


Abstract
Due to the brittleness and volume sensitivity, segmentation is necessary for the cement concrete pavement slabs currently in widespread use to mitigate thermal stress and deformation. The dimensions of segmented pavement slabs are typically constrained to 4∼6 m, which results in a large number of joints. These joints cause damages such as corner spalling and fracture under the impact of repeated loads and environmental factors. In addition, maintenance costs are significantly increased due to the numerous joints. To enhance pavement performance and extend service lifespan, this paper proposes a design methodology for large pavement slabs. This method breaks the dimensional constraint and significantly reduces the number of joints, thereby improving comfort and durability, lowering maintenance costs, and meeting the operational requirements of new aircraft types. In this paper, pavement slab thermal stress is divided into curling stress and thermal expansion stress according to different deformation types. The diurnal and annual distributions of these two types of stresses are also investigated. Moreover, the maximum dimension design of pavement slabs comprehensively considers aircraft loads, thermal stresses, and fatigue characteristics. The results indicate that the diurnal and annual distributions of curling and thermal expansion stresses exhibit sinusoidal patterns. Under different temperature gradients and slab thicknesses, the allowable maximum slab dimension is presented. It is feasible to break the 4∼6 m limit for the maximum dimension of the pavement slab, which provides a new reference for improving pavement performance and lifespan.
1. Introduction
Structures, materials, and segmentation of airport pavement, which depend on properties of pavement materials, directly determine the comfort, durability, and economic efficiency of the pavement. Nowadays, airport pavement structures are in forms of flexible pavement (asphalt concrete) [1], rigid pavement (cement concrete) [2], and special pavements (metal or polymer materials) [3,4,5,6]. Asphalt pavement is comfortable but short-lived with a service life of approximately 15 years [7], while cement pavement is better than asphalt pavement where durability is concerned and has a longer lifespan, lasting 30 years and requiring less maintenance [8]. Therefore, cement concrete pavements are broadly used in most airports. However, segmentation of cement concrete pavement is necessary due to the brittleness and volumetric sensitivity of cement concrete, which requires numerous pavement joints to reduce temperature stress and deformation and to control cracking damage. Simultaneously, pavement joints are the weakest part of the cement concrete pavement slab. Affected by repeated loads and climatic conditions, joints cyclically expand and contract with seasonal temperature fluctuations. This cyclic movement makes surface water and solid particles easier to infiltrate into the pavement and thereby reduce pavement strength, affecting the normal function of joints, and even leading to corner spalling, slab detachment, fragmentation, hollowing, misalignment, arching, and fracture [9]. These damages affect aircraft operation and worsen the flight safety. Moreover, due to a large number of joints, resonance or vibration occurs when aircraft taxi on the pavement, shortening the service life of aircraft, reducing ride comfort, and increasing maintenance costs.
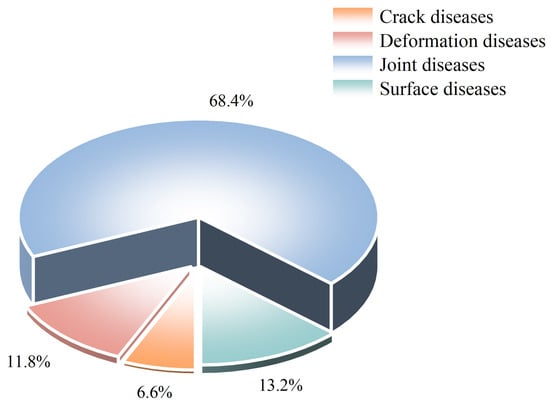
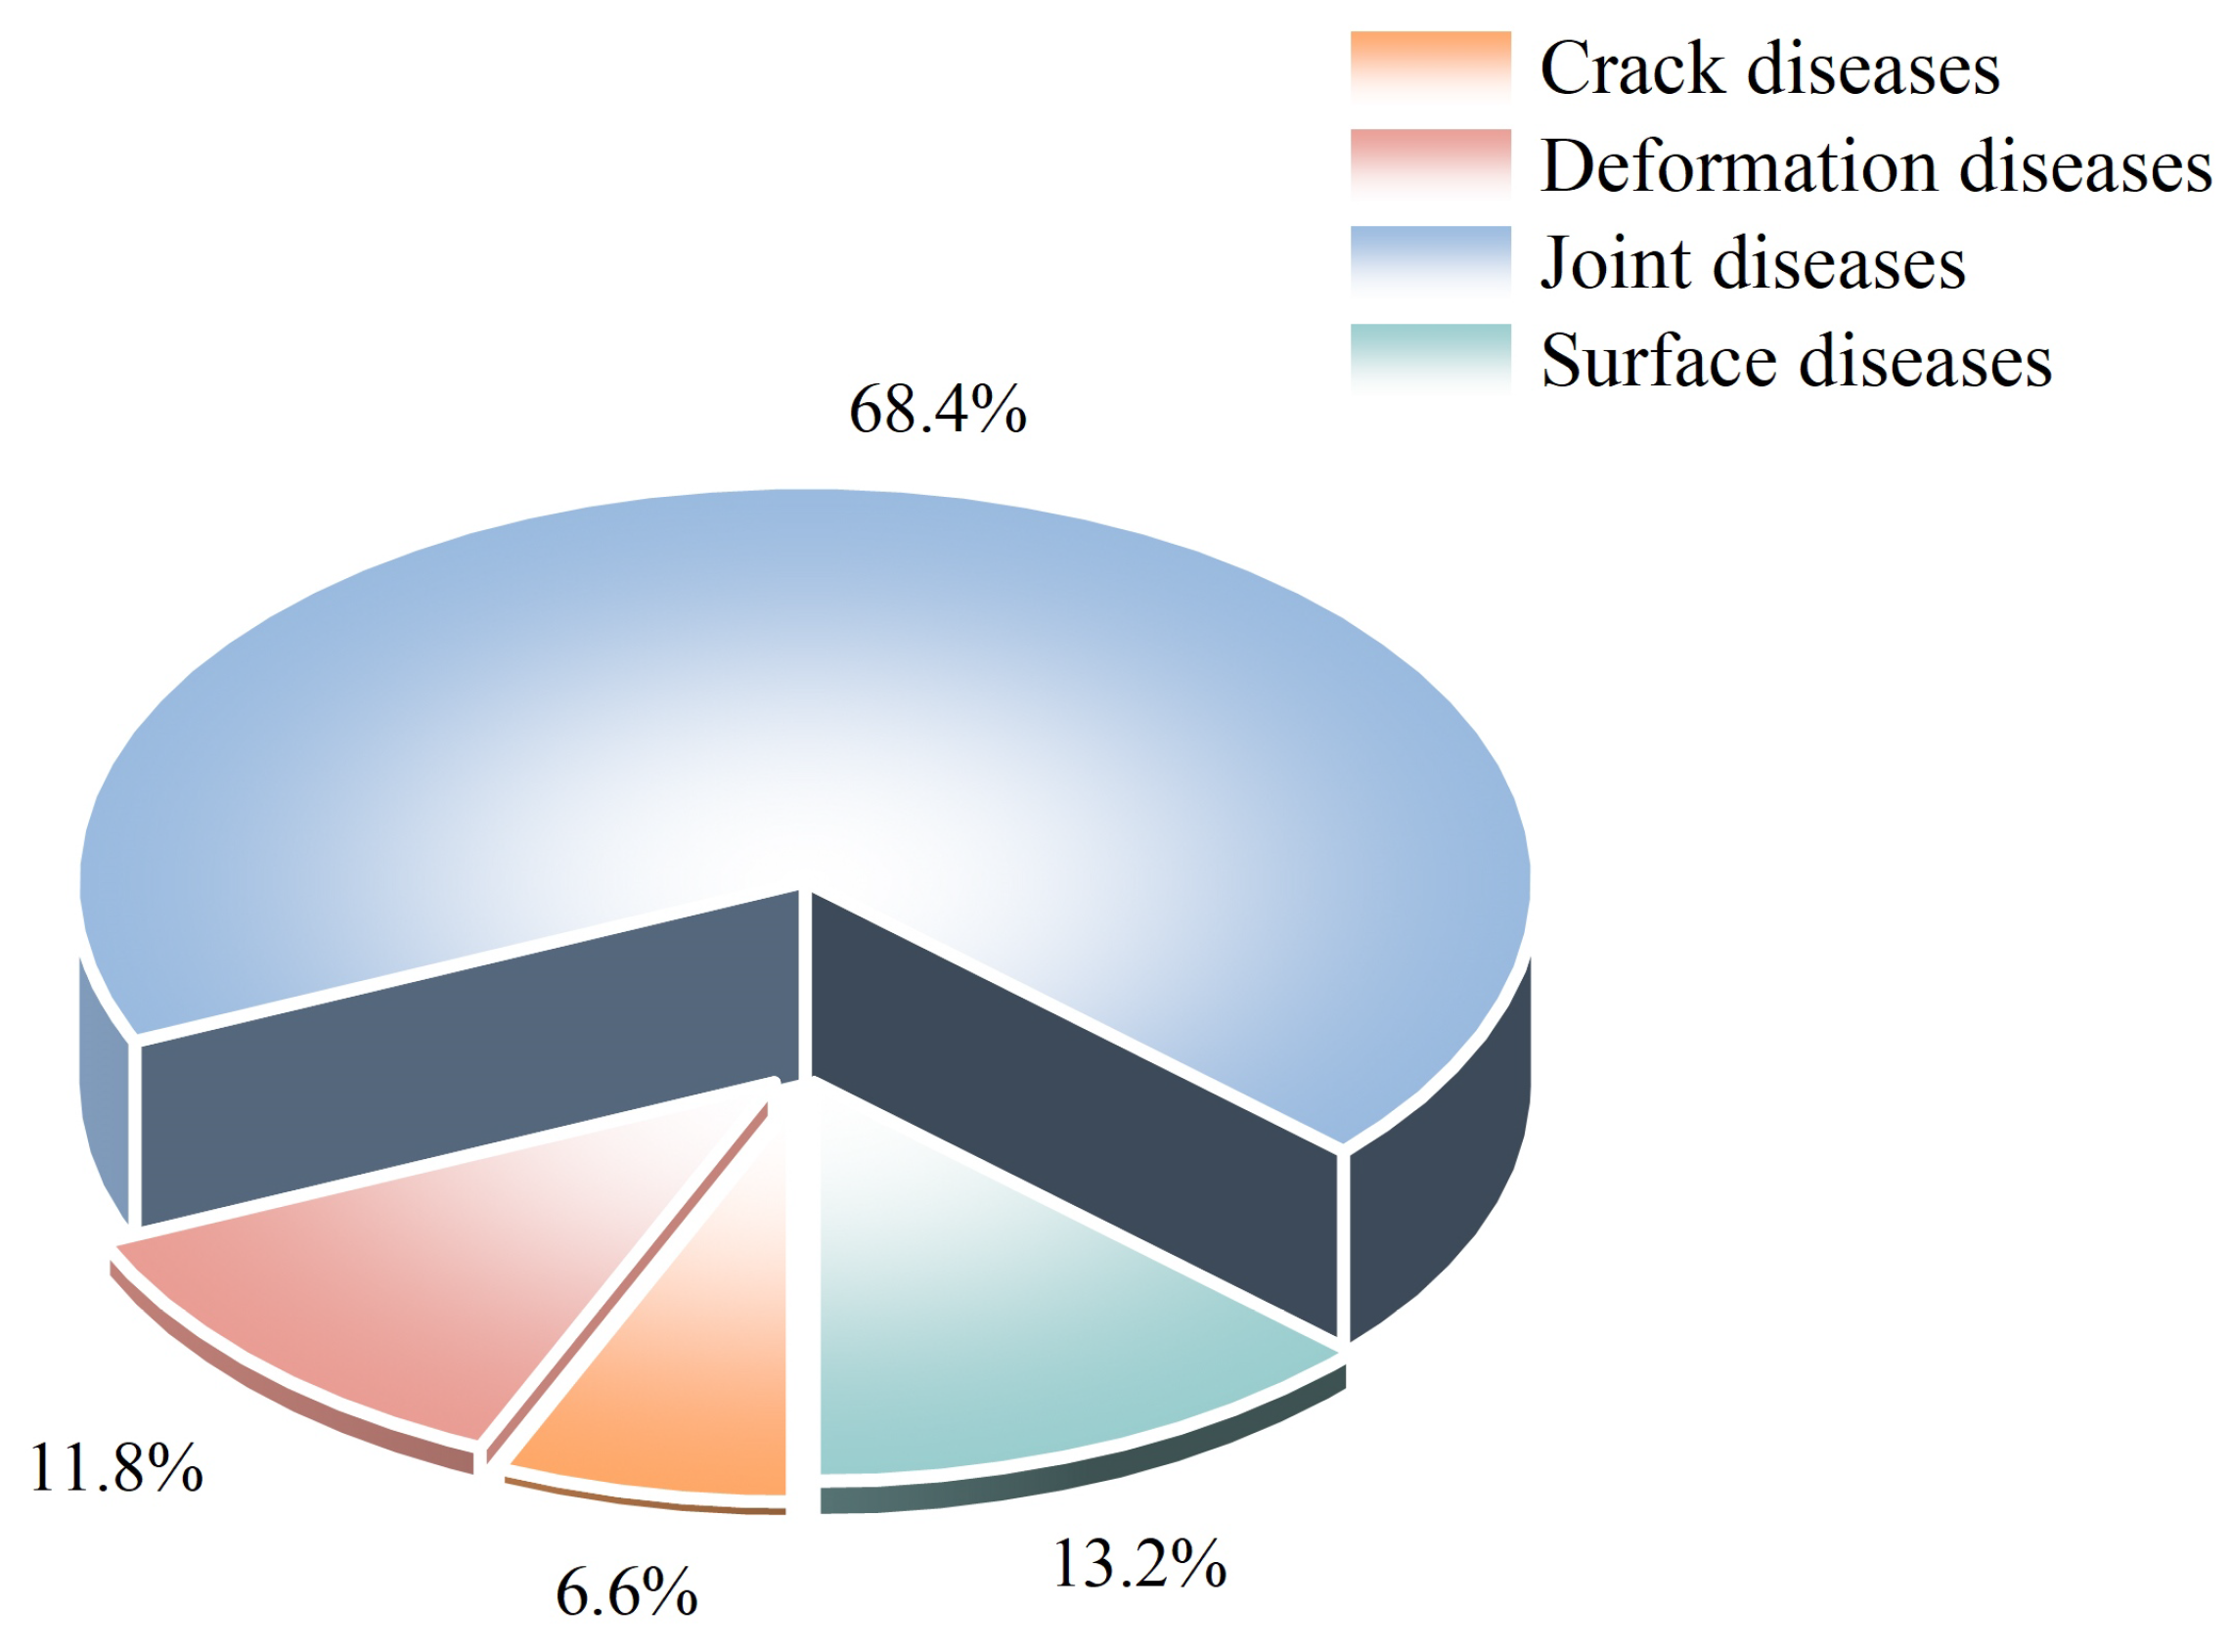
The first concrete pavement design theory based on temperature stress was established by Westergaard [10]. He published two papers dealing with stress computation in concrete pavement. The first paper involves stress and deflection due to loads, whereas the second involves stress and deflection due to variations of temperature [11,12]. The typical slab dimensions for concrete pavement are 12 ft wide by 15 ft long with slab thicknesses ranging from 6 to 14 inches depending on the level of traffic. Cervantes et al. optimized the slab dimension 6 ft by 6 ft panel sizes, decreasing the tensile stress in the slab [13]. These pavement slabs are prone to defects such as chipping, slab detachment, misalignment, arching, hollowing, mud pumping, and slab fracture under aircraft loads and natural environment factors. The issues stem from small slab sizes, excessive joints, corner spalling, and poor surface performance, which shorten pavement service life and consume substantial resources [14]. Hexagonal slabs were once used in cement concrete pavements [15]. The reason why hexagonal slabs were obsolete in the 80s of the last century is substantial joints. Currently, modern aircraft equipped with sophisticated electronic systems are advanced and costly, imposing rigorous demands on pavements: no aggregate loss or slab detachment, superior quality, and excellent flatness. Relevant practitioners often reflect that airport cement concrete pavements with an excessive number of joints can easily produce debris and blocks, endangering flight safety and increasing maintenance cost. Moreover, loud noise and considerable vibration caused by aircraft taxiing affect the operation of precision instruments. According to 10 years of statistics from a specific airport, there were 76 failures such as tire bursts, landing gear damage, and engine damage caused by pavement quality distresses, as shown in Figure 1. Among them, five cases were caused by crack distresses, accounting for 6.6%; nine failures were caused by deformation distresses, accounting for 11.8%; 52 failures were caused by joint distresses, accounting for 68%; and 10 failures were caused by surface distresses, accounting for 13.2%. The direct economic loss was up to CNY 120 million.
Figure 1.
Diagram of disease proportion.
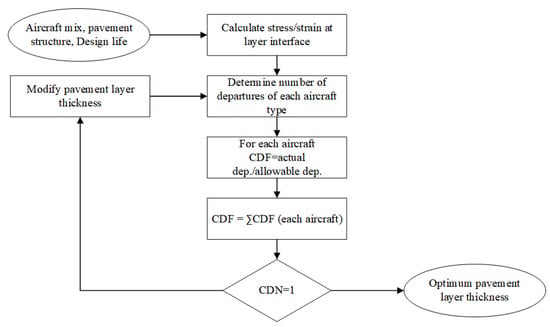
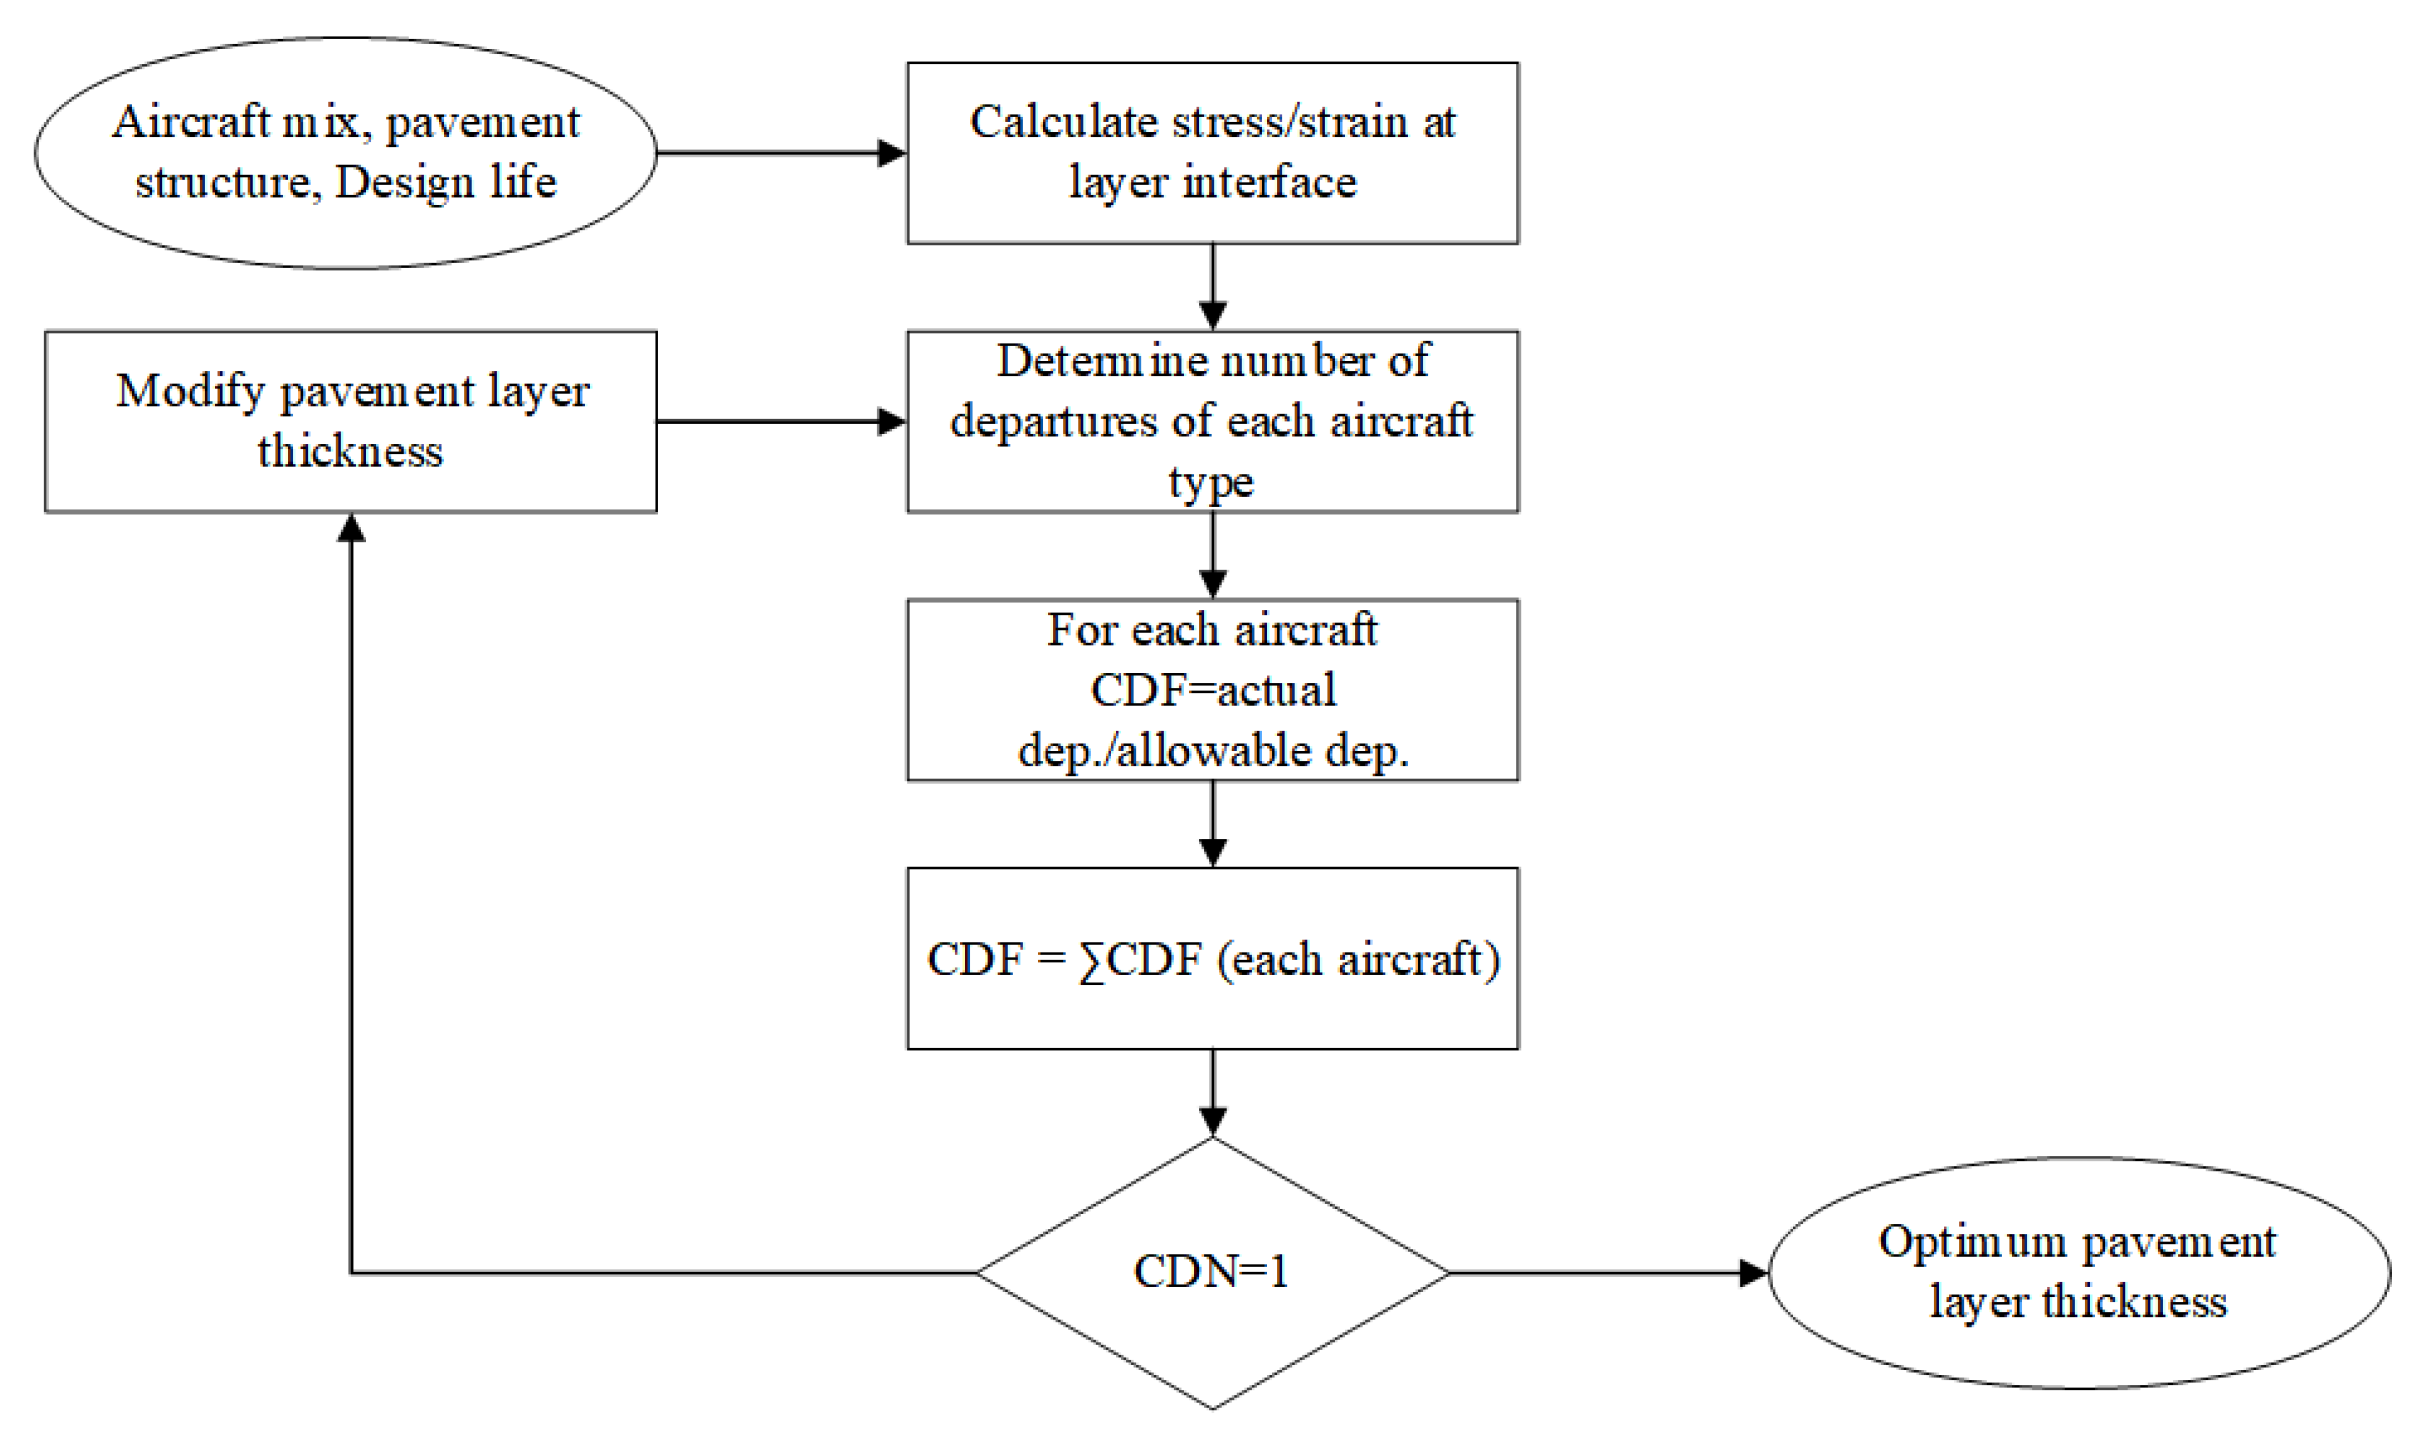
The calculation method of the International Civil Aviation Organization (ICAO) for concrete pavement stress was established on Westergaard’s analysis of slab edge loading [12]. The Portland Cement Association (PCA) adopts the permissible stress method for the concrete pavement slab, which is also established on Westergaard’s analysis of slab edge loading. The Federal Aviation Administration (FAA) proposed a stress chart based on the PCA calculation program to design the pavement slab [16]. There are common characteristics in these methods: (1) The slab thickness is determined by aircraft loads while the determination of slab dimensions is empirical. The dimension is limited to 4∼6 m on the assumption that reinforcements are necessary for a 6 m or longer slab in length, otherwise the slab will fracture. (2) The determination of slab dimensions only considers the effects caused by the aircraft load while the temperature stress is ignored for 4∼6 m slabs in length. However, the temperature curling stress of the pavement slab has been extensively studied. Since Westergaard’s introduction of the Winkler foundation slab in 1927 [10], which provided an analytical and computational approach for determining temperature curling stress in concrete pavements, Bradbury later developed temperature stress coefficient curves [17,18]. In 1993, thin plate theory was applied to obtain the temperature stress solution for cement concrete slabs on a Pasternak foundation (the 1927 solution represents a particular solution), offering a more accurate reflection of real scenarios [19]. The current Advisory Circular (AC) 150/5320–6G released by FAA adopted the concept of CDF for considering mixed traffic and the FEM model to design rigid pavement thickness. As shown in Figure 2, the FAA design process focuses on thickness design and does not consider temperature effects in slab dimension. Temperature stress can be categorized into curling stress and expansion stress. The current pavement design methods just select curling stress at the slab bottom as the design parameter due to the 4∼6 m dimension limit in which situation expansion stress is much smaller than curling stress. However, temperature expansion stress increases as the slab dimension grows and becomes a critical part in temperature stress. In the large slab design method, curling stress and expansion stress are both determining factors and simultaneously considered. Nonetheless, these methodologies have predominantly neglected the validation of slab dimensions and inadequately investigated thermal expansion stress. It is evident that the concrete pavement dimensions have been established purely based on empirical evidence, lacking a computational design basis.
Figure 2.
Process for estimating airport pavement layer thickness in FAARFIELD. Adapted from Sun [20].
In this research, a new design methodology for large cement concrete pavement slabs is proposed, which incorporates temperature stress, including curling stress and thermal expansion stress. The methodology aims to achieve large slab size, fewer joints, high strength and durability, extended service life, improved ride comfort for aircraft taxiing, and low cost and maintenance requirements, ultimately overcoming the dimensional limitations specified in the current standards. This solution is more effective and durable than traditional methods. It is characterized by a lack of necessary maintenance compared to radially expanded surfaces and is more durable. This paper starts with a theoretical analysis of temperature stress, followed by an investigation into the diurnal and annual distribution of temperature stress. It then presents the pavement fatigue equation, designs the dimensions of concrete slabs based on the equal loss principle, and conducts experimental verification for the proposed method.
2. Temperature Curling Stress
2.1. Calculation of Curling Stress
On the Winkler base, formulas of the curling stress of a finite-sized rectangular slab are as follows [21]:
The maximum curling stress at the middle of the slab edge:
where
- x—Longitudinal direction;
- y—Transverse direction;
- —Curling stress (MPa);
- —Curling stress in the x-axis (MPa);
- —Curling stress in the y-axis (MPa);
- E—Elastic modulus of cement concrete (MPa);
- —Coefficient of linear thermal expansion for cement concrete, generally taking 0.00001/°C;
- —Thermal gradient across the slab, calculated by multiplying the temperature gradient by the slab thickness;
- —Poisson’s ratio of cement concrete;
- and —Curling stress coefficient, with calculation formulas as follows below.
- L—Slab length (m);
- B—Slab width (m);
- l—The relative stiffness radius of the slab (m), calculation formulas as follows below. On the Winkler base:
- k—Subgrade reaction modulus ();
- h—The thickness of pavement slabs (m).
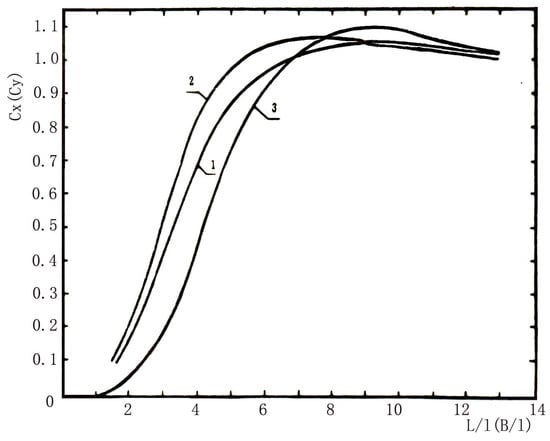
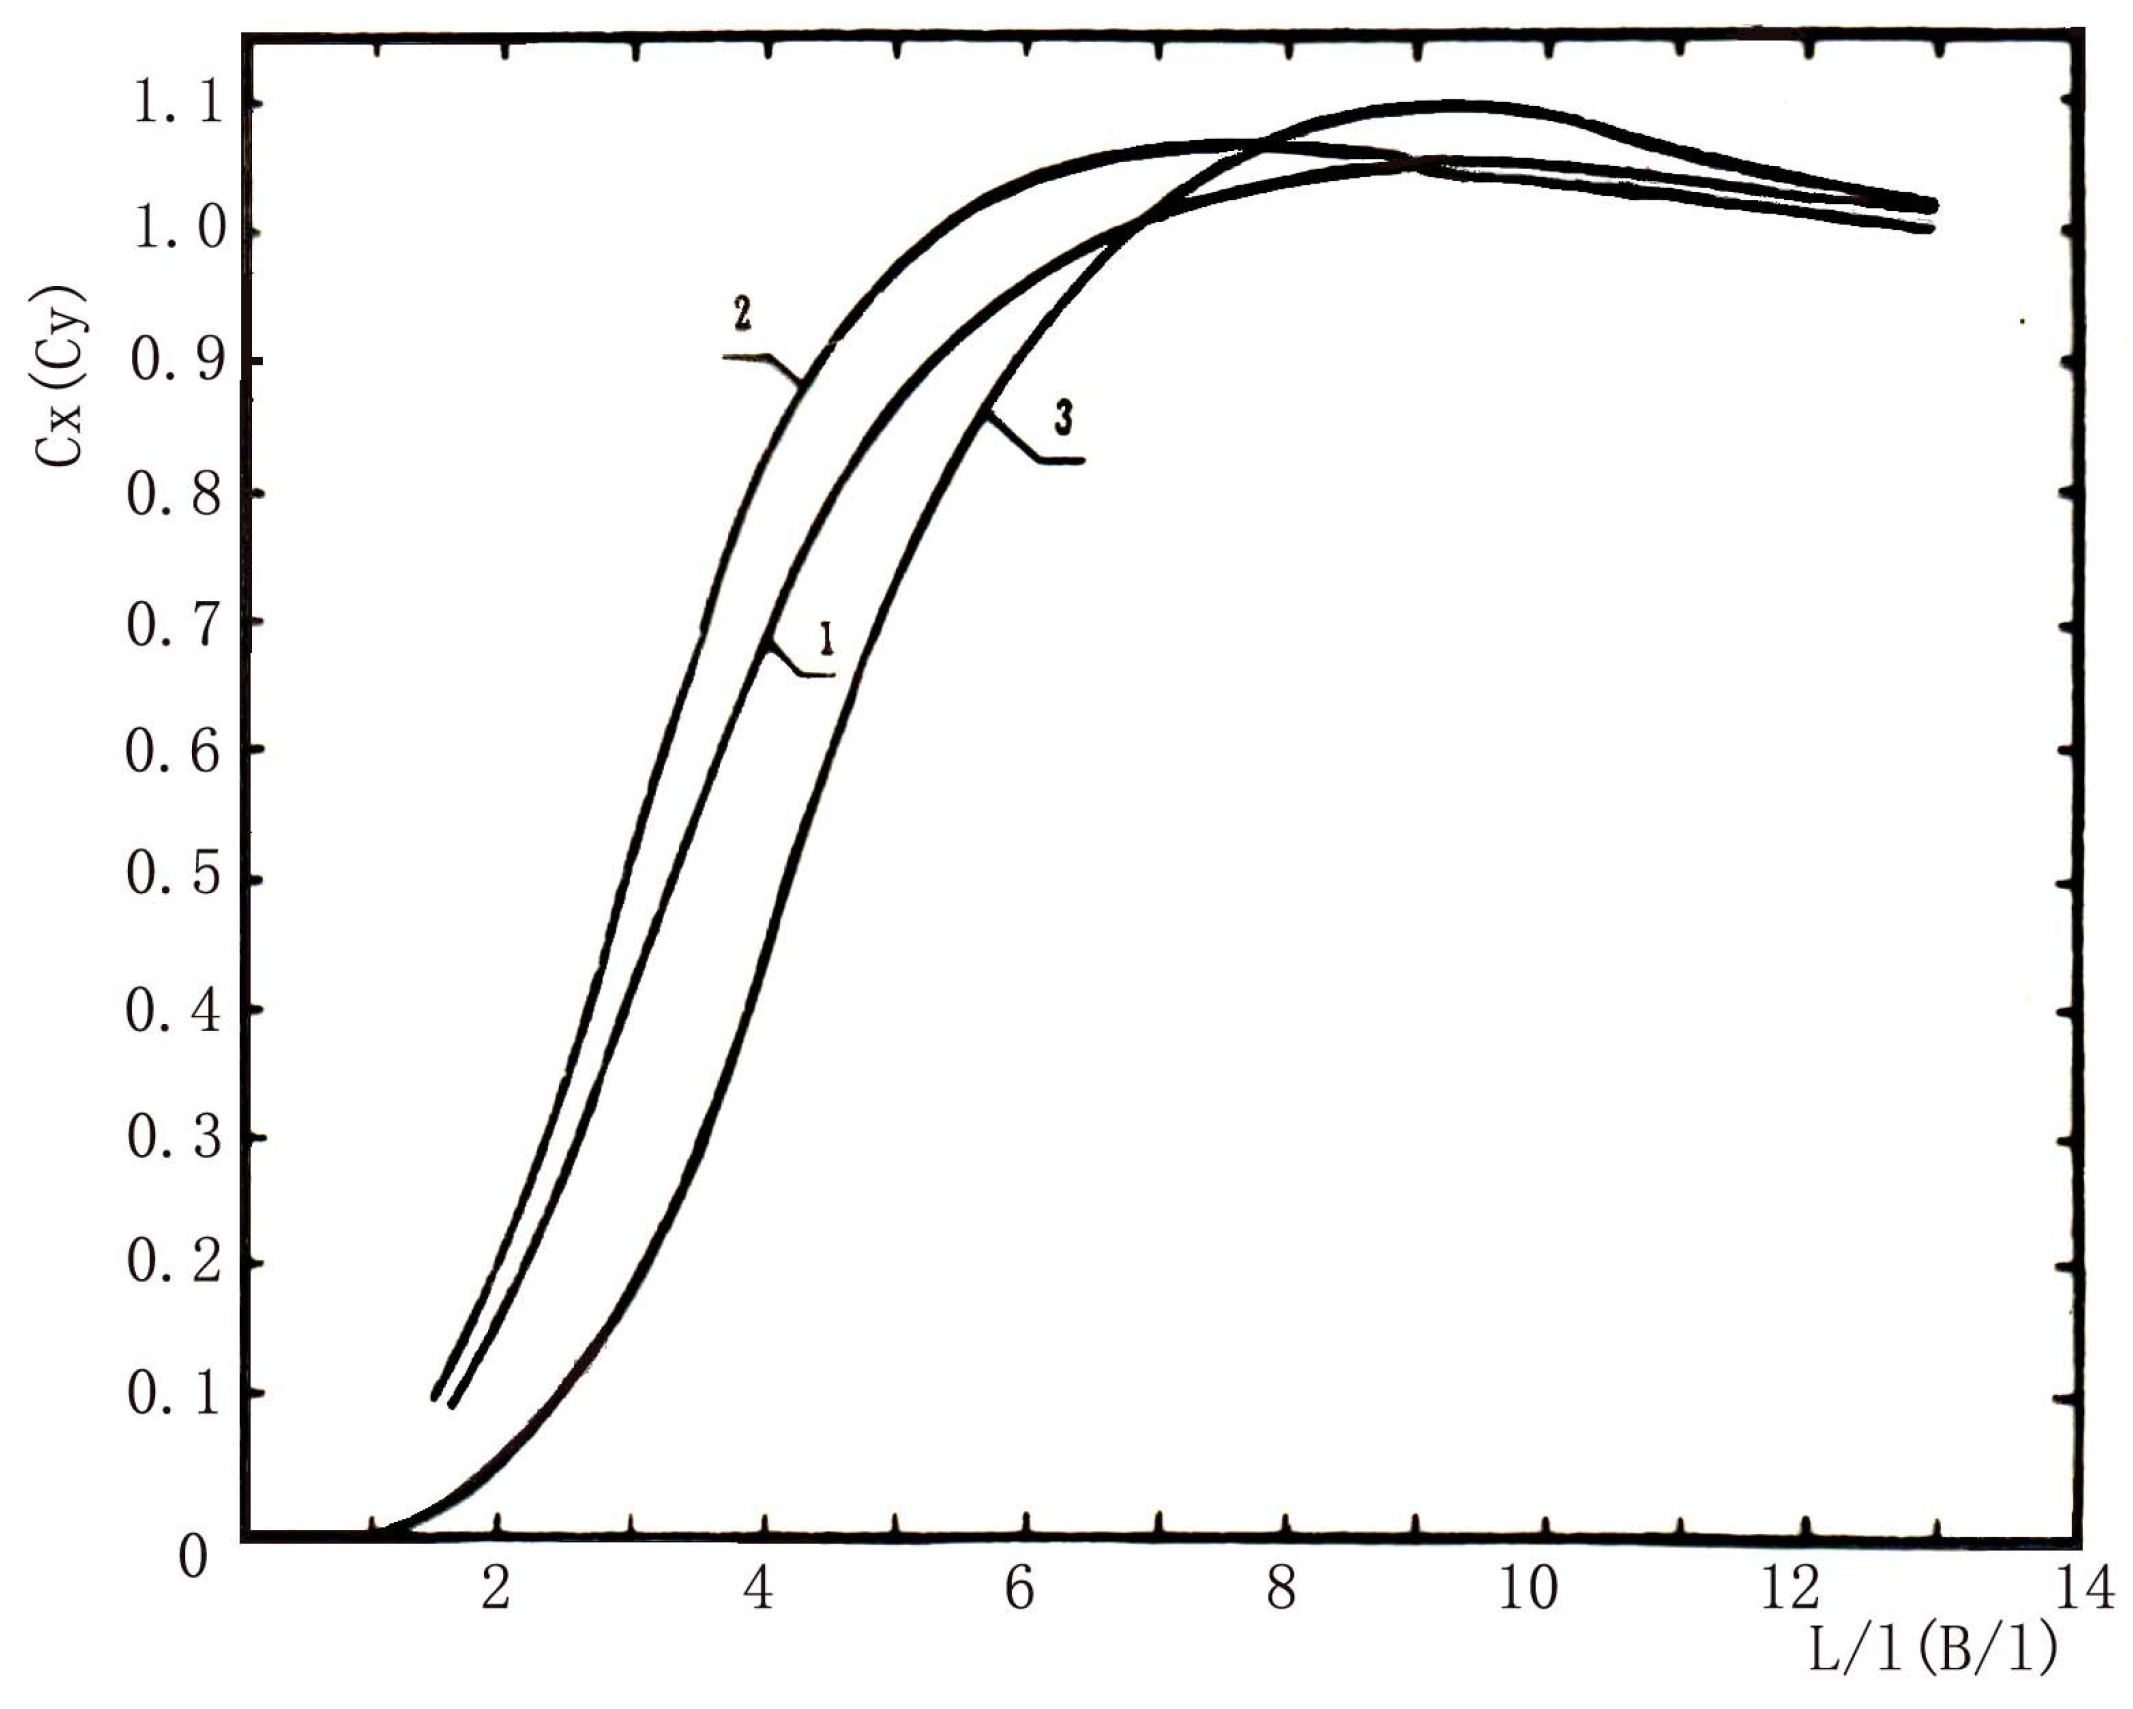
The calculation formulas for the maximum curling stress at the center and edge of an elastic half-space foundation slab are similar to Equations (1)–(3). The curling stress coefficient is adopted in Figure 3 [17]. The l referring to the relative stiffness radius of the elastic half-space foundation slab is calculated by the formula below:
where
Figure 3.
Curling stress coefficient of elastic foundation slab (1: center of elastic half-space foundation slab; 2: edge middle of elastic half-space foundation slab; 3: Winkler foundation).
- —The comprehensive calculated rebound modulus of the top surface of the foundation (MPa);
- —The Poisson’s ratio of the soil base.
As shown in Figure 3, the curling stress coefficient at the center of an elastic half-space foundation slab ( or ) can be fitted using the following formulas:
where
- .
- .
- are the length and width of slabs.
- l is calculated by Equation (12).
The temperature distribution along with the slab thickness is nonlinear and the material deformations in different depths tend to exhibit a nonlinear distribution [22]. However, due to the mutual constraints between cross-sections, the cross-section remains a plane perpendicular to the middle plane after deformation under the influence of a nonlinear temperature distribution. Consequently, the material layers in different depths are subjected to internal stresses.
Considering internal stress, the formulas for the maximum curling stress of pavement slabs on the elastic foundation are shown below:
At the slab center:
In the middle of the slab edge:
where
- —The temperature stress coefficient which is a function of and h. The calculation formula is as follows:
- h—Slab thickness (m). The subscript x means the direction along the length of the slab, which changes to y if it is along the width of the slab.
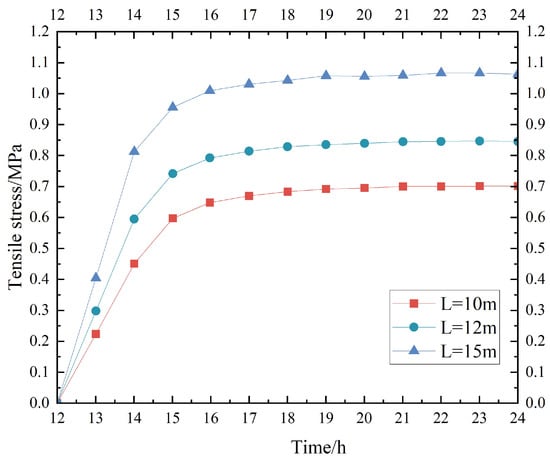
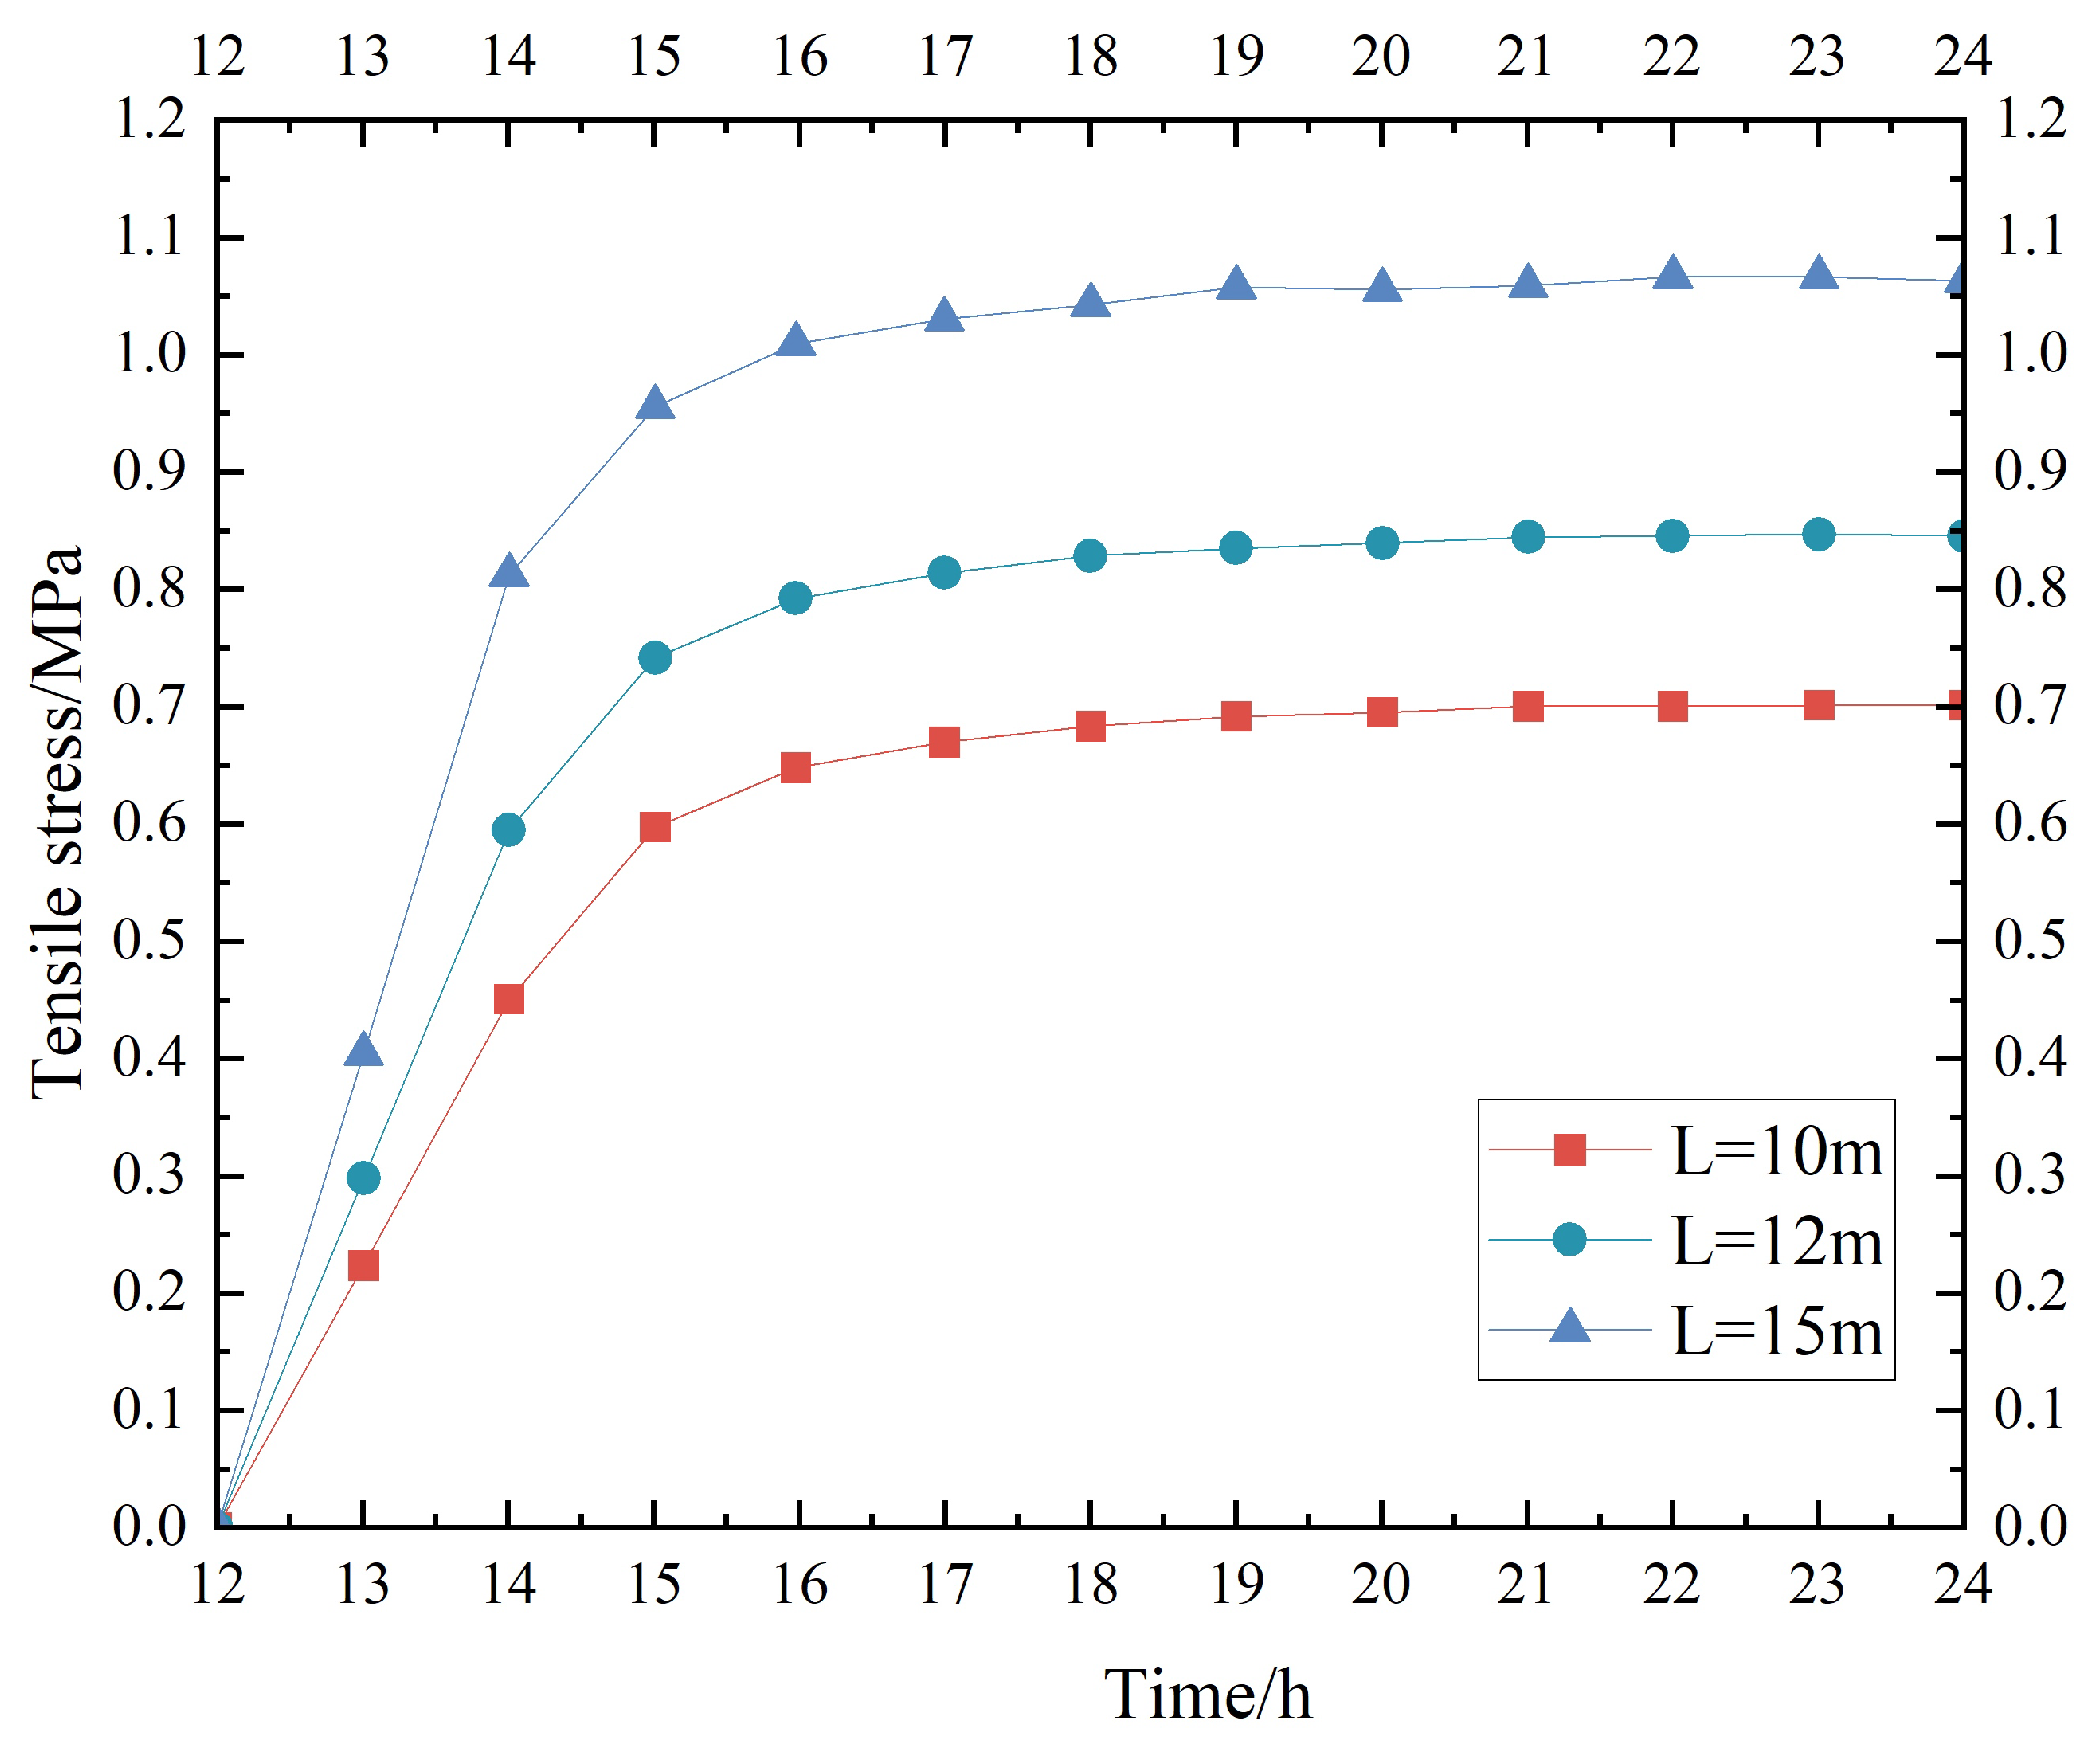
The curling stresses at different locations of slabs in ranging lengths on the elastic foundation are calculated and shown in Table 1. It can be concluded that the position of the maximum curling stress changes with increasing slab length. When the slab length is 8 m, the maximum curling stress occurs at the slab midpoint. With a further increase in length, the position of the maximum curling stress gradually shifts toward the slab edge. When the length reaches 15 m, the position of the maximum curling stress is 4 m away from the slab midpoint. Moreover, the curling stress does not rise infinitely as the slab dimension increases.
Table 1.
Curling stress variations in different slab lengths.
2.2. Distribution of Curling Stress
The temperature field of the pavement system is determined by the one-dimensional heat conduction partial differential equation, assuming that heat transfers only in the depth direction.
where
- —The temperature at depth z from the pavement surface and at time t;
- k—Thermal conductivity of pavement materials (W/m °C);
- —Density of surface layer materials (kg/m3);
- s—Specific heat capacity of surface layer materials (J/kg °C).
The temperature field within the pavement system can be obtained as follows [23]:
where
- —Average effective temperature (°C).
- —Average daily air temperature;
- R—The average increment by which daily radiant heat increases the average air temperature to the mean temperature (°C), estimating the average net loss of long-wave re-radiation (effective radiation) to be approximately 1/3, then
- b—Capacity of the pavement to absorb radiant heat (%);
- Q—Daily solar radiant heat;
- —Surface coefficient (convection coefficient) considering convection and re-radiation °C), approximately calculated by the formula below:
- v—Average wind speed (km/h);
- —Maximum deviation from the average effective temperature (°C), approximately determined using the following formula:
- —Daily variation range of air temperature (°C);
- H—The ratio of the convection coefficient to the thermal conductivity of the surface layer material, determined using the following formula:
- C—Comprehensive parameter of pavement material characteristics, determined using the following formula:
- t—Time from the start of the temperature cycle (h).
2.2.1. Daily Distribution of Curling Stress
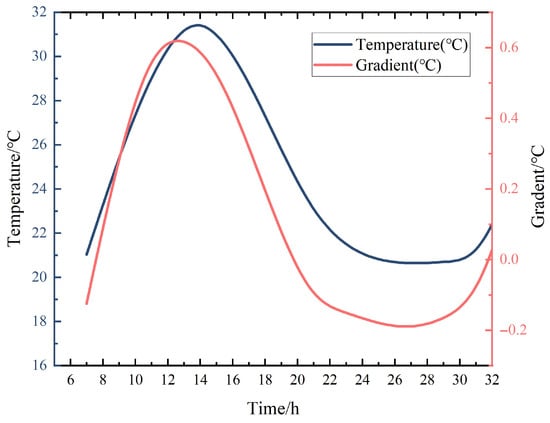
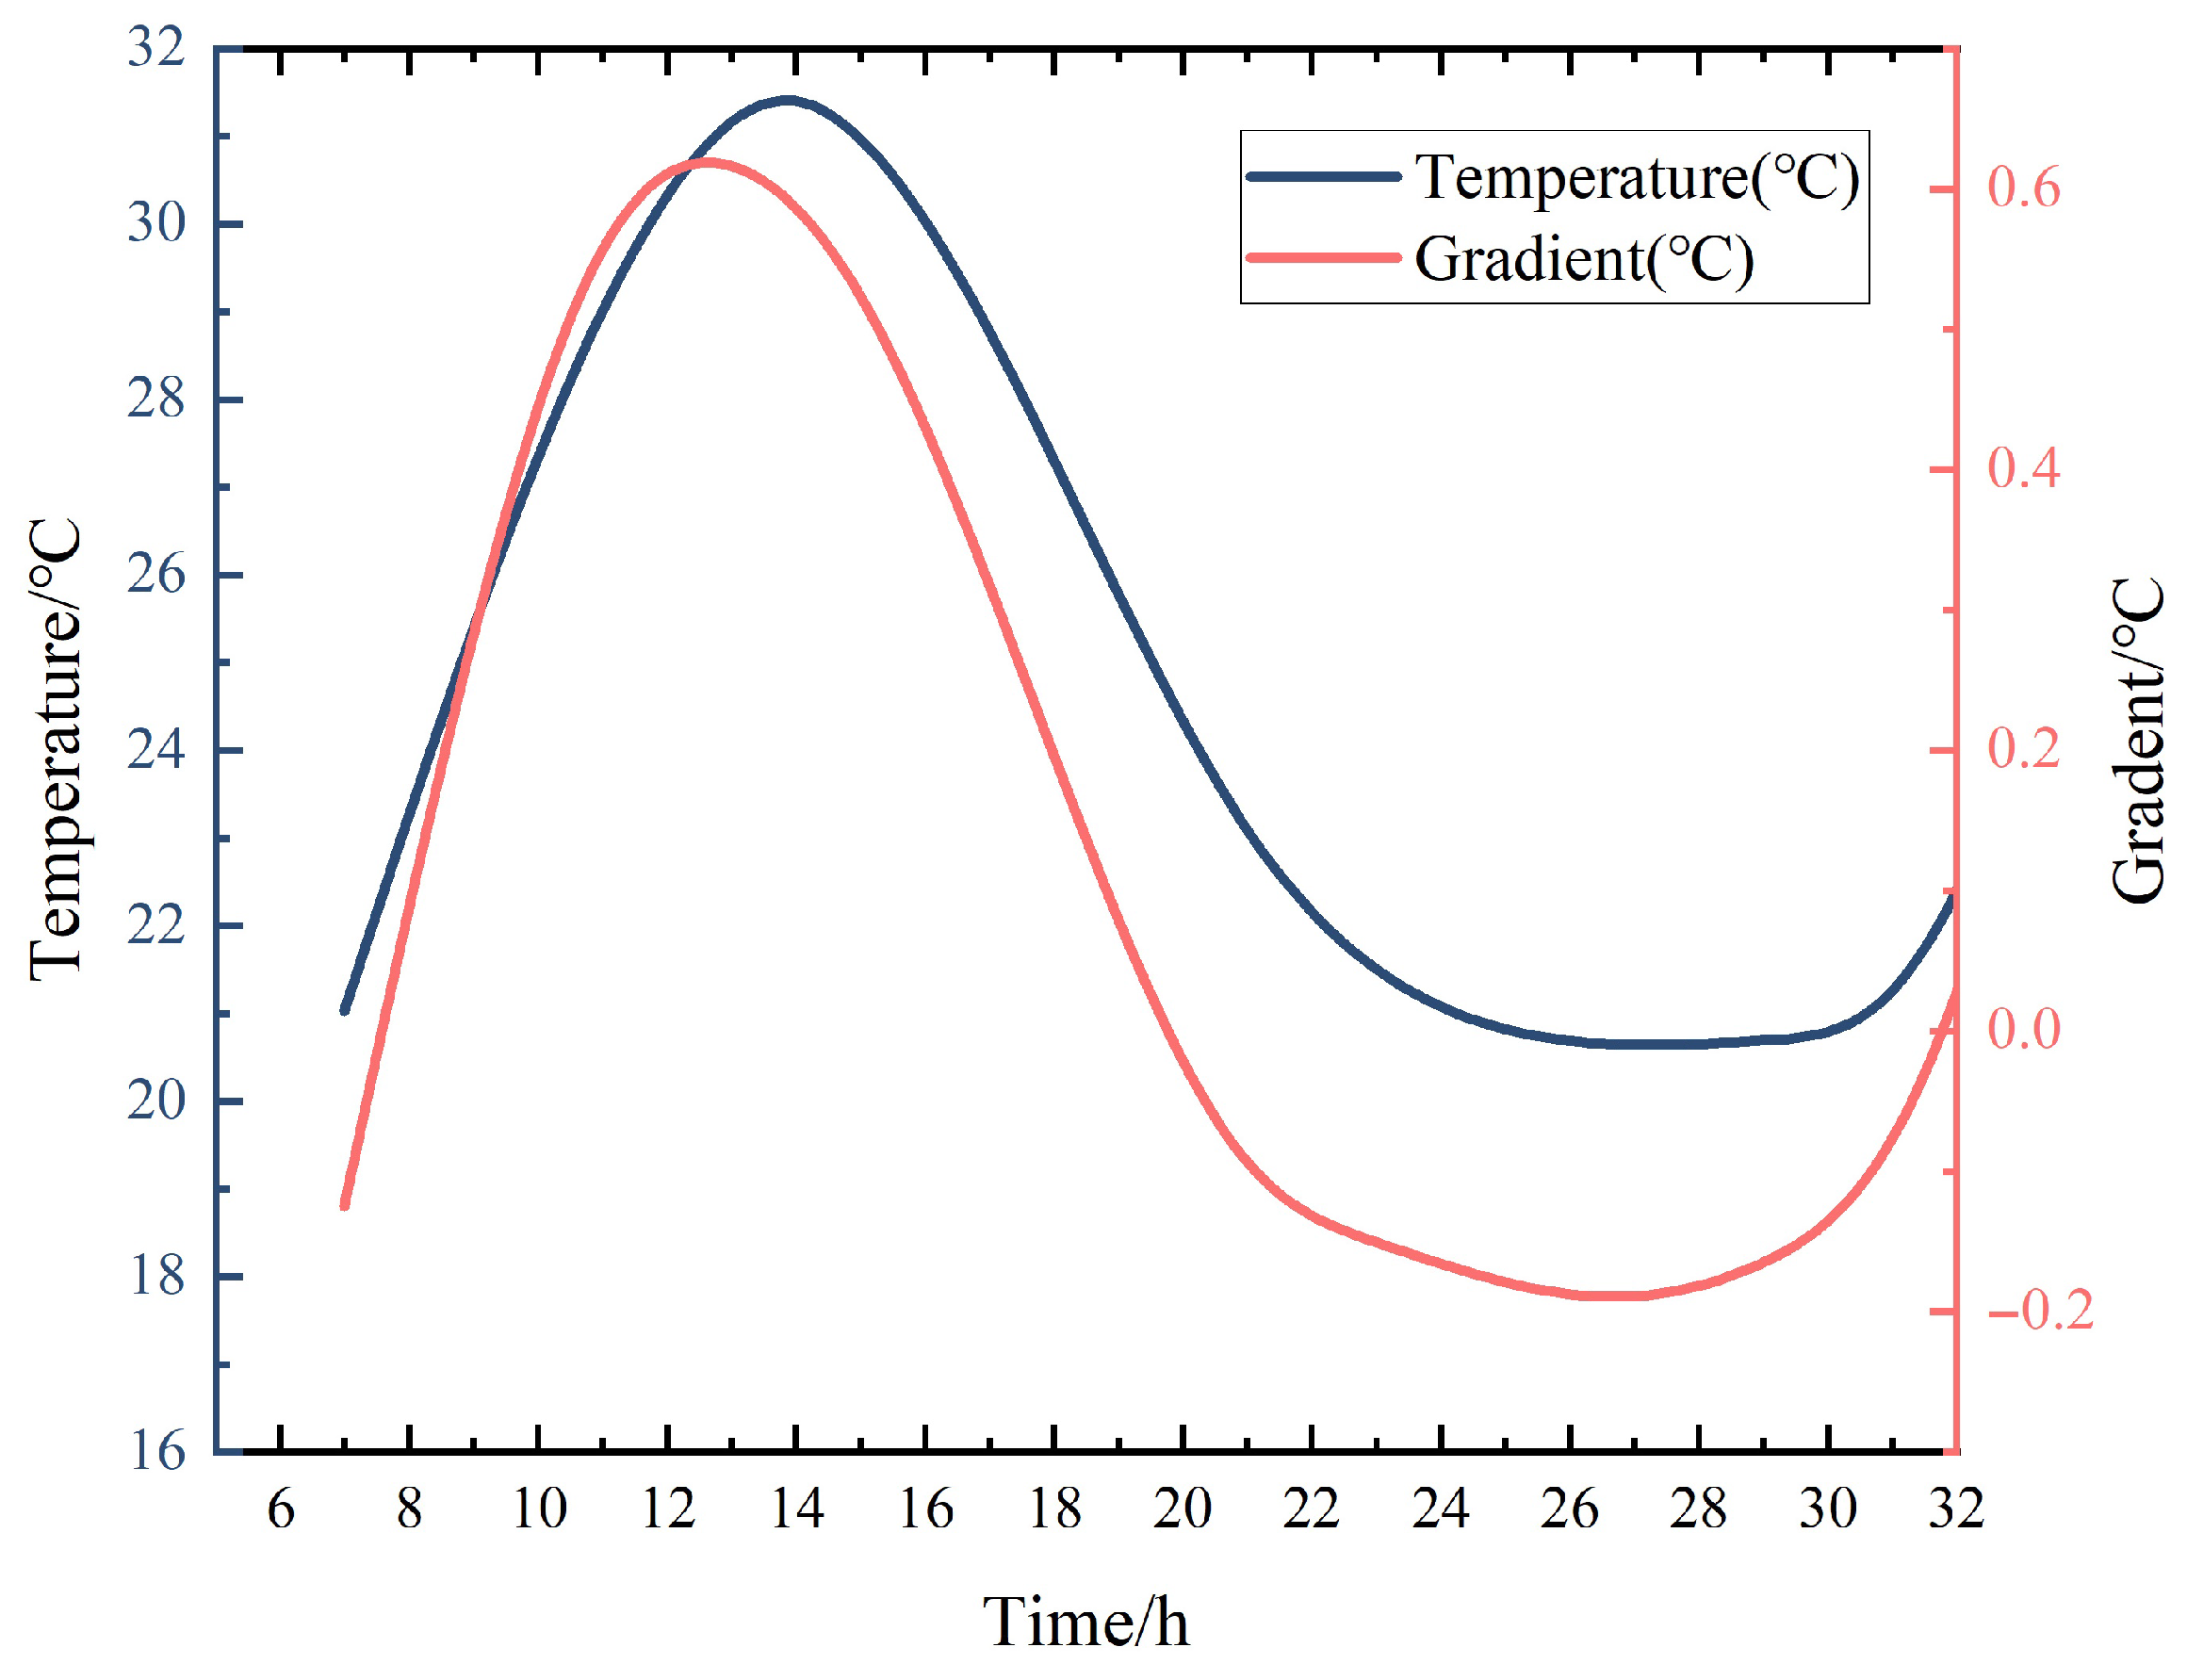
In Equation (19), the temperature variation of the pavement shares the same period as air temperature. The pavement temperature gradient also exhibits same periodic variations with air temperature. Figure 4 shows the daily temperature gradient variation of a selected airport. The feasibility of using the sinusoidal-approximated air temperature was well described and validated in [24]. Daily variation of the temperature gradient is also fitted through a sinusoidal curve. Since the curling stress is linear to the temperature gradient, it is also expressed using a sinusoidal function.
where
Figure 4.
Daily variation of the temperature gradient in the pavement slab.
- —Curling stress at a specific moment during a day (MPa);
- —Curling stress generated by daily maximum temperature gradient (MPa);
- t—Time;
- —The moment when the pavement temperature gradient is 0, determined by local air temperature conditions. Generally, 6 a.m. can be set as the origin of the coordinate system and namely .
2.2.2. Annual Distribution of Curling Stress
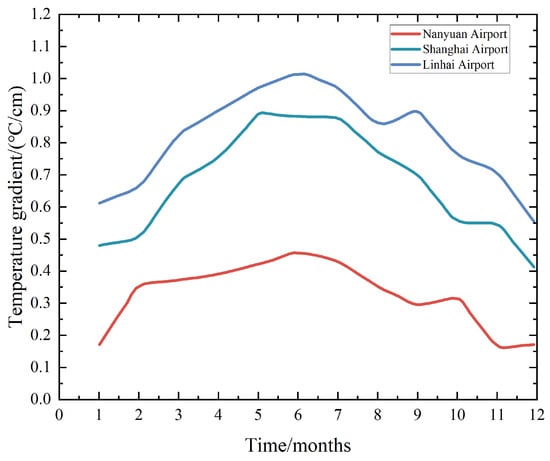
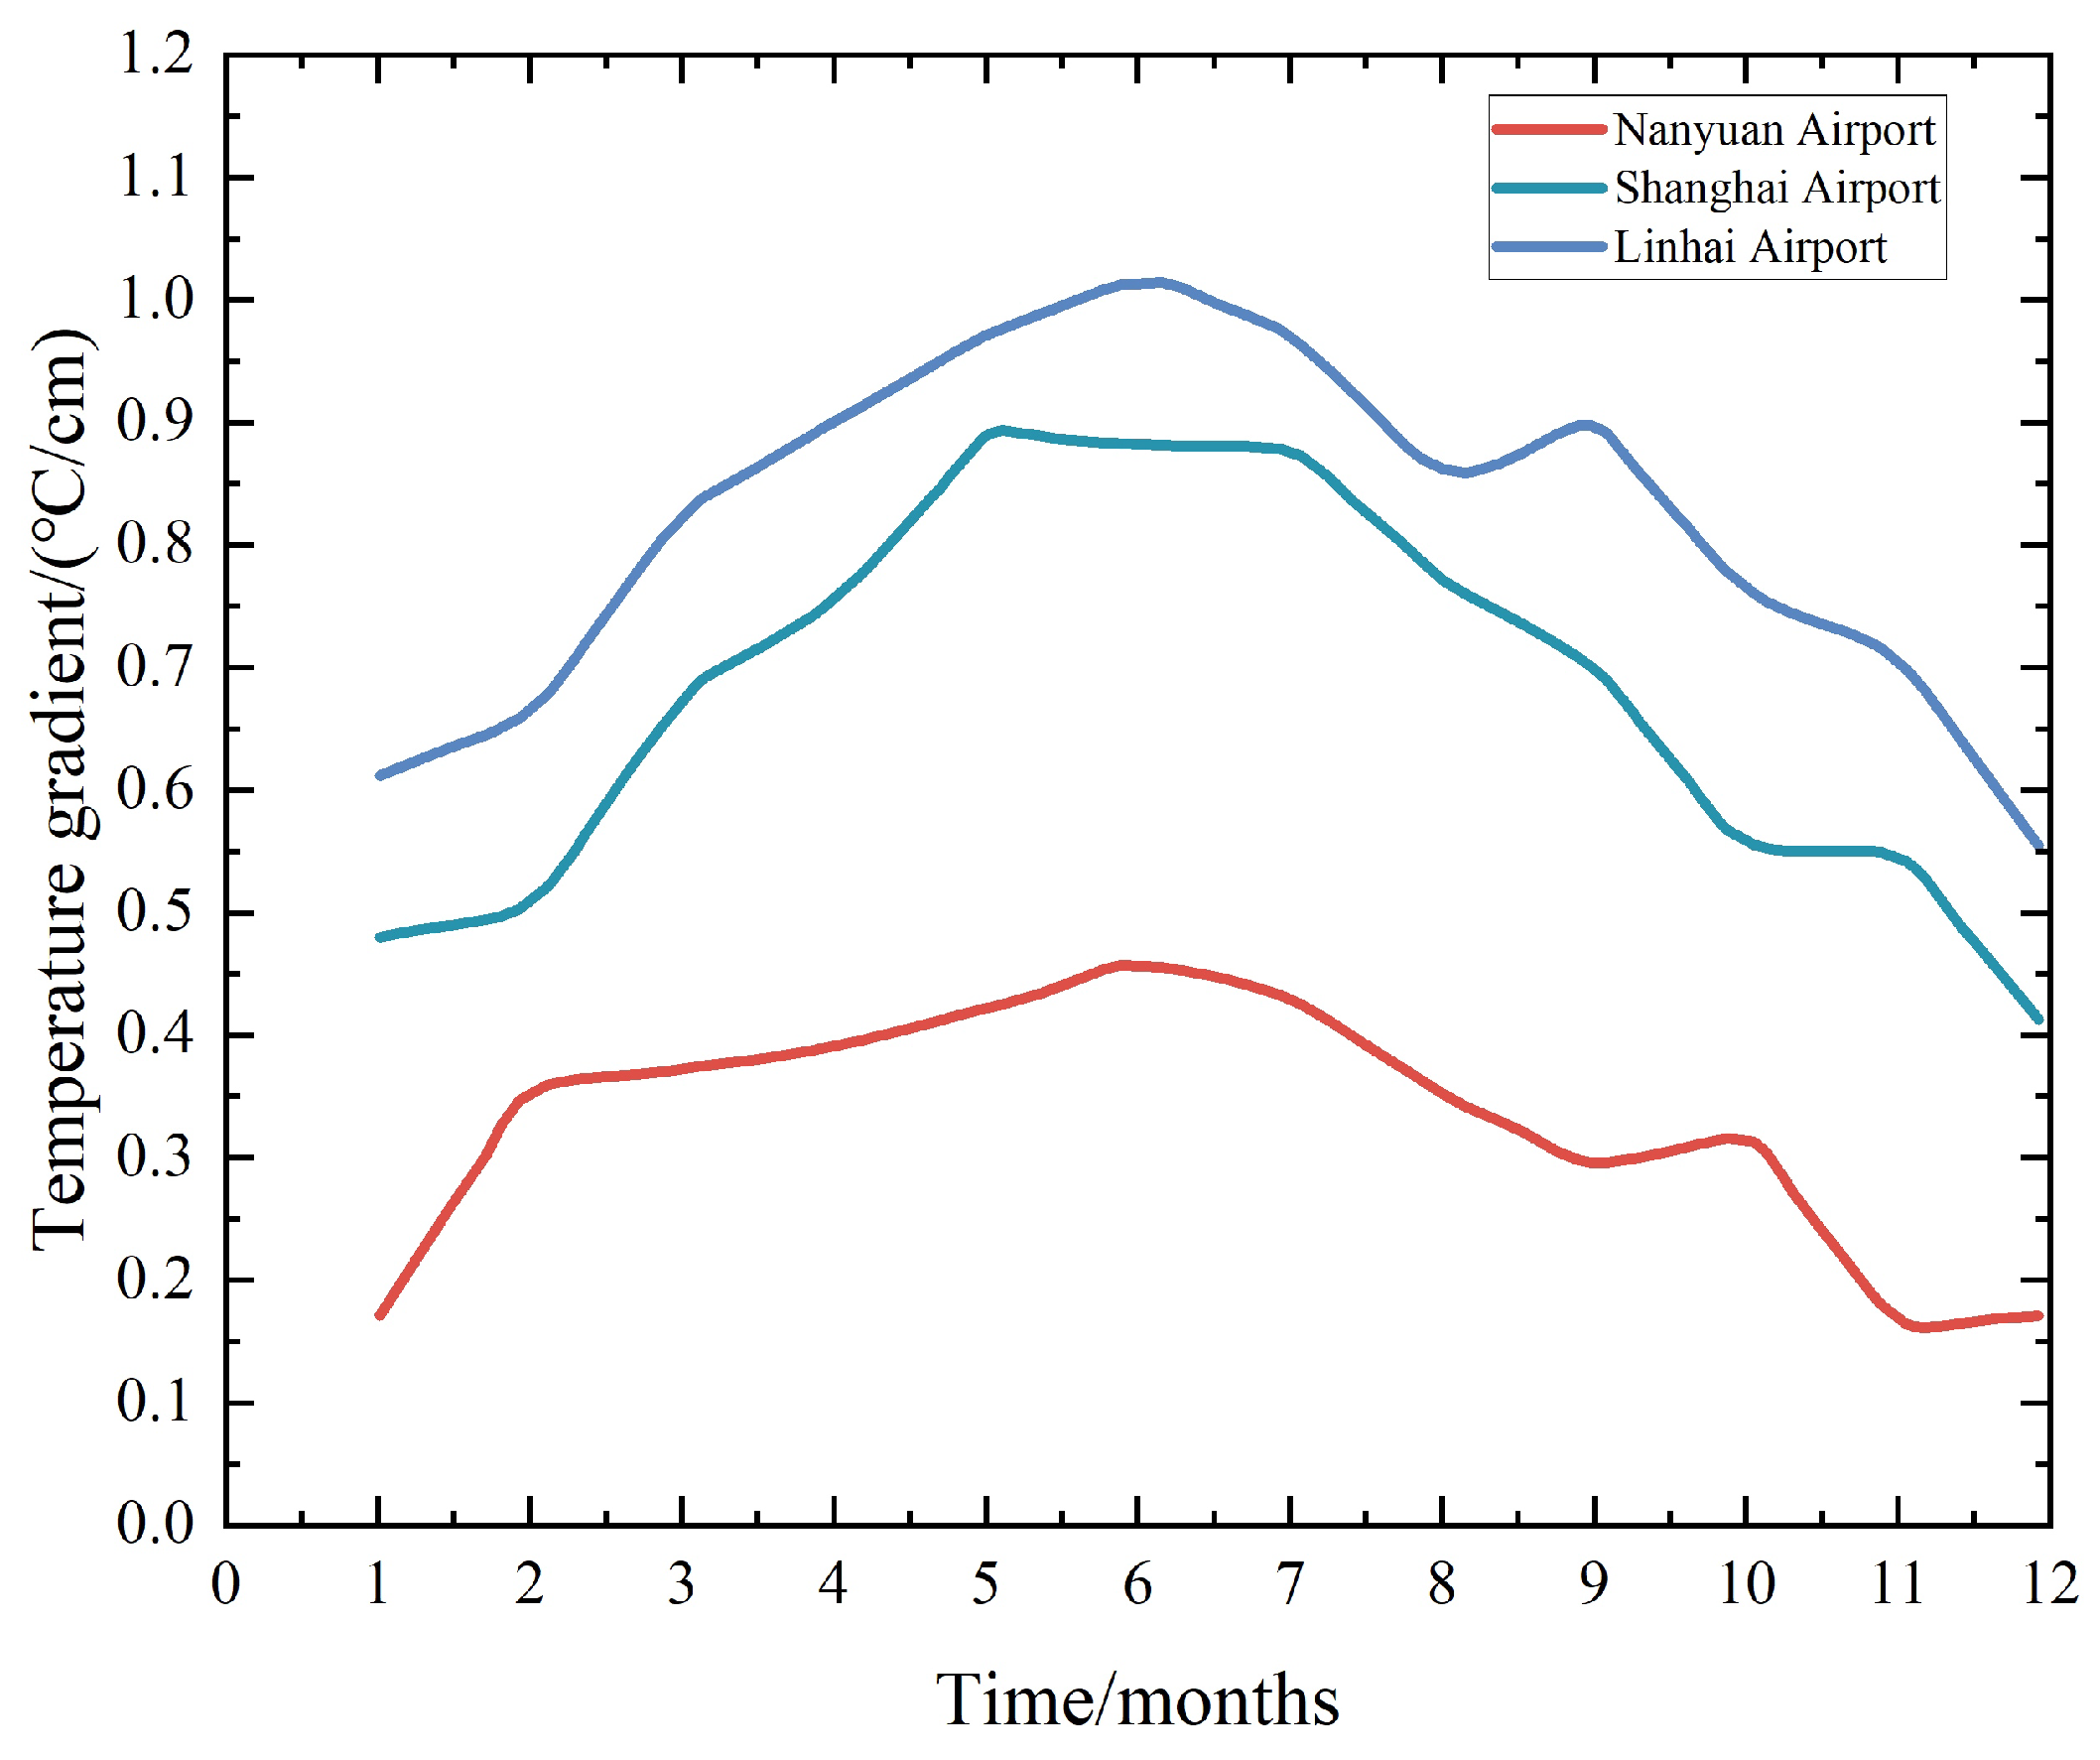
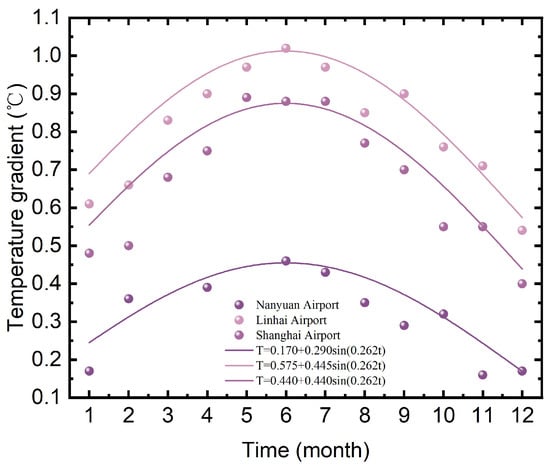
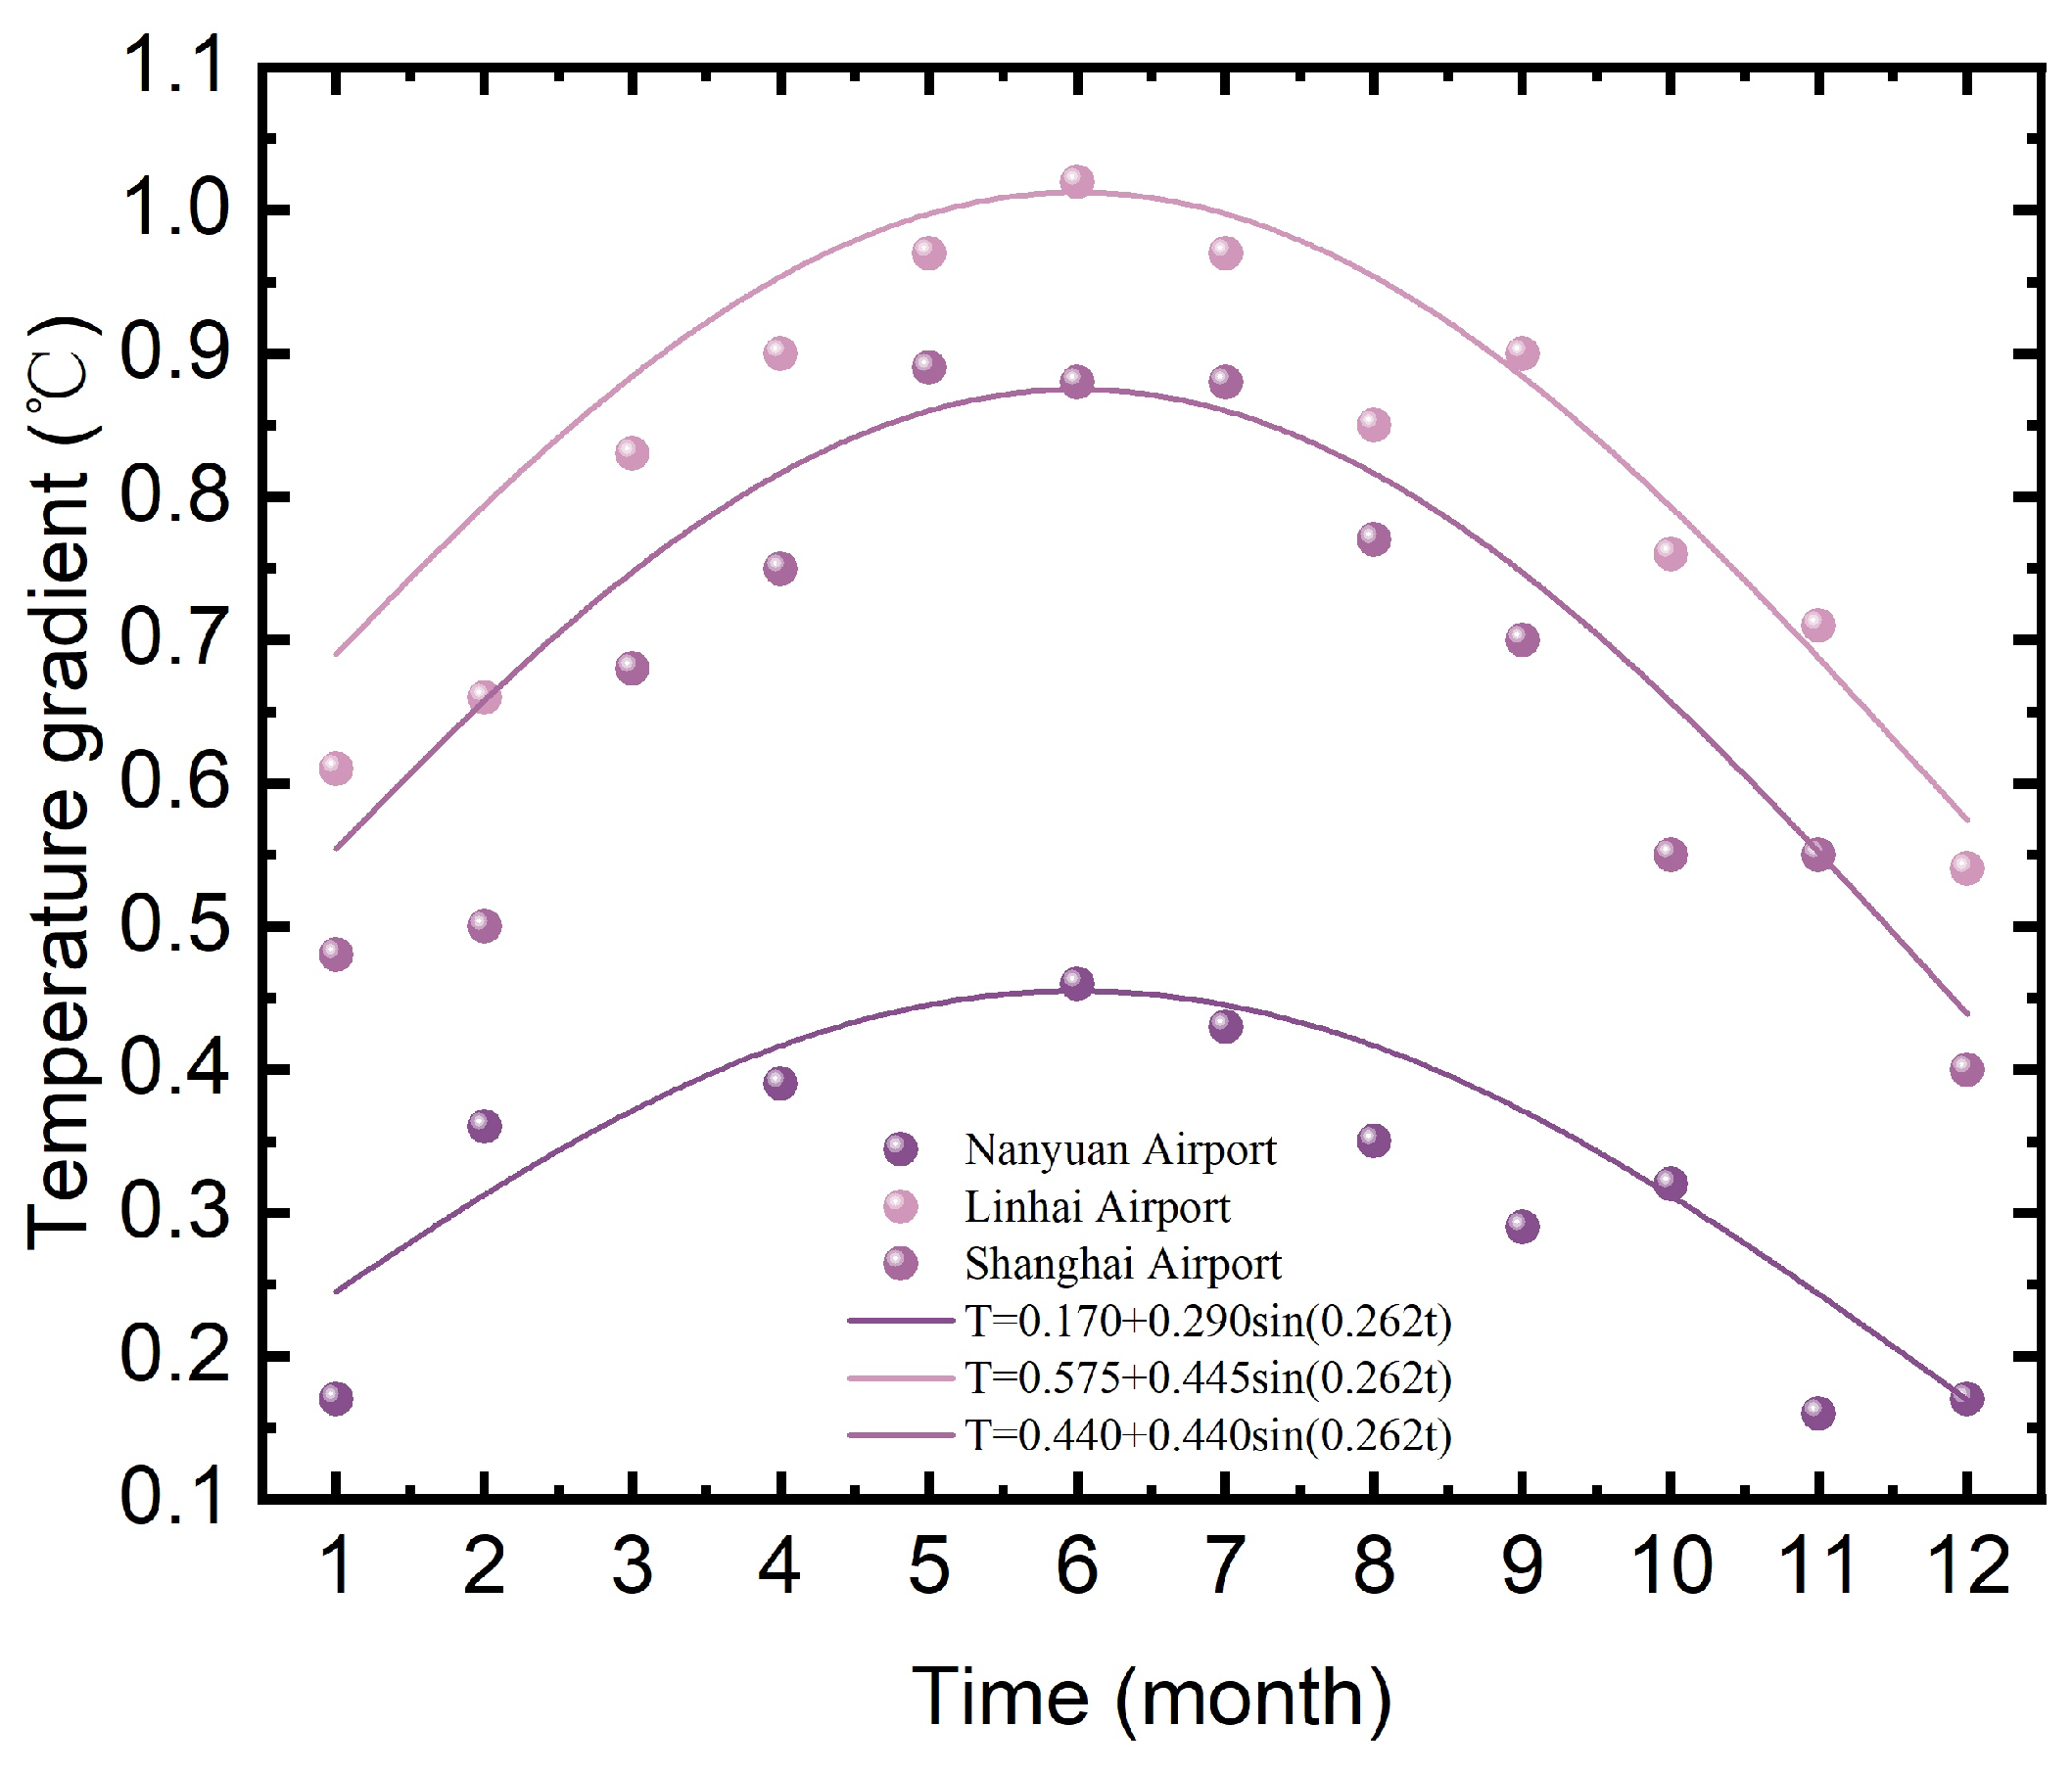
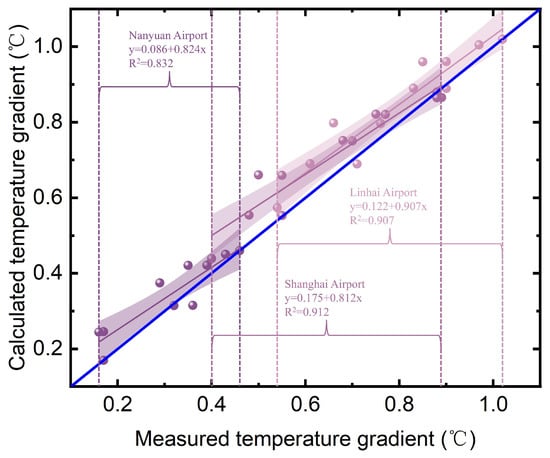
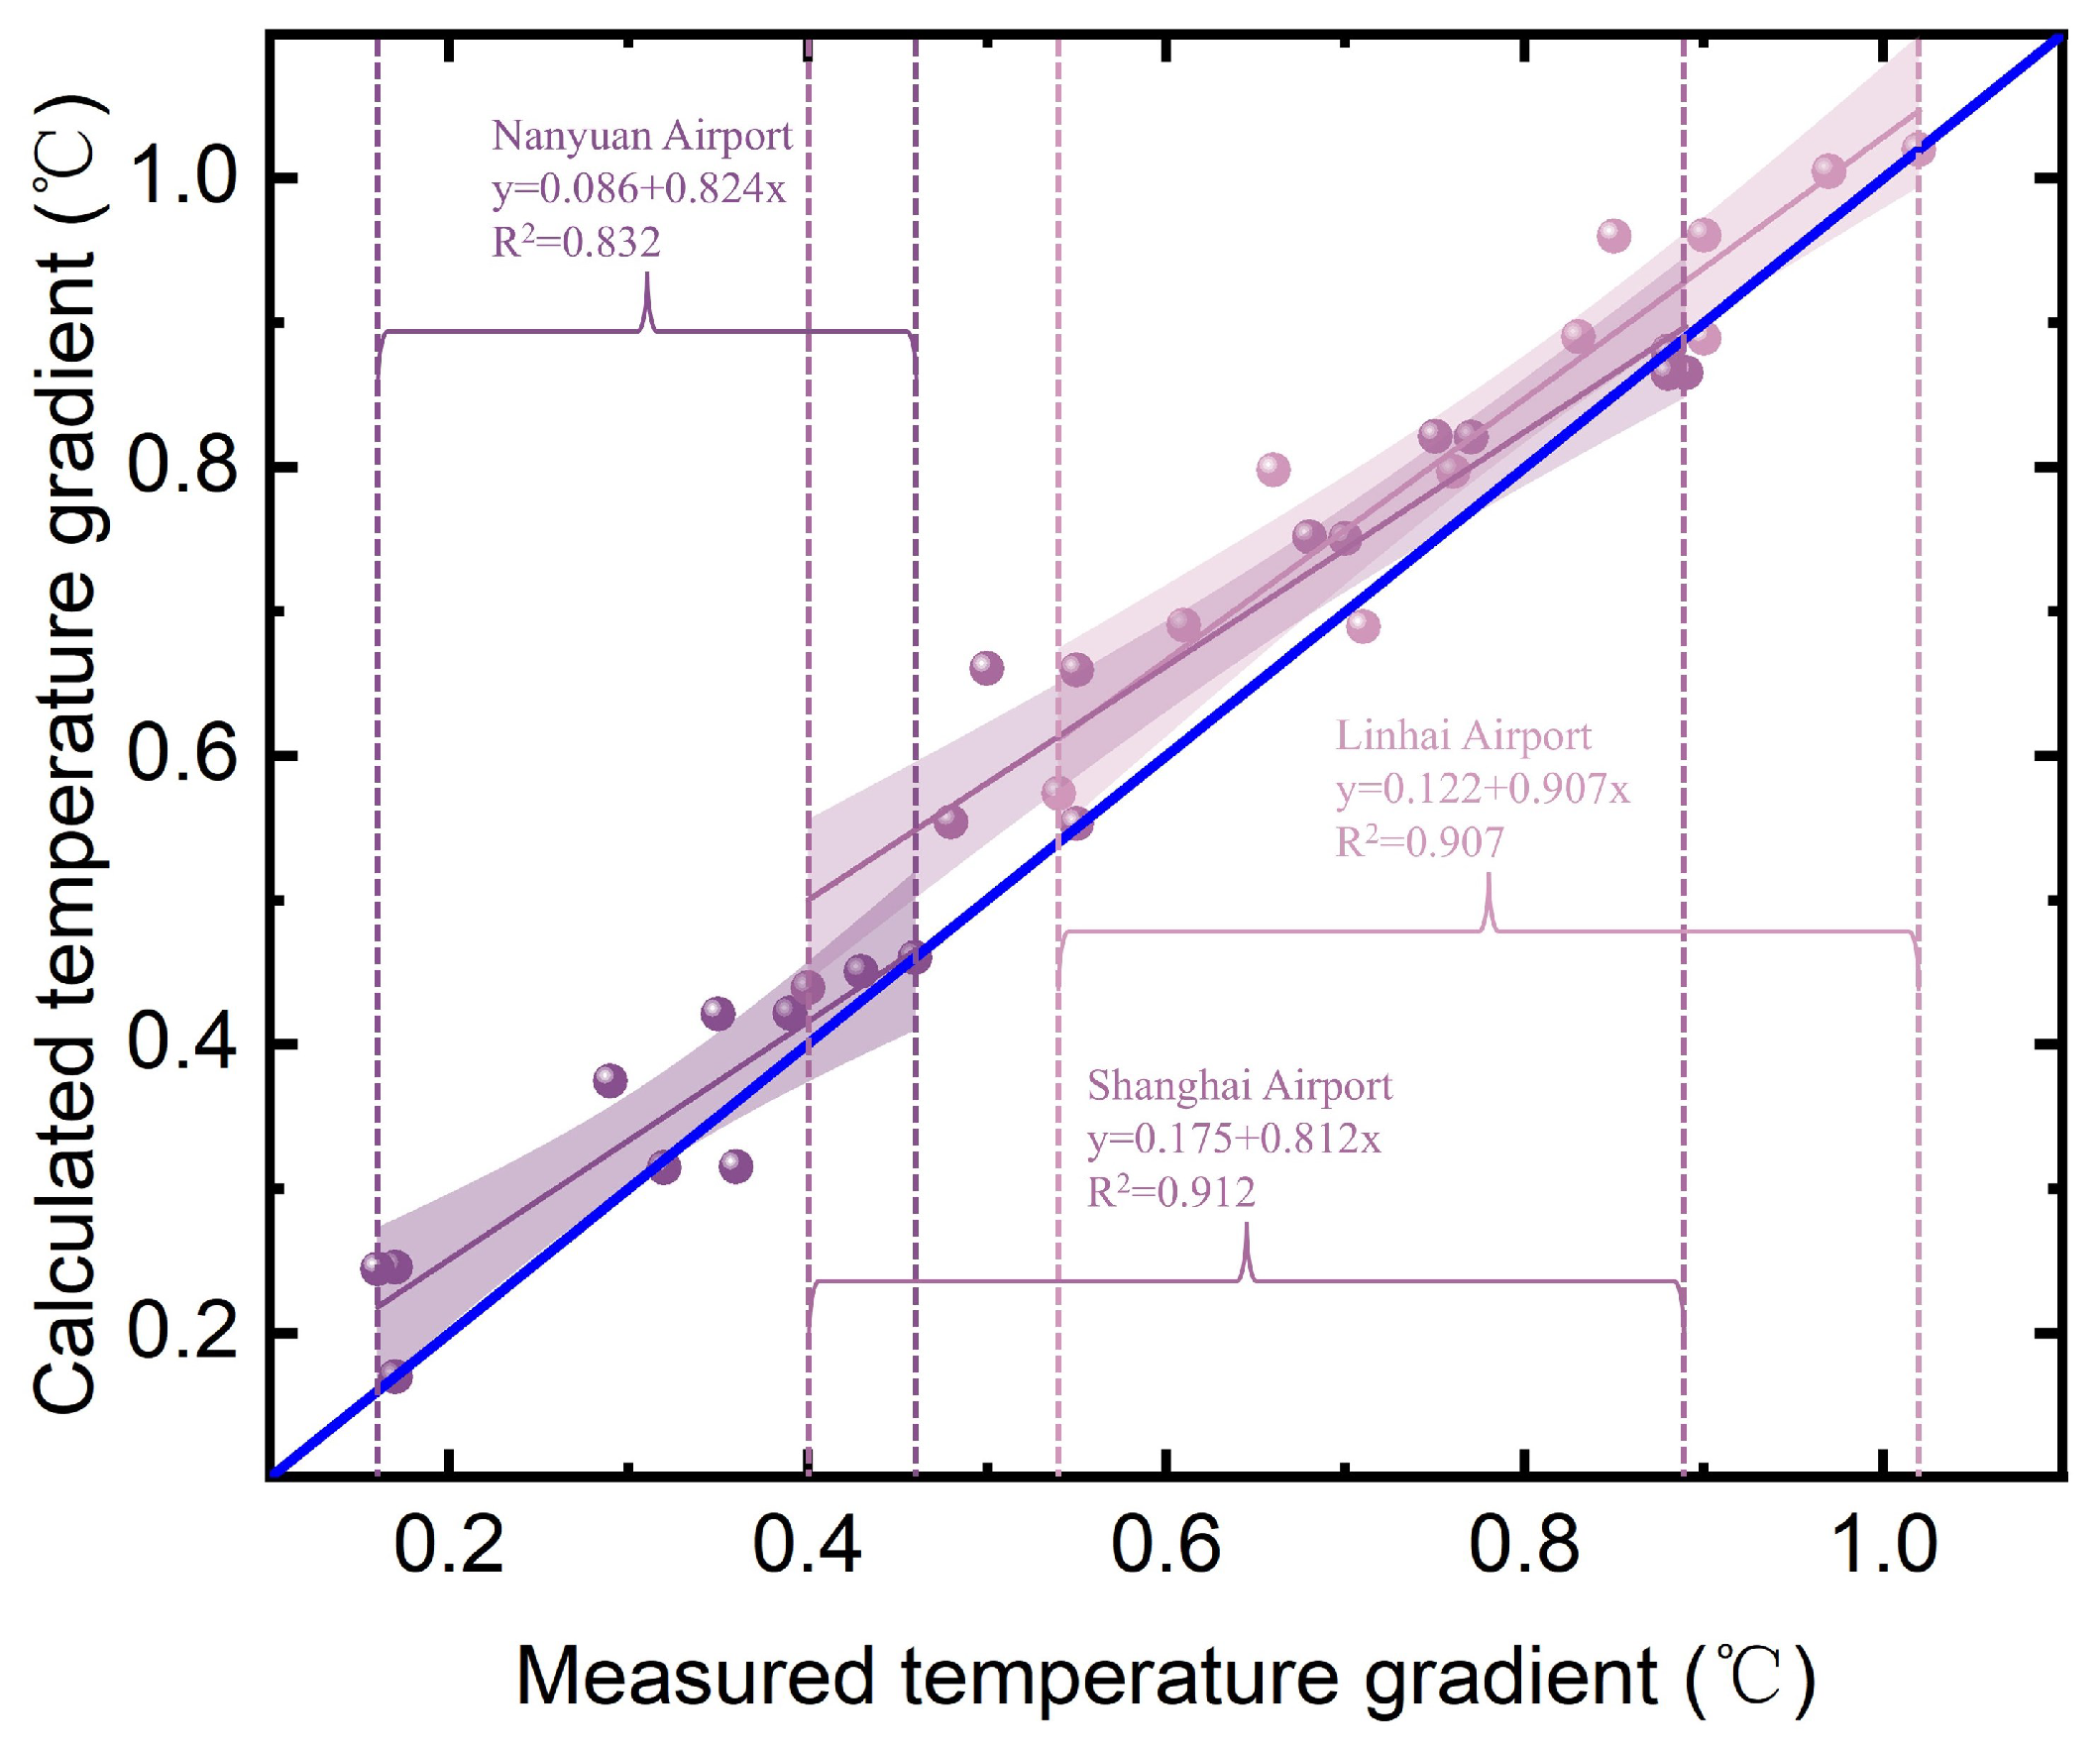
Table 2 shows annual variations of the daily measured maximum temperature gradient. Figure 5 is plotted from the data in Table 2 and indicates that the annual trend of the daily measured maximum temperature gradient can also be a sinusoidal approximation. Equation (27) is the sinusoidal calculation expression for the daily maximum temperature gradient. Figure 6 shows the sinusoidal approximation for the annual distribution of the maximum temperature gradient and Figure 7 evaluates its fitting effect. The sinusoidal method slightly overestimates the temperature gradient in all three airports, which leads to a relatively conservative pavement thickness design, but it is notable that a conservative result is beneficial for operation safety. The measured and calculated temperature gradient demonstrate a good linear correlation, with = 0.832, 0.907, and 0.912 for Nanyuan, Linhai, and Shanghai, respectively. MAE, MSE, and RMSE have also been used to describe the fitness effect, as shown in Table 3. All the three fitting lines approximate the 1:1 line, which also validates the feasibility of sinusoidal fitting.
where
Table 2.
Variation of daily maximum temperature gradients of different locations in a year.
Figure 5.
Annual variations of daily measured maximum temperature gradient.
Figure 6.
Sinusoidal approximation for annual distribution of daily measured maximum temperature gradient.
Figure 7.
Fitting effect of sinusoidal approximation.
Table 3.
, MAE, MSE, and RMSE of sinusoidal approximation.
- —Daily maximum temperature gradient in a specific month within a year (°C);
- —Average daily maximum temperature gradients of January and December (°C);
- —Difference between the daily maximum temperature gradient in a year and (°C);
- —Time (month).
For the cement concrete pavement in a specific airport, the curling stress is proportional to the temperature gradient. Therefore, the annual distribution of curling stress of pavement slabs is expressed as follows:
where
- —Daily maximum temperature curling stress in a specific month within a year (MPa);
- —Average daily maximum temperature curling stress of January and December (MPa);
- —Difference between the daily maximum temperature curling stress within a year and (MPa);
- —Time (month).
Calculations demonstrate the following: (1) The curling stress is generated from the nonlinear temperature gradient along the slab thickness and the internal stress caused by the nonlinear distribution needs to be considered. (2) The maximum curling stress in the pavement slab occurs in the slab middle and varies with the slab dimension. In the small dimension condition (generally less than 6 m), the maximum curling stress is in the slab center. As the slab size increases, the location shifts towards the slab edge. This indicates that the influence of slab boundary conditions (such as joints, etc.) on the slab center gradually decreases. The value develops in reverse to the slab thickness with a maximum threshold. (3) The temperature gradient of the pavement changes periodically with the air temperature and the daily trend is basically consistent with the air temperature curve. Both of them are expressed in sinusoidal functions. Since the curling stress is linear to the temperature gradient, it is also expressed using a sinusoidal function. (4) The annual distribution of the daily maximum temperature gradient is approximately expressed to be a sinusoidal function and the daily maximum curling stress can also be expressed using a sinusoidal function.
3. Thermal Expansion Stress
Pavement thermal expansion stress is determined by constraints, which consists of two parts. (1) Temperature-induced deformation restrained by the friction between the pavement slab and base. (2) Temperature-induced deformation restrained by adjacent slabs. Chang Wei-gao et al. proposed the calculation and distribution of the pavement thermal expansion stress [25]. The frictional coefficient f is related to the base material, slab misplacement, and repeated expansion/contraction behavior. is measured by field tests and selected from Table 4. is the displacement when producing the maximum friction. Let the slab temperature decrease and the linear expansion coefficient be , then the contraction displacement at a position from the starting point of displacement change will be: . When the reaches its peak value, . The starting point of displacement change is measured by a surface-mounted strain gauge. When the slab expands, the subgrade resists its expansion and produces compressive stress and vice versa.
Table 4.
Measured value of the frictional coefficient. Adapted from [26].
The maximum thermal expansion stress:
The daily distribution of thermal expansion stress:
The annual distribution of thermal expansion stress:
where
- —The maximum pavement thermal expansion stress (MPa);
- r—Density of the cement concrete ();
- —The maximum frictional coefficient;
- L—Length of the slab (m);
- —Displacement of the maximum friction (m);
- —Linear expansion coefficient;
- —Pavement temperature reduction (°C);
- —Maximum difference between average pavement temperature at a specific moment and the average pavement temperature (°C);
- t—Origin of the temperature period (h);
- —Moment of the average pavement temperature to the daily average air temperature (h);
- —Average value of daily maximum pavement temperature variations in January and December (°C);
- —Difference between annual maximum pavement temperature variation and (°C).
According to Equation (30), the daily distributions of thermal expansion stresses are calculated and shown in Table 5 and Figure 8.
Table 5.
Daily distribution of thermal expansion stresses.
Figure 8.
Daily distribution of thermal expansion stresses. Adapted from Chang [25].
4. Determination of the Slab Dimension
Temperature stresses consist of curling stress and thermal expansion stress. The critical location for aircraft traffic load in the slab is chosen as the calculation point of temperature stresses. The combination of aircraft load and temperature determines the slab size.
4.1. Aircraft Load
The aircraft load is currently adopted to design the pavement structure, which is represented by the design aircraft load. The design aircraft is the aircraft with the maximum operation number and main landing gear wheel load. One wheel load on the main landing gear of the design aircraft is selected as the design load. The operation number means the times of taking off and landing. When the aircraft takes off, the operation number is set as 1 and when the aircraft lands, the operation number is set as 0.75 since the landing weight is usually less than the takeoff weight. The other types of aircraft are converted to the design aircraft according to Equation (32). The annual average calculated operation times of the design aircraft is as shown in Equation (33). The repeated operation number means the number when every point of the pavement width is loaded by the aircraft. The annual repeated operation times of the design aircraft is shown in Equation (34). Then the cumulative repeated operation times of the design aircraft during the design life is as shown in Equation (35). The aircraft load sigma p is calculated in Equation (36). The pavement slab thickness is mainly determined by the design aircraft load and the traffic volume. Referring to the current design specifications, only the effect of design aircraft load is considered while that of the temperature stress is ignored, which leads to the same slab thickness designed as the design aircraft load being unchanged. This indicates that for different design aircraft, the pavement slabs of varying thicknesses have the same stress. It can be considered from Equation (36) that, according to current design specifications, the stress generated by the design aircraft load is independent of the pavement slab thickness.
where
- —Convert to the annual average equivalent operation times of the design aircraft;
- —Annual average operation times of the aircraft to be converted;
- —Dynamic load on a main wheel of the design aircraft (kN);
- —Dynamic load on a main wheel of the aircraft to be converted (kN);
- —Gear configuration conversion coefficient, adapted from Table 6.
Table 6.
Gear configuration conversion coefficient.
- —The annual average calculated operation times of the design aircraft;
- —The annual average operation times of the design aircraft;
- —The sum of the annual average operation times of all aircraft types other than the design aircraft, converted into the average equivalent operation times of the design aircraft.
- —The annual repeated operation times of the design aircraft;
- —Traffic percentage of the design aircraft within the traffic width, usually taking 0.9;
- —Width of a single tire (cm);
- T—Traffic width (m).
- —The cumulative repeated operation times of the design aircraft during the design life;
- t—The design life.
- —The aircraft load;
- —The design flexural tensile strength of cement concrete.
4.2. Expansion Stress
The thermal expansion stress of the pavement slab can be calculated using Equation (29). Equation (29) shows that the thermal expansion stress is related to the length, the overall temperature range of the pavement slab, and the friction force between the base and the slab, not to the pavement slab thickness.
4.3. Curling Stress
Regarding a specific airport pavement, the elastic modulus, expansion coefficient, and Poisson’s ratio of cement concrete are consistent. Based on Equations (1) and (2), the curling stress is just related to L (the length), h (the thickness), and (the temperature difference between the top and bottom of the slab). The relationship between the curling stress and L is shown in Table 7 (calculation conditions: E = 20,000 MPa, = 250 MPa, /°C, h = 0.26 m). When the length of the pavement slab is relatively short, the curling stress adversely changes with the slab length. But when the length reaches a specific value (usually 6∼8 m), the curling stress stops increasing but slightly decreasing. Therefore, regarding the large pavement slab, although the curling stress is greater than the thermal expansion stress, it cannot determine the slab size individually for the fact that it does not continuously increase with the slab length.
Table 7.
The distribution of the maximum curling stress along the length of the pavement slab.
If E = 20,000 MPa, = 250 MPa, = /°C, the maximum curling stresses of the slab edge with different thicknesses are shown in Table 8. It manifests that the maximum curling stress decreases with increasing slab thicknesses. That is to say, in the same pavement structure and environment conditions, the thicker the slab, the less the curling stress. Since the thermal expansion stress has nothing to do with the slab thickness; it can be inferred that the thicker the slab, the smaller the temperature stress under the same slab size condition.
Table 8.
Values of the curling stress of different slab thicknesses.
4.4. Superposition of Curling and Thermal Expansion Stress
Once the design aircraft and traffic volume are established, the slab thickness can be computed using the pavement design parameters. Should the slab thickness be ascertained, dimensions of the pavement slab ought to be governed by temperature-induced stresses, encompassing both curling and thermal expansion stress. The combination of curling and thermal expansion stresses dictates the slab dimension. The moment that both curling and thermal expansion stresses simultaneously manifest as positive values is due to the pavement temperature peaking between 12:00 and 18:00, specifically during the latter phase of curling stress [27]. Conversely, during the initial phase of curling stress, the thermal expansion stress is assumed as negative values. Let the curling stress be and thermal expansion stress be ; the superposition of curling stress and thermal expansion stress at the slab bottom is illustrated in Equation (37).
where
- —Temperature stress (MPa);
- —The moment that the curling stress of the pavement slab turns from negative to positive (h);
- —The moment that the thermal expansion stress of the pavement slab turns from negative to positive (h);
- —The moment that the curling stress of the pavement slab turns from positive to negative (h).
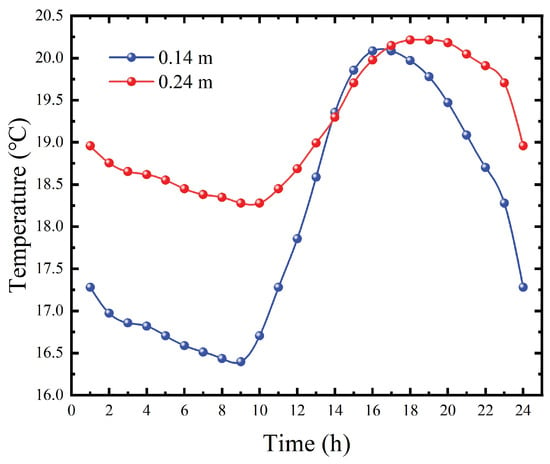
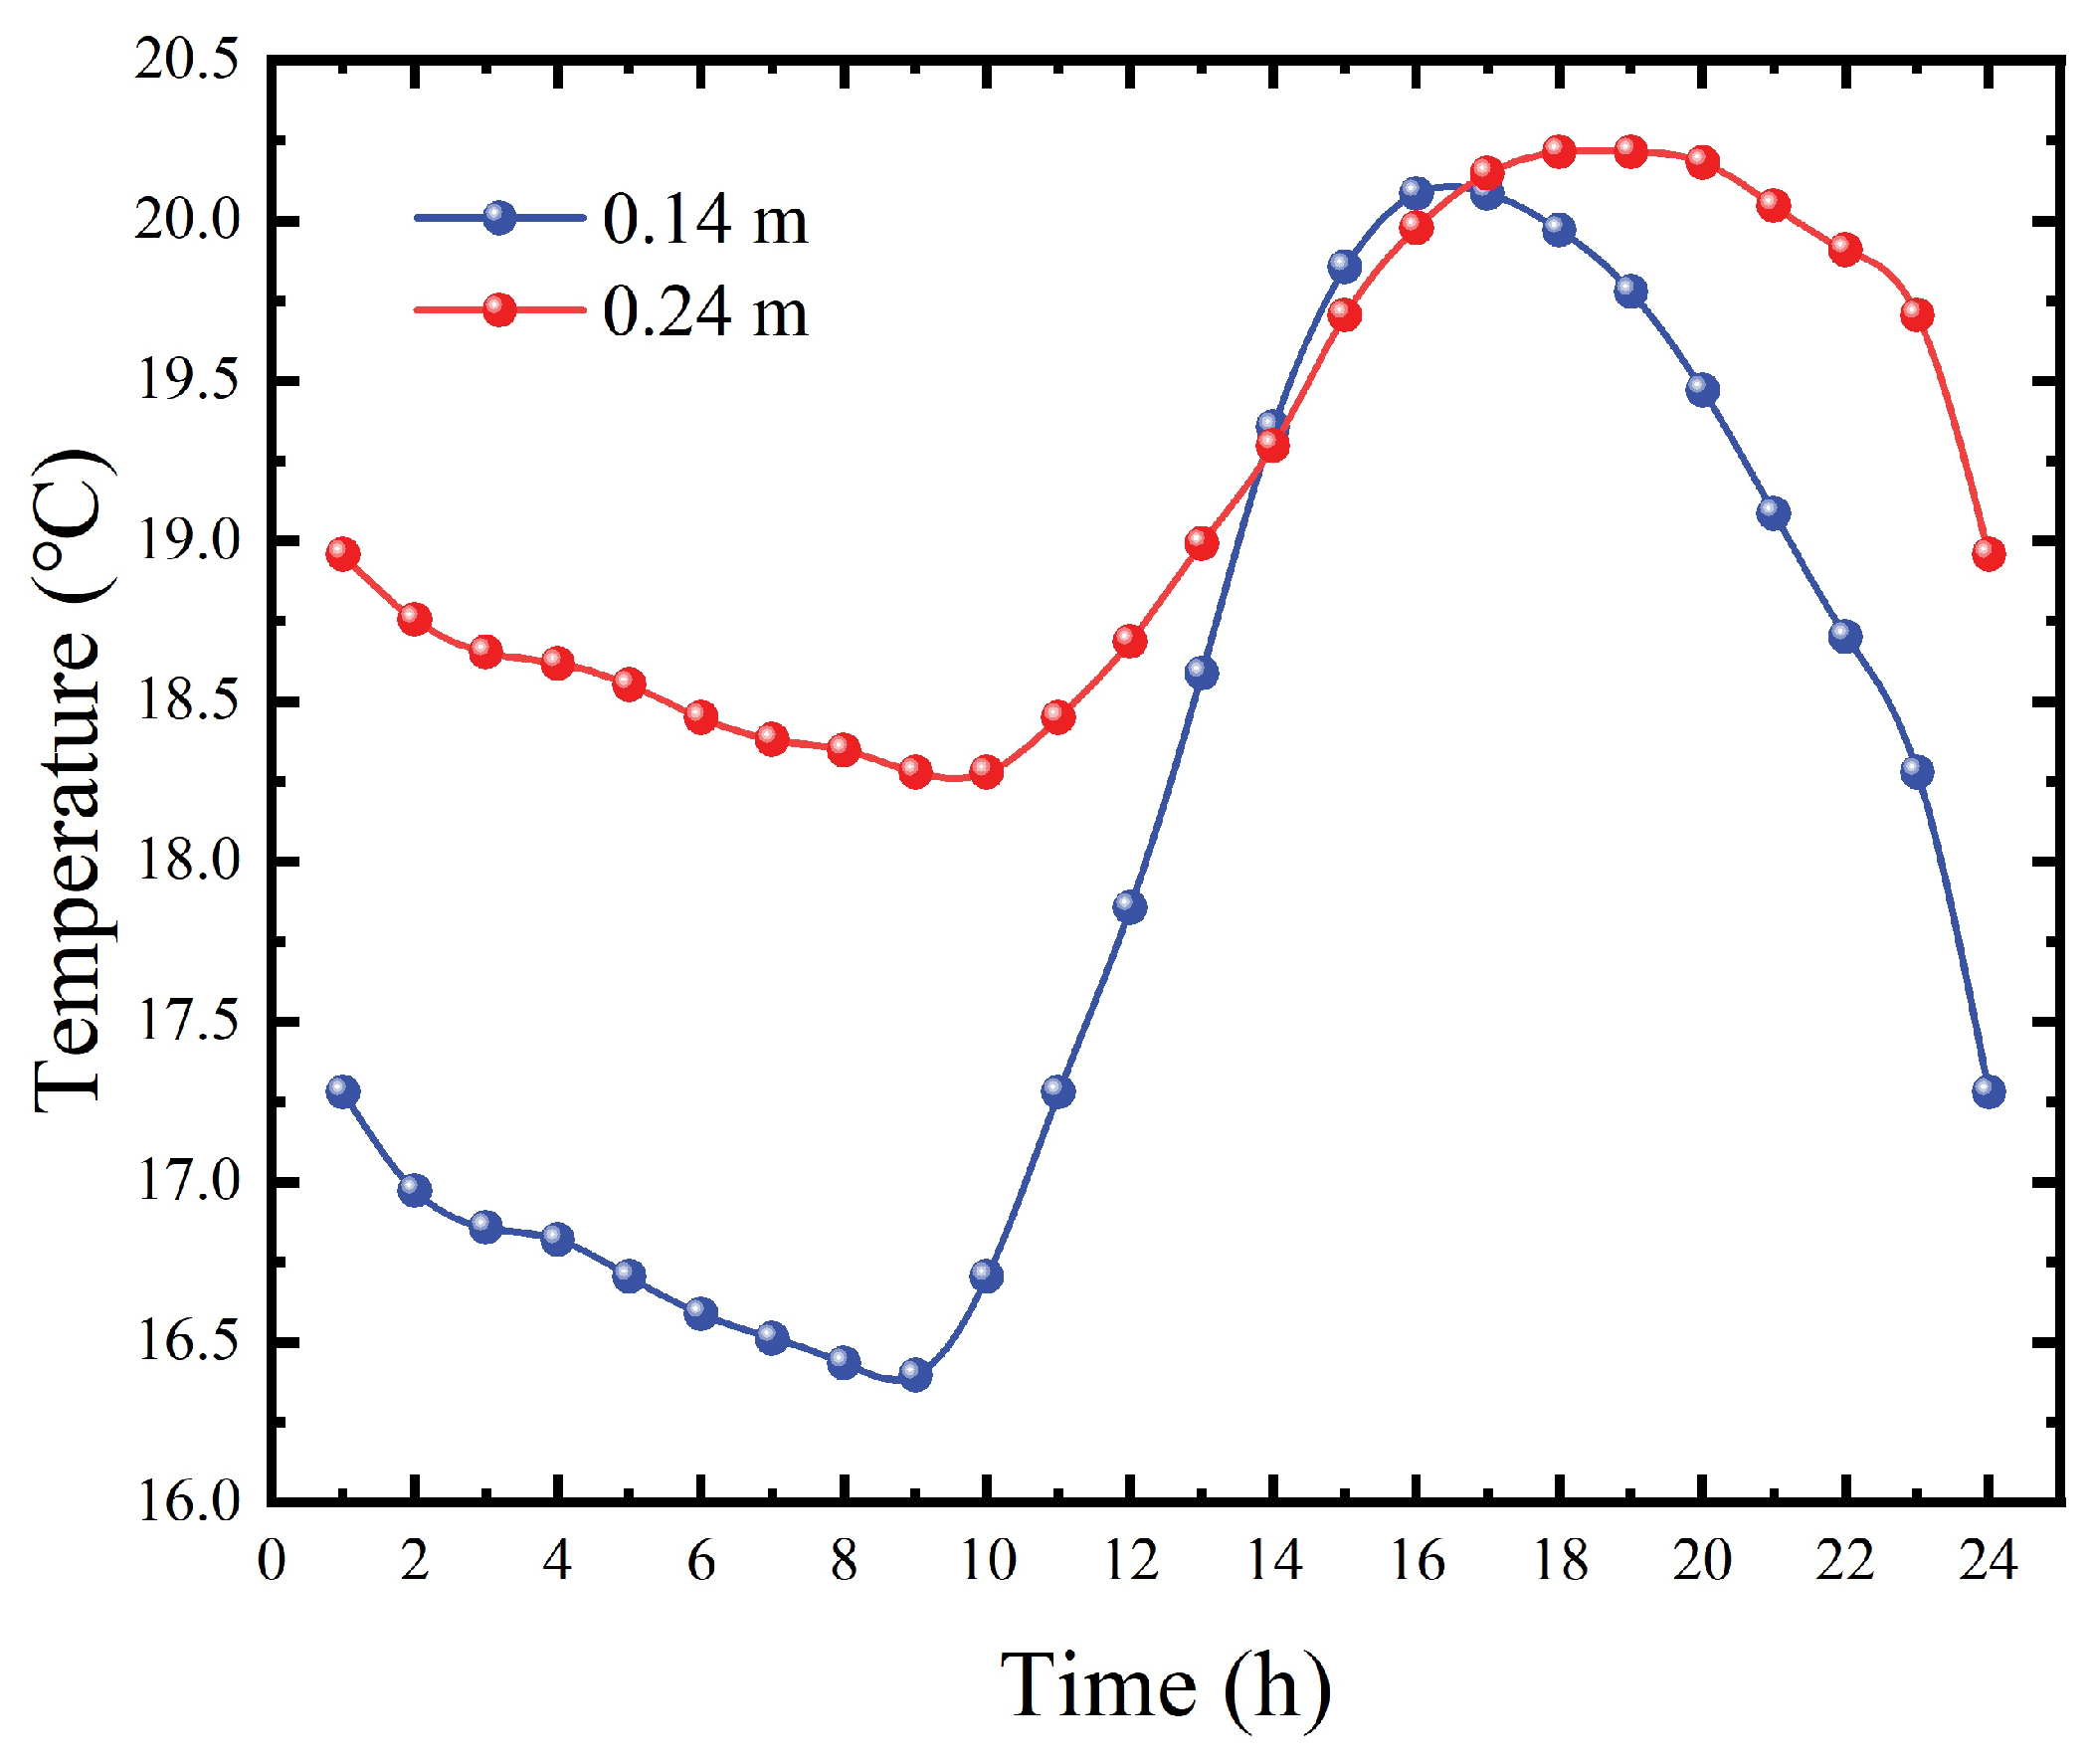
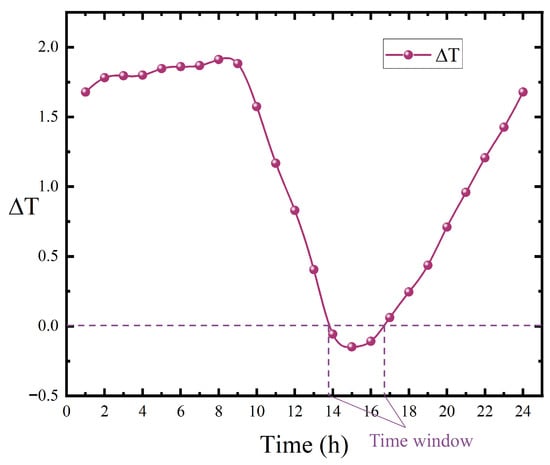
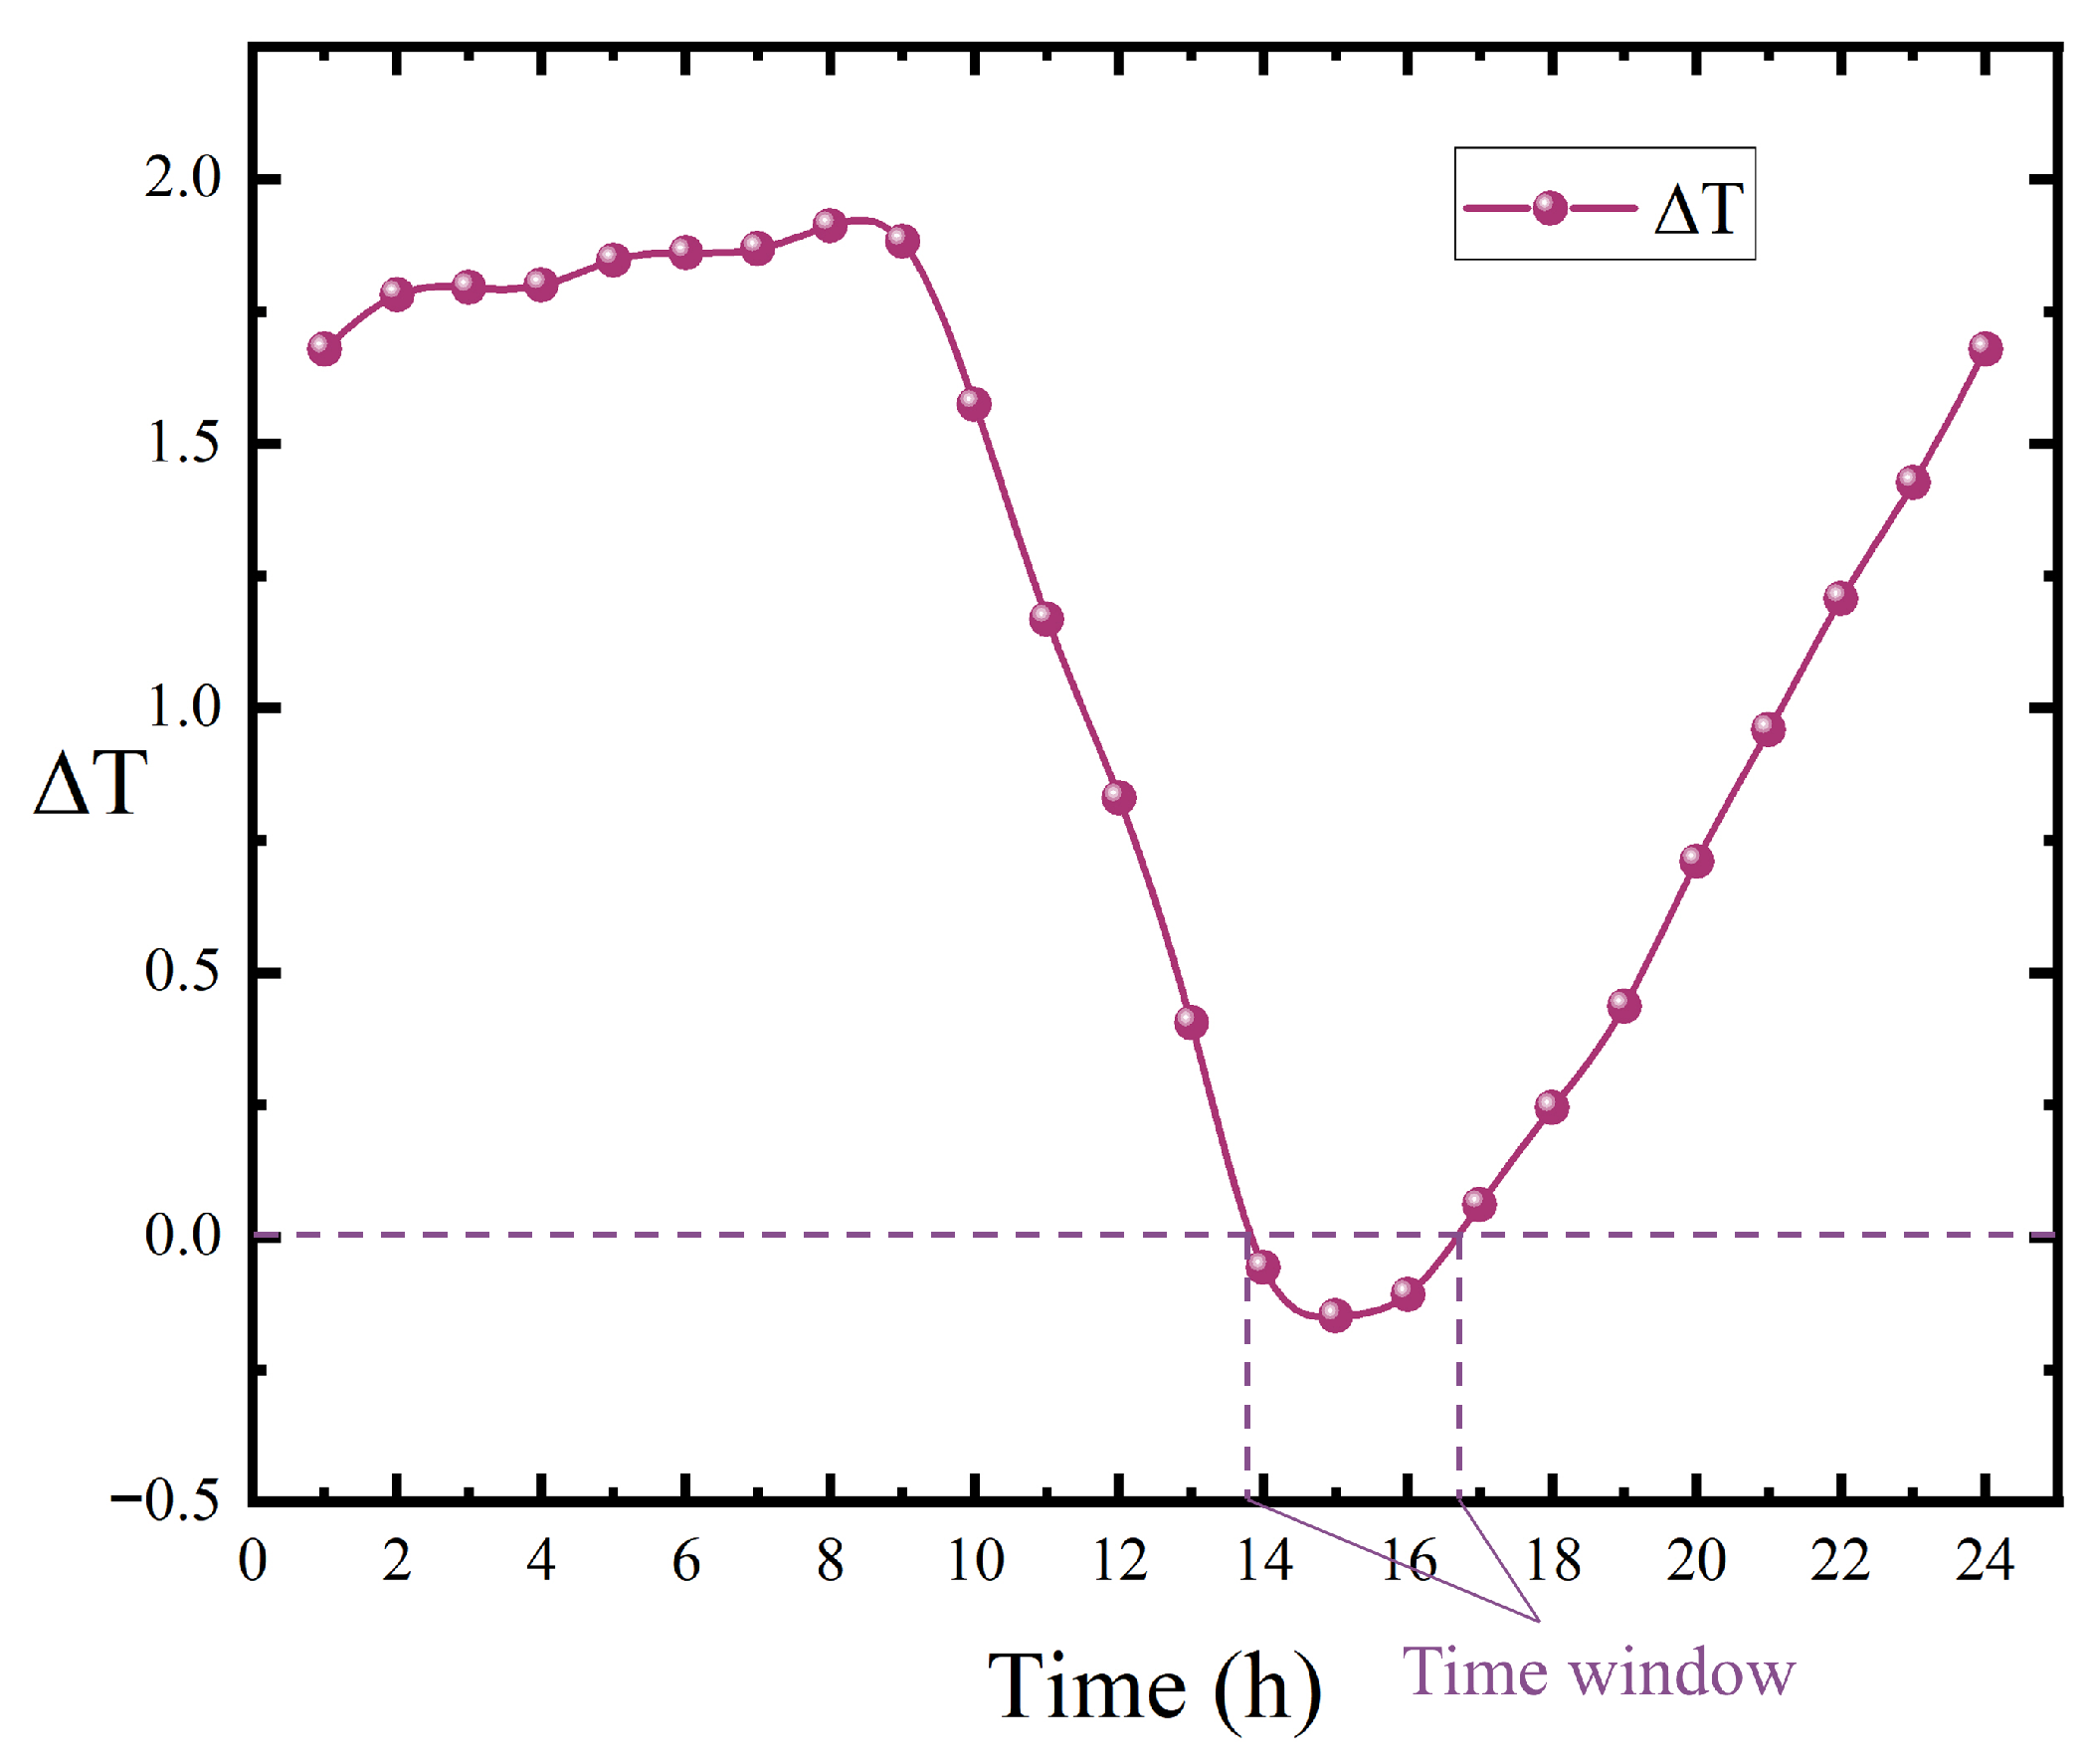
Table 9 lists the measured temperatures in 0.14 m and 0.24 m depths of the cement concrete slab in Chongqing airport. Temperature monitoring points were installed at a distance of 7.5 m from the runway center line and the monitoring duration was 10 days in November. As shown in Figure 9 and Figure 10, the curling stress becomes positive in 14∼17 for the negative temperature gradient and expansion stress becomes positive in 16∼24 for the decreasing slab temperature. Additionally, 16∼17 is the time window that the curling stress and expansion stress both become positive.
Table 9.
Temperature variation of cement concrete slab in Chongqing.
Figure 9.
Daily temperature variation of the pavement slab at different depths.
Figure 10.
Daily temperature gradient variation of the pavement slab.
Regarding how to select the critical temperature stress position, the weakest part of the pavement slab that acted based on the aircraft load is the main factor considered. Table 1 shows that the curling stress shifts with slab longitudinal length, which is impacted by the temperature effect. However, the critical location is selected comprehensively considering temperature and aircraft load. The midpoints of transverse and longitudinal edges are the weakest parts in aircraft load. Due to the large size of the slab mainly increasing the longitudinal length, the midpoint of the longitudinal edge is selected as the critical position.
Equation (38) is the fatigue equation for an elastic foundation slab that takes into account the modulus of the subgrade reaction and the load transfer coefficient at the slab joints. The fatigue equation is derived from laboratory fatigue tests. is the ratio of the unloaded slab deflection to the loaded slab deflection. is the modulus of the subgrade reaction measured by the plate load test. R is the ratio of the minimum load to the maximum load. n is the ratio of the maximum load to the flexural strength of cement concrete. The cement concrete pavement slab fatigue test is conducted in the large pavement test tank (6 m × 18 m). The fatigue testing machine adopted was the PME-50A model manufactured by Jinan Testing Machine General Factory, Jinan city, Shandong Province, China, with a maximum static and dynamic load of 500 kN and an operating frequency range of 1∼8 Hz. During the operation of the testing machine, high-pressure oil output from the high-pressure oil pump flows through the pulsator and is connected to the jack and the oil pressure gauge in the control system, filling the pulsator and the oil pressure gauge with pressure oil. The flywheel drives the crank to make the pulsator move up and down, generating pulsating oil pressure that is transmitted to the jack, and a sinusoidal pulsating load is thus applied to the pavement slab. The cement used was Grade 32.5 Portland cement produced by Yaoxian Cement Plant in Tongchuan city, Shaanxi Province, China, and the fine aggregate was medium sand from the Bahe River with a fineness modulus of 2.08 and a density of 1.34 . The mix proportion of cement concrete was determined in accordance with the C30 strength grade of cement concrete, with a designed flexural tensile strength of 4.5 MPa. After the casting and construction of cement concrete pavement slabs were completed, the curing measure of sand covering combined with water sprinkling was adopted. Four types of pavement slabs were prepared to reflect the influence of different joint load transfer capacities on the fatigue strength of pavement slabs, including single slabs, multi-slab specimens with dummy joints at all edges, multi-slab specimens with tongue-and-groove joints at all edges, and multi-slab specimens with tongue-and-groove longitudinal joints and dummy transverse joints. The base materials of the pavement slabs included lime soil, sand, undisturbed loess, and lime–fly ash macadam. Different base materials correspond to different moduli of subgrade reactions, thereby reflecting the influence of the modulus of subgrade reaction on the fatigue strength of pavement slabs. The fatigue equation is comprehensively considering both the modulus of subgrade reaction and the load transfer coefficient according to the test results.
where
- N—The fatigue amount of the pavement slab;
- R—The ratio of minimum stress to maximum stress;
- —The load transfer coefficient;
- —The modulus of subgrade reaction;
- n—The ratio of maximum stress to the concrete flexural strength.
Let
Then
The fatigue damage caused by a single design aircraft load coverage is
The fatigue damage of the pavement slab is related to the number of aircraft applications. The number of repeated aircraft load applications is uniformly distributed over the pavement service life. Due to the influence of some factors (climate, etc.) on the annual distribution of the repeated aircraft load applications, the distribution within a day is generally non-uniform. However, to simplify the calculation, the annual and diurnal distributions of the repeated aircraft load applications is assumed uniform. This uniform assumption of repeated aircraft loads is made according to the flight plan. The number of the repeated aircraft load applications within a day can be calculated using equation Equation (42).
where
- —The cumulative number of repetitive applications of the design aircraft load over the design lifespan;
- —The design lifespan (year).
The distribution of the number of repeated aircraft load applications within a day is divided in two parts: daytime and nighttime. The thermal expansion stress is generated in the daytime and the compressive stress is generated in the nighttime at the pavement slab bottom. The compressive stress is beneficial to the aircraft load. Therefore, the temperature stress is considered just in the daytime. In addition, the flights are usually arranged in the daytime. The number of repeated aircraft load applications in the daytime is more than that in the nighttime. Statistically, the applications carried out in the daytime account for 70∼80% of the total number within a day. If the day/night ratio becomes larger, the maximum size will decrease for the bigger daily damage to the slab. If the repeated aircraft load applications in the daytime () are uniformly distributed, they can be calculated by Equation (43).
where
- q—The ratio of the number of design aircraft load applications under positive temperature gradients to the daily number of design aircraft load applications.
The fatigue damage caused by the aircraft load within a day can be calculated using Equation (44):
where
- —The number of repeated aircraft load applications during the time period from to ;
- —The number of repeated aircraft load applications during the time period from to .
Assuming that the repeated aircraft load applications are uniformly distributed in the daytime and if the time period from to equals that from to , the number of the repeated aircraft load applications of the two time periods is equal.
The fatigue damage caused by the aircraft load within a year can be calculated by Equation (45).
The temperature fatigue equation is also in the form of Equation (38). R in the temperature fatigue equation is as follows:
where
- —The design aircraft load (MPa);
- —The equivalent temperature fatigue stress (MPa).
Then the temperature fatigue amount is
The annual fatigue damage will be
Let
Then the equivalent temperature fatigue stress can be back-calculated in the above procedure.
4.5. Design Steps
- Data collection: (1) Collect the types of aircraft and decide the design aircraft. Calculate the annual and diurnal number of repeated aircraft load applications. Based on the flight schedule, determine the number of repeated aircraft load applications during the daytime. (2) Collect meteorological data and pavement slab temperature information: (1) Gather daily temperature fluctuation records from the last three decades, compute the mean daily temperature and the diurnal temperature variation amplitude for each day, plot the daily temperature changes within each year, and determine the annual trend of daily temperature variations. (2) Gather daily solar radiation fluctuation records from the last three decades, plot the daily solar changes within each year, and determine the annual trend of daily solar radiation variations. (3) In the presence of measured data involving pavement slab temperatures, it is feasible to ascertain the temperature gradient of the pavement slab by the diurnal and annual temperature profiles of the slab. In the absence of such measured pavement slab temperature data, the temperature gradient of the pavement slab and the diurnal and annual temperature profiles of the slab can be alternatively computed with Equation (19) based on the collected meteorological data.
- Preliminary pavement structure design: Preliminarily determine the structure, material, and thickness of pavement layers according to the design aircraft, transportation volume, climate (ambient temperature and precipitation), and soil.
- Design parameters of pavement structures: Establish the design flexural strength and modulus of elasticity for the cement concrete, ascertain the computed modulus of subgrade reaction at the upper surface of the base, and choose the joint configuration with the load transfer coefficient at the joints.
- Pavement slab thickness calculation: Calculate the slab thickness according to the method in the specification.
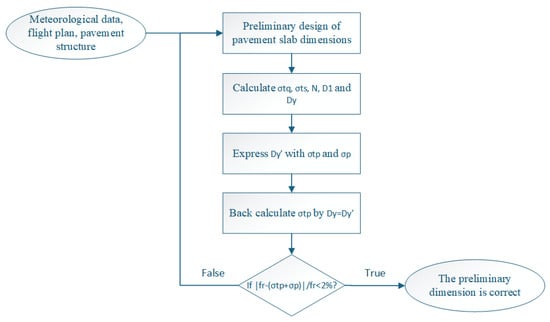
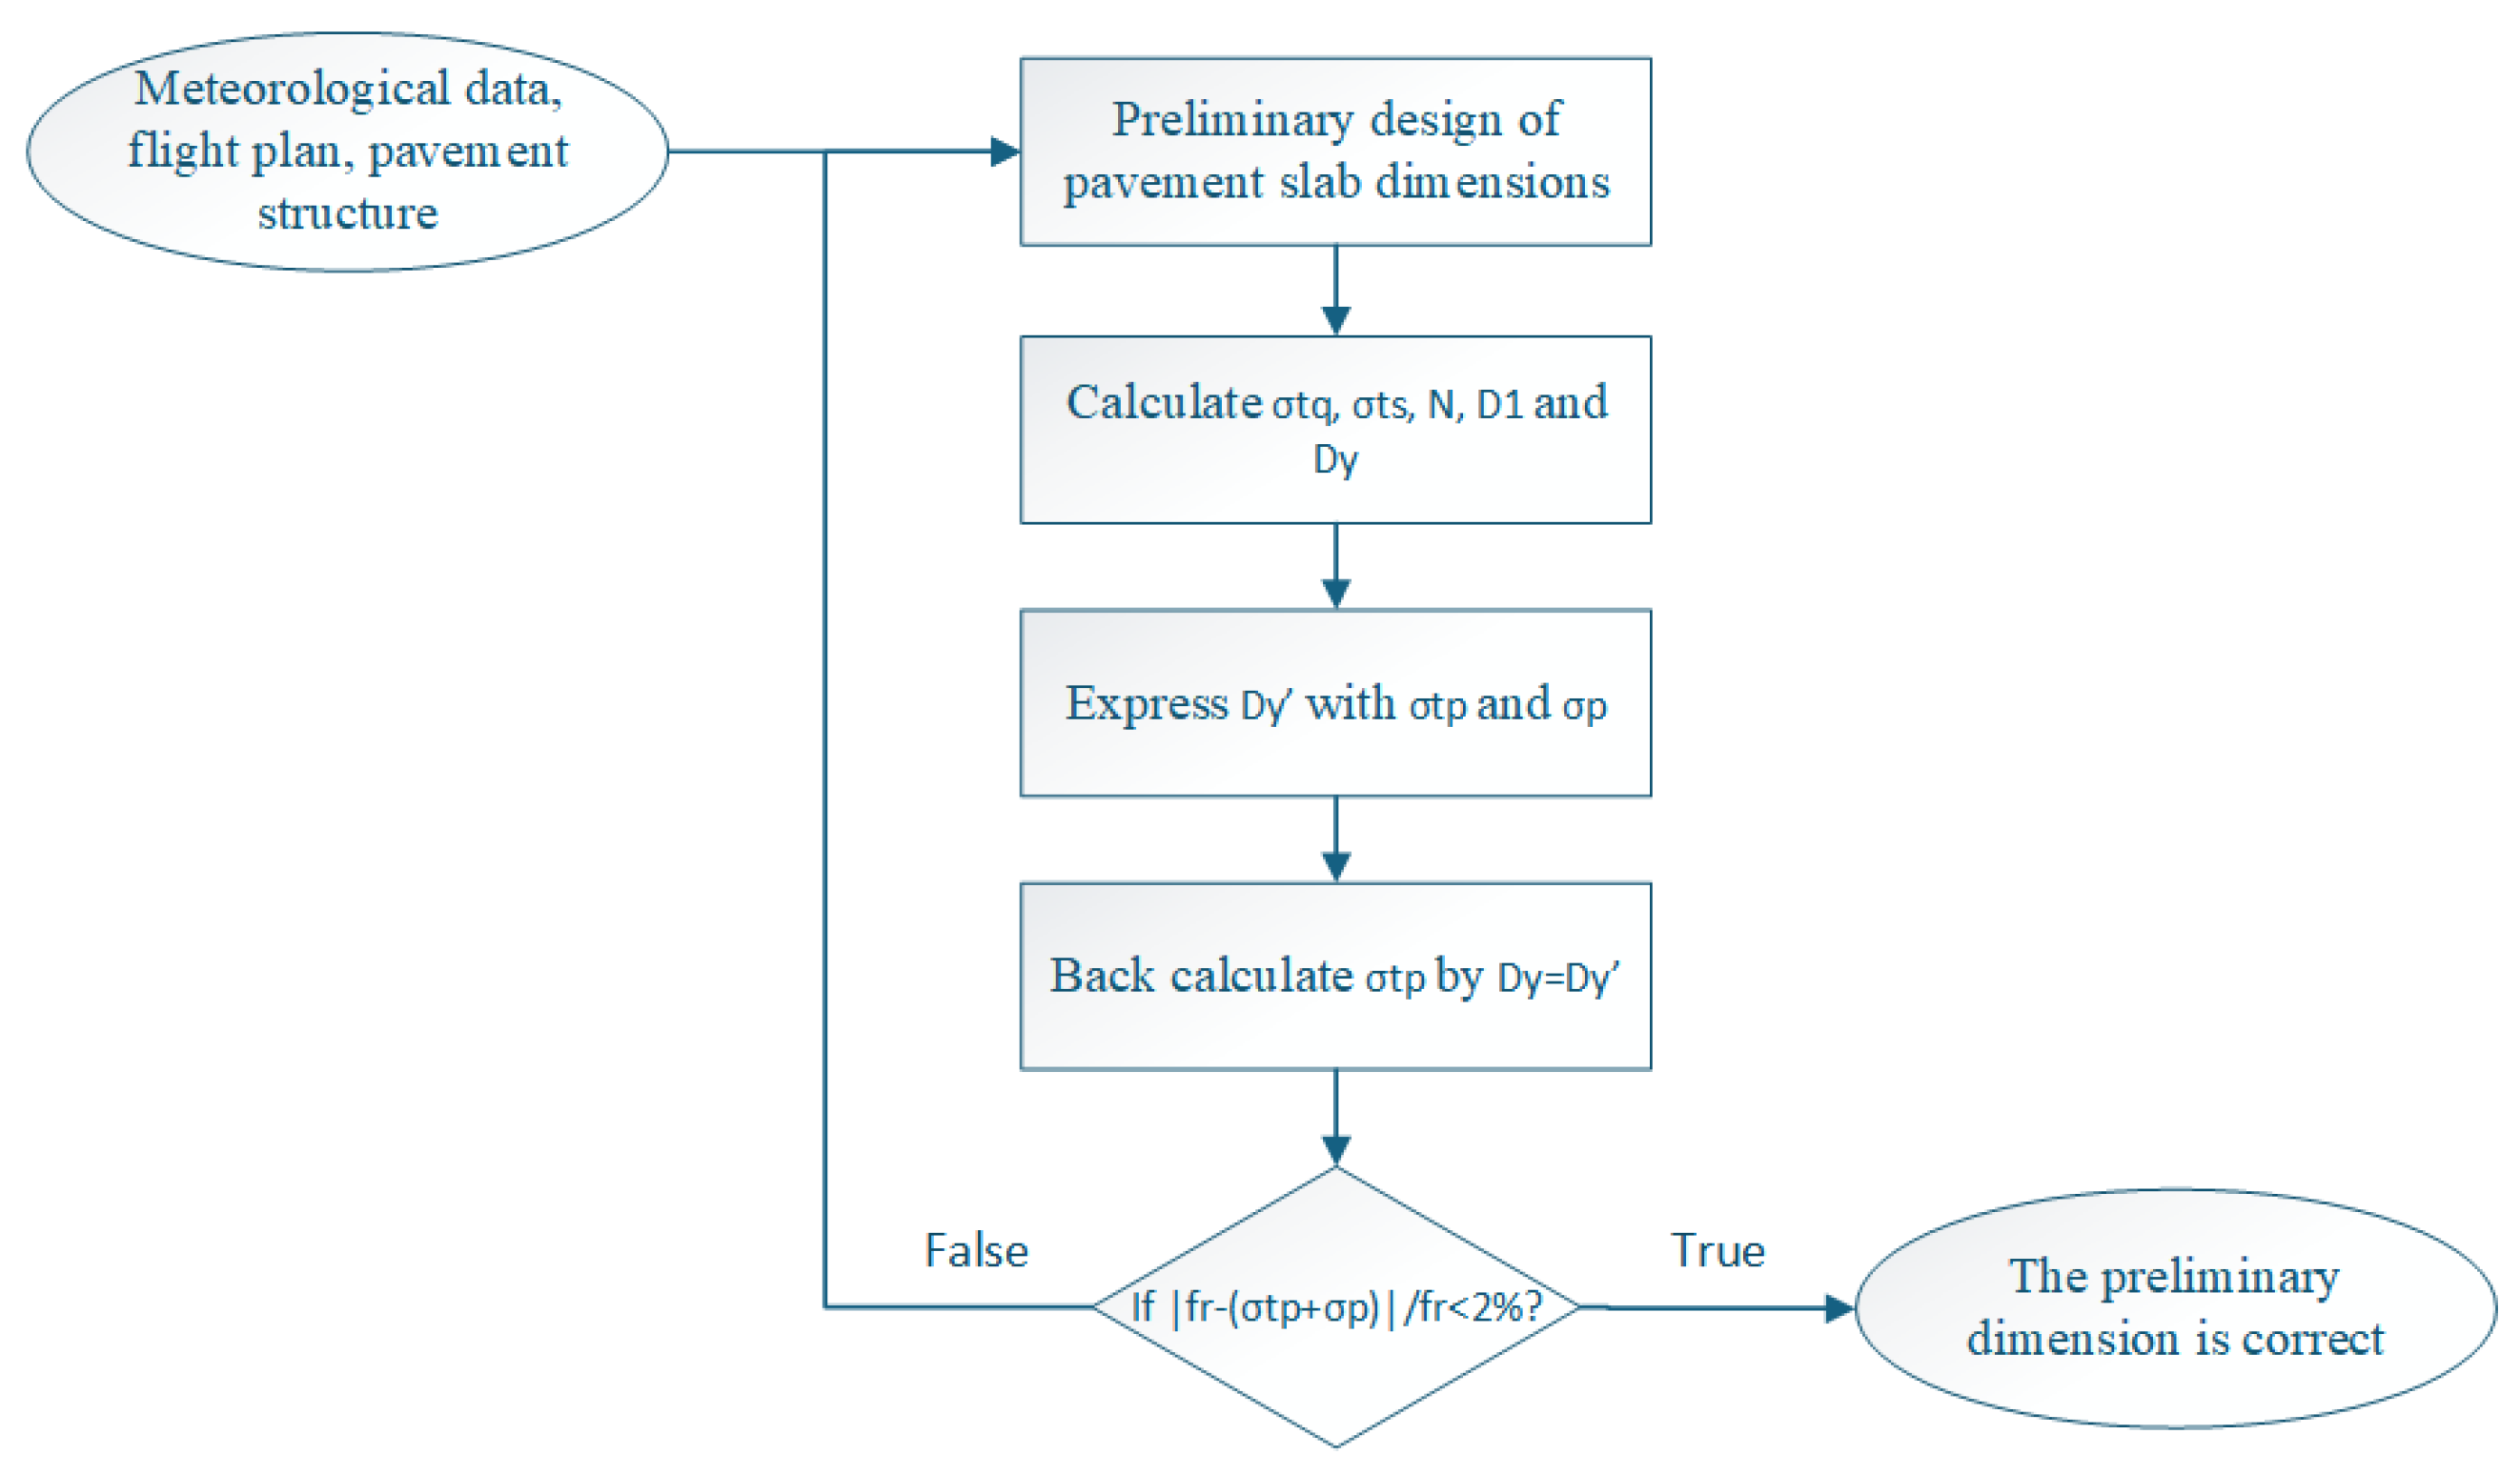
- Pavement slab dimension calculation: Preliminarily determine the pavement slab dimension. Referring to Equation (49), the equivalent temperature fatigue stress can be back-calculated.If Equation (50) is satisfied, the preliminarily chosen size is just the allowed maximum size of the pavement slab ( represents the flexural strength of cement concrete pavement (MPa)). Otherwise, the assumed size of the slab should be revised and the calculations should be repeated until the requirements are satisfied.
Figure 11 demonstrates the design steps.
Figure 11.
Flowchart of the design steps.
4.6. Verification of the Large Concrete Pavement Slab Theory
To verify the design method of the airport large cement concrete pavement slab established above, a test section was paved with large cement concrete slabs.
4.6.1. Calculation of Large Pavement Slab Dimension
The pavement structure consists of a dynamic compaction treated soil subgrade, with 0.30 m thick semi-rigid base course made of lime–fly ash-stabilized aggregate (cement and fly ash). The flexural design strength of the cement concrete pavement slab is 5.0 MPa. Referring to the method provided in the specification, the pavement slab thickness is 0.30 m as calculated. Firstly, the collected local annual and diurnal climate distribution of the airport is prepared for calculating the temperature distribution of the pavement slab. The annual repeated load of the design aircraft is adopted to be 4000/year. The comprehensive resilient modulus designed for the top surface of the base layer is 280 MPa. The maximum pavement slab sizes of different thicknesses are calculated and shown in Table 10.
Table 10.
The maximum pavement slab sizes of different slab thicknesses.
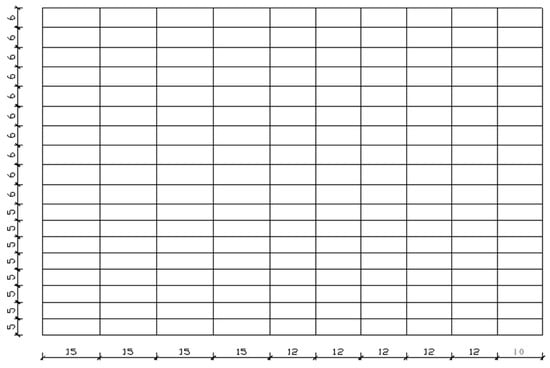
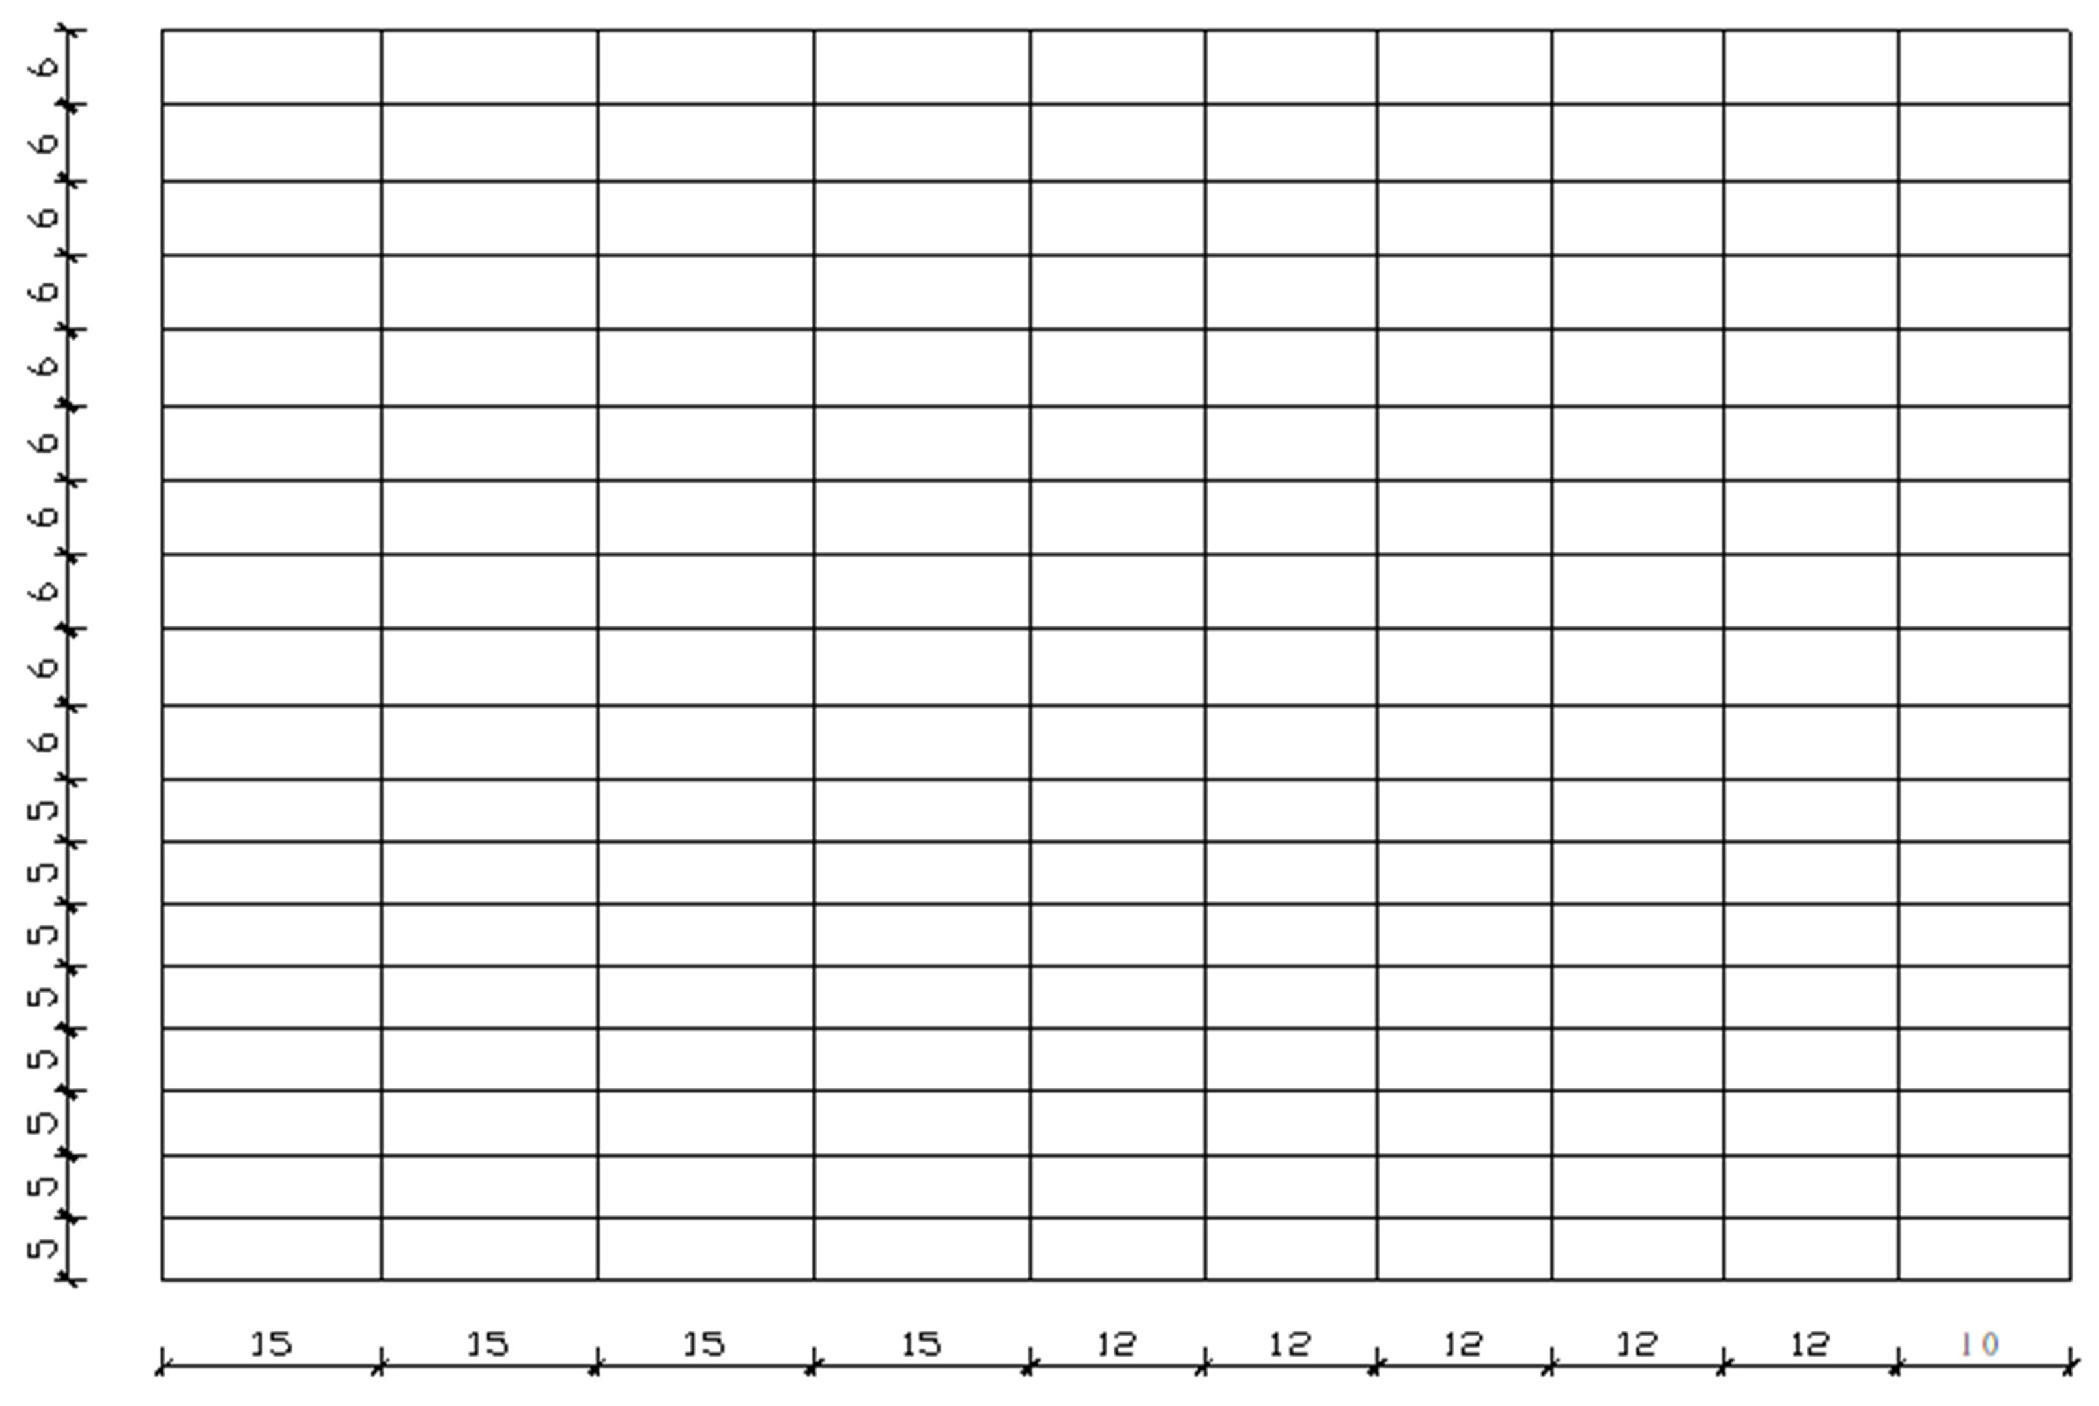
To verify the results shown in Table 6, 0.3 m thick large slab tests were conducted on the apron of a certain airport. The dimension of the test area was 130 m × 100 m and the pavement slab was divided into panels of 5 m × 15 m, 5 m × 12 m, 5 m × 10 m, 6 m × 15 m, 6 m × 12 m, and 6 m × 10 m, as shown in Figure 12. A total of 12,220 (3666 ) of cement concrete pavement was paved. Additionally, mix proportion tests were conducted for seven different admixtures, which are as follows:
Figure 12.
Schematic diagram of the test section panel layout.
1. Fly ash, fiber; 2. Fly ash, fiber, water-reducing agent; 3. Fly ash, fiber, expanding agent; 4. Fly ash, fiber, water-reducing agent, expanding agent; 5. Fly ash, expanding agent; 6. Fly ash, water-reducing agent, expanding agent; 7. No additional admixture materials.
4.6.2. Performance Evaluation of the Concrete Slab
To evaluate the performance of the pavement slab, tests consisting of pavement bearing capacity and pavement smoothness were conducted.
Pavement Bearing Capacity
To determine the bearing capacity of the large pavement slab, the deflection of the pavement was measured, and the Pavement Classification Number (PCN) of the pavement was calculated. The selection of parameters was as follows:
As shown in Table 11, the elastic modulus of the cement concrete in different proportions was measured through cement concrete trabecular specimens.
Table 11.
Elastic modulus of cement concrete in different proportions.
The flexural strength of the cement concrete was taken as the design strength, which was 5.0 MPa. The subgrade reaction modulus was back-calculated through measuring the actual deflection curve of the pavement slab, which was applied by a bearing plate load. The entire test section underwent deflection testing at a total of 12 points. Specific locations were selected on strip 4, strip 6, strip 13, and strip 16, each with one slab of 10 m, 12 m, and 15 m. Among them, two strips were paved with plastic cloth on top of the lime–fly ash-stabilized macadam, while the other two were not. The PCNs of each point were calculated and are shown in Table 12. It demonstrated that beside one point being classified as a medium strength foundation, the other points were classified as high strength foundations. The minimum PCN was 39.9 and the maximum PCN was 49.2. Judging from the evaluation of the pavement structure strength, the pavement slab strength did not decrease with the slab dimension expansion, which illustrated that the slab dimension expansion had no impact on the pavement structure strength.
Table 12.
Parameters and PCNs of the measured points.
Pavement Smoothness
The pavement smoothness was measured by 3 m pavement straightedge. The 3 m pavement straightedge is made of hardwood, aluminum alloy, or steel, with a flat bottom surface and a total length of 3 m. During the construction inspection, place the 3 m straightedge on the pavement at the test location along the direction determined as required. Visually inspect the gap between the bottom surface of the 3 m straightedge and the pavement to identify the position with the maximum gap. Insert a feeler gauge with height markings into the gap and measure and record the height of the maximum gap, accurate to 0.2 mm. Total 165 points were under inspection and 151 points were qualified. The qualification rate was 92%; the adjacent slab difference was tested at 138 points, with all 138 points passing, resulting in a 100% pass rate. The average maximum gap measured by 3 m straight rulers was 2.1 mm, with none of them exceeding 5 mm. The pavement smoothness was qualified and classified as excellent, showing that the adopted construction methods and techniques satisfied the demand of the large slab for pavement smoothness. The dimension expansion of the pavement slab had no impact on the pavement smoothness. The texture depth of the pavement slab was not evaluated because it was independent of the size of the slab.
4.6.3. Measurement of Joint Load Transfer Efficiency
Due to the longitudinal expansion of the cement concrete pavement slab, the width variation of the pavement transverse joint was larger than that of the currently used slab. Most of the transverse joints in airport cement concrete pavement slabs are dummy joints, and their load transfer efficiency mainly relies on the irregular through-fracture surfaces formed in the cross-section of the slabs, which transfer loads through interlocking effects. Therefore, the width variation of the pavement transverse joints influences the load transfer efficiency of the dummy joints.
To investigate the variation of the joint width of large cement concrete slabs under different environmental conditions, observations on joint width changes were carried out on the test section of large cement concrete slabs. Two continuously cast construction segments were selected as the observation sections on the test section (the construction segments run across the entire test section with a length of 130 m), and three measuring points were arranged on each joint; the average value of the three measuring points was taken as the width of the corresponding joint. The joint width was measured by a vernier caliper with an accuracy of 0.02 mm. The slab joint width was measured at four fixed time points every day (6:00, 13:00, 17:00 and 24:00, respectively). Measurements were conducted for two seasons, autumn and winter, with continuous monitoring for 10 to 15 days in each season. The diurnal variation of pavement slab joint width ranges from 0.009 mm/°C to 0.014 mm/°C [28]. The variation law of slab joint width is consistent in different seasons, which mainly changes with the variation of the internal temperature of the slabs. The joint width narrows as the slab temperature rises, and vice versa.
The measurement of joint load transfer efficiency involves setting up dial gauges on adjacent sides in the middle of a transverse joint in the slab. A heavy truck is used to apply a load at the edge of the slab on one side, causing deflection of the pavement slab. The readings on the dial gauges on both sides of the slab are recorded. Then, the truck is driven away from the loaded slab, and the pavement slab undergoes resilient deformation. After the deformation stabilizes (approximately 1 to 2 min), the readings on the dial gauges on both sides of the slab are recorded again. The difference between the two sets of dial gauge readings represents the resilient deformation of the edges of the pavement slab on both sides of the joint. and represent deflections of the unloaded slab and the loaded slab, respectively. The joint load transfer efficiency can be expressed with the joint load transfer coefficient. The greater the joint load transfer coefficient, the higher the joint load transfer efficiency. The definition of the joint load transfer coefficient is as follows:
where
- —The joint load transfer coefficient;
- —Deflection of the unloaded slab;
- —Deflection of the loaded slab.
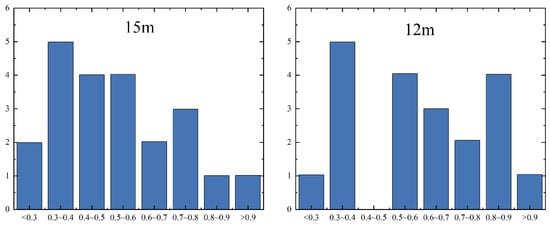
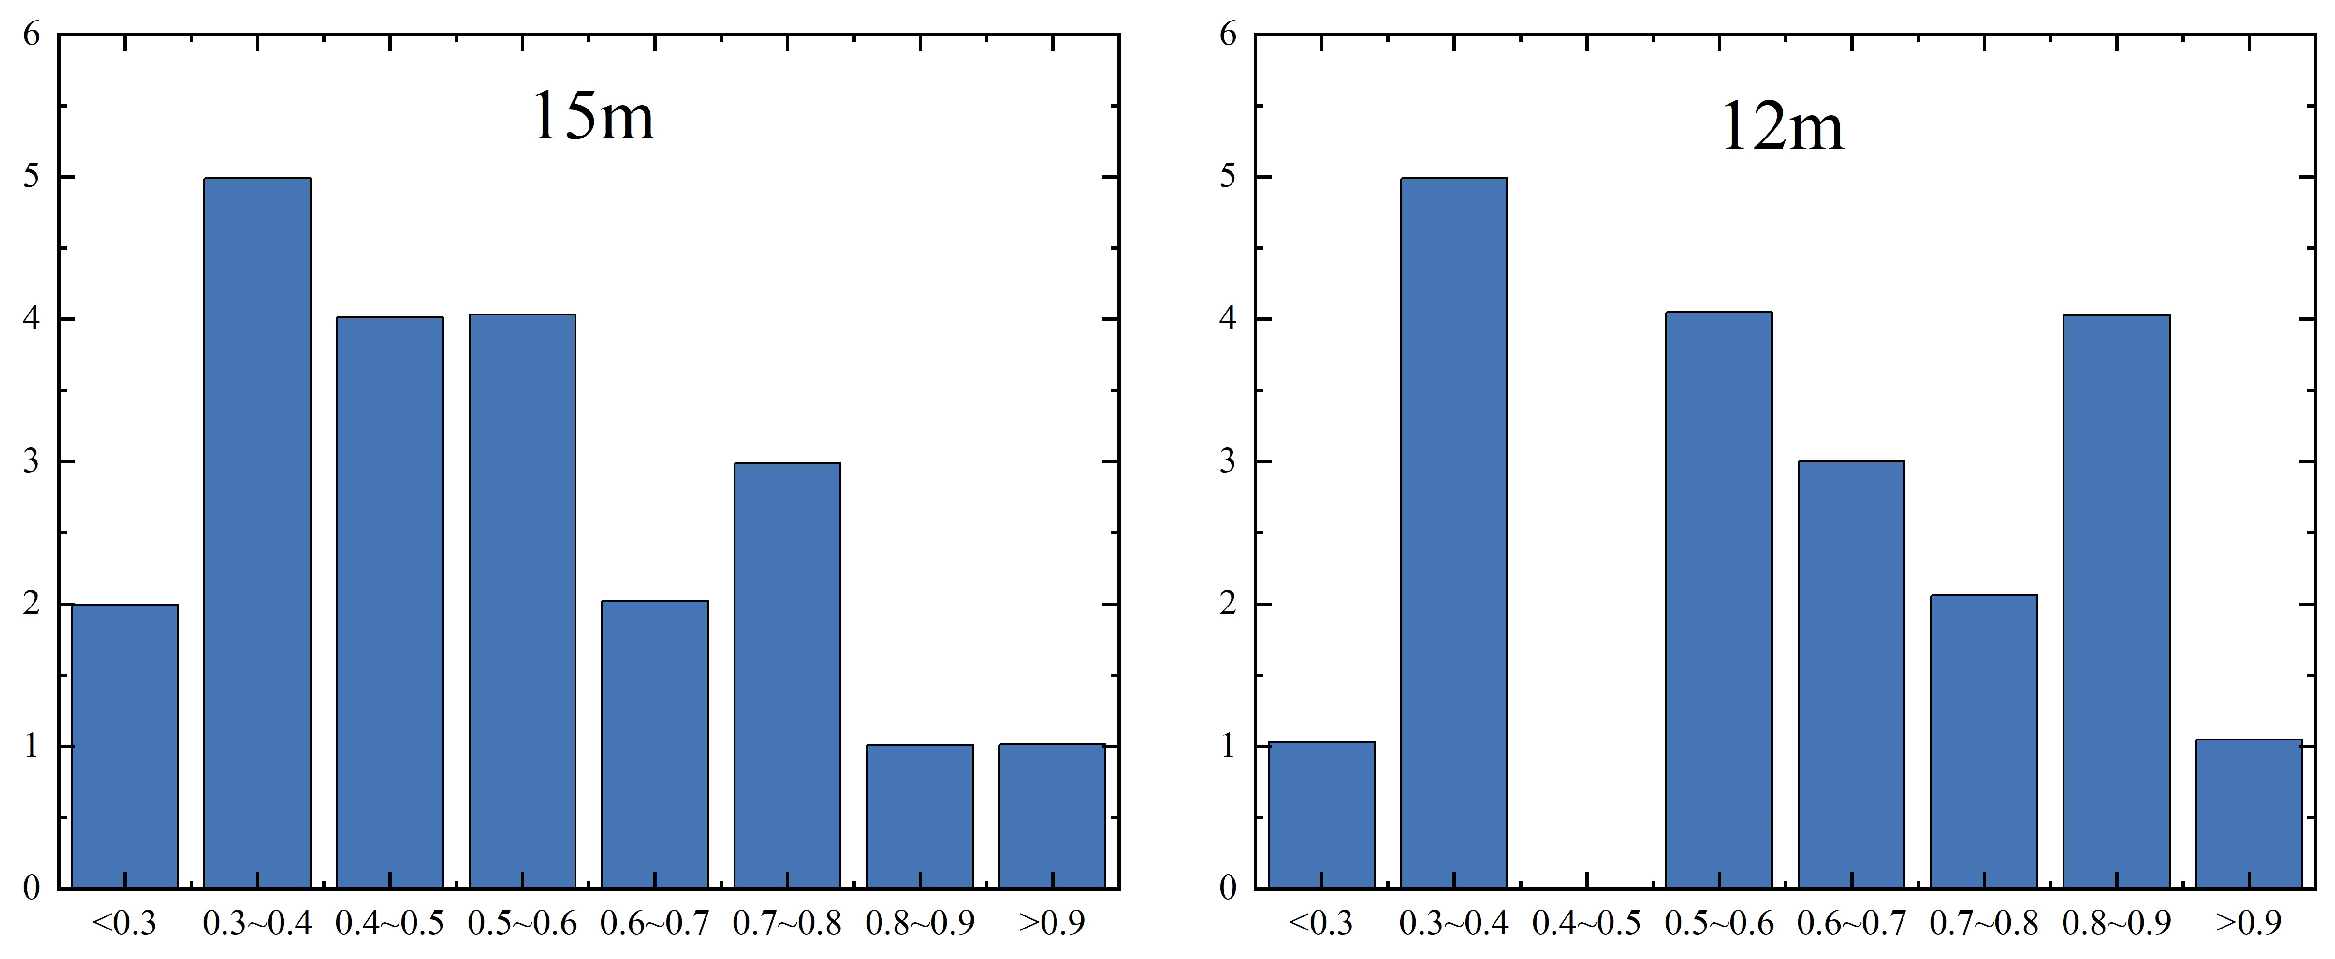
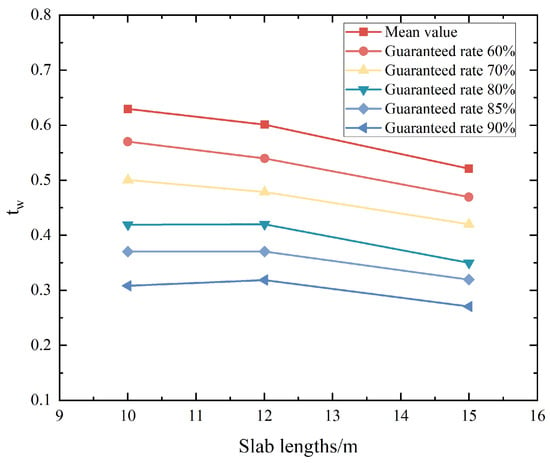
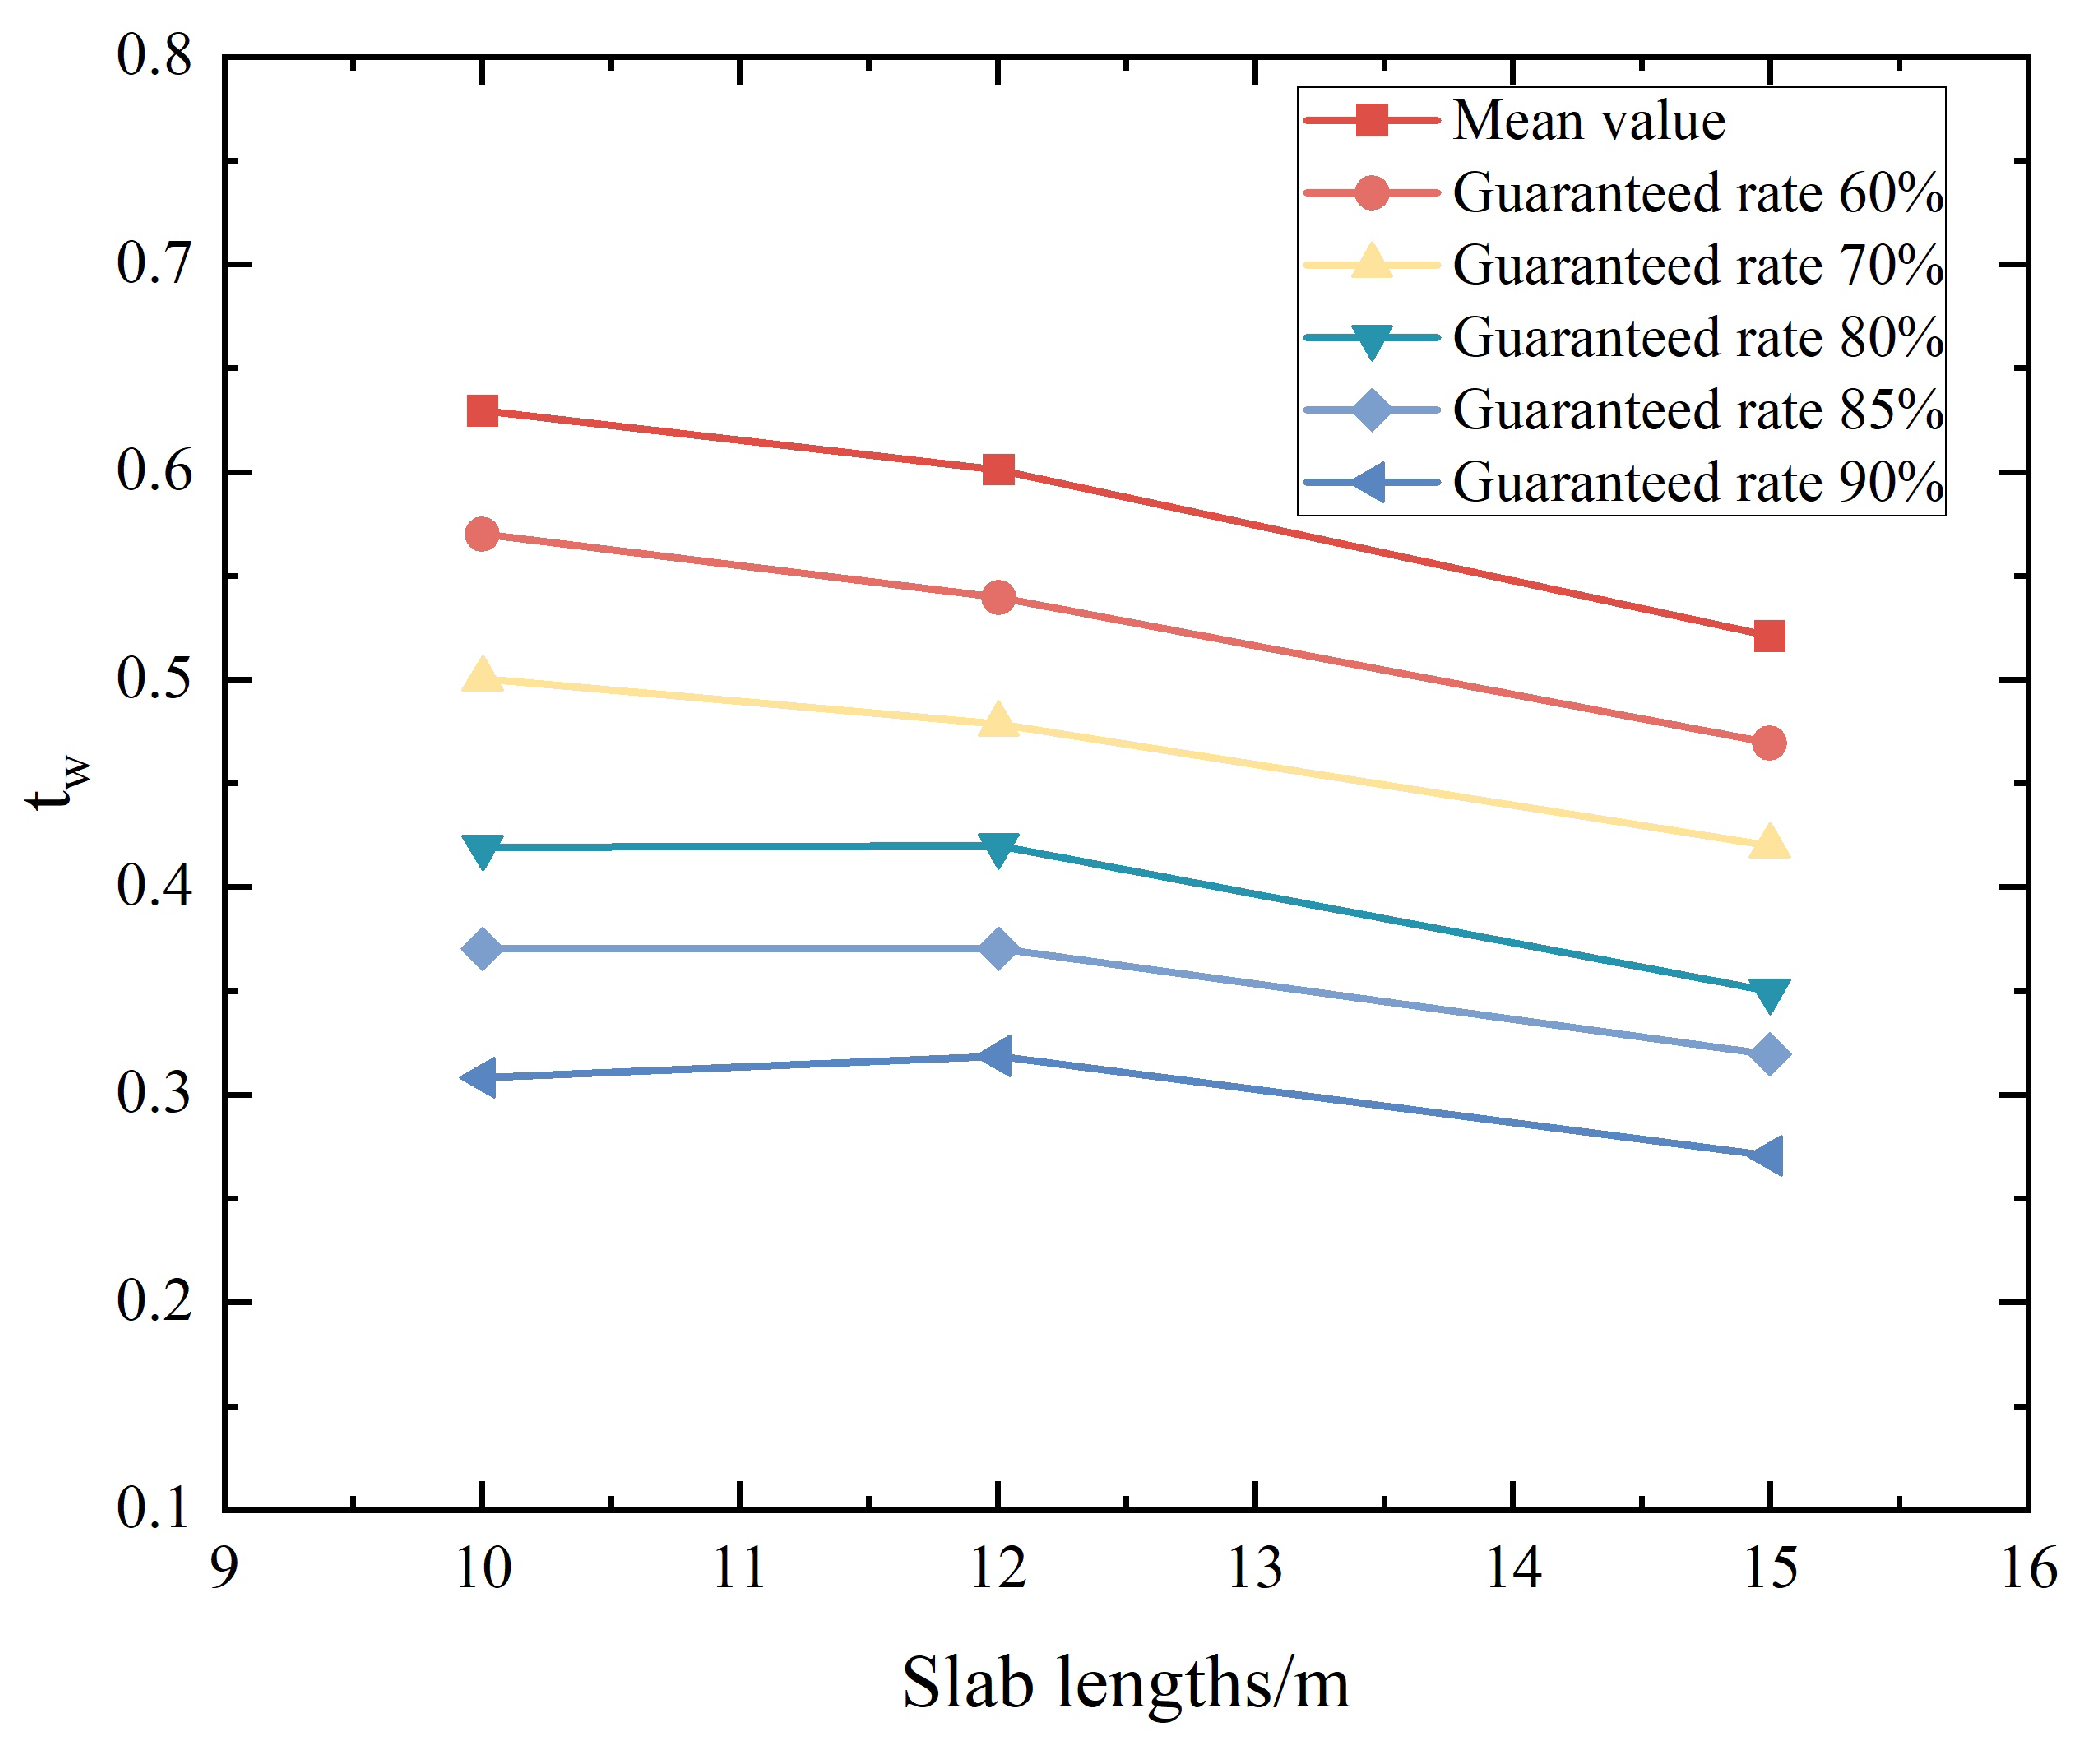
The load transfer efficiencies of every transverse joint were tested three times, with a total of 11 pavement strips tested. As shown in Figure 13, the measured joint load transfer efficiencies were divided at an interval of 0.1 for acquiring distributions of different intervals for the values of load transfer efficiency. By conducting statistical analysis under different guaranteed rates, the joint load transfer efficiency for different slab lengths can be obtained as shown in Table 13. When the average value represents the load transfer efficiency of the joint, the load transfer efficiencies for different slab lengths are as follows: 0.63 for a 10 m slab length, 0.60 for a 12 m slab length, and 0.52 for a 15 m slab length. According to the specification, the load transfer efficiency of dummy joints is in the range of 0.55∼0.65. Therefore, the average value is qualified to represent the load transfer coefficient except that 0.52 for a 15 m slab length is slightly low. The load transfer coefficient of the pavement slab decreases with the ascent of the guaranteed rates. When the guaranteed rate is 85%, the joint load transfer coefficients decrease to 59%, 62%, and 52% of the coefficient values for 10 m slab length, 12 m slab length, and 15 m slab length, respectively. The decrease degrees of joints for different slab lengths are similar and do not change dramatically with the increase in slab length.
Figure 13.
Interval distribution of the load transfer coefficients.
Table 13.
The load transfer coefficients of pavement slabs for different lengths under multiple guaranteed rates.
By performing numerical fitting on the values in Table 13, the calculation formula for the joint load transfer coefficient as a function of slab length at different guaranteed rates can be obtained, as shown in Table 14. Comparing the data in Table 13 and Table 14, it can be asserted that the fitted results are consistent with the measured values. The fitting curve is shown in Figure 14. Formulas shown in Table 14 provide reference for determining the joint load transfer coefficient of large pavement slab.
Table 14.
Fitting of load transfer coefficients for different slab lengths under multiple guaranteed rates.
Figure 14.
Fitting curves of the load transfer coefficients for different slab lengths under multiple guaranteed rates.
4.7. Determination of the Maximum Dimension for the Pavement Slab
To facilitate the determination of airport cement concrete pavement slab dimensions in engineering applications, the calculation method for pavement slab dimensions developed in this study was applied to compute the maximum dimensions of airport cement concrete pavement slabs in different regions.
The interval temperature distribution of the pavement slab is mainly influenced by the surrounding environment. The temperature change, solar radiation, and air convection directly determine the interval temperature distribution and variation of the pavement slab. Additionally, the heat sensitivity of the concrete itself also has an impact on the temperature distribution and variation. However, the heat sensitivities of the concrete in different areas are basically consistent so that it is feasible to ignore the impact of material differences across various regions when studying the temperature distribution and variation of the cement concrete pavement slab. Therefore, the temperature condition is mainly decided by the surrounding environment.
The interval temperature distribution and variation of the pavement slab can be expressed by the temperature gradient, which indicates the linear distribution of the temperature inside the pavement slab. Its value reflects the temperature variation condition of the pavement slab. The annual and diurnal distribution along with the maximum value of the temperature gradient directly determine the dimension of the pavement slab. The maximum temperature gradient reflects the effect of the surrounding environment on the pavement slab. Therefore, the temperature characteristics of pavement slabs in different regions are represented by the maximum temperature gradient.
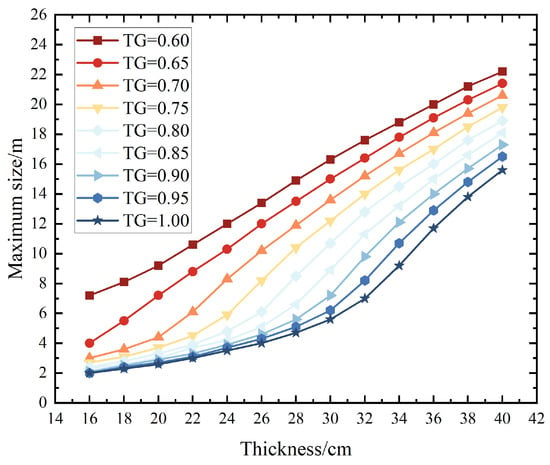
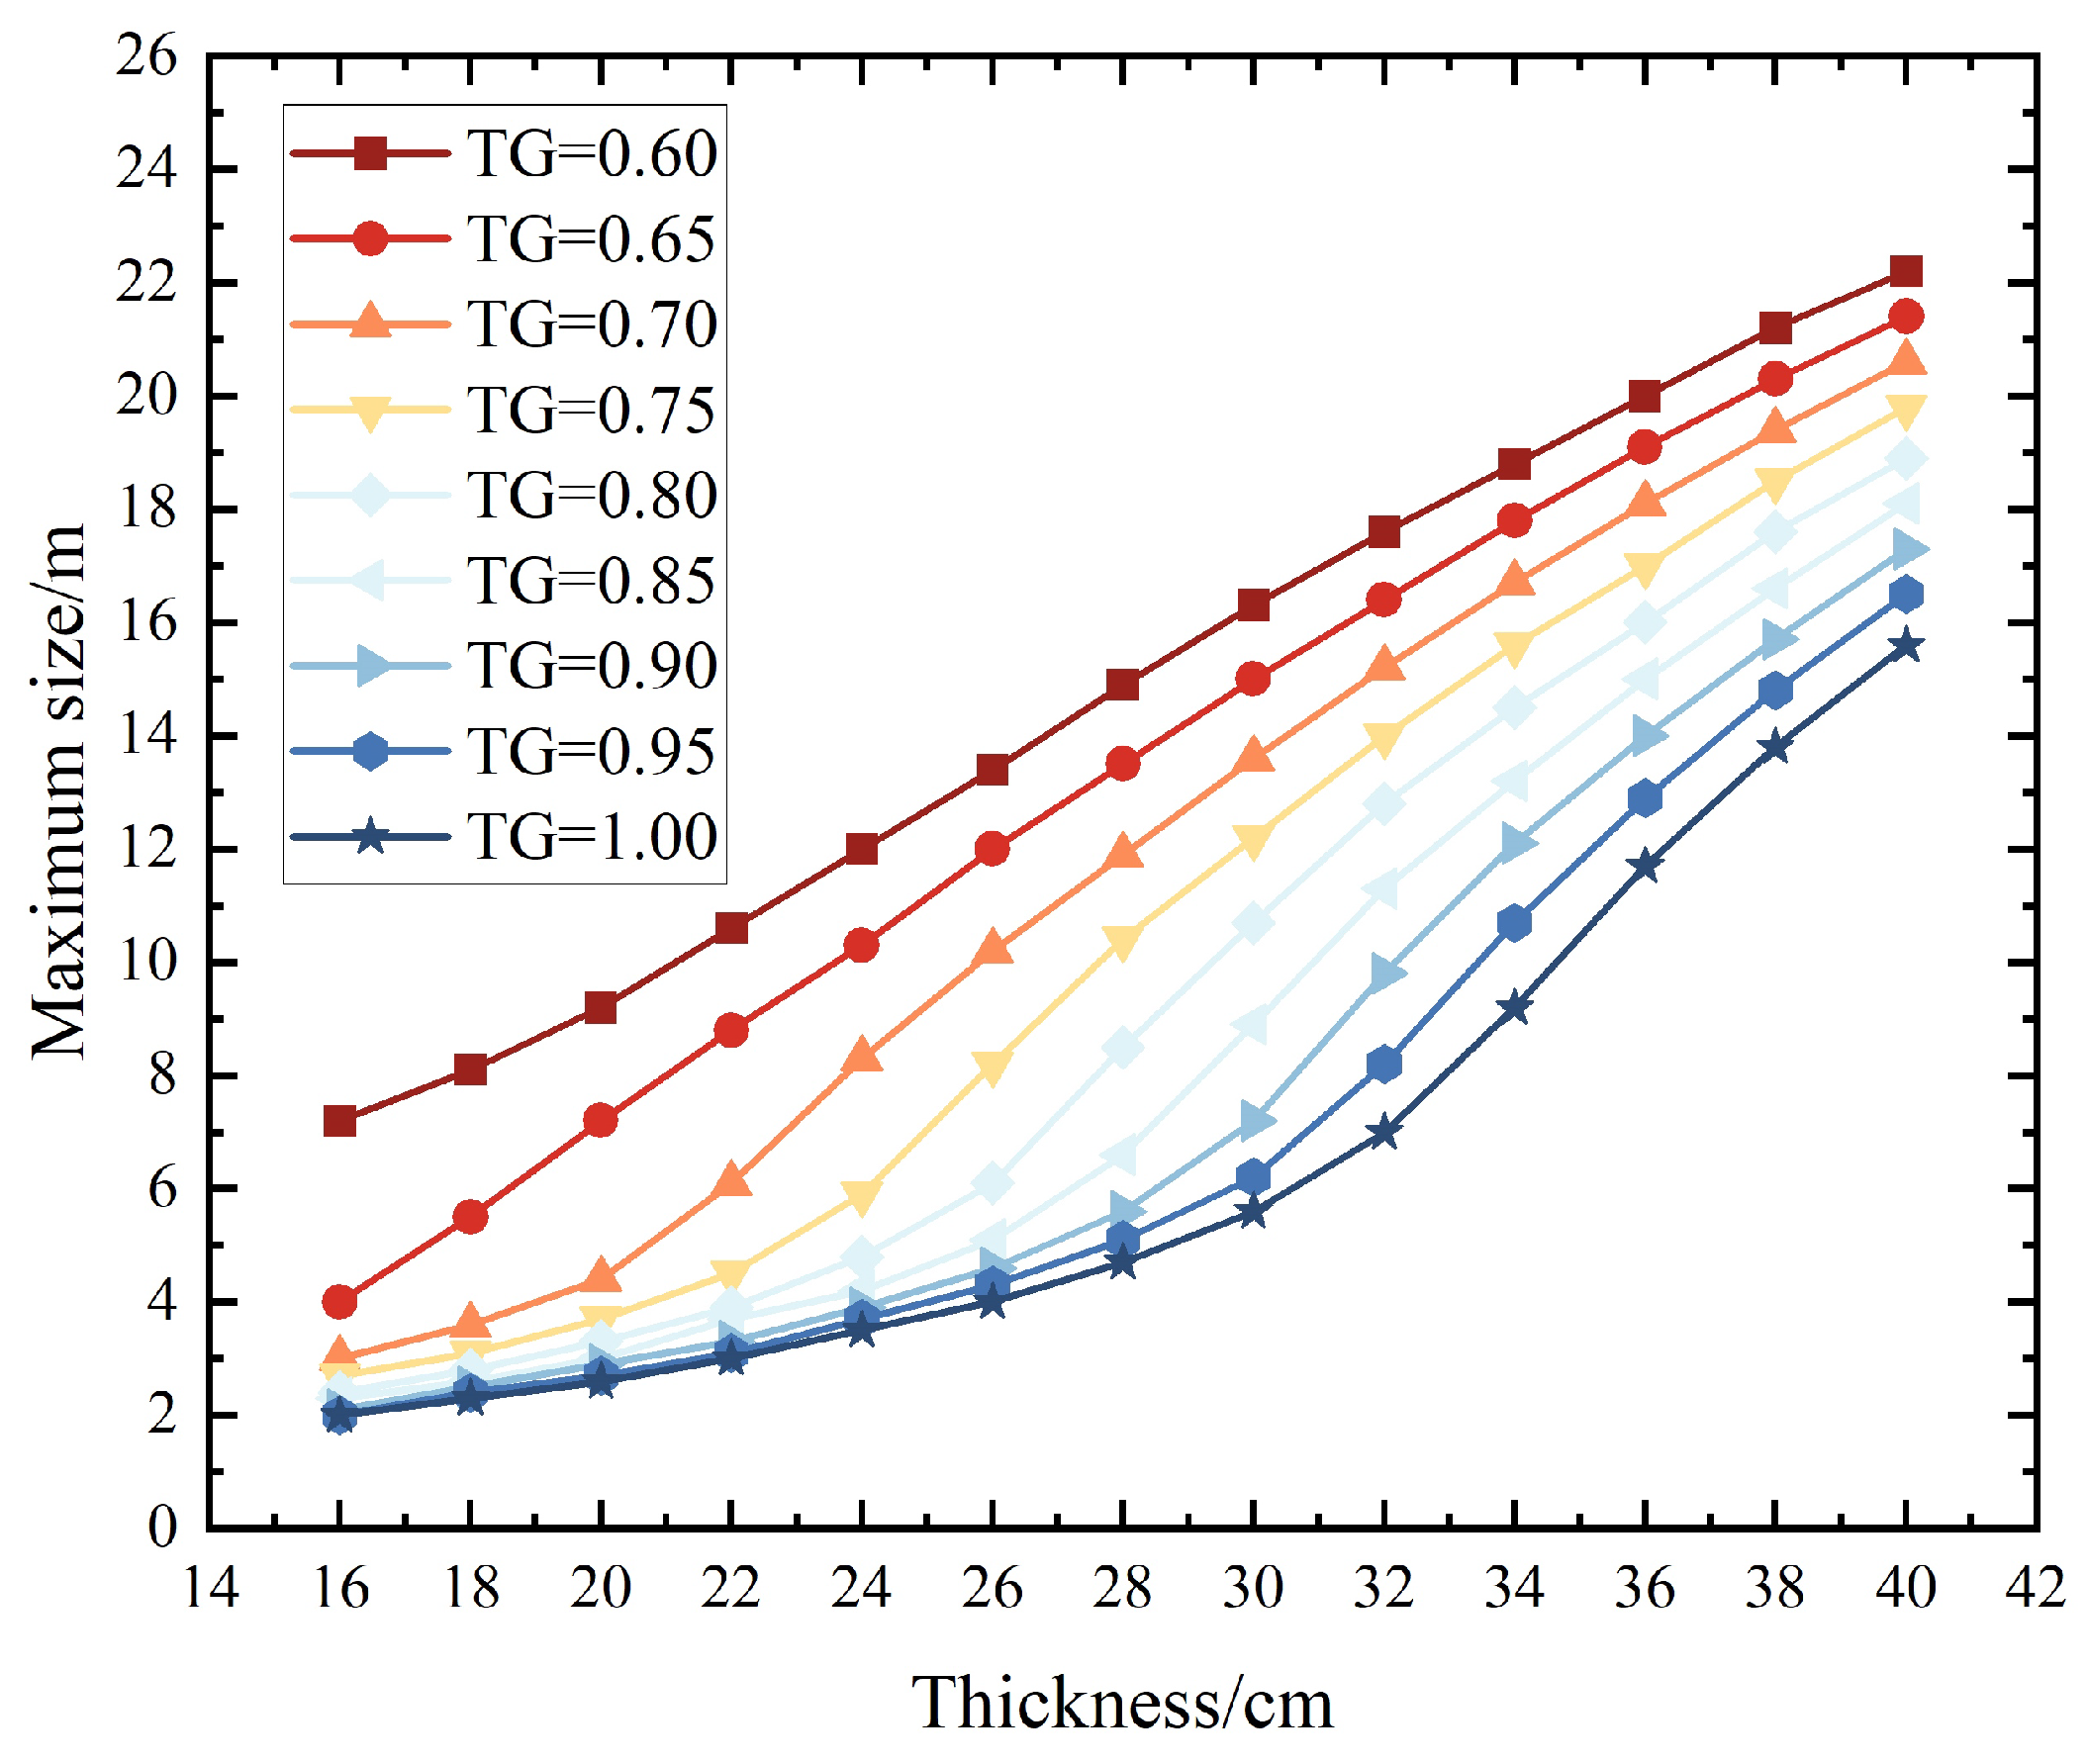
Table 15 shows the results of the achievable maximum dimensions calculated using the method studied in this paper under different temperature gradients of the pavement slab. The values from Table 15 are represented graphically in Figure 15 (TG represents the temperature gradient between the top and bottom of the pavement slab). The temperature gradients in the table represent the maximum temperature gradients under the condition that the thickness of the pavement slab is 22 cm. The choice range of the maximum temperature gradients covers the pavement temperature characteristics for most regions in China. The determination of the maximum dimension for the pavement slab should be combined with the local climate to rationally determine the maximum temperature gradients for the pavement slab.
Table 15.
The maximum dimension of cement concrete slabs under different temperature gradients and thicknesses.
Figure 15.
Variations in the maximum dimensions for different slab thicknesses.
Table 15 and Figure 15 show that the effects on the slab dimension increase when the temperature gradients decrease. With the increment of the temperature gradient, the influence on the maximum dimension of the pavement slab becomes progressively smaller. In the condition that the temperature gradient reaches 0.8 or more, the maximum dimensions almost remain consistent. A relatively large change range for the maximum slab dimensions exists at a specific thickness range of the pavement slab. This thickness range is mainly relative to the maximum temperature gradients. The greater the maximum temperature gradient, the higher the initial thickness of this range. For example, with a temperature gradient of 0.8, the slab’s maximum dimensions increase sharply at a thickness of 0.26 m, and the rate of increase only begins to decelerate upon reaching a thickness of 0.38 m. At a slab thickness of 0.40 m, a linear relationship emerges between the maximum dimensions of the pavement slab and the maximum temperature gradient, signifying that the variation in the maximum dimensions with thickness is unaffected by the temperature gradient. Table 15 shows the maximum dimensions of the pavement slab for different temperature gradients (reflecting different regions). These dimensions can be referred to while designing the airport pavement structures. The pavement dimensions should be determined comprehensively considering the structures, working conditions, and load transfer efficiencies.
5. Discussions
In current design specifications for cement concrete pavements of civil airports, there is no dedicated section for calculating the planned dimensions of pavement slabs. Civil airports generally select pavement slabs with dimensions of 4.5 m × 5 m or 5 m × 5 m based on engineering experience. The existing specifications stipulate that slab division must ensure the main landing gear of key aircraft passes through the center of the pavement slabs. The main landing gear spacing of common civil airliners ranges from 5 to 10 m, and lateral deviation occurs during aircraft taxiing. Adopting pavement slabs with a width of 4.5 m or 5 m thus results in more aircraft wheel loads acting on slab joints. For common cement concrete runways with widths of 45 m and 60 m, at least ten pavement slabs are typically arranged transversely, leading to a large number of slab joints and an increased risk of faulting. Consequently, the edges and corners of slabs are also the positions most vulnerable to damage in cement concrete pavements [29].
The most direct method to reduce the number of joints is to increase the slab dimensions. Figure 15 illustrates the maximum allowable dimensions for different slab thicknesses. Large cement concrete slabs generally adopt dimensions of 5 m × 10 m and 5 m × 15 m. Their transverse length remains consistent with the 5 m specified in current specifications, while their width is 2 to 3 times the longitudinal length of existing pavement slabs.
The dimensions of large slabs are constrained by curling stress and expansion stress. When the longitudinal length exceeds 10 m, expansion stress becomes non-negligible, as it reaches approximately half the magnitude of curling stress. Transverse joints of large slabs are mainly dummy joints. Saw cutting of cement concrete slabs performed in the early stage of concrete setting allows the joint width to expand with the subsequent setting and hardening of concrete, resulting in a narrower joint width compared to the secondary saw cutting method. Meanwhile, saw cutting during the early setting and hardening stage is more operable than that conducted after concrete has fully set and hardened, thereby reducing project costs. Therefore, the saw cut width of cement concrete pavement slabs should be achieved in a single cutting operation. This approach not only lowers costs but also does not compromise the effect of joint width on joint sealants. For this reason, a 4 mm saw cut is adopted for the dummy joints of large slabs, and joint sealants are poured under relatively low ambient temperatures.
Concrete shrinkage phenomena, including drying shrinkage, autogenous shrinkage, and plastic shrinkage, predominantly occur at the early age of concrete and exert a pronounced effect on its dimensional stability. The magnitude of shrinkage deformation varies with mix design parameters such as cement content, aggregate volume fraction, coarse-to-fine aggregate volume ratio, and water-reducing admixture dosage, with typical values ranging from 0 to m [30]. Notably, the shrinkage deformation is in the same order of magnitude ( m) as temperature-induced deformation [31]. However the effects of shrinkage are primarily confined to the early-age stage of concrete and can be mitigated by implementing timely curing measures immediately after pavement construction, such as sprinkling water and cleaning the surface to maintain a moist and clean condition of the concrete. In contrast, the temperature exerts a persistent influence throughout the entire service life of pavement slabs. This is the reason why the design methodology prioritizes temperature and aircraft loads.
This study is based on meteorological data collection and lacks an analysis of extreme weather conditions. The dimensions of large slabs vary with the climatic conditions of different regions, and a universal dimension standard for large slabs has not yet been established. The research results are intended solely as a reference for the design of large cement concrete slab dimensions.
6. Conclusions
The determination of the pavement slab dimension depends on aircraft loads and climate conditions. Under the design aircraft load, load stress remains consistent in slabs of different thicknesses. However, heavier load stress requires thicker pavement slabs. Increasing slab thickness with unchanged dimensions reduces temperature stress. Therefore, it is feasible to expand the slab dimension while maintaining temperature stress within acceptable limits.
Based on the annual and diurnal distribution of the curling stress and thermal expansion stress, as well as the fatigue characteristics of pavement slabs, a design method for slab dimensions was established using the principle of fatigue equivalence. This method was adopted for slab dimension design at a specific airport. The test section has been in service for 3 years, and the pavement structure remains intact, verifying the rationality and correctness of the proposed design method.
Load bearing capacity, roughness, and transverse joint load transfer efficiency were measured for the large slabs in the test section. The first two indexes showed no decrease with expanded slab dimensions, while transverse joint load transfer efficiency decreased as slab length increased. Using the average of the measured values to represent joint load transfer efficiency, the coefficients for different slab lengths are obtained as follows: 0.63 for 10 m, 0.60 for 12 m, and 0.52 for 15 m.
The maximum dimensions under different temperature gradients in Table 11 serve as references for pavement structure design. The final slab dimensions should be determined by comprehensively considering the pavement structure, construction conditions, and joint load transfer capacity.
For future work, continuous monitoring of the internal slab temperature, joint movement, and service performance of cement concrete pavement slabs is required.
Author Contributions
Conceptualization, L.S.; validation, J.Z.; formal analysis, Z.Z.; investigation, W.X.; resources, W.X. and J.Z.; data curation, Z.Z. and J.L.; writing—original draft preparation, Z.Z.; writing—review and editing, Z.Z. and J.S.; supervision, L.S.; funding acquisition, W.X. and J.Z. All authors have read and agreed to the published version of the manuscript.
Funding
This research was funded by the National Natural Science Foundation of China (Grant No. 52308470).
Institutional Review Board Statement
Not applicable.
Informed Consent Statement
Not applicable.
Data Availability Statement
The original contributions presented in the study are included in the article, further inquiries can be directed to the corresponding author.
Acknowledgments
During the preparation of this manuscript, the author used Doubao AI for the purposes of text translation. The authors have reviewed and edited the output and take full responsibility for the content of this publication.
Conflicts of Interest
The authors declare no conflicts of interest.
Nomenclatures
The following abbreviations are used in this manuscript:
| Symbol | Definition | Unit |
| x | Longitudinal direction | — |
| y | Transverse direction | — |
| Curling stress | MPa | |
| Curling stress in the x-axis | MPa | |
| Curling stress in the y-axis | MPa | |
| E | Elastic modulus of cement concrete | MPa |
| Coefficient of linear thermal expansion for cement concrete, generally taking 0.00001/°C | — | |
| Thermal gradient across the slab, calculated by multiplying the temperature gradient by the slab thickness | — | |
| Poisson’s ratio of cement concrete | — | |
| () | Curling stress coefficient | — |
| L | Slab length | m |
| B | Slab width | m |
| l | The relative stiffness radius of the slab | m |
| The comprehensive calculated rebound modulus of the top surface of the foundation | MPa | |
| The Poisson’s ratio of the soil base | — | |
| — | ||
| — | ||
| The temperature stress coefficient | — | |
| h | Slab thickness | m |
| The temperature at depth z from the pavement surface at time t | — | |
| k | Thermal conductivity of pavement materials | W/(m·°C) |
| Density of surface layer materials | kg/m3 | |
| s | Specific heat capacity of surface layer materials | J/(kg·°C) |
| Average daily air temperature | — | |
| R | The average increment by which daily radiant heat increases the average air temperature to the mean temperature | °C |
| b | Capacity of the pavement to absorb radiant heat | % |
| Q | Daily solar radiant heat | — |
| Surface coefficient (convection coefficient) considering convection and re-radiation | W/(m2·°C) | |
| v | Average wind speed | km/h |
| Maximum deviation from the average effective temperature | °C | |
| Daily variation range of air temperature | °C | |
| H | The ratio of the convection coefficient to the thermal conductivity of the surface layer material | — |
| C | Comprehensive parameter of pavement material characteristics | — |
| Curling stress at a specific moment during a day | MPa | |
| Curling stress generated by daily maximum temperature gradient | MPa | |
| t | Time | — |
| The moment when the pavement temperature gradient is 0 | — | |
| Daily maximum temperature gradient in a specific month within a year | °C | |
| Average daily maximum temperature gradients of January and December | °C | |
| Difference between the daily maximum temperature gradient in a year and | °C | |
| Time | month | |
| Daily maximum temperature curling stress in a specific month within a year | MPa | |
| Average daily maximum temperature curling stress of January and December | MPa | |
| Difference between the daily maximum temperature curling stress within a year and | MPa | |
| Time | month | |
| The maximum pavement thermal expansion stress | MPa | |
| r | Density of the cement concrete | MN/m3 |
| The maximum frictional coefficient | — | |
| Displacement of the maximum friction | m | |
| Linear expansion coefficient | — | |
| Pavement temperature reduction | °C | |
| Maximum difference between average pavement temperature at a specific moment and the average pavement temperature | °C | |
| Moment of the average pavement temperature to the daily average air temperature | h | |
| Average value of daily maximum pavement temperature variations in January and December | °C | |
| Difference between annual maximum pavement temperature variation and | °C | |
| The moment that the curling stress of the pavement slab turns from negative to positive | h | |
| The moment that the thermal expansion stress of the pavement slab turns from negative to positive | h | |
| The moment that the curling stress of the pavement slab turns from positive to negative | h | |
| N | The fatigue amount of the pavement slab | — |
| R | The ratio of minimum stress to maximum stress | — |
| The load transfer coefficient | — | |
| The modulus of subgrade reaction | — | |
| n | The ratio of maximum stress to the concrete flexural strength | — |
| The cumulative number of repetitive applications of the design aircraft load over the design lifespan | — | |
| The design lifespan | year | |
| q | The ratio of the number of design aircraft load applications under positive temperature gradients to the daily number of design aircraft load applications | — |
| The number of repeated aircraft load applications during the time period from to | — | |
| The number of repeated aircraft load applications during the time period from to | — | |
| The design aircraft load | MPa | |
| The equivalent temperature fatigue stress | MPa | |
| The joint load transfer coefficient | — | |
| Deflection of the unloaded slab | — | |
| Deflection of the loaded slab | — |
References
- Al-Qadi, I.L.; Elseifi, M.; Carpenter, S.H. Reclaimed Asphalt Pavement—A Literature Review; FHWA-ICT-07-001; Illinois Center for Transportation: Rantoul, IL, USA, 2007. [Google Scholar]
- Delatte, N. Concrete Pavement Design, Construction, and Performance; CRC Press: Boca Raton, FL, USA, 2018. [Google Scholar]
- Kalantar, Z.N.; Karim, M.R.; Mahrez, A. A review of using waste and virgin polymer in pavement. Constr. Build. Mater. 2012, 33, 55–62. [Google Scholar] [CrossRef] [Scilit]
- Maharaj, R.; Maharaj, C.; Hosein, A. Performance of waste polymer modified road paving materials. Prog. Rubber Plast. Recycl. Technol. 2018, 34, 19–33. [Google Scholar] [CrossRef] [Scilit]
- Georgees, R.N.; Hassan, R.A.; Evans, R.P. A potential use of a hydrophilic polymeric material to enhance durability properties of pavement materials. Constr. Build. Mater. 2017, 148, 686–695. [Google Scholar] [CrossRef] [Scilit]
- Yang, J.M.; Shin, H.O.; Yoo, D.Y. Benefits of using amorphous metallic fibers in concrete pavement for long-term performance. Arch. Civ. Mech. Eng. 2017, 17, 750–760. [Google Scholar] [CrossRef] [Scilit]
- Zaltuom, A.M. A review study of the effect of air voids on asphalt pavement life. In Proceedings of the First Conference for Engineering Sciences and Technology, Garaboulli, Libya, 25–27 September 2018; Volume 2, pp. 618–625. [Google Scholar]
- Kopp, T.; Kurtis, K.E.; Grubert, E. Life-Cycle Analysis of Proposed Performance-Based Specifications for Structural Concrete and Portland Cement Concrete Pavement in Georgia. J. Transp. Eng. Part B Pavements 2026, 152, 05025004. [Google Scholar] [CrossRef] [Scilit]
- Long, X.; Cai, L.; Shen, Y.; Shao, B.; Zhang, L.; Zi, J. Research on Comprehensive Disease Relation of Cement Concrete Pavement Based on Association Rule Mining. J. Xihua Univ. (Nat. Sci. Ed.) 2019, 38, 1–11. [Google Scholar]
- Westergaard, H. Theory of concrete pavement design. In Proceedings of the 7th Annual Meeting, Highway Research Board, Part I; National Academy of Sciences: Washington, DC, USA, 1927; pp. 175–181. [Google Scholar]
- Westergaard, H.M. Stresses in concrete pavements computed by theoretical analysis. Public Roads 1926, 7, 25–35. [Google Scholar]
- Westergaard, H.M. Analysis of stresses in concrete pavements due to variations of temperature. In Proceedings of the Highway Research Board Proceedings; Highway Research Board: Washington, DC, USA, 1927; Volume 6, pp. 201–215. [Google Scholar]
- Cervantes, V.; Roesler, J. Performance of Concrete Pavements with Optimized Slab Geometry; Report ICT-09-053; Illinois Center for Transportation Research: Rantoul, IL, USA, 2009. [Google Scholar]
- Novák, J.; Šrámek, M.; Kohoutková, A.; Vodička, J.; Křístek, V. Stress analysis of hexagonal element for precast concrete pavements. Int. Sch. Sci. Res. Innov. 2019, 13, 353–358. [Google Scholar]
- Perry, L.A. The Hexagonal Slab Design of Concrete Pavement. Trans. Am. Soc. Civ. Eng. 1926, 89, 1296–1311. [Google Scholar] [CrossRef] [Scilit]
- Zhao, H.; Ling, J.; Zhou, Z. Comparative Analysis of Airport Pavement Design Procedures Between CAAC and FAA. J. Tongji Univ. Sci. 2006, 34, 1196–1200. [Google Scholar]
- Bradbury, R.D. Reinforced Concrete Pavements; Transportation Research Board: Washington, DC, USA, 1938. [Google Scholar]
- Jia, W. Cement Concrete Pavement Dynamic Loads and Thermal Stress Analysis. Ph.D. Thesis, Chang’an University, Xi’an, China, 2013. [Google Scholar]
- Shi, X.; Fwa, T.; Tan, S. Warping stresses in concrete pavements on Pasternak foundation. J. Transp. Eng. 1993, 119, 905–913. [Google Scholar] [CrossRef] [Scilit]
- Sun, J.; Oh, E.; Chai, G.; Ma, Z.; Ong, D.E.; Bell, P. A systematic review of structural design methods and nondestructive tests for airport pavements. Constr. Build. Mater. 2024, 411, 134543. [Google Scholar] [CrossRef] [Scilit]
- Tan, Z.; Zhou, Y.; Liu, B. Calculation of Thermal Warping Stressesin Cement Concrete Pavement Slabs. Highway 2004, 63–67. [Google Scholar] [CrossRef]
- Thomlinson, J. Temperature Variations and Consequent Product by Daily and Seasonal Temperature Cycles in Concrete Slabs, Concrete Constr. 1940. Available online: https://www.scribd.com/document/400895616/thomlinson-1940-Temperature-variations-and-consequent-stress-in-concrete-slabs-pdf (accessed on 4 February 2026).
- Barber, E.S. Calculation of Maximum Pavement Temperatures from Weather Reports. Highw. Res. Board Bull. 1957. Available online: http://onlinepubs.trb.org/Onlinepubs/hrbbulletin/168/168-001.pdf (accessed on 4 February 2026).
- Qin, Y.; Zhang, X.; Tan, K.; Wang, J. A review on the influencing factors of pavement surface temperature. Environ. Sci. Pollut. Res. 2022, 29, 67659–67674. [Google Scholar] [CrossRef] [Scilit] [PubMed]
- Chang, W.G.; Lu, C.Q.; Weng, X.Z. Day and Year Distribution of Shrinkage and Tension Stresson Large Size Cement Concrete Slab. J. Air Force Eng. Univ. 2007, 13. Available online: http://kjgcdx.cnjournals.com/kjgcdxxb/article/abstract/20070504 (accessed on 4 February 2026).
- Weng, X. A Calculating Method of Size of Large Cement Concrete Slab. J. Air Force Eng. Univ. 2003. Available online: http://kjgcdx.ijournal.cn/kjgcdxxb/article/abstract/20030603 (accessed on 4 February 2026).
- Mohamed, A.R.; Hansen, W. Effect of nonlinear temperature gradient on curling stress in concrete pavements. Transp. Res. Rec. 1997, 1568, 65–71. [Google Scholar] [CrossRef] [Scilit]
- Weng, X. Joint Design of Cement Concrete Large Slab. J. Air Force Eng. Univ. 2002. Available online: https://kns.cnki.net/kcms2/article/abstract?v=nRANE_nPmUpxbqlQOnvgaFfPHeoJRDTzbhBgV4b23gPqzHbuW1XGyHTzRyngGTJAU0C_il3HTJGS9djEb2fMVNLm9jkSiCrObkO-LZPSgqxyHPJnxZXlv63psiSZ-QRppiAWylF45zO_I9YmUlelQ0R2hzh0tXNqqOQb6NnR6UfPQ8POg5k1_A==&uniplatform=NZKPT&language=CHS (accessed on 4 February 2026).
- Zhang, X.M.; Li, M.X.; Chen, Y.; Li, C.H.; Xu, B.Q. Size of cement concrete pavement slab of airport runway. J. Beijing Univ. Aeronaut. Astronaut. 2022, 48, 551–559. [Google Scholar] [CrossRef]
- Zhang, Z. Study on Early-age Shrinkage and Cracking of Pavemen Concrete. Master’s Thesis, Chang’an University, Xi’an, China, 2008. [Google Scholar]
- Li, X. Research on the Early Crack of Concrete Road Pavement During the Construction Stage. Master’s Thesis, Chang’an University, Xi’an, China, 2014. [Google Scholar]

Disclaimer/Publisher’s Note: The statements, opinions and data contained in all publications are solely those of the individual author(s) and contributor(s) and not of MDPI and/or the editor(s). MDPI and/or the editor(s) disclaim responsibility for any injury to people or property resulting from any ideas, methods, instructions or products referred to in the content. |
© 2026 by the authors. Licensee MDPI, Basel, Switzerland. This article is an open access article distributed under the terms and conditions of the Creative Commons Attribution (CC BY) license.