


Abstract
Conventional Security Operations Center (SOC) solutions struggle to process representative operational alert streams efficiently and adapt to evolving cyber threats, highlighting the need for automated, intelligent threat detection and prioritization. This study presents a custom AI-driven framework that leverages unsupervised learning techniques to support SOC analysts in cyber threat detection, anomaly identification, and alert prioritization. The framework applies several clustering methods: HDBSCAN, DBSCAN, KMeans, and Gaussian Mixture Models for alert segmentation, and integrates anomaly detection using LOF and Isolation Forest, complemented by semi-supervised detection via One-Class SVM. Using textual, categorical, and numerical features from Wazuh alerts across three datasets, the system performs clustering and anomaly detection in the original high-dimensional feature space, with UMAP applied solely for two-dimensional visualization. HDBSCAN consistently produced well-separated clusters with effective noise detection, while, Isolation Forest evaluated via 10-fold cross-validation exhibited stable anomaly flagging and clear score separation across both cyber alert event data and synthetic threat injection experiments. Furthermore, the framework formulates a composite priority ranking that integrates anomaly severity, cluster rarity, and SOC contextual weighting, yielding actionable alert rankings. An interactive, analyst-centric dashboard enables SOC teams to explore top alerts, clusters, associated MITRE techniques, priority rankings, and geolocation data, providing insights while preserving human oversight. Overall, the proposed system transforms complex alert streams into structured insights, enhancing SOC situational awareness, decision support, and operational efficiency.
1. Introduction
Contemporary SOCs serve as the primary defense against increasingly sophisticated digital threats, yet they are currently overwhelmed by the staggering volume of security telemetry produced by a wide array of systems and applications. Historically, the isolation of logs on disparate hosts impeded comprehensive monitoring, a hurdle that organizations sought to clear by implementing Security Information and Event Management (SIEM) systems to aggregate and correlate data centrally. Nevertheless, the analytical power of SIEMs has inadvertently triggered a new crisis: an unmanageable surge in alert frequency. Current academic findings highlight that this surge frequently causes “alert fatigue,” resulting in professional burnout and a dangerous decline in operational performance [1,2]. Industry data further illustrates this crisis, noting that SOCs are inundated with nearly 4484 warnings every day, with a staggering 67% remaining unaddressed due to the sheer lack of analyst bandwidth [3]. Recent systematic reviews further categorize these challenges into technical latency and the lack of standardized prioritization criteria, highlighting that effective triage requires a multi-faceted evaluation of threat severity and business impact [4].
To mitigate these pressures, the development of automated triage protocols has become essential for lightening the cognitive load on analysts and accelerating defensive responses. Emerging research suggests that evaluating anomalies based on their situational risk or severity can significantly refine how organizations respond to incidents [5]. However, the fundamental operational challenge remains deciding “which threat requires immediate action” among thousands of simultaneous alerts. Regrettably, the default severity rankings provided by most SIEM platforms are frequently too broad or inaccurate to be useful, leading to a surplus of “critical” alerts that are impossible to triage manually. This environment necessitates the creation of more intelligent and context-aware prioritization models, specifically those utilizing unsupervised learning to uncover hidden patterns and rank threats without the need for pre-labeled training data [6].
Building upon these requirements, earlier progress in the field of AI-based log interpretation has established a vital baseline. Notable early models, such as DeepLog, utilized LSTM networks to treat logs as behavioral sequences, identifying deviations from established normal patterns [7]. While innovative, DeepLog’s reliance on fixed log templates often resulted in the loss of critical semantic nuances. The research work by [8] addressed this limitation through LogAnomaly, incorporating template vectorization to jointly capture sequential and quantitative anomalies, thereby enhancing anomaly detection in unstructured logs. More recently, Transformer-based architectures have been adopted, with LogBERT exploiting bidirectional attention to capture contextual dependencies within log sequences, achieving higher detection robustness in complex environments [9]. The surveys of [6,10] confirm these performance gains, while noting persistent challenges regarding their interpretability and practical utility within a live SOC environment. Furthermore, recent approaches have introduced `learning to defer’ mechanisms, where AI models synergize with human expertise to refine prioritization decisions in high-uncertainty scenarios [11].
Complementing these detection efforts, newer research has shifted focus towards prioritizing the resulting alerts. The research article by [12] introduced HOLMES, which constructs high-level scenario graphs to map alerts to cyber kill-chain phases, thus reducing noise and enhancing analyst focus. Similarly, ref. [13] proposed automated triage mechanisms to classify alerts based on estimated relevance, while ref. [5] demonstrated real-time prioritization in industrial environments through anomaly-driven ranking. However, a significant limitation remains: many of these studies utilize synthetic or narrow datasets that do not reflect the diverse and complex nature of actual SIEM logs. Previous research efforts by [14,15] underscored that the use of these datasets (NSL-KDD or CIC-IDS) is primarily network-centric and lacks the rich contextual metadata found in SIEM alerts. To address this gap, recent research increasingly advocates for datasets derived from real SIEM infrastructures, such as logs produced from operational honeypot environments [16].
Despite these developments, a notable disconnect persists between theoretical innovation and the daily reality of SOC operations. A majority of current solutions continue to treat threat detection as a simple binary problem (“normal vs. abnormal”), often ignoring the critical need for dynamic prioritization under severe resource constraints [1,7,8]. Furthermore, the “black box” nature of many deep learning architectures continues to hinder their adoption by analysts who require transparency. The research article by [10] emphasized that explainability is paramount in high-stakes security missions, as analysts must trust the reasoning behind a model’s output, while [17] demonstrates the importance of interpretable decision reasoning in security domains. In light of this, the present study introduces an AI-based prioritization framework that intelligently ranks alerts while providing explainable insights. Utilizing data from a real-world, honeypot-enhanced SIEM environment [16], this framework employs clustering, anomaly isolation, and prioritization techniques to produce an actionable, prioritized queue that optimizes SOC decision-making.
While recent academic work has introduced advanced concepts like graph neural networks, reinforcement learning for attack simulation, and federated intelligence sharing [18,19], CTI-driven risk frameworks [20], hybrid SIEM enhancements [21], and trust-aware federated intelligence sharing [22], a persistent gap remains between these innovations and the operational realities of modern SOCs. Much of the current body of work is limited by its focus on binary classification, static severity scoring, or controlled datasets, offering limited support for dynamic alert prioritization, analyst interpretability, and scalability under real-world alert volumes. Addressing this gap, this work contributes an integrated and deployment-oriented SOC framework that leverages unsupervised learning on heterogeneous SIEM data to cluster alerts, identify anomalous behavior, and dynamically prioritize security-relevant events.
Contribution: The principal contributions of this study are outlined below:
- 1.
- Propose a comprehensive AI-based SOC framework that integrates unsupervised learning techniques to support cyber threat detection, anomaly identification, and intelligent alert prioritization using heterogeneous SIEM alert data.
- 2.
- Conduct a comparative evaluation of unsupervised clustering techniques—HDBSCAN, DBSCAN, KMeans, and Gaussian Mixture Models for alert segmentation; demonstrating that HDBSCAN provides superior cluster separation and noise detection for distinguishing rare or anomalous alerts from routine events.
- 3.
- Design and evaluate an anomaly detection and prioritization layer using unsupervised learning(Isolation Forest, Local Outlier Factor) and semi-supervised learning (One-Class SVM), identifying Isolation Forest as the most stable and reliable method for operational SOC alert prioritization.
- 4.
- Formulate an alert priority ranking scheme that combines anomaly severity, cluster rarity, and SOC contextual weighting to dynamically elevate security-relevant alerts while suppressing repetitive or low-impact noise.
- 5.
- Develop an interactive, analyst-centric SOC dashboard that enables dynamic exploration of prioritized alerts, clusters, MITRE ATT&CK techniques, mean priority rankings, and geolocation data, providing actionable intelligence while preserving human oversight.
2. Data Description
2.1. Data Collection Environment and Infrastructure Reuse
To capture and analyze real-world cyber threats, we utilized a distributed testbed environment that was originally established and validated in our prior work [16]. While the initial deployment focused on the extraction of Indicators of Compromise (IoC) and threat intelligence integration, the current study repurposes this robust infrastructure to evaluate our proposed unsupervised alert prioritization engine. The monitoring system consists of four distinct agents deployed across two geographically separated regions to collect diverse threat intelligence, following a cloud-based honeypot architecture similar to the approaches discussed in [23].
The architecture of our data acquisition and processing pipeline is illustrated in Figure 1. To capture a geographically diverse range of threat signals, our sensors were strategically distributed between the United States and Saudi Arabia. Each node hosts a deceptive web service designed to mimic vulnerable entry points, thereby attracting unsolicited traffic from global threat actors. The resulting dataset reflects multi-regional attack patterns, with significant activity spikes directed at these specific hosting zones. Given that cyber-adversaries often launch coordinated campaigns across international network boundaries, these captured signals are considered representative of broader global threat trends. To further enhance the diversity of our telemetry and reduce regional bias, future iterations of this testbed will include additional geographically dispersed deployment sites [16].
Figure 1.
Overview of real-time malicious activity captured by the honeypot and visualized through the Wazuh SIEM, forming the basis of the three curated, independent datasets.
2.2. Data Collection Environment
To facilitate the capture of authentic cyber threats, we established a distributed monitoring testbed utilizing the Wazuh SIEM ecosystem. The infrastructure consists of four specialized agents deployed across two distinct geographical zones to gather a wide spectrum of threat intelligence, following a cloud-honeypot methodology similar to the one proposed by [23].
- United States (US) Zone: This region comprises two agents, wazuhOT and deepkake_ v2_us. These nodes were assigned public-facing IP addresses (range 199.168.x.x), exposing them to the open internet and consequently attracting a high frequency of automated reconnaissance and credential-stuffing attempts.
- Saudi Arabia (Riyadh) Zone: This segment includes agents deepfake_v1 and koko. Unlike the US deployment, these nodes were situated within a private network environment (IP range 192.168.x.x) in Riyadh. Despite the presence of firewall and NAT protections, these agents recorded unique, persistent attack profiles, including targeted scanning activities from specific regional network blocks.
The resulting telemetry consists of security alerts processed by the Wazuh manager over a six-week duration, specifically from 24 May 2025, to 2 July 2025. Data was acquired in three distinct temporal bursts, with each phase capturing exactly 10,000 security events to ensure a balanced evaluation. The total dataset of 30,000 unique events is partitioned as follows: Phase 1 (24–26 May 2025) as Dataset 1; Phase 2 (1–2 June 2025) as Dataset 2; and Phase 3 (1–2 July 2025) as Dataset 3.
Each alert record is initially captured in JSON format and subsequently converted to CSV for analysis. For our unsupervised anomaly detection and ranking framework [24], we extracted critical attributes including temporal, categorical, and numerical features, as informed by existing research on multivariate log analysis [25]. Table 1 provides a summary of the feature set. Our preliminary analysis indicates that the threat landscape is primarily dominated by authentication-related adversarial activities.
Table 1.
Key features extracted for analysis.
2.3. The Operational Triage Gap and Research Motivation
Although the quantitative metrics presented in the previous section provide a macro-level view of adversarial activity, reliance on such aggregated statistics alone introduces significant friction in SOC triage operations. Frequency-centric measures, such as raw counts of cyber threat occurrences [26,27], often obscure critical behavioral nuances, limiting the ability to distinguish genuinely urgent threats from routine or low-impact activity. In practical SOC settings, the overwhelming volume of recurring, low-priority signals, exemplified by standard rule-level notifications, is a primary driver of analyst exhaustion, commonly referred to as “alert fatigue” [28]. Crucially, these static indicators do not provide a comparative measure of an event’s anomalous nature or its tactical intent, leaving incident response teams without an objective ranking mechanism for resource allocation [29]. To overcome this operational bottleneck and transform raw telemetry into high-fidelity intelligence, we must move beyond rigid and rule-based logic [30]. The following section introduces a dynamic framework based on unsupervised clustering and isolation [31]. By autonomously distinguishing unique adversarial markers from routine activity, this system establishes a data-driven foundation for alert prioritization and enhanced situational awareness.
3. Methodology
3.1. Data Preprocessing
The dataset consists of heterogeneous alert data, including text features (alert description), categorical features (alert group, MITRE tactic, and technique), and numerical features (alert severity level and frequency). Missing values are imputed, numerical features standardized, and categorical features one-hot encoded. Textual alert descriptions are embedded using a state-of-the-art transformer-based model to generate dense vector representations. We preprocessed the dataset by verifying the presence of all required textual, categorical, and numerical features. Textual alert descriptions were embedded using the all-MiniLM-L6-v2 SentenceTransformer model, producing 384-dimensional semantic representations that were subsequently standardized. Categorical variables were transformed using one-hot encoding, while numerical features were scaled. All feature types were then concatenated into a unified feature matrix. To control feature dimensionality during model deployment and to improve interpretability, non-linear dimensionality reduction was applied using either UMAP or t-SNE, depending on availability, reducing the combined feature space to two dimensions for visualization. A fixed random seed (random_state = 42) was used to enhance reproducibility; however, minor variations across runs may still occur due to the stochastic nature of these algorithms. Priority scores were computed for each sample by combining anomaly scores, cluster rarity measures, and an operational severity multiplier corresponding to the primary SOC alert categories. The resulting scores were ranked and normalized to a 0–100 scale to support effective alert prioritization.
3.2. Dimensionality Reduction
Uniform Manifold Approximation and Projection (UMAP) is applied to reduce high-dimensional features into a 2-dimensional space. This aids both visualization and clustering performance while preserving local and global data structure [32]. UMAP constructs a fuzzy graph in high-dimensional space and optimizes a low-dimensional embedding by minimizing cross-entropy between neighborhood graphs:
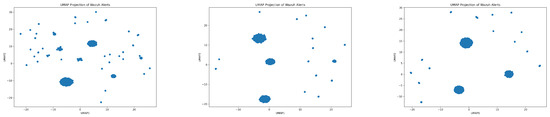
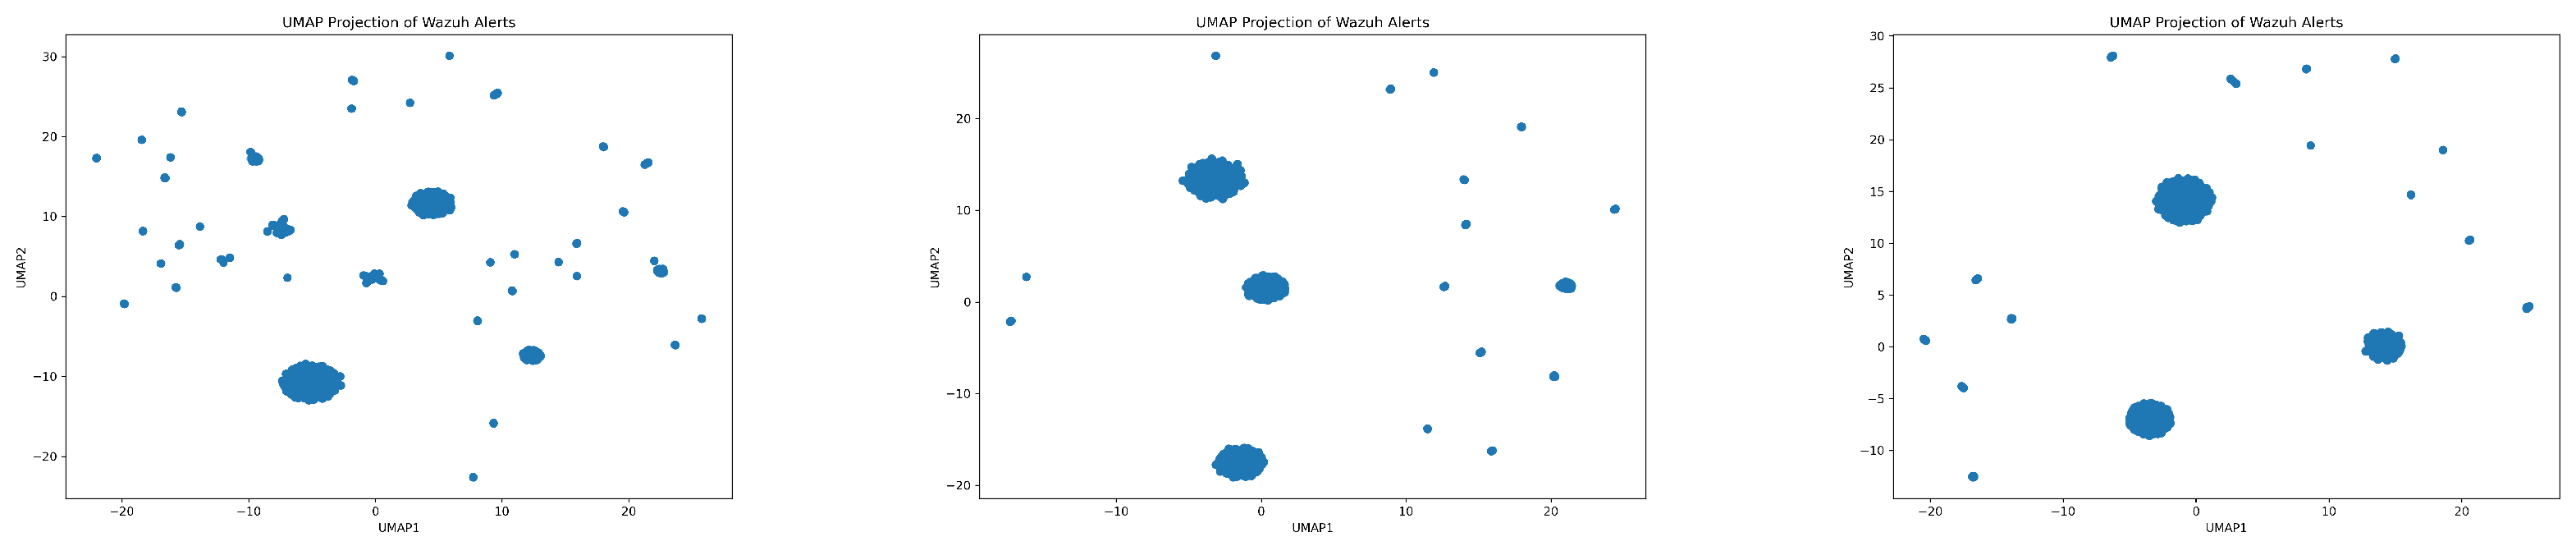
where are high-dimensional points, are low-dimensional embeddings, is distance, is local connectivity, controls local scale, and shape the embedding metric. The visualization of two-dimensional UMAP representation of the feature spaces of the examined datasets are shown in Figure 2.
Figure 2.
Two-dimensional UMAP representation of categorical, numerical, and embedded textual features across Datasets 1–3 (left → right).
3.3. Clustering
Comprehensive investigations of behavior analytics have shown that density-based methods are particularly effective at capturing the non-linear distribution of security telemetry compared to traditional centroid-based approaches [33]. The framework evaluates multiple unsupervised clustering algorithms:
3.3.1. HDBSCAN Clustering
Builds a hierarchy of density-based clusters [34,35] using core-distance and mutual-reachability distance:
where is the distance to the -th nearest neighbor. A minimum spanning tree of defines a density hierarchy; clusters are extracted as the most stable components satisfying . The HDBSCAN density-based clustering is capable of handling variable cluster sizes and noise. In this study, clustering size is set to 18.
3.3.2. DBSCAN Clustering
This technique discovers dense regions in data by labeling points as core, border, or noise [36]:
where is the -neighborhood of point .
3.3.3. KMeans Clustering
KMeans clusting partitions the dataset into K clusters [37] by minimizing the within-cluster sum of squares:
where is the centroid of cluster and clusters.
3.3.4. Gaussian Mixture Model Clustering
This method models the data as a mixture of K Gaussian distributions [38,39]:
where are the mixture weights, the means, the covariances, and components. The cluster algorithms are evaluated using the Silhouette Score and Davies-Bouldin Index, and the number of noise points is quantified. All clustering algorithms are trained and evaluated in the original high-dimensional feature space; UMAP is applied exclusively for post hoc two-dimensional visualization and does not influence clustering or comparative performance. Since the task is fully unsupervised learning, the traditional supervised train–test split was not performed. Instead, we repeated K-fold subsampling to assess the robustness and stability of discovered structures via internal validation metrics. To assess robustness, we employ repeated 10-fold evaluation with 10 independent random seeds. For each fold, clustering and anomaly detection models are trained and evaluated using internal validity metrics. Results are summarized using boxplots, reflecting stability across 100 independent runs per method.
3.4. Anomaly Detection Algorithms
3.4.1. Isolation Forest
Isolation Forest assumes anomalies are easier to isolate using random splits [40]. Samples requiring fewer splits are more anomalous.
- Path Length:
- Expected Path Length:
- Anomaly Score:where x sample, T trees, n samples, H harmonic number, Euler constant, normalization factor, anomaly score
3.4.2. Local Outlier Factor (LOF)
LOF compares local density of a point to its neighbors; significantly lower density indicates anomaly [41].
- Reachability Distance
- Local Reachability Density
- LOF Scorewhere k neighbors, neighbor set, distance, k-distance, LRD local reachability density, LOF anomaly score
3.4.3. One-Class SVM
One-Class SVM learns a boundary enclosing normal data. Values outside boundary are anomalies [42].
- Decision Function
- Weight Representation
- RBF KernelNormal if , anomalous otherwise; x data, support vectors, mapping, w weight vector, offset, multipliers, kernel width, K kernel, decision score.
3.5. Alert Prioritization
Each alert is assigned a priority score based on: anomaly score, cluster size (smaller clusters indicate rarer and potentially critical alerts), and SOC relevance weight based on alert group (e.g., Network/Service, System Integrity, Authentication Failure alerts). The combined score allows ranking alerts for SOC investigation, highlighting the most critical threats while reducing noise.
3.6. Implementation
The framework is implemented in Python 3.13.5 using libraries such as scikit-learn, hdbscan, umap, and SentenceTransformers. A web-based dashboard is integrated using Dash, enabling interactive exploration of top alerts, clusters, MITRE techniques, and global geolocation.
3.6.1. Dashboard Implementation for AI-Driven Cyber Threat Detection and Prioritization
- Data Ingestion & Preprocessing: This process involves the loading cyber event data, ensures required columns exist, converts numerical and categorical types, fills missing values, computes text embeddings using SentenceTransformer, and combines them with standardized numerical and one-hot encoded categorical features.
- Clustering & Visualization: Performs HDBSCAN clustering on the original high-dimensional features to group alerts, assigns descriptive cluster names, and applies UMAP (or t-SNE fallback) solely for 2-D visualization.
- Anomaly Detection & Priority Scoring: Uses Isolation Forest to compute anomaly scores and derives priority ranks by combining the anomaly score, inverse cluster size, and an operational severity multiplier based on dominant SOC alert categories.
- Dynamic Dashboard Layout: Built with Dash and Bootstrap (CYBORG theme). Includes UMAP scatter plot, top alert bar plot, MITRE techniques chart, GeoIP map, and dynamic cluster cards.
- Interactive Components & Callbacks: Cluster selection via scatter plot or bar plot click updates other visualizations. User inputs include top-N alerts to display and map type selection. Figures update dynamically with filtered data and highlighted clusters.
- Visualization Enhancements: Neon/dark theme applied via a custom configure plotly neon function. Cluster cards display summary metrics such as total alerts, average priority rank, top MITRE techniques, top affected countries, and top alert descriptions.
3.6.2. Resource Requirements and Experimental Setup
To assess clustering and anomaly detection stability, we used a repeated 10-fold cross-validation () strategy. Each dataset was split into 10 folds, with each fold serving once as the validation set, and the procedure repeated 10 times with different random seeds. This ensures evaluation metrics are not biased by a single partition, providing robust estimates of variability. Reported metrics, including Silhouette scores, Davies–Bouldin indices, and noise detection stability, reflect the mean and standard deviation over 100 runs. Experiments were conducted on a Lenovo Legion 9 18IAX10 laptop running Windows 11 Home (Build 26200), equipped with an Intel Core Ultra 9 275HX (24 cores/24 threads at 2.7 GHz), 64 GB RAM, and an NVIDIA GeForce RTX 5090 Laptop GPU (24 GB VRAM). The system’s UEFI BIOS with Secure Boot, hypervisor-enforced code integrity, and kernel DMA protection provides a high-performance, secure environment suitable for AI training and high-throughput data processing.
4. Results
4.1. Clustering and Noise Identification Comparison
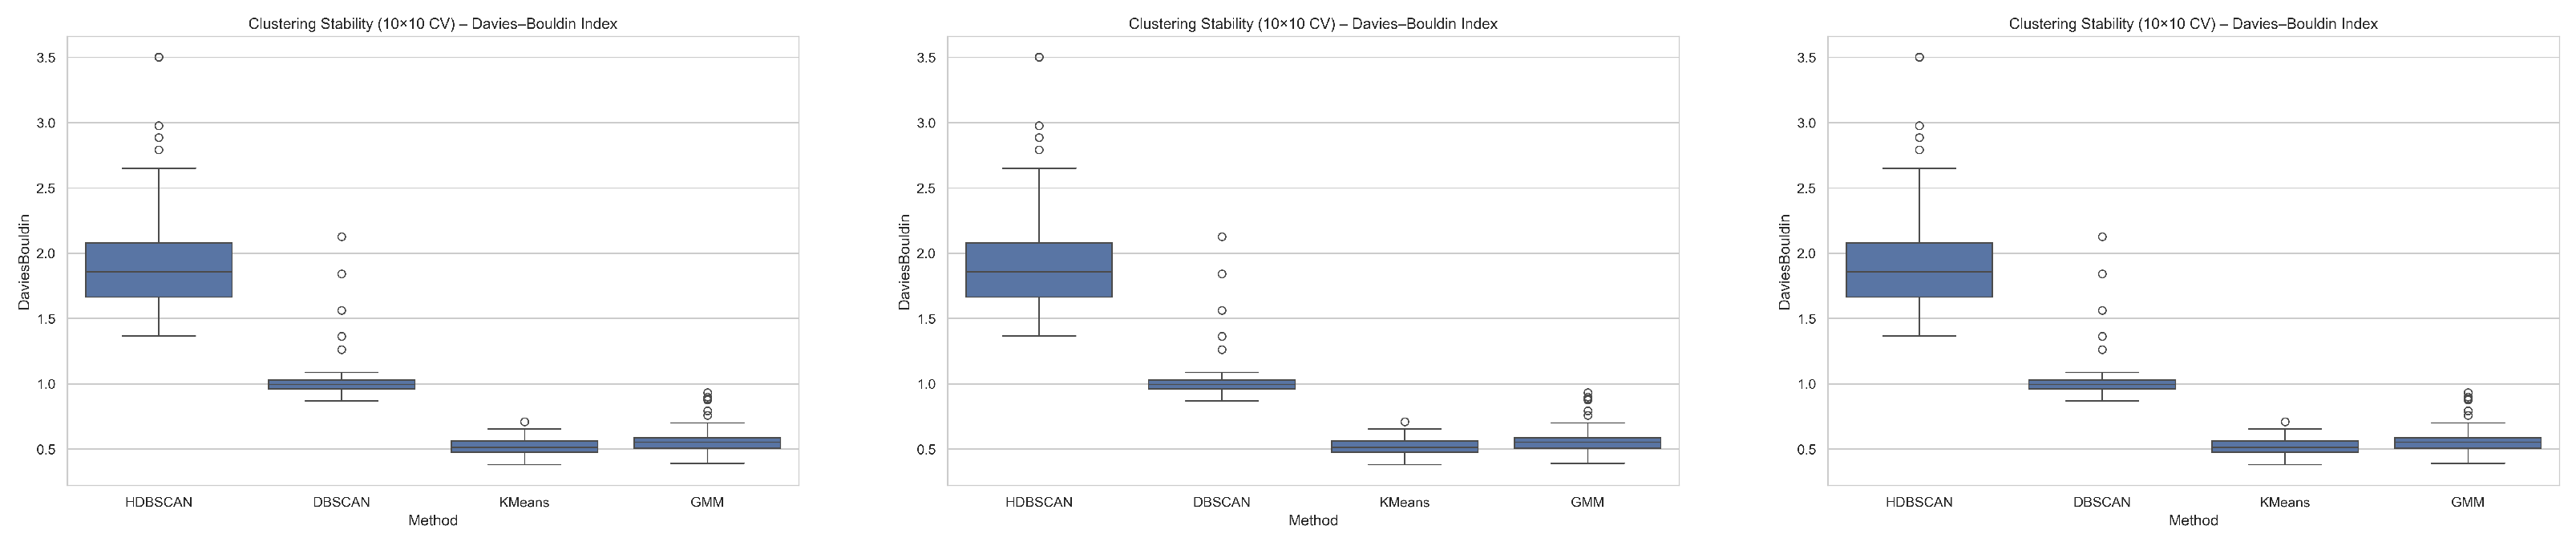
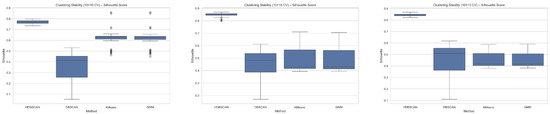
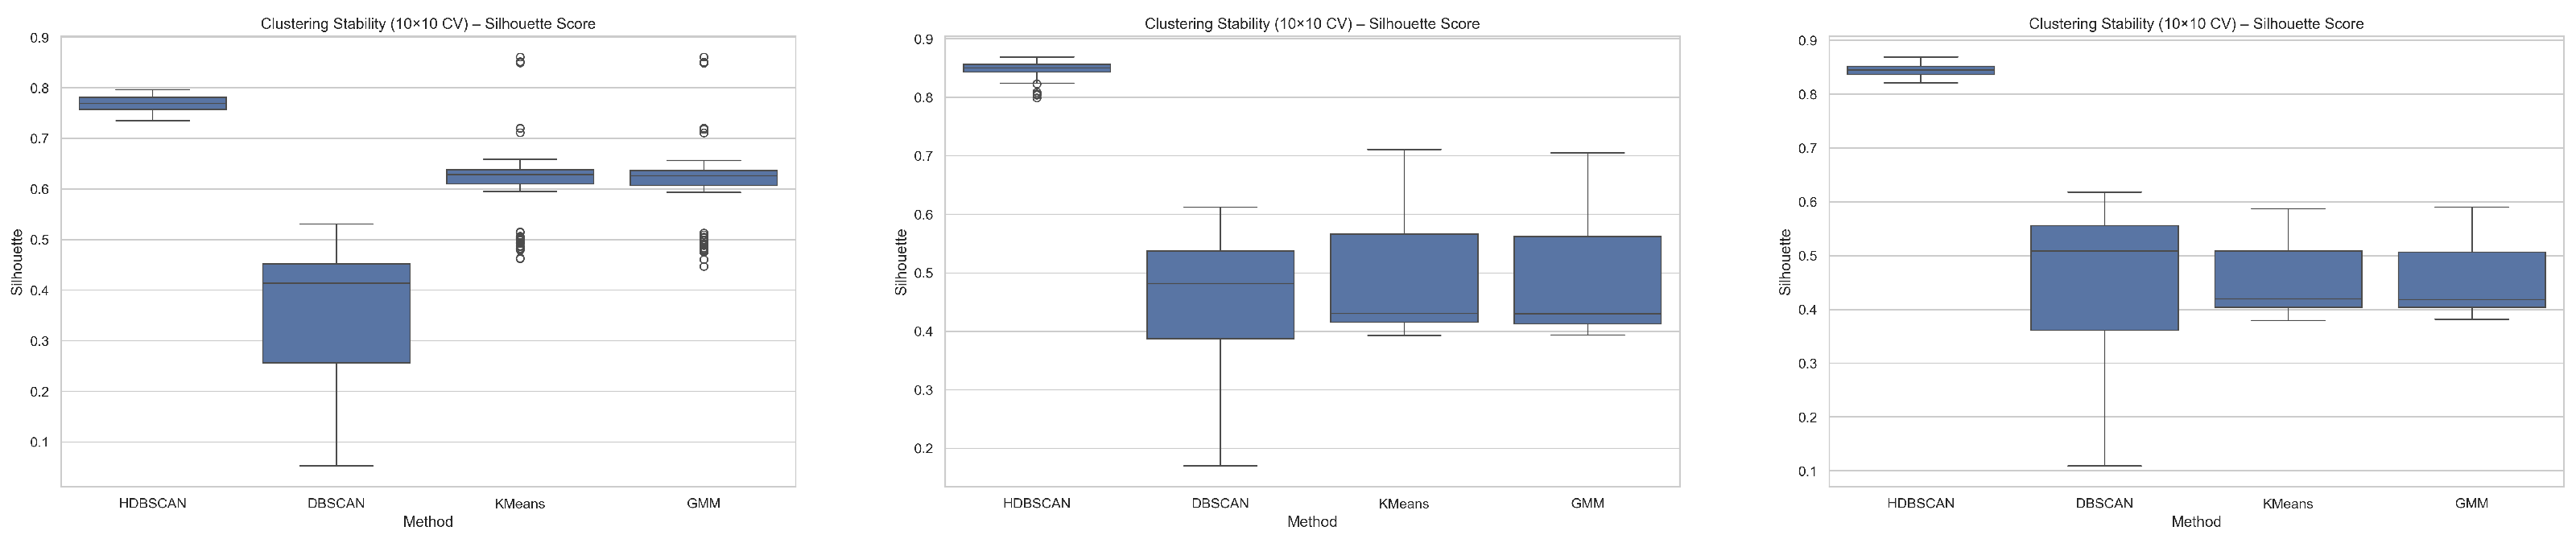
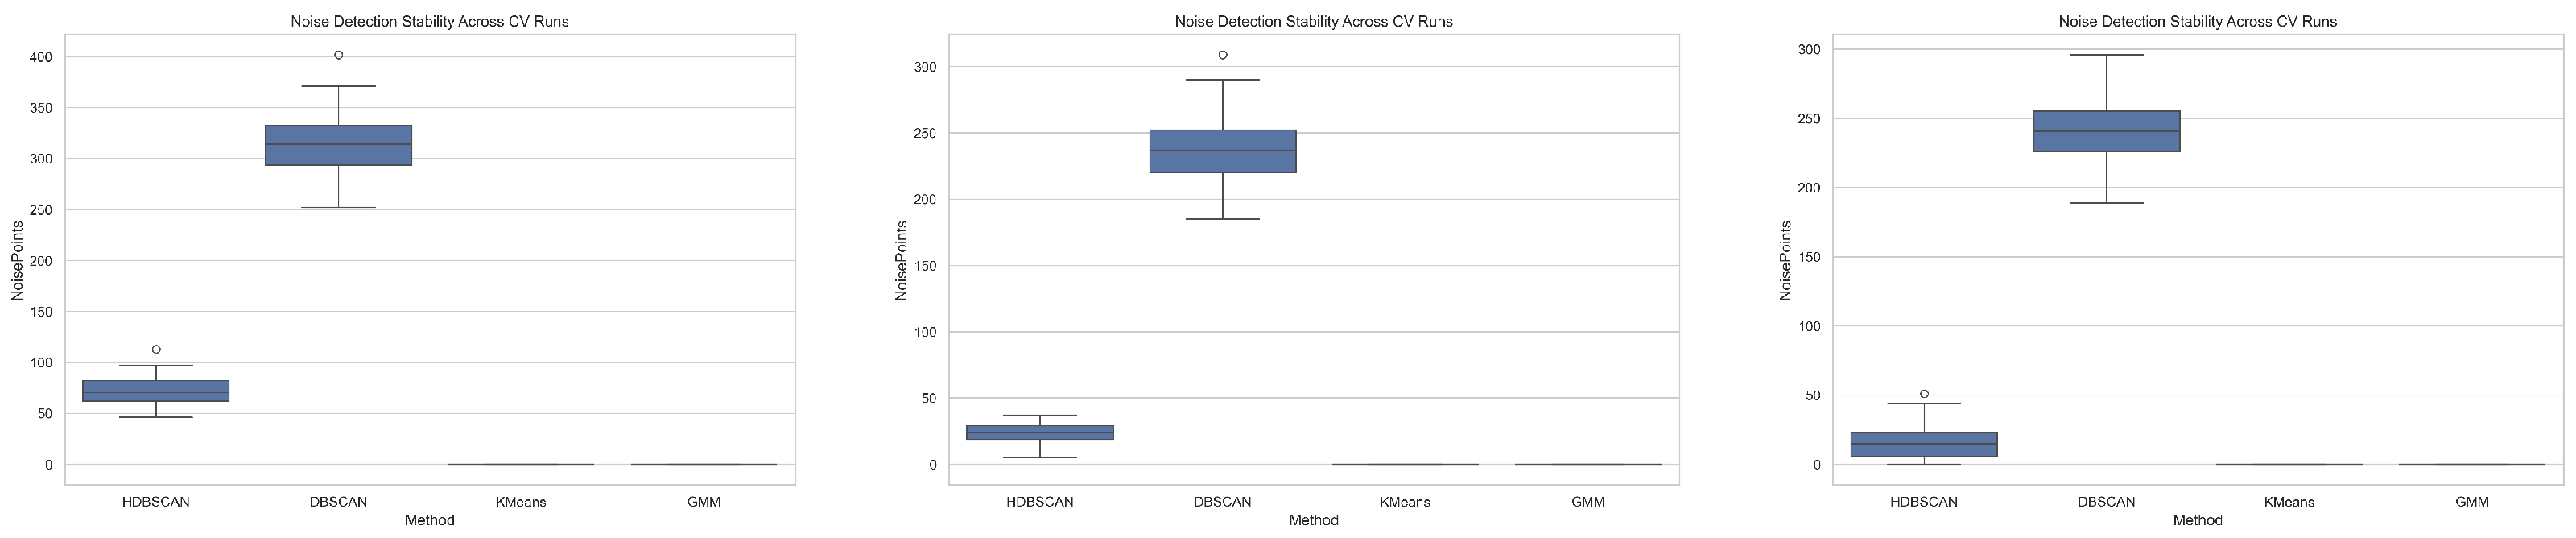
Figure 3, Figure 4 and Figure 5 present the performance comparison of four unsupervised learning algorithms: HDBSCAN, DBSCAN, KMeans, and Gaussian Mixture Model (GMM) analyzed across Datasets 1–3. Figure 3 shows clustering quality and stability evaluated using the Davies–Bouldin Index, Figure 4 shows the Silhouette Score, and Figure 5 highlights the number of noise points detected by each method. Table 2 summarizes the 10-fold cross-validation results of four unsupervised clustering methods evaluated across three datasets using the Silhouette Score, Davies–Bouldin (DB) Index, and the number of detected noise points. Reporting mean and standard deviation provides insight into both clustering quality and stability under repeated resampling. Across all datasets, HDBSCAN consistently achieves the highest Silhouette Scores with very low variance, indicating strong cluster separation and robustness to data partitioning. The Silhouette Score increases from in Dataset 1 to above in Datasets 2 and 3, demonstrating stable performance across heterogeneous alert distributions. Although HDBSCAN exhibits higher DB Index values than centroid-based methods, this behavior reflects its variable-density clustering and explicit treatment of noise rather than degraded cluster quality. KMeans and GMM exhibit comparable and moderate Silhouette Scores with consistently low DB Index values, but they detect no noise points in any dataset. This indicates that all alerts are forcibly assigned to clusters, limiting their suitability for SOC environments where identifying rare or anomalous alerts is critical. DBSCAN detects a large number of noise points, but at the cost of lower Silhouette Scores and higher variability across folds, suggesting sensitivity to density variations and reduced clustering stability. Overall, HDBSCAN provides the most balanced and stable performance, combining strong cluster separation with meaningful noise detection, making it well suited for SOC alert prioritization and noise reduction.
Figure 3.
Boxplot illustrating clustering stability across Datasets 1–3 using four unsupervised methods. Each metric is aggregated over 10 seeds folds of cross-validation, with performance evaluated via the Davies–Bouldin Index (left to right: Dataset 1 → Dataset 3).
Figure 4.
Boxplot illustrating clustering stability across Datasets 1–3 using four unsupervised methods. Each metric is aggregated over 10 seeds folds of cross-validation, with performance evaluated via the Silhouette Score (left to right: Dataset 1 → Dataset 3).
Figure 5.
Boxplot illustrating the stability of noise detection for four unsupervised clustering methods across Datasets 1–3. Results are aggregated over 10 seeds folds of cross-validation, with performance quantified as the number of noise points detected (left to right: Dataset 1 → Dataset 3).
Table 2.
10-fold cross-validation results for unsupervised clustering across three datasets. Silhouette Score, Davies–Bouldin index, and number of noise points are reported as mean ± standard deviation.
4.2. Anomaly Detection Performance Analysis Across Datasets
The figures below provide a visual comparison of anomaly detection behavior across semi-supervised and unsupervised learning approaches evaluated on Datasets 1–3. Specifically, Figure 6 presents box plots illustrating the distribution of the number of alerts flagged as anomalous, while Figure 7 summarizes the corresponding distributions of mean anomaly score separation. Results are aggregated over repeated 10-fold cross-validation with 10 independent random seeds, capturing both central tendencies and variability in detection performance across datasets. Together, these visualizations highlight differences in anomaly sensitivity and score discrimination among the evaluated methods, providing complementary insights to the quantitative results reported in Table 3: The table presents the 10-fold cross-validation results for three unsupervised anomaly detection methods evaluated across three datasets, reporting the percentage of samples flagged as anomalies and the corresponding score separation. Mean and standard deviation values highlight both detection behavior and stability across folds. Isolation Forest exhibits highly consistent behavior across all datasets, flagging approximately of samples as anomalies with extremely low variance. The score separation increases steadily from Dataset 1 to Dataset 3, indicating improved discrimination between anomalous and normal samples as data characteristics evolve. The low standard deviation across folds suggests strong robustness and repeatability, making Isolation Forest well suited for stable anomaly scoring in operational SOC settings. Local Outlier Factor (LOF) flags a similar proportion of anomalies but demonstrates substantially higher score separation values, particularly in Dataset 1. This indicates strong local contrast between anomalies and inliers; however, the large standard deviations suggest sensitivity to local density variations and reduced stability under resampling. Such behavior may be effective for exploratory anomaly discovery but less reliable for consistent alert prioritization. One-Class SVM shows the highest variability in the percentage of flagged anomalies, particularly in Dataset 1 and Dataset 3, reflecting sensitivity to training data and hyperparameter selection. Although its score separation improves in Datasets 2 and 3, it remains lower than that of Isolation Forest and LOF, suggesting weaker discrimination between anomalous and normal samples.
Overall, Isolation Forest provides the most balanced and stable anomaly detection performance, combining consistent anomaly rates with reliable score separation across datasets. While LOF achieves high separation, its variability limits robustness, and One-Class SVM demonstrates less consistent detection behavior. These results support the selection of Isolation Forest for SOC anomaly scoring and alert prioritization.
Figure 6.
Box plots comparing semi-supervised and unsupervised learning anomaly detection approaches across Datasets 1–3 (from left to right). Results are aggregated over repeated 10-fold cross-validation with 10 independent random seeds, and summarize the distribution of anomaly detection performance on alerts flagged as anomalous.
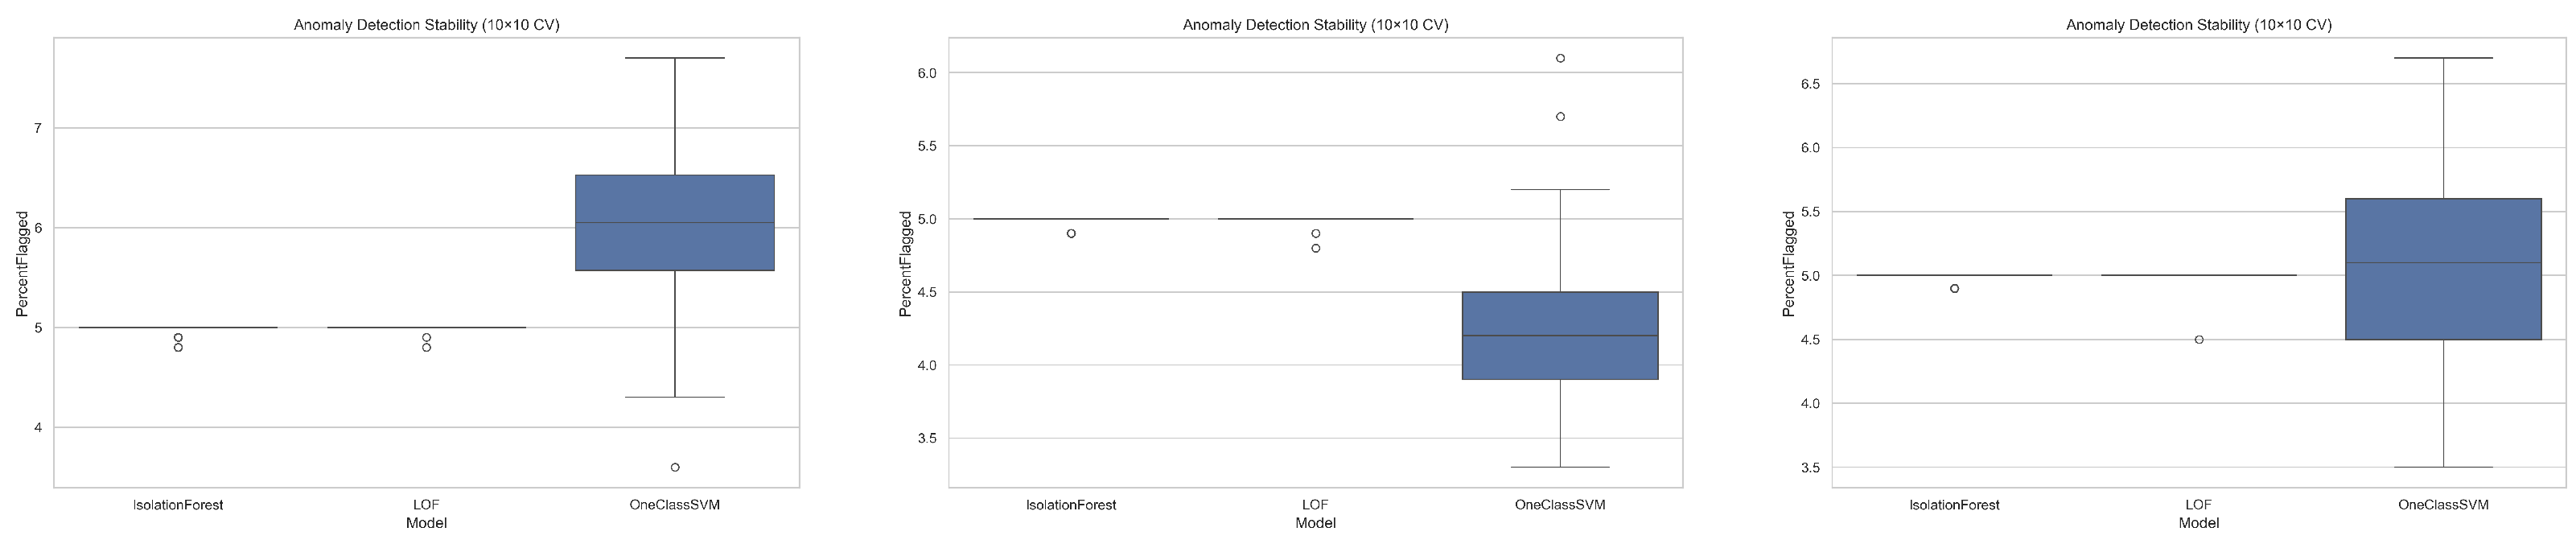
Figure 7.
Box plots comparing semi-supervised and unsupervised learning approaches across Datasets 1–3 (from left to right), summarizing the distribution of mean score separation on security alerts aggregated over repeated 10-fold cross-validation with 10 independent random seeds.
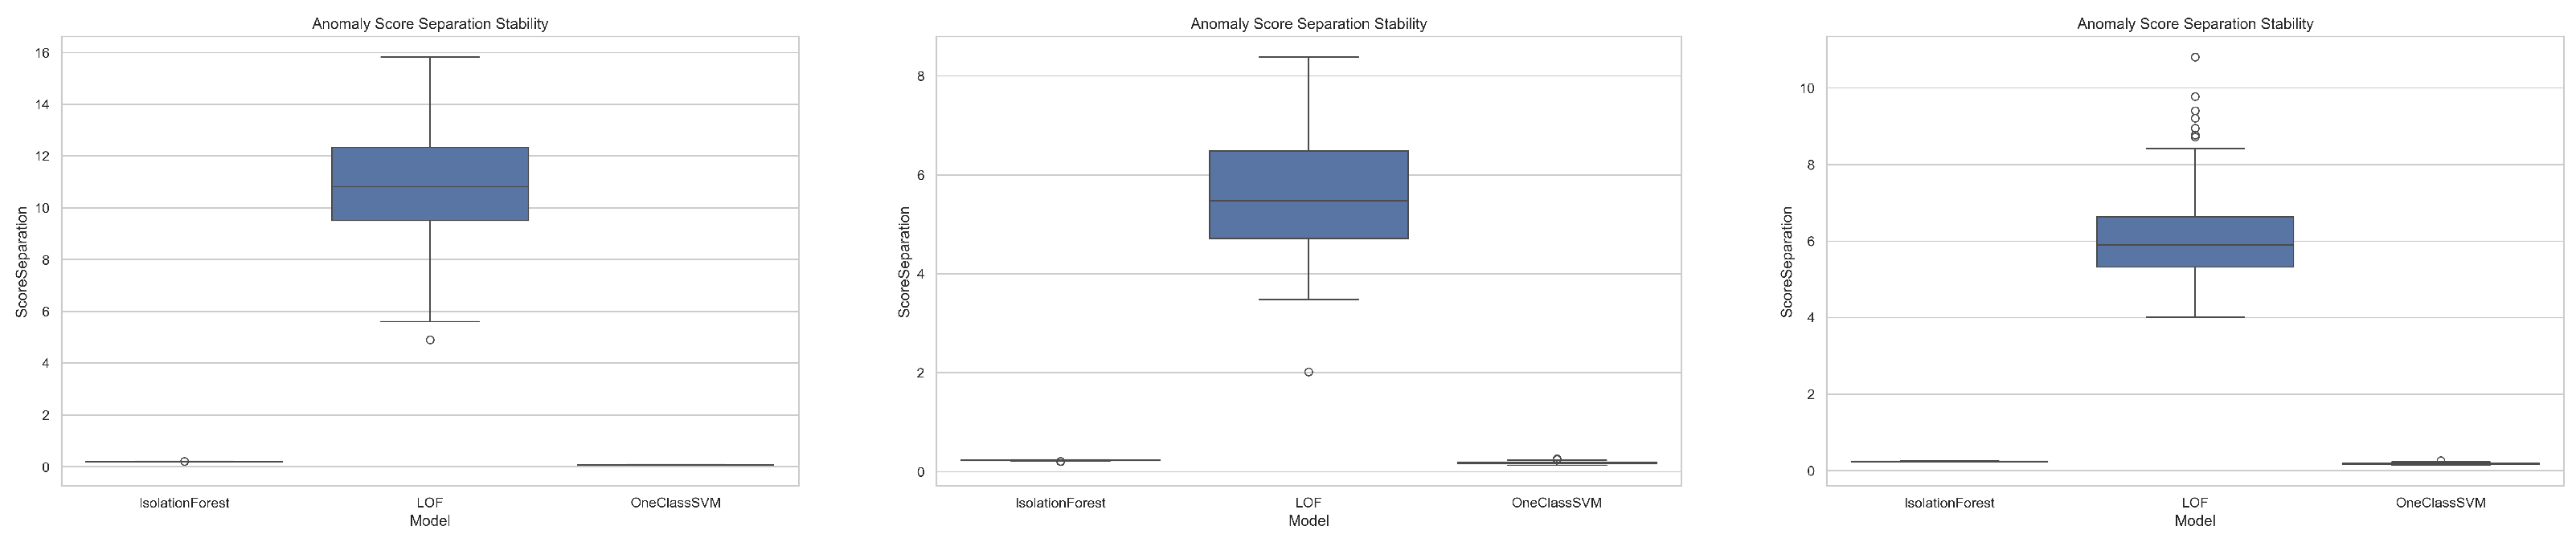
Table 3.
Ten-fold cross-validation results for anomaly detection across three datasets. Metrics include the percentage of samples flagged as anomalies and score separation, reported as mean ± standard deviation.
Discussion of Synthetic Threat Injection Results
Table 4 reports the 10-fold cross-validation performance of three anomaly detection models under synthetic threat injection across three datasets, evaluated using precision, recall, and F1-score. Mean and standard deviation values reflect both detection accuracy and stability across folds. Across all datasets, Isolation Forest consistently achieves near-perfect performance, with Precision above , recall equal to , and F1-scores close to . The negligible variance in recall indicates that injected threats are reliably detected in every fold, while the low standard deviation in precision suggests stable discrimination between injected attacks and benign alerts. This robustness highlights Isolation Forest’s suitability for detecting synthetic anomalies in SOC-like environments. One-Class SVM demonstrates perfect recall across all datasets but with noticeably lower precision and higher variance, particularly in Dataset 2. This behavior indicates a tendency to over-flag alerts as anomalous, resulting in a higher false-positive rate. Consequently, while One-Class SVM is effective at ensuring injected threats are not missed, its reduced precision leads to lower and less stable F1-scores compared to Isolation Forest. In contrast, LOF performs poorly across all datasets, yielding near-zero precision, recall, and F1-scores. This suggests that LOF is unable to distinguish injected threats from normal alerts under the evaluated settings, likely due to sensitivity to local density variations and the global structure of the feature space. Overall, the results demonstrate that Isolation Forest provides the most reliable and stable detection of synthetic threats, achieving an optimal balance between precision and recall. One-Class SVM offers high sensitivity but at the cost of increased false positives, while LOF is unsuitable for this threat injection scenario.
Table 4.
Ten-fold cross-validation results for synthetic threat injection across three datasets. Metrics include Precision, Recall, and F1-score, reported as mean ± standard deviation.
4.3. Alert Prioritization Results
Based on its stable performance across the evaluated datasets, Isolation Forest was selected as the anomaly detection technique used for alert prioritization. Each alert is assigned an anomaly score, which is subsequently combined with cluster rarity and SOC operational relevance to derive a priority rank, as defined by the priority rank score in Equation (20).
where denotes the Isolation Forest anomaly score of alert i, while represents the size of the cluster containing alert i, and represents an operational severity multiplier derived from dominant SOC alert categories, reflecting analyst-validated criticality rather than arbitrary weighting. Figure 8 presents the alert prioritization results based on the computed priority ranks. The results indicate that the joint consideration of anomaly severity, cluster size, and SOC contextual weighting enables effective differentiation between routine and security-relevant alerts.
Figure 8.
Analysis of the top-100 ranked alerts for Datasets 1–3 (from left to right), illustrating the ordering produced by the alert prioritization process.
Dataset 1. The results indicate that alerts related to routine web activity, such as web server 400 error codes, are predominantly assigned lower priority ranks. System-level events, including file additions and osquery error messages, occupy intermediate ranks, whereas alerts associated with service behavior anomalies, such as Nginx error messages, are consistently ranked among the highest-priority alerts.
Dataset 2. The analysis shows that authentication-related alerts involving repeated incorrect password attempts are generally assigned lower priority. In contrast, alerts indicating host-level security concerns, including rootcheck anomaly detections and integrity checksum changes, are ranked as high priority. File detection alerts exhibiting strong anomaly characteristics are consistently placed at the top of the ranking.
Dataset 3. The results demonstrate that network-related events such as SSH connection resets are primarily ranked at lower priority levels when exhibiting common behavioral patterns. Alerts associated with potential system compromise, including new package installations, integrity checksum modifications, and multiple authentication failures, are ranked higher. Authentication failures and web server errors appear at intermediate priority levels, reflecting their contextual relevance and observed frequency.
The results demonstrate that the proposed prioritization approach effectively suppresses alert noise while elevating alerts associated with rare and security-relevant behaviors, thereby supporting more efficient SOC analysis and incident response. This aligns with recent findings from automated triage systems, which demonstrate that learning behavioral patterns from large-scale alert streams can reduce investigation time by prioritizing high-fidelity signals over routine noise [43].
4.4. AI-Powered SOC Alert Detection and Prioritization Dashboard
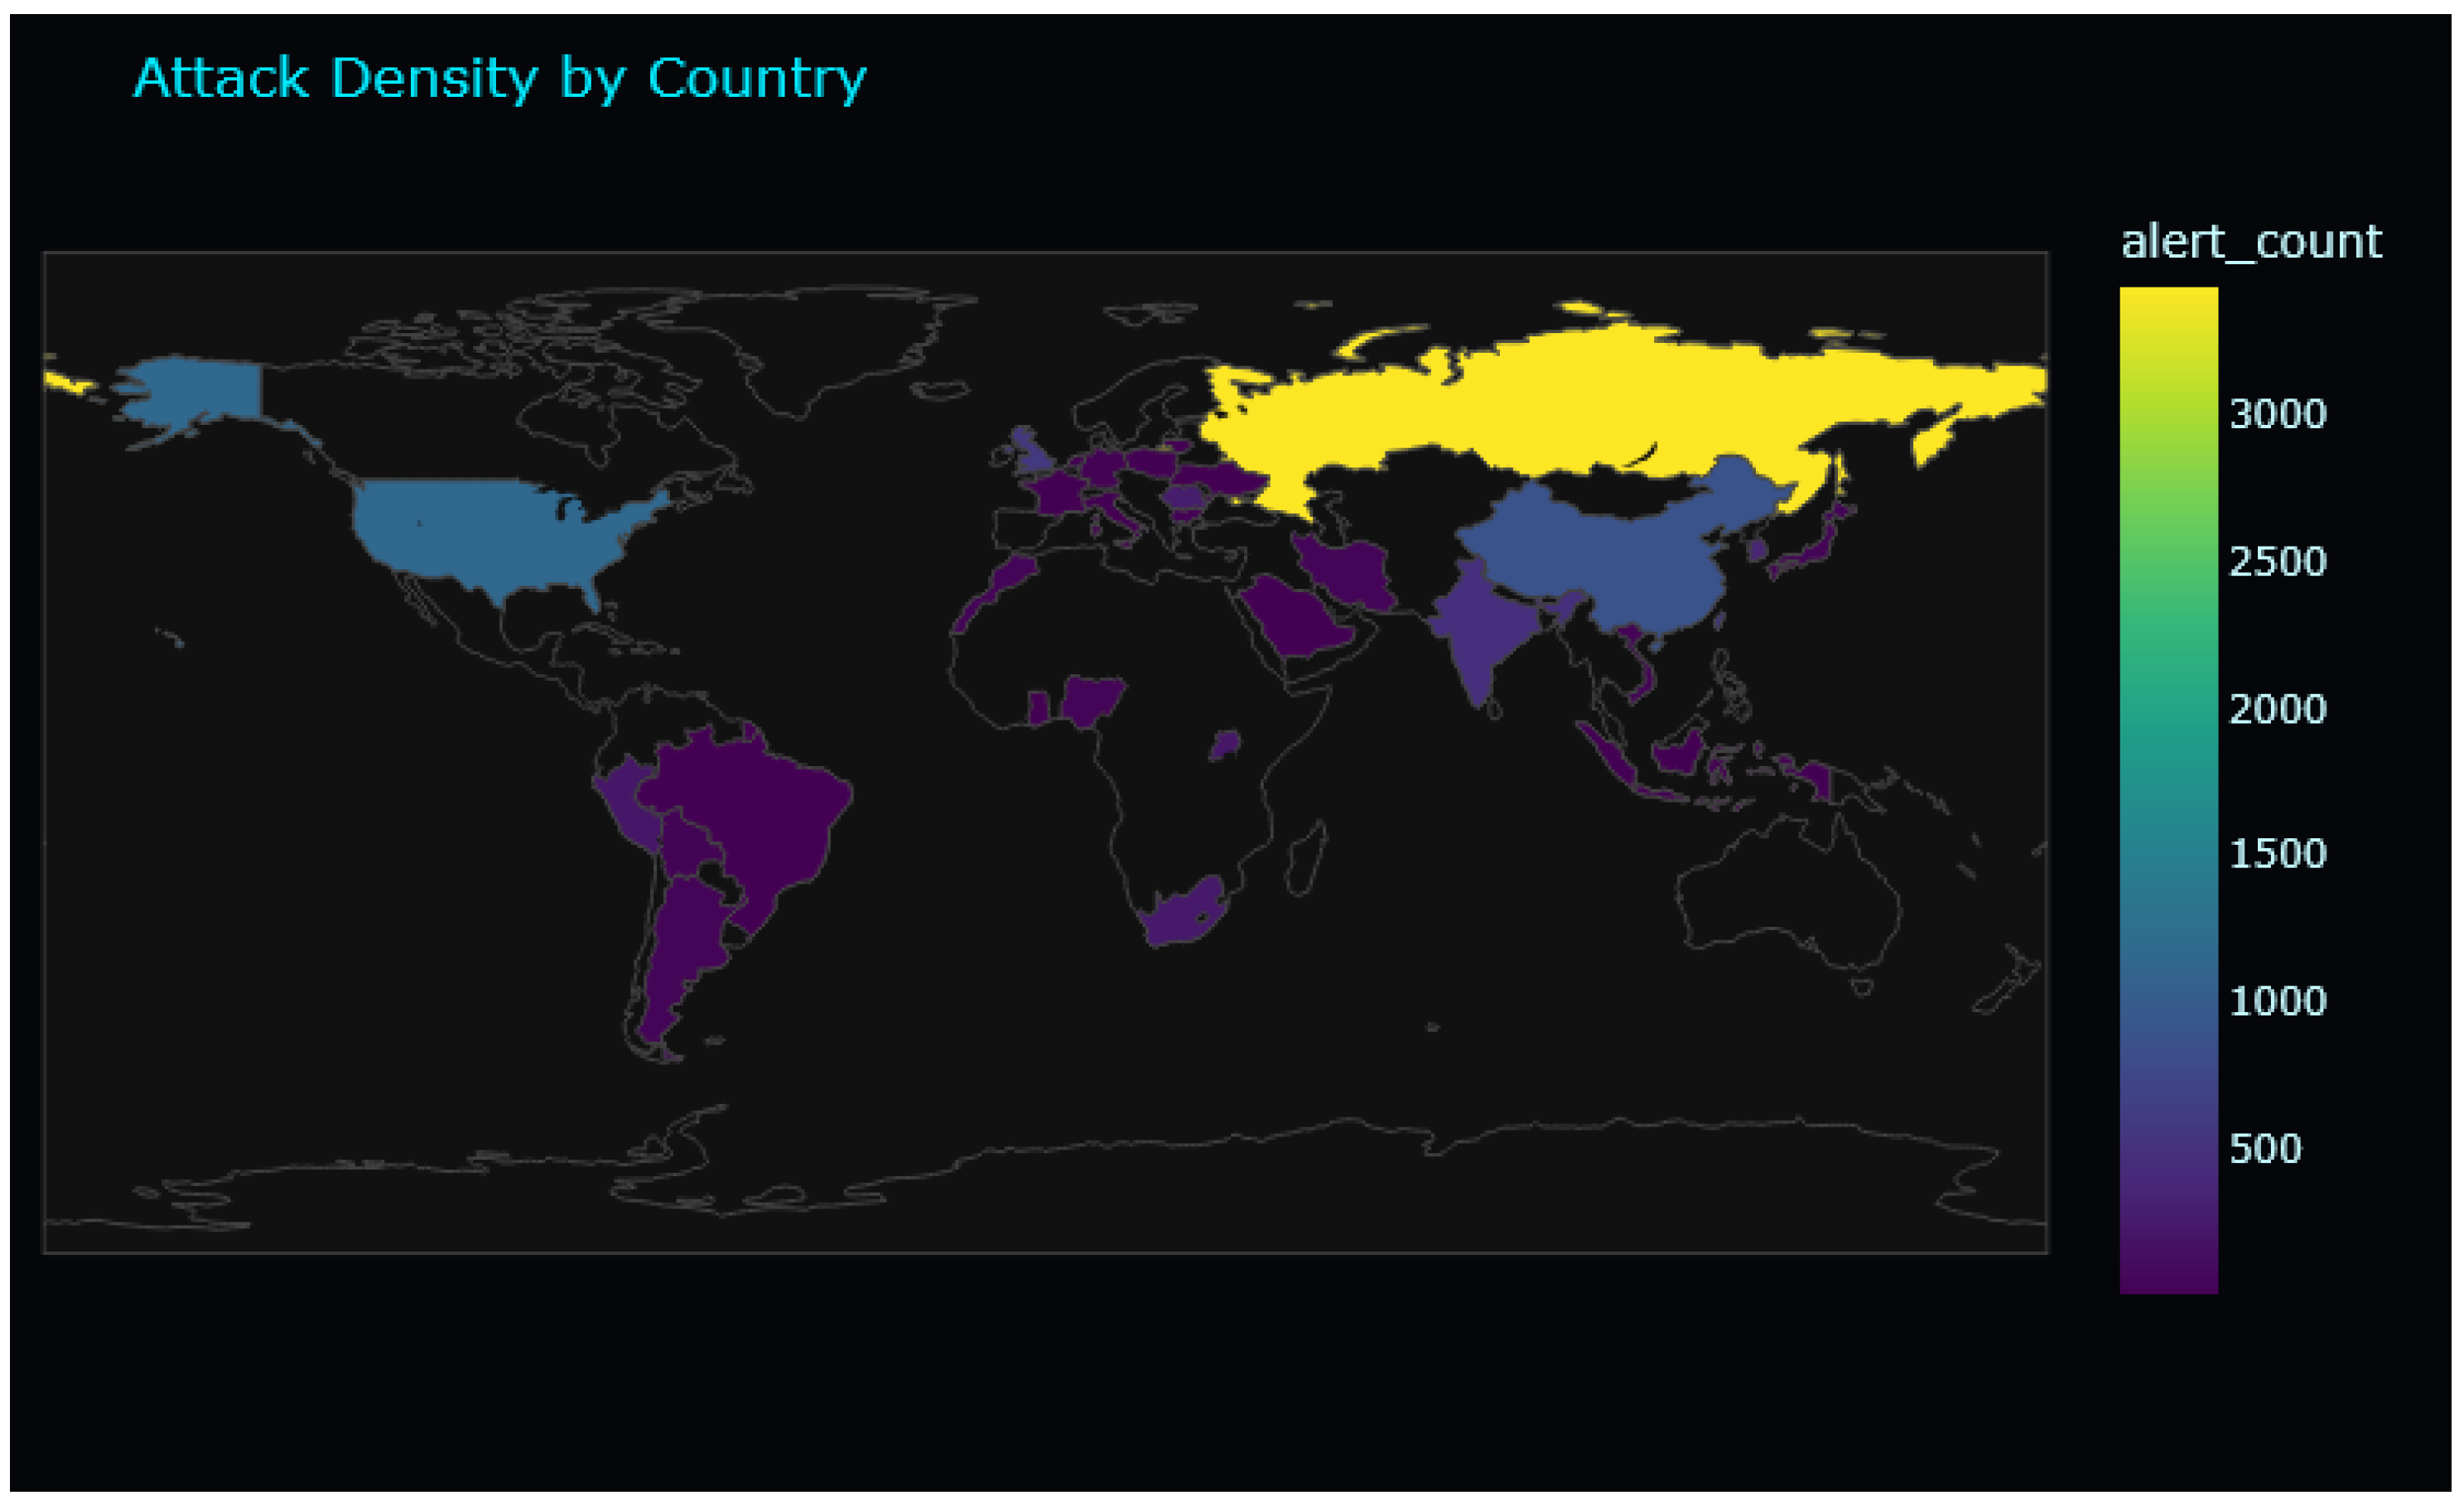
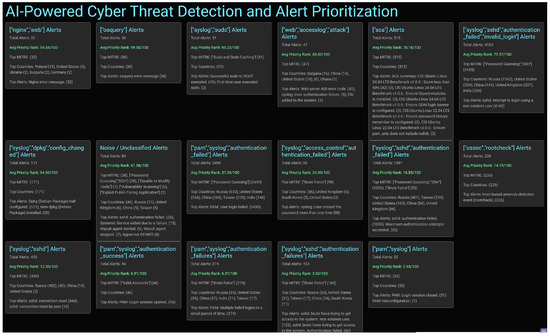
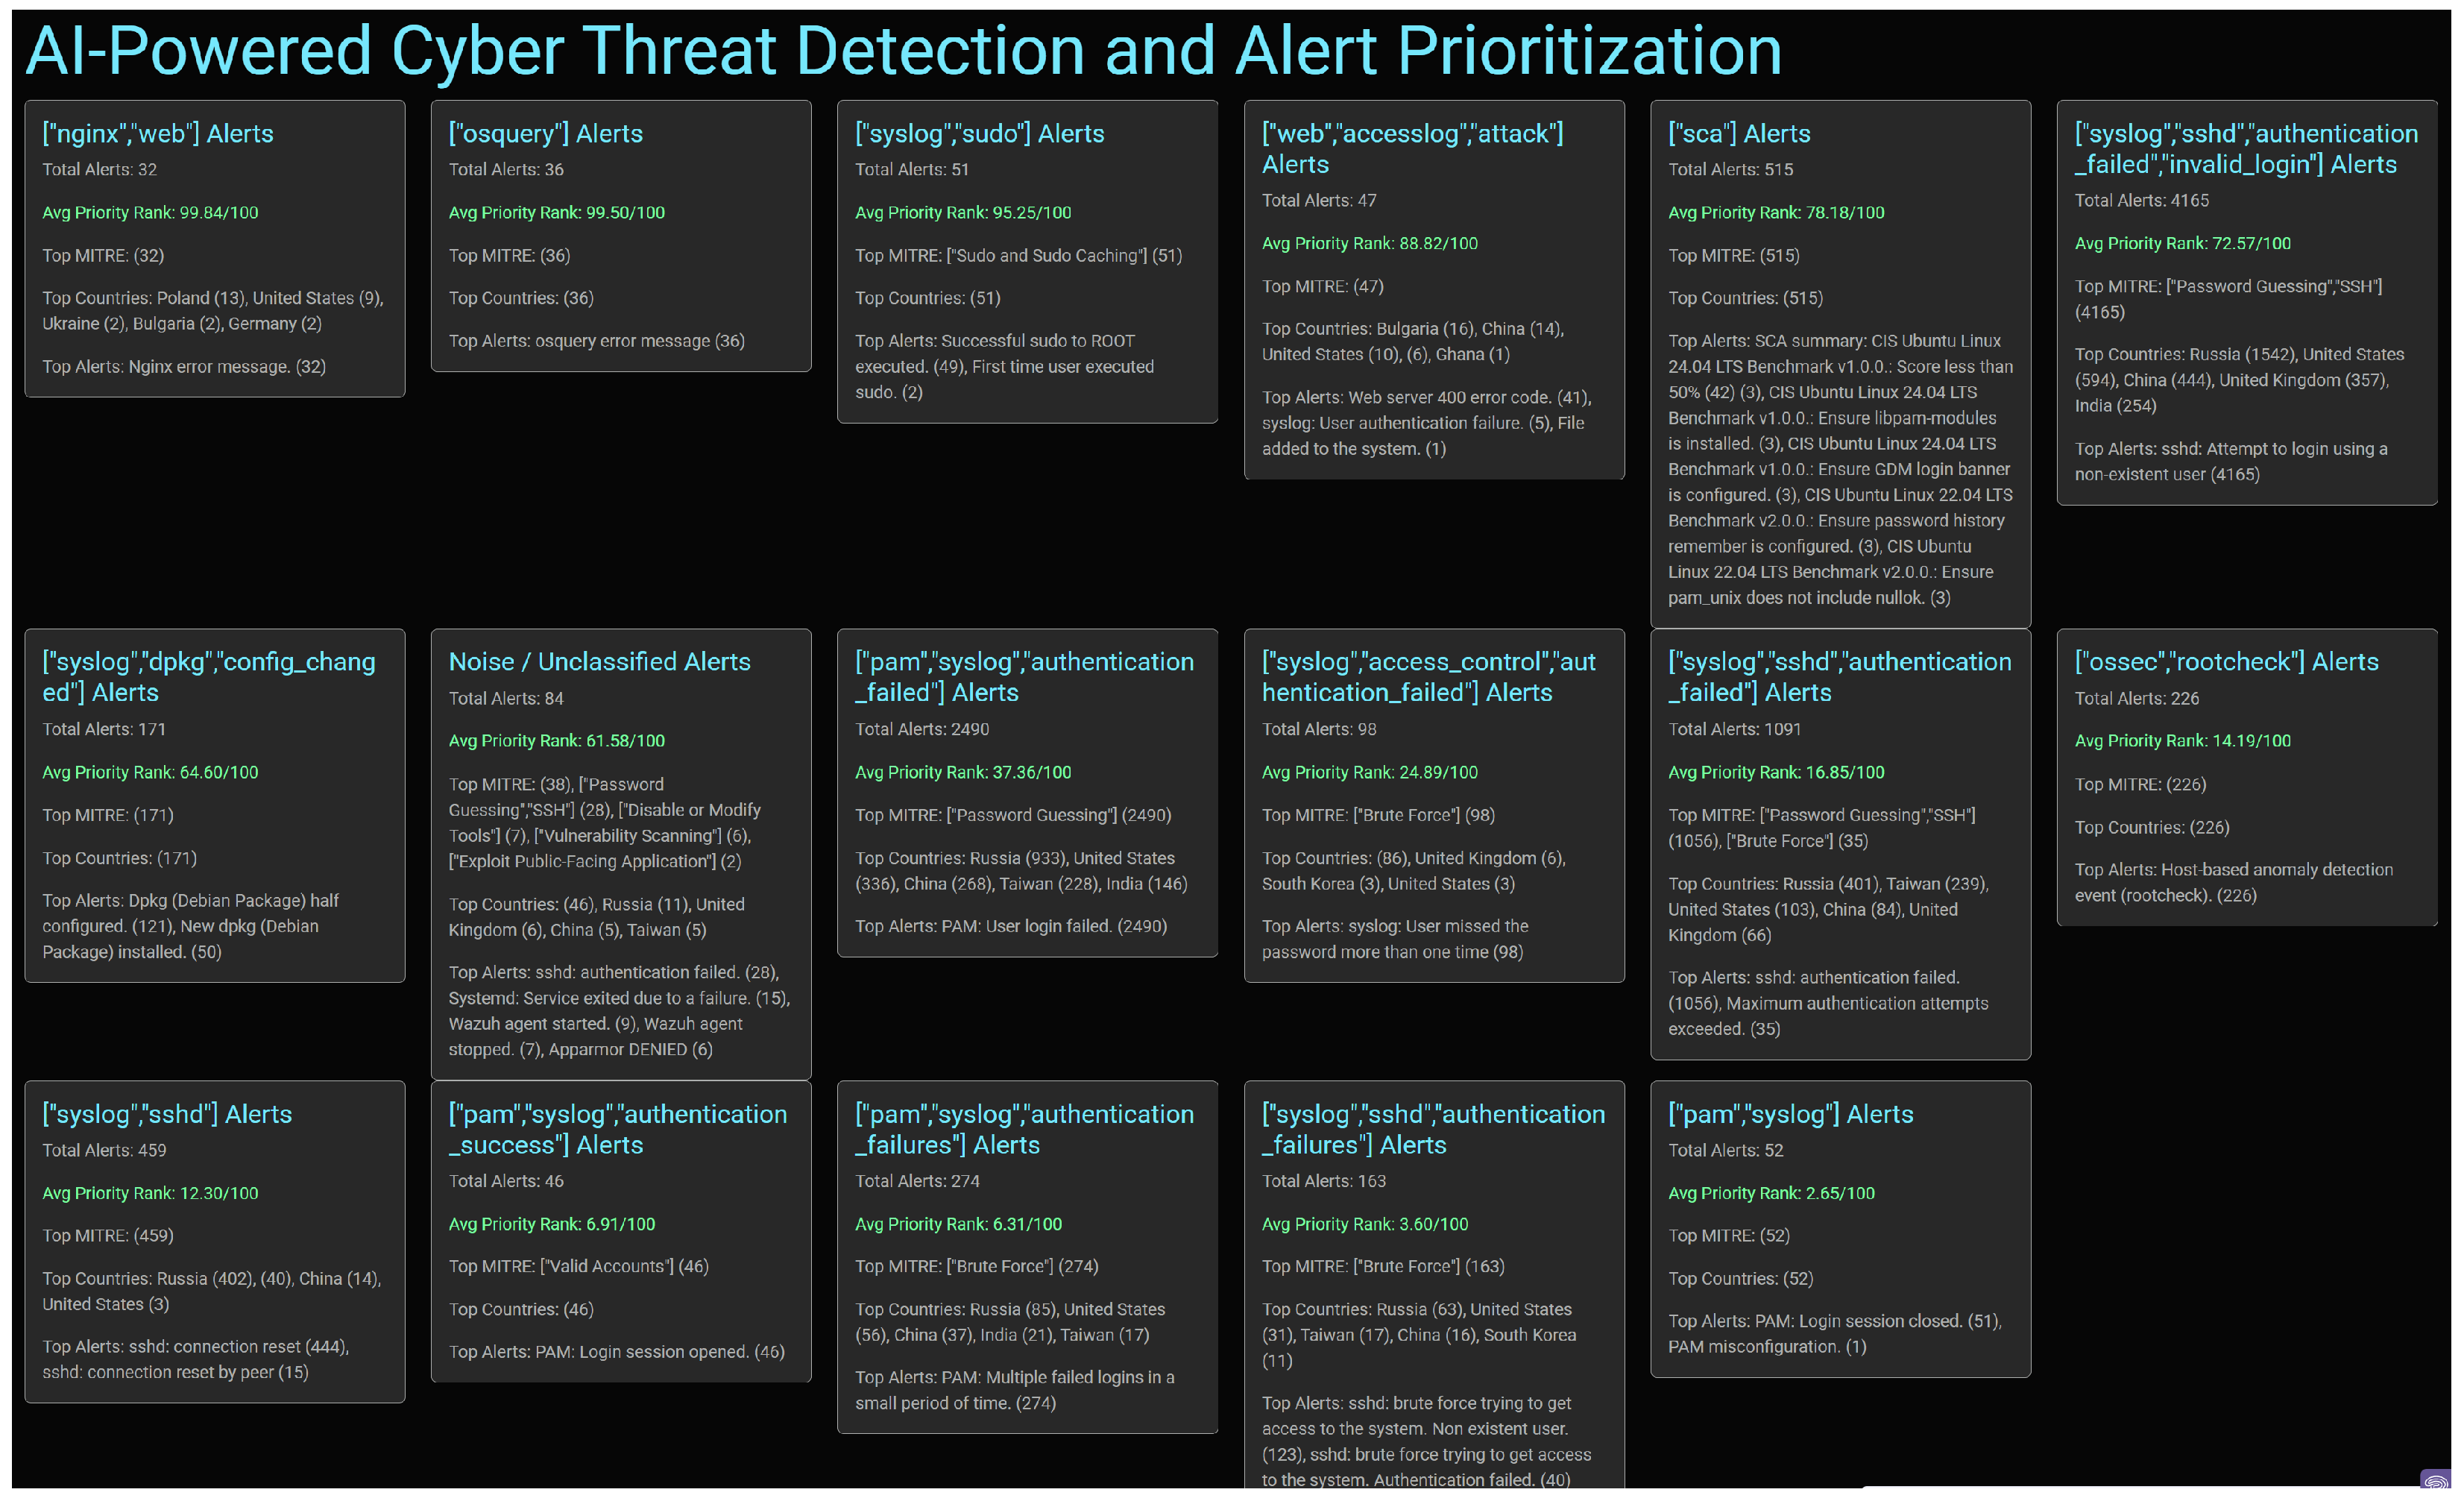
Dataset 1: We provide a comprehensive overview of the security posture and attack patterns observed in Dataset 1. Figure 9 presents AI-assisted SOC alert prioritization and clustering of 10,000 events, highlighting the top five MITRE techniques, top five source countries, top five alert counts per category, and average priority ranks (0–100%). Figure 10 illustrates HDBSCAN clustering visualized on a two-dimensional UMAP projection, capturing 17 real-world cyber alert categories, while Figure 11 shows the distribution of MITRE ATT&CK technique frequencies as summarized in Table 5. Figure 12 visualizes the geographic distribution of attack density by country, offering insight into the global sources of activity.
Figure 9.
AI-driven cyber threat detection and alert prioritization dashboard, showing clustering of 10,000 events from Dataset 1 into 17 alert types, along with the top MITRE techniques, source countries, alert counts per category, and average priority ranks, providing a representative overview of the dataset.
Together, these figures contextualize the subsequent findings: security monitoring identified sustained and high-volume malicious activity targeting the environment’s web services, system authentication mechanisms, and host configurations, consistent with continuous automated reconnaissance and attack attempts commonly directed at internet-facing systems. The activity includes more than 8000 authentication-related alerts driven primarily by password-guessing and brute-force attempts against SSH, PAM, and related services, originating from geographically diverse sources such as Russia, China, the United States, Taiwan, and multiple European regions, patterns strongly aligned with global botnet behavior rather than targeted insider threats Figure 9 and Figure 12. Concurrently, Nginx and web access logs recorded repeated error-triggering requests mapped to MITRE ATT&CK reconnaissance and exploit-preparation techniques, indicating intentional probing of application behavior; however, no successful exploitation or progression beyond error responses was observed Figure 10 and Figure 11. Note that the cluster semantics are derived through the dominant SOC rule and MITRE technique frequency analysis, enabling automated yet interpretable labeling. Privileged activity, including successful sudo executions and first-time sudo usage, was detected and assessed as legitimate administrative behavior with no signs of abnormal privilege escalation, though it remains under continuous monitoring due to its sensitive nature. In addition, over 500 system configuration assessment findings against CIS benchmarks highlight security hardening and compliance gaps related to logging, firewall enablement, password policy enforcement, and package configuration; these represent configuration risk rather than evidence of active exploitation and provide clear opportunities to reduce the overall attack surface. Routine operational events such as package updates, service restarts, and agent activity were also observed and classified as expected noise with low security impact. The results suggest that the external threat level remains high due to persistent attack activity, defensive controls are operating effectively, no successful compromise or data exposure has been detected, system stability is maintained, and the immediate focus should be on continued monitoring and prioritized configuration hardening to strengthen resilience and reduce future risk.
Figure 10.
HDBSCAN clustering was performed on the original high-dimensional features of Dataset 1, producing 17 clusters corresponding to real-world cyber alert categories; cluster semantics were automatically and interpretably inferred using dominant SOC rules and MITRE technique frequency analysis, with a two-dimensional UMAP projection employed solely for visualization.

Figure 11.
Distribution of MITRE ATT&CK technique frequencies in Dataset 1.
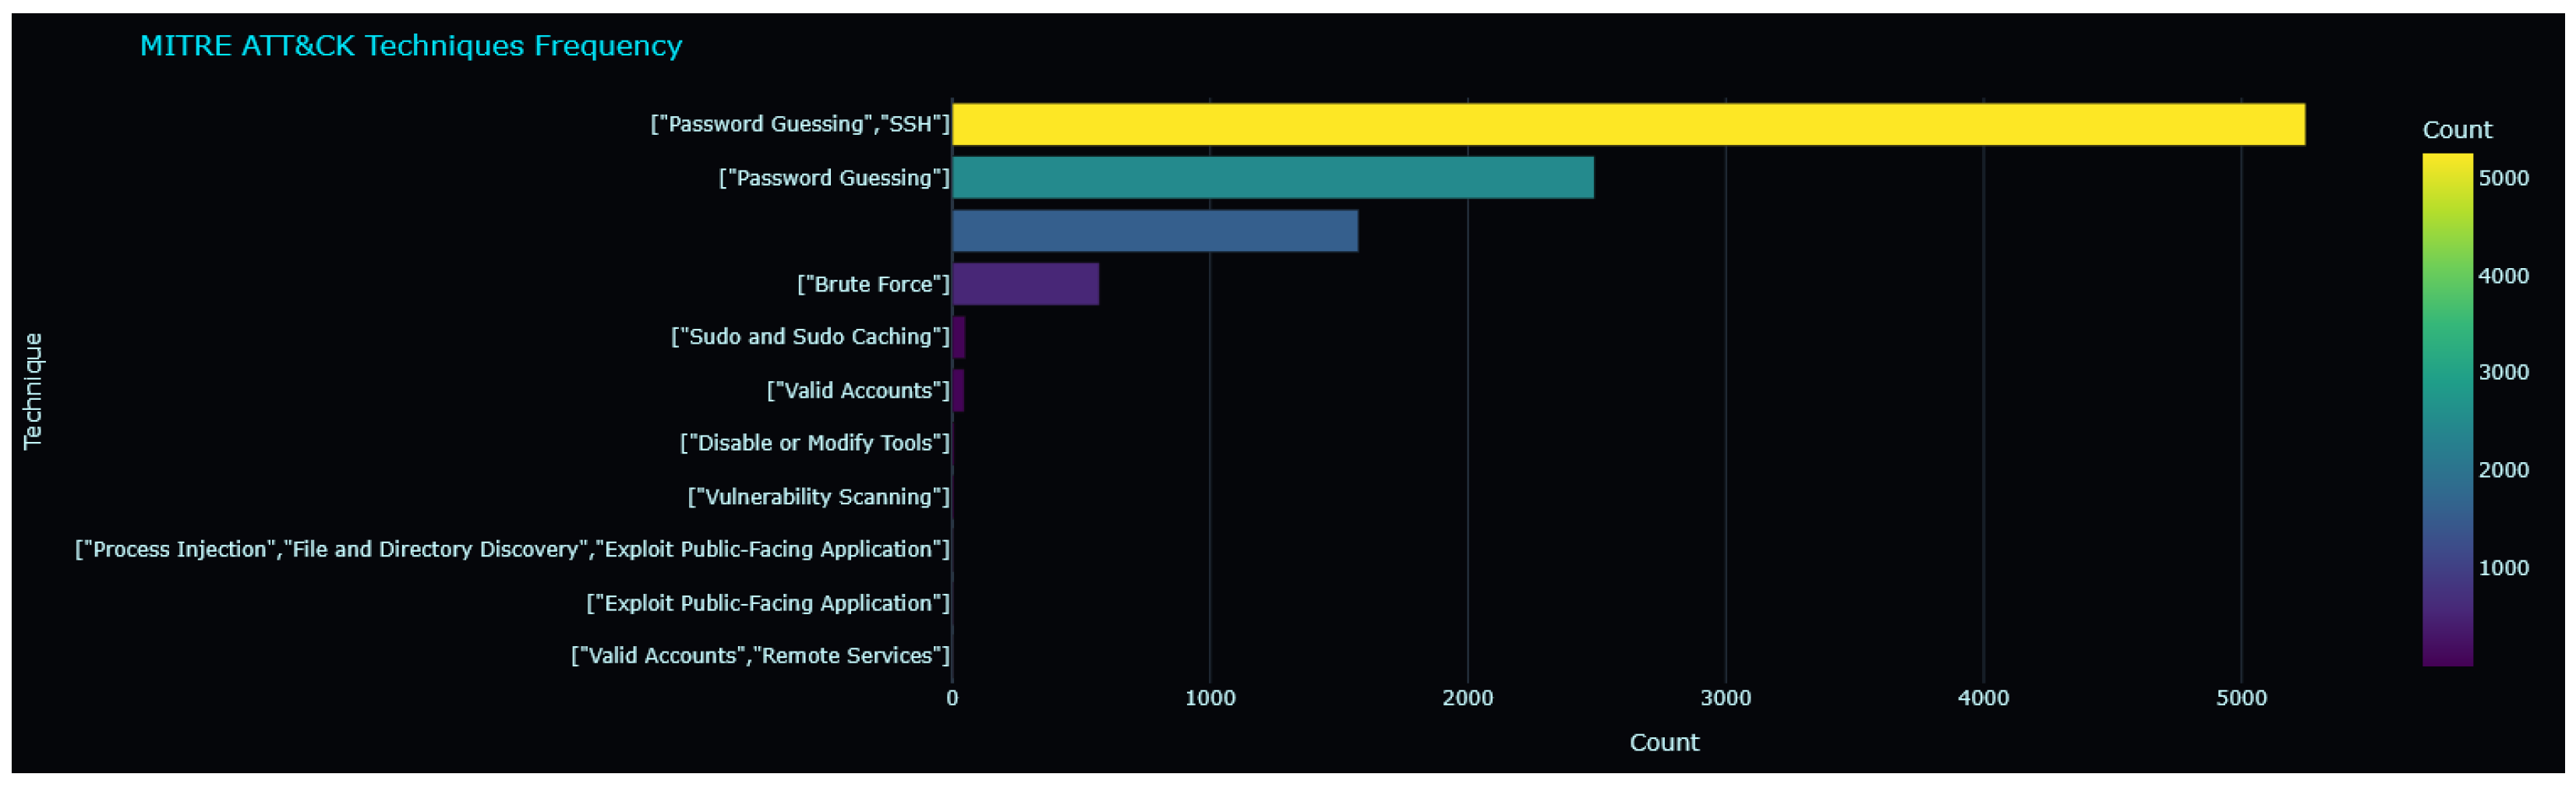
Figure 12.
Geographic distribution of attack density by country in Dataset 1.
Dataset 2: An overview of the security posture and attack patterns observed in Dataset 2. Figure A1 presents AI-assisted SOC alert prioritization and clustering of 10,000 events, highlighting the top five MITRE techniques, top five source countries, top five alert counts per category, and average priority ranks (0–100%). Figure A2 illustrates HDBSCAN clustering on a two-dimensional UMAP projection, capturing 8 real-world cyber alert categories, while Figure A3 shows the distribution of MITRE ATT&CK technique frequencies as summarized in Table 5. Figure A4 visualizes the geographic distribution of attack density by country, offering insight into the global sources of activity. Collectively, these figures provide context for the following analysis: The systems recorded a high volume of alerts, primarily associated with authentication failures and brute-force or password-guessing attempts targeting SSH and PAM, with thousands of events originating from multiple countries, including the United States, Russia, the United Kingdom, and China. In addition to these widespread login attempts, a smaller subset of high-severity events such as unauthorized file deletions and integrity checksum modifications was also observed, although no evidence of successful compromise or unauthorized access has been identified. While the majority of the activity appears to be automated scanning or probing by external sources, the persistence and frequency of these high-priority events underscore the need for continuous monitoring, rate-limiting of access attempts, and targeted investigation to ensure that system security and operational integrity are maintained. These findings highlight both the resilience of existing defenses and the importance of proactive measures to prevent potential exploitation in the future.
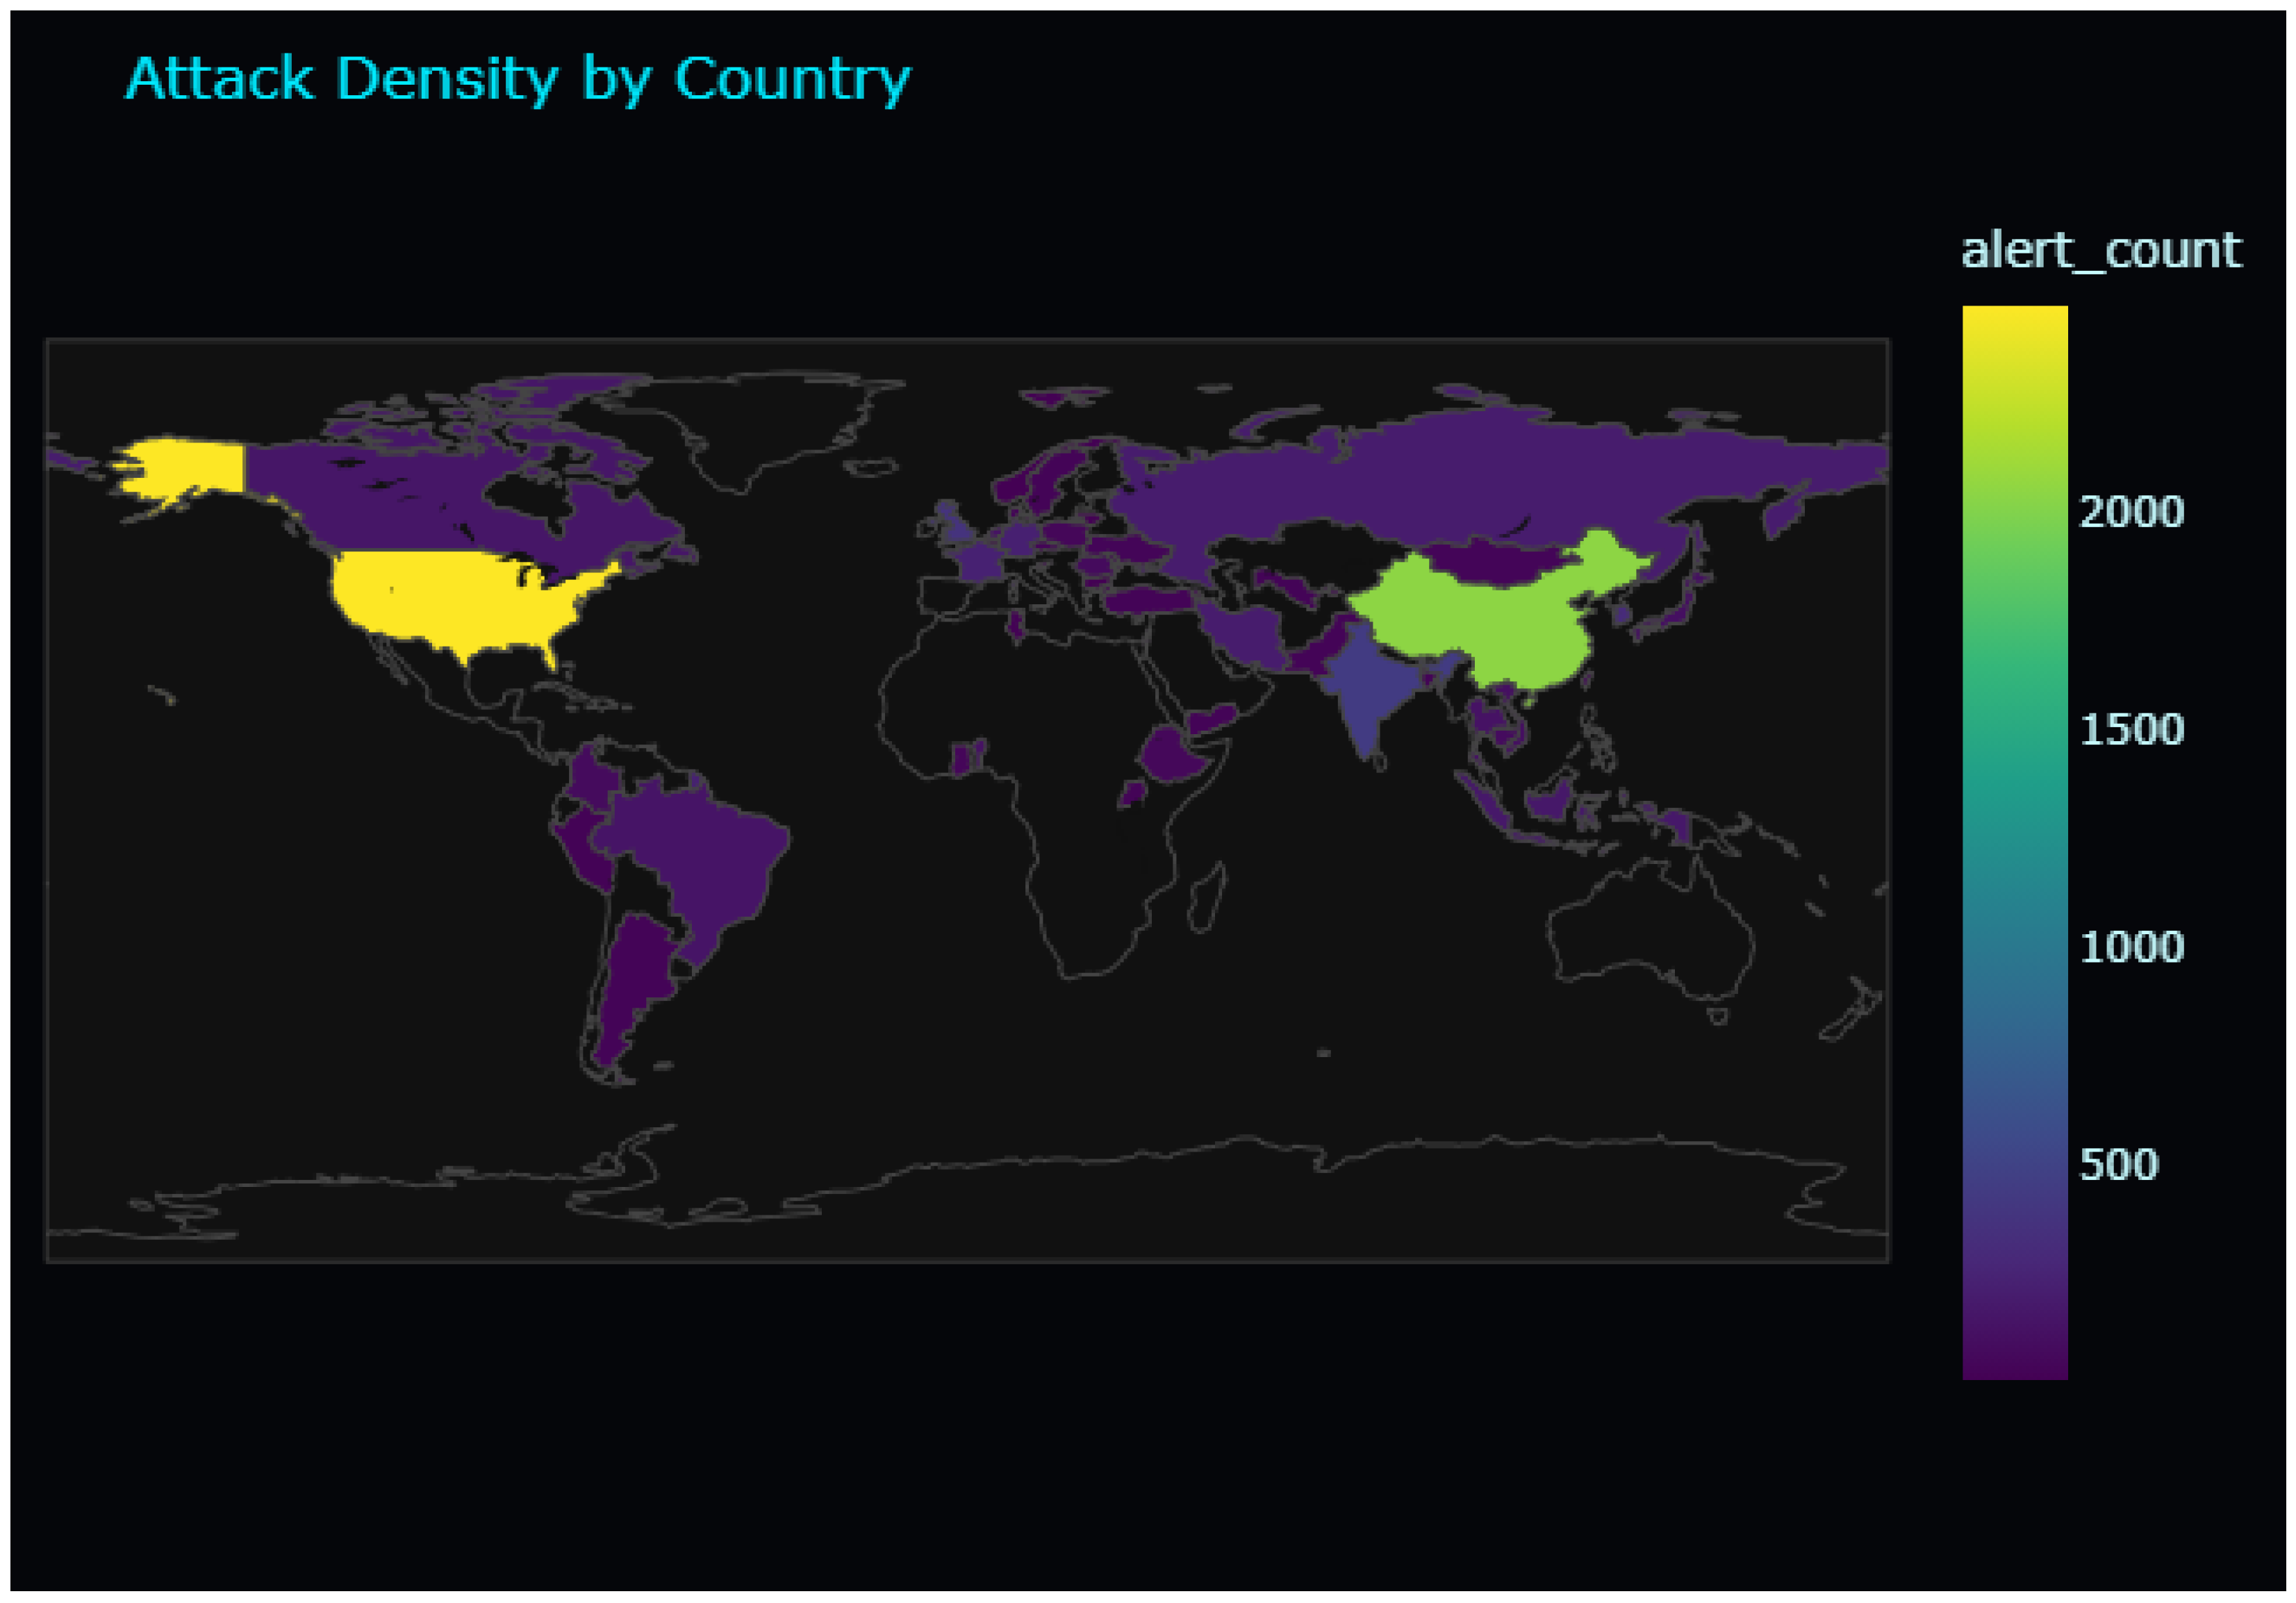
Dataset 3: An assessment of security events and attack behaviors recorded in Dataset 3. Figure A5 presents AI-assisted SOC alert prioritization and clustering of 10,000 events, highlighting the top five MITRE techniques, top five source countries, top five alert counts per category, and average priority ranks (0–100%). Figure A6 illustrates HDBSCAN clustering on a two-dimensional UMAP projection, capturing 8 real-world cyber alert categories, while Figure A7 shows the distribution of MITRE ATT&CK technique frequencies as summarized in Table 5. Figure A8 visualizes the geographic distribution of attack density by country, offering insight into the global sources of activity. Taken together, these figures frame the subsequent analysis: the system alert analysis indicates that our examined infrastructure is experiencing widespread and persistent authentication-focused activity, primarily targeting SSH and PAM services. Across multiple categories, there are thousands of events ranging from critical brute-force attempts to lower-priority password-guessing efforts, originating from a diverse set of countries including China, the United States, Russia, the United Kingdom, and several unidentified sources. High-priority alerts—scoring above 95 on the system’s severity scale—include repeated SSH connection resets, multiple failed login attempts over short intervals, and attempts to access accounts that may or may not exist, suggesting that attackers are actively probing the system for vulnerabilities and valid credentials. Furthermore, the medium- and lower-priority alerts largely represent automated password-guessing attempts and less targeted activity, but the sheer volume, indicating ongoing reconnaissance that could escalate into successful compromise if weak or default credentials exist. The pattern of these alerts is consistent with both targeted attacks and opportunistic scanning, reflecting the global nature of automated credential abuse and brute-force activity. The results indicate their is no confirmed evidence of a successful breach at this time; the combination of high-severity brute-force events and high-volume low-severity attempts underscores the need for immediate mitigation, such as enforcing strong password policies, implementing SSH key-based authentication, disabling root login, and deploying automated blocking measures like fail2ban. Additionally, continuous monitoring and auditing of authentication logs are essential to detect any escalation in attack sophistication or signs of lateral movement within the environment. Note: Figure A1, Figure A2, Figure A3, Figure A4, Figure A5, Figure A6, Figure A7 and Figure A8 are presented in Appendix A for completeness.
Table 5.
MITRE coverage summary.
4.5. SOC-Oriented Analytical Performance Metrics
We further analyzed the clusters representing different alert patterns that are clearly separated as described from the dashboard in Figure 9, Figure 10, Figure A1, Figure A2, Figure A5 and Figure A6. The figures visualize HDBSCAN clustering results for Datasets 1–3 on a two-dimensional UMAP projection of combined categorical, numerical, and textual features; distinct clusters and low-density noise points are shown for interpretability in the KPI panel of the dashboard, while clustering is performed in the original high-dimensional space. Correspondingly, Table 6 summarizes the clustering outcomes and dataset characteristics. Each dataset comprises 10,000 processed alerts. The HDBSCAN algorithm identified 17, 8, and 8 clusters for Datasets 1, 2, and 3, respectively, while identifying fewer than 1% of alerts as low-relevance noise. Consequently, an alert retention rate of approximately >99% was achieved across all datasets. These results highlight the effectiveness of HDBSCAN in separating rare or anomalous alerts from frequent, routine events, thereby reducing the manual review workload and supporting efficient SOC triage.
Table 6.
Summary of processed alerts and clustering outcomes, including Alert Retention Rate (ARR) and Noise Reduction (NR) for each dataset.
4.6. Discussion
HDBSCAN demonstrates the most balanced and robust clustering performance across all datasets, consistently achieving high Silhouette Scores with low variance, while effectively identifying low-relevance noise points. In contrast, KMeans and GMM forcibly assign all alerts to clusters, limiting their ability to isolate rare or anomalous alerts, and DBSCAN, although detecting substantial noise, exhibits lower Silhouette Scores and higher variability, reflecting sensitivity to density fluctuations. Regarding anomaly detection, Isolation Forest emerges as the most operationally practical and technically robust model, providing consistent anomaly rates and reliable score separation across datasets. LOF achieves high local contrast but suffers from substantial variability, while One-Class SVM demonstrates unstable detection behavior and inconsistent separation. Overall, these results indicate that anomalies in the evaluated datasets manifest as global deviations rather than purely local density irregularities, reinforcing the suitability of HDBSCAN for clustering and Isolation Forest for anomaly scoring. Together, this combination effectively isolates unusual alerts from routine activity, reducing manual review burden and supporting efficient SOC alert prioritization.
4.6.1. Computational Complexity
Table 7 provides a detailed breakdown of per-stage inference time across embedding, structured feature encoding, clustering, and anomaly detection, enabling a clear assessment of computational efficiency. The table highlights a clear computational hierarchy across the pipeline components and datasets. Embedding generation and feature preparation incur minimal overhead, remaining well below 1 ms per alert, which supports real-time SOC deployment. Among clustering methods, GMM is by far the most computationally expensive, exceeding 30 ms per alert, whereas HDBSCAN and DBSCAN offer a more practical trade-off between expressiveness and efficiency. Dimensionality reduction via UMAP introduces moderate latency but remains tractable. In contrast, anomaly detection models (Isolation Forest, LOF, and One-Class SVM) exhibit very low inference times, confirming that the dominant computational cost lies in representation learning and clustering rather than alert scoring. Overall, the results demonstrate consistent scaling behavior across datasets and validate the feasibility of the proposed framework for high-throughput operational environments.
Table 7.
Inference Time Comparison Across Three Datasets.
4.6.2. Limitations
The three datasets, obtained from Wazuh, reflect experimental workloads, and our model was deployed at pilot scale rather than in a full-scale enterprise environment. While the framework demonstrates effective performance on these datasets, its scalability to extremely high-volume settings will require further evaluation and potential optimization. Motivated by prior work on reinforcement learning with human feedback (RLHF) using large language models [11,44,45], we explored a preliminary RLHF extension to assess feasibility. Full optimization was constrained by the computational overhead and slow convergence associated with analyst-in-the-loop training in SOC environments. Consequently, this work focuses on demonstrating an unsupervised learning framework for threat detection, anomaly identification, analyst-prioritized alerts, and operational value, rather than fully optimized RLHF. Future work will investigate more efficient reward aggregation, offline and batch RL strategies, and scalable human-feedback integration tailored to real-world SOC operations.
5. Conclusions
This study has demonstrated the development of a comprehensive AI-driven framework that integrates unsupervised learning techniques to support SOC analysts in cyber threat detection, anomaly identification, and alert prioritization. The experimental results indicate that HDBSCAN consistently outperforms DBSCAN, KMeans, and Gaussian Mixture Models in producing well-separated clusters while effectively identifying realistic noise points, enabling the differentiation of rare or anomalous alerts from routine events. This clustering capability forms a robust foundation for structured alert analysis, improved situational awareness, and efficient triage within SOC environments.
As part of the anomaly detection and prioritization workflow, Isolation Forest exhibited more stable and reliable performance than LOF and OneClassSVM across multiple datasets, providing stable anomaly flagging and clear score separation that supported effective identification of high-priority alerts, including under synthetic threat injection scenarios. The derived priority scores, combining anomaly severity, cluster rarity, and SOC contextual weighting, successfully elevated critical security-relevant alerts while suppressing noise, reducing manual review workload, and supporting more focused incident response.
When deployed within the interactive dashboard, the system enabled SOC analysts to explore top alerts, clusters, MITRE techniques, and geolocation data dynamically, providing actionable intelligence on global attack patterns and operational risks. Alerts associated with brute-force attempts, system misconfigurations, and potential compromise were prioritized effectively, while routine or low-risk events were appropriately de-emphasized. Importantly, the framework is designed to augment human analysts, ensuring responsible use of automated intelligence and maintaining human oversight in operational decision-making.
To further bridge the interpretability gap, we intend to incorporate explainable AI (XAI) modules that provide human-readable justifications for anomaly scores, thereby enhancing the trust and adoption of automated systems among SOC analysts [46]. For future work, we plan to extend this framework by integrating agentic AI to coordinate cross-domain SOC responses, enhance predictive capabilities, and further optimize alert triage, thereby strengthening proactive cyber defense and resilience in increasingly complex threat environments.
Author Contributions
E.O. and S.L. wrote the original draft, writing review, and editing; data collection by S.L.; supervision, methodology, project administration, and funding acquisition by E.O. All authors have read and agreed to the published version of the manuscript.
Funding
This research was funded by Naif Arab University for Security Sciences, grant number NAUSS-26-R03.
Data Availability Statement
All material data is available upon request to interested researchers.
Acknowledgments
The authors acknowledge the use of Grammarly for grammar correction. All changes made using this tool were reviewed by the authors, who accept full responsibility for the integrity, accuracy, and originality of the manuscript.
Conflicts of Interest
The authors declare no conflicts of interest.
Appendix A
Figure A1.
AI-driven cyber threat detection and alert prioritization dashboard, showing clustering of 10,000 events from Dataset 2 into 8 alert types, along with the top MITRE techniques, source countries, alert counts per category, and average priority ranks, providing a representative overview of the dataset.
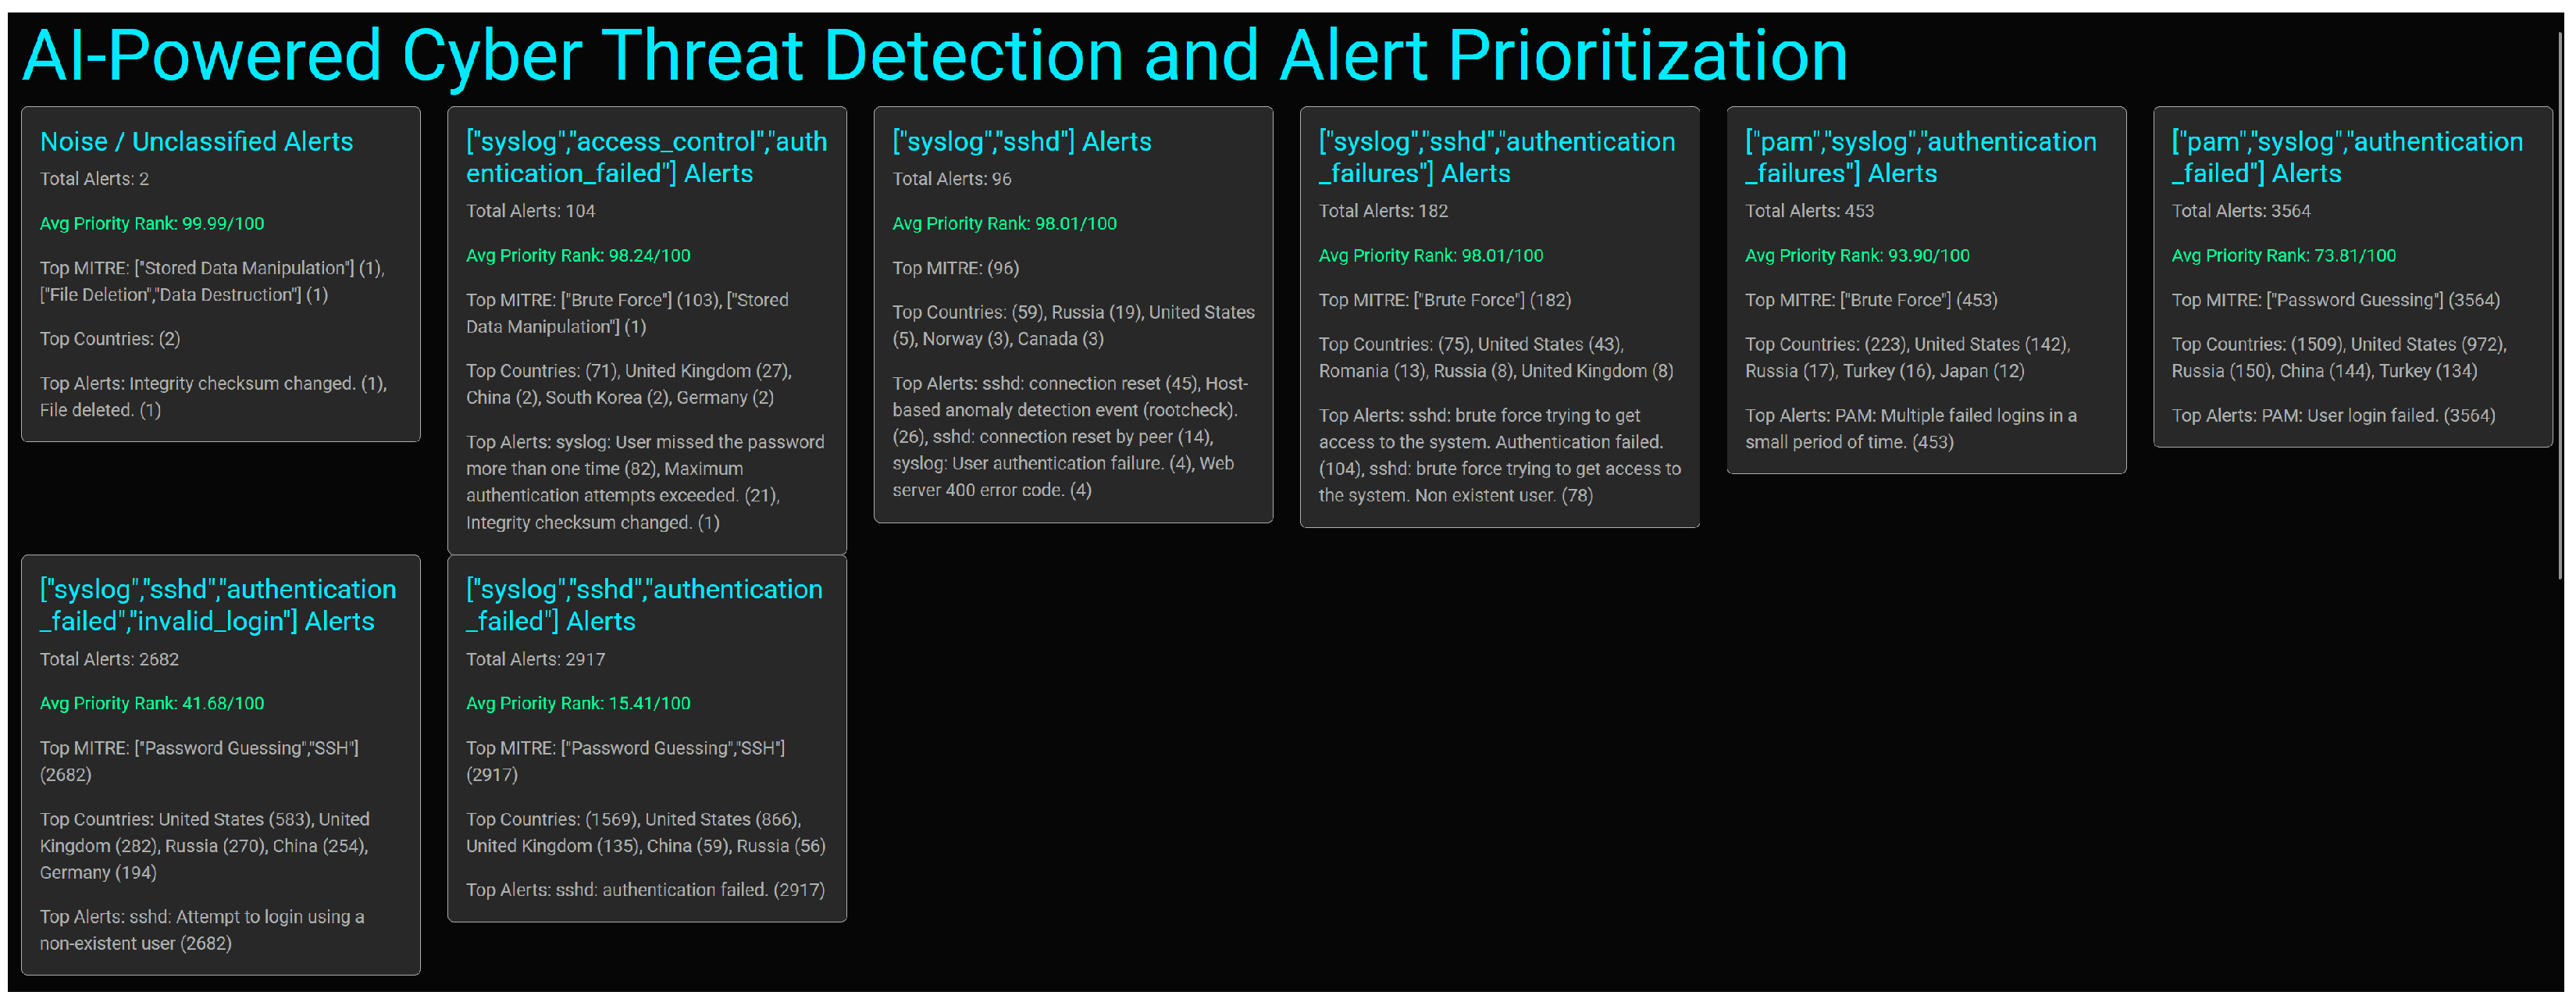
Figure A2.
HDBSCAN clustering was performed on the original high-dimensional features of Dataset 2, producing 8 clusters corresponding to real-world cyber alert categories; cluster semantics were automatically and interpretably inferred using dominant SOC rules and MITRE technique frequency analysis, with a two-dimensional UMAP projection employed solely for visualization.

Figure A3.
Distribution of MITRE ATT&CK technique frequencies in Dataset 2.
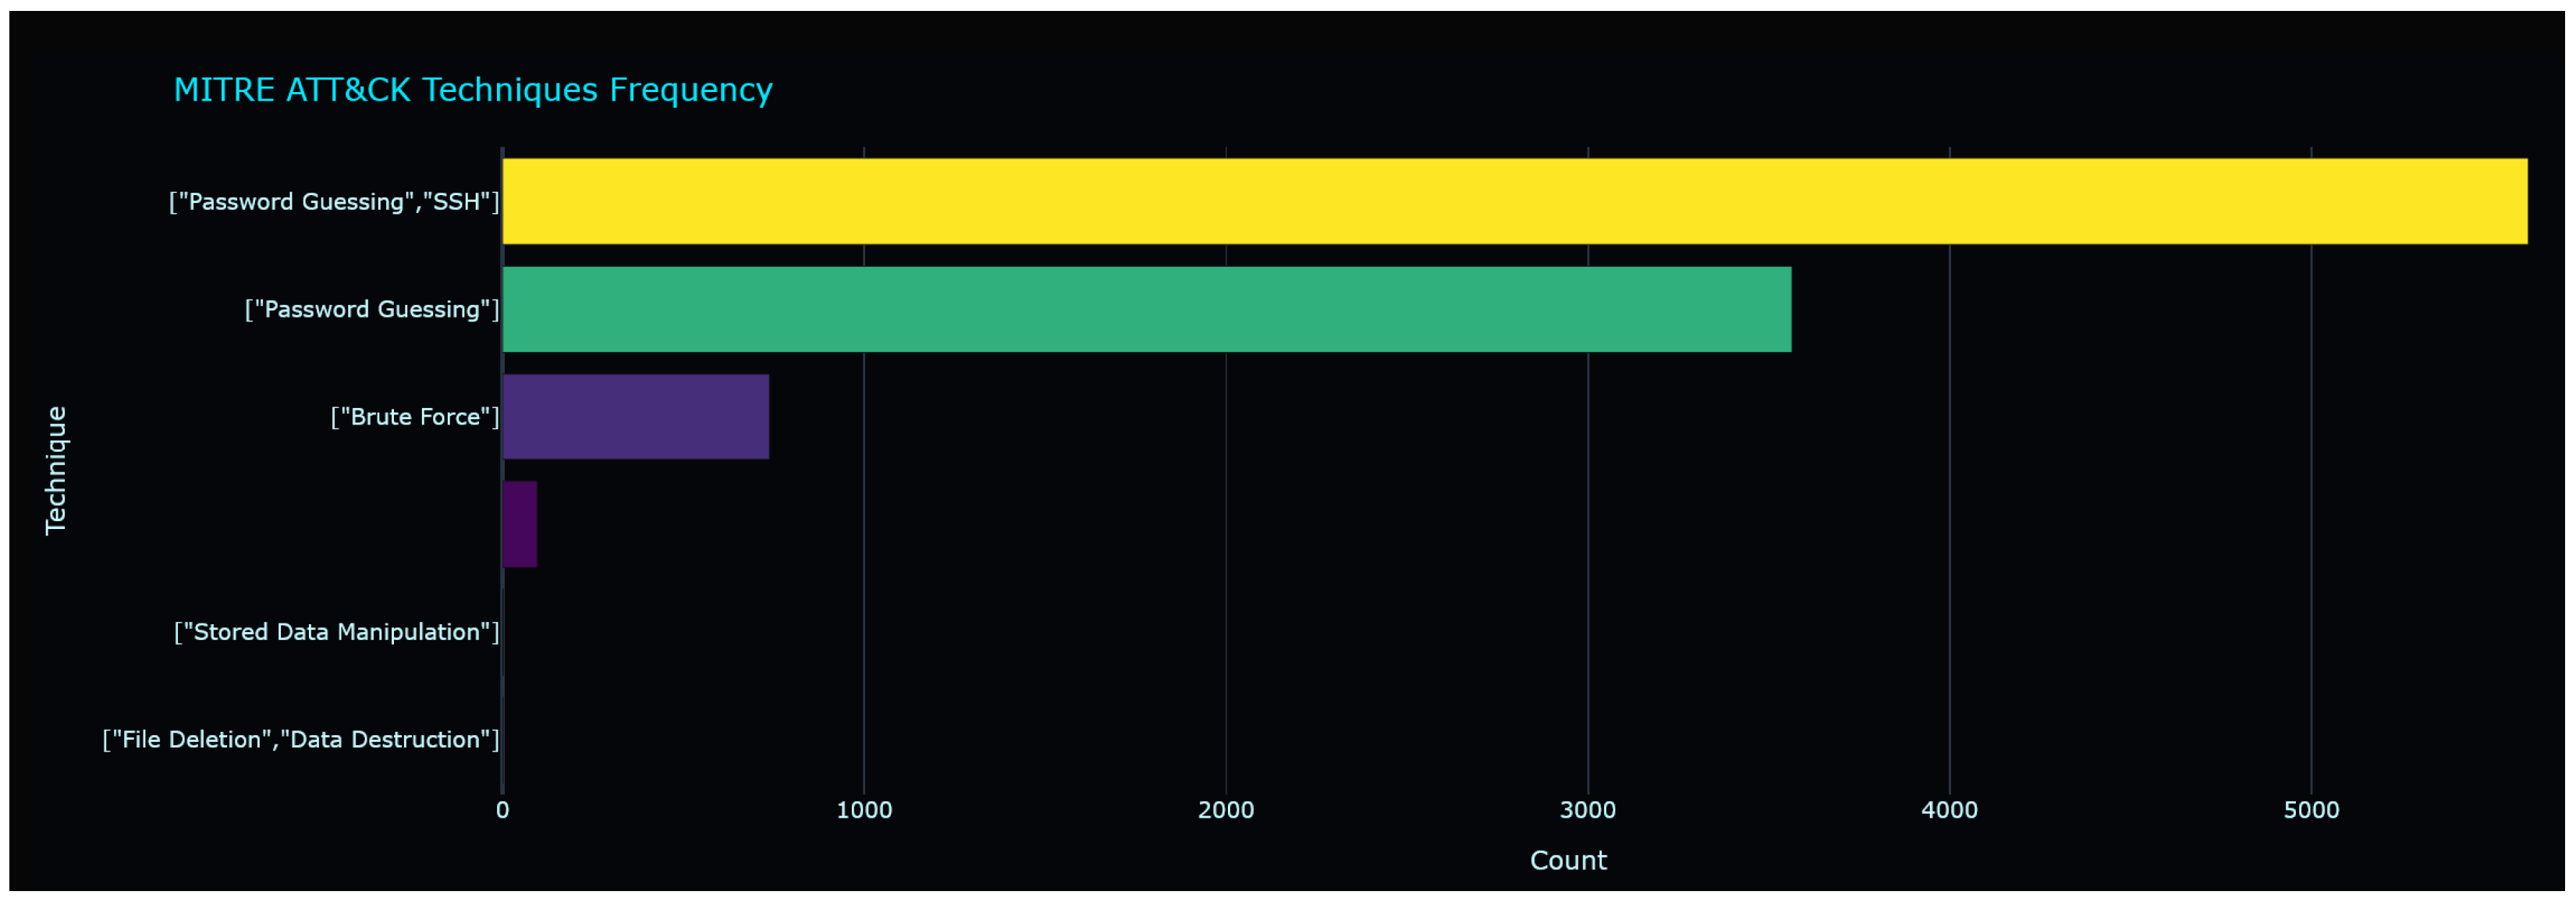
Figure A4.
Geographic distribution of attack density by country in Dataset 2.
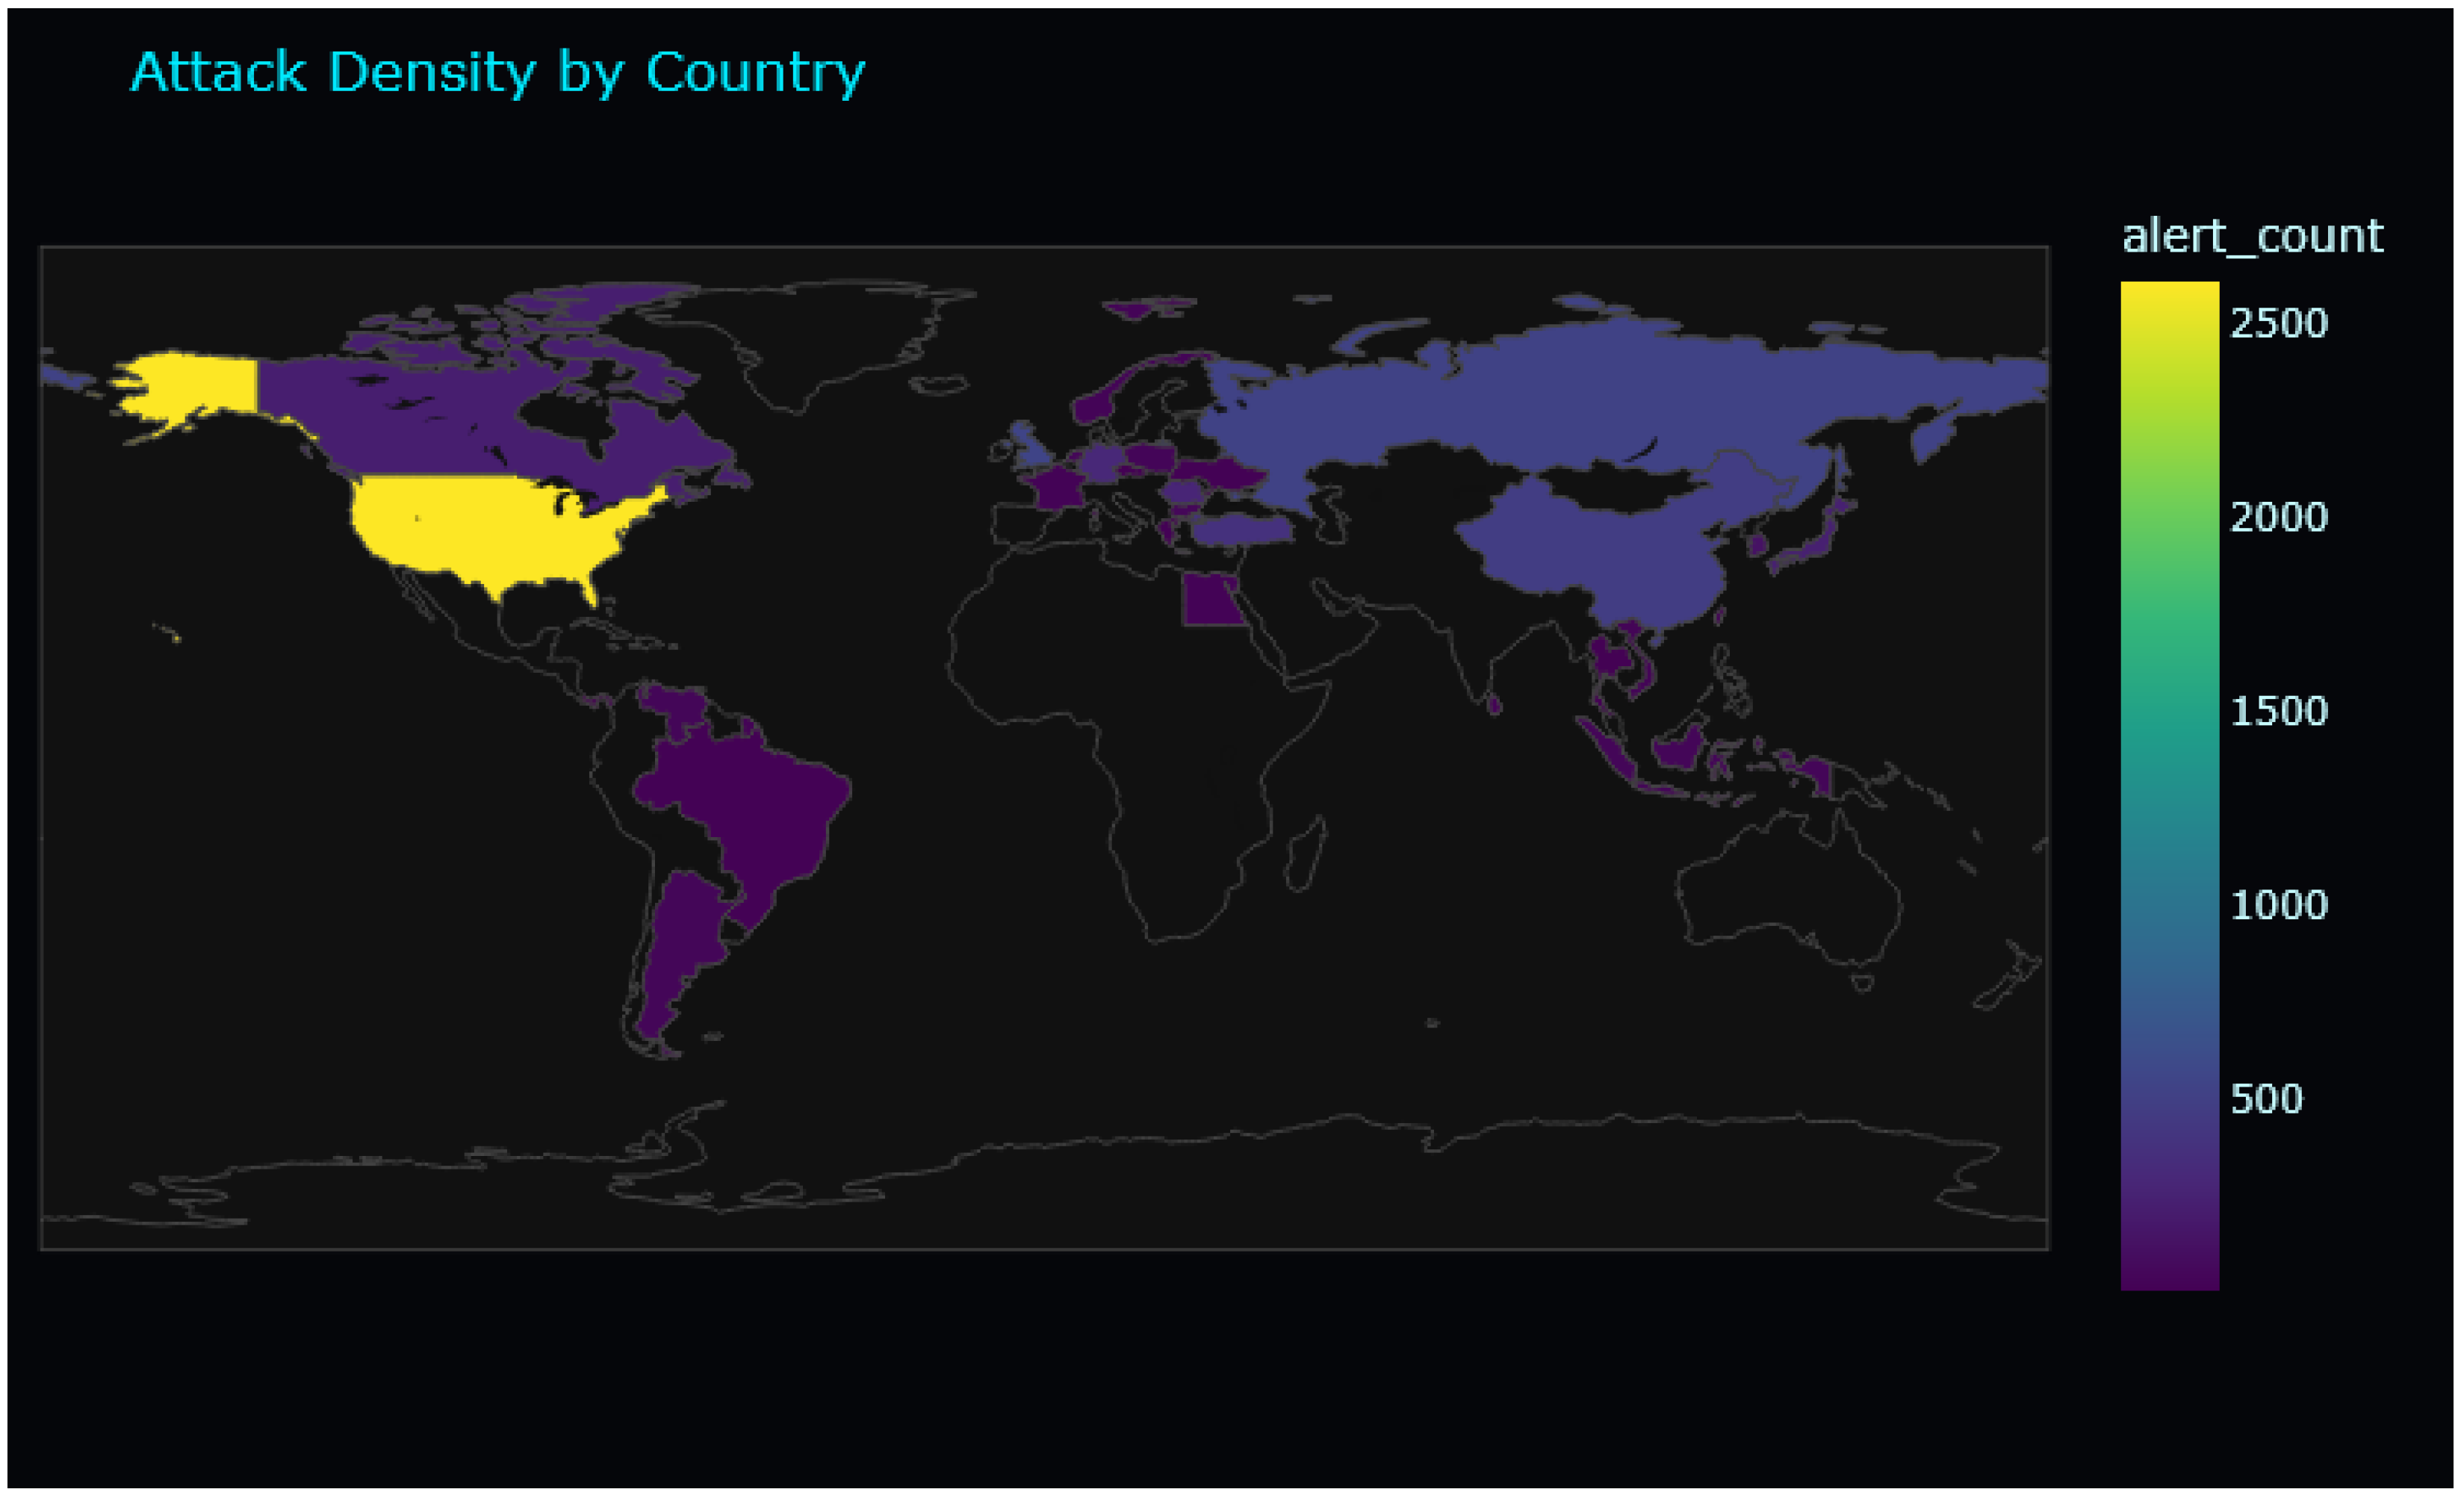
Figure A5.
AI-driven cyber threat detection and alert prioritization dashboard, showing clustering of 10,000 events from Dataset 3 into 8 alert types, along with the top MITRE techniques, source countries, alert counts per category, and average priority ranks, providing a representative overview of the dataset.
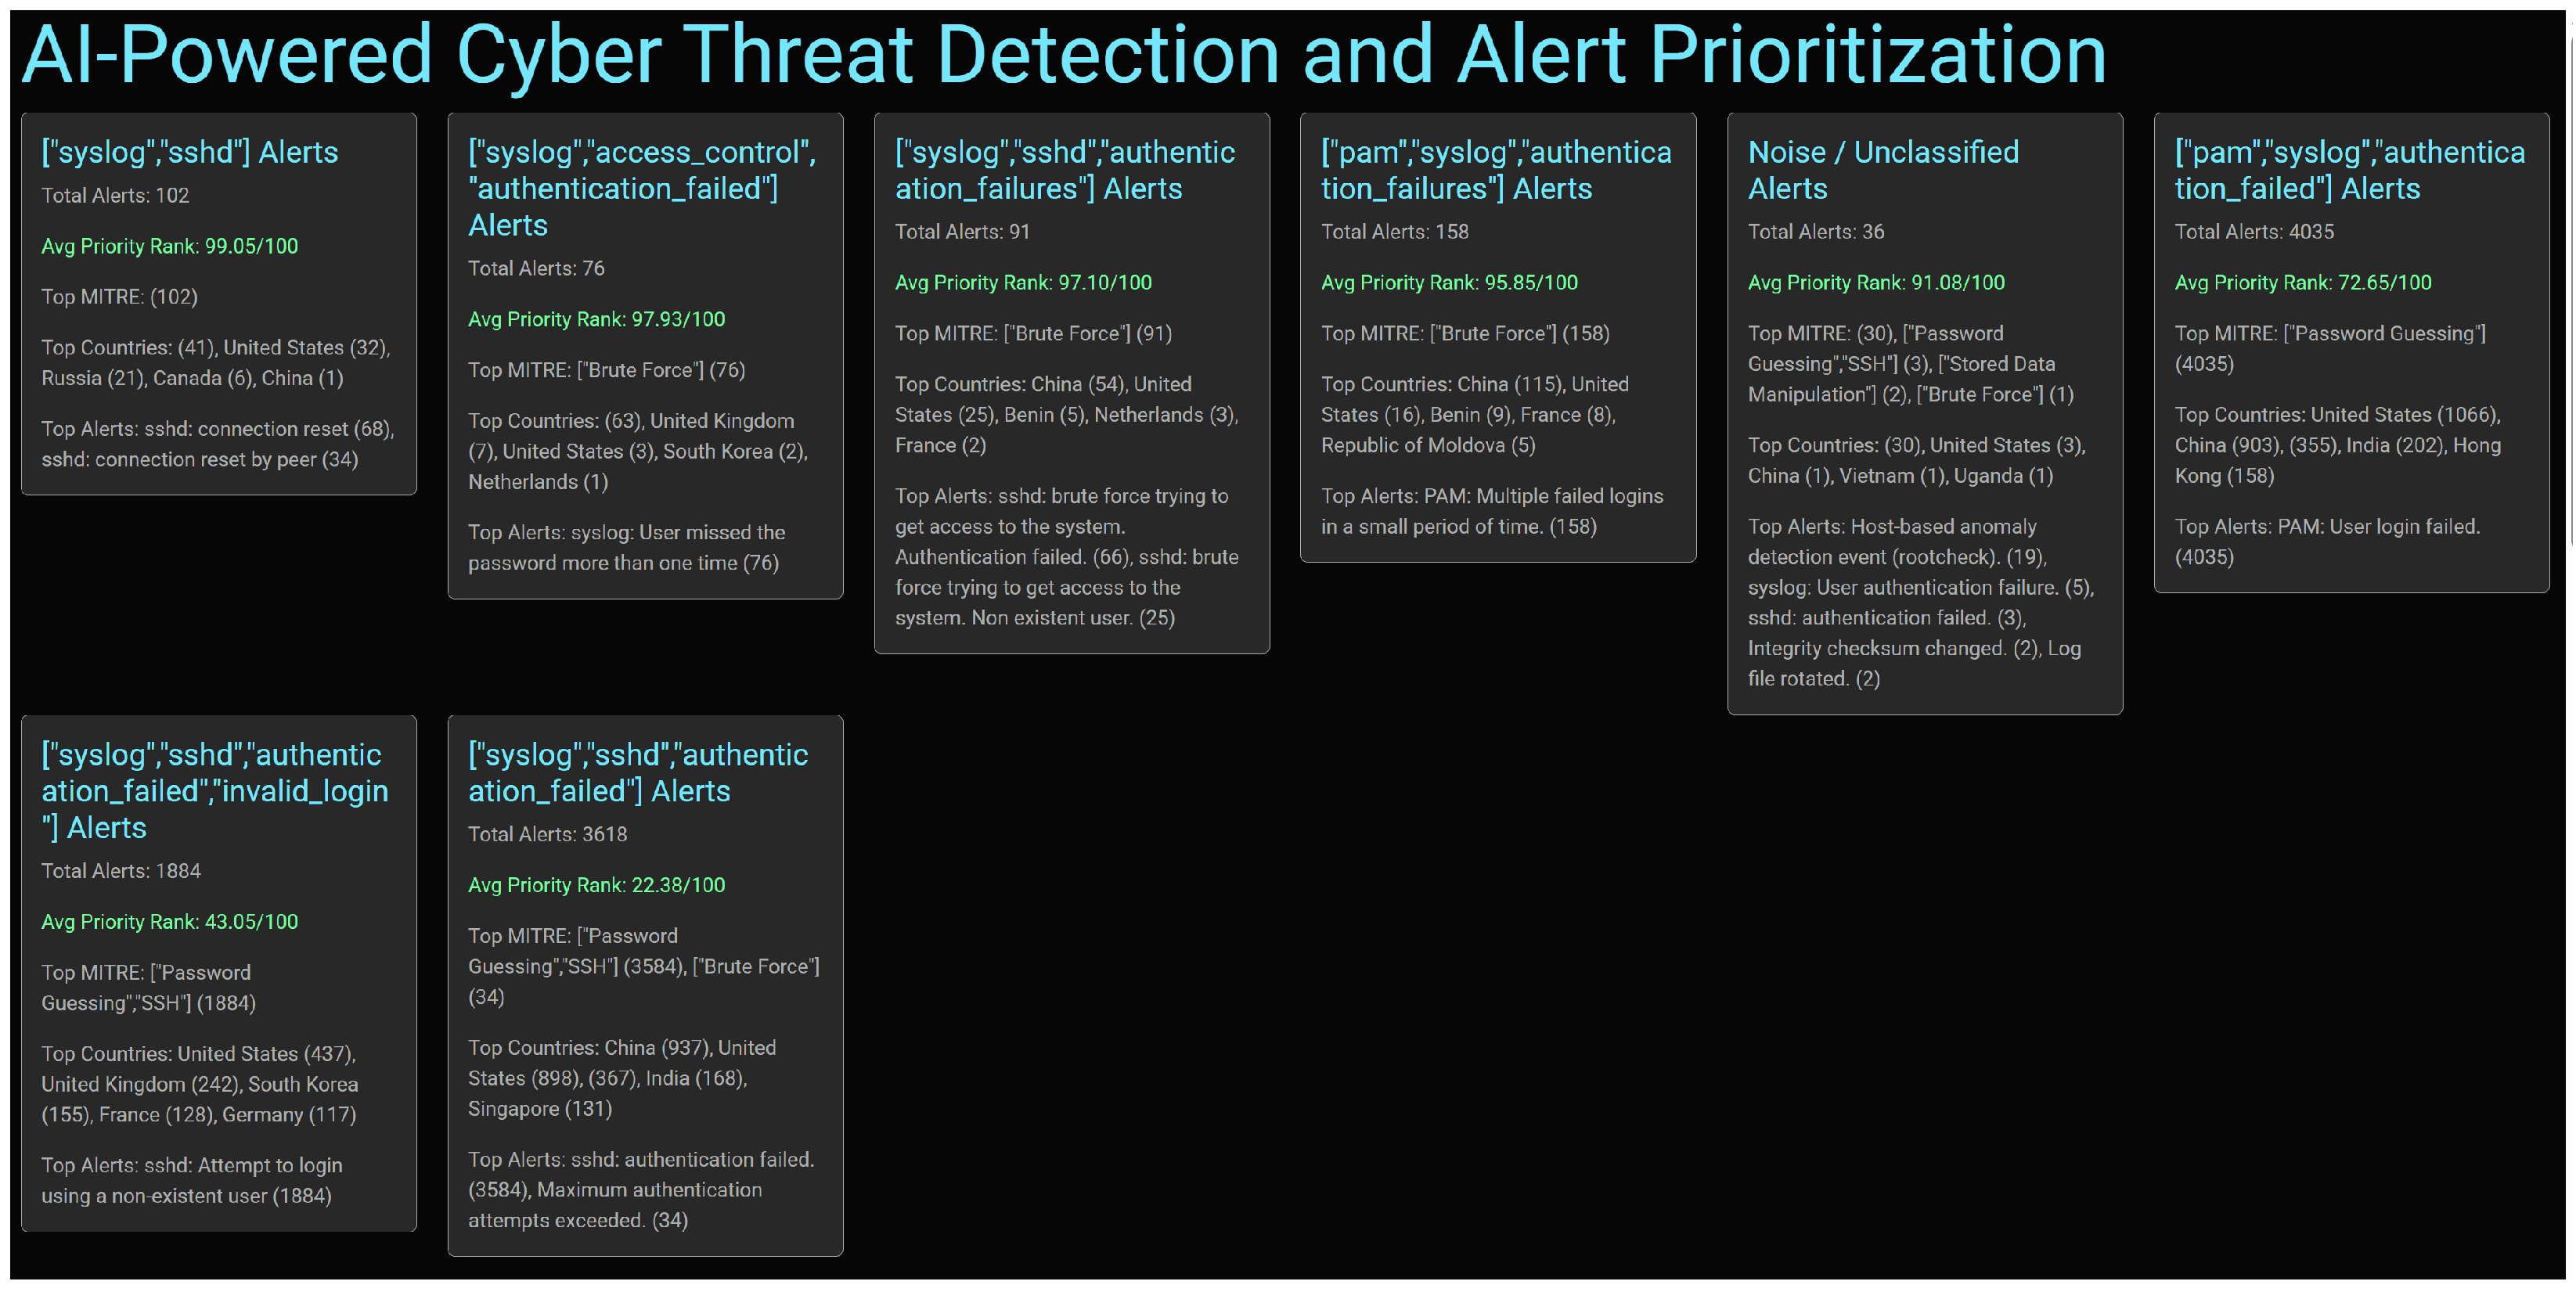
Figure A6.
HDBSCAN clustering was performed on the original high-dimensional features of Dataset 3, producing 8 clusters corresponding to real-world cyber alert categories; cluster semantics were automatically and interpretably inferred using dominant SOC rules and MITRE technique frequency analysis, with a two-dimensional UMAP projection employed solely for visualization.
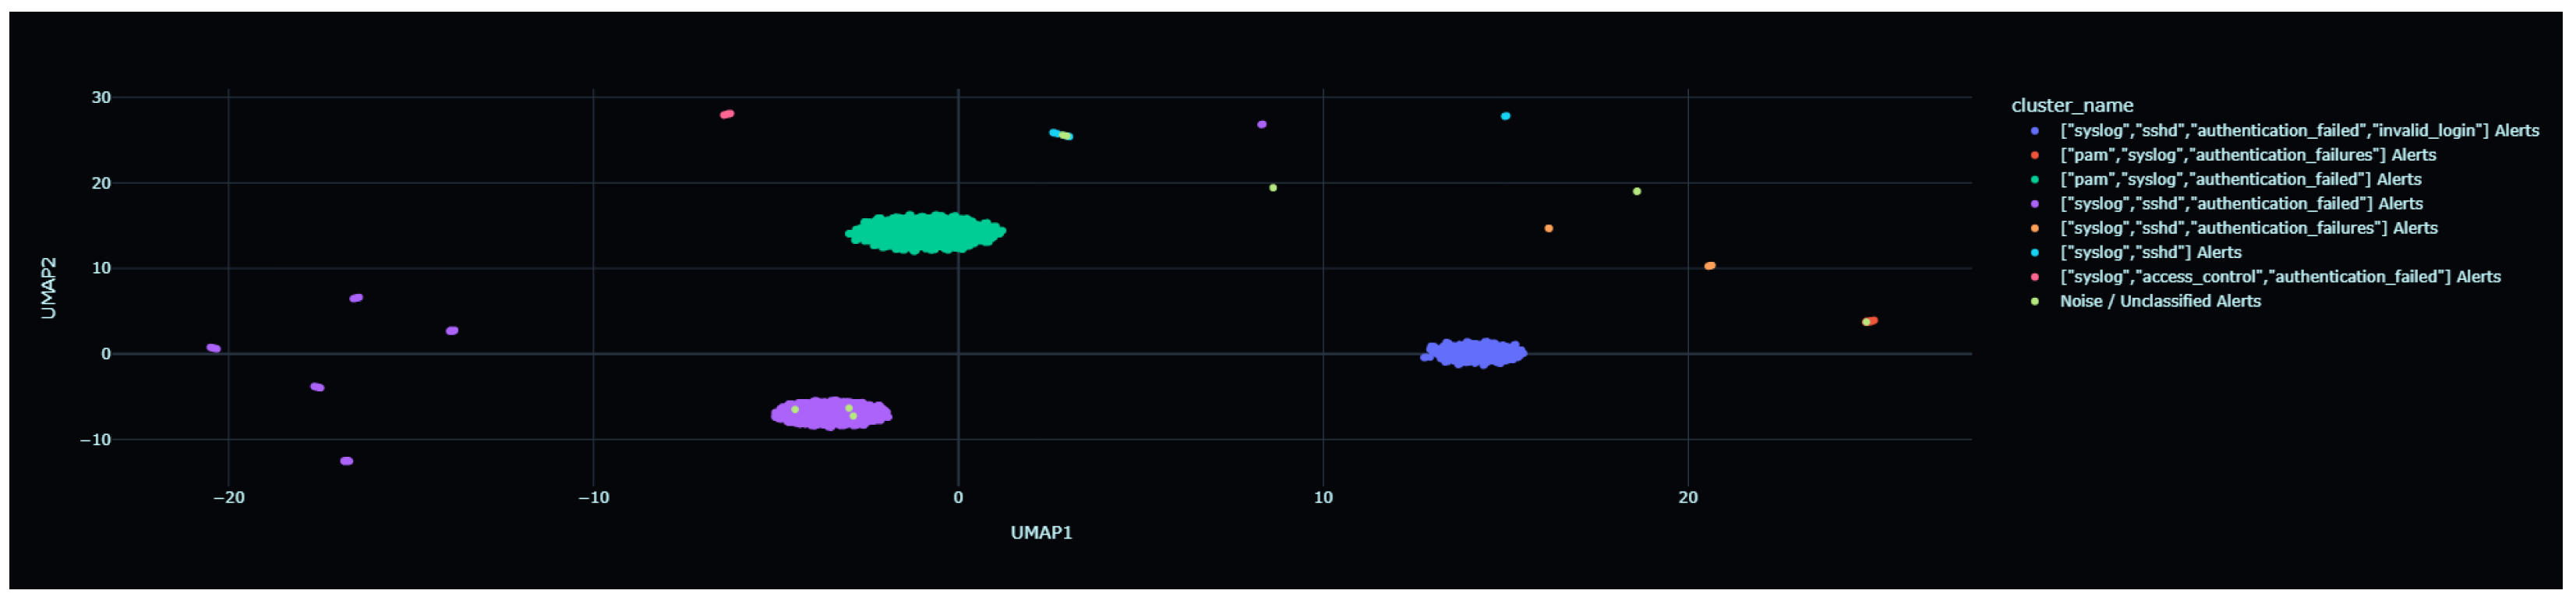
Figure A7.
Distribution of MITRE ATT&CK technique frequencies in Dataset 3.
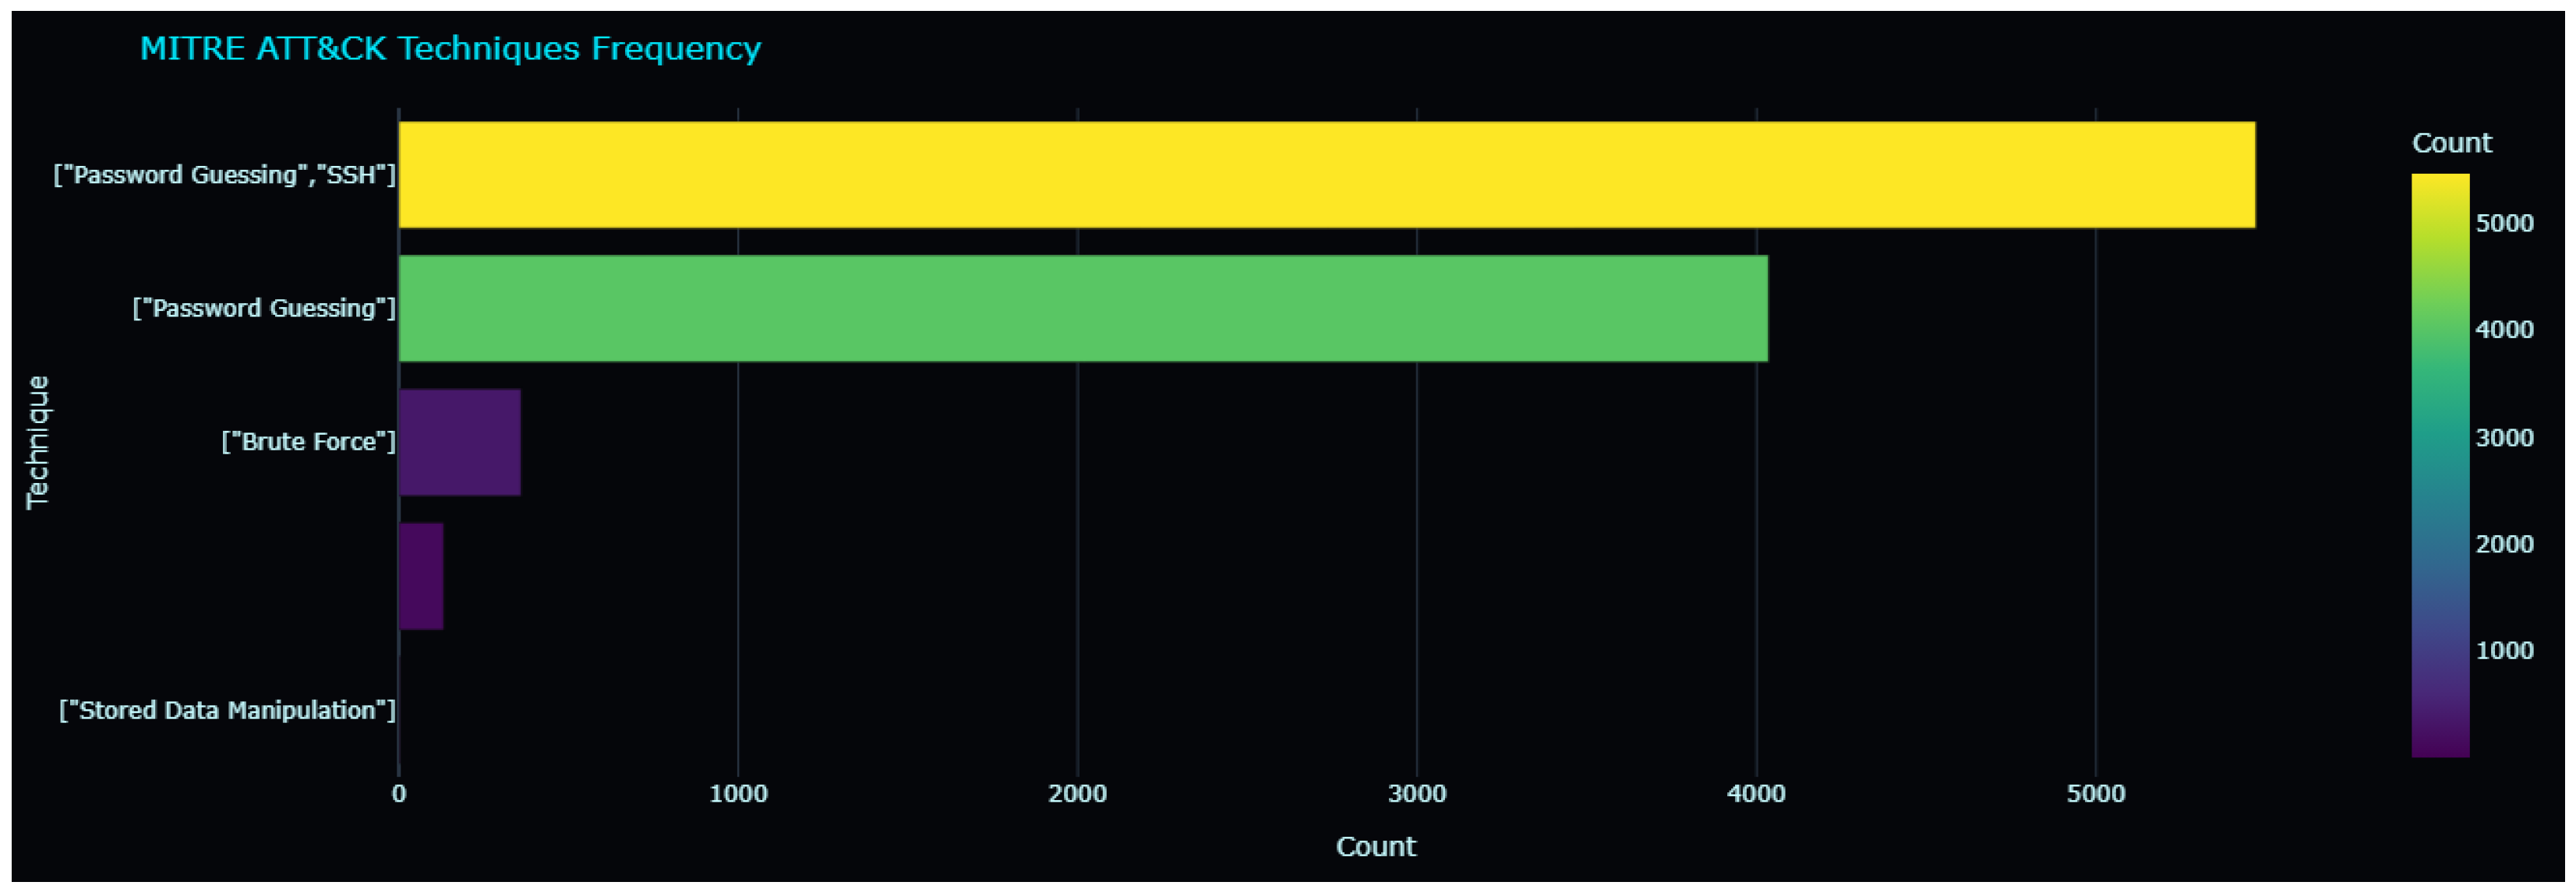
Figure A8.
Geographic distribution of attack density by country in Dataset 3.
References
- Vielberth, M.; Boehm, D.; Fichtinger, J.; Pernul, G. Security Operations Center: A Systematic Study and Open Challenges. J. Inf. Secur. Appl. 2021, 58, 102780. [Google Scholar] [CrossRef] [Scilit]
- Sundaramurthy, S.C.; Bardas, A.G.; Case, J.; Ou, X.; Wesch, M.; McHugh, J. A Human Capital Model for Mitigating Security Analyst Burnout. In Eleventh Symposium on Usable Privacy and Security (SOUPS 2015); USENIX Association: Berkeley, CA, USA, 2015; pp. 347–359. [Google Scholar]
- Vectra AI. 2023 State of Threat Detection Report. 2023. Available online: https://www.vectra.ai/resources/2023-state-of-threat-detection (accessed on 20 May 2024).
- Jalalv, F.; Baruwal Chhetri, M.; Nepal, S.; Paris, C. Alert Prioritisation in Security Operations Centres: A Systematic Survey on Criteria and Methods. ACM Comput. Surv. 2024, 57, 42. [Google Scholar] [CrossRef] [Scilit]
- Hosen, A.S.M.S.; Cho, G.H. An Anomaly Detection and Prioritization System for Smart Factory Security Using Machine Learning. Sensors 2024, 24, 567. [Google Scholar]
- Pang, G.; Shen, C.; Cao, L.; Hengel, A.V.D. Deep Learning for Anomaly Detection: A Review. ACM Comput. Surv. (CSUR) 2021, 54, 1–38. [Google Scholar] [CrossRef] [Scilit]
- Du, M.; Li, F.; Zheng, G.; Srikumar, V. DeepLog: Anomaly Detection and Diagnosis from System Logs through Deep Learning. In Proceedings of the 2017 ACM SIGSAC Conference on Computer and Communications Security, Dallas, TX, USA, 30 Octobe–3 November 2017; Association for Computing Machinery: New York, NY, USA, 2017; pp. 1285–1298. [Google Scholar]
- Meng, W.; Liu, Y.; Zhu, Y.; Zhang, S.; Pei, D.; Liu, Y.; Chen, Y.; Zhang, R.; Tao, S.; Sun, P.; et al. LogAnomaly: Unsupervised Detection of Sequential and Quantitative Anomalies in Unstructured Logs. In Proceedings of the Twenty-Eighth International Joint Conference on Artificial Intelligence (IJCAI), Macao, China, 10–16 August 2019; pp. 4739–4745. [Google Scholar]
- Guo, H.; Yuan, S.; Wu, X. LogBERT: Log Anomaly Detection via BERT. In Proceedings of the 2021 International Joint Conference on Neural Networks (IJCNN), Shenzhen, China, 18–22 July 2021; IEEE: New York, NY, USA, 2021; pp. 1–8. [Google Scholar]
- Landauer, M.; Onder, S.; Skopik, F.; Wurzenberger, M. Deep Learning for Log-Based Anomaly Detection: A Survey. Mach. Learn. Appl. 2023, 12, 100470. [Google Scholar]
- Jalalvand, F.; Chhetri, M.B.; Nepal, S.; Paris, C. Adaptive alert prioritisation in security operations centres via learning to defer with human feedback. arXiv 2025, arXiv:2506.18462. [Google Scholar] [CrossRef] [Scilit]
- Milajerdi, S.M.; Gjomemo, R.; Eshete, B.; Sekar, R.; Vullikanti, V. HOLMES: Real-time APT Detection through Correlation of Suspicious Information Flows. In Proceedings of the IEEE Symposium on Security and Privacy (SP), San Francisco, CA, USA, 19–23 May 2019; IEEE: New York, NY, USA, 2019; pp. 1137–1152. [Google Scholar]
- Catuogno, L.; Galdi, C. On the Automated Triage of Security Alerts. IEEE Access 2021, 9, 46612–46625. [Google Scholar]
- Ring, M.; Wunderlich, S.; Scheuring, D.; Landes, D.; Hotho, A. A Survey of Network-based Intrusion Detection Data Sets. Comput. Secur. 2019, 86, 147–167. [Google Scholar] [CrossRef] [Scilit]
- Sharafaldin, S.I.; Lashkari, A.H.; Ghorbani, A.A. Toward Generating a New Intrusion Detection Dataset and Intrusion Traffic Characterization. ICISSp 2018, 1, 108–116. [Google Scholar]
- Alzahrani, I.Y.; Lee, S.; Kim, K. Enhancing Cyber-Threat Intelligence in the Arab World: Leveraging IoC and MISP Integration. Electronics 2024, 13, 2526. [Google Scholar] [CrossRef] [Scilit]
- Guo, W.; Mu, D.; Xu, J.; Su, P.; Wang, G.; Cao, X. Lemna: Explaining Deep Learning based Security Applications. In Proceedings of the 2018 ACM SIGSAC Conference on Computer and Communications Security, Toronto, ON, Canada, 15–19 October 2018; Association for Computing Machinery: New York, NY, USA, 2018; pp. 364–379. [Google Scholar]
- Prasanga, D.G.T.; Gutierrez, J.A.; Ray, S.K. The Role of Graph Neural Networks, Transformers, and Reinforcement Learning in Network Threat Detection: A Systematic Literature Review. Electronics 2025, 14, 4163. [Google Scholar] [CrossRef] [Scilit]
- Oh, S.H.; Kim, J.; Nah, J.H.; Park, J. Employing deep reinforcement learning to cyber-attack simulation for enhancing cybersecurity. Electronics 2024, 13, 555. [Google Scholar] [CrossRef] [Scilit]
- El Amin, H.; Samhat, A.E.; Chamoun, M.; Oueidat, L.; Feghali, A. An integrated approach to cyber risk management with cyber threat intelligence framework to secure critical infrastructure. J. Cybersecur. Priv. 2024, 4, 357–381. [Google Scholar] [CrossRef] [Scilit]
- Chamkar, S.A.; Zaydi, M.; Maleh, Y.; Gherabi, N. Improving Threat Detection in Wazuh Using Machine Learning Techniques. J. Cybersecur. Priv. 2025, 5, 34. [Google Scholar] [CrossRef] [Scilit]
- Mrabet, M. TrustFed-CTI: A Trust-Aware Federated Learning Framework for Privacy-Preserving Cyber Threat Intelligence Sharing Across Distributed Organizations. Future Internet 2025, 17, 512. [Google Scholar] [CrossRef] [Scilit]
- Salah, K.; Kahtani, A. Reducing false positives in intrusion detection systems using cloud-based honeypot. IEEE Access 2015, 3, 521–534. [Google Scholar]
- Chandola, V.; Banerjee, A.; Kumar, V. Anomaly detection: A survey. ACM Comput. Surv. (CSUR) 2009, 41, 15. [Google Scholar] [CrossRef] [Scilit]
- Goldstein, M.; Uchida, S. A comparative evaluation of unsupervised anomaly detection algorithms for multivariate data. PLoS ONE 2016, 11, e0152173. [Google Scholar] [CrossRef] [Scilit]
- Das, S.; Liu, Y.; Zhang, W.; Chandramohan, M. Semantics-based online malware detection: Towards efficient real-time protection against malware. IEEE Trans. Inf. Forensics Secur. 2015, 11, 289–302. [Google Scholar] [CrossRef] [Scilit]
- Edwards, B.; Hofmeyr, S.; Forrest, S. Hype and heavy tails: A closer look at data breaches. J. Cybersecur. 2016, 2, 3–14. [Google Scholar] [CrossRef] [Scilit]
- Kokulu, F.B.; Soneji, A.; Bao, T.; Shoshitaishvili, Y.; Zhao, Z.; Doupé, A.; Ahn, G.-J. Matched and mismatched SOCs: A qualitative study on security operations center issues. In Proceedings of the 2019 ACM SIGSAC Conference on Computer and Communications Security, London, UK, 11–15 November 2019; ACM: New York, NY, USA, 2019; pp. 1955–1970. [Google Scholar]
- Hassan, W.U.; Guo, S.; Li, D.; Chen, Z.; Wood, K.; Zou, Z.; Wang, W.; Yu, Z.; Zhao, B.; Hua, J.; et al. NoDoze: Combatting Threat Alert Fatigue with Automated Provenance Analysis. In Proceedings of the Network and Distributed System Security Symposium (NDSS), San Diego, CA, USA, 24–27 February 2019; Internet Society: Fredericksburg, VA, USA, 2019. [Google Scholar] [CrossRef] [Scilit]
- Churu, M.; Blaauw, D.; Watson, B. A review and analysis of cybersecurity threats and vulnerabilities, by development of a fuzzy rule-based expert system. In Proceedings of the Pan African Conference on Artificial Intelligence; Springer: Berlin/Heidelberg, Germany, 2023; pp. 151–168. [Google Scholar]
- Landauer, M.; Skopik, F.; Wurzenberger, M.; Rauber, A. Dynamic log clustering for heuristics mining in security operations centers. Comput. Secur. 2020, 96, 101878. [Google Scholar]
- Ghojogh, B.; Crowley, M.; Karray, F.; Ghodsi, A. Uniform manifold approximation and projection (UMAP). In Elements of Dimensionality Reduction and Manifold Learning; Springer: Berlin/Heidelberg, Germany, 2023; pp. 479–497. [Google Scholar]
- Artioli, P.; Maci, A.; Magrì, A. A comprehensive investigation of clustering algorithms for User and Entity Behavior Analytics. Front. Big Data 2024, 7, 1375818. [Google Scholar] [CrossRef] [Scilit] [PubMed]
- Campello, R.J.; Moulavi, D.; Sander, J. Density-based clustering based on hierarchical density estimates. In Proceedings of the Pacific-Asia Conference on Knowledge Discovery and Data Mining; Springer: Berlin/Heidelberg, Germany, 2013; pp. 160–172. [Google Scholar]
- McInnes, L.; Healy, J.; Astels, S. hdbscan: Hierarchical density based clustering. J. Open Source Softw. 2017, 2, 205. [Google Scholar] [CrossRef] [Scilit]
- Maiti, A.; Chakraborty, R.; Basu, D.; Sarkar, I.; Dutta, A. Unsupervised Pattern Discovery in Cyber Incidents Using Principal Component Analysis K-Means DBSCAN and Isolation Forest. In Proceedings of the International Conference on Data Science and Network Engineering; Springer: Berlin/Heidelberg, Germany, 2025; pp. 314–324. [Google Scholar]
- Steinley, D. K-means clustering: A half-century synthesis. Br. J. Math. Stat. Psychol. 2006, 59, 1–34. [Google Scholar] [CrossRef] [Scilit] [PubMed]
- Happa, J. Insider-threat detection using gaussian mixture models and sensitivity profiles. Comput. Secur. 2018, 77, 838–859. [Google Scholar] [CrossRef] [Scilit]
- Murphy, K.P. Machine Learning: A Probabilistic Perspective; MIT Press: Cambridge, MA, USA, 2012. [Google Scholar]
- Liu, F.T.; Ting, K.M.; Zhou, Z.H. Isolation forest. In Proceedings of the 2008 Eighth IEEE International Conference on Data Mining, 15–19 December 2008; IEEE: New York, NY, USA, 2008; pp. 413–422. [Google Scholar]
- Breunig, M.M.; Kriegel, H.P.; Ng, R.T.; Sander, J. LOF: Identifying density-based local outliers. In Proceedings of the 2000 ACM SIGMOD International Conference on Management of Data, Dallas, TX, USA, 15–18 May 2000; Association for Computing Machinery: New York, NY, USA, 2000; pp. 93–104. [Google Scholar]
- Schölkopf, B.; Platt, J.C.; Shawe-Taylor, J.; Smola, A.J.; Williamson, R.C. Estimating the support of a high-dimensional distribution. Neural Comput. 2001, 13, 1443–1471. [Google Scholar] [CrossRef] [Scilit]
- Turcotte, M.; Labrèche, F.; Paquette, S.O. Automated Alert Classification and Triage (AACT): An Intelligent System for the Prioritisation of Cybersecurity Alerts. arXiv 2025, arXiv:2505.09843. [Google Scholar] [CrossRef] [Scilit]
- Ouyang, L.; Wu, J.; Jiang, X.; Almeida, D.; Wainwright, C.; Mishkin, P.; Zhang, C.; Agarwal, S.; Slama, K.; Ray, A.; et al. Training language models to follow instructions with human feedback. Adv. Neural Inf. Process. Syst. 2022, 35, 27730–27744. [Google Scholar]
- Wong, M.F.; Tan, C.W. Aligning crowd-sourced human feedback for reinforcement learning on code generation by large language models. IEEE Trans. Big Data 2024. [Google Scholar] [CrossRef] [Scilit]
- Sunkara, G. Explainable AI for cyber threat intelligence: Enhancing analyst trust. Open Access Res. J. Sci. Technol. (OARJST) 2025, 14, 29–40. [Google Scholar] [CrossRef] [Scilit]





Disclaimer/Publisher’s Note: The statements, opinions and data contained in all publications are solely those of the individual author(s) and contributor(s) and not of MDPI and/or the editor(s). MDPI and/or the editor(s) disclaim responsibility for any injury to people or property resulting from any ideas, methods, instructions or products referred to in the content. |
© 2026 by the authors. Licensee MDPI, Basel, Switzerland. This article is an open access article distributed under the terms and conditions of the Creative Commons Attribution (CC BY) license.