


Abstract
This paper presents a novel system for estimating 3D athlete pose, boom angle, and rudder angle in Olympic dinghy sailing using onboard 360° video footage. The proposed approach integrates adaptive panorama slicing, keypoint-based rig detection, and geometric ray-casting into an end-to-end pipeline for quantitative performance analysis under real-world on-water conditions. Traditionally, restrictive International Laser Class Association (ILCA) rules have prohibited advanced sensor systems during competition. However, recent rule changes permit a single onboard camera, enabling unobtrusive and rule-compliant measurement solutions. The purpose of this study is to evaluate whether a competition-legal 360° camera combined with computer vision can provide meaningful performance-related measurements in Olympic sailing. The experimental results indicate that computer-vision-based analysis can complement traditional performance assessment and provide access to data previously limited to physical sensors or manual estimation. The system can support teams and coaches in identifying technique-related performance opportunities.
Keywords:
ILCA; laser dinghy; 360° camera; YOLO; computer vision; Olympic sailing; sports; machine learning; deep learning; MediaPipe 1. Introduction
The ILCA class, formerly known as the Laser, is among the most accessible sailing classes, which makes it highly competitive due to its unified and simple design. With a single sail, no trapeze, minimal rigging, and its one-design philosophy, competitive differences emerge through athlete skill rather than equipment advantages [1]. In Olympic dinghy racing, the objective is to complete a predefined course around marker buoys in the water as quickly as possible. The fastest route depends primarily on environmental factors, such as wind and waves, but also on tactics and interactions with other dinghies in the race. A typical course consists of upwind, downwind, and broad-reach sections, often called legs [2,3]. Each leg demands different tactical approaches, setups, and physical techniques from the athlete [4]. In upwind sailing, progress is achieved through a technique called tacking. A tack is defined as a change in course sweeping through the source direction of the wind. Upwind sailing is performed at an angle to the wind, typically around 45 degrees. The wind generates forces on the sail, resulting in a heeling moment on the dinghy, which if left uncompensated, reduces performance or, in the worst case, causes capsizing. To counteract this heel moment, the sailor performs a technique known as hiking [5,6].
Hiking involves the athlete suspending their body weight outboard over the windward side of the hull, with their hips positioned on the top edge along the dinghy’s side. To support themselves, they hook their feet under a hiking strap mounted in the middle of the dinghy, using their core and leg muscles to maintain their position [2,7,8]. The forces generated by the sailor’s body weight, acting at a distance from the dinghy’s center line, create a counterbalancing moment for the the sail’s heel moment [9].
Maintaining an optimal heel angle, which depends on the wind, is important for keeping the dinghy within its performance window [10]. A flatter dinghy reduces the weather helm, which is the tendency of the dinghy to round up into the wind. This also minimizes the corrective rudder input required from the sailor, which, in turn, reduces hydrodynamic drag and requires less energy from the sailor’s arms [4]. Research agrees that hiking is the most physically demanding activity in dinghy sailing, thereby limiting maximum performance under medium-to-strong wind conditions [2,11,12].
Despite its importance, analyzing an athlete’s hiking performance under race conditions remains challenging. Current methods for assessing hiking performance rely on either subjective coach observation, post-race video reviews, or using dedicated sensor systems [9,11,13]. Furthermore, using such instrumentation can be prohibited in racing, unlike the single camera that recent changes now allow [14,15].
The use of 360° cameras in sports performance tracking is a relatively new field, as these cameras have only recently become more commercially available [16]. The current use of these cameras in the field of sports seems limited; in [17], the authors combine 360° cameras with planar cameras for tracking players on a basketball court. Previous research in other fields utilizes body-mounted cameras for pose estimation [18,19]. Furthermore, several studies have employed 360° videos together with VR for training purposes [20,21,22,23].
This study presents an automated system for detecting athlete poses in 3D, hiking positions, and boat rig motion through a boom-mounted 360° camera, using an end-to-end pipeline that combines adaptive panorama slicing, keypoint-based rig detection, and ray-casting. This manuscript first details the proposed pipeline and experimental setup, followed by the results and reflections from initial on-water testing. In doing so, we aim to address a gap in the literature by analyzing athlete-specific motion data obtained during on-water training and competition. Such data, as emphasized in [24], is of primary interest to athletes, teams, and coaches. The main contribution of this study lies in the integration of multiple computer vision components into a single end-to-end competition-legal pipeline for Olympic sailing. The system combines adaptive panorama slicing, which enables the use of conventional pose estimation methods on equirectangular imagery. Keypoint-based detection of rig components and ray-casting detected poses enable 3D athlete poses to be created within the dinghy’s reference frame. This approach allows for a simultaneous analysis of athlete motion and rig dynamics from a single onboard camera under realistic sailing conditions.
The proposed approach enables coaches to quantify hiking efficiency, identify asymmetries between port and starboard tacks, and monitor longitudinal performance improvements. The system also estimates rudder and boom angles. By consolidating equipment angle sensing and athlete tracking into a single camera-based system, the proposed approach offers an unobtrusive, automated performance analysis suitable for both training and competition environments.
2. Software Approach, Data Collection, and Test Setup
This section presents an experimental setup for data acquisition and describes the technical architecture for a vision-based athlete tracking system. The system processes a 360° video and outputs a 3D pose of the athlete in the dinghy’s coordinate frame in addition to boom and rudder angle estimates. The system is product-agnostic and can work with any high-resolution 360° camera, as well as any ILCA-class dinghy due to its non-permanent mounting.
2.1. Hardware and Test Setup
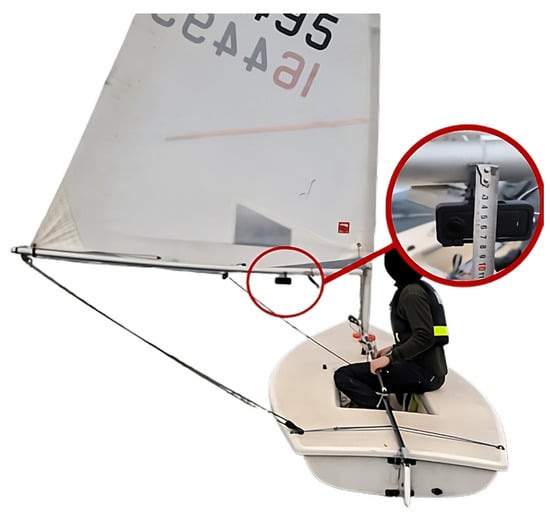
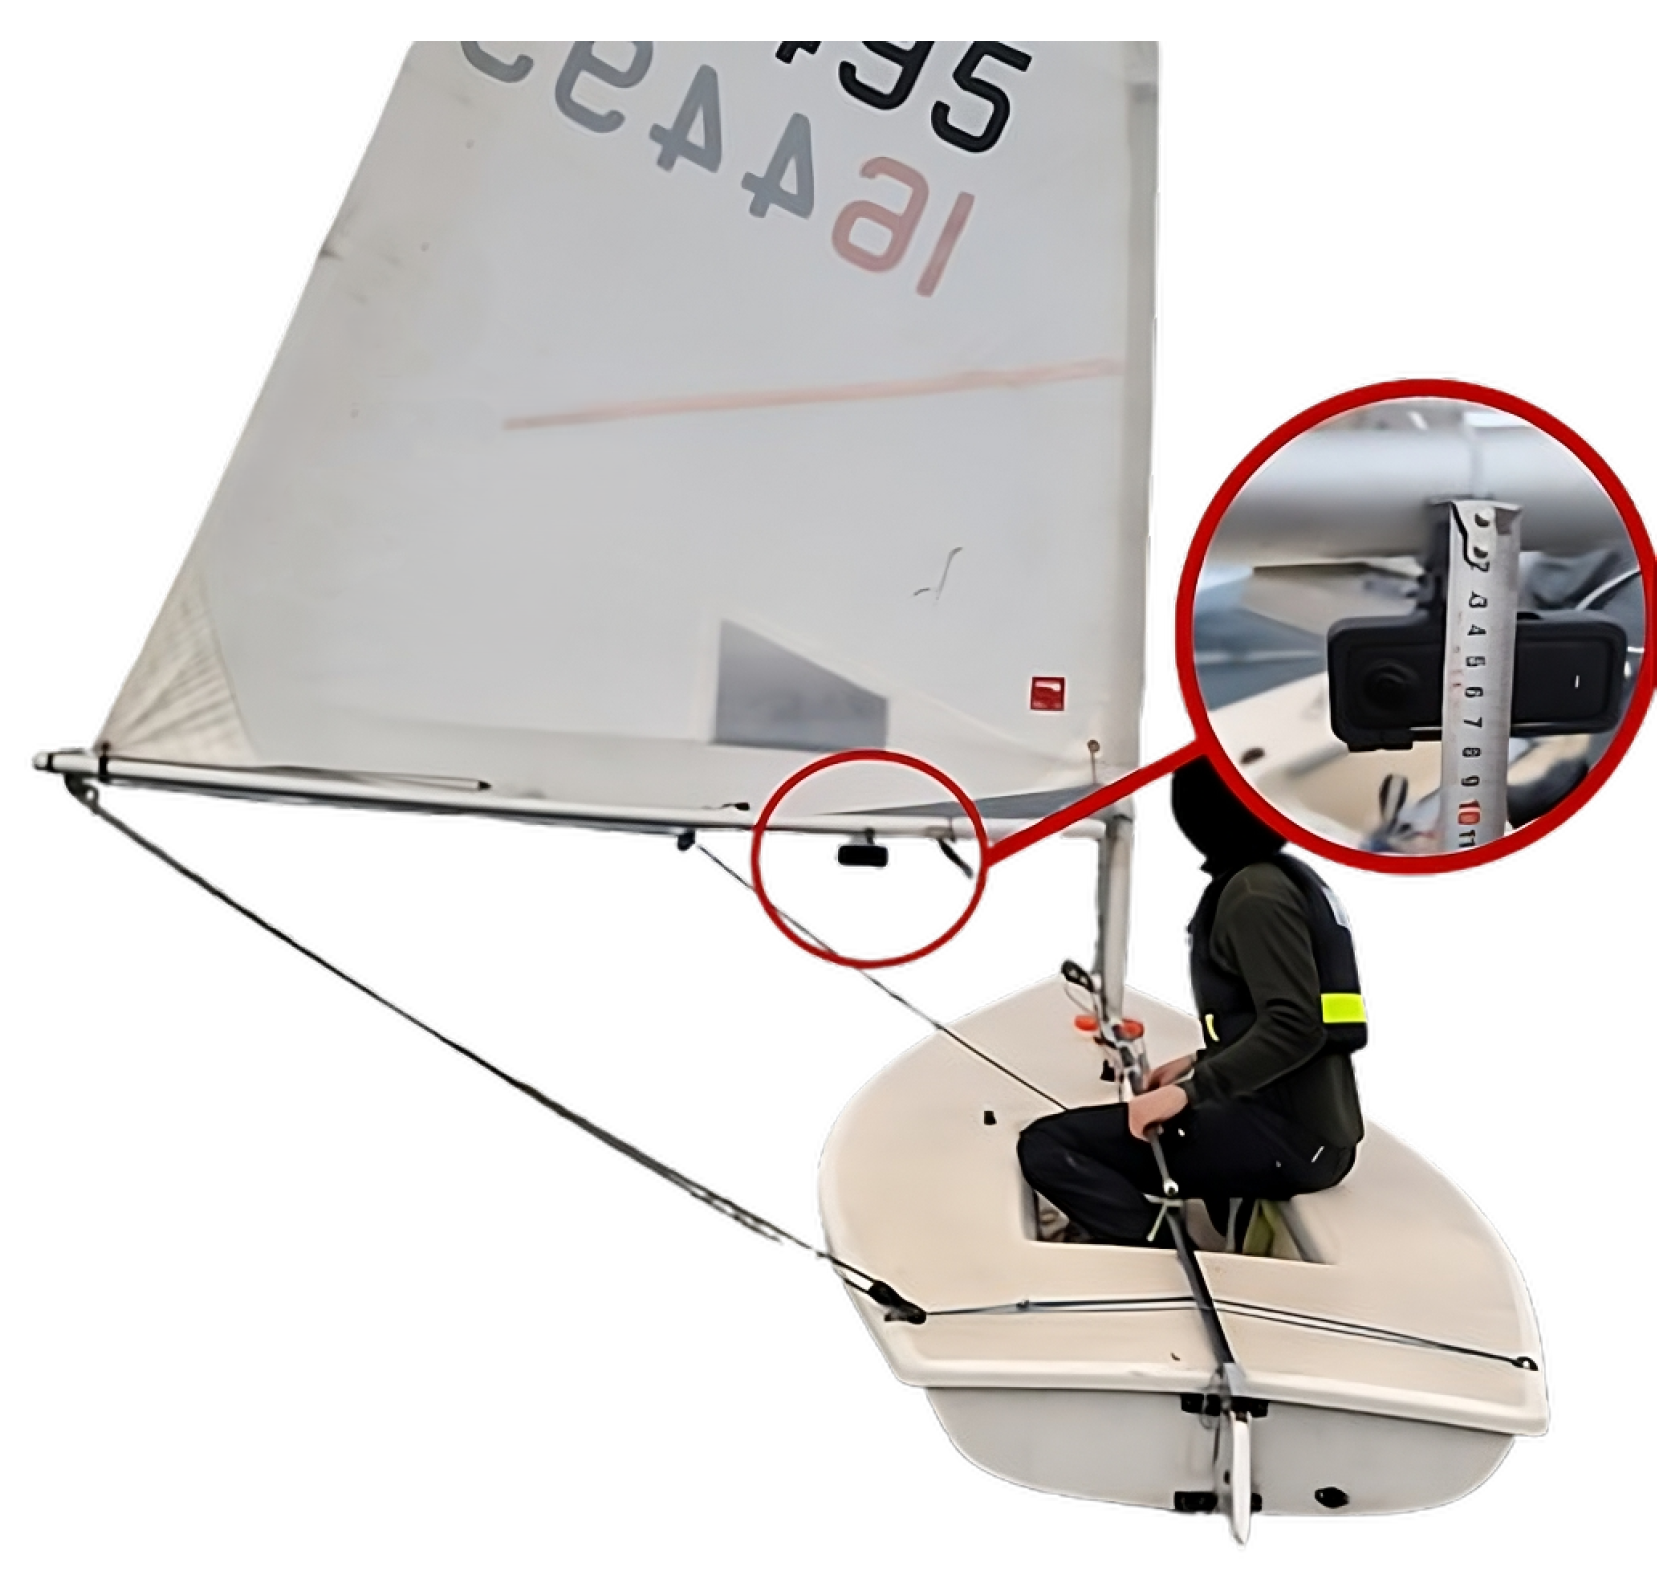
The hardware utilized in this test was an Insta360 X4 camera [25] mounted to the boom using a modified version of an open-source 3D-printed mounting bracket [26] (Figure 1).
Figure 1.
Mounting of camera to boom on the ILCA 7 during on-water data collection.
2.2. System Overview
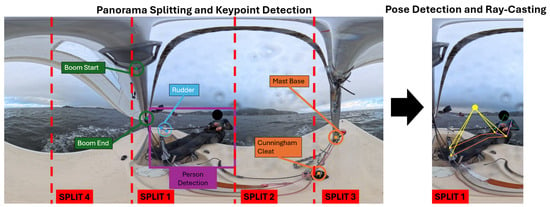
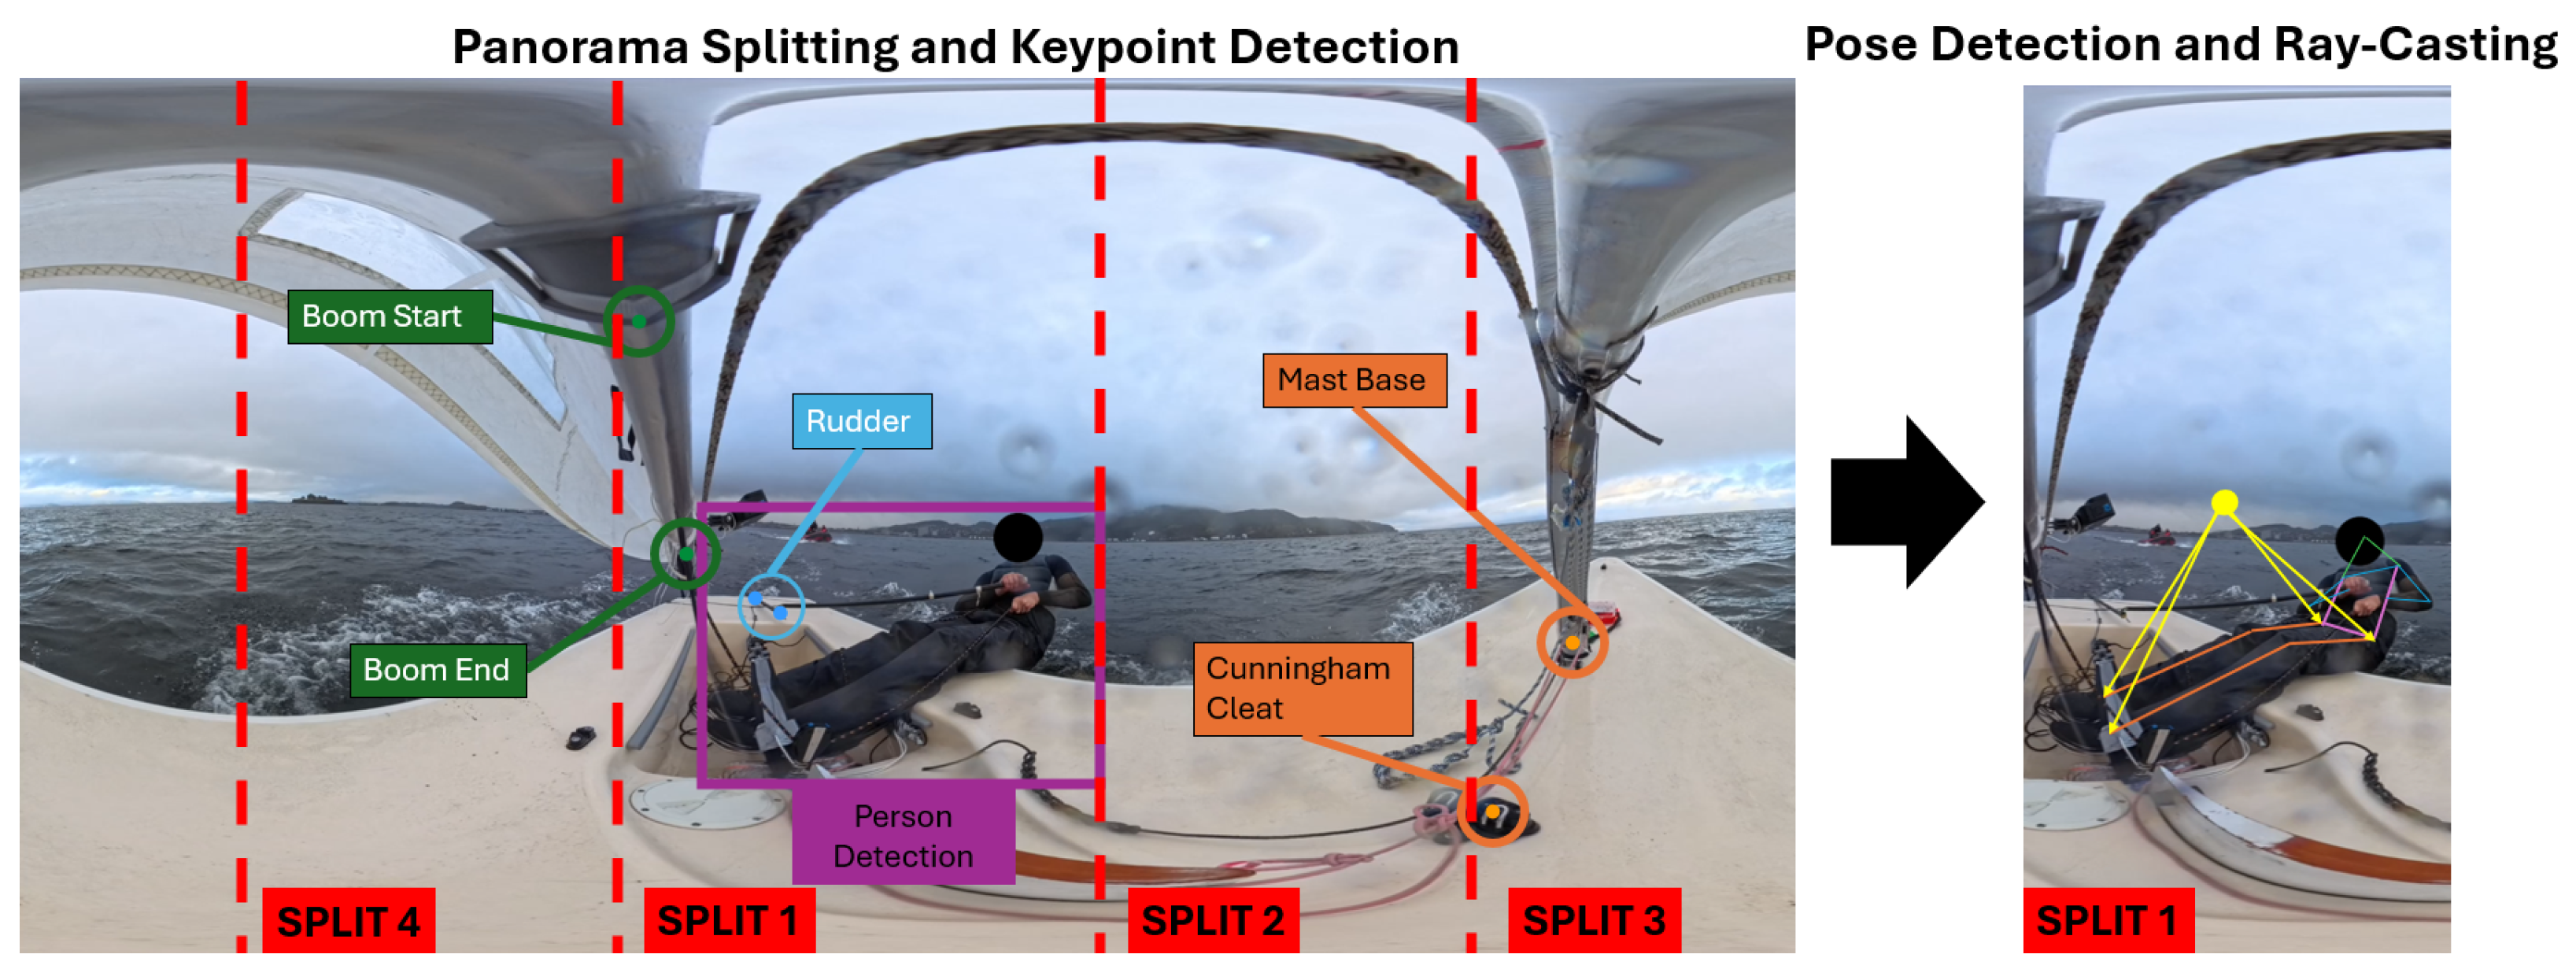
The system works using the following pipeline format (Figure 2):
Figure 2.
Overview of the proposed end-to-end pipeline for rig angle estimation and 3D athlete pose reconstruction from 360° video.
- Adaptive panorama slicing: the 360° frame is decomposed into four perspective projections while avoiding splitting the frames on top of the potential bounding box of the athlete.
- Keypoint detection: a keypoint-based detection model identifies the boom, rudder, and dinghy center line, enabling the computation of their angles.
- Athlete Pose Detection: A 2D pose estimation model localizes the sailor’s keypoints within the panoramic frame.
- Three-dimensional pose estimation: a monocular 3D pose estimation network reconstructs the athlete’s skeleton in a camera-centric coordinate system.
- Scene integration: ray-casting places the 3D skeleton within the dinghy’s coordinate frame.
2.3. Equirectangular Projection and Panorama Slicing
The camera-captured 360° imagery was processed as an equirectangular projection that mapped the spherical camera view onto a rectangular image spanning 360° horizontally and 180° vertically. In this representation, the horizontal axis corresponds to azimuth angle and the vertical axis corresponds to elevation angle . A pixel at coordinates in an image of dimensions maps to the following spherical angles:
While an equirectangular projection preserves the full spherical field of view, it introduces distortion, particularly near the poles, which degrades the performance of vision models trained on normal images [27].
2.3.1. Adaptive Slicing
To increase the accuracy of standard pose detection architectures, the equirectangular panorama was decomposed into four perspective slices, each spanning 90° of the horizontal field of view [27]. To eliminate the risk of bisecting the athlete at slice boundaries, a YOLOv8 person detection model first scanned the full equirectangular frame to localize the athlete’s bounding box [28]. The slice boundaries were then computed such that the athlete’s centroid was positioned at the center of one slice, while adjacent slices were adjusted accordingly while maintaining equal widths. This helped keep the athlete contained within a single-perspective view, reducing the need for cross-slice pose reconstruction.
2.3.2. Camera Positioning and Keypoint Detection
The camera was mounted on the boom at a fixed offset distance from the mast and at a height above the deck. As the boom rotated by angle relative to the centreline, the camera position in the dinghy’s coordinate frame was as follows:
where the sign of the y-component depends on whether the boom is to the port or starboard side. To estimate camera orientation, the boom angle must first be determined. In this case, a YOLOv8N-Pose architecture [28] was trained to detect the following:
- Boom: two points on the boom.
- Rudder: two points on the tiller.
- Center line: the mast base and the Cunningham cleat.
The model was trained on a manually annotated dataset of 266 images, using a 77–23% split between training and validation data. The dataset was collected under realistic on-water conditions and used to fine-tune a lightweight keypoint-based model for robust detection of rigid rig components with limited appearance variability. For each object class, two keypoints define an axis.
2.3.3. Calculating Boom and Rudder Angles
The equirectangular images can be represented as a sphere, where straight lines in 3D space project as great-circle arcs. This relation can be used to compute the angular relationship between the detected objects. For each pair of keypoints and , the corresponding 3D unit vectors and are computed via the spherical projection, where the spherical angles and are defined in Equations (1) and (2) as follows:
The great-circle arc connecting these points lies in a plane passing through the sphere’s origin. The plane’s orientation is characterized by its normal vector:
Then, the angle between two objects (e.g., the boom and center line) is computed as the dihedral angle between their respective planes:
The relative port/starboard positions of the objects are determined by evaluating the sign of the cross product between the center line vector and the direction vector corresponding to each component.
2.4. Athlete Pose Estimation
Reconstructing a 3D pose from a single 2D image is challenging due to the lack of depth information. To address this, the system uses MediaPipe, which is a 3D pose estimation framework that combines 2D keypoint detection with a learned 3D lifting network [29]. Each slice containing the athlete is processed by MediaPipe, which outputs the following:
- Two-dimensional landmarks: pixel coordinates for 33 body landmarks.
- Three-dimensional world landmarks: metric coordinates in a camera-centric reference frame.
2.5. Positioning the 3D Pose
The basis of this method is an algorithm that combines the 3D pose output of the MediaPipe skeleton with a method to place this skeleton onto the dinghy’s reference frame using geometric ray-casting. This method assumes that, during normal hiking, the athlete’s ankles and hips remain at approximately constant heights. Hiking constrains the athlete’s feet under the hiking strap and the athlete’s hips to the deck level. Under these conditions, ankle and hip joints can be treated as height-constrained reference points and be used for geometric triangulation to provide absolute positioning. This assumption represents a first-order approximation of the athlete’s posture during steady-state hiking. Deviations from this assumption, such as vertical displacement of the hips or ankles, introduce corresponding errors in the estimated horizontal position. The sensitivity of the method to such deviations is discussed further in Section 4. For each 2D hip and ankle keypoint , a ray is constructed from the camera position in direction [30]:
Here, represents the distance from the camera along the ray, and the direction vector is obtained by converting the pixel coordinates to a unit sphere direction, with manually obtained calibration offsets applied to compensate for camera yaw and pitch.
Two horizontal reference planes are defined, namely a lower plane at and an upper plane at , which are defined as the heights of the ankles and the hips during normal hiking. The intersection of ankle rays with the lower plane and hip rays with the upper plane yields four anchor points in the dinghy’s coordinate frame. The 3D output skeleton from MediaPipe is transformed to align with the geometric anchors via a rigid-body transformation [29]:
The transformation parameters consist of a scale factor s, computed as the ratio of the Euclidean distance between the hip and ankle anchor points to the corresponding distance of the 3D skeleton. A rotation about the vertical axis, selected to align the left to right hip vector of the 3D skeleton, with the corresponding vector found in the anchor points, as well as a translation vector , are used to align the centroid of the MediaPipe ankles with the centroid of the ankle anchor points. This method allows the superimposition to preserve the proportions found by MediaPipe while placing the skeleton at the geometrically determined position.
2.6. Field Test
A single sea trial was carried out to collect data for the development of this system. It was performed with the help of a male top athlete in the Trondheim Fjord, Norway. In this test, data was gathered from upwind, downwind, and broad-reach legs. The athlete was instructed to sail and hike normally. The test was performed close to the Ocean Lab weather buoy operated by The Foundation for Industrial and Technical Research (SINTEF) [31], which allowed for the collection of weather data within the time frame of the test, as shown in Table 1 below.
Table 1.
Wind conditions during testing (14 October 2025).
3. Results
This section presents the analysis of a 5 min recorded segment with the athlete sailing under upwind conditions. During this segment, the athlete performed three tacks and spent most of the time sailing on a single tack, with shorter periods on the opposite tack. We will present the results gathered for the boom and rudder angles, 3D athlete pose and position estimation, and trunk angle analysis.
3.1. Boom and Rudder Angle Detection
Of the 8978 frames analyzed in the segment, valid boom angles were successfully detected in 7391 frames (82.3%) and valid rudder angles were detected in 7952 frames (88.6%). Due to the absence of ground truth data, quantitative accuracy metrics are not reported, and the results are interpreted based on visual verification against the original footage.
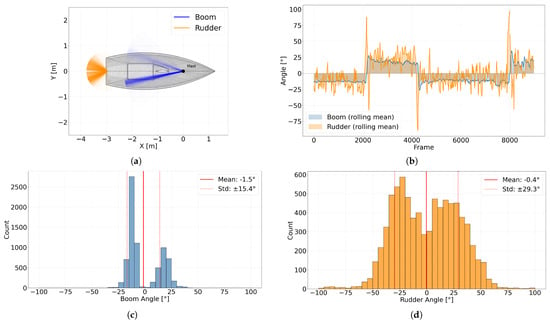
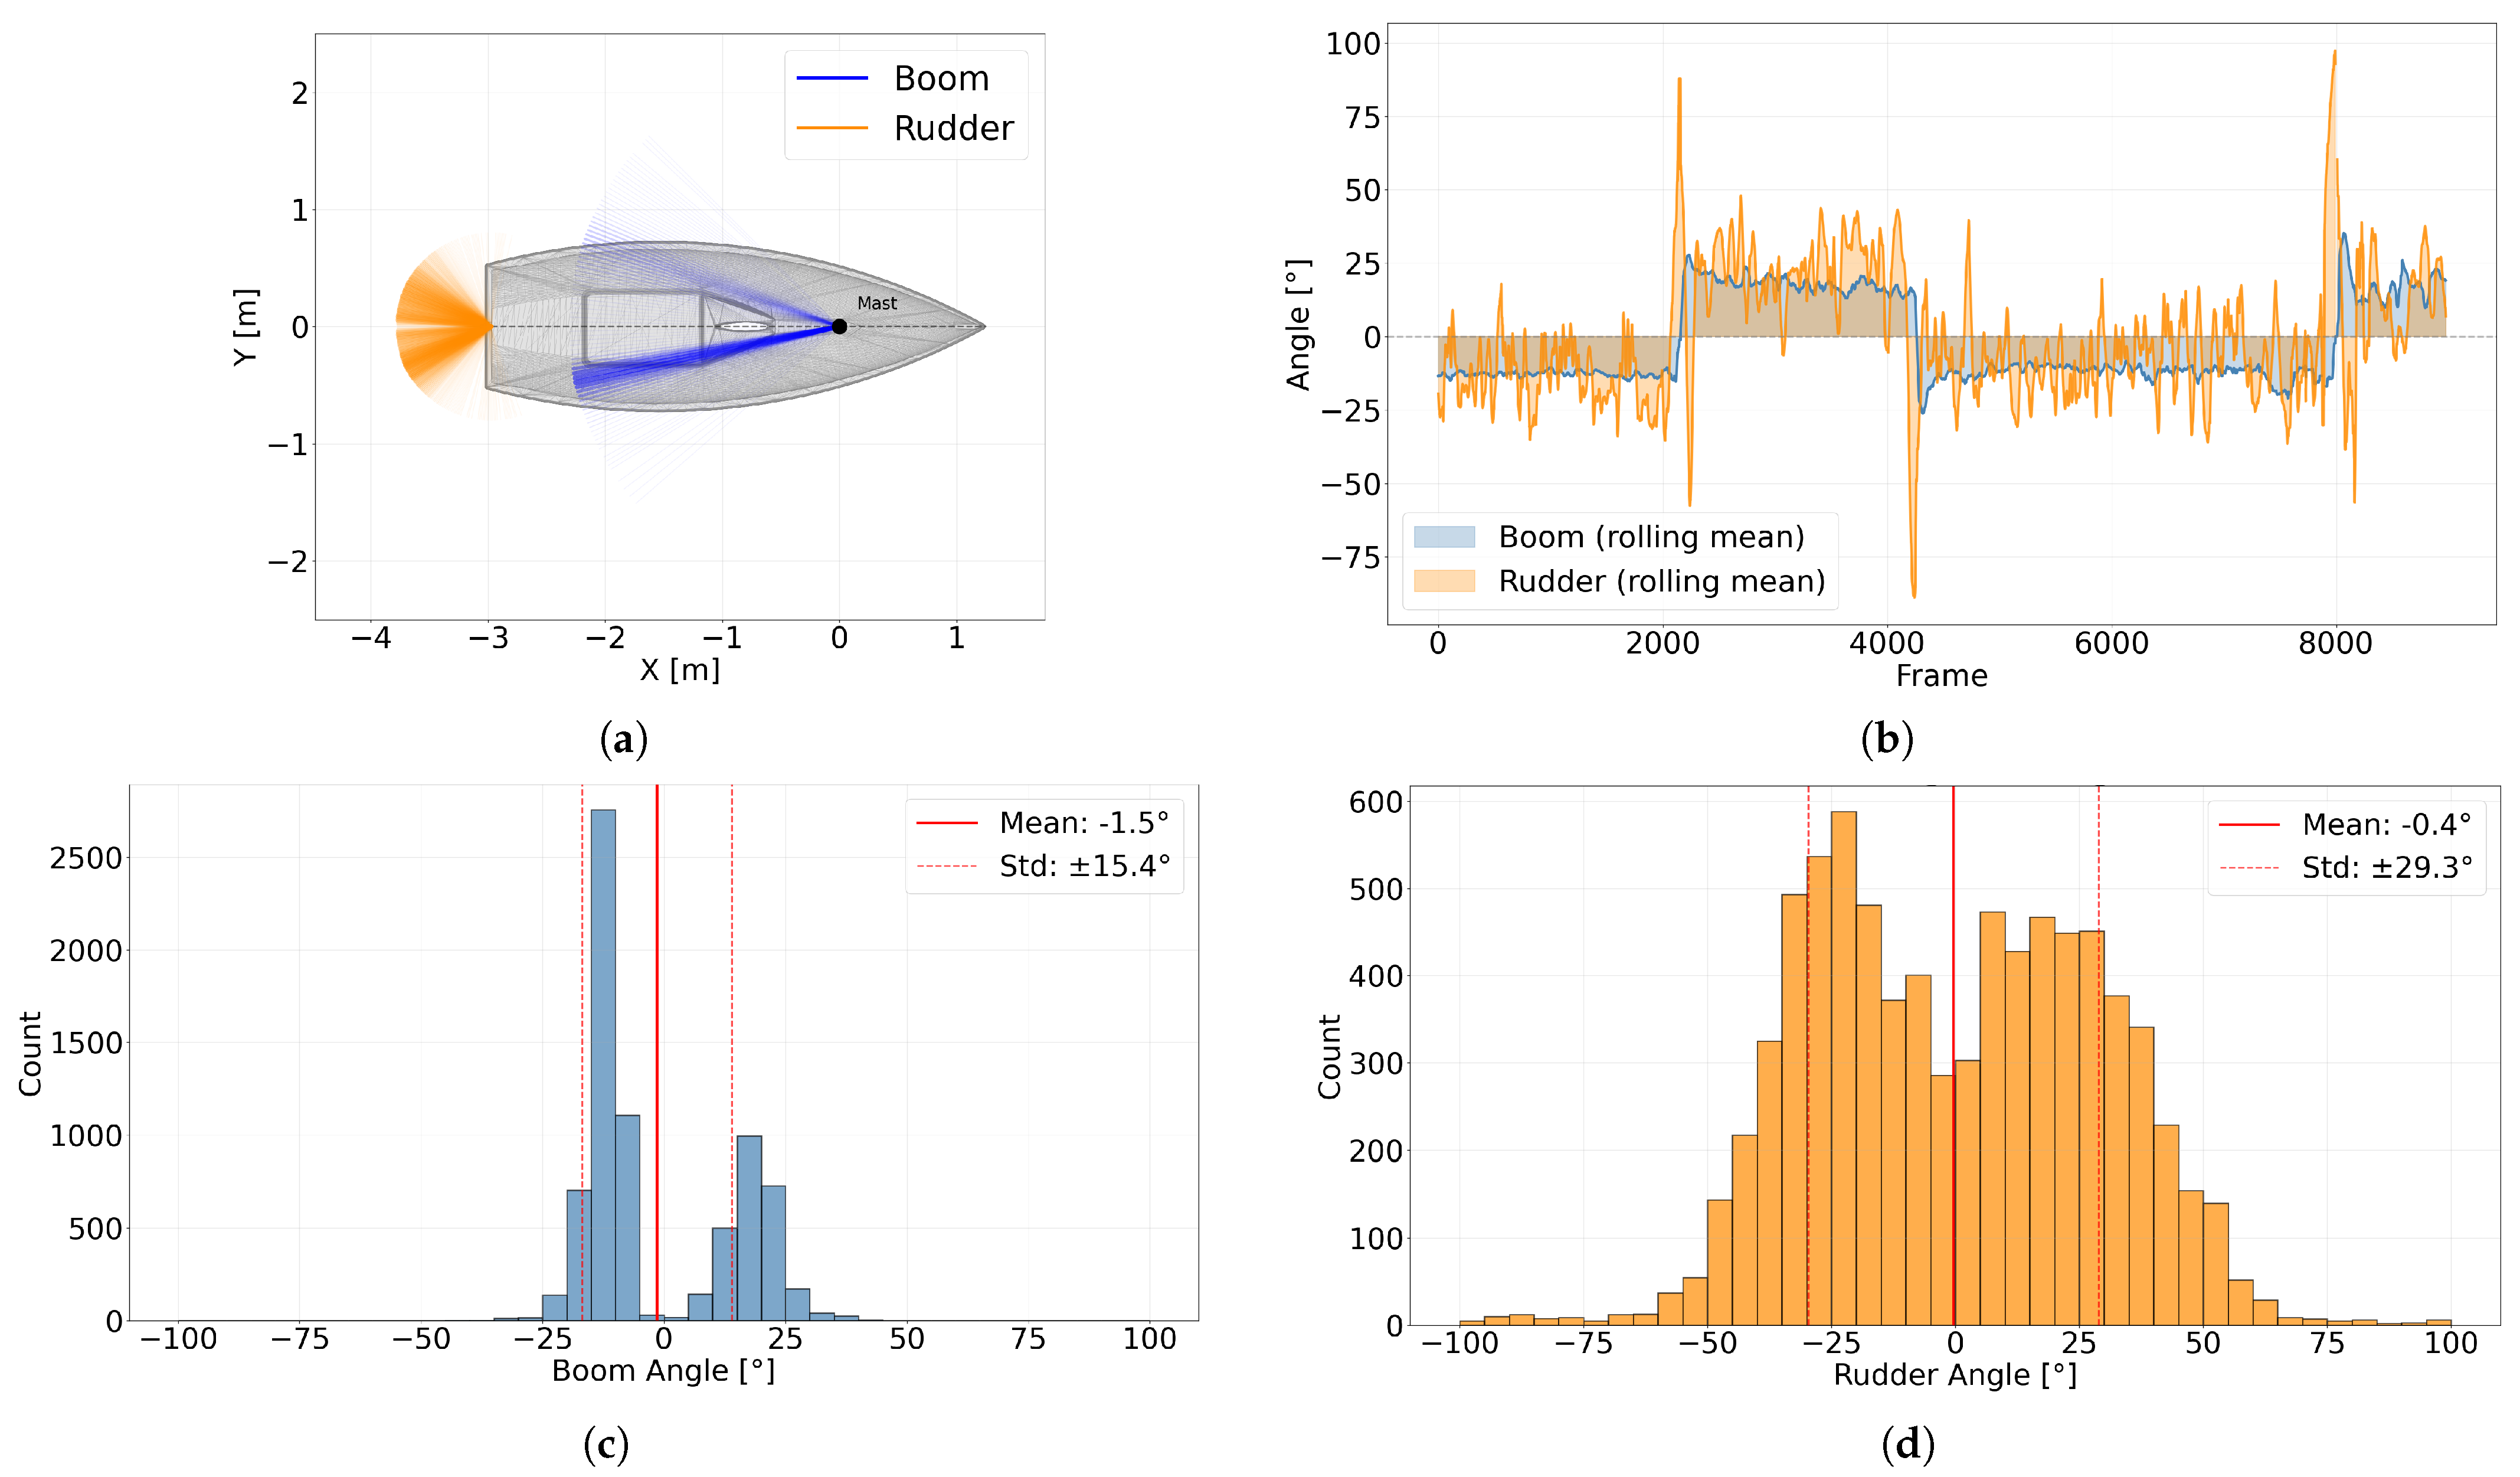
Figure 3a shows the spatial distribution of boom and rudder angles viewed from above in the dinghy’s reference frame. The mean boom angle is 12.4° ± 5.6 to starboard and 18.5° ± 3.6 to port, consistent with visual observations from the video footage. The histogram shown in Figure 3c, where negative values indicate deflection to starboard and positive values to port, reflects that a greater proportion of the segment was sailed on the port tack.
Figure 3.
Boom and rudder angle analysis: (a) scatter plot of detected angles in top-down view (ILCA model [32]); (b) angle time series with rolling mean; (c) boom angle histogram; (d) rudder angle histogram.
The rudder angle histogram in Figure 3d shows a standard deviation of 29.3° with a mean of −0.4°. The near-zero mean indicates a balanced distribution between port and starboard corrections throughout the segment, with a large standard deviation indicating dynamic movement.
The time series in Figure 3b suggests that the rudder tends to deflect toward the same side as the boom. Additionally, sharp rudder deflections precede each tack, followed by a correction phase and then steady-state weather helm compensation. This pattern appears consistently before all three tacks in the segment.
3.2. Three-Dimensional Pose and Athlete Position Estimation
The results of the pose estimation process showed that, out of a total of 7391 frames with detected boom angles, 5381 frames had valid skeleton data. Of these, 2485 (46.2%) were to the port and 2896 (53.8%) were to the starboard side. This gives a total rate of 60% for placing the detected athlete skeleton within the dinghy’s reference frame.
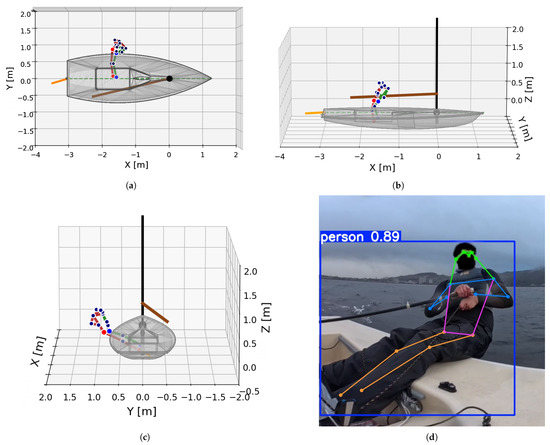
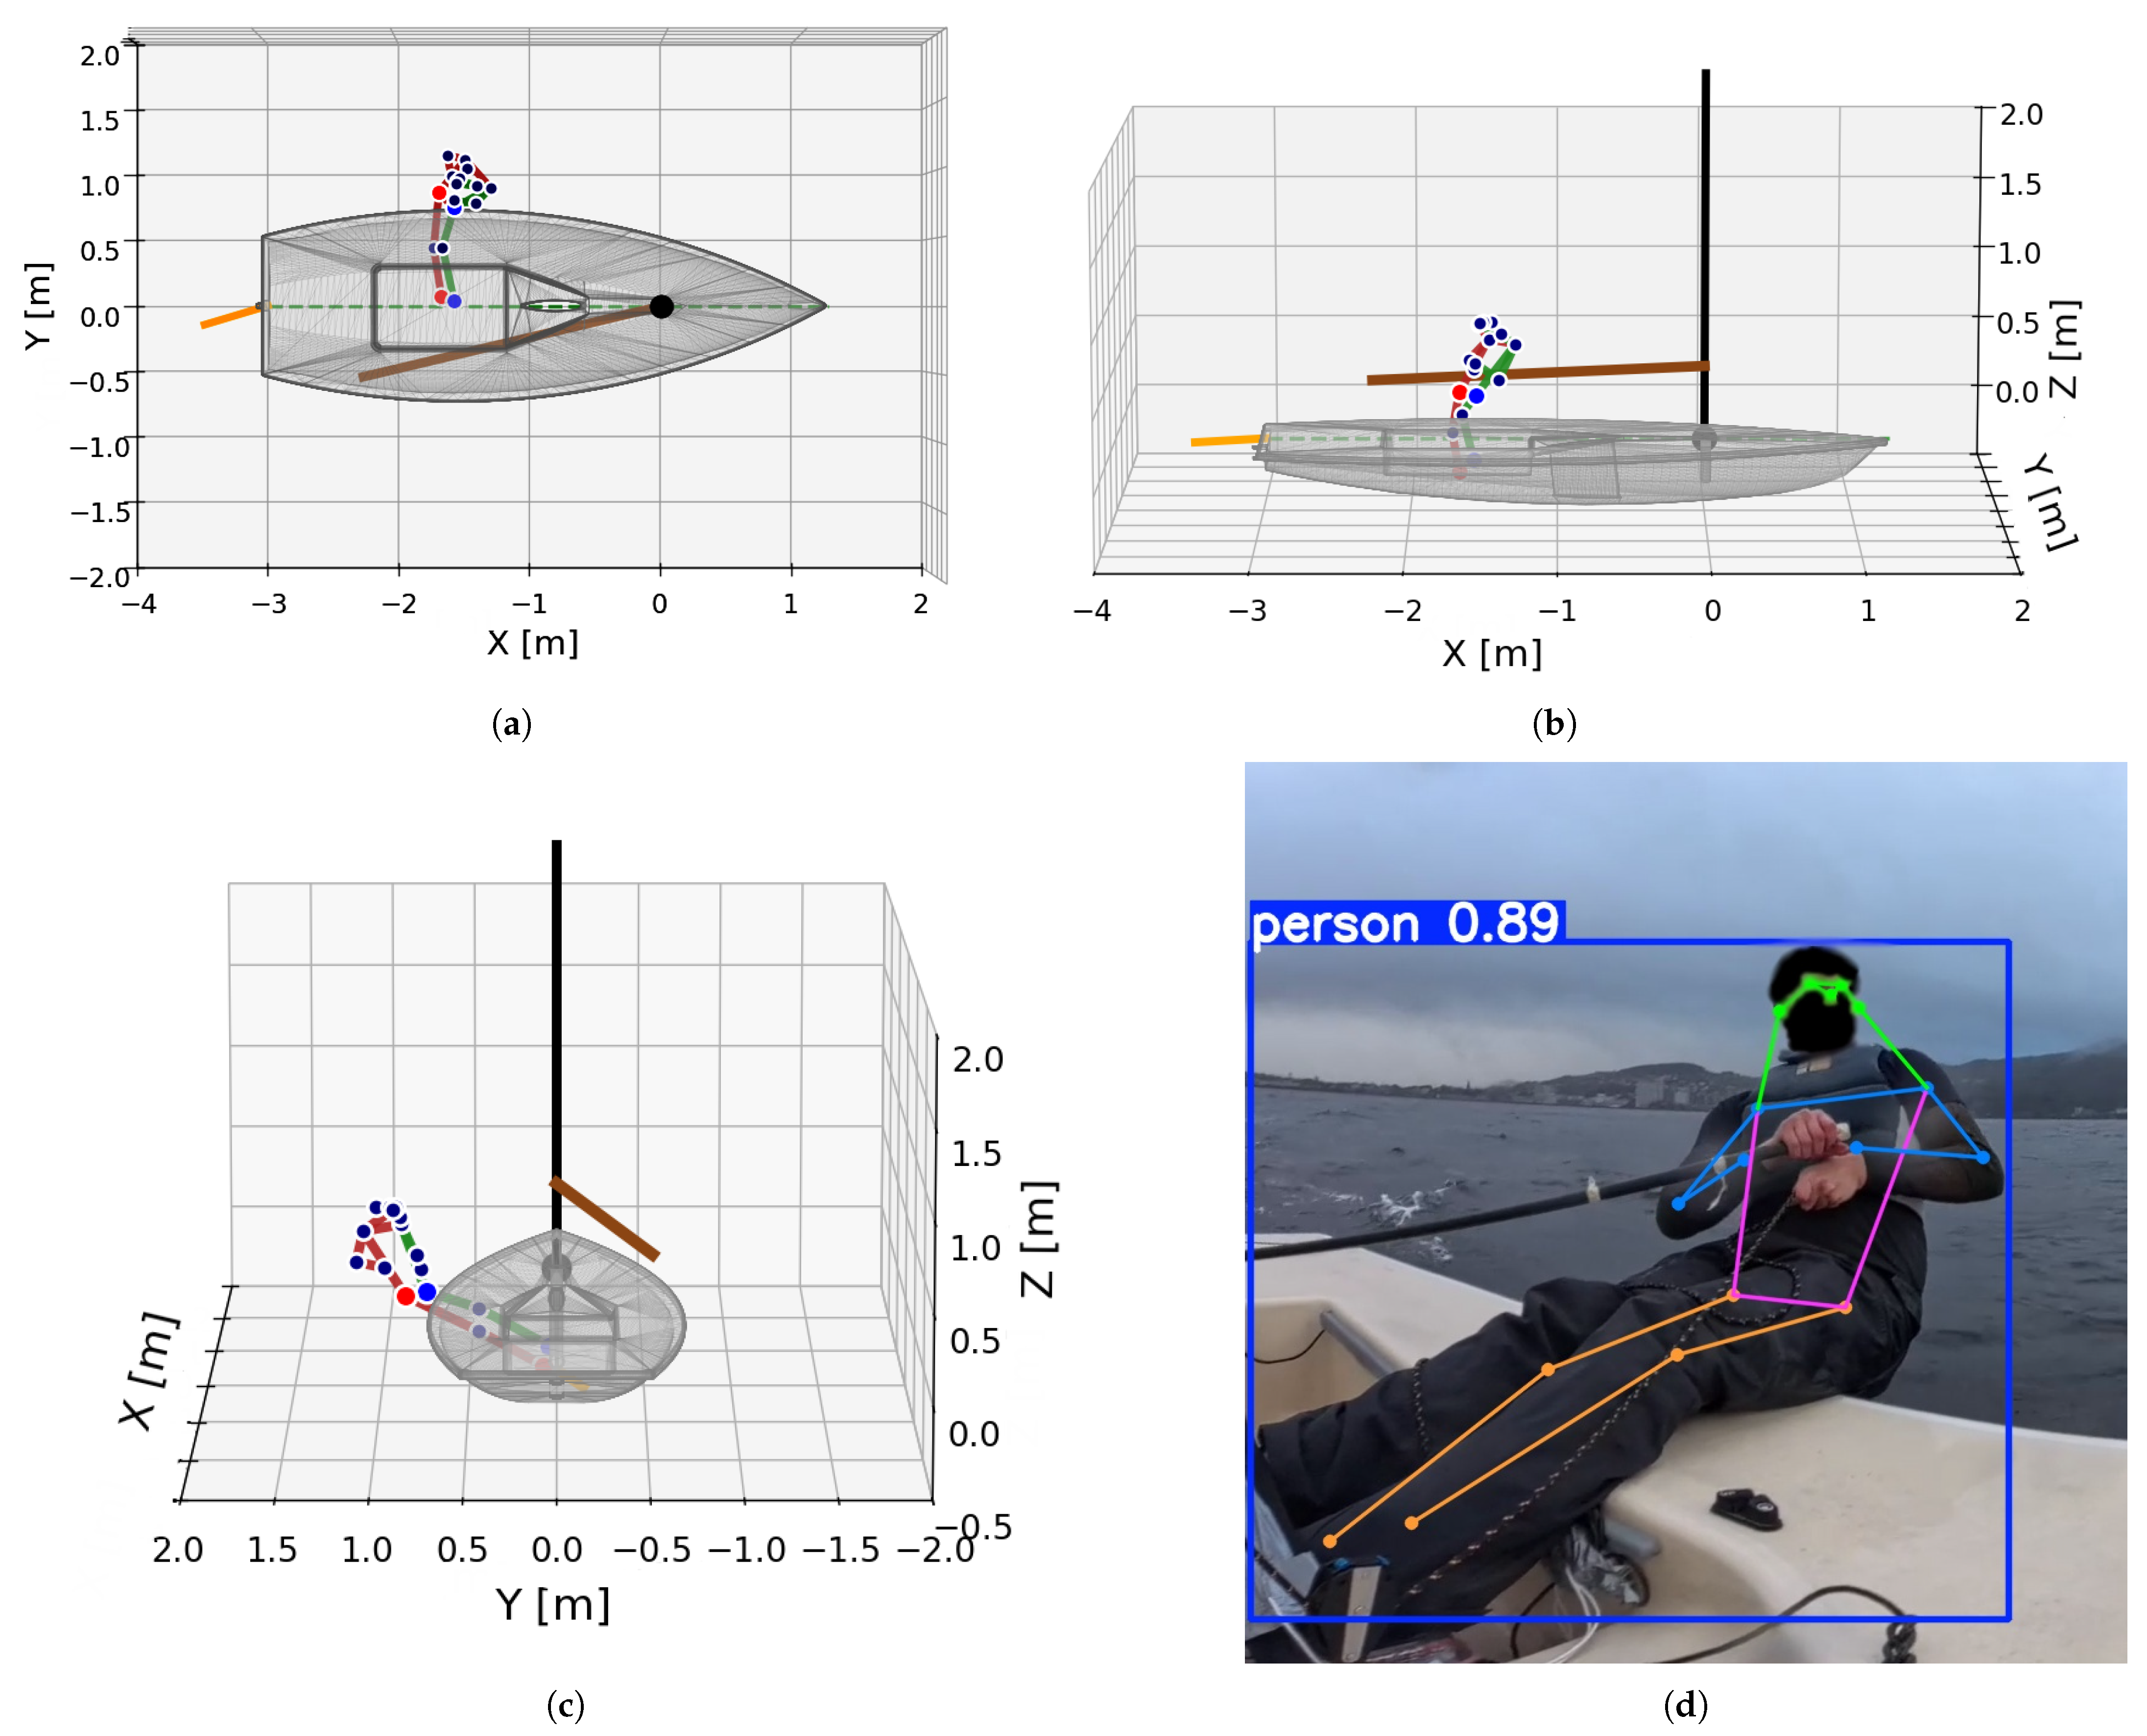
In Figure 4, an example of successfully detecting the pose and position for a single frame is presented. The detection demonstrates reasonable proportions and is well positioned compared to what is expected from the reference image. The hips and ankles lie on the expected z-planes, demonstrating the potential of ray-plane casting.
Figure 4.
Single-frame athlete position estimation (ILCA model [32]): (a) top–down view); (b) view from starboard side; (c) view from behind; (d) visualization of detected athlete pose.
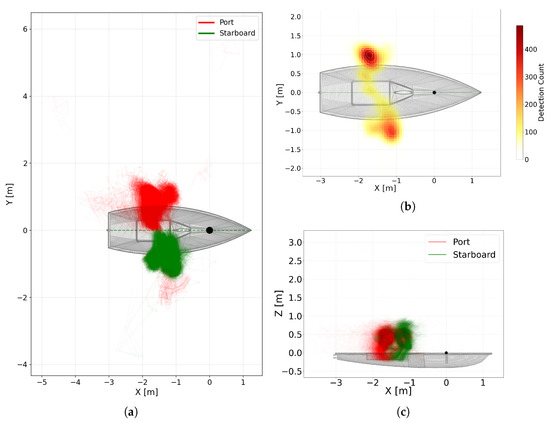
Figure 5a presents all the detected poses overlaid, while Figure 5c shows the corresponding keypoint density heatmap, which becomes brighter in areas with more keypoints and is therefore brighter at the trunk portion of the detected pose.
Figure 5.
Spatial analysis of detected athlete poses (red and green coloring following standard maritime convention). (a) All poses overlaid in the dinghy’s reference frame; (b) heatmap of keypoint density; (c) side-view pose overlay (ILCA model [32]).
The heatmap analysis reveals that the athlete’s legs typically occupy positions between m and m along the axis (X), consistent with measurements taken from the physical dinghy and visual confirmation with the video footage; however, some issues are evident. Poses detected at more negative X positions exhibit increased displacement in the Y axis. This lateral drift effect is reversed between port and starboard tacks, suggesting potential parameter tuning discrepancies between the two viewing configurations or by distortion caused by equirectangular-to-perspective mapping at extreme angles. Some poses appear up to 6 m from the dinghy center line, and some are behind the dinghy, showcasing false detections caused by failures in the pipeline (<1% of detected poses).
3.3. Trunk Angle Analysis
The trunk angle of the athlete, namely the forward/backward lean, was calculated by measuring the angle between the torso vector (from mid-hip to mid-shoulder) and the legs. An angle of 0° indicates an upright seated posture, while 90° represents full horizontal extension, which occurs during hiking. This metric was successfully computed for 6079 frames. Table 2 presents statistics for the trunk angle measurements.
Table 2.
Trunk angle measurements.
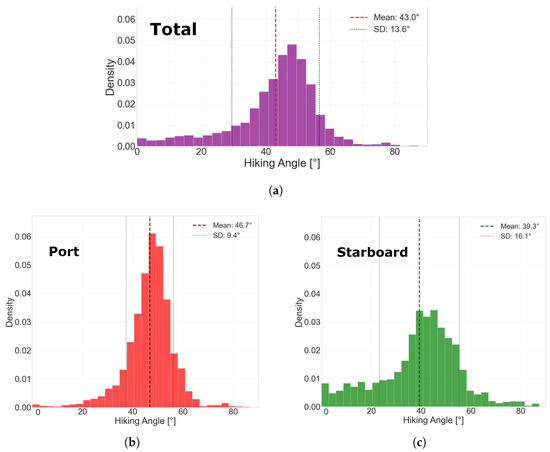
The mean trunk angle of 43.0° indicates that the sailor maintained a moderate lean on average, consistent with typical hiking postures in dinghy sailing under moderate wind conditions [11]. A visual inspection of the video using manual angle measurements confirm the correct general trunk angle range. The median (45.6°) being higher than the mean indicates a left-skewed distribution. The standard deviation of 13.6° shows the dynamic nature of hiking, requiring different leans in response to wind gusts and wave conditions. Figure 6a displays a histogram of the estimated trunk angles, where 56.3% of detections are indicated to be in the 45–55° range.
Figure 6.
Distribution analysis of trunk angles: (a) total distribution); (b) port trunk angles; (c) starboard trunk angles.
A percentile analysis of trunk angles reveals that the most common hiking position was between 35° and 55°, with the 90th percentile at 55.8°, indicating that hiking while leaning all the way back was measured as infrequent (Table 3).
Table 3.
Summary statistics of measured hiking angles.
The side-determined hiking data seen in Figure 6b,c generally shows more aggressive hiking behavior on the port tack, with the 25th percentile at 42.5° and the 75th at 51.9°. On the starboard tack, the sailor exhibits more dynamic behavior, with the 25th percentile at 31.6° and the 75th at 49.3°, indicating that for both sides, most of the hiking was achieved with a trunk angle between 30° and 50°. The decrease in total frames analyzed is caused by the reliance on accurate boom detections for the side determination.
4. Discussion
The primary objective of this study was to explore the data-gathering possibilities of utilizing computer vision on an ILCA 7 sailing dinghy and to contextualize its feasibility relative to established sensor-based performance analysis approaches. The main benefit of this approach, as demonstrated throughout this study, is the potential for a low-cost and competition-legal setup capable of measuring data points, which was previously only possible through specific sensor setups prohibited in competitions.
The deep-learning-based pose analysis demonstrates effective 3D pose estimation and the possibilities that lie within a single camera system. The trunk angle calculations appear to be accurate based on visual verification of the video footage. In [11], it was found that, in the ILCA class, during simulated competitions, the athlete spent between 24 and 94% of upwind time hiking. Our data, recorded in a more informal training setting, indicates that in 68.4% of the estimated poses, the athlete hiked with a trunk angle between 35° and 55°, as shown in Figure 6a. This agrees well with visual observations from the footage and from what is expected under these wind conditions [8]. However, higher angle hiking was less detected by our model, especially for port tacks, as shown in Figure 6b. From the manual video analysis, high-angle hiking was estimated to be approximately 10% of the total time. The wider distribution of trunk angles on the starboard side could indicate that the sailor is more active in their movements on this tack, perhaps due to the combination of wind and waves allowing for pumping motions to gain speed across the wave peaks. Differences in wind behavior, such as increased gusts, might be another reason behind the wider trunk angle distribution on the starboard side.
The chosen camera-mounting location provides a useful overview of the sailor, boom, and rudder from a single viewpoint. Further development of the system could consider other mounting locations on the dinghy which are static, as opposed to the boom, which rotates around the mast. Currently, lens flare and water spray may affect individual frames; however, their impact on the analysis over time is limited and has been left for future work. From Figure 5a, we observe that the average predicted position is within acceptable bounds of what is expected by visually analyzing the footage. Future iterations of the system could employ machine-learning-based angle estimation rather than purely geometric approaches, as proposed in [33], to produce more accurate boom angle estimates. Continuing with this study, we plan to collect comprehensive datasets under various conditions to reliably train and test such an approach.
The rudder angles estimated by the presented machine learning pipeline are within a reasonable range, although some outliers with angles approaching 90° are present in spikes in Figure 3b. The figure also captures tacking manoeuvres; however, the rudder profiles observed during tacks differ somewhat from those reported in [3], likely due to the athlete occluding the view of the rudder during tacking. The spread of rudder angles seen in Figure 3d indicates an active sailing style, natural to the wave conditions during the test. The rudder and boom measurements could have value for coaches in analyzing how active the athletes sail in longer straight legs, as well as the timing of rudder and boom movements moving into tacks and gybes.
Previous research on the ILCA racing dinghy has primarily quantified on-water performance using dedicated sensor systems such as GNSS and inertial logging [3,34]. Controlled-environment and simulation-based studies have provided valuable insights, but their transferability to real sailing conditions remains limited [10,12]. Building on the importance of in situ measurements highlighted by [24], the present study evaluates a single-camera setup for competition-legal data collection on an ILCA dinghy. By targeting determinants of athletic performance in sailing [6] and leveraging video-based analysis methods established across multiple sports [17,18,21], we aim to support coaches in providing more informed feedback to athletes during both training and competition.
Limitations and Further Work
The results should be interpreted in light of the limitations of the present study. The current dataset does not include ground truth measurement angles for the athlete’s pose and is based on a single sea trial. The geometric integration of the 3D pose into the dinghy reference frame relies on simplified assumptions about athlete contact constraints during hiking. Deviations from these assumptions combined with occlusions and projection-related distortion remain important points to address as the system is further developed. This study has not explored more advanced detection methods and aims to present a lightweight framework for applications in practical analysis.
In future studies, we plan to first explore methods to capture ground truth data for the athlete’s position, the trunk angle, and rig angles. Furthermore, a fixed camera-mounting location would reduce geometric uncertainty, enabling more accurate rig angle estimation and simpler handling of lens and projection-related distortions, thereby reducing overall uncertainty and systematic errors in position estimation. The system could be expanded to include horizon detection, thereby replacing an inertial measurement unit (IMU) for gathering orientation data and enable collection in competitions. Another potential use case could be to estimate the athlete’s center of mass, as performed with IMU sensors in [9], allowing for athlete righting moment estimation and development towards a digital twin.
5. Conclusions
This study has demonstrated that low-cost, competition-legal performance analysis in sailing is achievable by using a single 360° camera combined with computer vision. The possibility to capture trunk angles, detailed poses, and position data can reveal previously undetectable differences between athletes, enabling more targeted coaching. Similarly, rudder and boom angle analysis could identify asymmetries between port and starboard tacks and characterize what distinguishes successful tacking. The future of Olympic sailing will be defined by marginal performance gains, where competition-approved measurement and analysis systems can serve as valuable tools for sailors and coaches.
Author Contributions
Conceptualization, E.E.S., L.M.Ø., S.H. and M.S.; methodology, E.E.S., L.M.Ø. and S.H.; software, L.M.Ø. and S.H.; validation, L.M.Ø., S.H. and E.E.S.; formal analysis, E.E.S., S.H. and L.M.Ø.; data curation, E.E.S., L.M.Ø. and S.H.; writing—original draft preparation, E.E.S., L.M.Ø. and S.H.; writing—review and editing, L.M.Ø., E.E.S., S.H. and M.S.; visualization, E.E.S., L.M.Ø. and S.H.; supervision, E.E.S. and M.S.; project administration, E.E.S. and M.S.; funding acquisition, M.S. All authors have read and agreed to the published version of the manuscript.
Funding
This research received funding from the Norwegian Olympic Committee.
Institutional Review Board Statement
This study was conducted in accordance with the Declaration of Helsinki and approved by the Ethics Committee of Norway (ID: 661300, approved 16 January 2025).
Informed Consent Statement
Written informed consent was obtained from all subjects involved in this study.
Data Availability Statement
The datasets generated and/or analyzed during the current study are available from the corresponding author upon reasonable request. The data is not publicly available because it contains information that can compromise the privacy of the research participants.
Acknowledgments
We would like to thank Trondheim Seilforening for providing equipment and assistance in the harbor for testing.
Conflicts of Interest
The authors declare no conflicts of interest.
References
- Bahchevanski, S. Anthropometric Characteristics of Ilca 6 Sailors at the Summer Olympic Games. J. Appl. Sport. Sci. 2025, 9, 76–84. [Google Scholar] [CrossRef] [Scilit]
- Zattoni, M.; Belluco, P. Data acquisition and analysis of ILCA 6 dinghies sailing upwind. In Proceedings of the 2024 IEEE International Workshop on Sport, Technology and Research (STAR), Lecco, Italy, 8–10 July 2024; pp. 88–93. [Google Scholar] [CrossRef] [Scilit]
- Semb, E.E.; Stendal, E.; Dahlhaug, K.; Steinert, M. Multi-Sensor System for Analysis of Maneuver Performance in Olympic Sailing. Appl. Sci. 2025, 15, 8629. [Google Scholar] [CrossRef] [Scilit]
- Gowland, C. Sail Faster with Less Hiking–Part 2: Sail Setup. Int. Sail. Acad. 2017. [Google Scholar]
- Putnam, C. A mathematical model of hiking positions in a sailing dinghy. Med. Sci. Sport. 1979, 11, 288–292. [Google Scholar]
- Winchcombe, C.E.; Goods, P.S.R.; Binnie, M.J.; Peeling, P. Coaches’ insights: Determinants of athlete success, physical demands and training approaches in single-handed Olympic-class dinghy sailing. PLoS ONE 2025, 20, e0322510. [Google Scholar] [CrossRef] [Scilit]
- Chicoy, I.; Encarnación-Martínez, A. Determining factors in the performance of hiking in dinghy sailing: A literature review. Eur. J. Hum. Mov. 2015, 34, 15–33. [Google Scholar]
- Fontana, C.; Naddeo, A.; Califano, R. Biomechanical and Physiological Implications of the Hiking Position in Laser Class Sailing. Appl. Sci. 2025, 15, 9853. [Google Scholar] [CrossRef] [Scilit]
- Taylor, J.C.; Banks, J.; Turnock, S.R. The Influence of Sailor Position and Motion on the Performance Prediction of Racing Dinghies. In Proceedings of the SNAME 22nd Chesapeake Sailing Yacht Symposium, Annapolis, MD, USA, 18–19 March 2016; p. D021S002R006. [Google Scholar] [CrossRef] [Scilit]
- Pennanen, M.; Levin, R.L.; Larsson, L.; Finnsgård, C. Numerical Prediction of the Best Heel and Trim of a Laser Dinghy. Procedia Eng. 2016, 147, 336–341. [Google Scholar] [CrossRef] [Scilit]
- Legg, S.; Mackie, H.; Smith, P. Temporal patterns of physical activity in Olympic dinghy racing. J. Sport. Med. Phys. Fit. 1999, 39, 315–320. [Google Scholar]
- Cunningham, P.; Hale, T. Physiological responses of elite Laser sailors to 30 minutes of simulated upwind sailing. J. Sport. Sci. 2007, 25, 1109–1116. [Google Scholar] [CrossRef] [Scilit]
- Reichert, G.M.W.; Pieras, M.; Marroquim, R.; Vilanova, A. Stabilization and visual analysis of video-recorded sailing sessions. Vis. Comput. Ind. Biomed. Art 2021, 4, 26. [Google Scholar] [CrossRef] [Scilit] [PubMed]
- Zagas, N. Constitution and Class Rules. Available online: https://www.laserinternational.org/wp-content/uploads/2024/09/HANDBOOK-2024.pdf (accessed on 5 December 2025).
- ILCA. Class Rules. Available online: https://ilcasailing.org/rules-and-technical/laser-class-rules/ (accessed on 8 December 2025).
- Xu, M.; Li, C.; Zhang, S.; Callet, P.L. State-of-the-Art in 360° Video/Image Processing: Perception, Assessment and Compression. IEEE J. Sel. Top. Signal Process. 2020, 14, 5–26. [Google Scholar] [CrossRef] [Scilit]
- Alahi, A.; Boursier, Y.; Jacques, L.; Vandergheynst, P. Sport players detection and tracking with a mixed network of planar and omnidirectional cameras. In Proceedings of the 2009 Third ACM/IEEE International Conference on Distributed Smart Cameras (ICDSC), Como, Italy, 30 August–2 September 2009; pp. 1–8. [Google Scholar] [CrossRef] [Scilit]
- Hori, R.; Hachiuma, R.; Isogawa, M.; Mikami, D.; Saito, H. Silhouette-Based 3D Human Pose Estimation Using A Single Wrist-Mounted 360 Camera. IEEE Access 2022, 10, 54957–54968. [Google Scholar] [CrossRef] [Scilit]
- Rhodin, H.; Richardt, C.; Casas, D.; Insafutdinov, E.; Shafiei, M.; Seidel, H.P.; Schiele, B.; Theobalt, C. EgoCap: Egocentric marker-less motion capture with two fisheye cameras. ACM Trans. Graph. 2016, 35, 162. [Google Scholar] [CrossRef] [Scilit]
- Farley, O.R.; Spencer, K.; Baudinet, L. Virtual reality in sports coaching, skill acquisition and application to surfing: A review. J. Hum. Sport Exerc. 2019, 15. [Google Scholar] [CrossRef] [Scilit]
- Rastegar Sani, M.; Zollmann, S.; Langlotz, T. Train Me: Exploring Mobile Sports Capture and Replay for Immersive Sports Coaching. In Proceedings of the 26th International Conference on Mobile Human-Computer Interaction, Melbourne, VIC, Australia, 30 September–3 October 2024; pp. 1–7. [Google Scholar] [CrossRef] [Scilit]
- Pagé, C.; Bernier, P.M.; Trempe, M. Using video simulations and virtual reality to improve decision-making skills in basketball. J. Sport. Sci. 2019, 37, 2403–2410. [Google Scholar] [CrossRef] [Scilit]
- Kittel, A.; Cunningham, I.; Larkin, P. Editorial: 360° VR in sport and physical activity—It is very real. Front. Psychol. 2023, 14, 104096. [Google Scholar] [CrossRef] [Scilit] [PubMed]
- Stellingwerff, T.; Burke, L.M.; Caldwell, H.G.; Gathercole, R.J.; McNeil, C.J.; Napier, C.; Purcell, S.A.; Boegman, S.; Johnson, E.; Hoar, S.D.; et al. Integrative Field-Based Health and Performance Research: A Narrative Review on Experimental Methods and Logistics to Conduct Competition and Training Camp Studies in Athletes. Sports Med. 2025, 55, 1377–1403. [Google Scholar] [CrossRef] [Scilit]
- Insta360. Insta360 X4-Ultimate 8K 360 Action Cam. Available online: https://www.insta360.com/product/insta360-x4 (accessed on 8 December 2025).
- Thingiverse.com. GoPro Mast/Boom Mount by Alphacornutum. Available online: https://www.thingiverse.com/thing:5384462 (accessed on 2 December 2025).
- Guo, J.; Wang, M.; Ilyankou, I.; Jongwiriyanurak, N.; Gao, X.; Christie, N.; Haworth, J. Multiple Object Detection and Tracking in Panoramic Videos for Cycling Safety Analysis. arXiv 2024, arXiv:2407.15199. [Google Scholar] [CrossRef] [Scilit]
- Redmon, J.; Divvala, S.; Girshick, R.; Farhadi, A. You Only Look Once: Unified, Real-Time Object Detection. arXiv 2016, arXiv:1506.02640. [Google Scholar] [CrossRef] [Scilit]
- MediaPipe Solutions Guide | Google AI Edge. Available online: https://ai.google.dev/edge/mediapipe/solutions/guide (accessed on 30 November 2025).
- Doypare, T. Understanding Ray–Plane Intersection: The Key to Mapping Pixels to Real-World Coordinates. Available online: https://medium.com/@tejasdoypare/understanding-ray-plane-intersection-the-key-to-mapping-pixels-to-real-world-coordinates-4ac0e4cded36 (accessed on 5 December 2025).
- SINTEF. OceanLab Observatory. Available online: https://oceanlabobservatory.no/ (accessed on 3 December 2025).
- Swamp, J. Laser Dinghy ILCA Class by John Swamp | Download Free STL Model. Available online: https://www.printables.com/model/781762-laser-dinghy-ilca-class (accessed on 28 November 2025).
- Ebert, A. Using Artificial Intelligence in the Domain of Sailing. Available online: https://www.adagger.com/blog/using-artificial-intelligence-in-the-domain-of-sailing (accessed on 29 November 2025).
- Caraballo, I.; Conde-Caveda, J.; Pezelj, L.; Milavić, B.; Castro-Piñero, J. GNSS Applications to Assess Performance in Olympic Sailors: Laser Class. Appl. Sci. 2021, 11, 264. [Google Scholar] [CrossRef] [Scilit]

Disclaimer/Publisher’s Note: The statements, opinions and data contained in all publications are solely those of the individual author(s) and contributor(s) and not of MDPI and/or the editor(s). MDPI and/or the editor(s) disclaim responsibility for any injury to people or property resulting from any ideas, methods, instructions or products referred to in the content. |
© 2026 by the authors. Licensee MDPI, Basel, Switzerland. This article is an open access article distributed under the terms and conditions of the Creative Commons Attribution (CC BY) license.