


Abstract
The reverse circulation pneumatic down-the-hole (DTH) drilling system employs percussive drilling to achieve high efficiency and strong adaptability across diverse rock formations. However, its cutting removal efficiency remains suboptimal. To enhance reverse circulation performance, a comprehensive understanding of airflow and solid particle dynamics at the borehole bottom is essential. This study investigates rock cutting transportation and distribution under varying drilling parameters and evaluates reverse circulation flow ratio using a Computational Fluid Dynamics (CFD) multiphase flow model, coupled with finite volume analysis of the reverse circulation bit. Simulation results reveal that increasing the input gas flow rate (Q), reducing the equivalent particle diameter (D), and minimizing the borehole enlargement ratio (E) significantly improve cutting removal efficiency, with optimal values identified for each parameter. Additionally, solid volume fraction contours at the borehole bottom indicate that the arrangement of spherical teeth influences the flow field. Optimal values for rock cutting density (ρ), rate of penetration (ROP), and rotational speed (N) were also determined to maximize reverse circulation flow ratio. The Genetic Algorithm–Least Squares Support Vector Machine (GA-LSSVM) method was used to train the response surface data and construct a predictive model, which was then further optimized using Particle Swarm Optimization (PSO) to determine accurate parameter settings. These findings provide operational insights into optimizing drilling parameters to advance efficient drilling performance.
1. Introduction
Down-the-hole (DTH) drilling is an advanced drilling technology with unique advantages in fields such as mineral exploration and mine rescue [1,2]. Compared with traditional drilling methods, it offers benefits such as high drilling speed, high efficiency, and environmental friendliness [3,4]. In the field of mineral exploration, the RC-DTH hammer fractures rock primarily through impact-induced volumetric breakage, which offers advantages for the exploration of high-density rock formations. These advantages result in significant economic benefits in mineral exploration projects. Under dry conditions, the system primarily involves gas–solid two-phase particle flow. However, the complex structure of the drill bit and the presence of button bits lead to highly variable rock cuttings flow at the borehole bottom, posing research challenges and emphasizing the urgent need to control the movement behavior of these cuttings.
Traditional experimental approaches, which require numerous RC drill bit samples, are both time-consuming and costly. In contrast, CFD offers a viable alternative for analyzing gas flow characteristics at the borehole bottom, especially under constrained experimental conditions. This method is recognized for its convenience, cost-effectiveness, and efficiency [5]. Currently, many scholars have investigated particle behavior at the borehole bottom during reverse circulation drilling for sampling. For instance, Sun et al. [6] quantified the air volume required for cuttings transportation under varying conditions, including rate of penetration (ROP), cuttings diameter, and water production, elucidating the interactions among these factors. Their findings suggested that mechanical penetration rate, cuttings size, and water production significantly influence the minimum air influx needed for efficient cuttings transport. Emmanuel et al. [7], using the Euler–Euler multiphase flow model, demonstrated that slight increases in drill pipe rotation speed and reductions in eccentricity improve wellbore cleaning. Siamak et al. [8,9] used a Computational Fluid Dynamics–Discrete Element Method (CFD–DEM) model to investigate cuttings transport under aerated mud and downhole conditions, highlighting that factors such as gas–liquid ratio, ambient temperature, and injection pressure significantly affect transport efficiency. Han et al. [10] employed the CFD–DEM method to simulate two-phase cuttings and airflow within the drill pipe during reverse circulation pneumatic debris removal in horizontal coal seam drilling, deriving an empirical equation for the cuttings pressure drop coefficient through analysis of working principles and dynamic equations.
The RC drill bit is crucial for establishing the air reverse circulation flow field at the borehole bottom [11]. To improve reverse circulation performance, researchers have focused on optimizing the geometric parameters of the RC drill bit, particularly the suction nozzle. Yin et al. [12] used CFD to show that increasing the number or tilt angle of suction nozzles enhances dust removal performance. Additionally, lowering the position of the suction nozzle within the drill bit further improves dust removal, and these findings were corroborated by experimental tests. Zhao et al. [13] employed orthogonal experimental methods and CFD simulations to design an optimal large-diameter reverse circulation drill bit. They evaluated multiple parameters, including the diameter, number, length, bore diameter, tilt angle, and deflection angle of the suction nozzles, to determine the optimal configuration for cutting transport capacity and reverse circulation performance. Similarly, Cao et al. [14] designed an innovative RC drill bit with an annular gap. Their simulations showed that airflow moves upward along the inner wall of the annular center channel without the interference typically observed in standard drill bits, thus facilitating reverse circulation.
During drilling with pneumatic DTH hammers, two main types of leakage may occur: bottom leakage, caused by vibrations that enlarge the borehole diameter beyond the hammer size, and gas leakage, originating from drill pipe joint failures or drill rod damage [15]. In coal mine strata, the borehole diameter expansion rate is approximately 5%, while it is lower in hard rock formations. Current research primarily focuses on optimizing drill bit structures, with limited studies addressing the cuttings transport characteristics of the reverse circulation flow field at the borehole bottom under gas leakage conditions. This gap makes accurately determining control parameters based on drilling conditions challenging. Therefore, investigating the influence of operational parameters on cuttings distribution at the borehole bottom and on reverse circulation is essential for accurately determining control parameter values, which is critical for improving drilling efficiency. Since two-phase flow is considered more representative of actual working conditions, this study aims to clarify the mechanisms for enhancing dust control performance during drilling. CFD simulations based on the Euler–Euler two-phase flow model are employed to analyze the reverse circulation flow ratio of RC drill bits under borehole leakage conditions. The study examines the effects of cuttings size, input air volume, borehole enlargement ratio, drilling speed, cutting density, and rotational speed on the cutting transport and reverse circulation performance of the drilling system.
Since two-phase flow more accurately represents real drilling conditions, this study employs CFD simulations using an Euler–Euler two-phase particle flow model to investigate the reverse circulation flow ratio of RC drill bits under different operating parameters. The analysis focuses on how cutting size, input air volume, borehole enlargement ratio, drilling penetration rate, cutting density, and rotational speed influence cuttings transport behavior and the overall reverse circulation performance at the borehole bottom.
In recent years, artificial intelligence algorithms have been widely applied for parameter prediction and optimization, yielding substantial progress. Deng et al. [16] proposed a novel fault diagnosis approach that integrates an improved PSO algorithm with a Least Squares Support Vector Machine (LSSVM), enhancing diagnostic accuracy for rotary machine bearing faults. Li developed a surface roughness prediction method based on PSO and LSSVM, with experimental results confirming strong predictive accuracy and generalization across diverse machining conditions. Khajeh et al. [17] employed a PSO–Artificial Neural Network and Response Surface Methodology (RSM) to evaluate the efficiency of silver nanoparticles in removing methylene blue from water, achieving high prediction accuracy through experimental optimization. Mokarizadeh et al. [18] combined LSSVM with a Genetic Algorithm (GA) to predict SO2 solubility in room-temperature ionic liquids. Cai et al. [19] employed a Genetic Algorithm—Least Squares Support Vector Machine (GA-LSSVM) model for landslide displacement forecasting, demonstrating improved predictive precision. Gupta et al. [20] used RSM and PSO to optimize machining parameters for titanium alloy turning, finding that PSO outperformed traditional optimization techniques. Kilickap et al. [21] applied RSM and GA to optimize drilling parameters for AISI 1045 steel, with both experimental measurements and model results validating the method’s effectiveness. Collectively, these studies demonstrate that PSO- and GA-enhanced LSSVM models based on RSM data offer high predictive reliability and broad applicability. Therefore, this study adopts this combined optimization approach to achieve accurate parameter prediction.
2. Model and Methods
2.1. CFD Calculation Model
In this study, the Euler–Euler method is employed, which imposes no restriction on the number of particles, making it well-suited for investigating the transport behavior of cuttings. All CFD simulations were performed using ANSYS Fluent 2022 R1. The governing equations were solved using the finite volume method within the Fluent solver framework. In this approach, the solid phase is treated as a continuum within the gas phase. The continuity equation for the two phases (where represents either the gas or solid phase) is expressed as follows [22,23,24]:
where is the space occupied by phase . are abbreviations for the density of phase . are the speed of phase .
When the virtual mass force between the gas and solid phases is neglected, the momentum equation for the gas phase can be expressed as follows:
The solid phase is modeled using the Kinetic Theory of Granular Flow (KTGF) [25], which accounts for energy loss due to particle collisions. Its momentum equation is:
where is the shared pressure of all phases, and and are the coefficient of momentum exchange to and from the two phases. is the solid pressure with respect to the particle temperature, and are the phase stress–strain tensor of the gas and solid phase.
Solid pressure represents the normal solid-phase force generated by the interactions between particles over time, and are determined by Ding and Gidaspow [26]:
where is the coefficient of restitution, is the radial distribution function, and is the fluctuating energy.
The stress tensor is related to the velocity gradient components, and the stress tensor for the gas phase is:
where is the shear viscosity of the gas or solid phase. is the bulk viscosity of gas phase or solid phase.
2.2. Artificial Intelligence Methodology
The LSSVM, an enhancement of the Support Vector Machine (SVM) [27], represents a nonlinear extension of the generalized portrait algorithm. By transforming the inequality constraints inherent in SVM into equality constraints, LSSVM converts the original quadratic optimization problem into a set of linear equations [28]. The loss function for the training samples is defined as the sum of squared errors. Given a training set , where () denotes the input data, () denotes the target output, and () is the number of samples, the regression function can be expressed as follows [29]:
where denotes the weight vector; is a bias term; and is mapping function.
Based on the structural risk minimization principle, the function optimization problem can be expressed as [20] (see Equation (7)):
where is a regularization parameter; is the slack variable.
Using the Lagrange method to solve the optimization problem [30]:
where is the Lagrange multiplier. To determine the unknown parameters, the Lagrangian form with respect to parameter must be derived. Setting the result to zero yields the following expression:
Given its robust nonlinear mapping capabilities, the Radial Basis Function (RBF) serves as the kernel function for the LSSVM model in this study [20]:
where is the width of the RBF.
The Genetic Algorithm (GA) is an optimization technique based on evolutionary theory, in which the evolutionary process is driven by random variations within the dataset [31]. In the GA, the effects of genetic encoding on combination, transmission, and natural selection are maintained according to specific model conditions. The algorithm incorporates mechanisms such as inheritance, mutation, selection, and crossover [32], thereby simulating natural evolutionary processes to identify optimal solutions. Moreover, the GA’s capability to explore multiple pathways allows it to effectively address a wide range of optimization problems. Consequently, integrating the GA with LSSVM yields faster performance than alternative methods and proves particularly effective for highly nonlinear systems. In this study, the synergy between the GA and LSSVM not only reduces computational runtime but also improves predictive accuracy [20].
The Particle Swarm Optimization (PSO) algorithm is a population-based stochastic optimization method that simulates the social behavior of bird flocks and iteratively updates particle positions and velocities to search for the optimum [33]. In this framework, individuals are referred to as “particles,” which move through a multidimensional search space. Namely, the position () and velocity () of each particle will be changed by the particle best value () and global best value () [18]. Kennedy and Spears proposed the inertia weight technique and introduced the inertia weight into the basic update rule in order to reduce particle velocities when the swarm explores a large search region. As a result, the particles are guided toward more promising regions of the search space, where more effective search can be performed to obtain improved solutions [34]. The update rules for each particle’s velocity () and position () are expressed as follows:
where is the dimensionless velocity of particle at iteration and ; is the dimensionless position of particle at iteration and ; are the particle best value and global best value; is inertia weight; is cognitive learning factor; is social learning factor; and and are random numbers uniformly distributed in [0, 1].
To control excessive wandering of particles outside the search space, each component of V can generally be constrained within the range of . The PSO algorithm uses either the maximum number of iterations or the optimal position of a particle within the swarm as the termination condition, ceasing further improvement after a sufficient number of iterations.
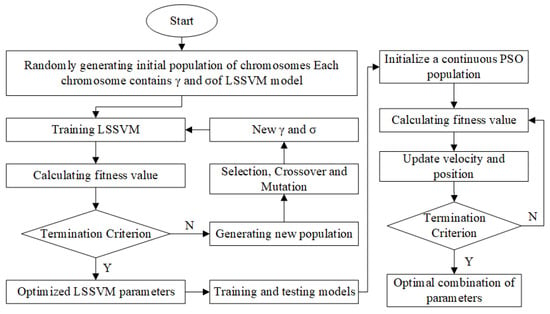
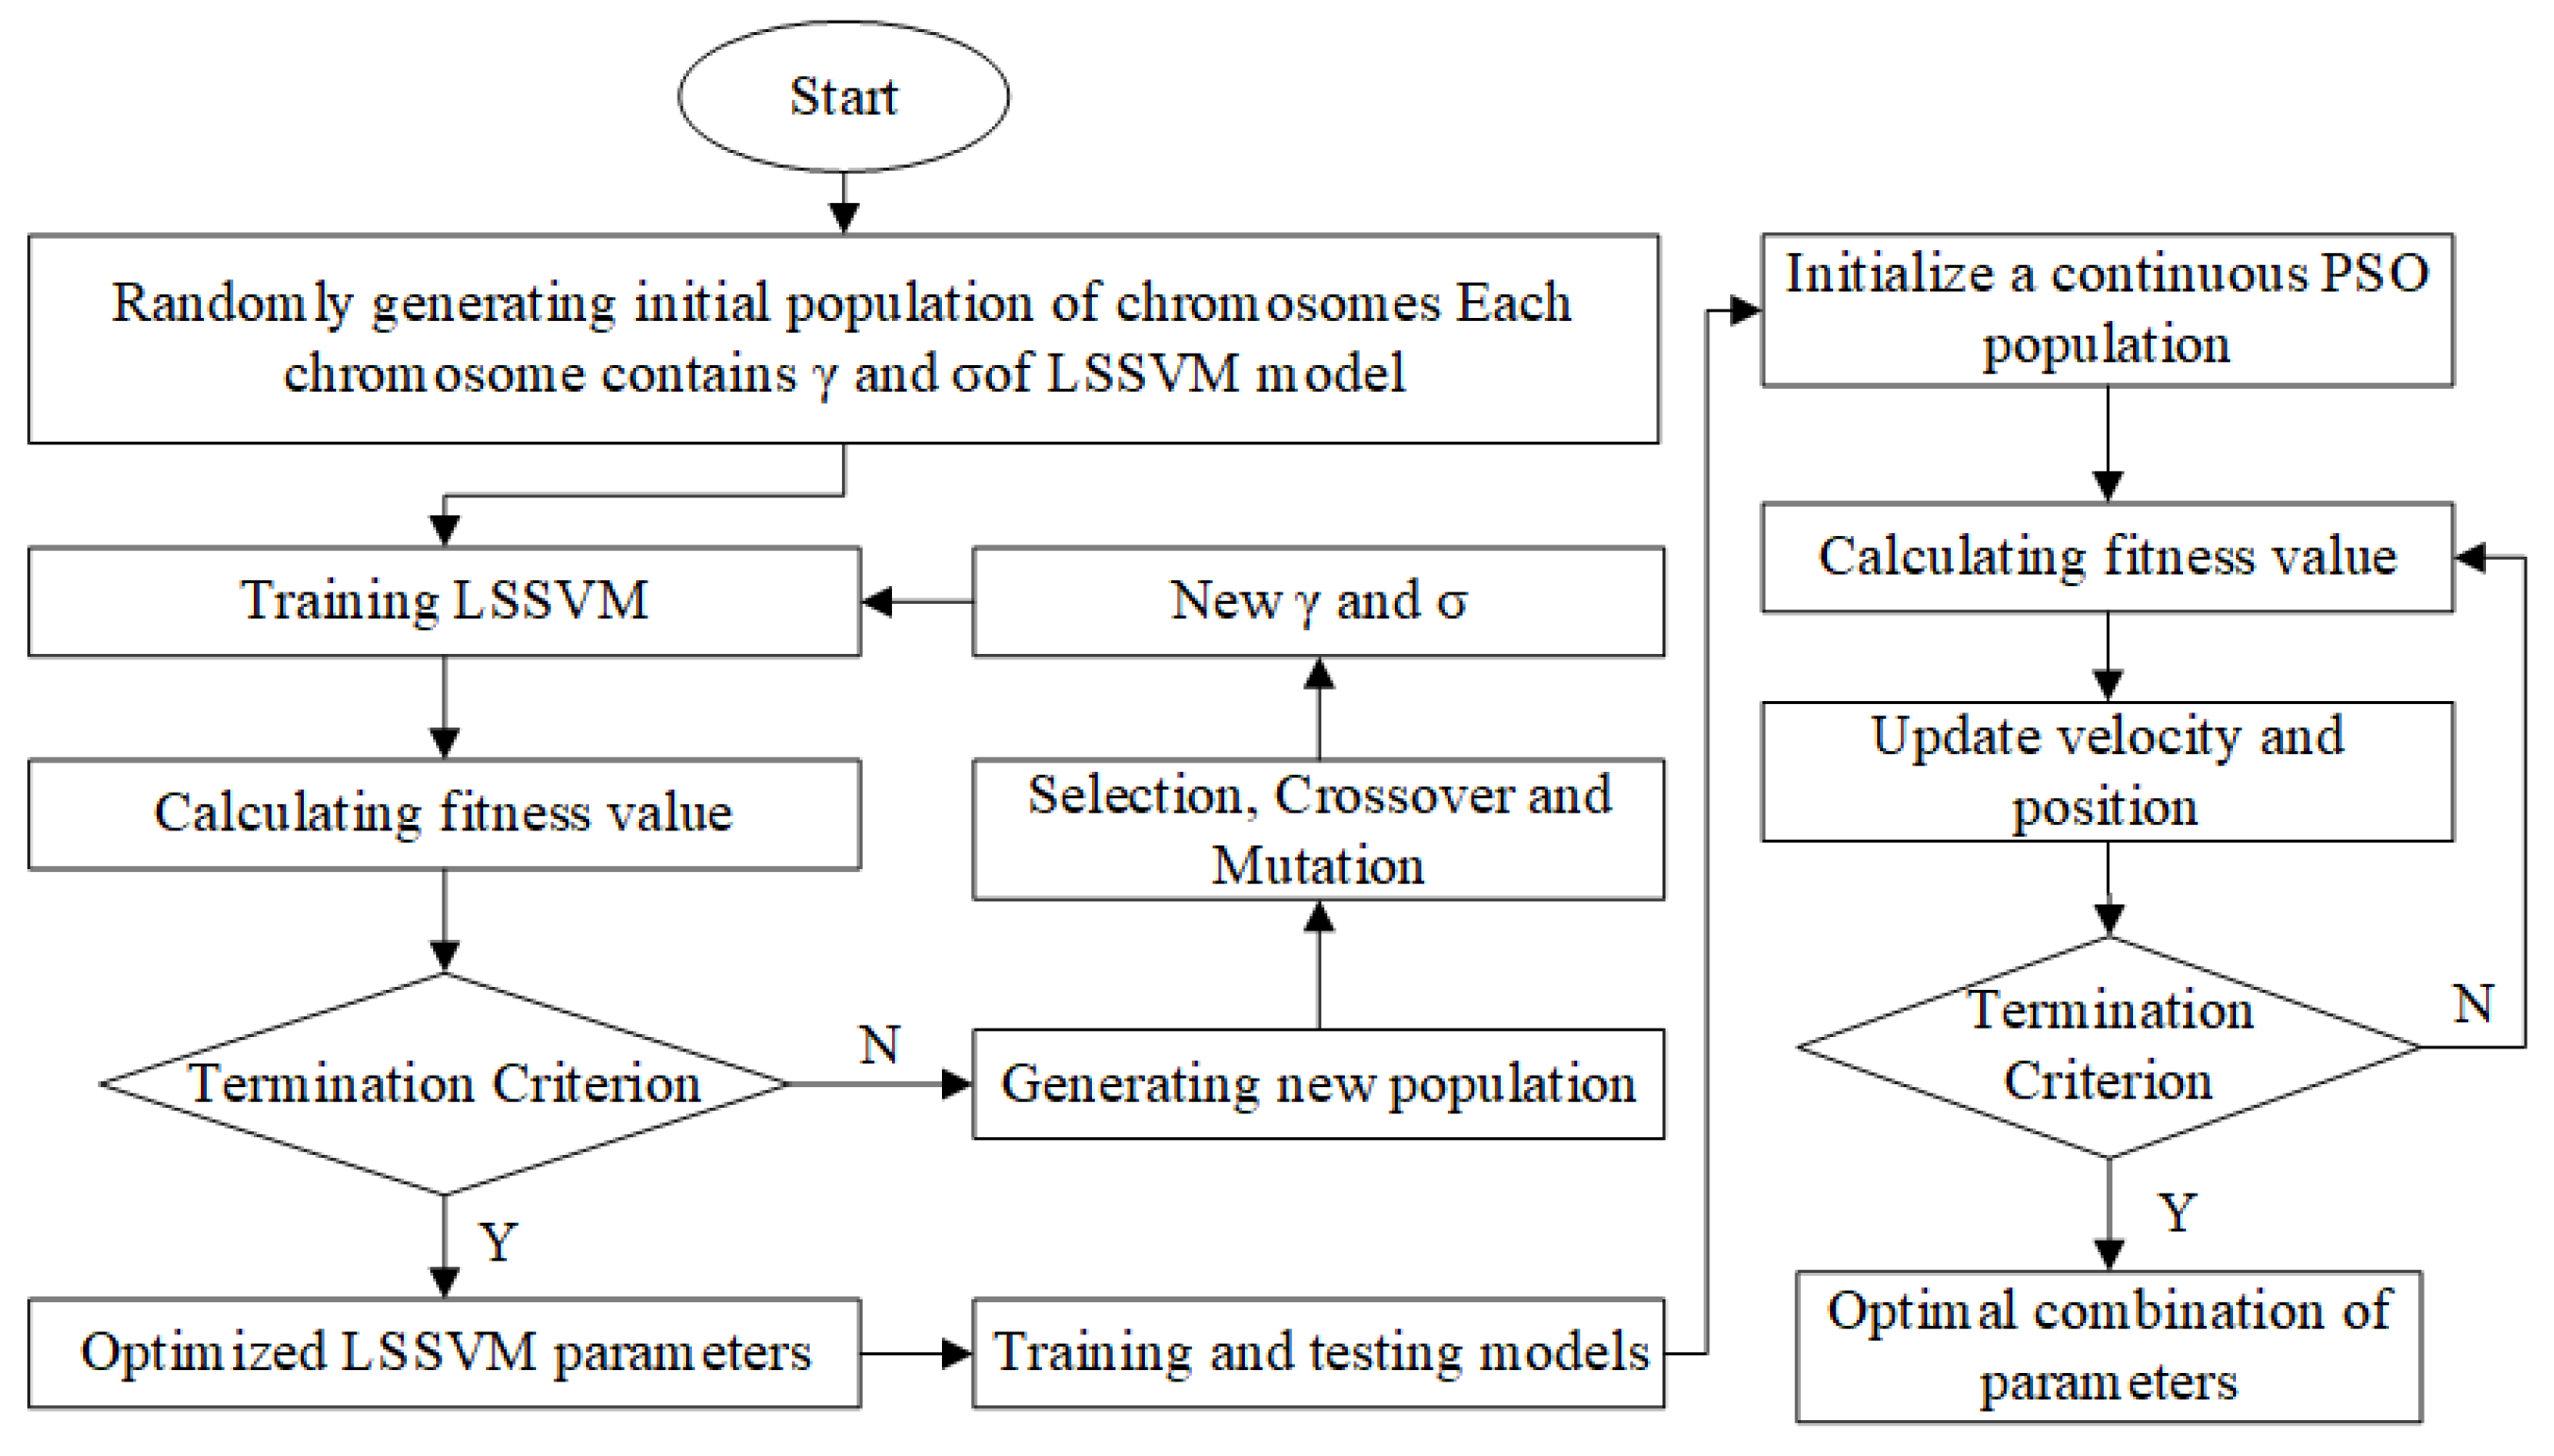
The optimization process for control parameters is illustrated in Figure 1. Initially, a GA is employed to perform iterative calculations on the LSSVM network, facilitating the construction of a regression function model. Subsequently, PSO is applied to identify the optimal values, thereby determining the optimal control parameters for reverse circulation drilling. All machine learning algorithms (GA-LSSVM and PSO) were implemented using in-house developed codes written in MATLAB R2024a.
Figure 1.
Artificial intelligence algorithm optimization scheme.
3. CFD Simulation
3.1. Reverse Circulation Principle
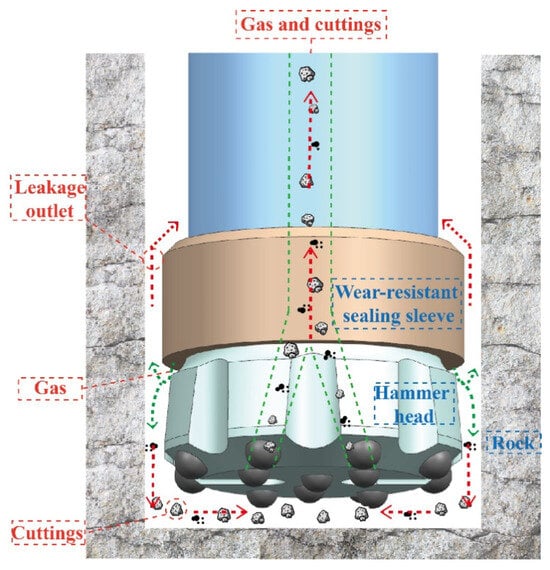
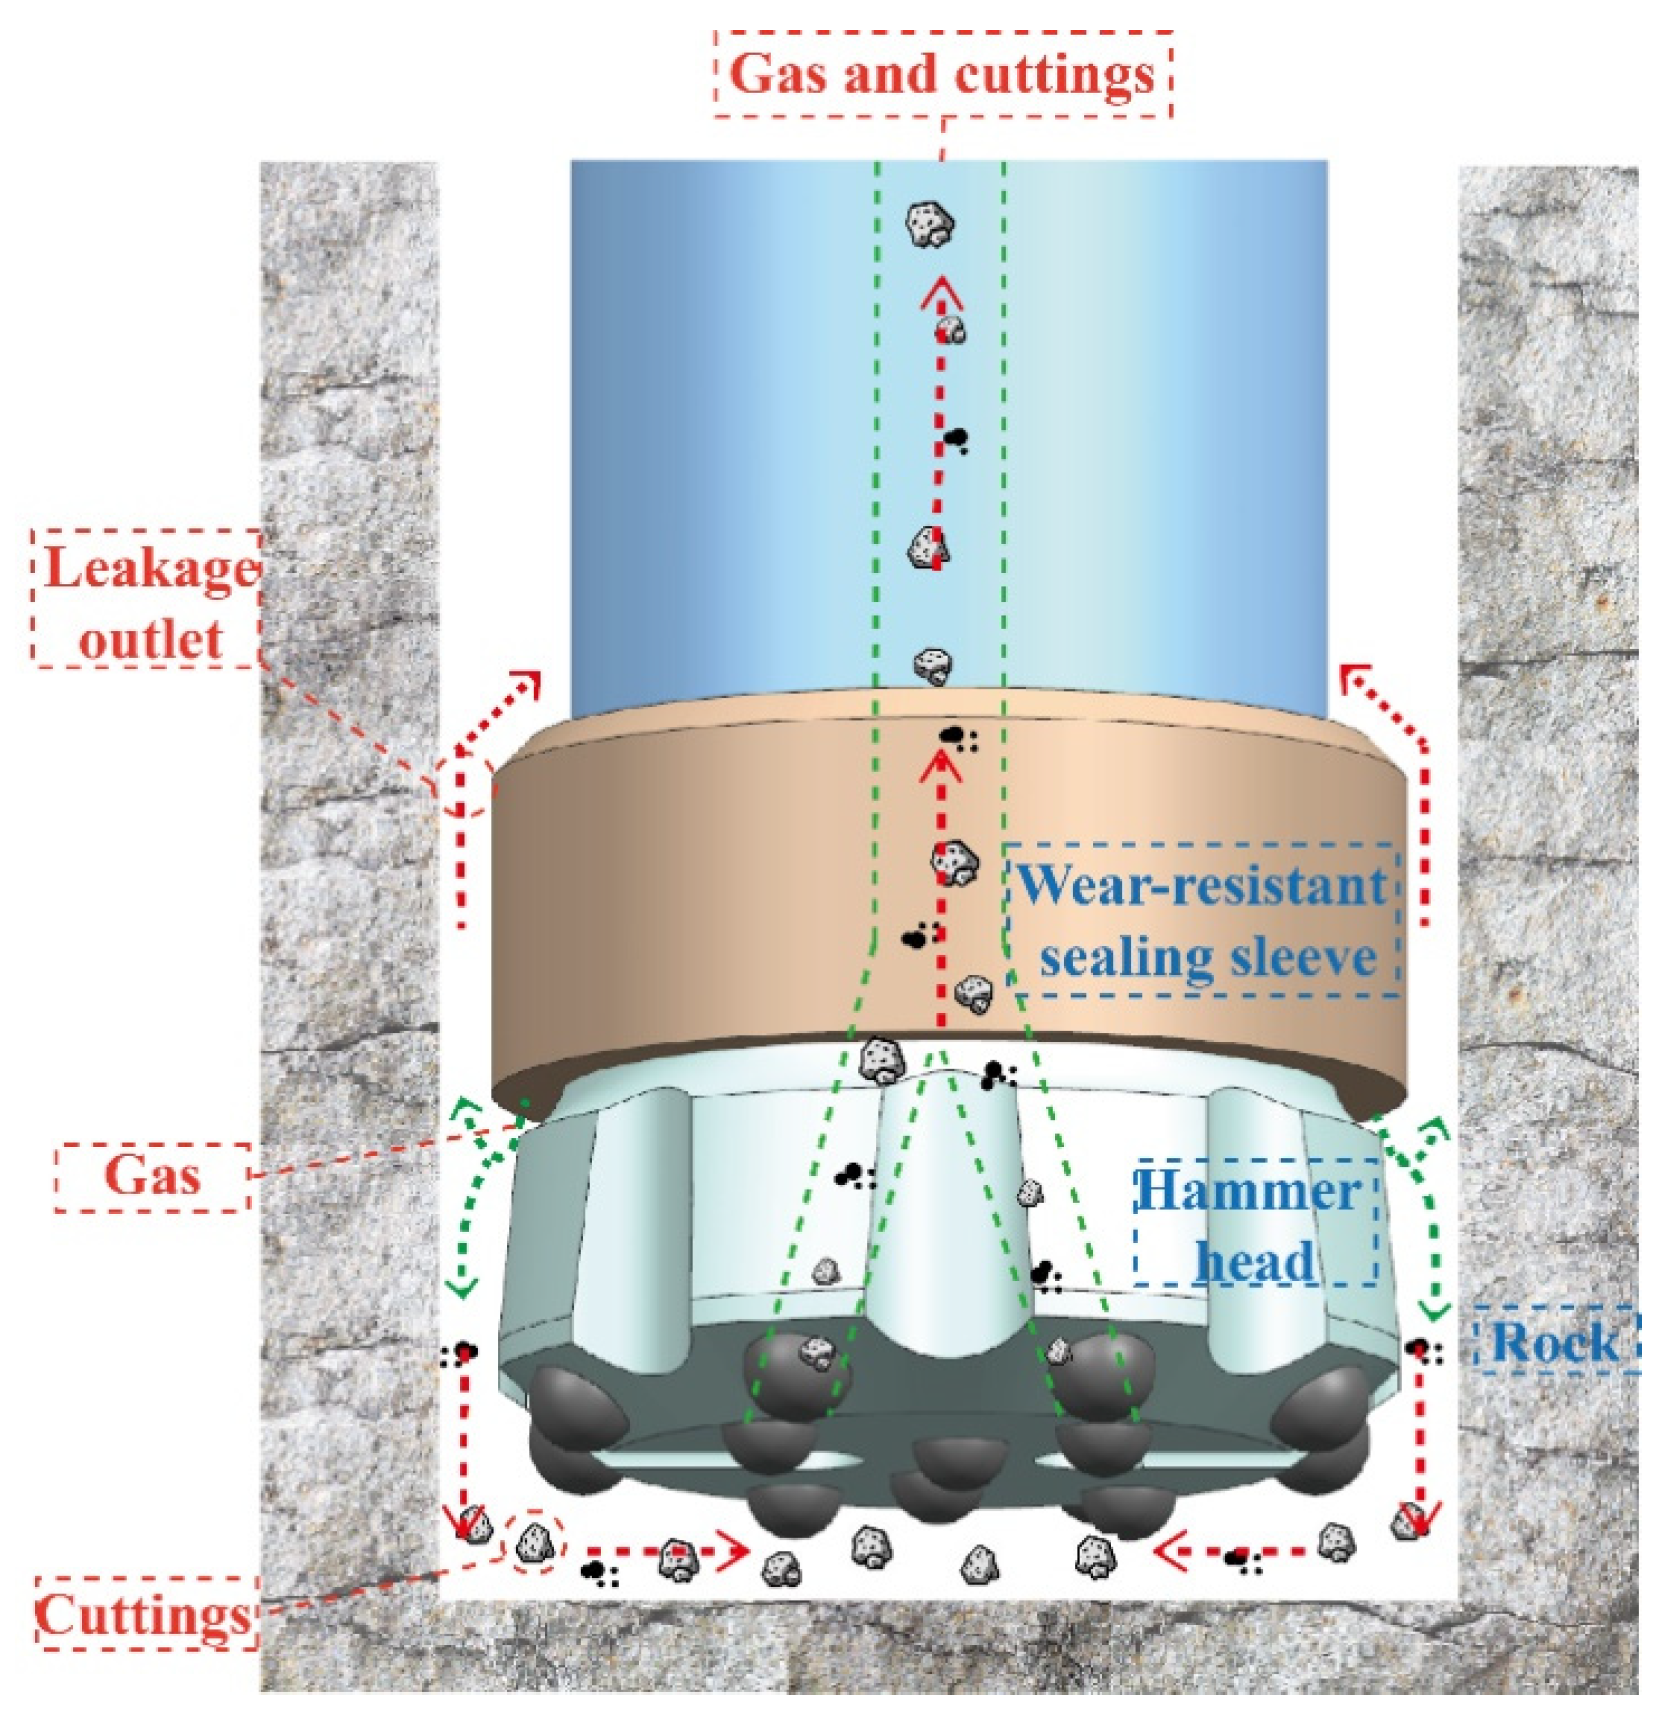
High-pressure gas drives the piston of the down-the-hole hammer to strike the hammer body, thereby transmitting impact loads to the tungsten carbide button inserts. In combination with the rotational shearing action of the drilling assembly, this process induces volumetric rock fragmentation at the hammer face and generates cuttings. Pneumatic RC-DTH drilling technology differs from conventional methods by using a reverse circulation approach, as illustrated in Figure 2, which transports cuttings to the surface through the central channel of the drill rod and bit [35,36]. This technology uses equipment such as double-walled drill rods, air inlet and outlet pipelines, a through-type pneumatic DTH hammer, and an air compressor. The air compressor generates high-pressure gas that enters the annulus of the double-walled drill rod to drive the pneumatic DTH hammer. Then, the gas is expelled through lateral flow grooves on the drill bit. Part of the gas carries the cuttings through bottom flow channels into the central channel of the double-walled drill rod, discharging them to the surface. Another portion leaks through the gap between the wear-resistant sealing sleeve and the wellbore wall. The CFD analysis focuses only on the borehole bottom flow field and the transport and recovery of cuttings by reverse circulation, while the rock-breaking and cutting generation processes are not modeled and are considered only as background physical processes. The reverse circulation flow ratio is defined as the ratio of the reverse circulation outlet air volume flow to the inlet air volume flow , and the calculation formula is:
Figure 2.
Schematic diagram of reverse circulation drilling principle.
3.2. Boundary Conditions and Mesh Independence Test
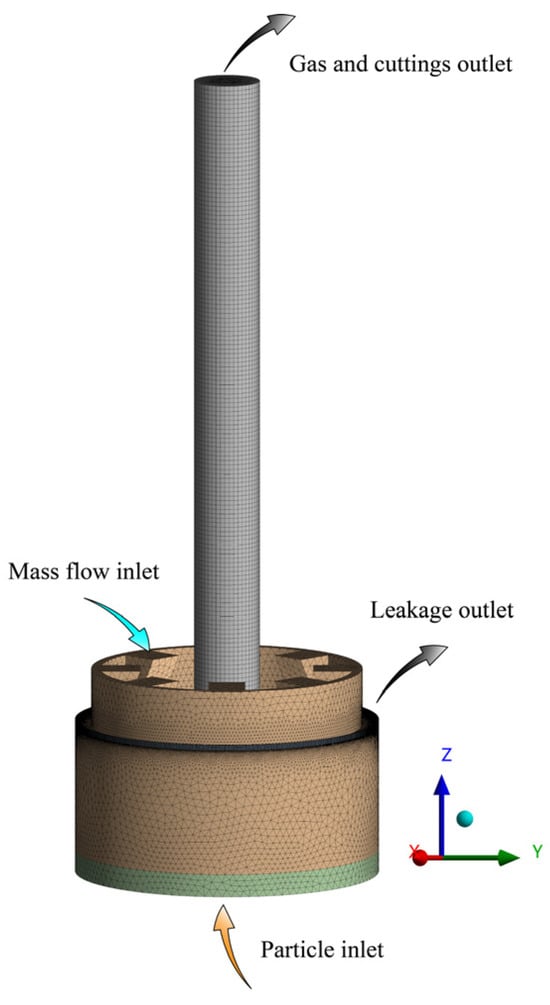
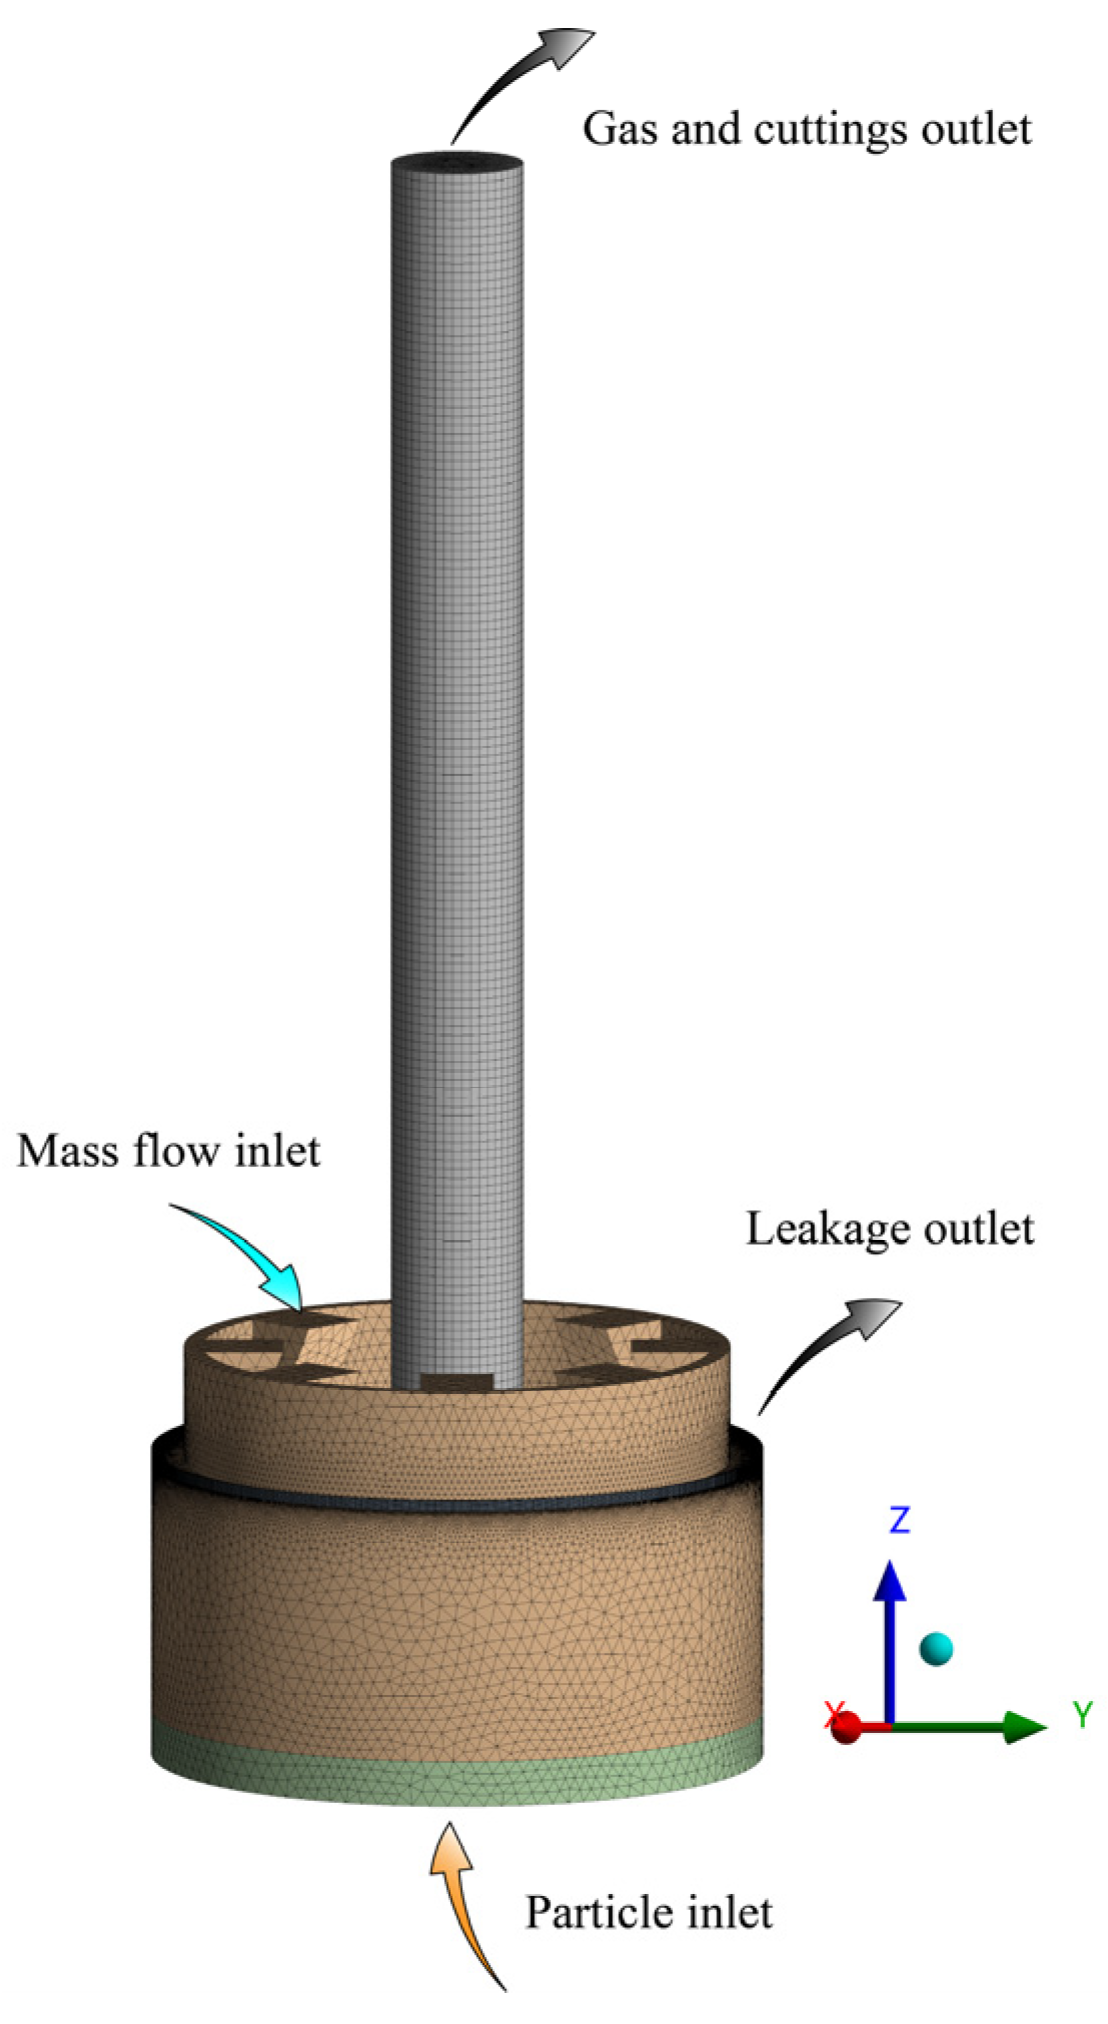
A computational model was established based on the Mt. Roseby Hill project [37] and the hammer diameters used in engineering applications of RC-DTH drilling. The model employs an RC bit with a diameter of 133 mm, with the bit face positioned 10 mm above the borehole bottom. The particle inlet is taken as the origin of the model. The bit is equipped with eight 16 mm outer orifices and six 14 mm inner orifices. The typical grid model and boundary conditions of the computing domain are shown in Figure 3. The following assumptions were adopted in the present model: (i) the masses of both phases are conserved and each phase is treated as incompressible; (ii) the size and density of the cuttings are assumed to be uniform within a specified range; and (iii) only gas leakage is assumed to occur at the borehole bottom.
Figure 3.
Typical grid model and boundary conditions of computational domain.
Turbulence was modeled using the standard k-ε model, which solves for turbulent kinetic energy () and its dissipation rate (). Compared with the realizable k–ε and k–ω SST turbulence models, the standard k–ε model was selected in this study because of its higher numerical robustness, computational efficiency, and stable convergence behavior. Moreover, the standard k–ε model has been extensively validated and widely applied in gas–solid multiphase flows and pneumatic conveying systems [13,38]. Since the present work does not aim to resolve near-wall turbulence structures in detail, the standard k–ε model was adopted to enhance numerical stability and reduce computational cost. This choice constitutes a limitation of the present study.
Near-wall flow was treated with the standard wall function approach. Pressure–velocity coupling was achieved using the SIMPLE algorithm, while spatial discretization of the volume fraction equation employed the QUICK scheme. All other transport equations were discretized using a second-order upwind scheme. The inlet was specified as a mass-flow-inlet boundary condition, whereas both the reverse circulation outlet and the leakage flow outlet were defined as pressure outlets. Owing to the use of wall functions, no boundary layer mesh refinement was applied near the walls. The particles are regarded as an ideal sphere with volume and corresponding mass, regardless of the influence of particle shape and other factors. The cuttings inlet was set as a velocity-inlet boundary condition. Other simulation parameters are shown in Table 1.
Table 1.
Selection of parameters used in the simulations [13].
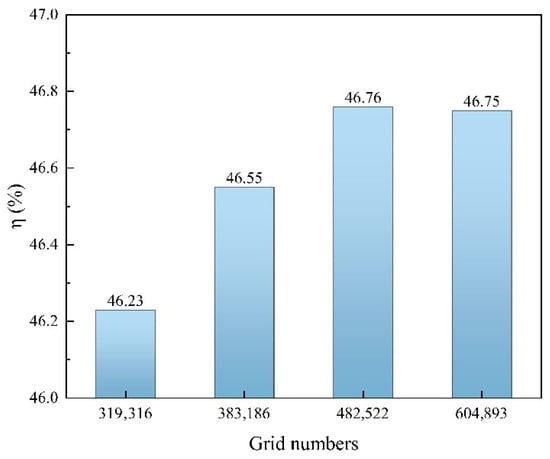
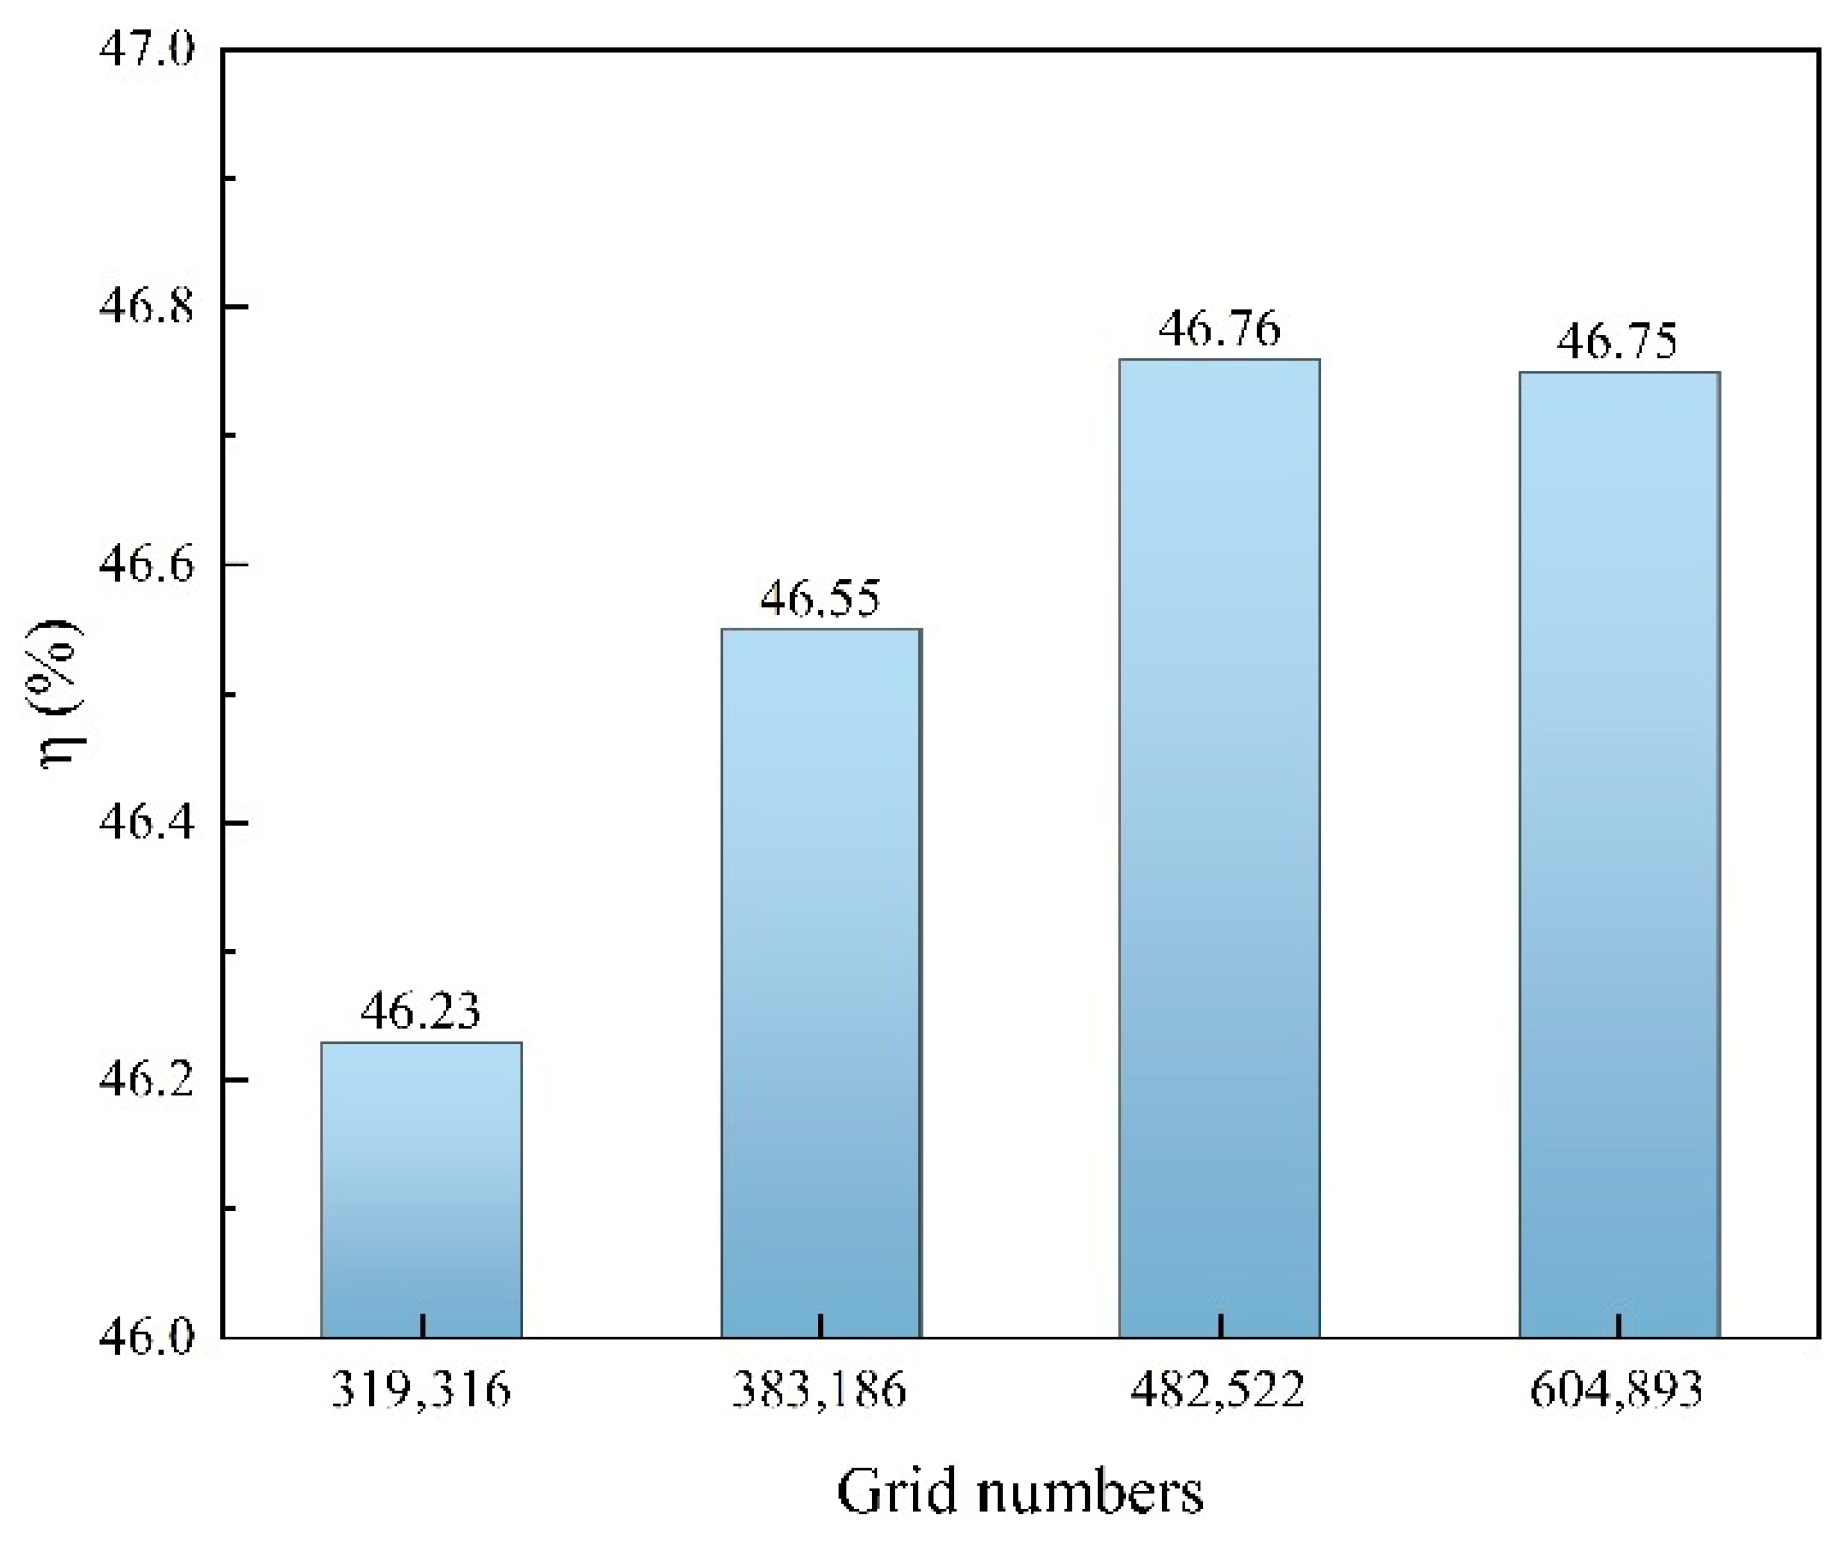
The computational domain was discretized using an unstructured tetrahedral mesh, with local mesh refinement applied near the gas leakage outlet. A grid independence study was conducted using four different mesh resolutions, as shown in Figure 3 and Figure 4. The grid sizes were 8 mm, 7 mm, 6 mm, and 5 mm, respectively. When the total number of cells reached 482,522 at a grid size of 6 mm, the monitored parameters became essentially grid-independent. Considering both computational efficiency and numerical accuracy, this mesh resolution and cell count were therefore selected for all subsequent simulations.
Figure 4.
Grid independence verification.
3.3. Validation of CFD Simulation
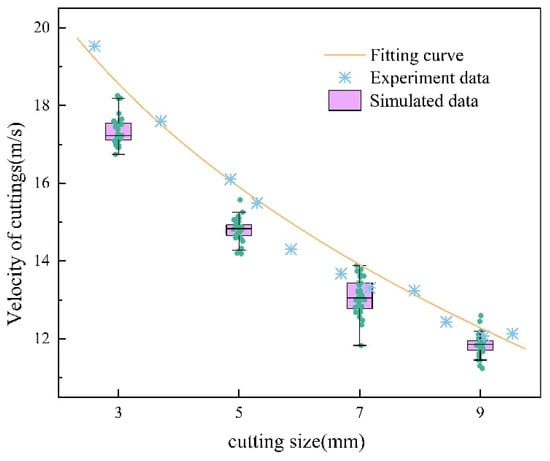
The accuracy of the CFD model was validated against field test data reported by Zhu [39]. The simulation conditions were identical to those in the experiments: a central gas velocity of 45 m/s, a particle density of 2700 kg/m3, and a gas density of 1.29 kg/m3. These parameters were used to predict particle exit velocities. In the CFD results, the gas velocity exhibits a higher value at the center and decreases toward the annulus, thereby producing a velocity distribution for the entrained particles [40].
As shown in Figure 5, the simulated exit velocities of particles with different diameters exhibit the same trend as the experimental data reported by Zhu, namely that the particle velocity decreases with increasing particle diameter [41]. However, the simulated velocities are generally slightly lower than the measured values. This discrepancy mainly arises from the assumption adopted in the CFD model that particles are ideal spheres characterized by equivalent volume diameters. In contrast, the actual particles in the field experiments are highly irregular in shape and include a large proportion of flattened cuttings [42], resulting in larger projected frontal areas. Such irregular geometries promote earlier flow separation and enhance local turbulence, thereby increasing the aerodynamic drag and consequently leading to higher particle acceleration and exit velocities. Although a systematic deviation exists, the simulation results show trends consistent with the experimental measurements, with a maximum relative deviation of 11%. In addition, the pressure drop in the central channel predicted by the simulation is 4745.8 Pa/m, whereas Patro [43] reported a pressure drop in the range of 4500–5222 Pa/m for vertical pipes. This agreement further supports the accuracy of the present CFD model.
Figure 5.
Comparison of CFD simulated particle velocity with experimental data of Zhu [40].
4. Result and Discussion
4.1. The Effect of Particle Size on Reverse Circulation
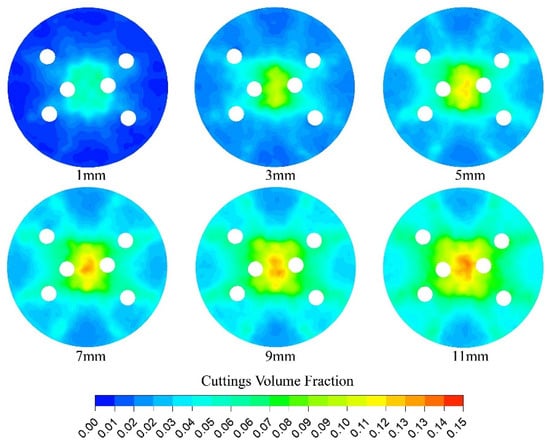
Particle size is affected by rock properties, impact force, impact frequency, and drilling parameters. Therefore, regulating these factors enables control of particle size. The particle size is influenced by the rock properties, impact force, impact frequency, and drilling parameters. Consequently, different drilling conditions produce cuttings with different mean particle sizes. Under practical operating conditions, the cuttings size distribution generally follows a Gandin–Schuhmann distribution [44]. Assuming a monodisperse particle size, the cutting distribution at the borehole bottom can be regulated by controlling the particle size, thereby influencing the degree of rock fragmentation and reducing the likelihood of borehole bottom blockage. The influence of particle diameter on reverse circulation capability is analyzed under the following conditions: , gas volume flow rate , particle density , wellbore enlargement ratio , and rotation speed . As shown in Figure 6, the volumetric fraction of solids increases significantly with increasing particle diameter. This occurs because larger particles experience stronger gravitational forces, reducing their radial migration speed. In addition, due to the lower gas flow velocity in the central region, cuttings tend to accumulate there, leading to repeated fragmentation and deteriorating reverse circulation performance.
Figure 6.
The solid volume fraction cloud diagram under different particle sizes ().
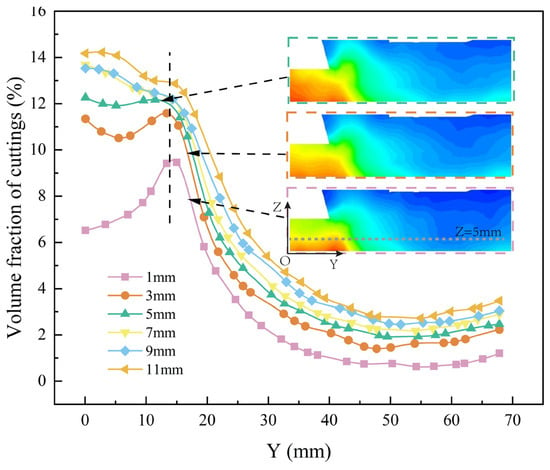
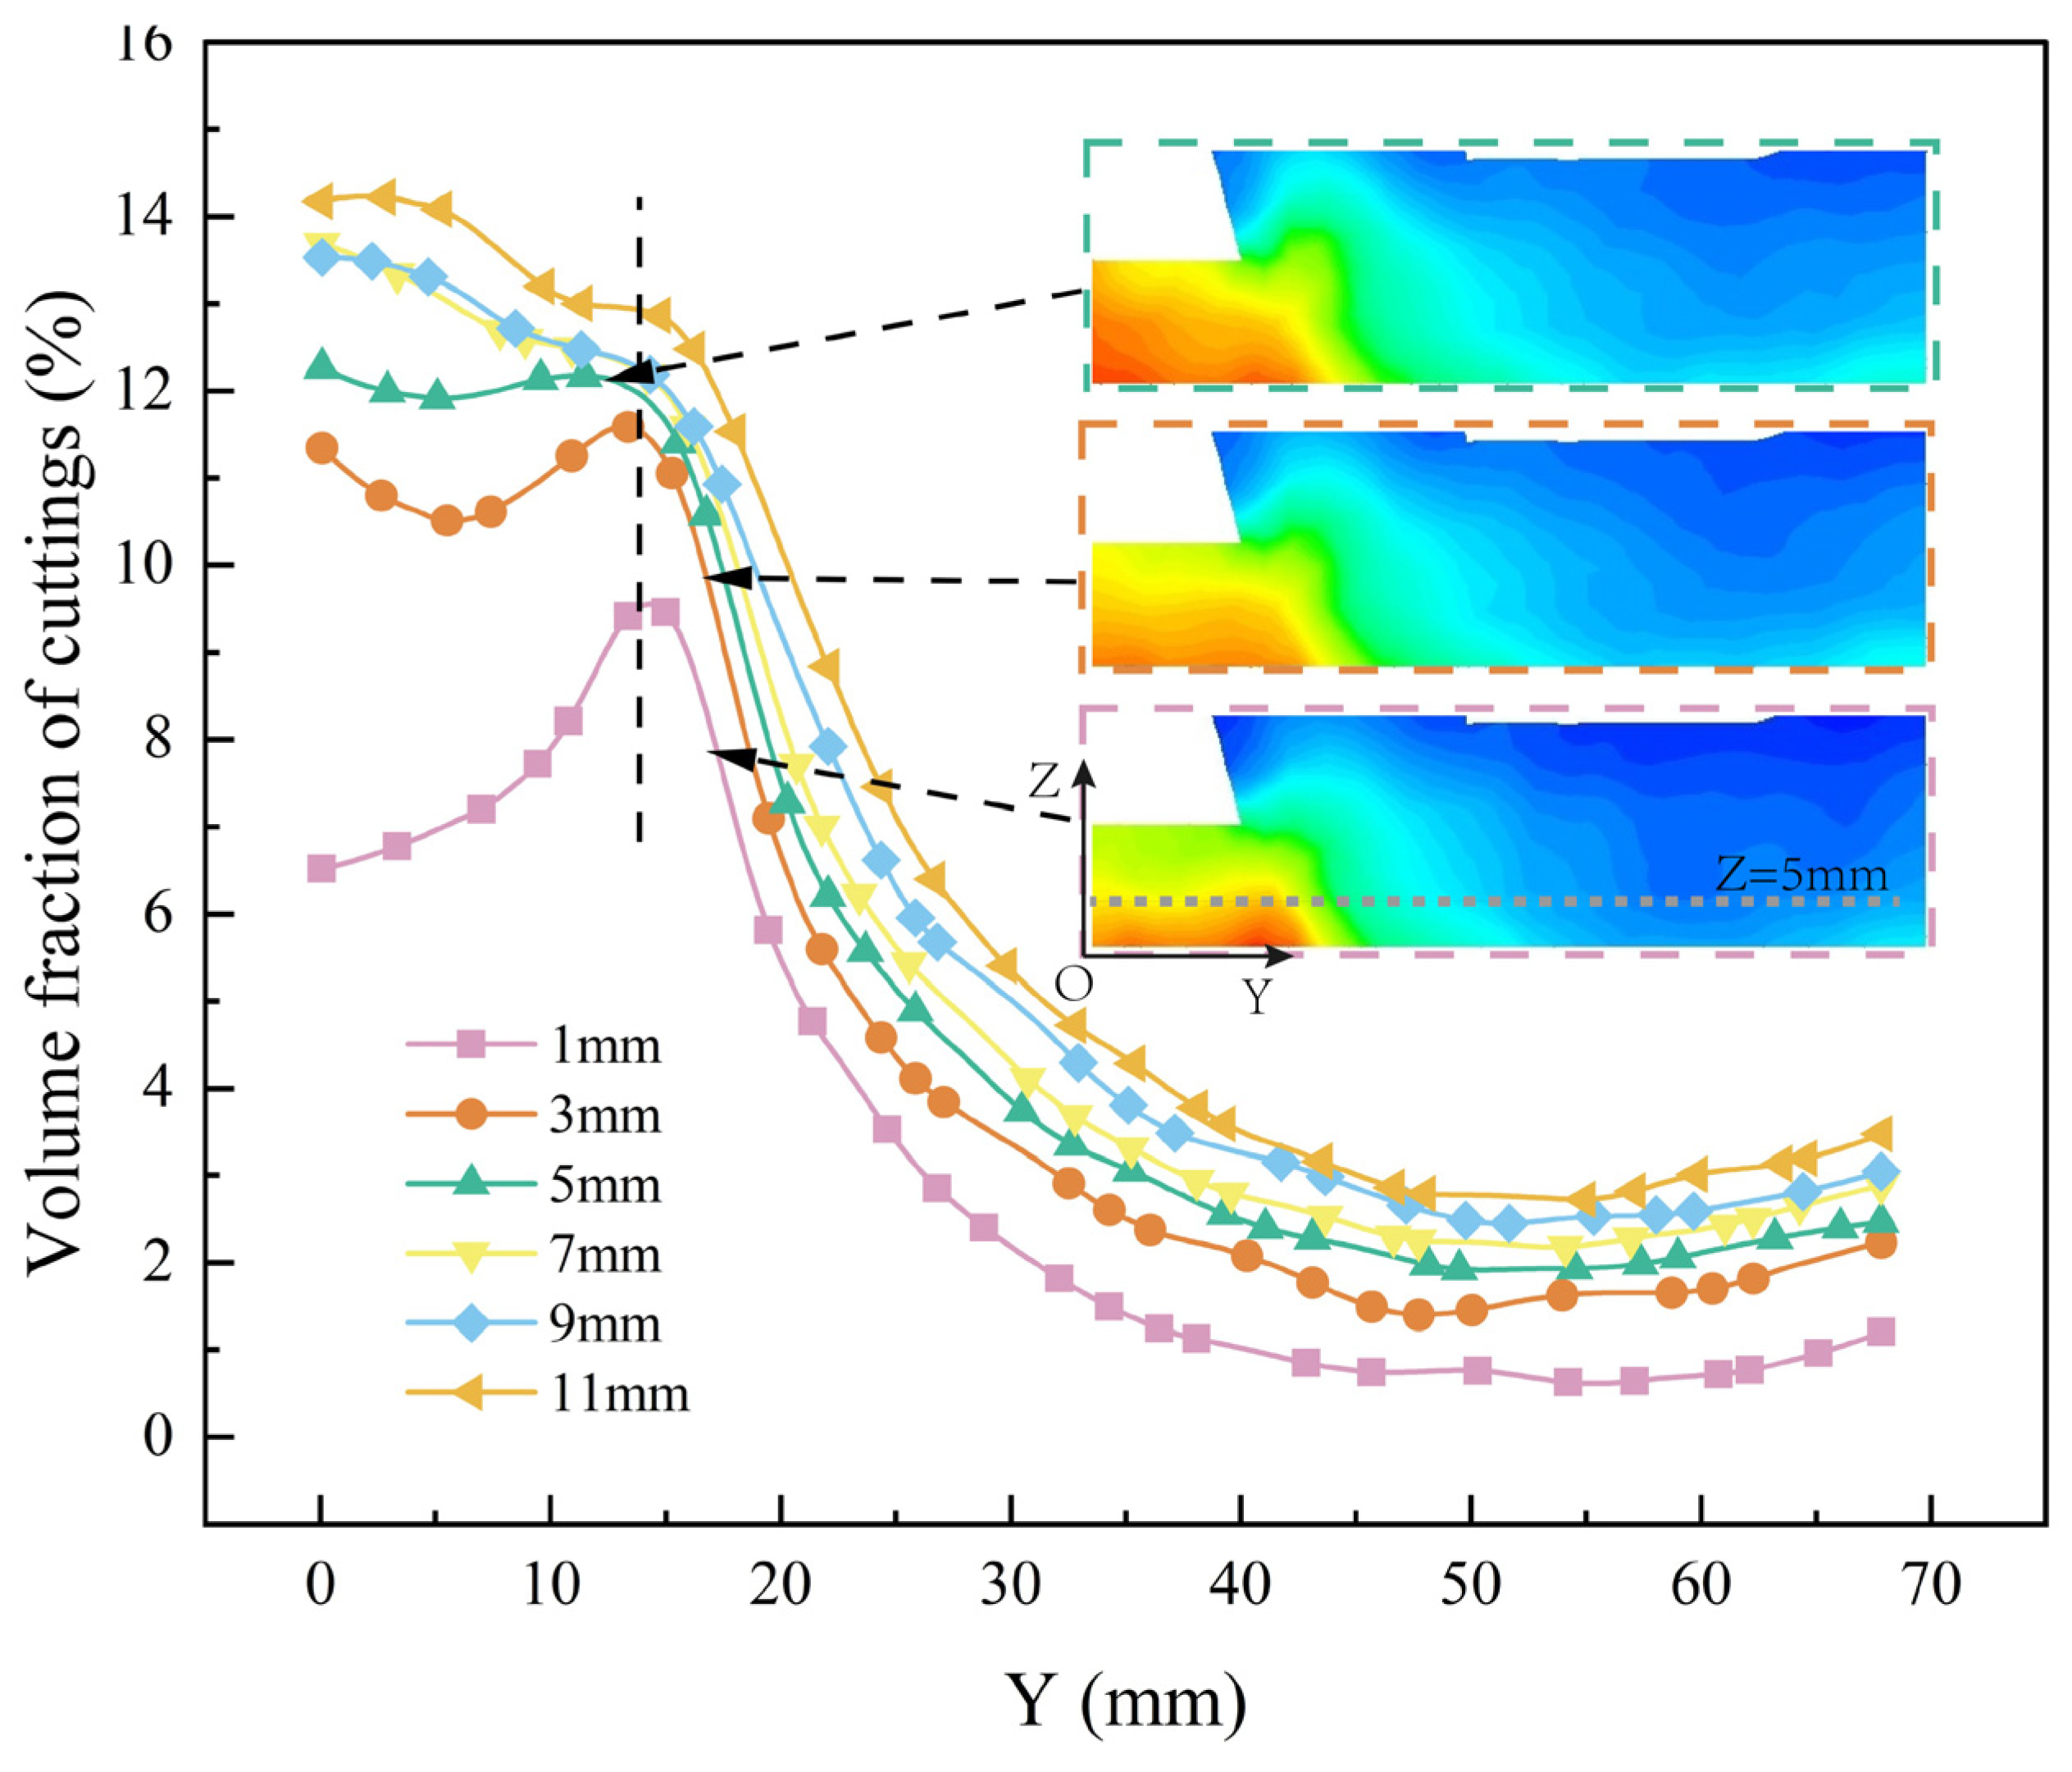
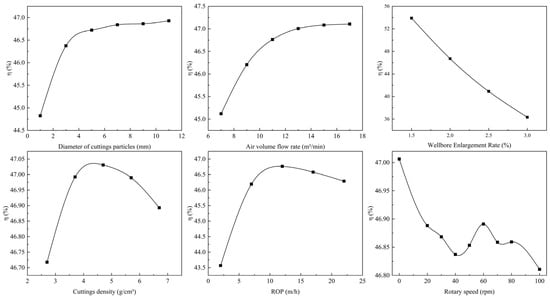
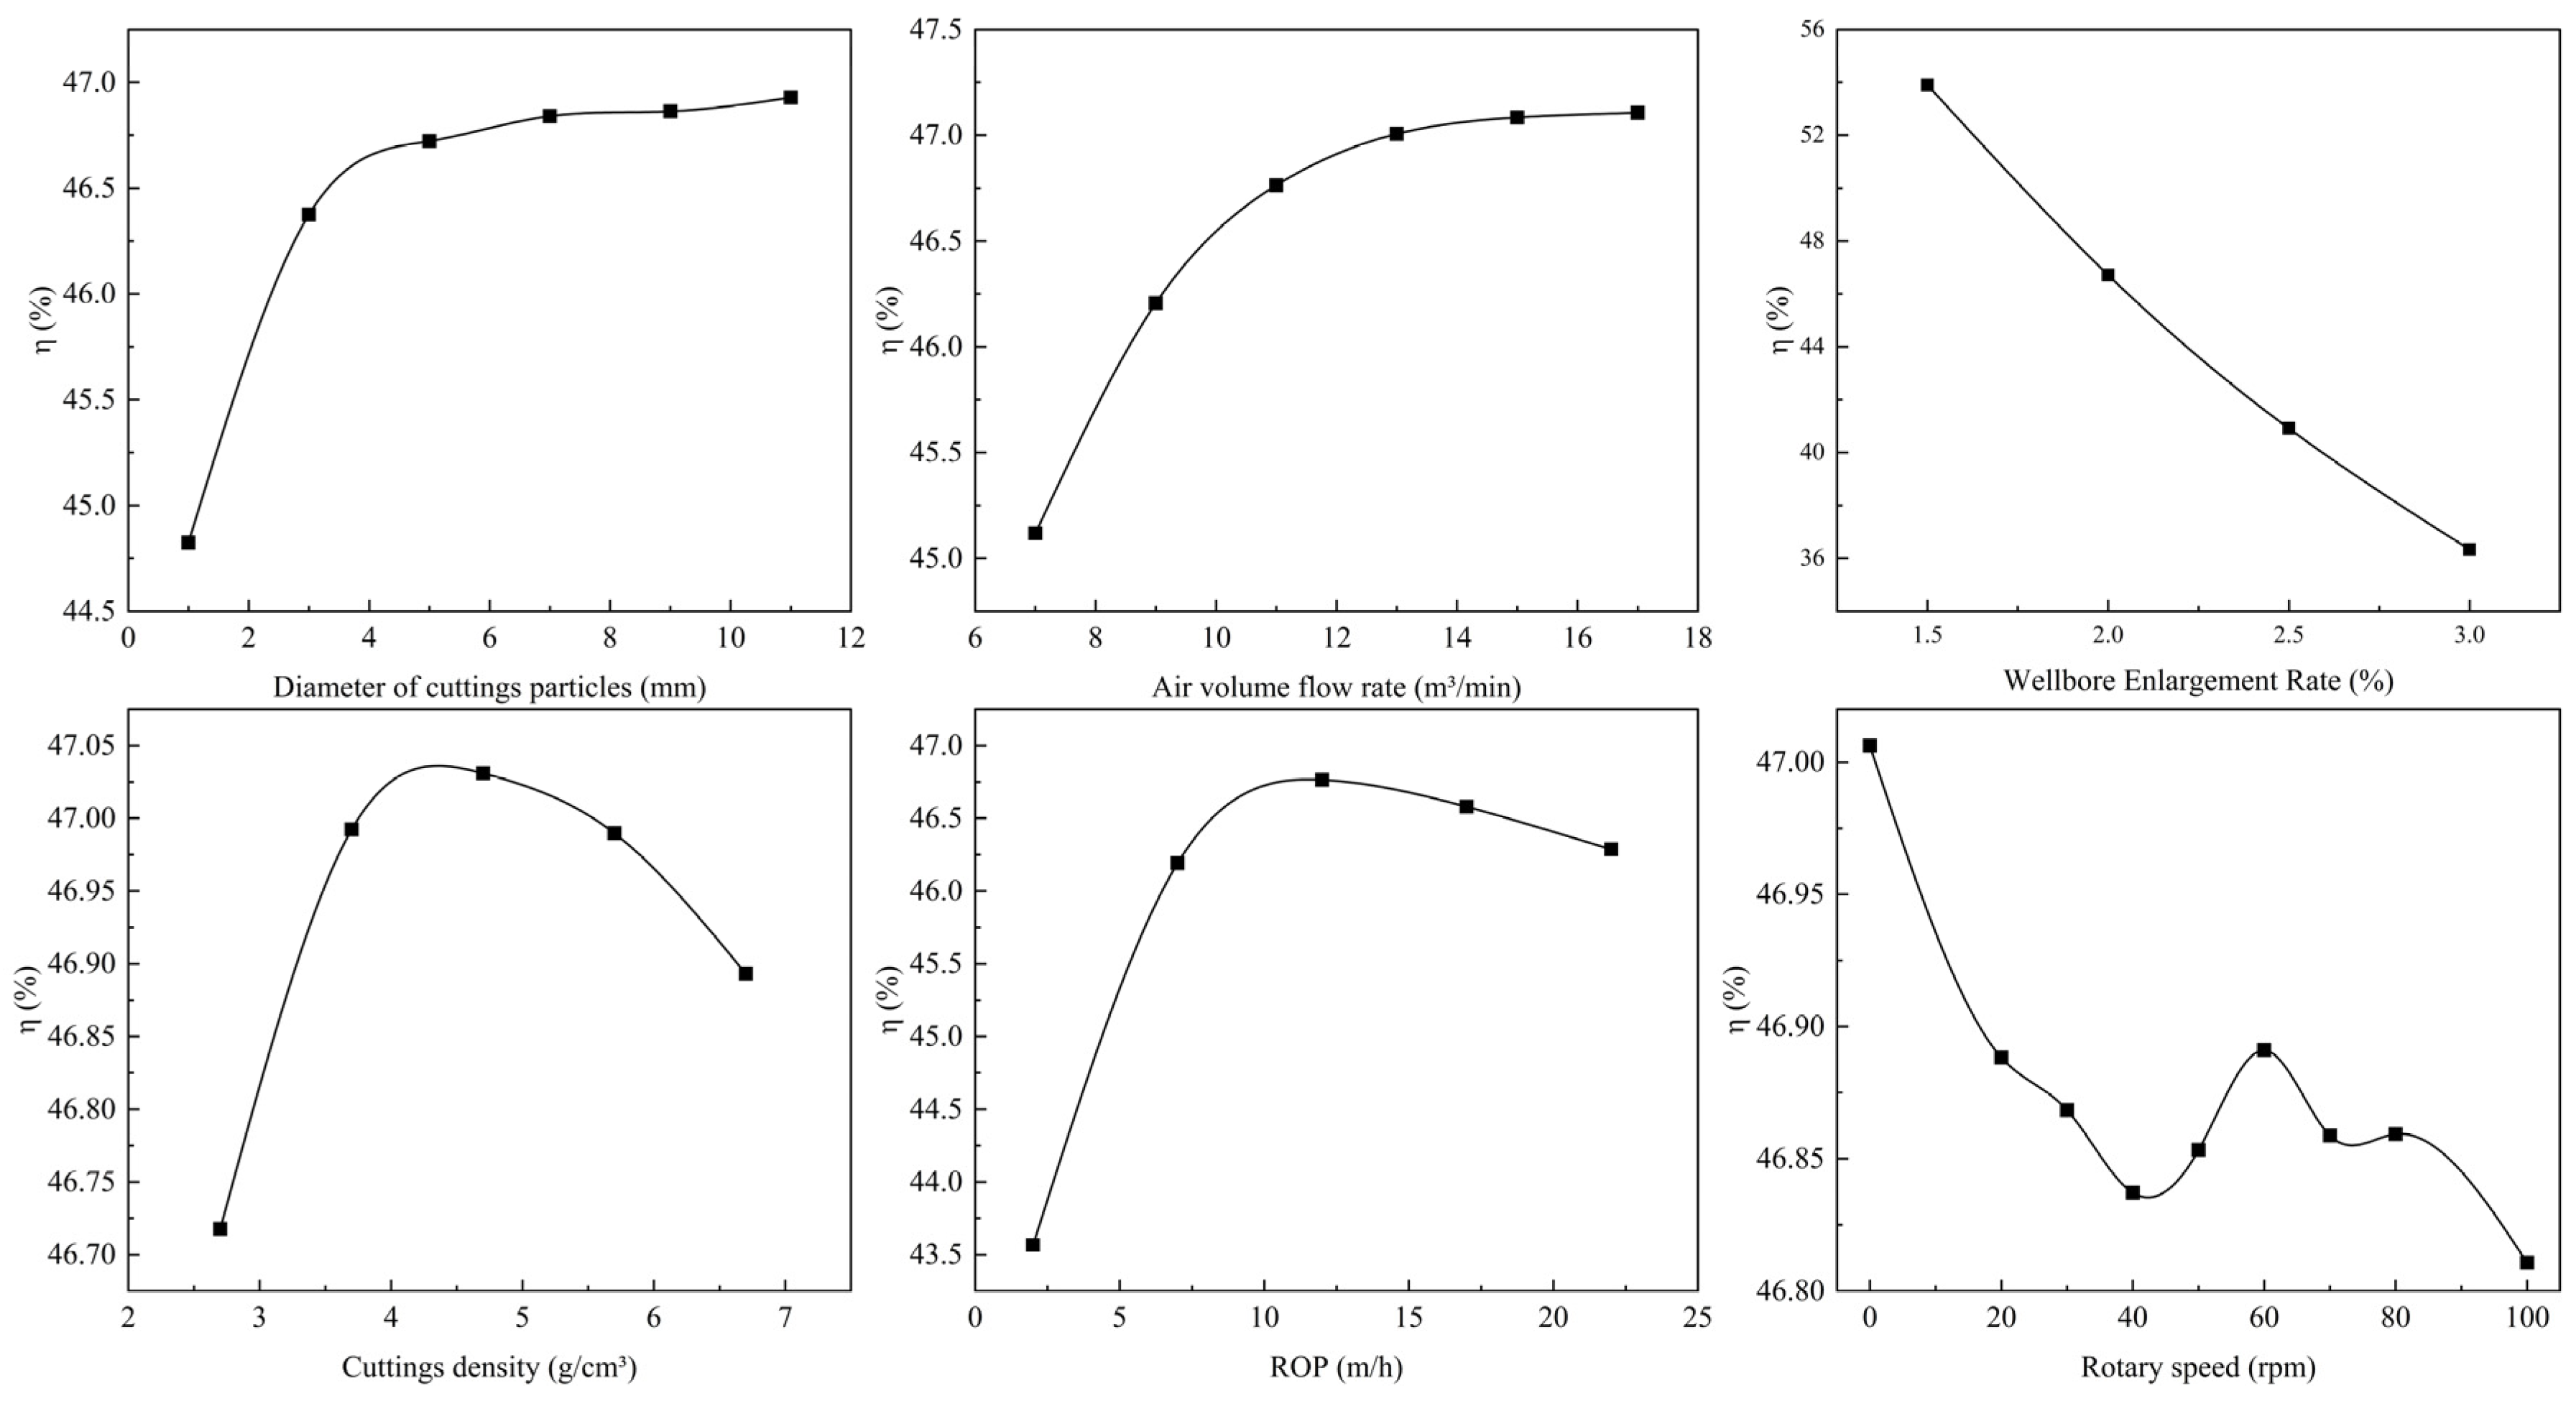
Figure 7 shows the radial distribution of the volumetric fraction of cuttings at 5 mm above the hammer bottom. Cuttings tend to accumulate in the central region, and significant accumulation appears when the particle diameter exceeds 5 mm. This occurs because larger particles have greater weight and higher terminal settling velocity, making migration more difficult and leading to particle buildup. In addition, as shown in Figure 8, increasing particle diameter can improve reverse circulation flow ratio. However, when the diameter exceeds 5 mm, the improvement effect becomes limited. Therefore, within the investigated parameter range and for the 133 mm RC drill bit geometry considered in this study, a particle diameter of approximately 5 mm was found to provide the most favorable reverse circulation performance.
Figure 7.
Solid phase volume fraction diagram under plane with different particle sizes ().
Figure 8.
The influence of various factors on the reverse circulation flow ratio.
4.2. The Effect of Gas Flow Rate on Reverse Circulation
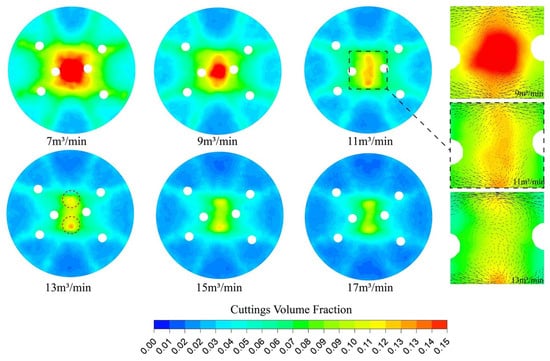
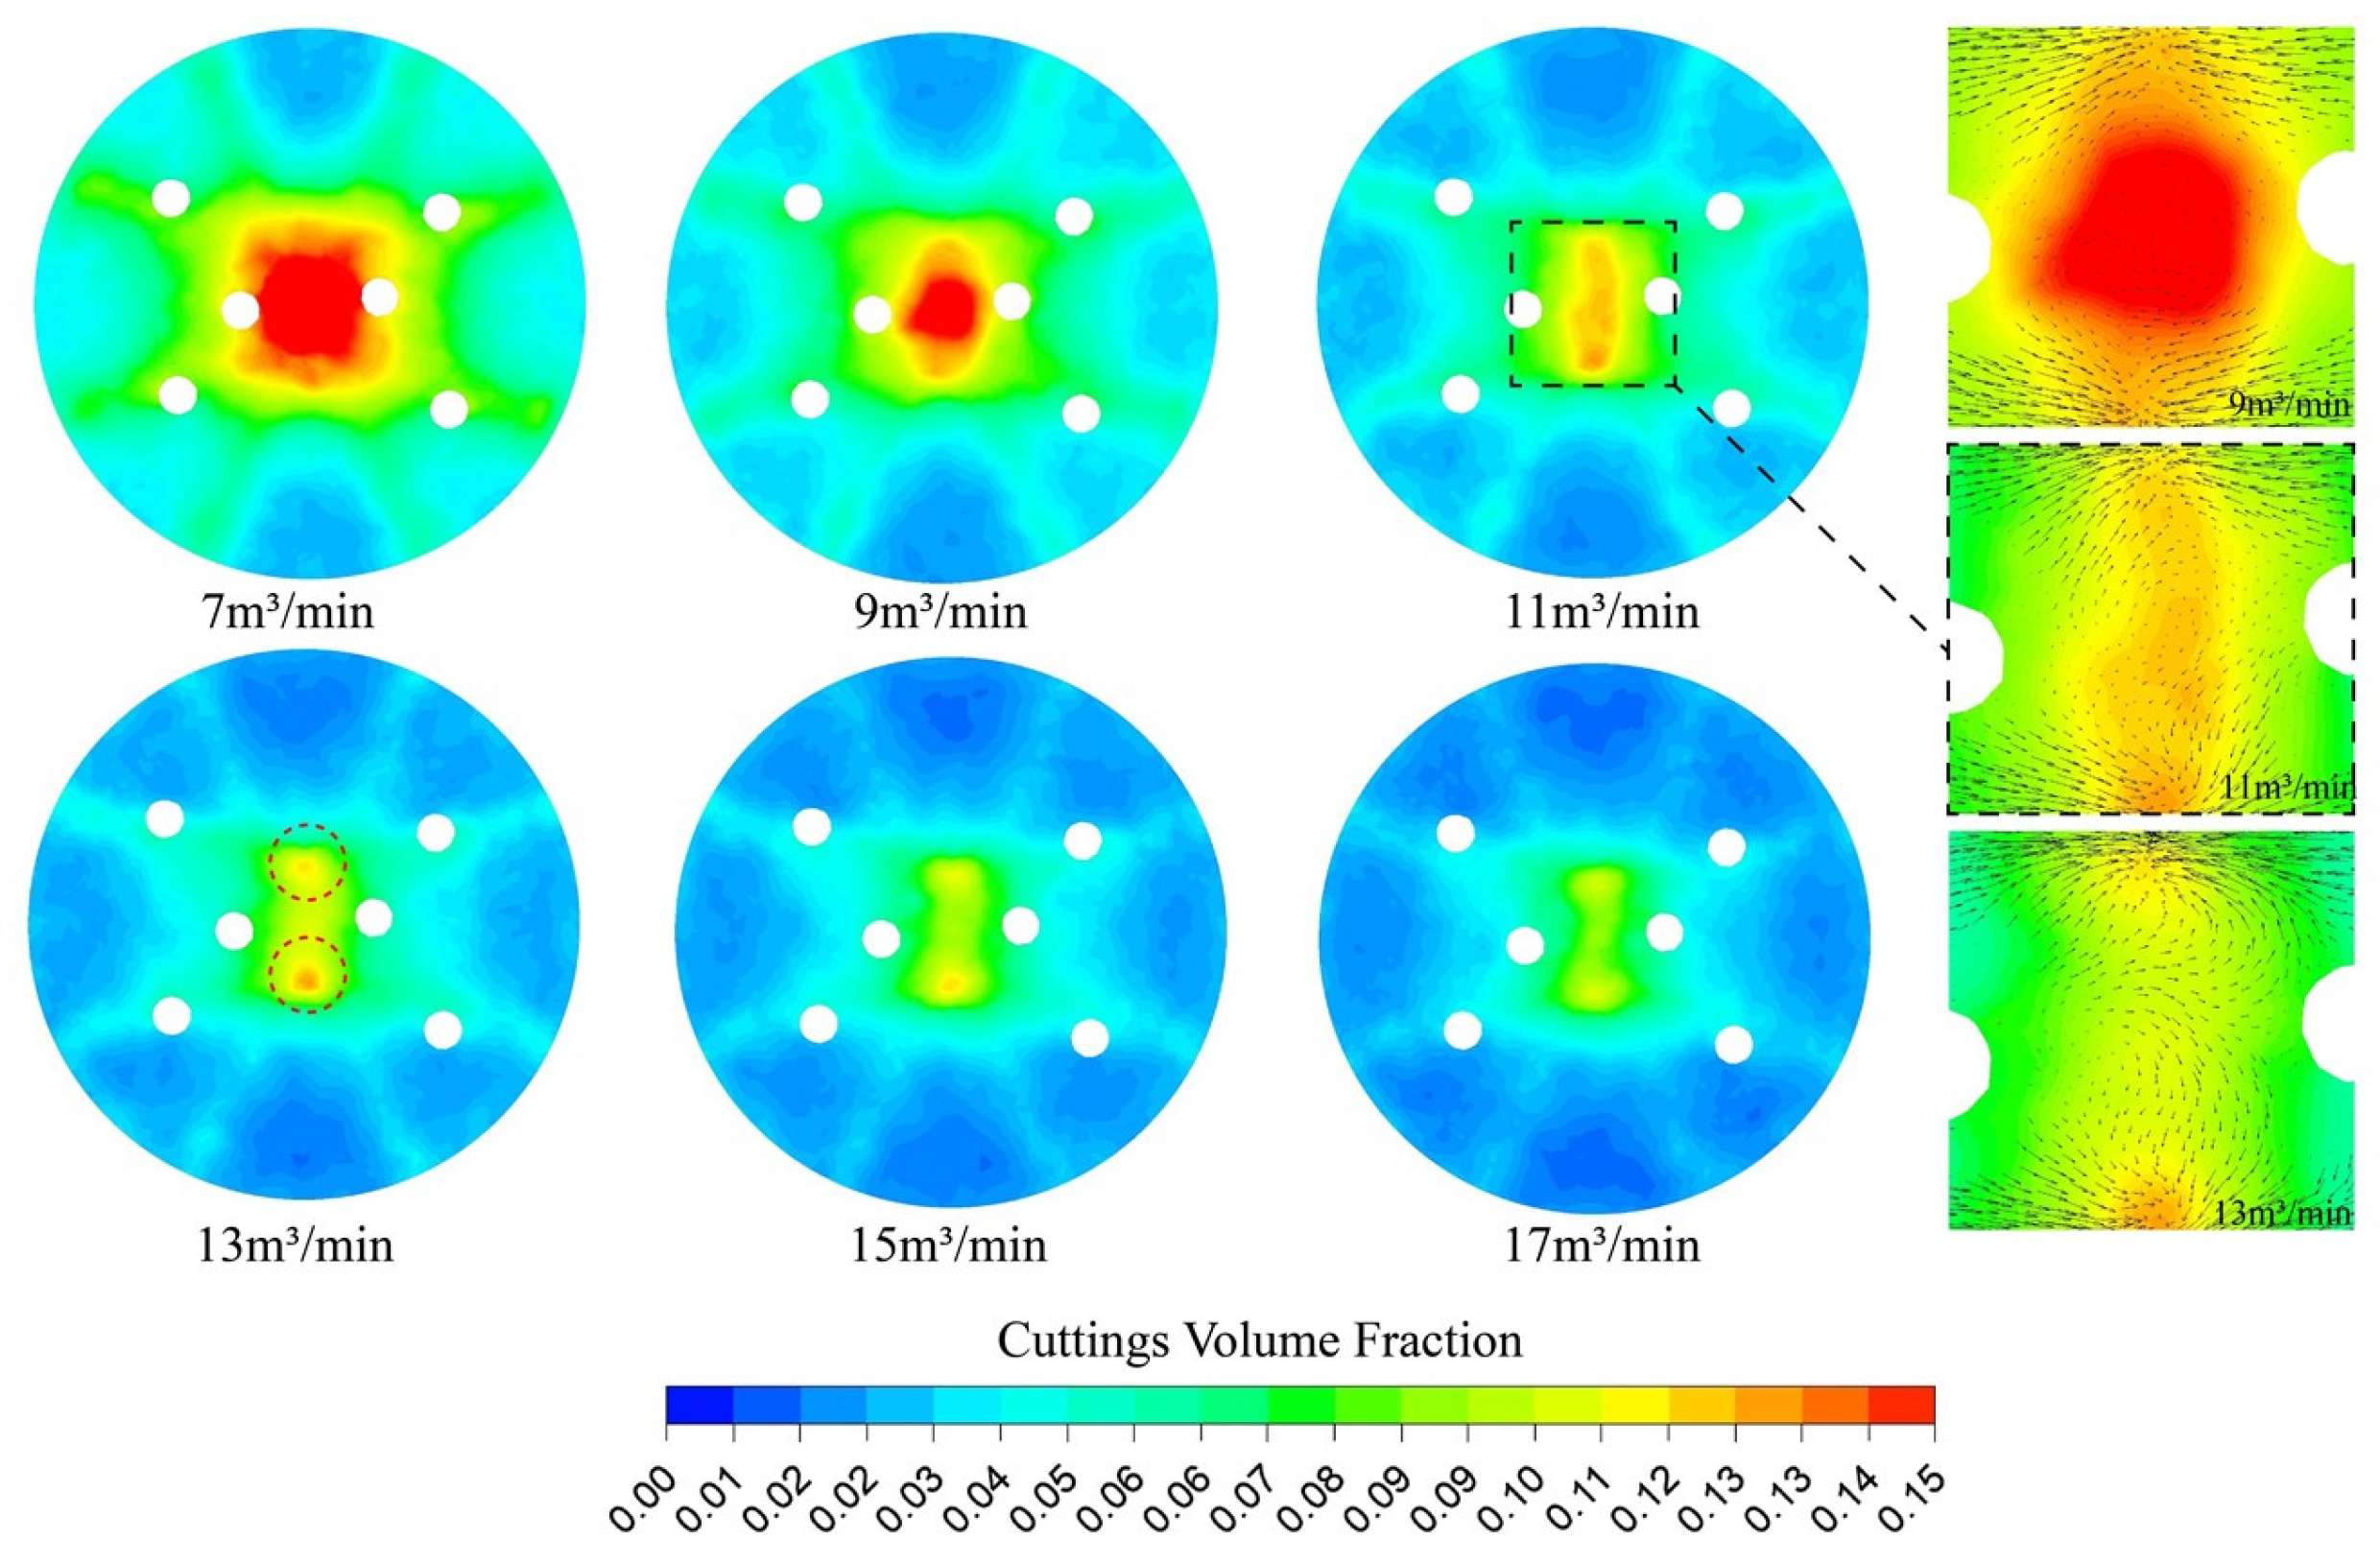
In practical engineering, the piston movement inside the DTH hammer causes fluctuations in the output air volumetric flow rate. However, using a continuous flow model in analytical work still provides meaningful insights [13]. The gas volumetric flow rate is a key parameter in air reverse circulation drilling. A suitable flow rate ensures cost savings while maintaining efficient cutting transport. The influence of gas injection rate on reverse circulation capability is analyzed under the following conditions: , , , and . As shown in Figure 8, increasing the gas flow rate reduces the overall volume fraction of cuttings. Notably, increasing the flow rate from 7 m3/min to 11 m3/min greatly decreases the solid volume fraction in the central region. Furthermore, when the gas flow rate increases to 13 m3/min, the central accumulation zone splits into two separate regions.
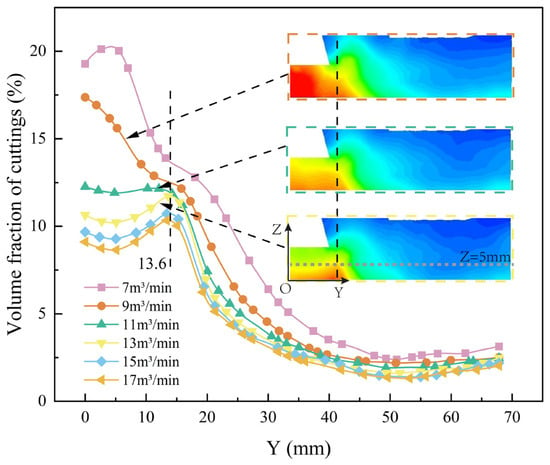
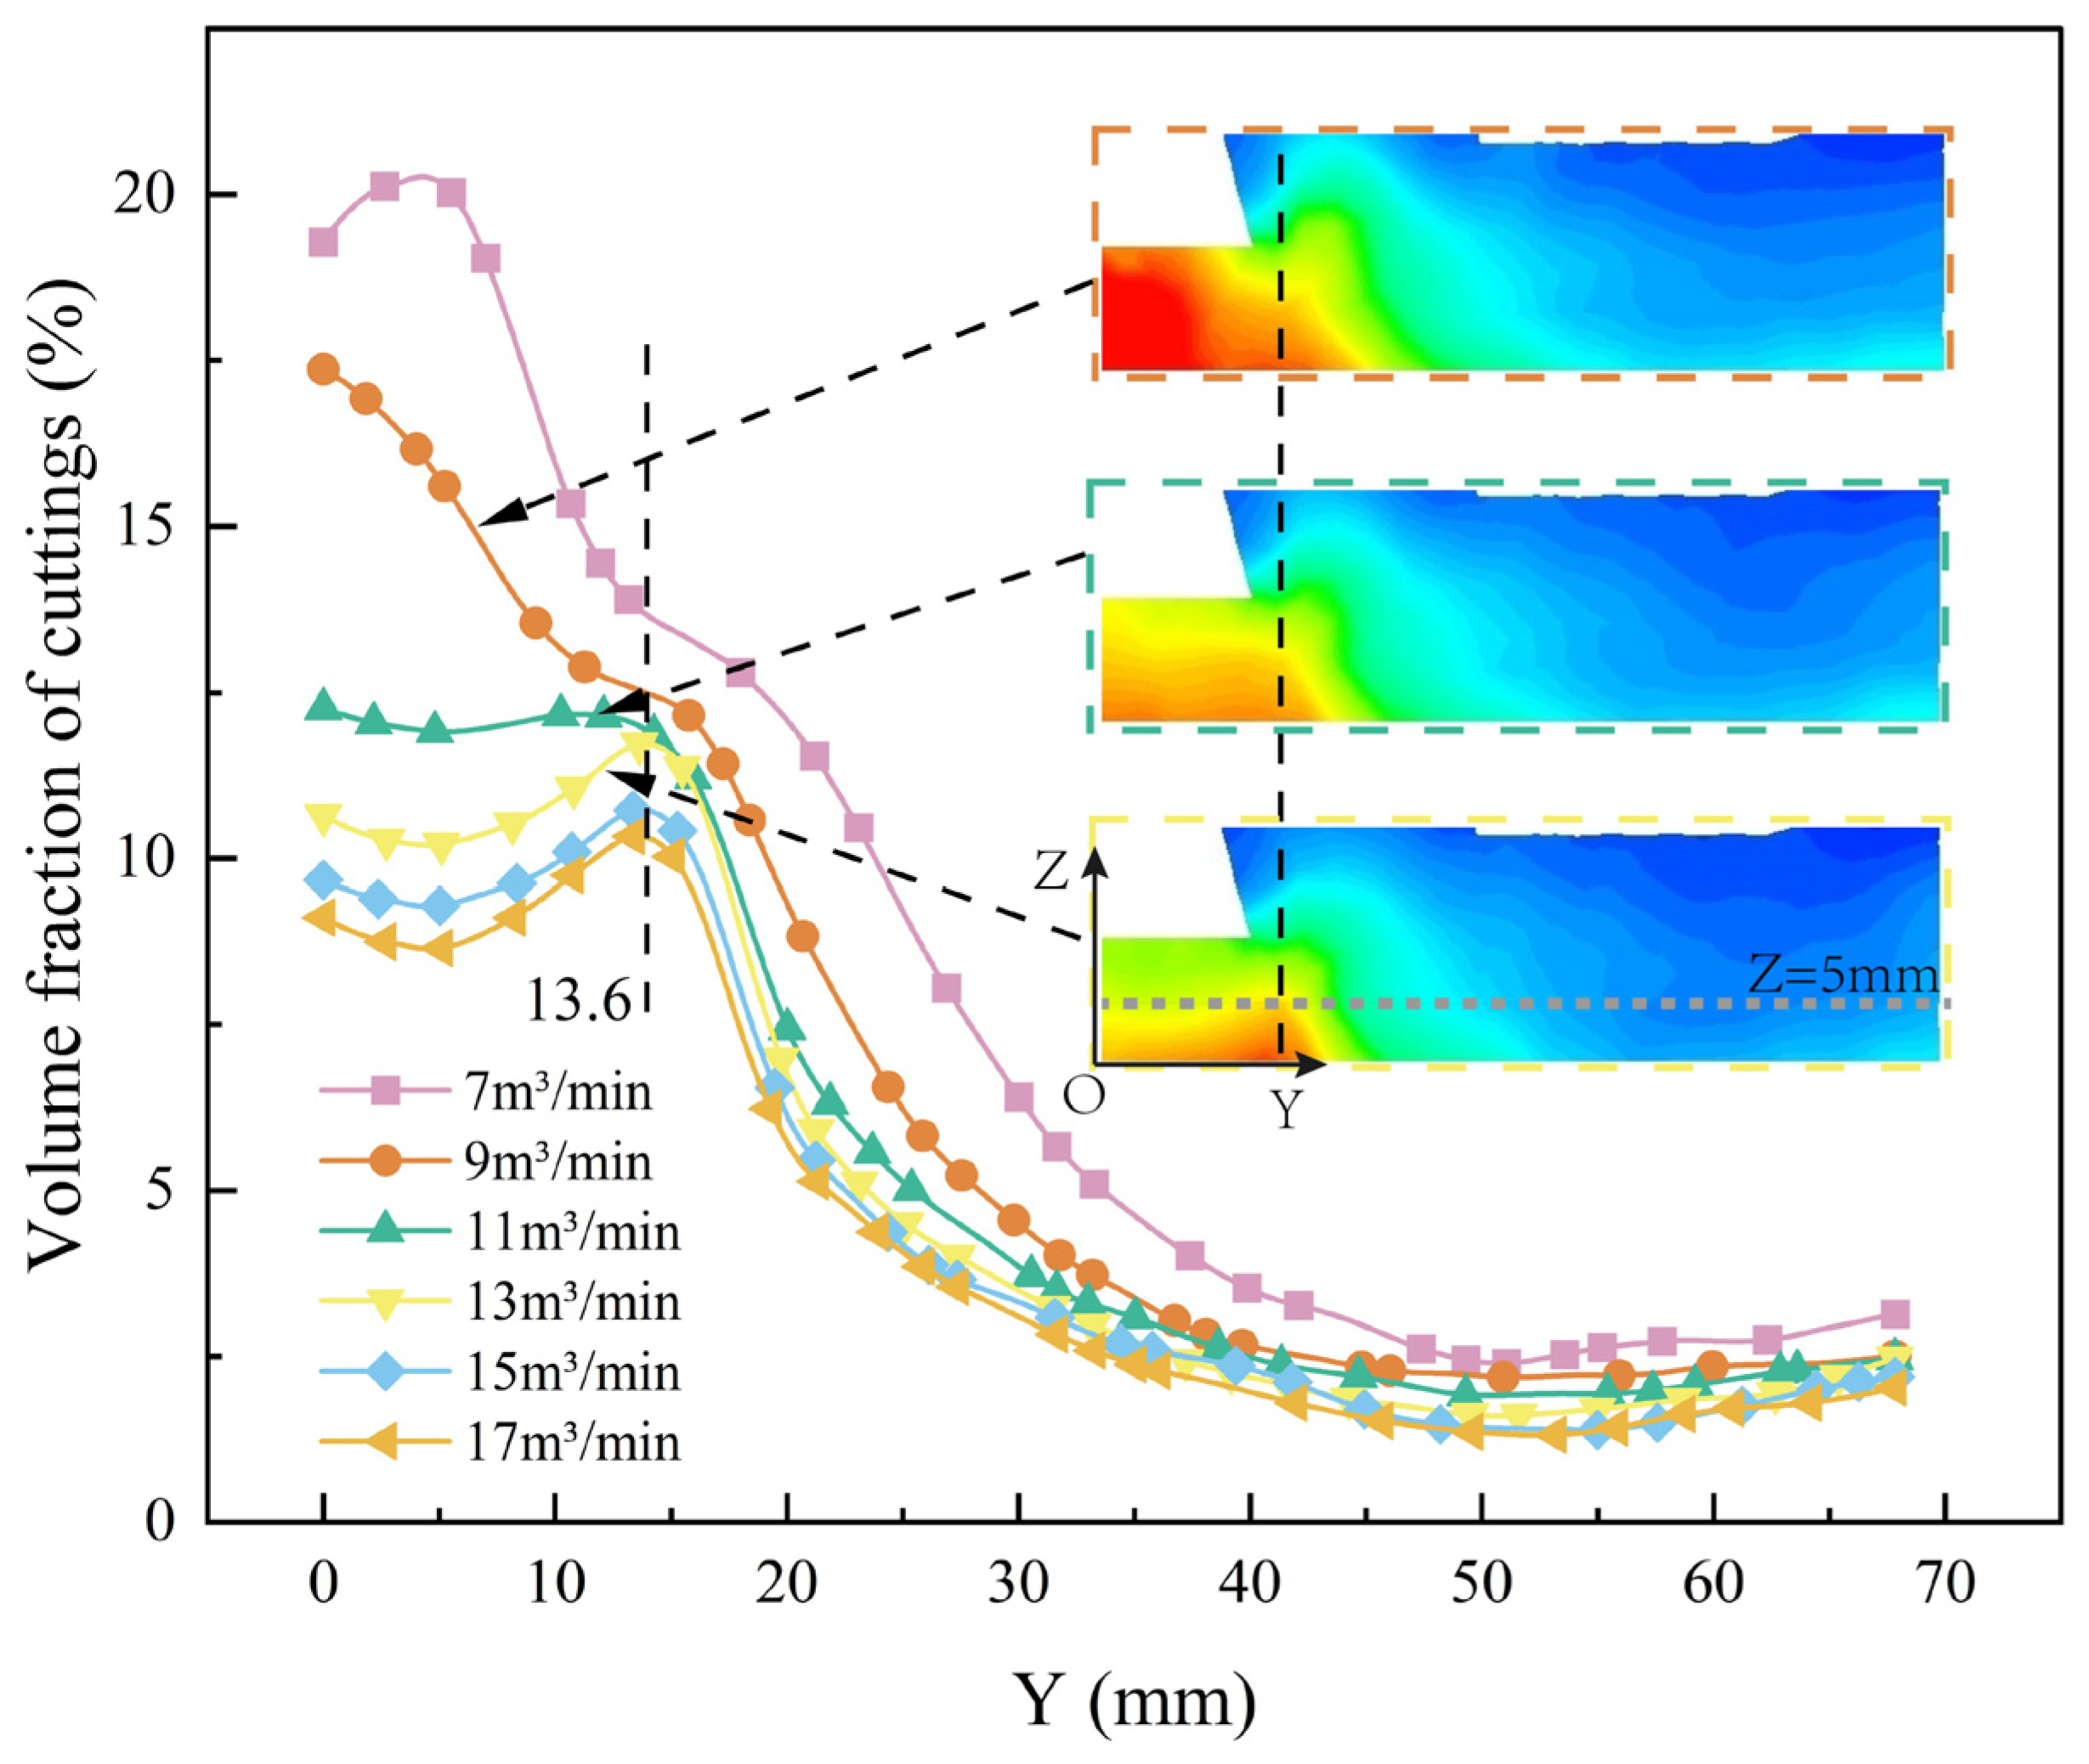
As shown in Figure 9 and Figure 10, cuttings mainly concentrate at 13.6 mm from the center along the Y-axis, and severe accumulation appears in the central region when the gas flow rate is below 11 m3/min. This occurs because increasing the gas flow rate enhances turbulence, which is influenced by the distribution of two spherical teeth in the central region. Higher gas velocity in the central region helps reduce cutting buildup, a phenomenon also observed for smaller particle diameters and larger wellbore enlargement ratios. According to Figure 8, increasing the gas flow rate improves reverse circulation flow ratio, but the improvement becomes stable once the flow rate exceeds 12 m3/min. Therefore, for the investigated operating conditions and bit configuration, a gas flow rate in the range of 11–13 m3/min was observed to effectively reduce cutting accumulation while maintaining reasonable energy consumption.
Figure 9.
The solid volume fraction cloud diagram under different gas flow rates ().
Figure 10.
Solid phase volume fraction diagram under plane with different gas flow rates ().
4.3. The Influence of Wellbore Enlargement Ratio on Reverse Circulation
The wellbore enlargement rate E is defined as the relative increase in the equivalent borehole diameter compared with the nominal diameter of the hammer or drill bit:
where is the equivalent borehole diameter and is the nominal hammer diameter. This definition quantifies the degree of borehole overbreak and the associated gas leakage area around the hammer.
The influence of the wellbore enlargement ratio on reverse circulation capability is analyzed under the conditions and , as shown in Figure 11.
Figure 11.
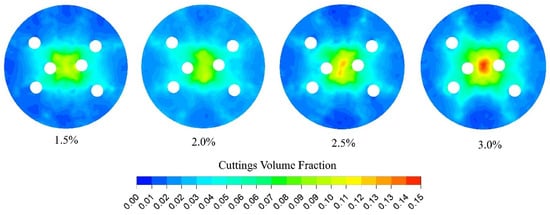
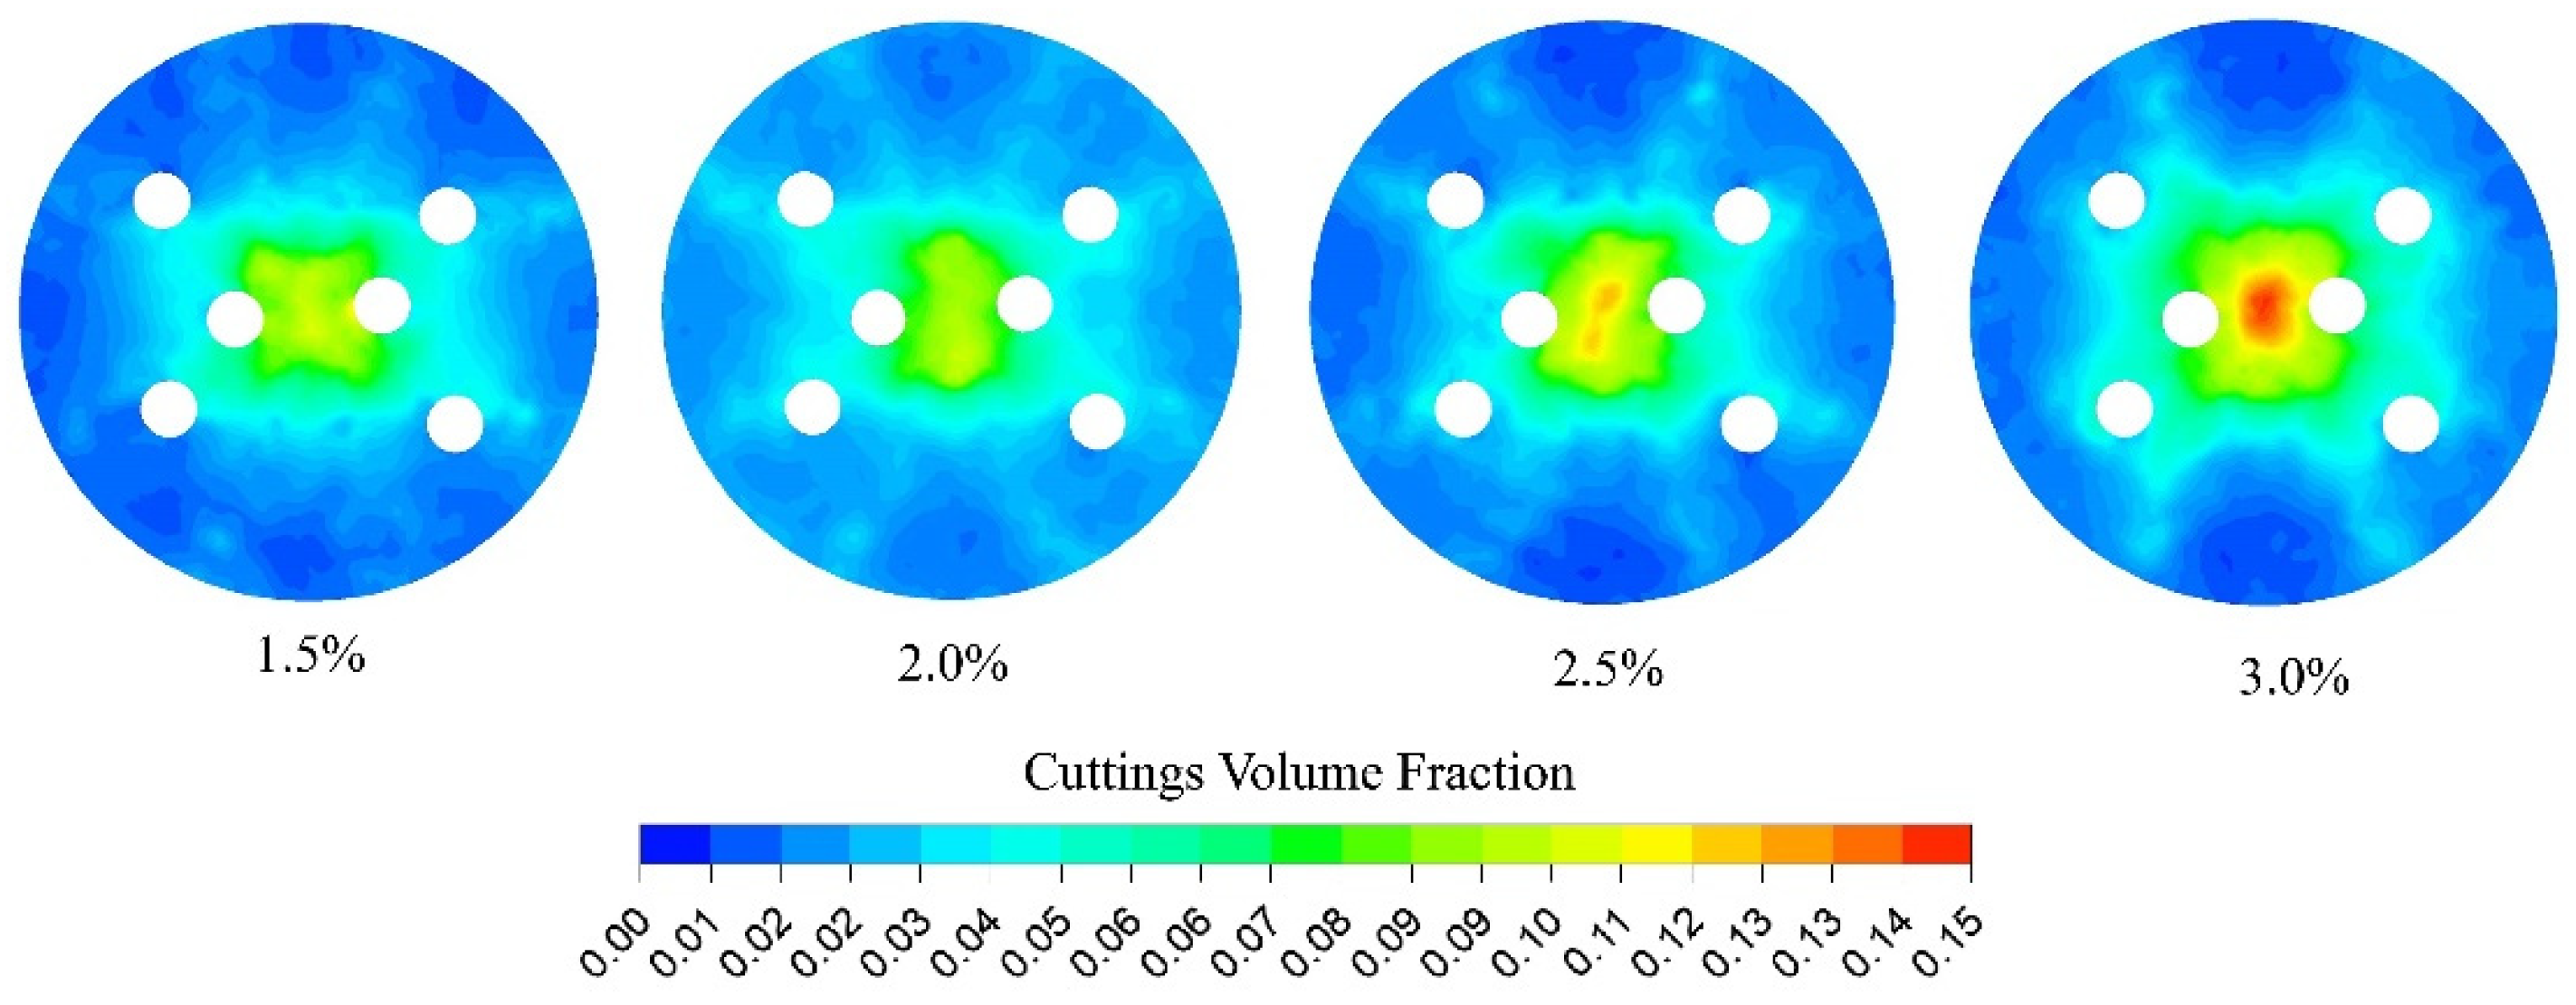
The solid volume fraction cloud diagram under different wellbore enlargement ratios ().
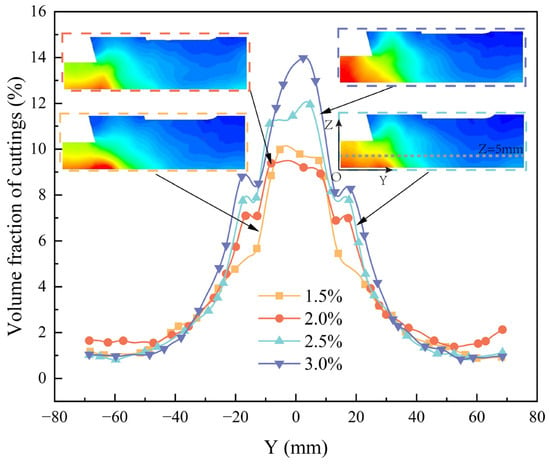
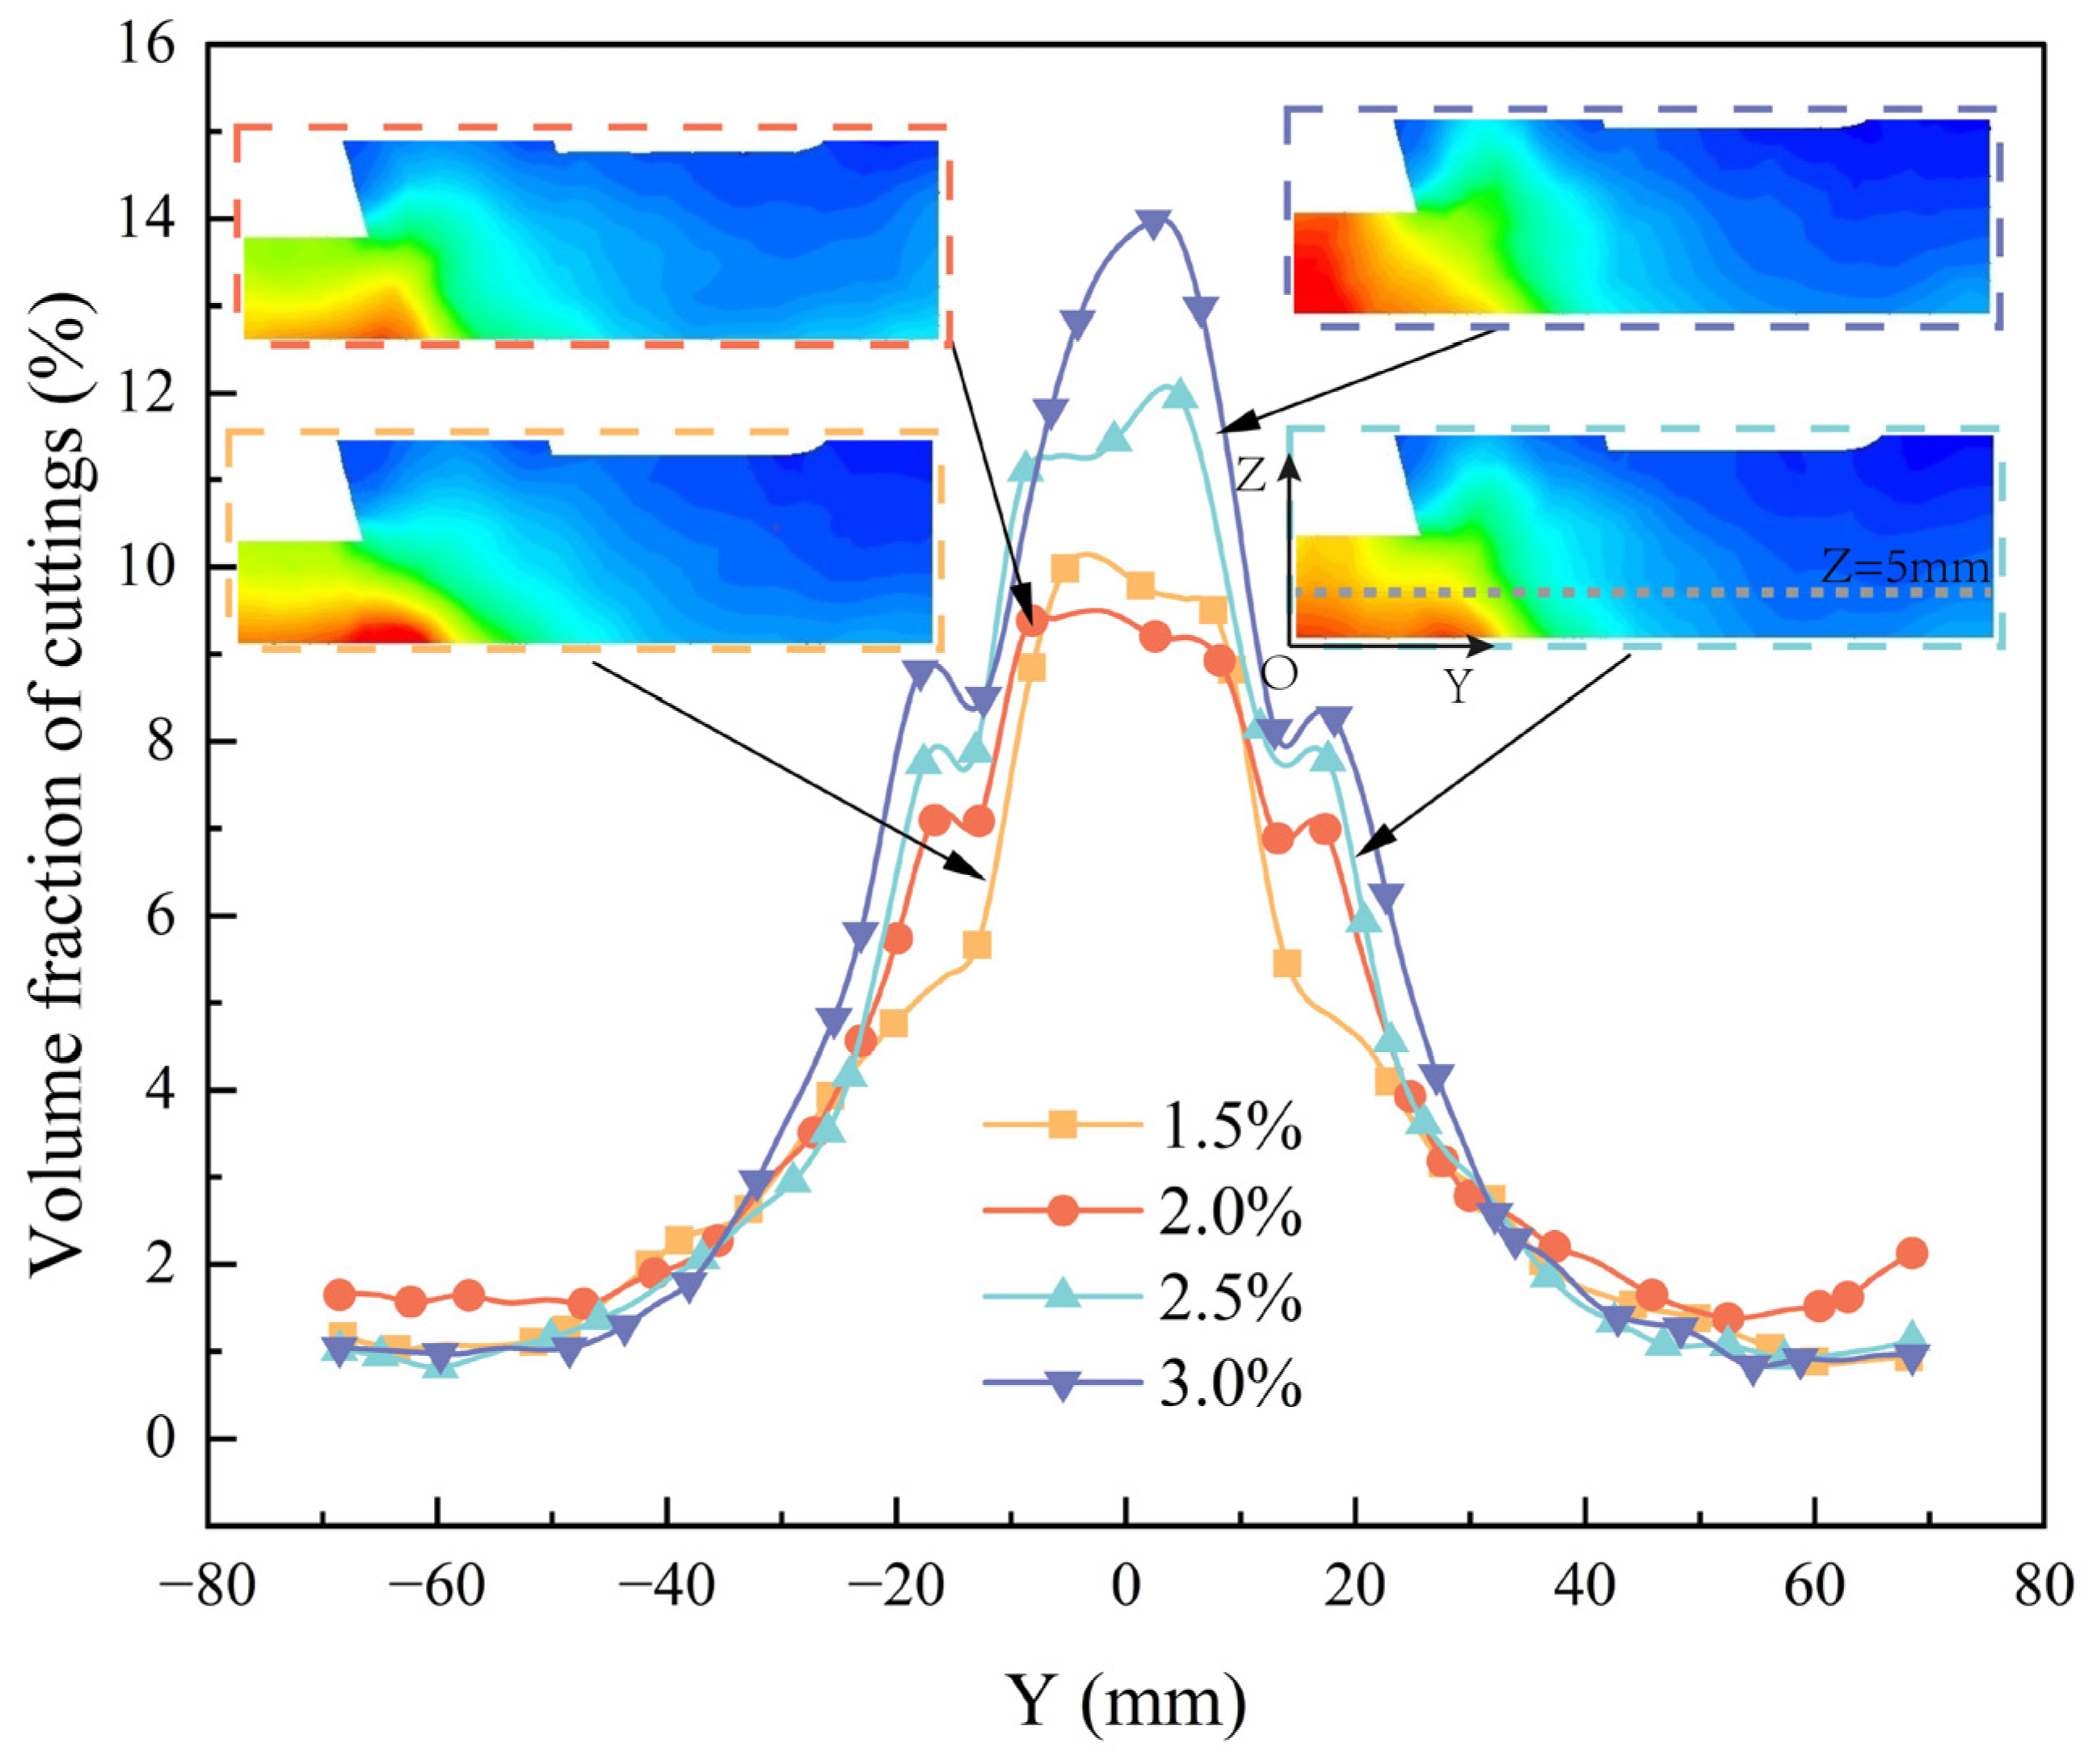
As the enlargement ratio increases, the volume fraction of cuttings at the well bottom also increases, particularly in the central accumulation region. This occurs because a larger enlargement ratio results in a greater leakage area, leading to increased gas leakage and reducing the gas flow entering the bottom for reverse circulation and cuttings removal, thereby decreasing wellbore enlargement ratio, as illustrated in Figure 12. However, at an enlargement ratio of 2%, the volume fraction curve exhibits a lower peak in the central region compared with that at 1.5%. At this ratio, the bottom flow field becomes more uniform. Therefore, under the simulated leakage conditions and within the examined range of enlargement ratios, values below approximately 2% were associated with reduced particle accumulation at the borehole bottom.
Figure 12.
Solid phase volume fraction diagram under plane with different borehole enlargement rates ().
4.4. The Effect of Density on Reverse Circulation
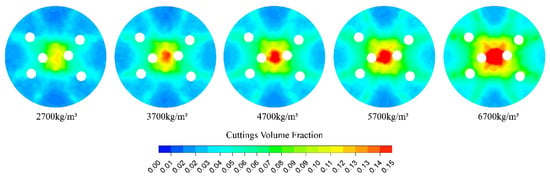
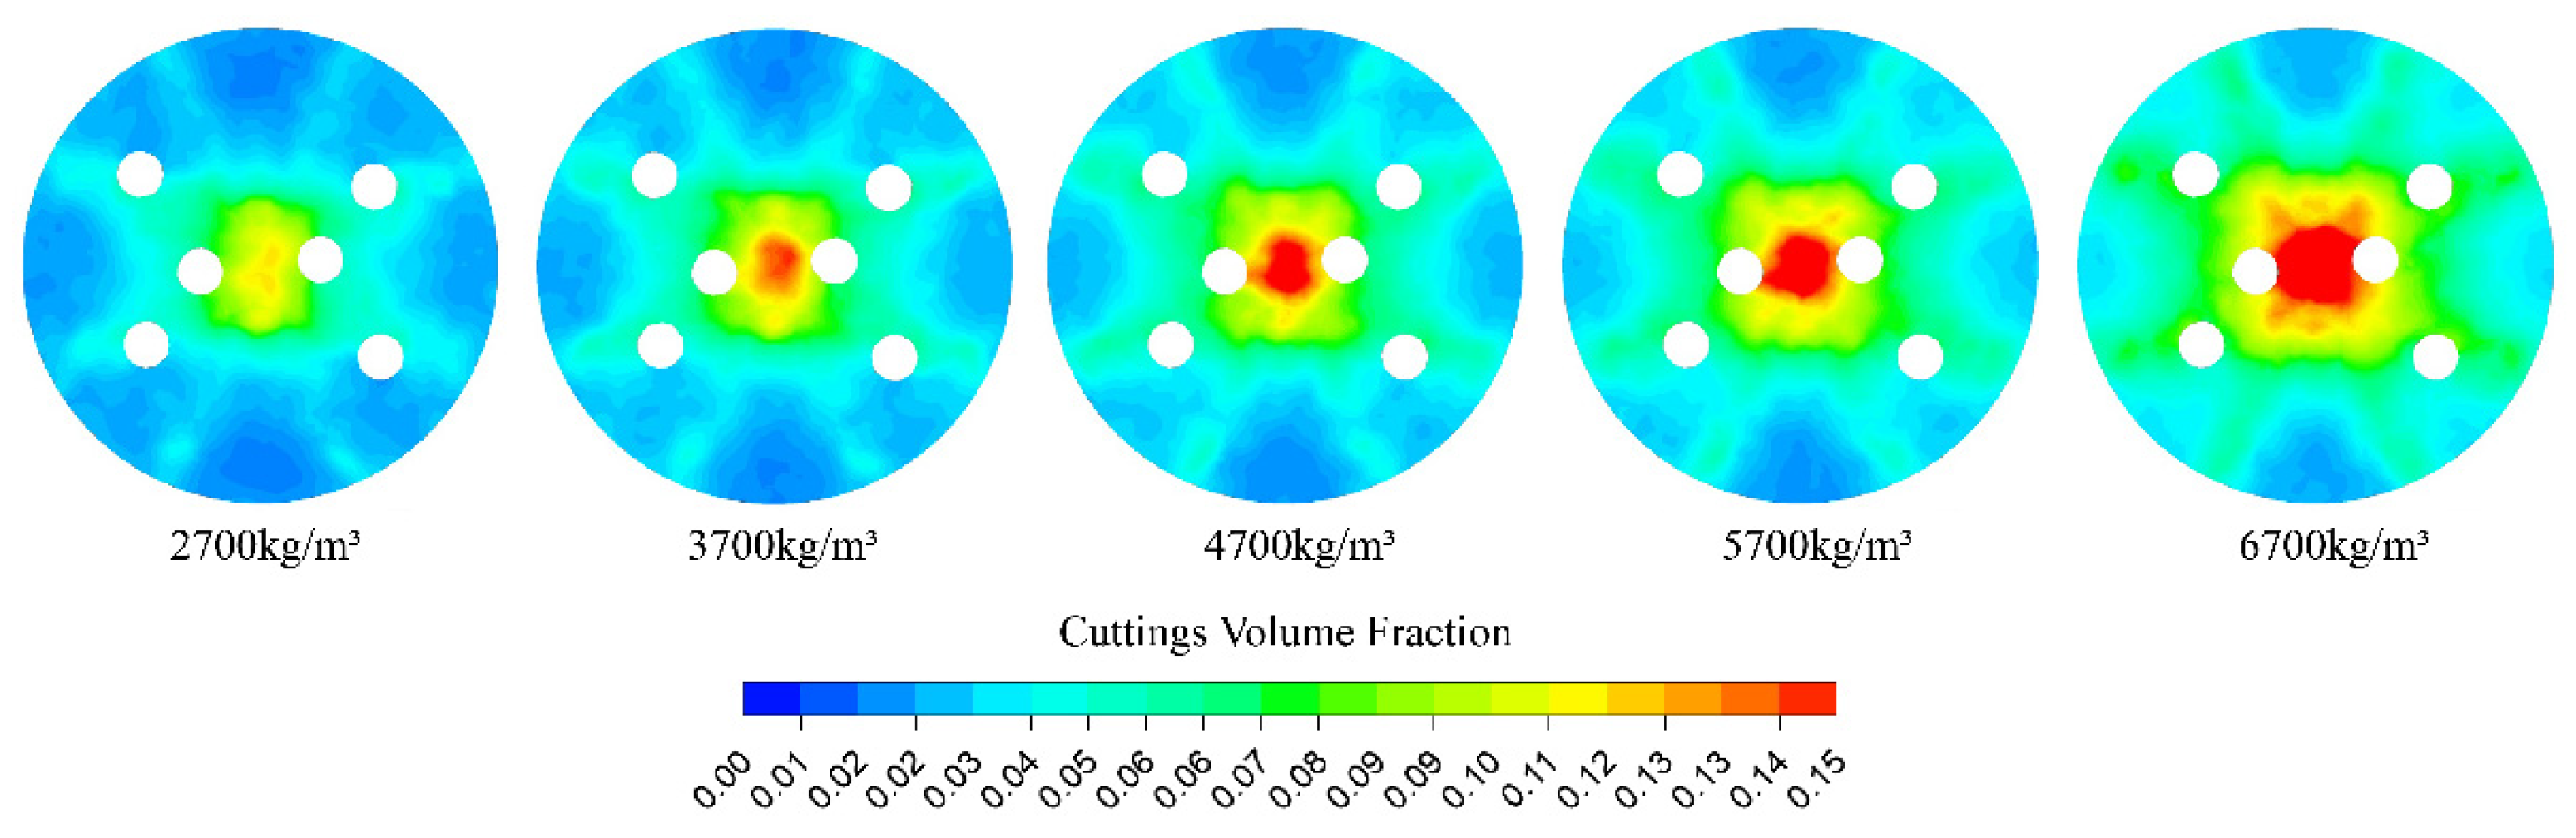
In different formations, cutting density varies, especially in complex strata where particle density can change significantly. The influence of particle density on reverse circulation capacity is analyzed under the conditions and . As shown in Figure 13, under fixed drilling speed conditions, cutting accumulation at the well bottom becomes more severe as particle density increases. This is particularly evident in the central region, where significant accumulation occurs and the accumulation zone gradually expands outward. Figure 8 shows that with increasing particle density, the reverse circulation flow ratio first increases and then decreases. This may be because particles initially alter the local flow field structure, causing the gas to preferentially discharge through the reverse circulation outlet. However, as particle density continues to rise, particle clustering intensifies, increasing flow resistance and reducing gas flow rate. The reverse circulation flow ratio reaches its maximum when the particle density is approximately 4200 kg/m3.
Figure 13.
The solid volume fraction cloud diagram under different cutting densities ().
4.5. The Influence of ROP on Reverse Circulation
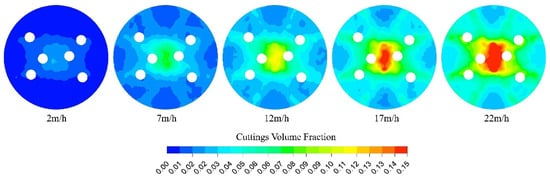
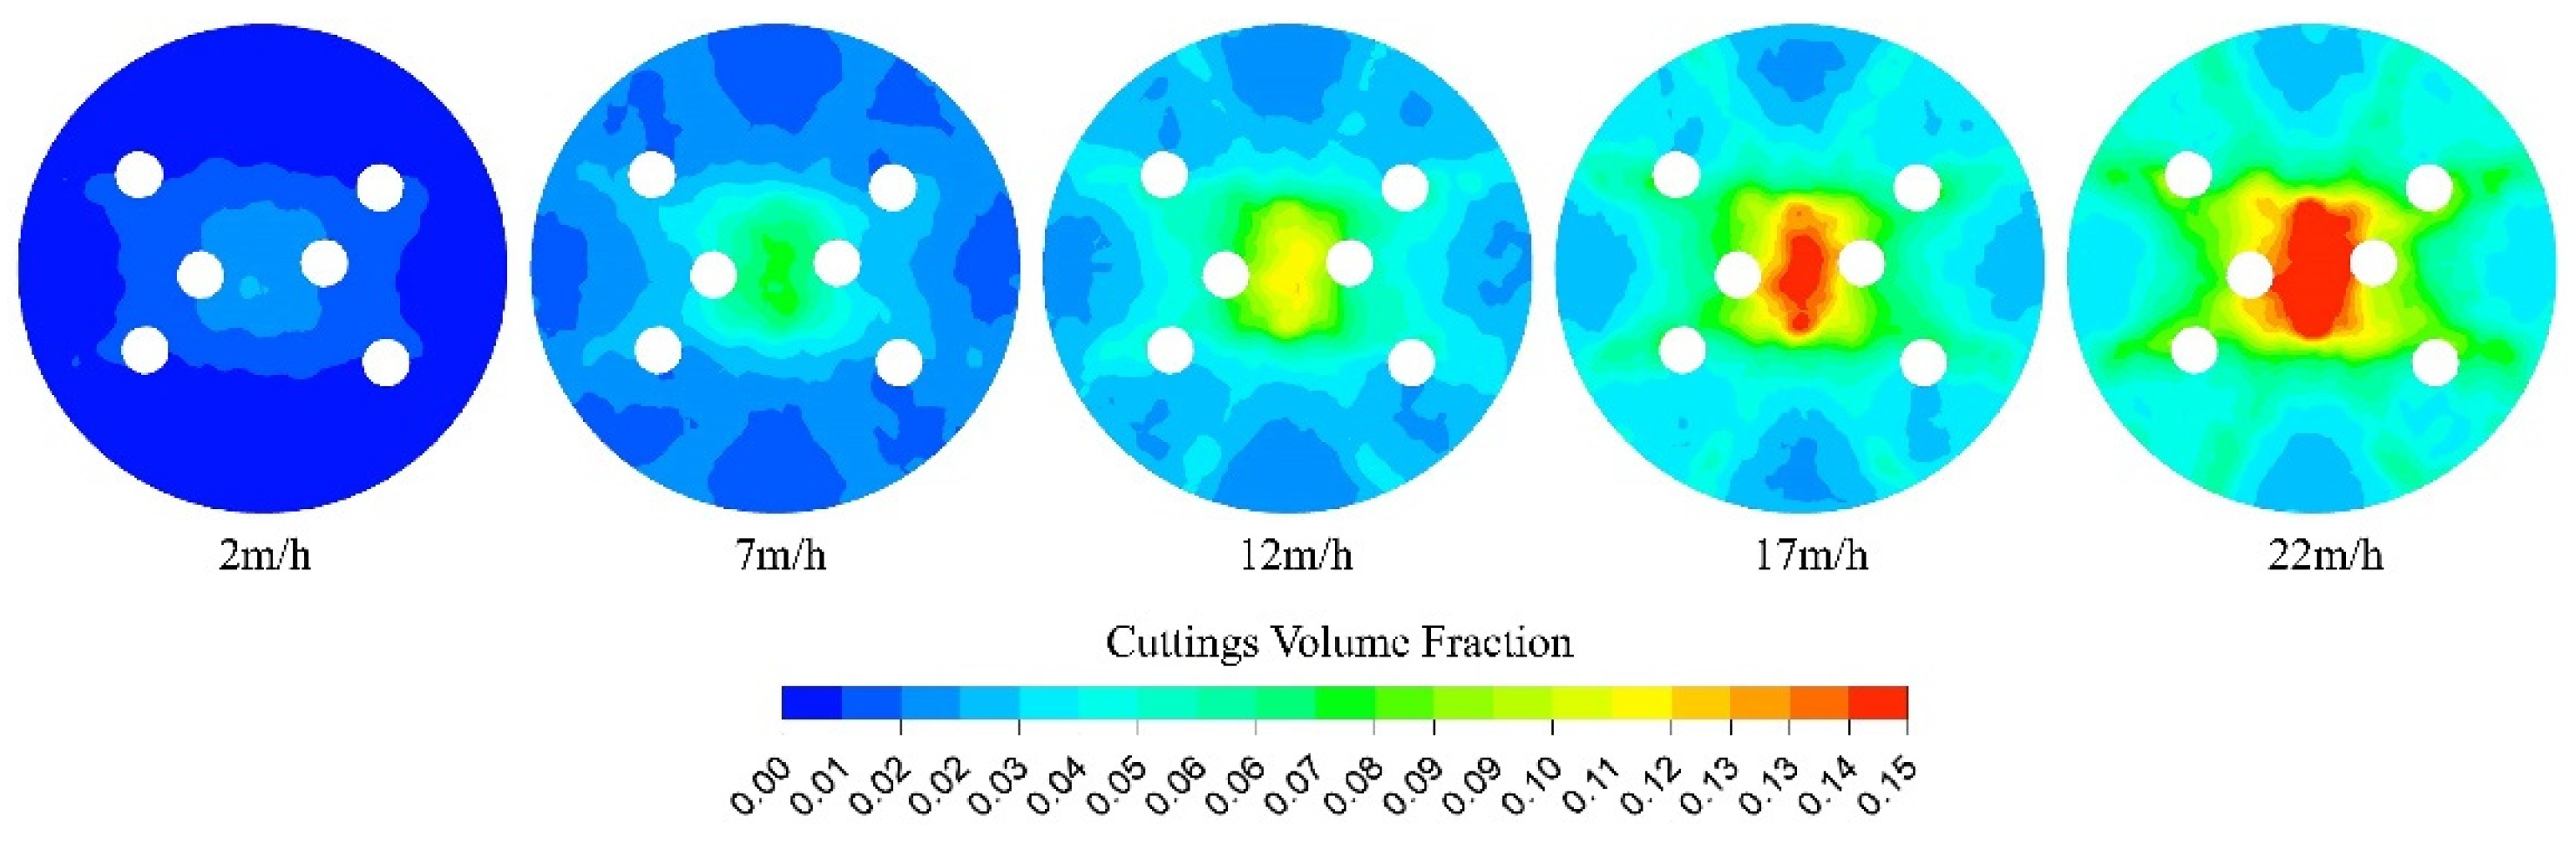
The ROP is defined as the axial advance velocity of the drill bit relative to the rock formation. In practical applications, the mechanical ROP is a resultant variable determined by the combined effects of rock mechanical properties, the impact energy of the DTH hammer, and the operating conditions. In this study, the ROP is treated as a prescribed operating parameter to represent different drilling scenarios, and to investigate how different cutting generation rates influence the reverse circulation performance. However, increasing ROP produces more cuttings, which requires greater cutting transport capacity. This study evaluates the influence of ROP on reverse circulation capacity under the conditions and . As ROP increases, the flow rate of solid particles rises, resulting in more particles in the system. This leads to a higher solid volume fraction at the well bottom. Figure 14 shows that, unlike the influence of particle density, the central accumulation region extends along the Y-axis.
Figure 14.
The solid volume fraction cloud diagram under different ().
An increase in particle density affects drilling because heavier particles are generated. However, drilling speed affects only the mass flow rate of particles and does not change the weight of individual cuttings. Therefore, cuttings are more strongly influenced by the gas flow field. Figure 8 illustrates that drilling speed initially increases the reverse circulation flow ratio and then decreases it, due to mechanisms similar to those associated with particle density. The reverse circulation flow ratio reaches its peak at a drilling speed of approximately 10 m/h.
4.6. The Effect of Rotation Speed on Reverse Circulation
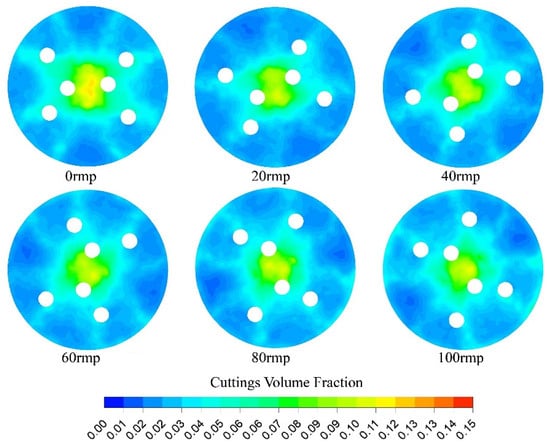
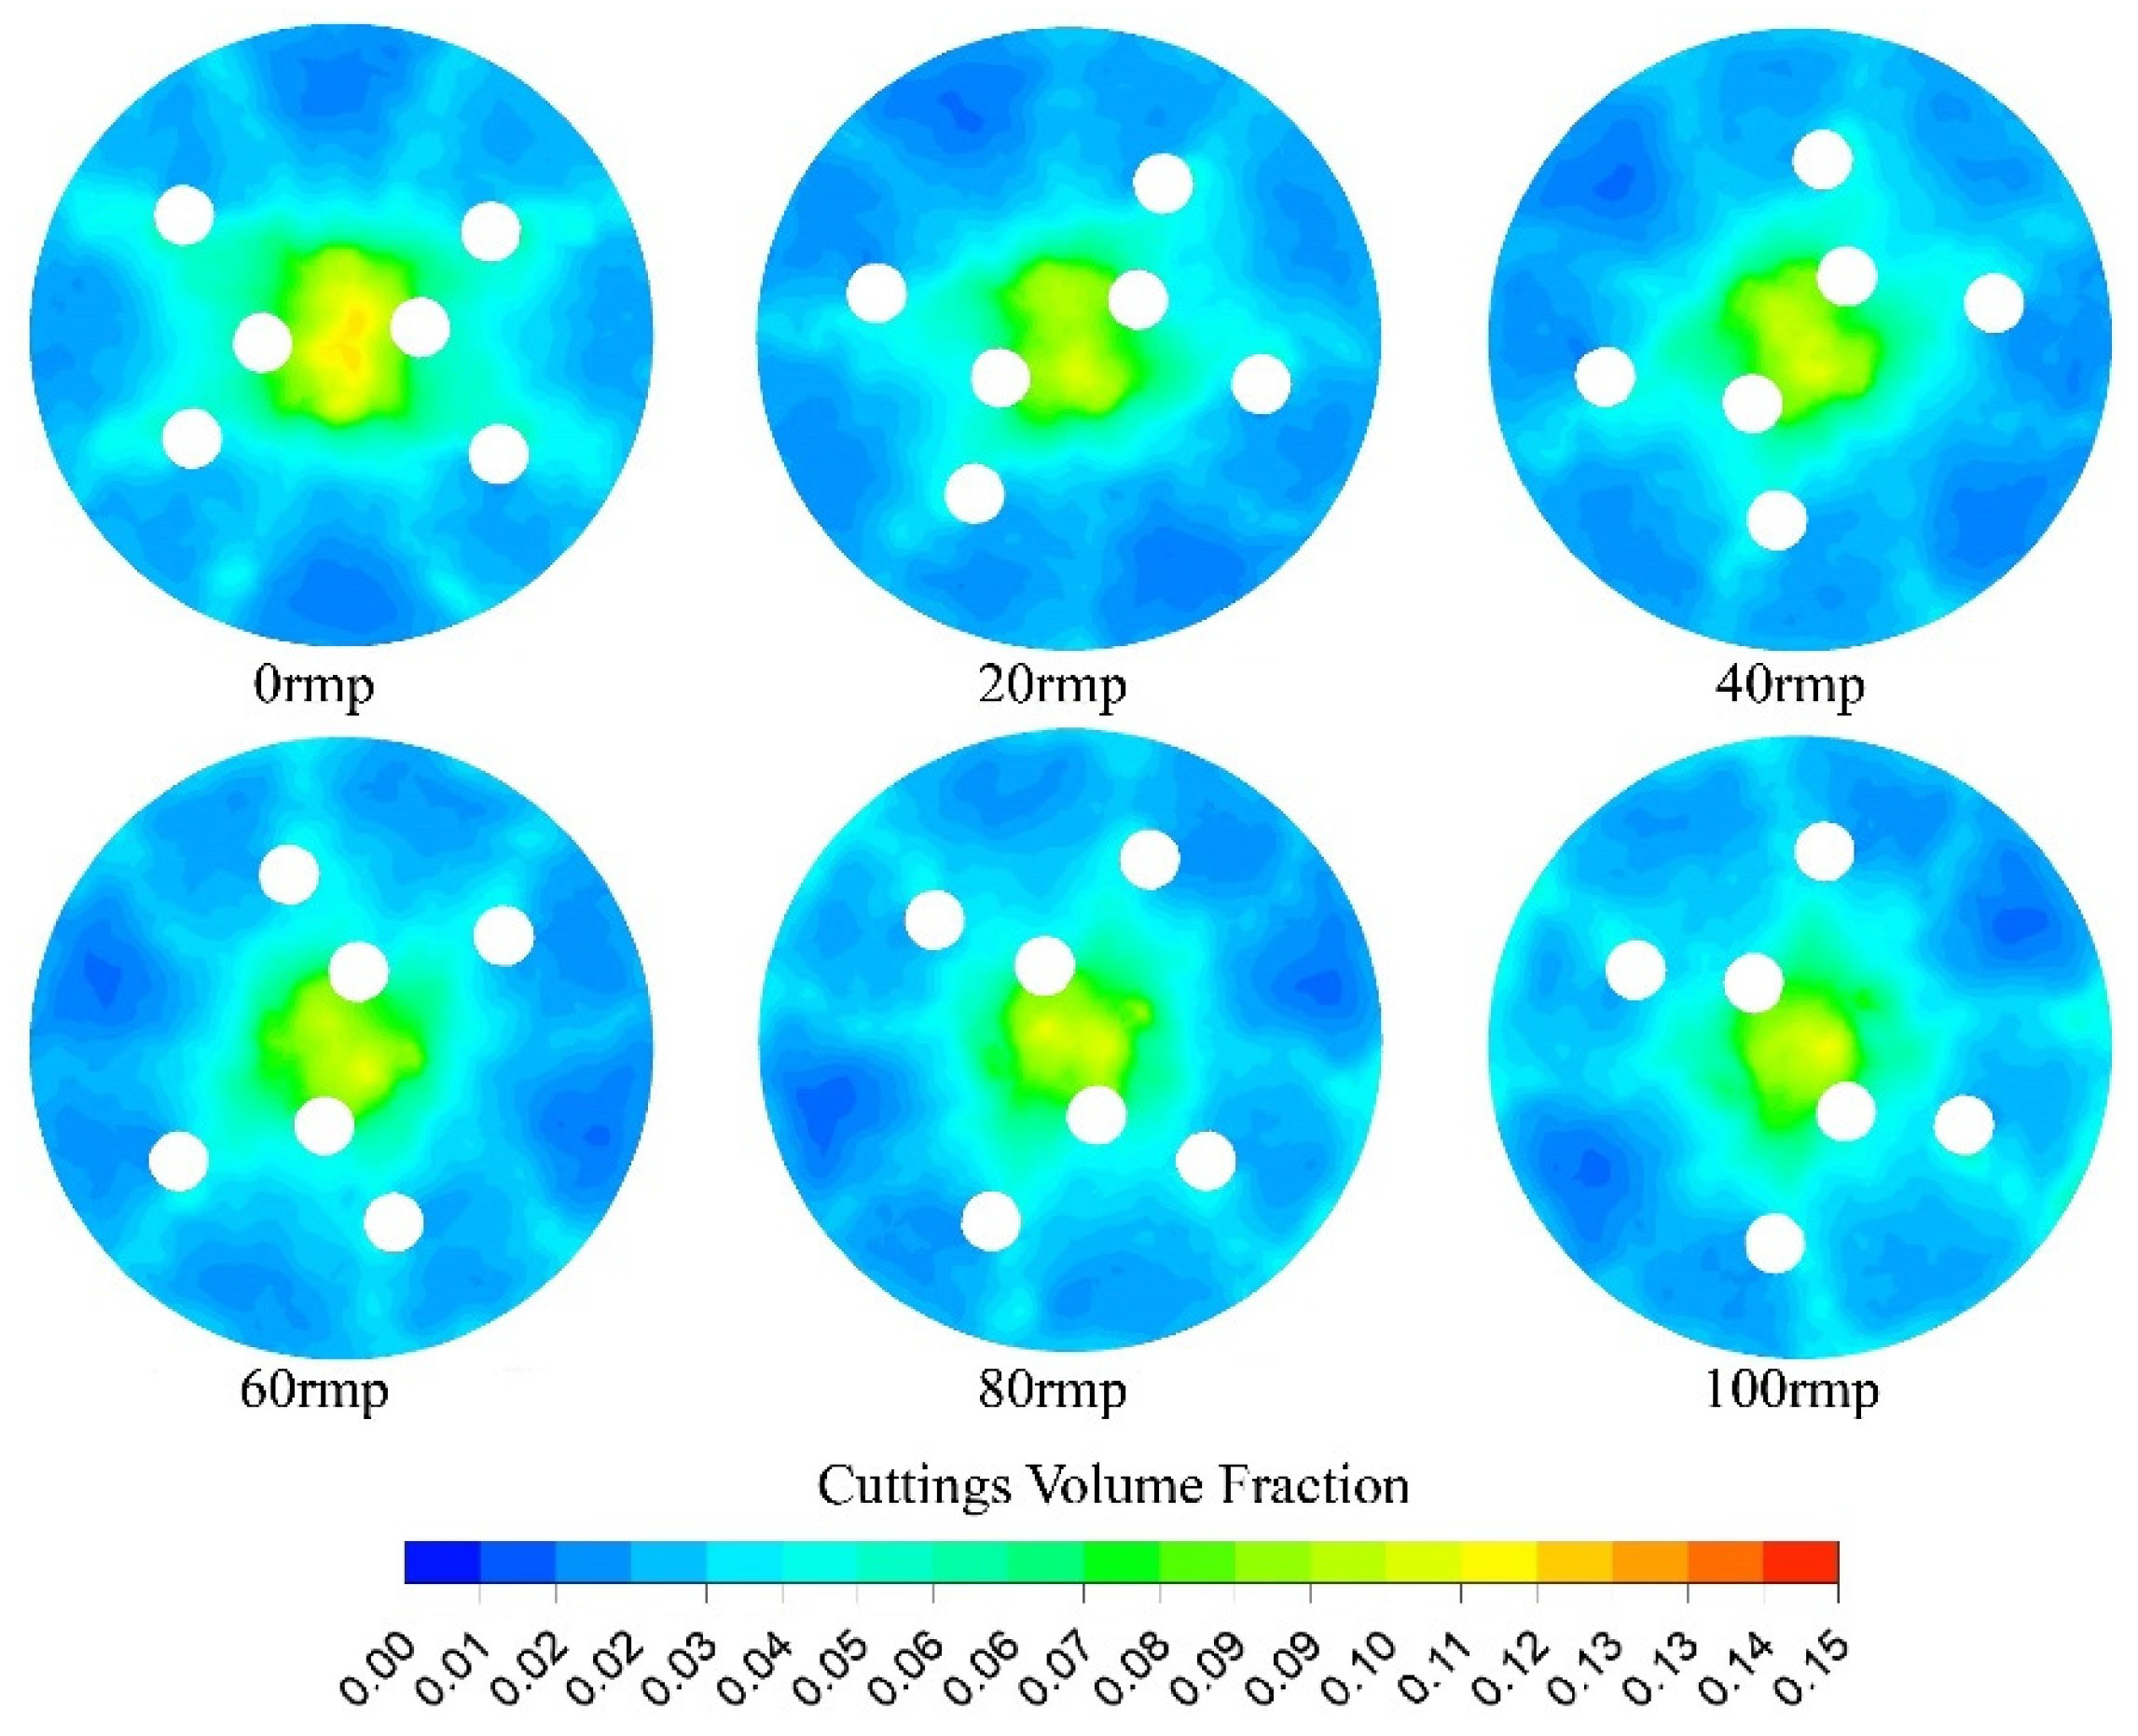
In reverse circulation pneumatic DTH hammer drilling, selecting an appropriate rotational speed is essential to ensure efficient rock fragmentation while minimizing the repeated breakage of rock fragments [45]. Rotational speed also significantly affects the distribution of cuttings at the bottom of the borehole. Under the conditions and , the influence of rotational speed on reverse circulation capability is examined. As shown in Figure 15, with increasing rotational speed, the solid volume fraction in the central region of the borehole changes only slightly, whereas the peripheral volume fraction increases considerably, resulting in a more uniform spatial distribution of particles. A more uniform distribution promotes effective reverse circulation and enhances drilling efficiency. However, excessively high rotational speeds increase the solid volume fraction in the annular region near the drill bit, which elevates drilling resistance. Therefore, excessively high rotational speeds should be avoided to prevent increased resistance and associated performance losses. As shown in Figure 8, the reverse circulation flow ratio displays a fluctuating trend with increasing rotational speed, consistent with the findings of Zhang [13]. Peak efficiency is achieved at approximately 60 rpm.
Figure 15.
The solid volume fraction cloud diagram under different revolution speeds ().
4.7. Artificial Intelligence Optimization
This study investigated multiple factors influencing reverse circulation flow ratio. For particle diameter, gas flow rate, and borehole enlargement rate, the effects were found to be monotonic, allowing optimal values to be determined directly through single-factor experiments. By analyzing the distribution of solid volume fraction at the well bottom, the most favorable parameter settings for these factors were identified.
In contrast, particle density, drilling speed, and rotational speed exhibited peak responses, indicating that their effects were non-monotonic and potentially involved interactions among factors. Therefore, their influence required comprehensive evaluation, and the peak efficiency points were determined through detailed analysis of the corresponding response curves.
Although full-enumeration CFD simulations provide the highest level of physical fidelity, they are computationally prohibitive. In contrast, the RSM significantly reduces the computational cost, but its predictive accuracy is limited when strong interactions exist among the three factors considered in this study. By integrating RSM-generated data with a GA–LSSVM surrogate model and an efficient PSO algorithm, a favorable balance between computational efficiency and predictive accuracy is achieved, thereby enabling the optimization of reverse circulation performance under practical computational constraints.
Because the response of the reverse circulation flow ratio to the selected factors (rate of penetration, rotational speed, and particle density) exhibits a pronounced non-monotonic behavior with identifiable maxima, a three-level design was adopted, as indicated by the single-factor analyses in Section 4.4, Section 4.5 and Section 4.6. Based on these results and considering the practical operating ranges in engineering applications, the levels of the experimental factors were selected by taking one level above and one level below the optimal settings, as summarized in Table 2. Subsequently, a three-factor, three-level response surface design matrix was constructed, as presented in Table 3. The reverse circulation flow ratio for each experimental run was evaluated by CFD simulations, thereby ensuring accurate and reliable efficiency assessments under different parameter combinations.
Table 2.
Factors and the levels coding of experiment of response surface analysis.
Table 3.
Simulation design and results.
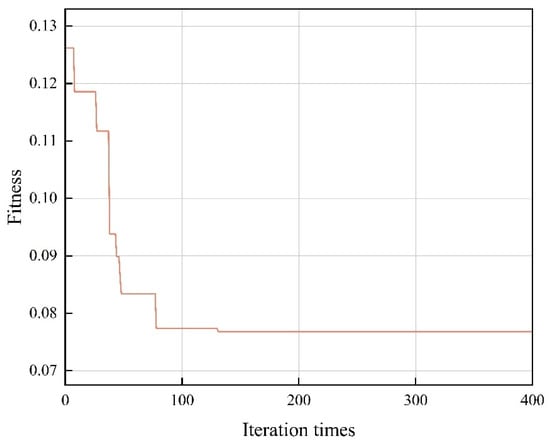
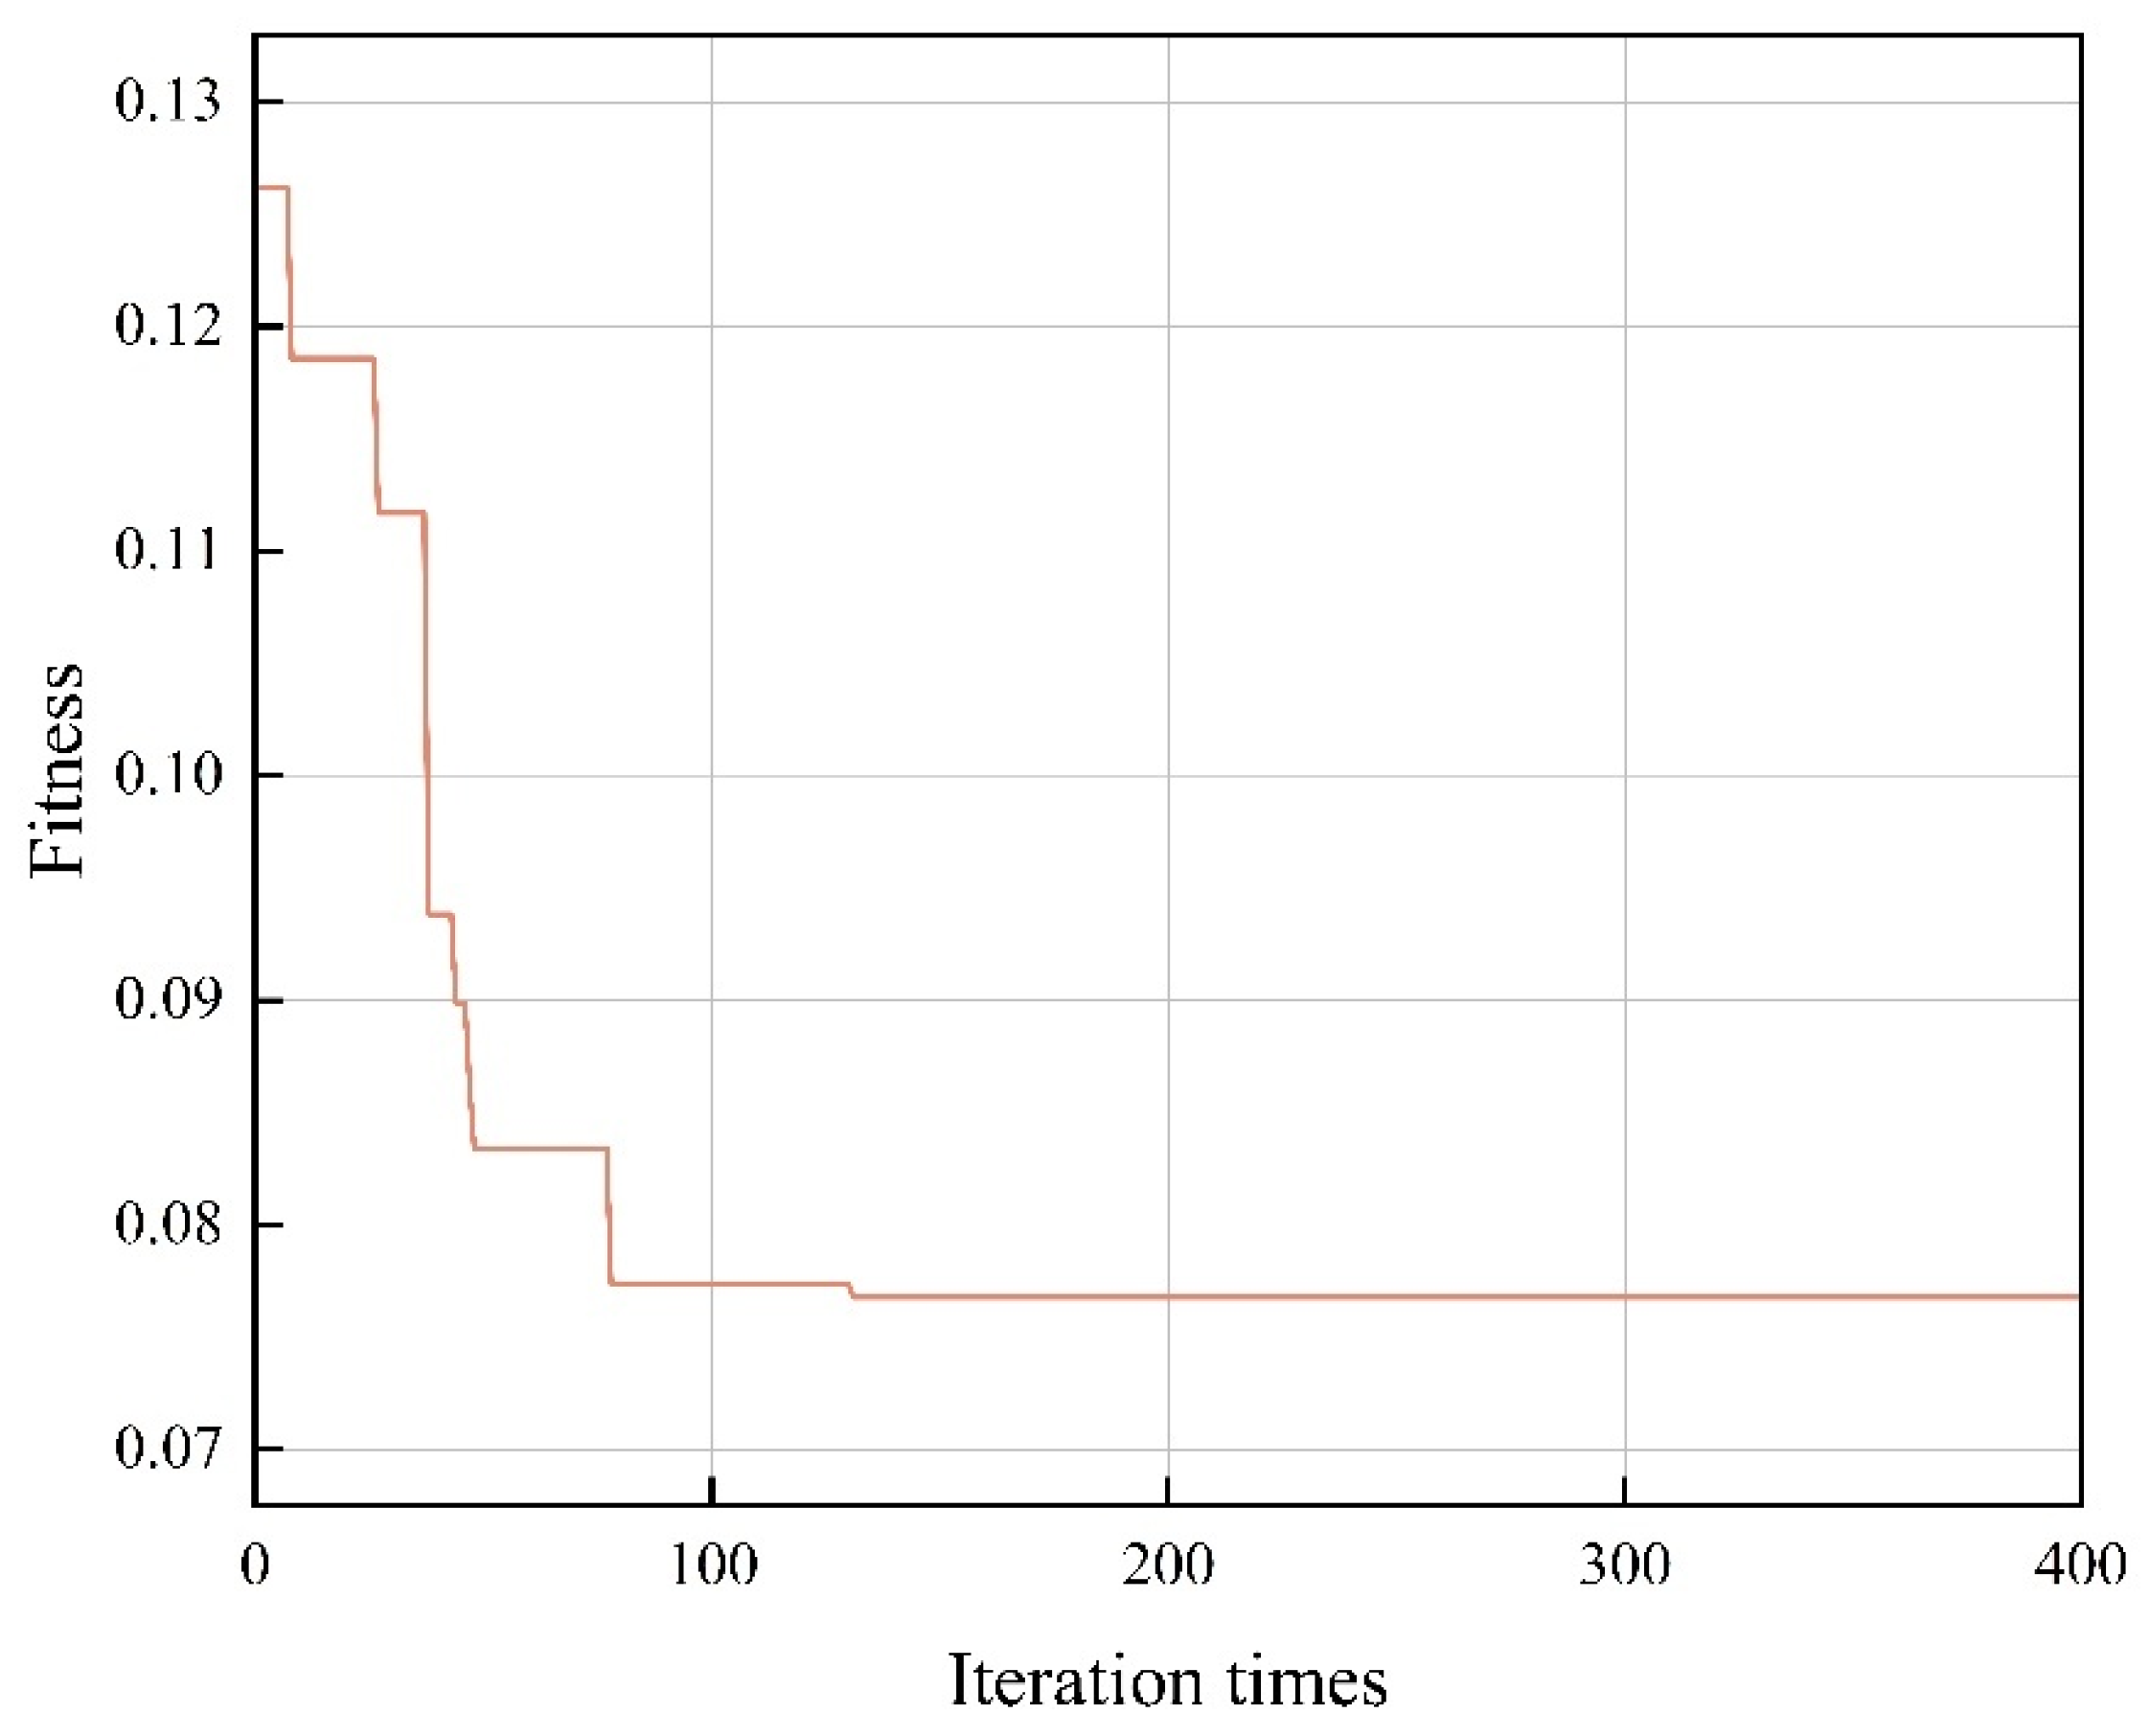
Based on the artificial intelligence optimization scheme described in Section 2.2, the 17 experimental datasets listed in Table 3 were randomly shuffled to eliminate any ordering bias. Subsequently, 12 samples were used as the training set to construct the GA–LSSVM model, and the remaining 5 samples were reserved as an independent test set to evaluate its generalization performance. Random splitting uses fixed random seeds. The GA-LSSVM and PSO algorithm experiments are shown in Table 4 and Table 5. The fitness convergence curve for the GA-LSSVM model predicting rock-carrying efficiency is shown in Figure 16. The curve indicates that after 131 iterations, the fitness value stabilizes, reaching an optimal point. The predictive performance of the model is evaluated using the Root Mean Square Error (RMSE), the coefficient of determination (R2), and the Mean Absolute Error (MAE), as defined in Equations (15)–(17) [20,28].
Table 4.
Parameters used in the GA-LASSVM implementation.
Table 5.
Parameters used in the PSO implementation.
Figure 16.
Detailed iterative records of GA-LSSVM.
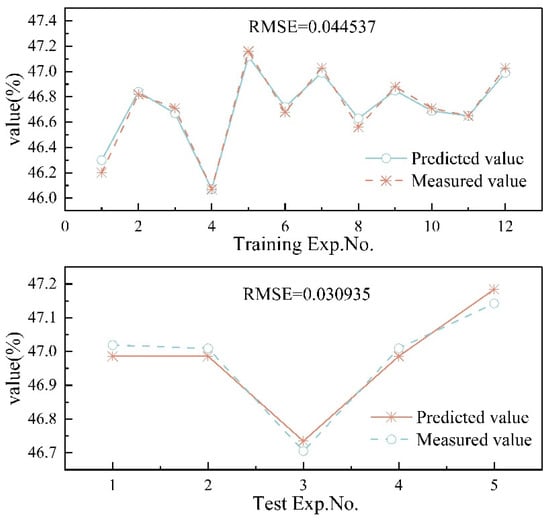
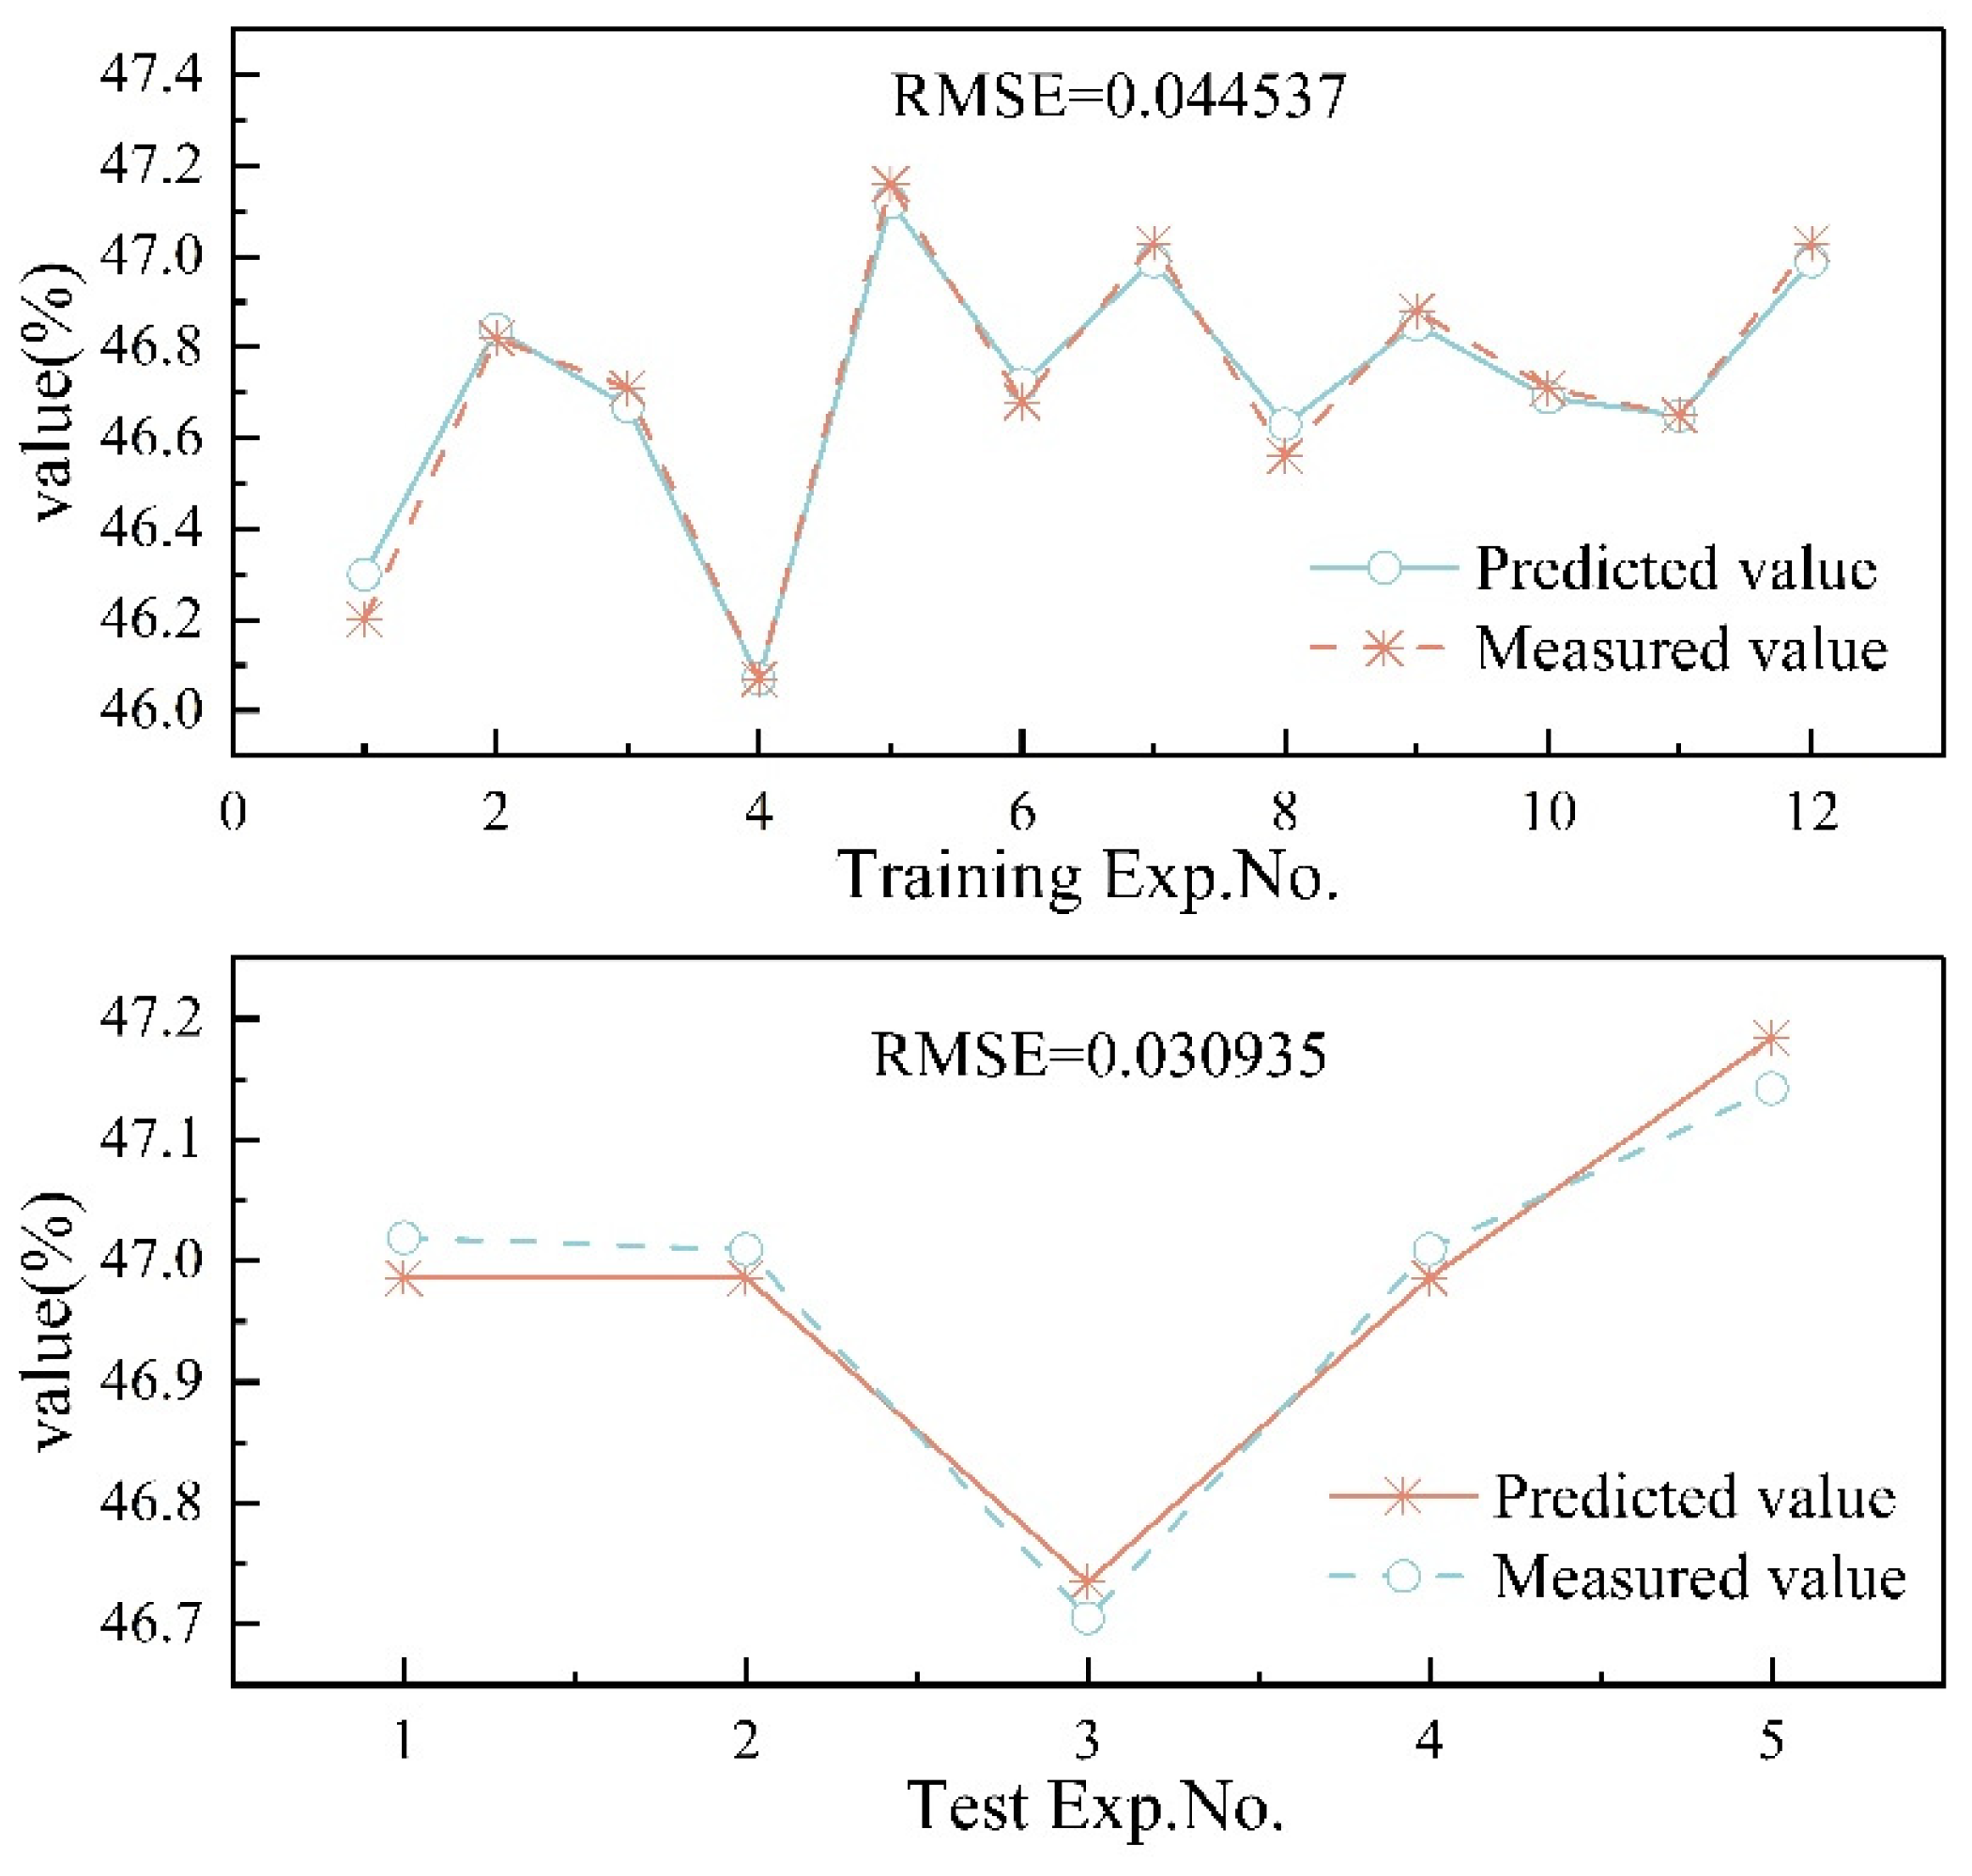
The RMSE for the training set was 0.0445 ± 0.05, with an R2 of 0.91 ± 0.05 and an MAE of 0.01131 ± 0.06. For the test set, the RMSE was 0.0309 ± 0.06, R2 was 0.86 ± 0.05, and MAE was 0.03119 ± 0.05. As shown in Figure 17, predictions from the GA-LSSVM model closely match the actual values. High R2 values in both the training and test sets indicate excellent explanatory power, suggesting that the model captures most of the variance in the data. The low RMSE and MAE values further demonstrate the model’s precision, reflecting minimal deviation between predicted and actual values. Overall, this strong performance across multiple evaluation metrics underscores the reliability and robustness of the PSO-optimized GA-LSSVM model for predicting optimal parameter combinations in reverse circulation drilling.
Figure 17.
Reverse circulation flow ratio training and testing based on GA-LSSVM.
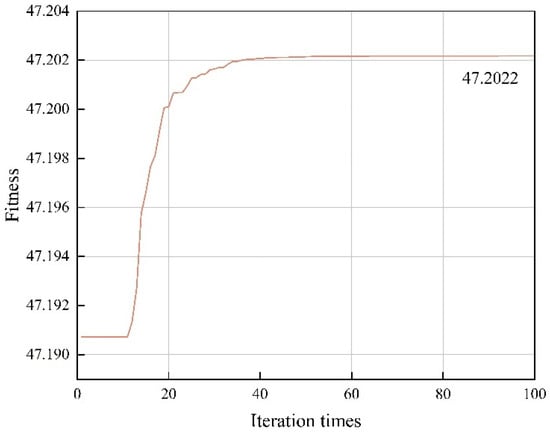
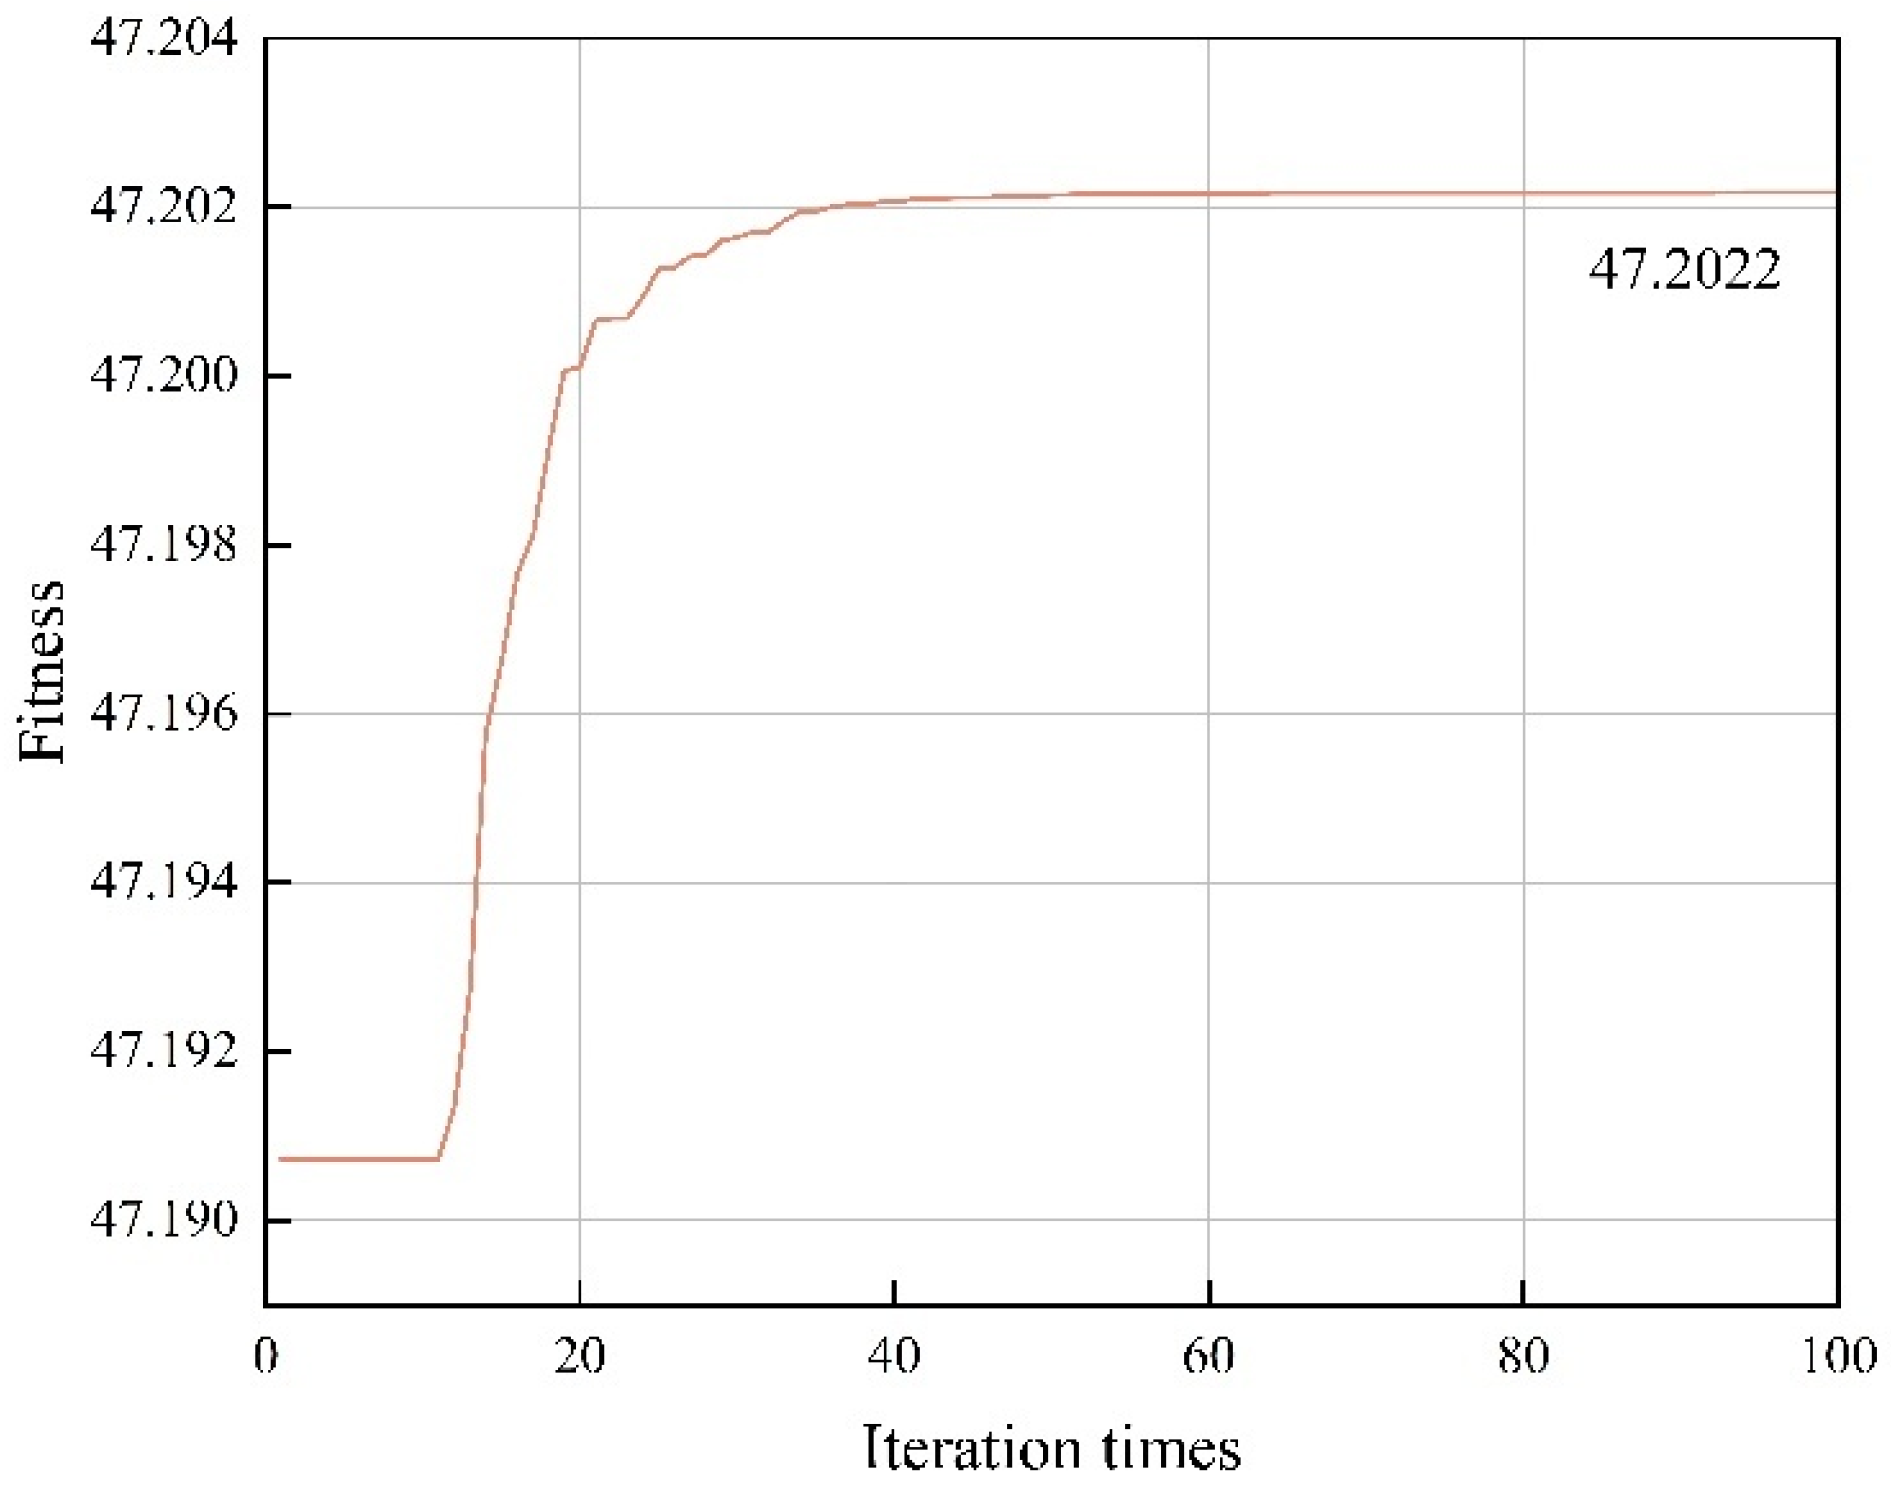
The GA-LSSVM model, optimized using PSO, produced the fitness convergence curve shown in Figure 18. The curve indicates that the fitness value stabilizes and reaches an optimum after 48 training iterations. The optimal parameter combination was determined as , yielding the highest predicted reverse circulation flow ratio of 47.2022%. To validate these optimal parameters, CFD simulations were performed, resulting in an actual reverse circulation flow ratio of 47.2135%. The close agreement between the predicted and simulated results demonstrates the high accuracy of PSO in forecasting optimal parameter combinations for reverse circulation drilling.
Figure 18.
Detailed iterative records of PSO.
5. Conclusions
This study investigated the suboptimal cutting removal efficiency in air reverse circulation sampling drilling under deep and complex formation conditions. In the three-dimensional model of the 133 mm RC-DTH hammer, the formation conditions and the cutting shapes are assumed to be idealized. Using the Euler–Euler multiphase flow model, CFD simulations were performed to evaluate the rock-carrying capacity of reverse circulation, with solid-phase volume fraction distribution selected as the primary indicator of efficiency. Single-factor analysis showed that particle size, gas mass flow rate, and borehole enlargement rate significantly influence reverse circulation performance. Optimal results were achieved with a particle size of 5 mm, a gas mass flow rate of 11 m3/min, and a borehole enlargement rate below 2%, which effectively minimized cuttings accumulation at the borehole bottom and reduced operational costs. The arrangement of carbide teeth was found to markedly affect central disturbance and blockage zones in the bottom-hole flow field; reasonable tooth distribution improved rock fragmentation efficiency and overall flow field dynamics. For particle density, drilling speed, and rotational speed, Response Surface Methodology was combined with a GA-LSSVM model optimized by the PSO algorithm. Validation simulations confirmed that this AI-based approach accurately predicts the optimal parameter combinations. These findings provide practical guidance for parameter control and efficiency improvement in air reverse circulation drilling engineering. Future work will focus on integrating real-time drilling data with the developed AI model to achieve dynamic parameter optimization and further enhance field applicability.
Author Contributions
Conceptualization, K.L. and J.Z.; methodology, K.L.; software, K.L.; validation, K.L. and J.Z.; formal analysis, J.Z.; investigation, H.W. and T.X.; resources, K.L.; data curation, K.L.; writing—original draft preparation, K.L.; writing—review and editing, K.L. and P.Y.; visualization, K.L.; supervision, H.W.; project administration, J.Z.; funding acquisition, J.Z. All authors have read and agreed to the published version of the manuscript.
Funding
This research was supported by the Guizhou Provincial Key Technology R&D Program under the project “Research on Efficient Pneumatic Drilling Tools and Rapid Hole-Forming Technology and Equipment for Life-Rescue Holes in Mine Disaster Accidents,” grant number Qiankehe Support [2023] General 422.
Institutional Review Board Statement
Not applicable.
Informed Consent Statement
Not applicable.
Data Availability Statement
The data presented in this study are available on request from the corresponding author (Jing Zhou).
Acknowledgments
We extend our sincere thanks to the China University of Geosciences (Beijing) for providing essential facilities and resources. In addition, we would like to thank the previous researchers for their excellent work, which has greatly helped academic research.
Conflicts of Interest
Authors Jing Zhou were employed by the China National Administration of Coal Geology. Peizhi Yu was employed by Chia University of Geosciences, Beijing. Hao Wu and Tianhao Xu were employed by The Second Exploration Bureau of China National Administration of Coal Geology. The remaining authors declare that the research was conducted in the absence of any commercial or financial relationships that could be construed as a potential conflict of interest.
References
- Batako, A.D.; Babitsky, V.I.; Halliwell, N.A. A Self-Excited System for Percussive-Rotary Drilling. J. Sound Vib. 2003, 259, 97–118. [Google Scholar] [CrossRef] [Scilit]
- Lundberg, B.; Okrouhlik, M. Efficiency of a Percussive Rock Drilling Process with Consideration of Wave Energy Radiation into the Rock. Int. J. Impact Eng. 2006, 32, 1573–1583. [Google Scholar] [CrossRef] [Scilit]
- Bo, K.; Sun, S.; Hu, Y.; Wang, M. Design Optimization and Performance Analysis of the Pneumatic DTH Hammer with Self-Propelled Round Bit. Shock Vib. 2021, 2021, 6653390. [Google Scholar] [CrossRef] [Scilit]
- Cooper, L.W.; Hook, R.A.; Payne, B.R. Air Drilling Techniques. In Proceedings of the SPE Deep Drilling and Production Symposium, Amarillo, TX, USA, 17–19 April 1977. [Google Scholar]
- Ghalandari, M.; Mirzadeh Koohshahi, E.; Mohamadian, F.; Shamshirband, S.; Chau, K.W. Numerical Simulation of Nanofluid Flow inside a Root Canal. Eng. Appl. Comput. Fluid Mech. 2019, 13, 254–264. [Google Scholar] [CrossRef] [Scilit]
- Sun, S.; Bo, K.; Jia, R.; Cao, P.; Chen, B.; Guo, M. Experimental Investigation and CFD Simulation of Multiphase Flow Behavior in Air Reverse Circulation Drilling. Adv. Powder Technol. 2023, 34, 104168. [Google Scholar] [CrossRef] [Scilit]
- Epelle, E.I.; Gerogiorgis, D.I. A Multiparametric CFD Analysis of Multiphase Annular Flows for Oil and Gas Drilling Applications. Comput. Chem. Eng. 2017, 106, 645–661. [Google Scholar] [CrossRef] [Scilit]
- Akhshik, S.; Rajabi, M. CFD-DEM Modeling of Cuttings Transport in Underbalanced Drilling Considering Aerated Mud Effects and Downhole Conditions. J. Pet. Sci. Eng. 2018, 160, 229–246. [Google Scholar] [CrossRef] [Scilit]
- Akhshik, S.; Behzad, M.; Rajabi, M. CFD–DEM Approach to Investigate the Effect of Drill Pipe Rotation on Cuttings Transport Behavior. J. Pet. Sci. Eng. 2015, 127, 229–244. [Google Scholar] [CrossRef] [Scilit]
- Han, X.; Song, S.; Li, J. Pressure Drop Characteristics of Reverse Circulation Pneumatic Cuttings Removal during Coal Seam Drilling. Sci. Prog. 2020, 103, 003685042092523. [Google Scholar] [CrossRef] [Scilit]
- Bo, K.; Ji, F.; Zhao, Z.; Fan, L.; Wang, M. Optimum Design of Large-Diameter Reverse Circulation Drill Bit for Drilling Rescue Wells Using Orthogonal Experimental Method and CFD Simulation. Energies 2023, 16, 3913. [Google Scholar] [CrossRef] [Scilit]
- Yin, Q.; Peng, J.; Bo, K.; He, J.; Kui, Y.; Gan, X. Study on Dust Control Performance of a Hammer Drill Bit. Int. J. Min. Reclam. Environ. 2013, 27, 393–406. [Google Scholar] [CrossRef] [Scilit]
- Zhao, Z.Q.; Li, L.J.; Bo, K.; He, X.S.; Chai, J.F. Numerical Investigation Based on Orthogonal Design of Structural Parameters on Large-Diameter DTH Hammer Bit. Adv. Mater. Res. 2013, 774–776, 1442–1445. [Google Scholar] [CrossRef] [Scilit]
- Cao, P.; Chen, Y.; Liu, M.; Chen, B.; Wang, J. Analytical and Experimental Study of a Reverse Circulation Drill Bit with an Annular Slit. Adv. Mech. Eng. 2016, 8, 168781401666947. [Google Scholar] [CrossRef] [Scilit]
- Albdiry, M.T.; Almensory, M.F. Failure Analysis of Drillstring in Petroleum Industry: A Review. Eng. Fail. Anal. 2016, 65, 74–85. [Google Scholar] [CrossRef] [Scilit]
- Deng, W.; Yao, R.; Zhao, H.; Yang, X.; Li, G. A Novel Intelligent Diagnosis Method Using Optimal LS-SVM with Improved PSO Algorithm. Soft Comput. 2019, 23, 2445–2462. [Google Scholar] [CrossRef] [Scilit]
- Khajeh, M. Application of PSO-Artificial Neural Network and Response Surface Methodology for Removal of Methylene Blue Using Silver Nanoparticles from Water Samples. J. Ind. Eng. Chem. 2013, 19, 1624–1630. [Google Scholar] [CrossRef] [Scilit]
- Mokarizadeh, H.; Atashrouz, S.; Mirshekar, H.; Hemmati-Sarapardeh, A.; Mohaddes Pour, A. Comparison of LSSVM Model Results with Artificial Neural Network Model for Determination of the Solubility of SO2 in Ionic Liquids. J. Mol. Liq. 2020, 304, 112771. [Google Scholar] [CrossRef] [Scilit]
- Cai, Z.; Xu, W.; Meng, Y.; Shi, C.; Wang, R. Prediction of Landslide Displacement Based on GA-LSSVM with Multiple Factors. Bull. Eng. Geol. Environ. 2016, 75, 637–646. [Google Scholar] [CrossRef] [Scilit]
- Gupta, M.K.; Sood, P.K.; Sharma, V.S. Machining Parameters Optimization of Titanium Alloy Using Response Surface Methodology and Particle Swarm Optimization under Minimum-Quantity Lubrication Environment. Mater. Manuf. Process. 2016, 31, 1671–1682. [Google Scholar] [CrossRef] [Scilit]
- Kilickap, E.; Huseyinoglu, M.; Yardimeden, A. Optimization of Drilling Parameters on Surface Roughness in Drilling of AISI 1045 Using Response Surface Methodology and Genetic Algorithm. Int. J. Adv. Manuf. Technol. 2011, 52, 79–88. [Google Scholar] [CrossRef] [Scilit]
- Zhang, X.; Wu, Z.; Zhao, Z.; Sun, P.; Tang, L.; Shabir, U. Insight into Dust Control Performance of a Reverse Circulation Drill Bit Using Multiphase Flow Simulation. Eng. Appl. Comput. Fluid Mech. 2022, 16, 841–857. [Google Scholar] [CrossRef] [Scilit]
- Han, X.; Li, P.; Li, J. CFD-DEM Simulation of Reverse Circulation Pneumatic Cuttings Removal during Coal Seam Drilling. Math. Probl. Eng. 2020, 2020, 3707864. [Google Scholar] [CrossRef] [Scilit]
- Alkassar, Y.; Agarwal, V.K.; Pandey, R.K.; Behera, N. Analysis of Dense Phase Pneumatic Conveying of Fly Ash Using CFD Including Particle Size Distribution. Part. Sci. Technol. 2021, 39, 322–337. [Google Scholar] [CrossRef] [Scilit]
- Vakilzadeh, A.; Bagheri Sarvestani, A.; Osloob, R.; Kamali, R. Sensitivity Analysis of Kinetic Theory of Granular Flow (KTGF) and Mixture Models in Terms of Involved Elemental Parameters for Two-Phase Gas-Solid Flow. Part. Sci. Technol. 2023, 41, 1156–1169. [Google Scholar] [CrossRef] [Scilit]
- Ding, J.; Gidaspow, D. A Bubbling Fluidization Model Using Kinetic Theory of Granular Flow. AIChE J. 1990, 36, 523–538. [Google Scholar] [CrossRef] [Scilit]
- Hashemkhani, M.; Soleimani, R.; Fazeli, H.; Lee, M.; Bahadori, A.; Tavalaeian, M. Prediction of the Binary Surface Tension of Mixtures Containing Ionic Liquids Using Support Vector Machine Algorithms. J. Mol. Liq. 2015, 211, 534–552. [Google Scholar] [CrossRef] [Scilit]
- Li, B.; Tian, X. An Effective PSO-LSSVM-Based Approach for Surface Roughness Prediction in High-Speed Precision Milling. IEEE Access 2021, 9, 80006–80014. [Google Scholar] [CrossRef] [Scilit]
- Suykens, J.A.K.; Vandewalle, J. Least Squares Support Vector Machine Classifiers. Neural Process. Lett. 1999, 9, 293–300. [Google Scholar] [CrossRef] [Scilit]
- Chung, Y.S.; Cho, Y.; Kim, B.H. Comparison of Outcomes of Treatment for Ranula: A Proportion Meta-Analysis. Br. J. Oral Maxillofac. Surg. 2019, 57, 620–626. [Google Scholar] [CrossRef] [Scilit]
- Coello, C.A. An Updated Survey of GA-Based Multiobjective Optimization Techniques. ACM Comput. Surv. 2000, 32, 109–143. [Google Scholar] [CrossRef] [Scilit]
- Scrucca, L. GA: A Package for Genetic Algorithms in R. J. Stat. Soft. 2013, 53, 1–37. [Google Scholar] [CrossRef] [Scilit]
- Shami, T.M.; El-Saleh, A.A.; Alswaitti, M.; Al-Tashi, Q.; Summakieh, M.A.; Mirjalili, S. Particle Swarm Optimization: A Comprehensive Survey. IEEE Access 2022, 10, 10031–10061. [Google Scholar] [CrossRef] [Scilit]
- Jordehi, A.R. Enhanced Leader PSO (ELPSO): A New PSO Variant for Solving Global Optimisation Problems. Appl. Soft Comput. 2015, 26, 401–417. [Google Scholar] [CrossRef] [Scilit]
- Zhang, X.; Luo, Y.; Gan, X.; Yin, K. Design and Numerical Analysis of a Large-diameter Air Reverse Circulation Drill Bit for Reverse Circulation Down-the-hole Air Hammer Drilling. Energy Sci. Eng. 2019, 7, 921–929. [Google Scholar] [CrossRef] [Scilit]
- He, J.; Zhao, Z.; Yin, Q.; Luo, Y.; Gan, X. Design and Optimisation on Rapid Rescue Well-Drilling Technology with Large-Diameter Pneumatic Hammers. Int. J. Min. Reclam. Environ. 2020, 34, 19–33. [Google Scholar] [CrossRef] [Scilit]
- Hapugoda, S.; Manuel, J. Techniques Used and Problems Encountered in Normal and Reverse Circulation Drilling at the Mt Roseby Project, Cloncurry, North West Queensland. In Proceedings of the XXV International Mineral Processing Congress, Victoria, Australia, 6–10 September 2010. [Google Scholar]
- Luo, Y.; Peng, J.; Li, L.; He, J.; Gan, X.; Yin, K.; Zhao, Z. Development of a Specially Designed Drill Bit for Down-the-Hole Air Hammer to Reduce Dust Production in the Drilling Process. J. Clean. Prod. 2016, 112, 1040–1048. [Google Scholar] [CrossRef] [Scilit]
- Zhu, L.H.; Huang, Y.; Wang, R.H.; Wang, J.Y. A Mathematical Model of the Motion of Cutting Particles in Reverse Circulation Air Drilling. Appl. Math. Comput. 2015, 256, 192–202. [Google Scholar] [CrossRef] [Scilit]
- Li, Y.; Zhou, Y.; Xiao, Y.; Yang, W. Study of Gas-Solid Two-Phase Flow in Pipeline Elbows Using an LES-DPM Coupling Method. Powder Technol. 2023, 413, 118012. [Google Scholar] [CrossRef] [Scilit]
- Senior, R.C.; Grace, J.R. Integrated Particle Collision and Turbulent Diffusion Model for Dilute Gas-Solid Suspensions. Powder Technol. 1998, 96, 48–78. [Google Scholar] [CrossRef] [Scilit]
- Ren, H. Study on Coring Mechanism of Reverse Circulation Continuous Coring Drill with through DTH Hammer. Ph.D. Thesis, Jilin University, Changchun, China, 2008. [Google Scholar]
- Patro, P.; Dash, S.K. Two-Fluid Modeling of Turbulent Particle–Gas Suspensions in Vertical Pipes. Powder Technol. 2014, 264, 320–331. [Google Scholar] [CrossRef] [Scilit]
- Yong, H.; Lihong, Z.; Kun, Y.; Hong, R. Grain Size Distribution Law of Cuttings in DTH Hammer Reverse Circulation Drilling. J. Jilin Univ. (Earth Sci. Ed.) 2012, 42, 1119–1124. [Google Scholar] [CrossRef]
- Hongtu, Z.; Ouya, Z.; Botao, L.; Jian, Z.; Xiangyu, X.; Jianping, W. Effect of Drill Pipe Rotation on Gas-Solid Flow Characteristics of Negative Pressure Pneumatic Conveying Using CFD-DEM Simulation. Powder Technol. 2021, 387, 48–60. [Google Scholar] [CrossRef] [Scilit]

Disclaimer/Publisher’s Note: The statements, opinions and data contained in all publications are solely those of the individual author(s) and contributor(s) and not of MDPI and/or the editor(s). MDPI and/or the editor(s) disclaim responsibility for any injury to people or property resulting from any ideas, methods, instructions or products referred to in the content. |
© 2026 by the authors. Licensee MDPI, Basel, Switzerland. This article is an open access article distributed under the terms and conditions of the Creative Commons Attribution (CC BY) license.