


Abstract
This study aims to enhance the development effectiveness of infill wells in the strongly heterogeneous conglomerate reservoir of the Baikouquan Formation in the Bai 21 well area of the Junggar Basin. By optimizing the synergy between fracturing and waterflooding development, it provides a basis for improving the recovery rate of such reservoirs. Integrating geomechanical modeling, fracturing numerical simulation, and reservoir dynamic analysis, the influence mechanisms of fracturing parameters—including pumping rate, pad fluid ratio, and proppant intensity—on fracture propagation, waterflooding response, and stress field evolution were systematically investigated. The results indicate that an optimal parameter combination of a pumping rate of 3.5–4.0 m3/min, a pad fluid ratio of 40–50%, and a proppant intensity of 3.0–4.0 m3/m can create short, wide fractures with half-lengths of 40–45 m, effectively delaying water breakthrough and reducing inter-well interference. Stress field simulations further reveal non-uniform evolution during injection and production: the stress near injection wells initially increases and then decreases, dropping by 9.3% compared to the initial value, while the stress around production wells continuously decreases, with a reduction of up to 37.3%. These findings provide valuable guidance for the synergistic development of fracturing and waterflooding in infill wells in similar strongly heterogeneous conglomerate reservoirs.
1. Introduction
The Triassic Baikouquan Formation reservoir in the Bai 21 well block, located on the northwestern margin of the Junggar Basin, is a typical alluvial fan conglomerate reservoir characterized by low porosity, low permeability, and strong heterogeneity [1,2]. After long-term waterflooding development, preferential water flow channels have developed within the reservoir, leading to severe ineffective water circulation. Consequently, the reservoir has entered a “dual-high” development stage characterized by high water cut and a high degree of recovery, making well pattern adjustment urgently necessary. Based on the existing waterflooding well groups, an inverted nine-spot pattern was adopted for refined waterflooding development. Production wells were put into operation through perforation followed by intra-layer multi-stage fracturing. The optimization of fracturing engineering parameters is a key technology for avoiding the formation of preferential water flow channels.
Scholars have conducted research on the characteristics of hydraulic fractures in infill wells and their controlling parameters. The propagation morphology of hydraulic fractures in conglomerate reservoirs is not simply planar; instead, it forms a complex three-dimensional fracture network system controlled by multi-scale heterogeneity, based on two fundamental modes: penetrating through gravels and bypassing around gravels [3,4,5,6]. Related studies have recognized that higher fluid viscosity and larger injection rates favor fracture penetration through gravels, while high viscosity and low injection rates tend to promote the formation of short, wide fractures [7,8,9,10]. Recent studies have established corresponding governing equations through fully or partially coupled Thermal-Hydraulic-Mechanical (THM) numerical simulation methods in porous media, revealing the interaction mechanisms among the temperature field, seepage field, and stress field [11,12,13]. While the study describes hydraulic fracture propagation behavior under different engineering parameters, it lacks sufficient quantitative description of the evolution of the in situ stress field, the distribution of remaining oil, and the changes in formation pressure following fracturing in infill well patterns during waterflooding development [14,15,16,17,18]. Previous studies, based on reservoir initial conditions and validated through multi-scale approaches, have established a relatively accurate understanding of the in situ stress field, pressure field, and crude oil distribution. However, for the Baikouquan Formation reservoir in the Bai 21 well area investigated in this paper, the distribution characteristics of its in situ stress field, pressure field, and seepage field after long-term injection and production development remain unclear and require in-depth investigation. Revealing its dynamic evolution patterns holds significant theoretical and practical importance for guiding the optimization of fracturing designs for infill wells in this block.
This study focuses on the Baikouquan Formation in the Bai 21 well block, investigating the influence mechanisms of fracturing parameters on fracture propagation in infill wells and the evolution of the in situ stress field during waterflooding. The aim is to provide a theoretical basis and technical support for resolving current development challenges and enhancing oil recovery, as well as to offer a theoretical foundation for the synergistic optimization of “fracturing-waterflooding-production” in conglomerate reservoirs. The research findings are of significant importance for guiding development adjustments in conglomerate reservoirs during the high water-cut stage.
2. Engineering Background
The Triassic Baikouquan Formation reservoir in the Bai 21 well block is a structural-lithologic reservoir controlled by faults, with inactive edge and bottom water. The reservoir sand bodies exhibit good continuity, with the T1b1 layer being the thickest at 48.3 m, followed by the T1b2 layer at 36.9 m, and the T1b3 layer being the thinnest at 27.7 m. The average thickness of the barrier bed between T1b3 and T1b2 is 2.2 m; it is thinner in the central part and thicker in the northeastern part, with overall good stability. The average thickness of the barrier bed between T1b2 and T1b1 is 2.8 m; it is thicker in the northwestern part, while the thinner areas exhibit a potato-shaped distribution, with moderate overall stability.
The reservoir lithology of the Triassic Baikouquan Formation in the Bai 21 well block is predominantly fine-to-small grained conglomerate and sandy conglomerate. The roundness is mainly sub-rounded to rounded, with poor sorting. The cementation type is primarily contact–porous, indicating low textural maturity. Through a multi-scale comprehensive investigation, it is revealed that the natural fractures are poorly developed. The interpreted oil-bearing zones in the Baikouquan Formation have an average porosity of 12.6% and an average permeability of 66.1 mD. The original formation pressure is 255 bar, and the central formation temperature is 62.0 °C. The specific scope is shown in Table 1.
Table 1.
Block geological parameter table.
During the initial development phase, the Triassic Baikouquan Formation reservoir in the Bai 21 well block achieved long-term continuous stable production through layered development and infill well adjustment. In the production enhancement stage, the implementation of refined water flooding, multi-stage fracturing for production increase, and development adjustment trials further boosted oil production, revealing significant adjustment potential in the reservoir. Currently, a refined water flooding well pattern has been established by drilling a new 175 m × 250 m inverted nine-spot pattern in the T1b3 layer and comprehensively utilizing existing wells.
3. Governing Equations
Based on the theory of induced stress, a multi-field coupled numerical simulation method is established to systematically compute the distribution patterns of the in situ stress field under different geological and engineering conditions. On this foundation, the influencing mechanisms on the propagation paths and geometries of hydraulic fractures in infill well clusters are analyzed in depth. By integrating fracture propagation models that couple geomechanics and hydrodynamics with poroelastic models, this approach enables the quantitative characterization of both the formation process of complex fracture networks and the evolution of the in situ stress field under long-term injection and production development.
3.1. The Governing Equations for Fracture Propagation
The fracture geometry is simulated using the Unconventional Fracture Model (UFM) [19]. The UFM is based on a pseudo-three-dimensional fracture model, which discretizes the hydraulic fracture laterally into several units of varying heights. Within each unit, the fracture height and length are calculated. The model couples fluid flow with solid elastic deformation, allowing for the consideration of complex fracture network patterns [15]. The mathematical formulation is as follows.
(1) Intra-Fracture Flow Equation
The fluid within the fracture is considered as a power-law fluid undergoing laminar flow between parallel plates, satisfying Poiseuille’s law.
where p is the fluid pressure (MPa); s is the distance from the wellbore along the fracture (m); w is the average fracture width (m); n′ is the fluid power-law index; q is the fluid flow rate within the fracture (m3/min); Hfl is the fluid height within the fracture, which equals the fracture height during propagation (m); k′ is the consistency index; w(z) is the fracture width at depth z (cm); z is an arbitrary depth within the fracture (m); α0 and ϕ(n′) are coefficients related to the flow.
(2) Mass Balance Equation
The mass balance condition is given by the continuity equation:
where t is time (s); hL is the leak-off height (m); CL is the comprehensive leak-off coefficient (m/min0.5); τ0(s) is the time at which fluid entered the fracture element at location s (s); Q(t) is the pumping rate (m3/min); L(t) is the fracture length at time t (m); H is the fracture height (m); qi is the fluid flow rate through the i-th perforation (m3/min); Nperf is the number of perforations.
(3) Fracture Height and Width
The fracture width profile is given by:
At the fracture tip, the condition is:
where x, y are the horizontal and vertical coordinates (m); σn is the normal stress (MPa).
The stable fracture height is determined by matching the stress intensity factor at the tip with the fracture toughness of the layer containing the tip. Thus, the width for each fracture element can be obtained:
Assuming no vertical fluid flow, then:
where pcp is the pressure at hcp (MPa); ρf is the density of the fluid within the fracture (g/cm3); g is the gravitational acceleration (m/s2); hcp is the reference depth from the fracture bottom to the perforation point (m).
3.2. Poroelastic Model
Using an elastic damage constitutive relationship, with compressive stress (strain) taken as positive, the porous medium behaves elastically in the initial stage of loading. According to the generalized Hooke’s law, the constitutive equations for the porous medium, expressed in terms of displacement, pore fluid pressure p (negative for contraction), and temperature change T, are given as [20]:
where G is the shear modulus of the medium; ν is the drained Poisson’s ratio of the medium; Fi and ui (with i = x, y, z) represent the body force components and displacement components along the i-direction, respectively; K′ = 2G(1 + ν)/3(1 − 2ν) is the drained bulk modulus of the medium; αT is the overall volumetric thermal expansion coefficient of the medium under constant pore pressure (unit: °C−1); α is the Biot’s coefficient.
The porosity of the reservoir layer and its relationship with the applied stress can be expressed as:
where ϕ0 is the porosity under zero-stress conditions; αφ is the stress sensitivity coefficient of porosity; ϕr is the limiting value of porosity under high compressive stress; σv is the mean effective stress.
The relationship between reservoir permeability and porosity satisfies the following power-law function:
where k0 is the permeability under zero-stress conditions (unit: m2); k is the permeability under applied stress (unit: m2).
3.3. Model Solution
The fracturing and fracture propagation model for infill well groups, along with the coupled multi-physical field interactions, involves governing equations that are highly nonlinear in both the temporal and spatial domains. Consequently, these equations can only be solved using numerical methods such as the finite element method. By utilizing the Kinetix fracturing module in conjunction with other simulators, it becomes possible to achieve solutions for fracture propagation and stress field evolution under long-term injection and production operations. The core task for researchers lies in the modeling and engineering application of these multi-physical field coupling problems—namely, formulating the governing equations for the coupled system—without needing to focus on the numerical solution of the coupled equations themselves. This significantly streamlines the research process.
In this study, the Kinetix fracturing module is employed alongside the VISAGE finite element geomechanical simulator and the INTERSECT high-resolution reservoir simulator to investigate the influence of fracturing engineering parameters on fracture propagation in infill wells and the evolution of the in situ stress field during waterflooding. Model validation was conducted using field data from infill well fracturing operations (including parameters such as treatment pressure, pumping rate, and sand concentration). The simulation results are highly consistent with the fracture geometry interpreted by microseismic interpretation, which verifies the reliability of the model.
4. Three-Dimensional Geological Model
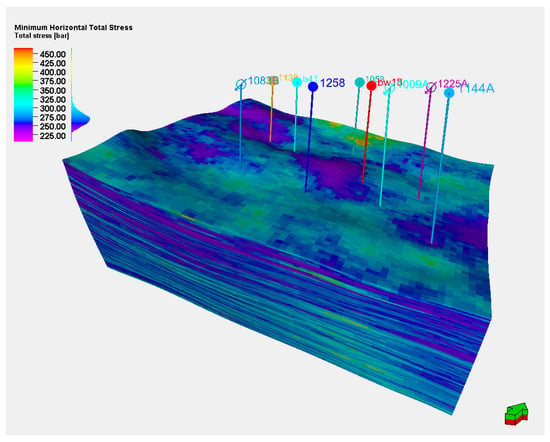
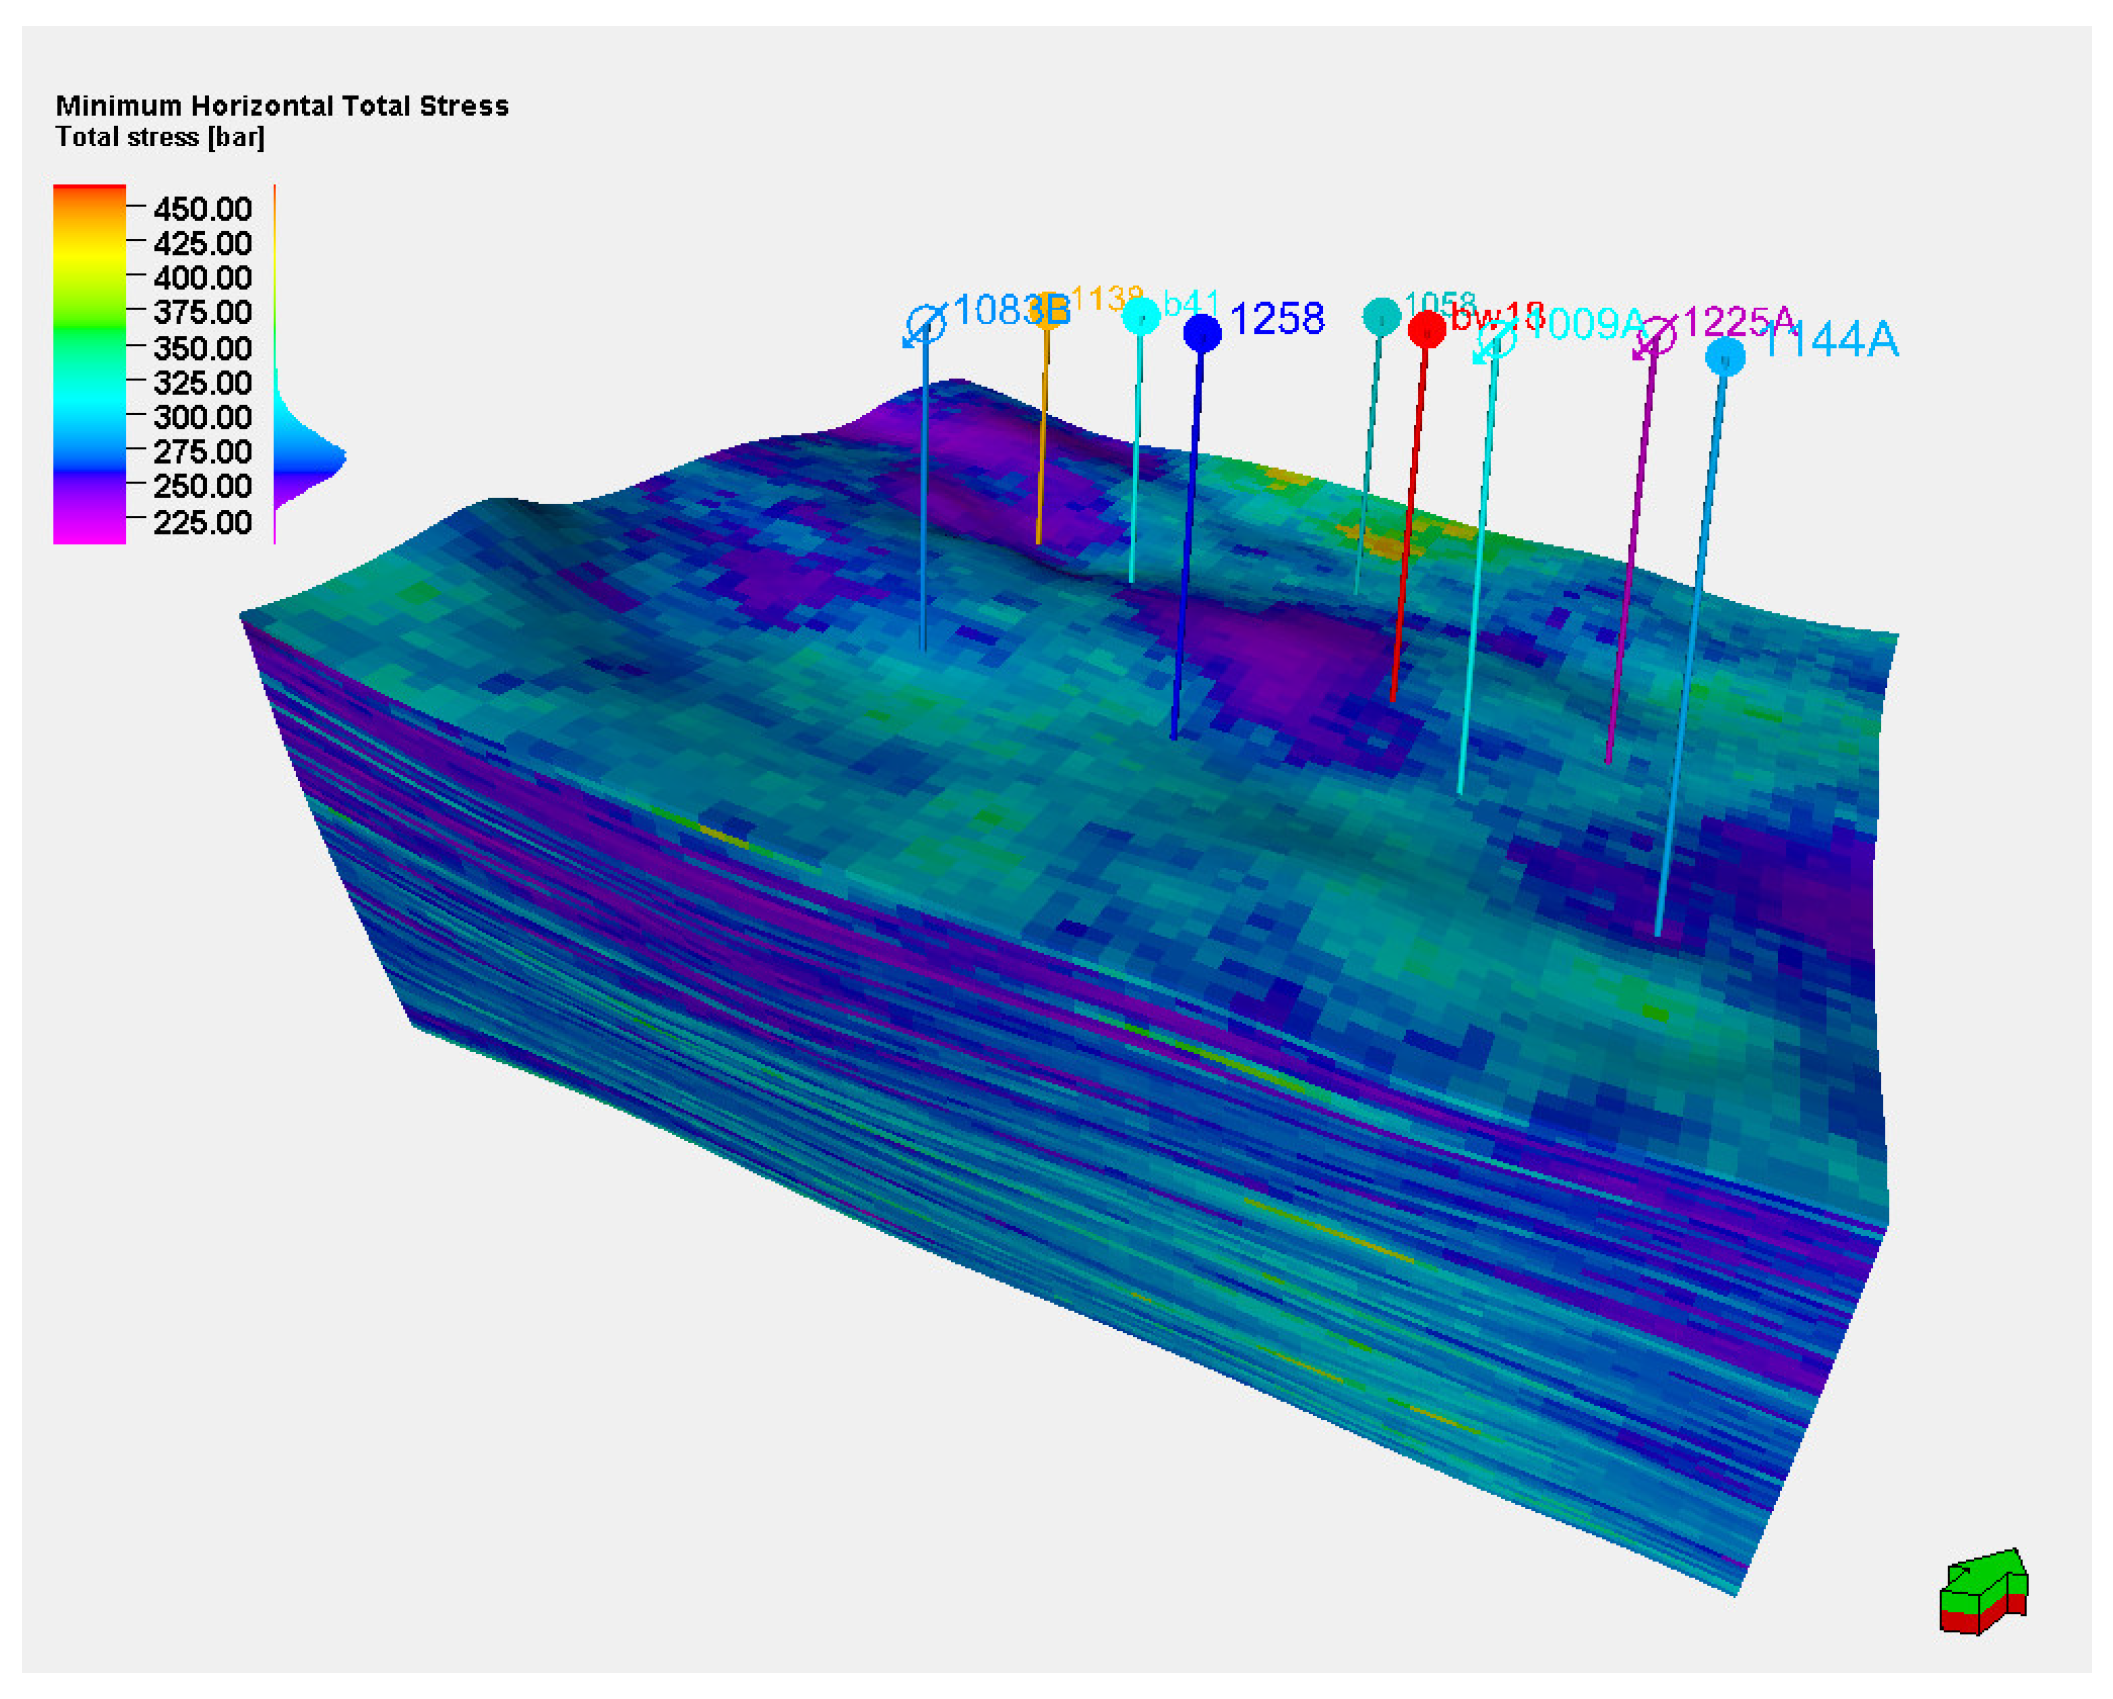
The average Young’s modulus of the Triassic Baikouquan Formation reservoir rocks in the Bai 21 well area is 24.14 GPa, with an average Poisson’s ratio of 0.27. The average overburden pressure is 480 bar, the average maximum horizontal principal stress is 296 bar, and the average minimum horizontal principal stress is 272 bar. The direction of the maximum horizontal principal stress is NE60°. The specific ranges of geomechanical properties are shown in Table 2. By integrating rock mechanics test results, well-log interpretation data, and seismic data, a three-dimensional geomechanical model of the reservoir has been established, as illustrated in Figure 1.
Table 2.
Geomechanical property range table.
Figure 1.
Minimum horizontal principal stress model.
5. Numerical Simulation and Model Validation
5.1. Old Well Hydraulic Fracturing Crack Expansion Simulation
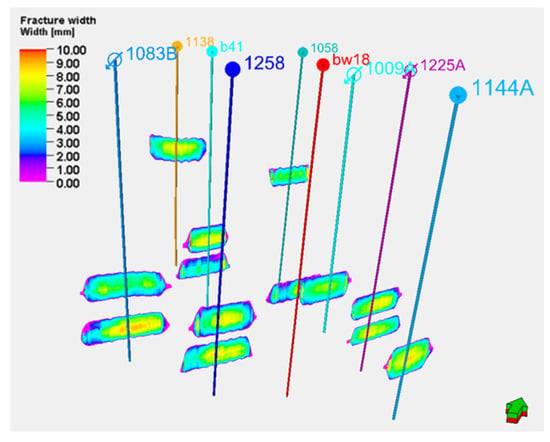
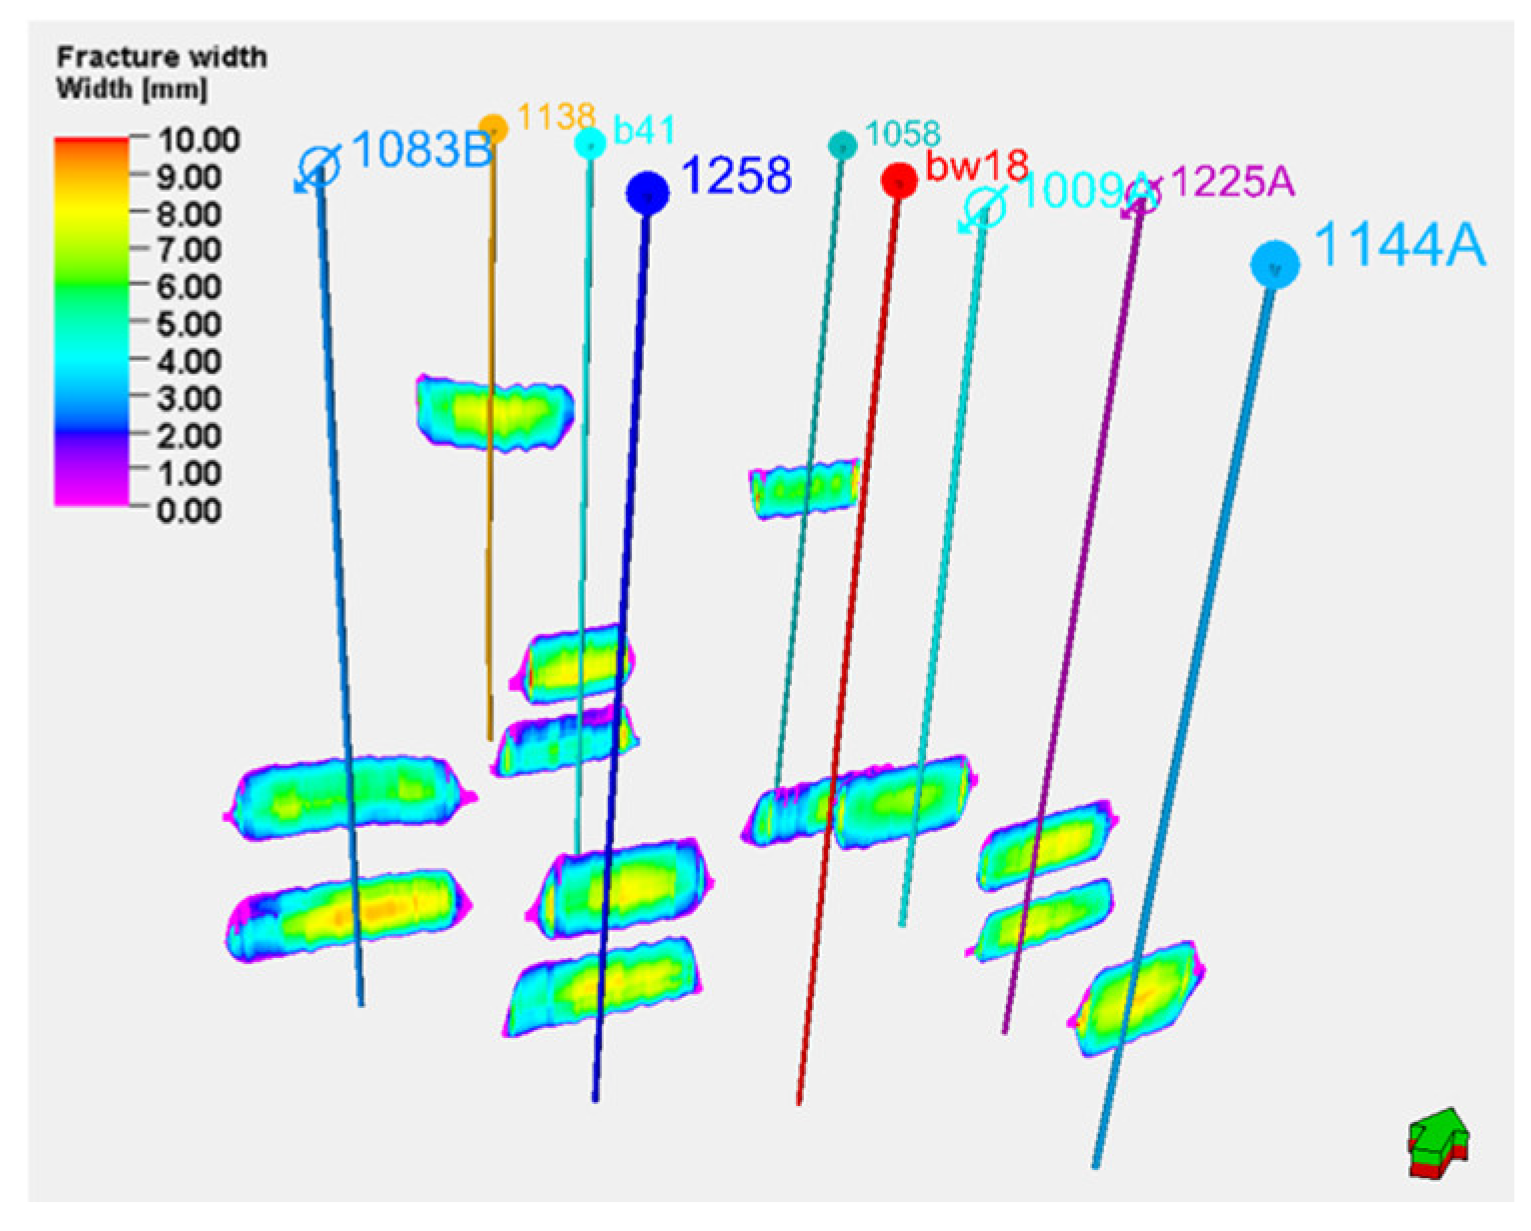
Based on the three-dimensional geomechanical model and combined with the fracturing parameters of existing wells, hydraulic fracturing simulations were conducted. Water-based guar fracturing fluid was used for all nine existing wells, and the fracturing operation parameters are listed in Table 3. Figure 2 shows the simulation results of hydraulic fracture propagation for the existing wells, while the geometric characteristics of the hydraulic fracture propagation results are provided in Table 4.
Table 3.
Fracturing operation parameters table.
Figure 2.
Old well fracturing fracture expansion simulation results.
Table 4.
Hydraulic fracture geometric parameters table.
Based on the hydraulic fracture simulation results and production data from existing wells, reservoir numerical simulation technology was employed to conduct production history matching for the existing wells and simulate the regional dynamic in situ stress field. From January 2006 to December 2024, nine existing wells were successively fractured. Among them, six production wells initially had an average liquid production rate of 16.65 t/d, an oil production rate of 4.56 t/d, and a wellhead flowing pressure of 0.66 MPa. Three water injection wells maintained long-term injection, with daily water injection rates ranging from 30 to 55 t/d and wellhead injection pressures between 22 and 28 bar.
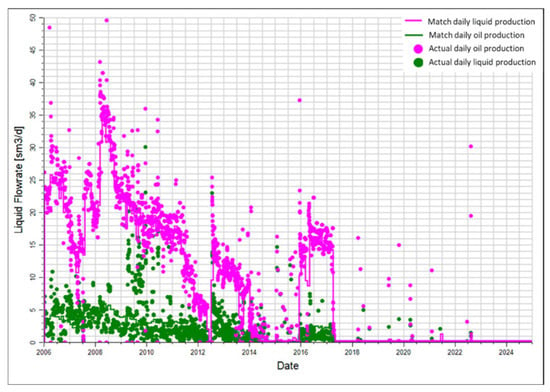
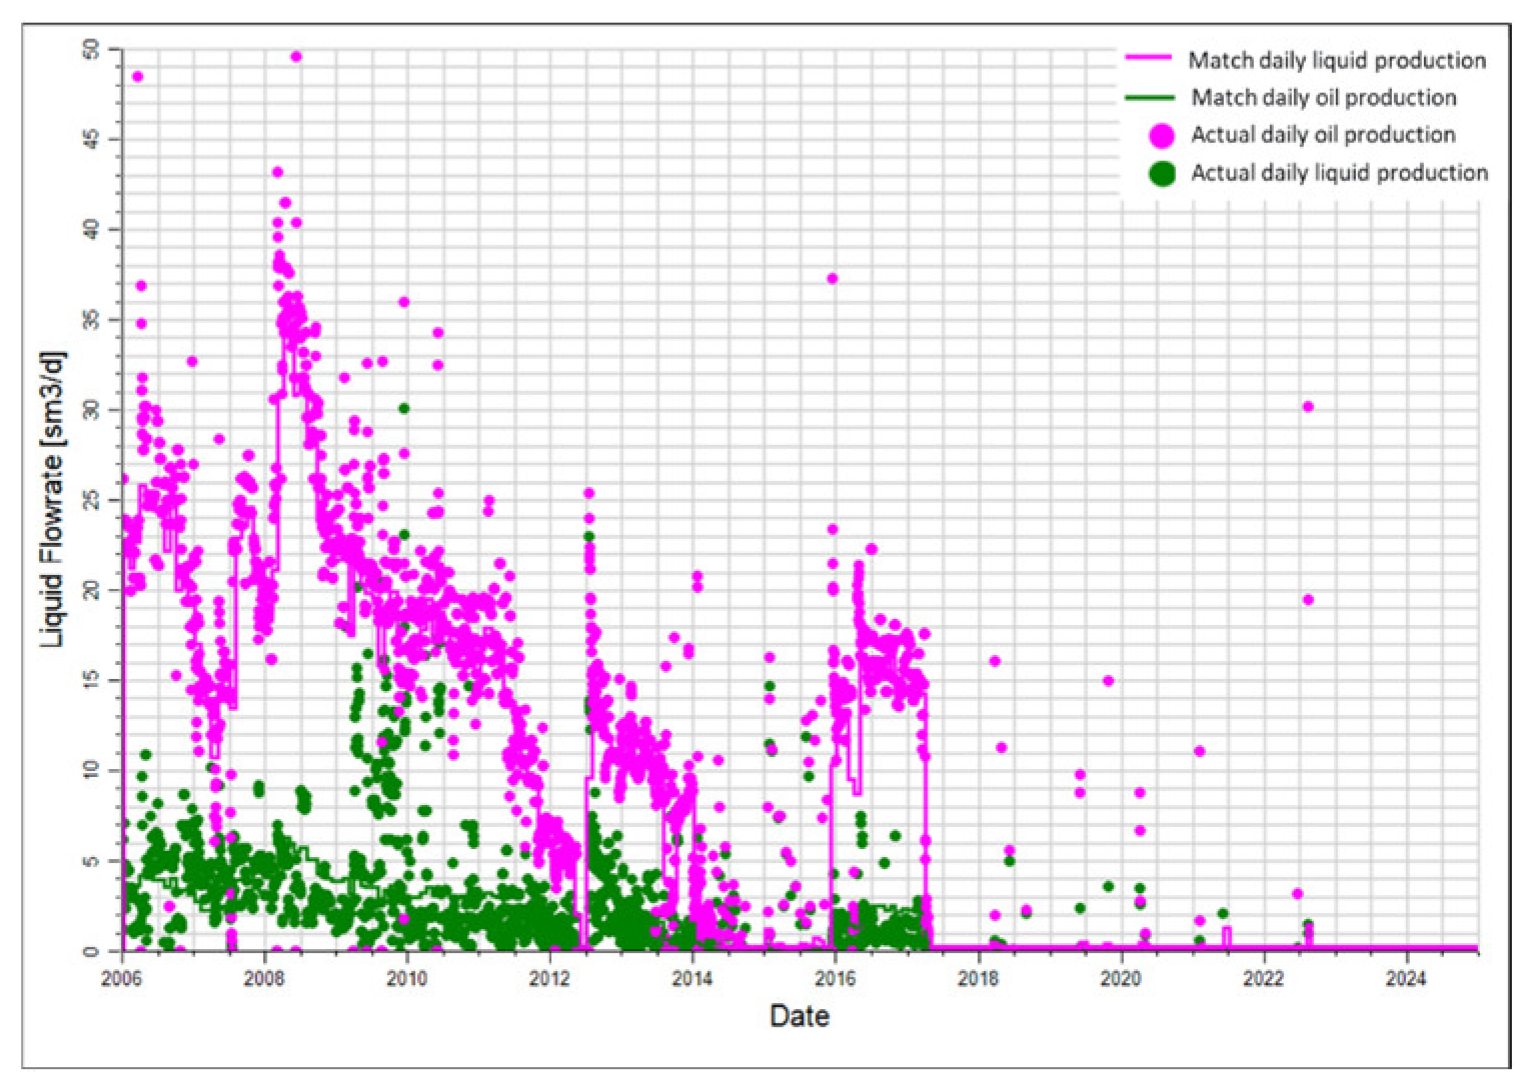
This study used the actual production and injection rates as targets for history matching the existing wells’ production. Petrophysical parameters in the geological model, such as porosity and permeability, were calibrated to achieve a good agreement between the production data and the simulation results. Taking Well B41 as an example, the match between the simulated and observed data is presented in Figure 3. During the injection and production process following the fracturing of the existing wells, the injection wells continuously replenished energy into the formation, ensuring sufficient reservoir energy to maintain efficient production from the production wells.
Figure 3.
Fitting Results for Well B41.
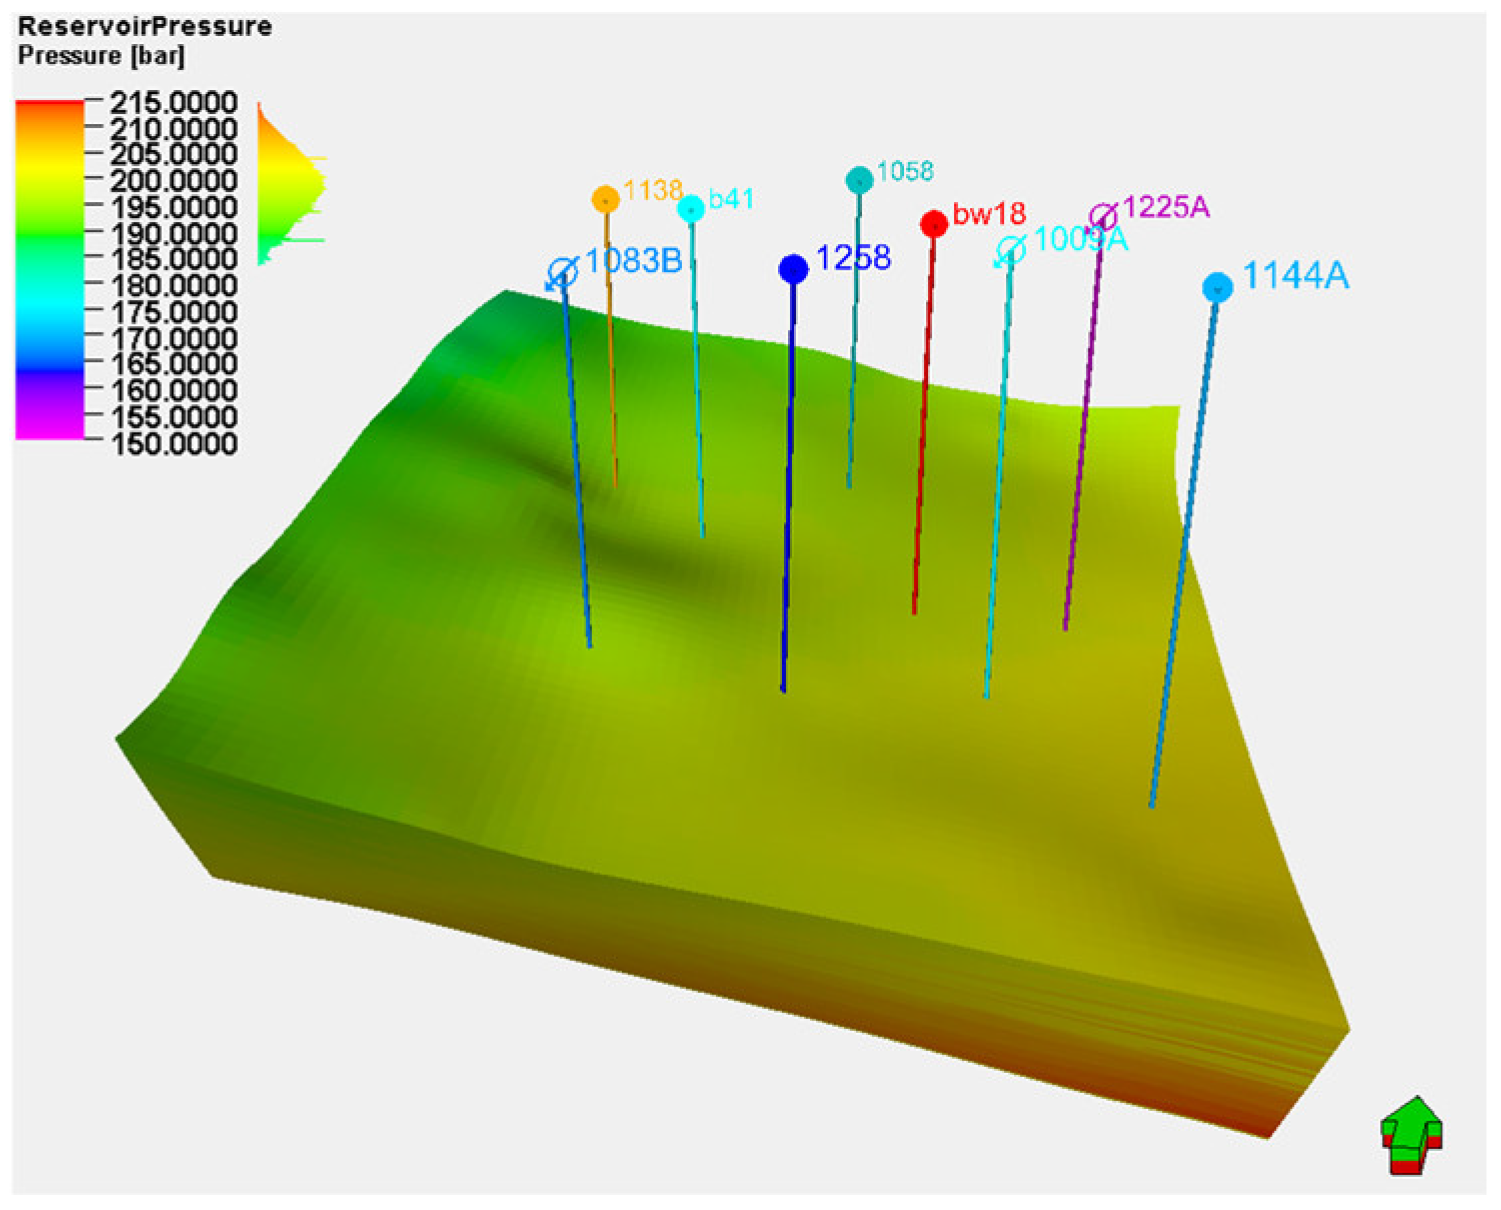
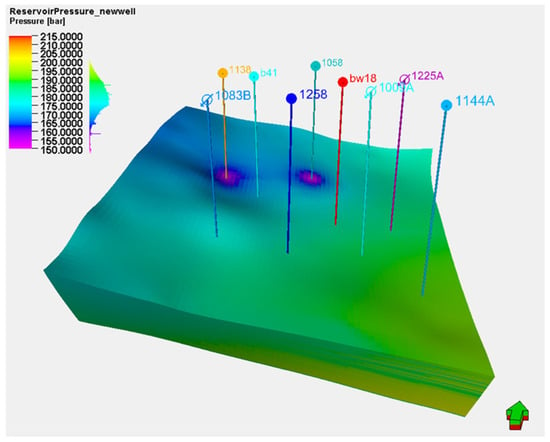
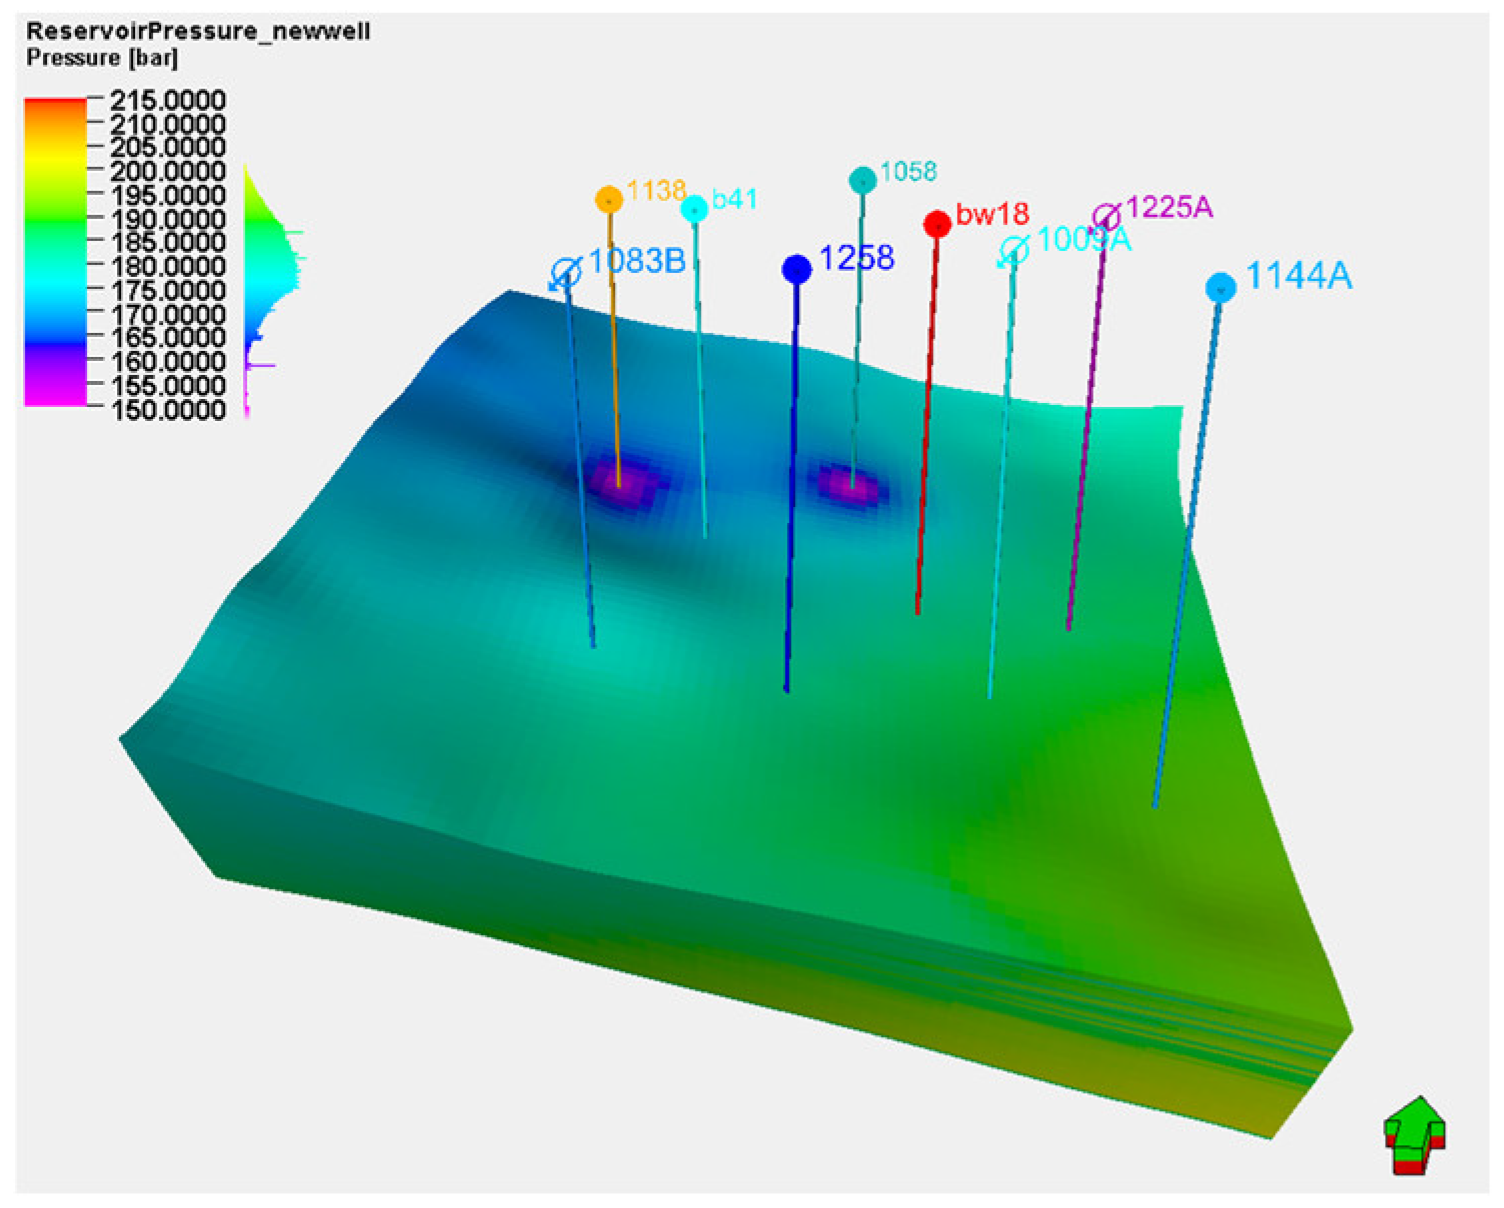
At the initial stage of injection and production, the formation pressure was 205 bar (Figure 4). After 19 years of production, the formation pressure declined to 186 bar, representing a relatively small decrease of only 9.3% (Figure 5).
Figure 4.
Initial formation pressure field map of the old well fracturing production (January 2006).
Figure 5.
Old well fracturing production formation pressure field map (December 2024).
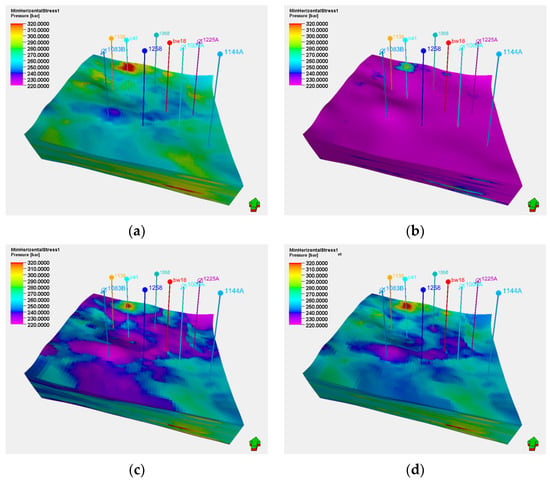
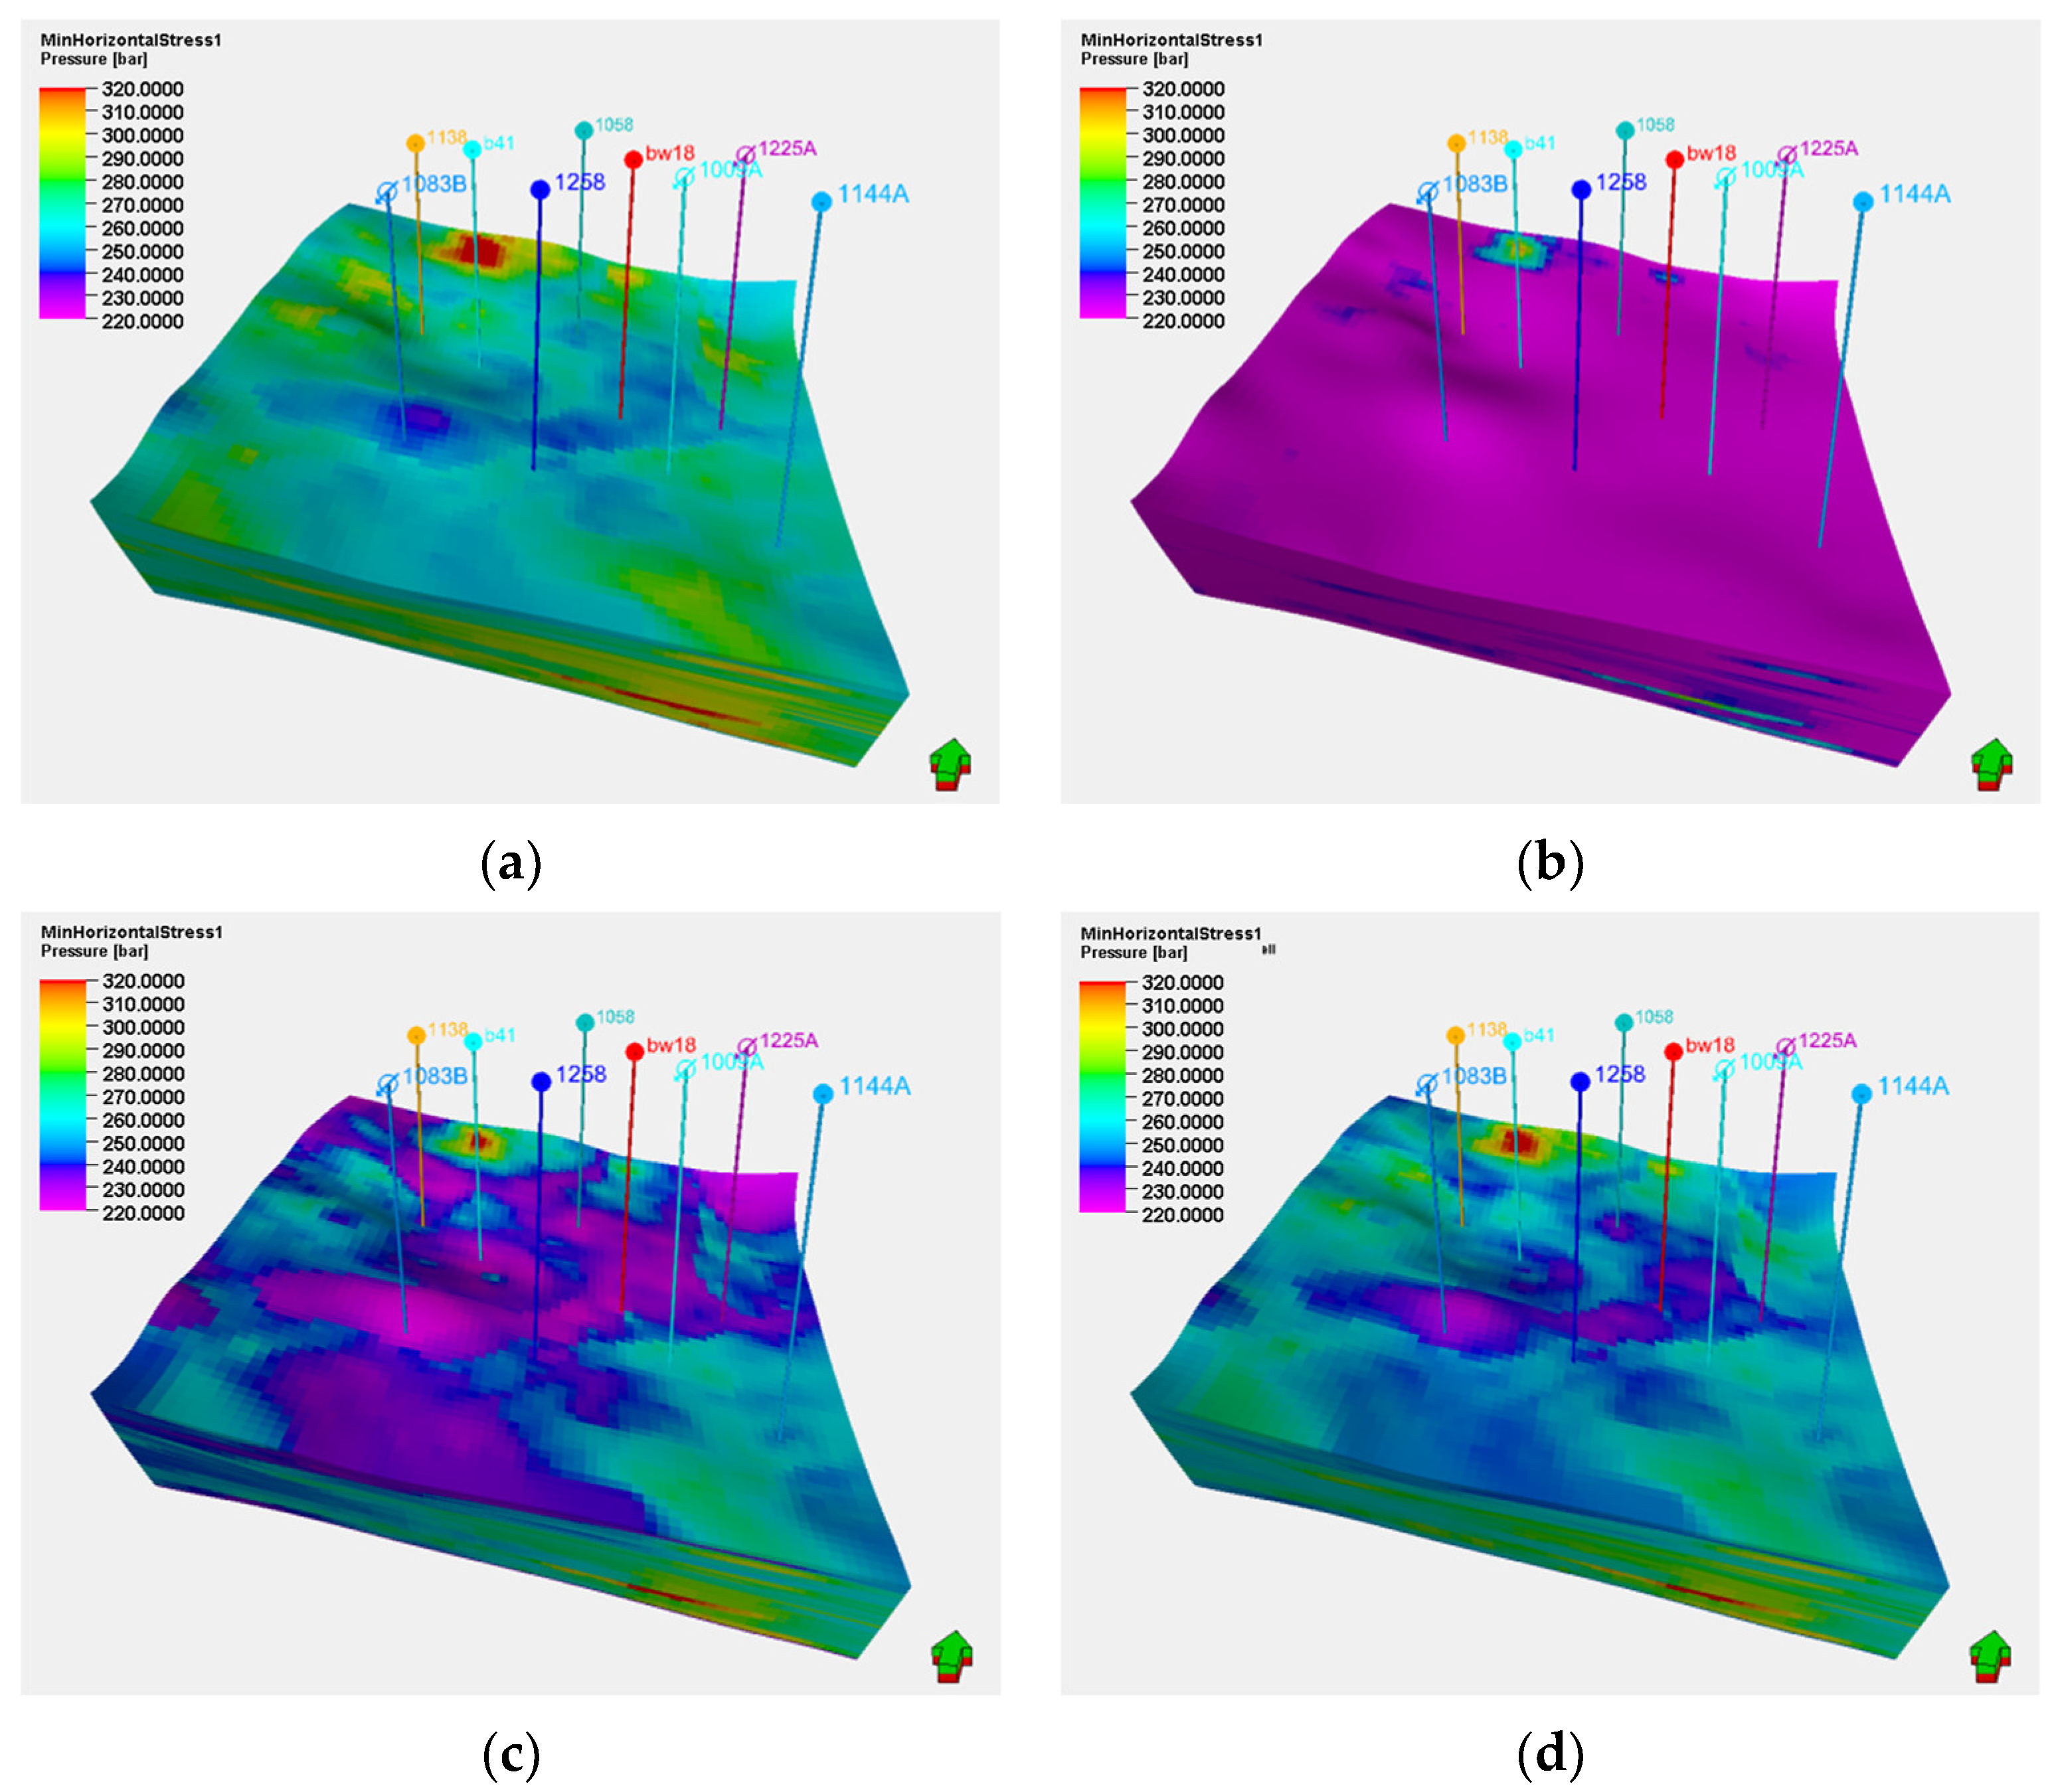
Simultaneously, a simulation of the in situ stress field evolution during injection and production was conducted. The results, shown in Figure 6, indicate that the minimum horizontal principal stress gradually decreased during the initial production phase. After water injection commenced in 2011, the minimum horizontal principal stress began to recover gradually. Within the target well group, the minimum horizontal principal stress decreased from a range of 259–343 bar to 246–330 bar, with an average reduction of 12 bar. The areas experiencing a more significant decrease in the minimum horizontal principal stress were primarily concentrated around the production wells.
Figure 6.
Evolution of the minimum horizontal principal stress field during the long-term water-flooding process: (a) January 2006; (b) January 2011; (c) January 2016; (d) December 2024.
5.2. Simulation of Hydraulic Fracturing Crack Extension in Infilled Well
Based on the existing injection-production well pattern of the older wells, an infill inverted nine-spot well pattern with a well spacing of 175 m × 250 m was deployed in the T1b3 layer of the Baikouquan Formation, involving 9 new infill wells. To mitigate profile conflicts and improve oil layer utilization, the T1b3 layer in the 9 older wells was sealed with cement, and their production interval was switched to the T1b2 layer of the Baikouquan Formation.
To tap into the remaining oil potential of the T1b3 layer reservoir, targeted multi-stage fracturing technology was employed to enhance production, building upon the geological conditions established by long-term injection and production in the older wells. Fracturing engineering parameters were optimized to create short, wide fractures through precise fracturing design. This approach aims to improve reservoir control in the near-wellbore region while avoiding the risk of water channeling during subsequent water injection.
Using the control variable method, multiple simulation scenarios (Table 5) were designed focusing on key parameters such as fracturing pump rate, pad fluid ratio, and proppant intensity. The influence of these fracturing parameters on fracture geometry, waterflooding response, and the evolution of the in situ stress field was analyzed. The objective was to optimize and determine reasonable fracturing parameters that would achieve enhanced production through refined waterflooding.
Table 5.
Fracturing Engineering Parameter Optimization Simulation Plan.
6. Discussion and Analysis
6.1. Fracturing Pump Rate
6.1.1. Fracture Morphology Analysis
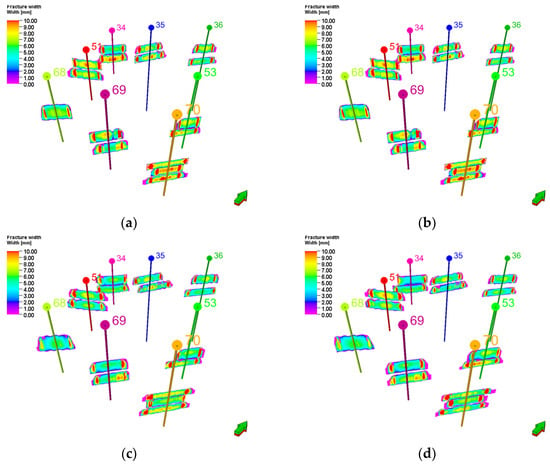
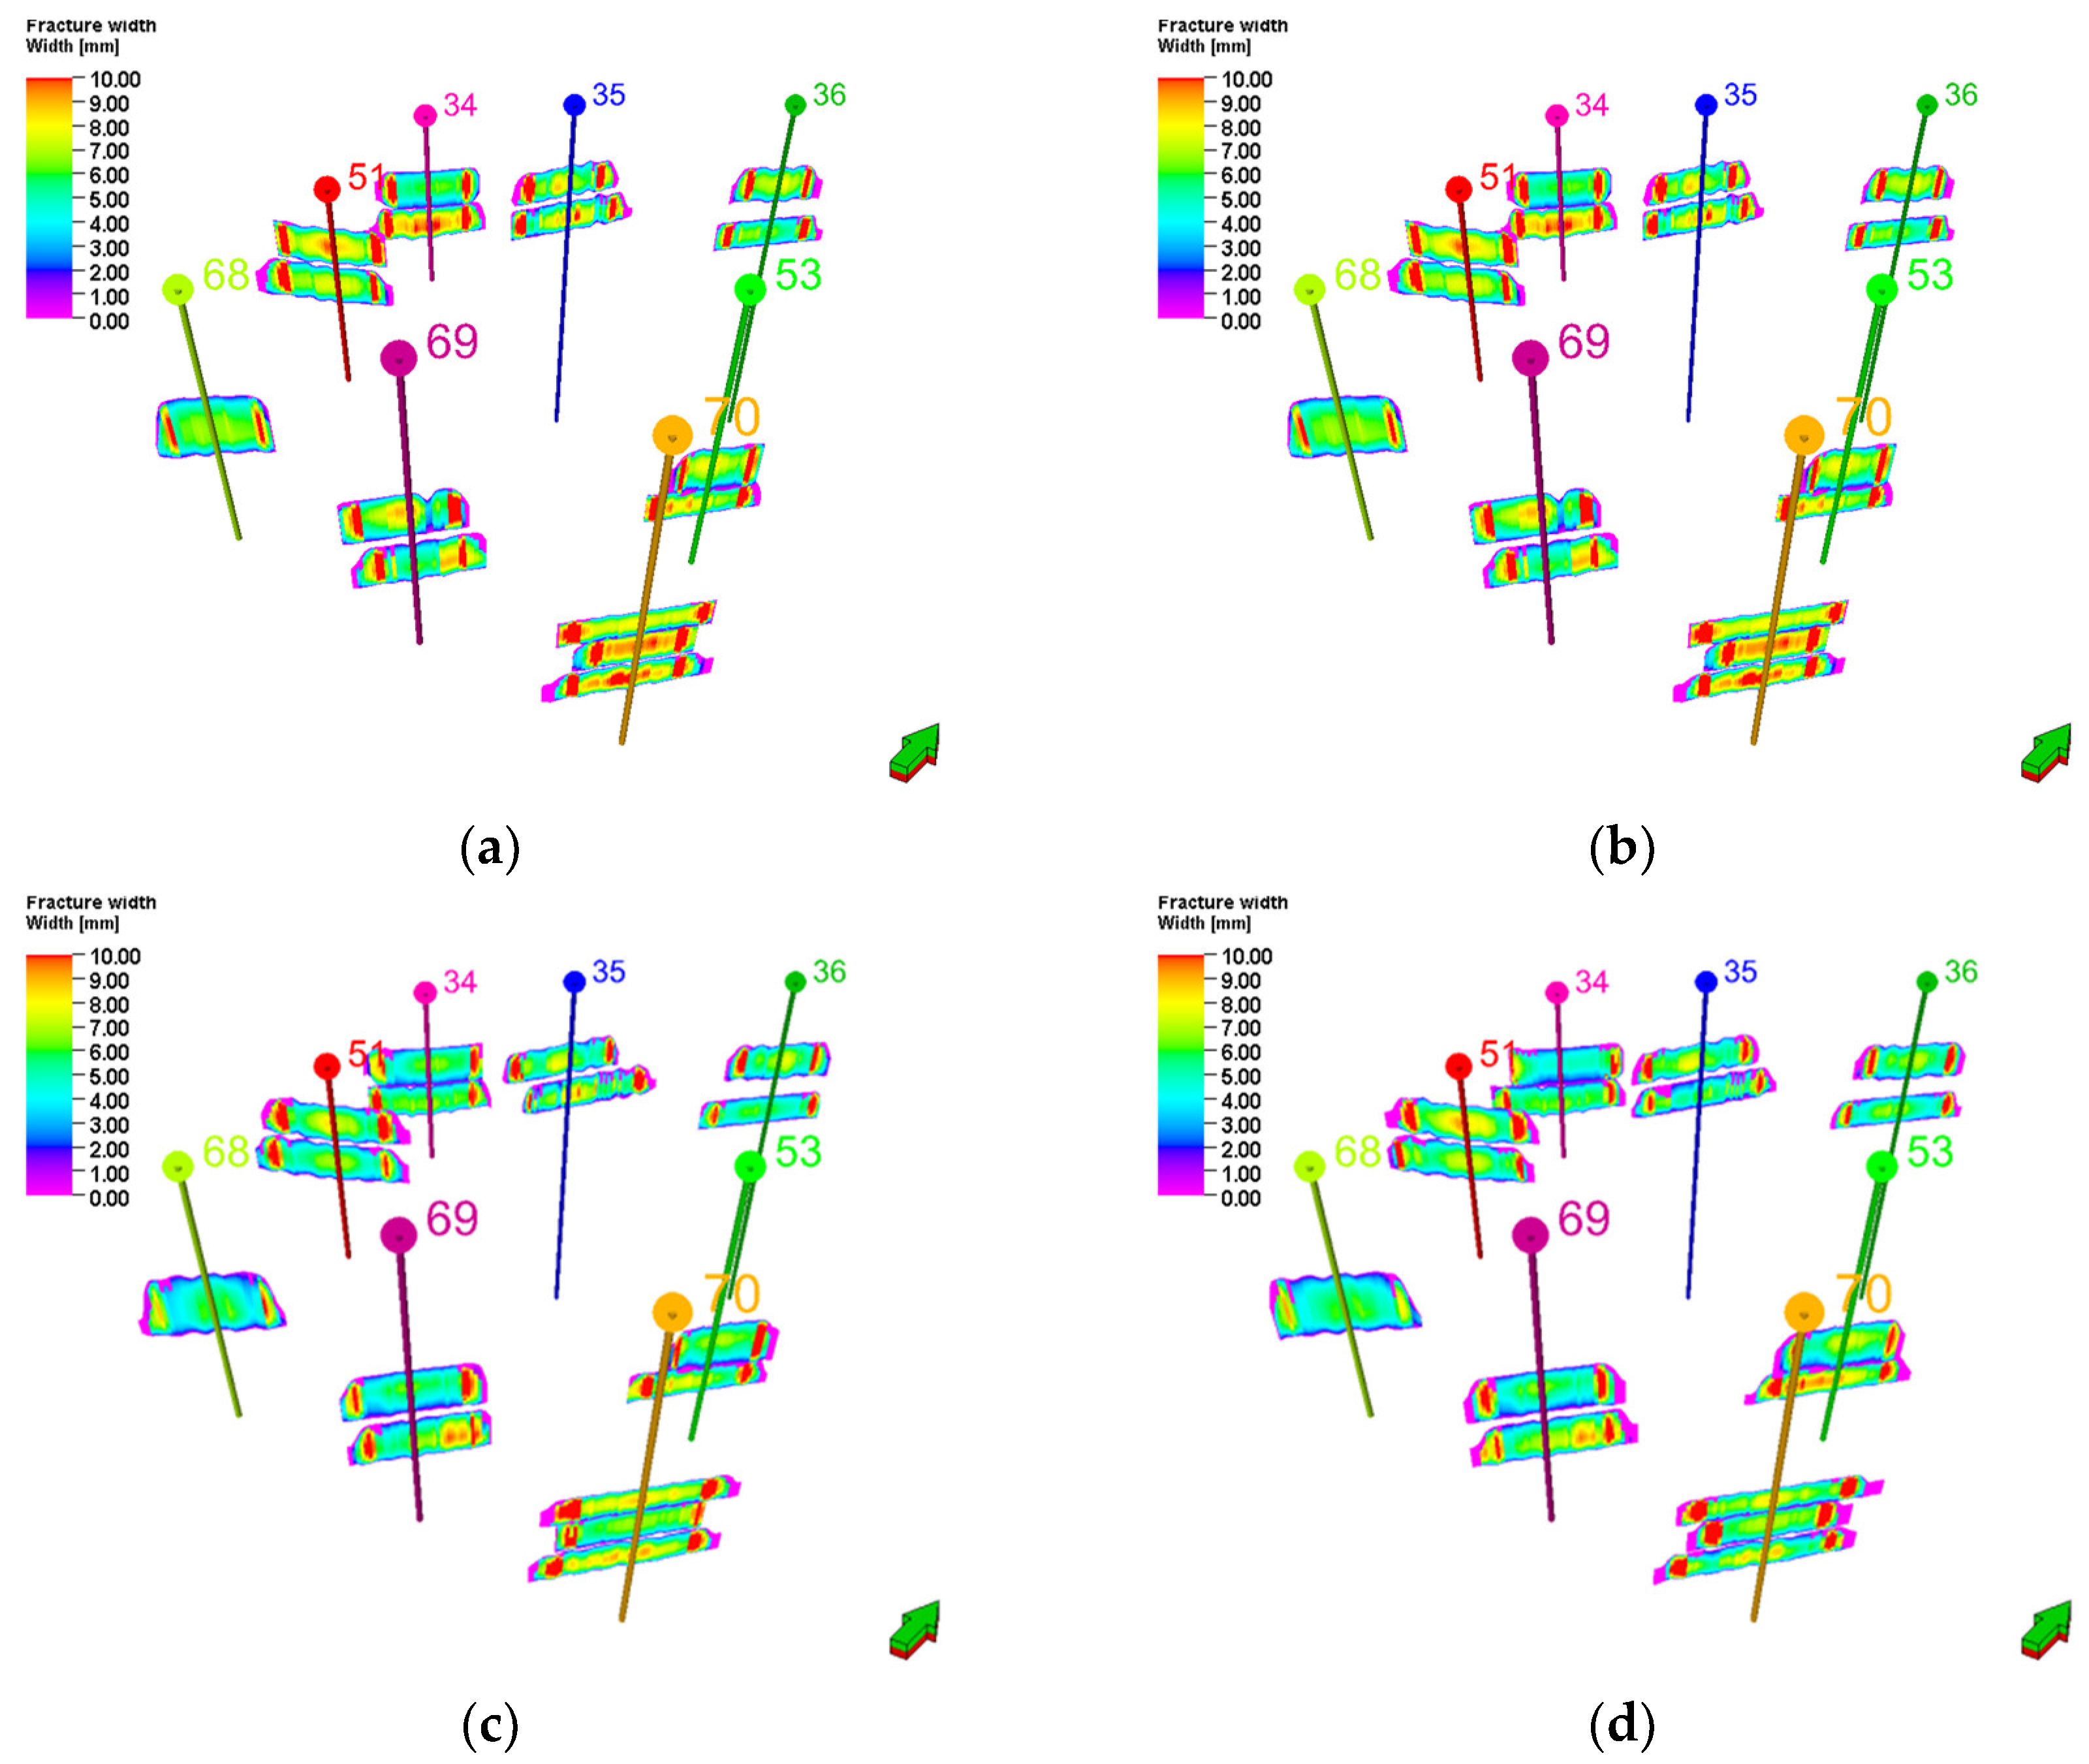
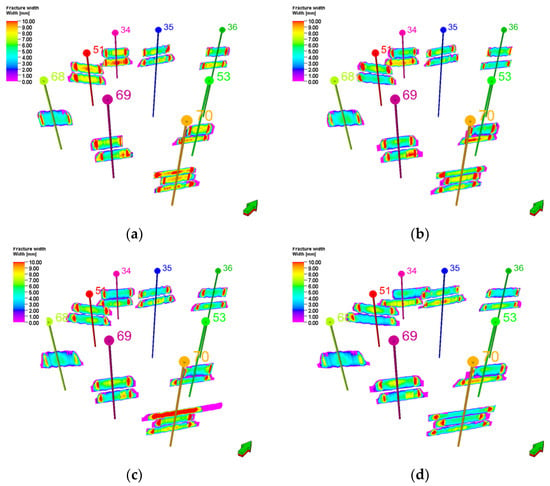
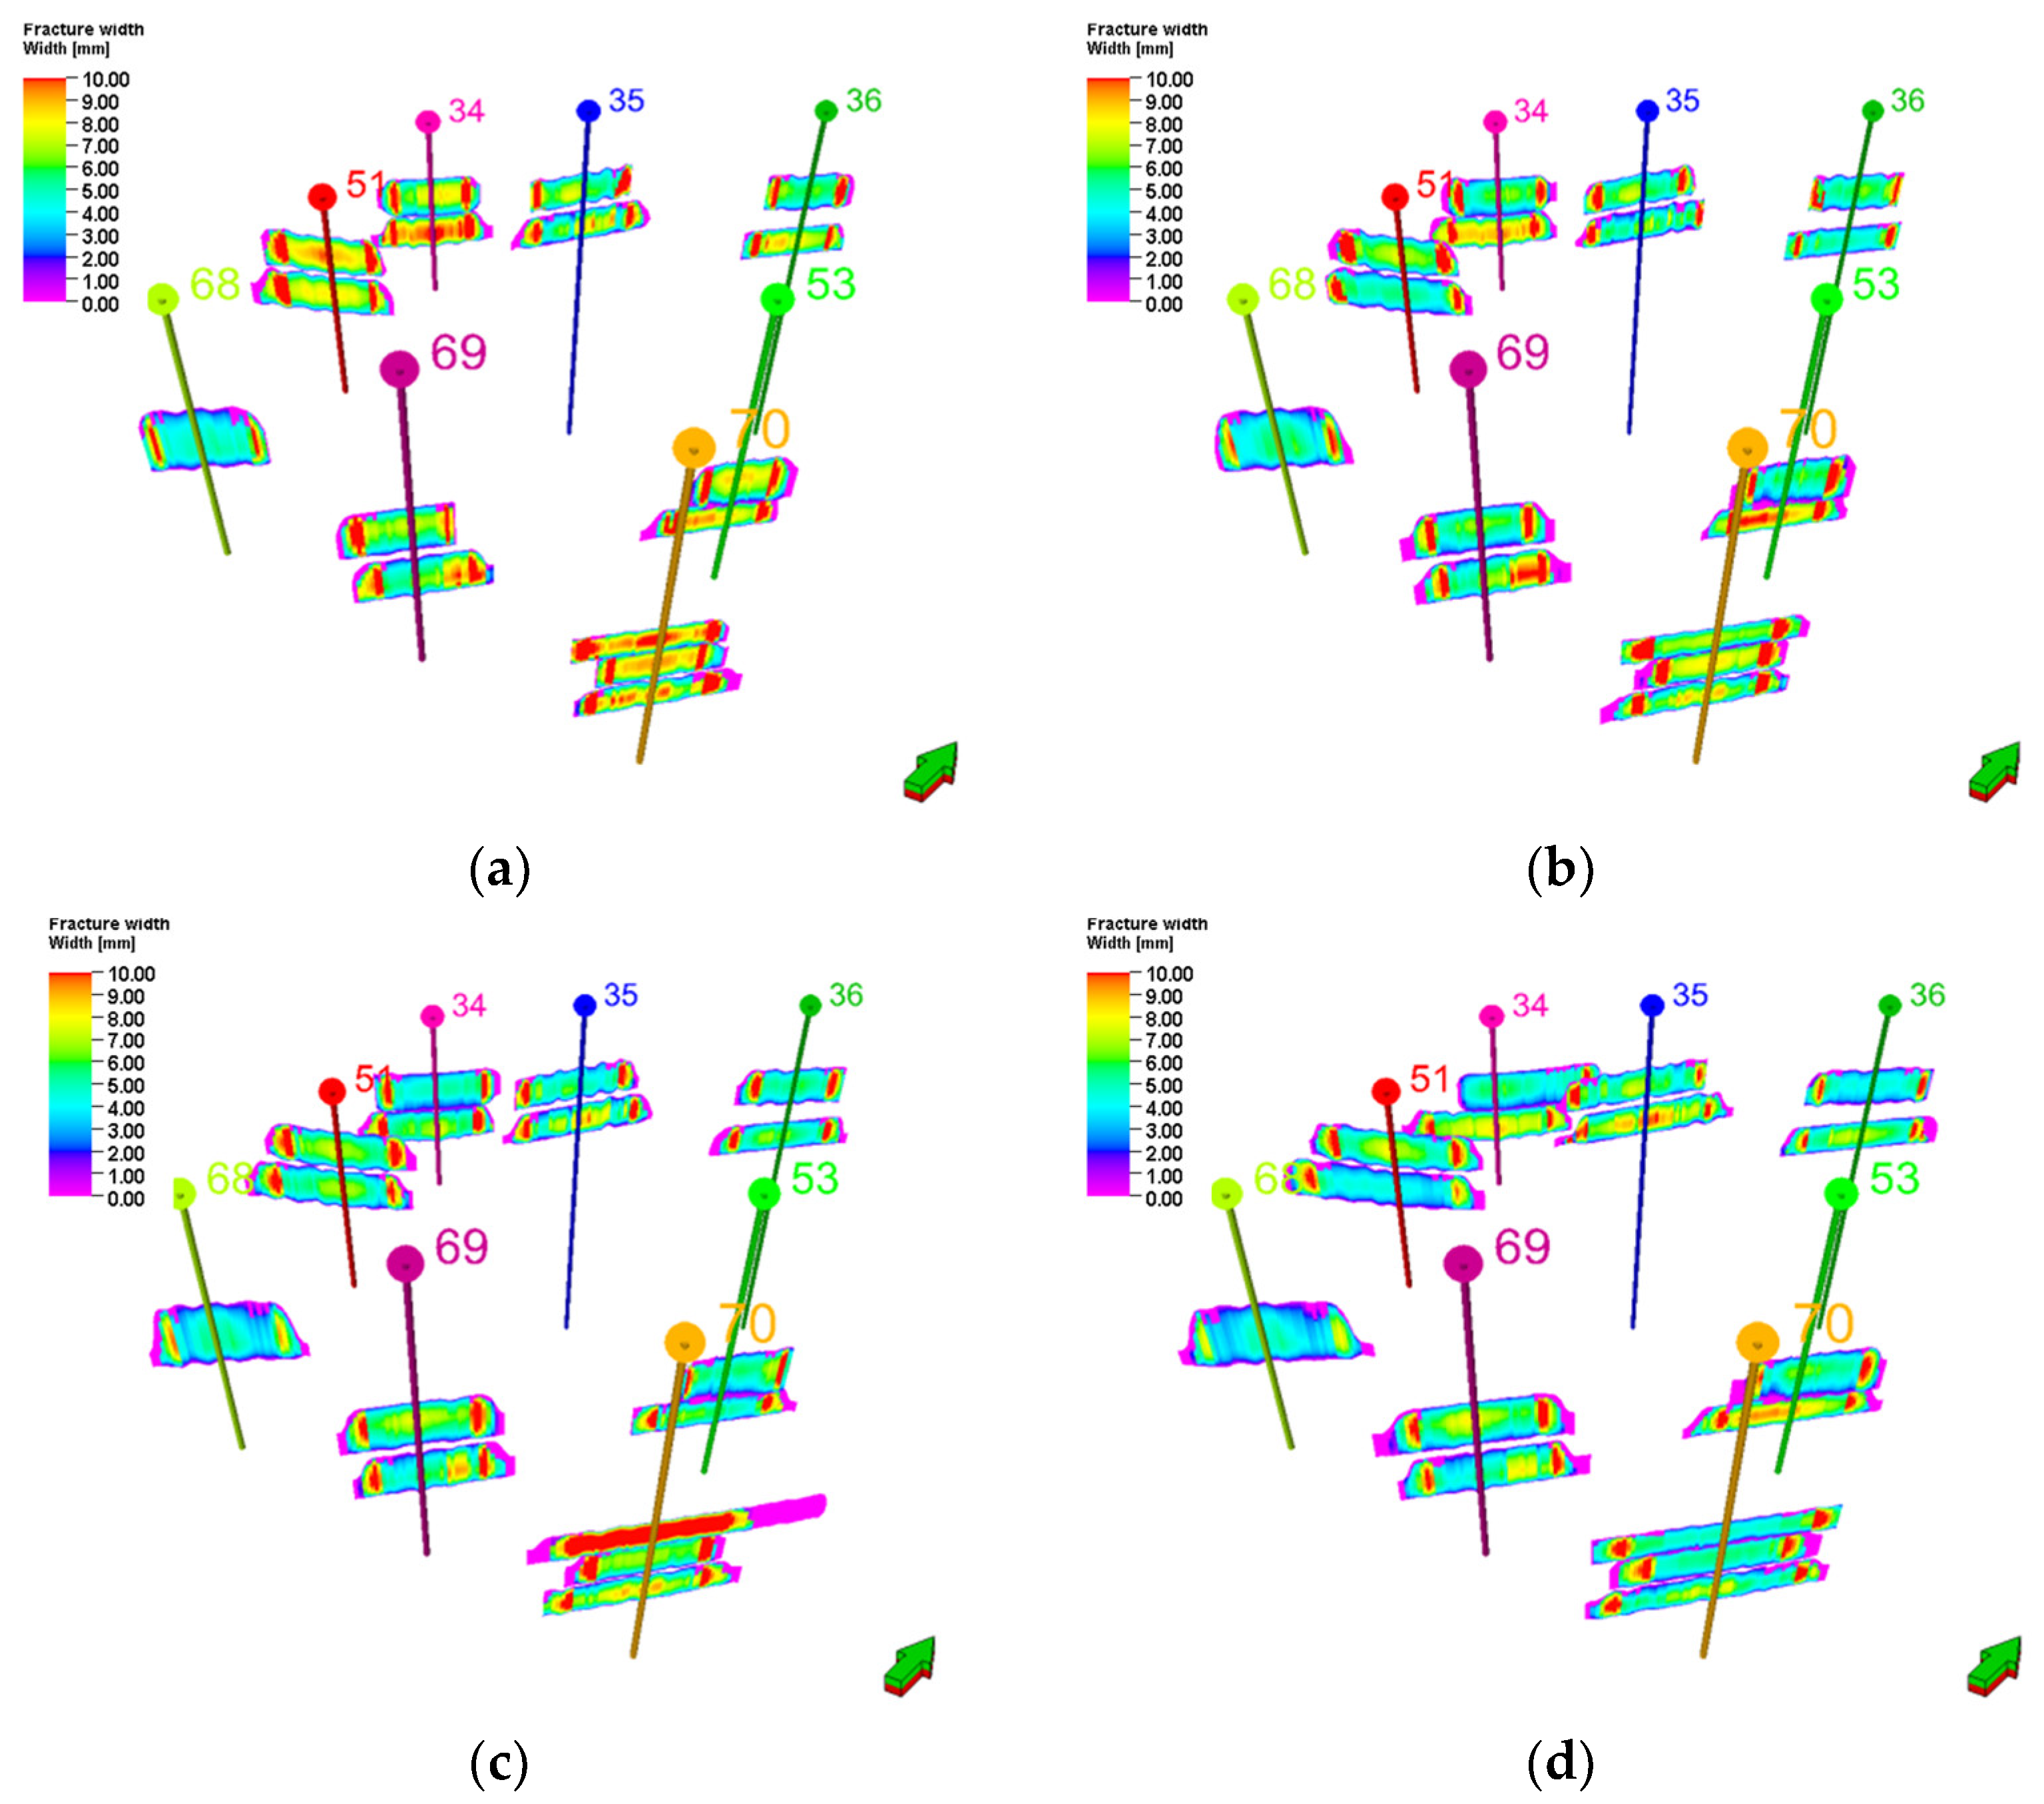
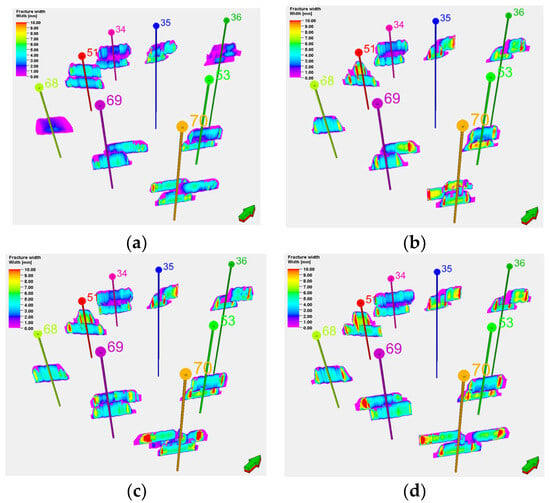
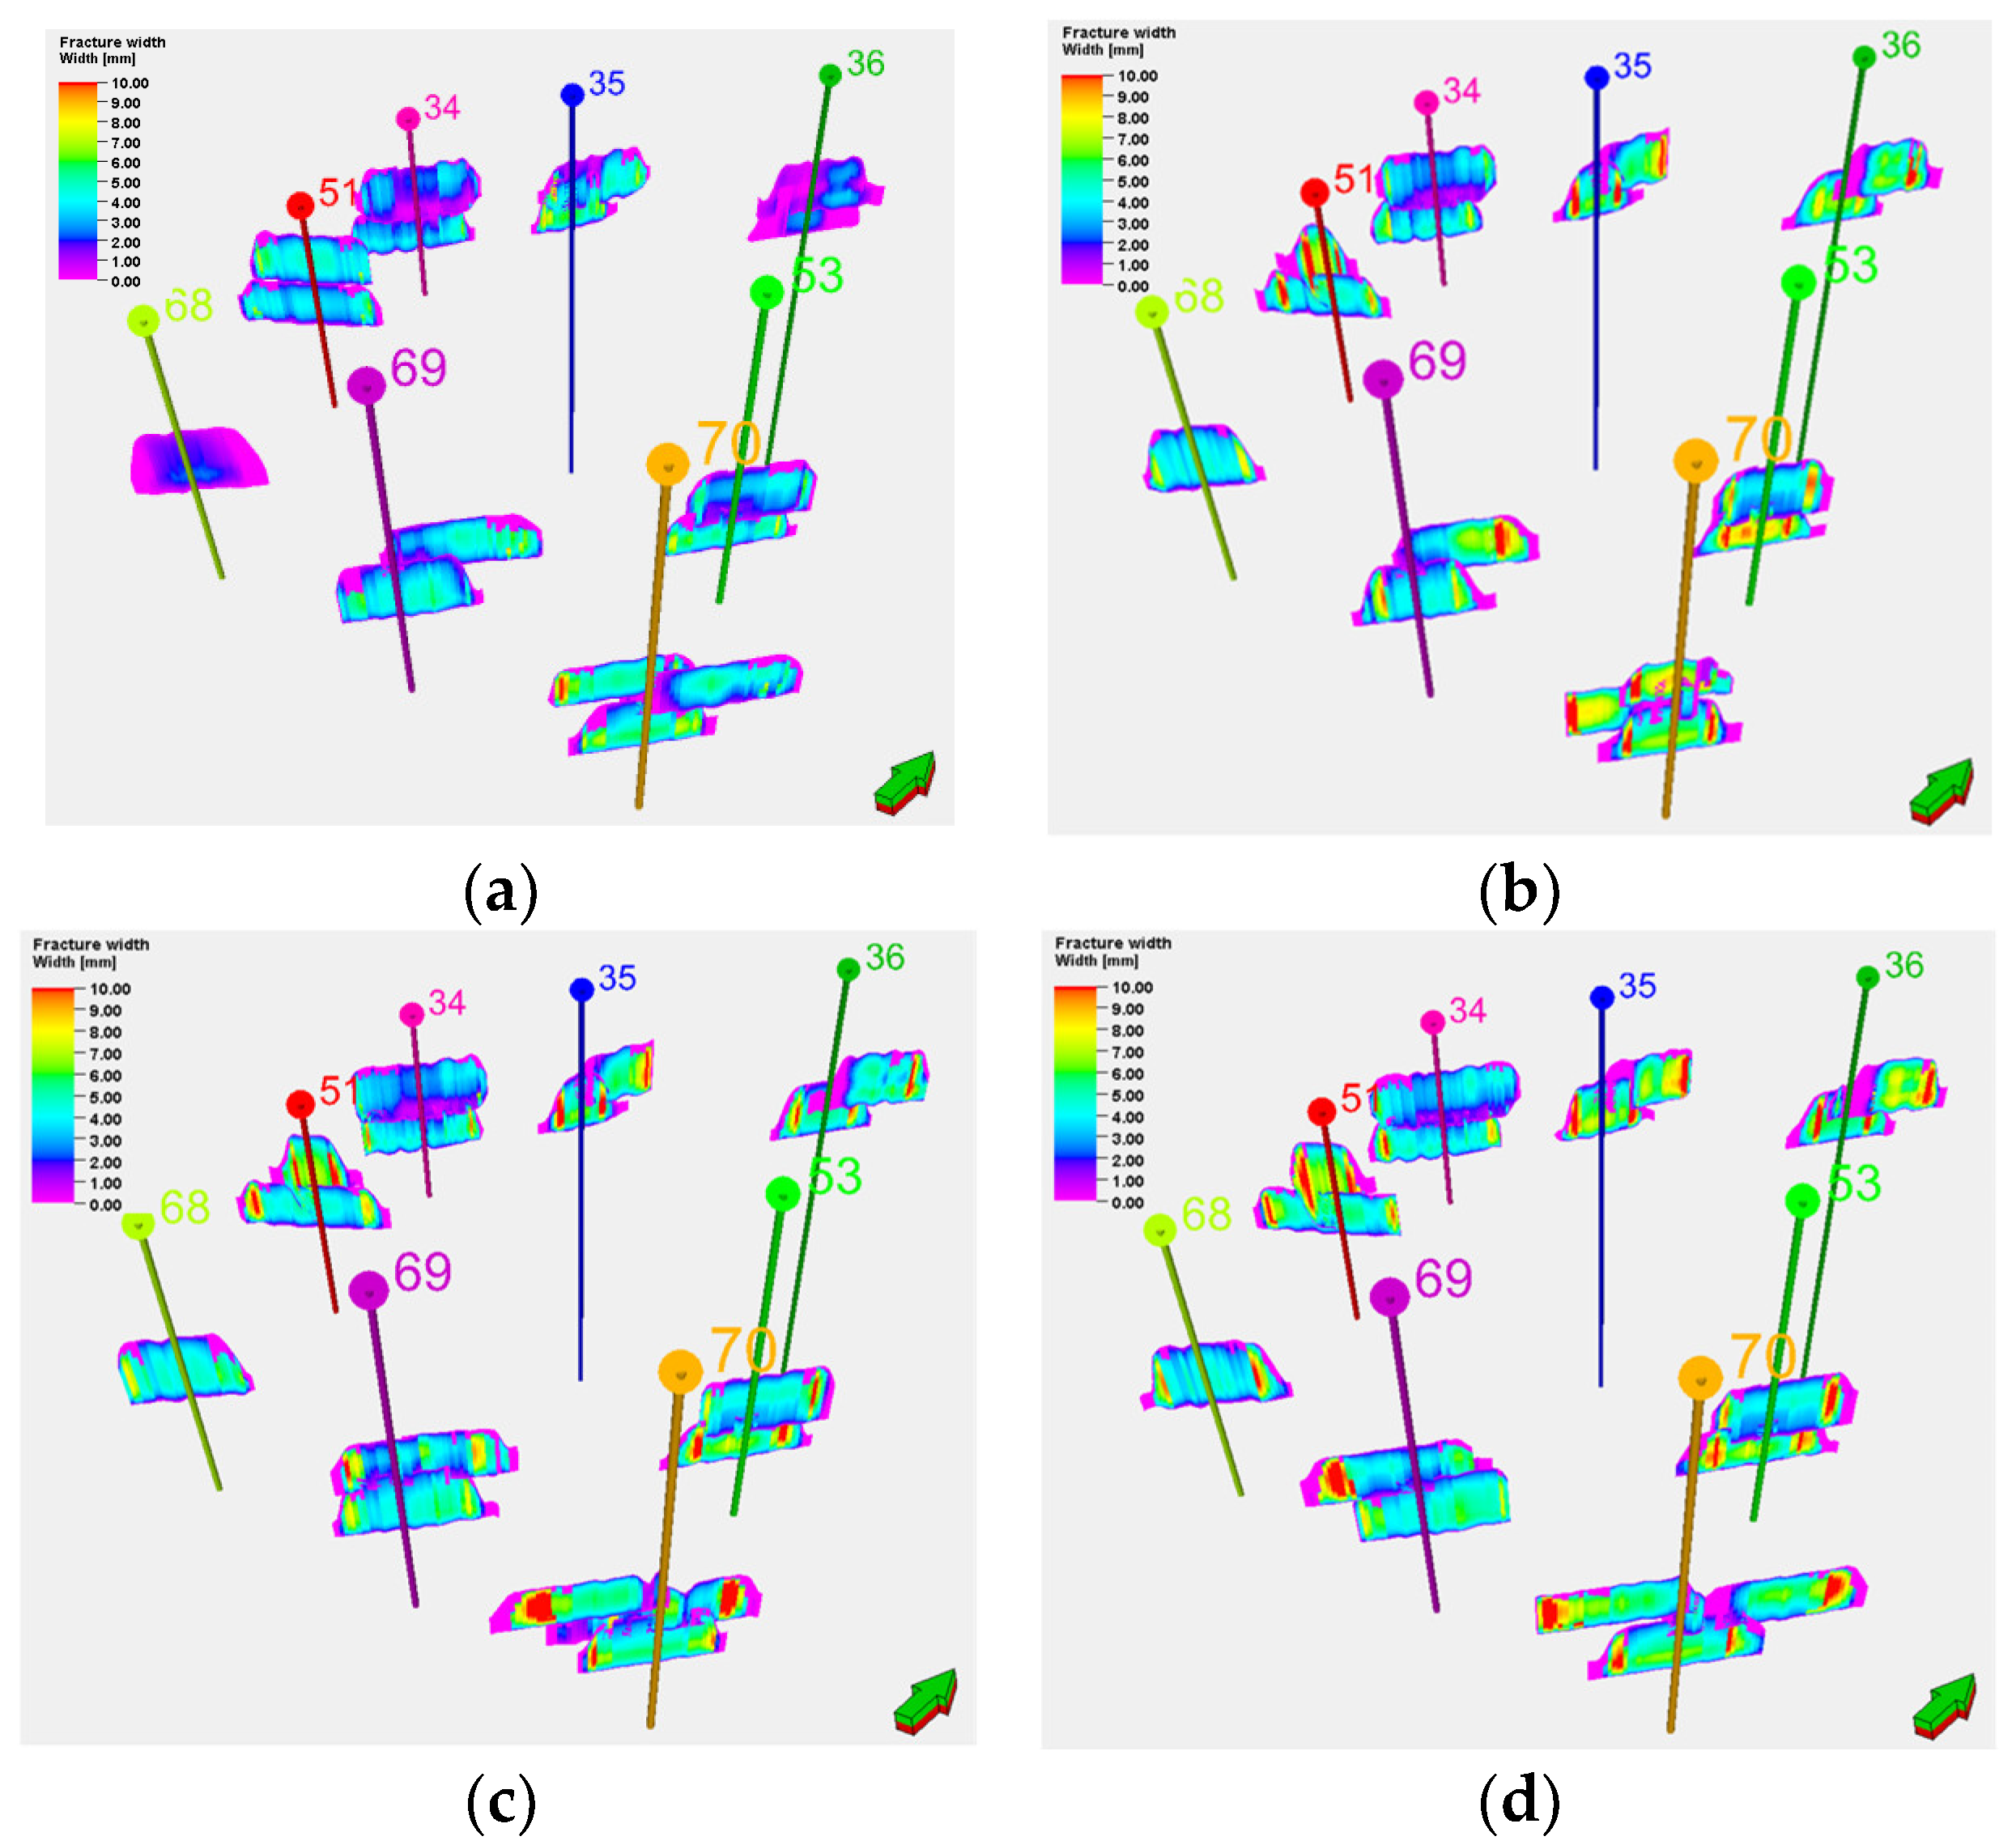
In the newly deployed inverted nine-spot well pattern, the central water injection well (Well 52) was not fractured, while numerical simulations were conducted for the surrounding eight production wells under different injection rates. These simulations were based on the geological model established after long-term injection and production from the older wells, with injection rates set at 3.0 m3/min, 3.5 m3/min, 4.0 m3/min, and 4.5 m3/min, respectively.
The simulation results indicate that as the injection rate increases, the fracture half-length, height, and width all significantly increase. Specifically, the fracture half-length grew from approximately 32 m at 3.0 m3/min to about 53 m at 4.5 m3/min, representing an increase of 65.6%. The average fracture width increased from 3.2 mm to 6.5 mm (Figure 7).
Figure 7.
Fracture patterns of the infilled well group under different fracturing pump rates: (a) 3.0 m3/min; (b) 3.5 m3/min; (c) 4.0 m3/min; (d) 4.5 m3/min.
Considering both the fracture geometry and production requirements, to effectively control the fracture half-length within the range of 40–45 m while ensuring the fracture width is no less than 5.0 mm, it is recommended to set the injection rate within the range of 3.5 to 4.0 m3/min.
6.1.2. The Effect of Water Flooding in the Infilled Well Group
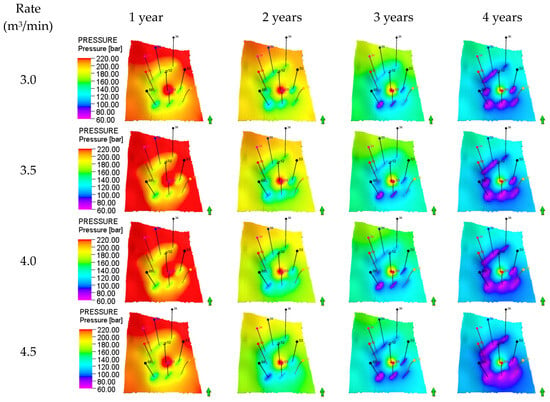
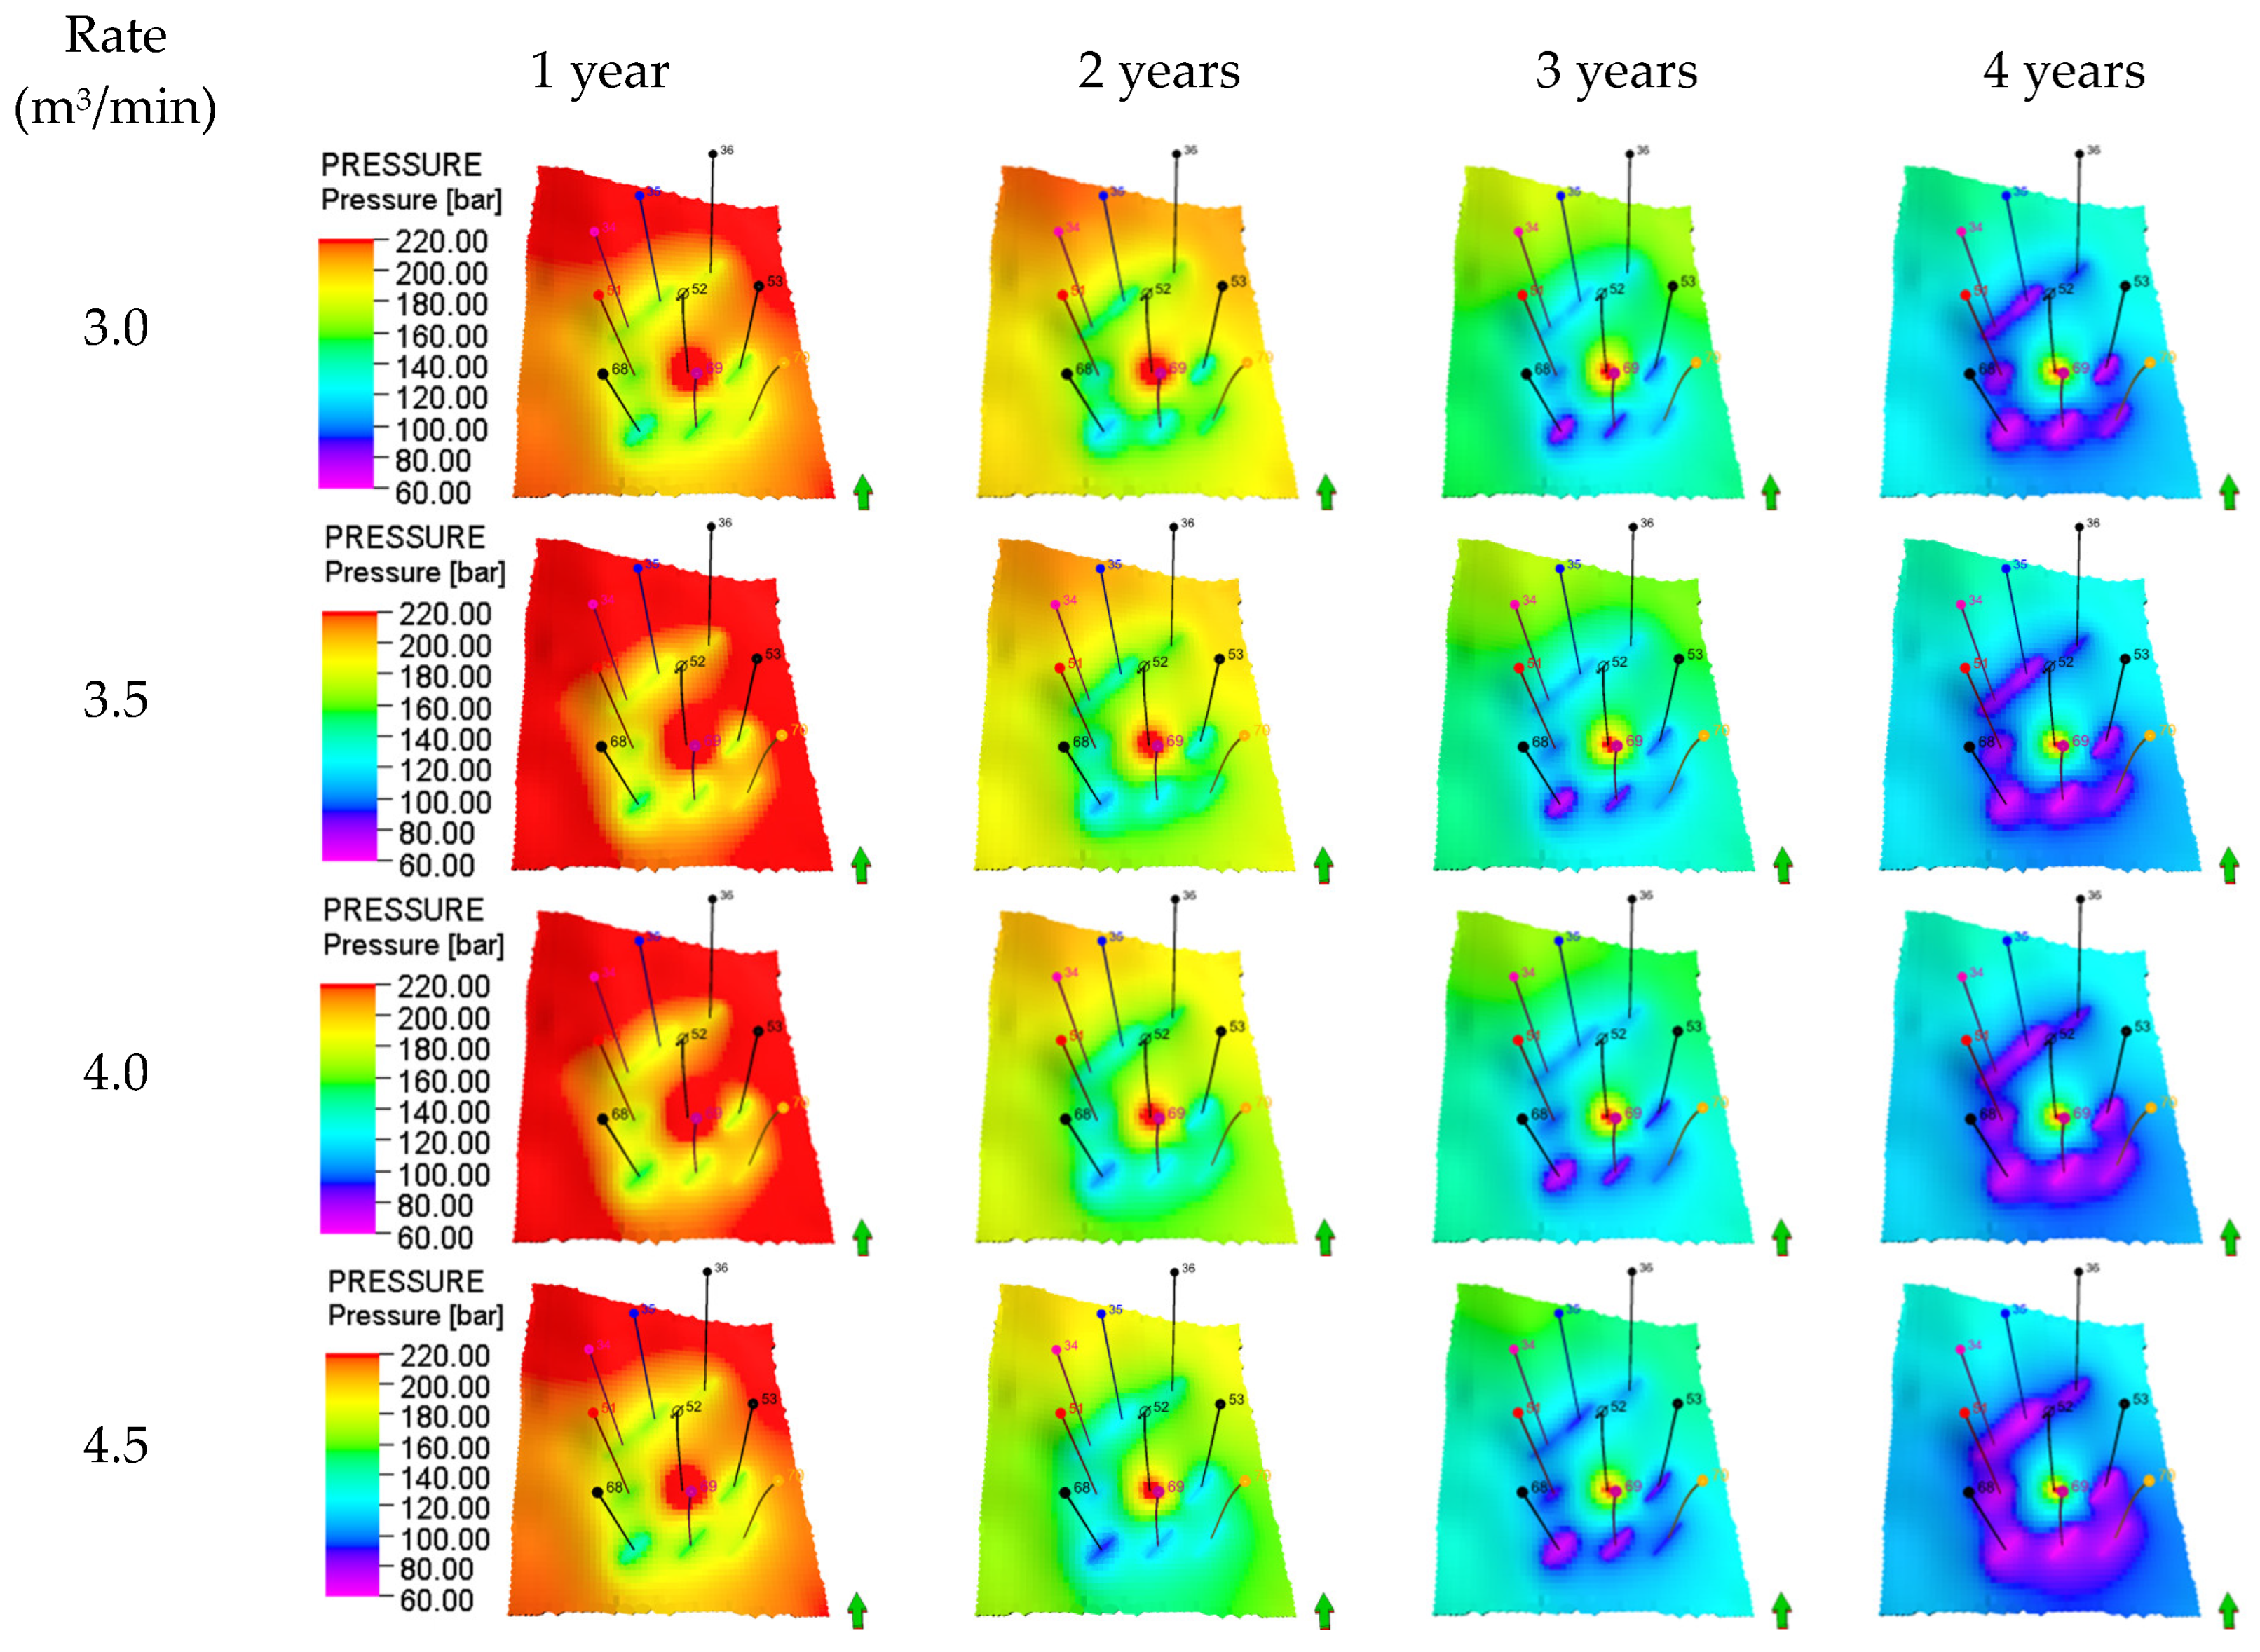
Figure 8 illustrates the evolution characteristics of the reservoir pressure field under different fracturing injection rates and waterflooding time periods. The pressure cloud maps clearly show that as waterflooding time increases, the red high-pressure zone gradually advances towards the production wells, indicating effective oil displacement by the injected water and an overall good pressure maintenance level. A pressure funnel remains evident near the wellbore, reflecting the strong heterogeneity of the reservoir. However, the risk of early water breakthrough increases under higher injection rates (≥4.0 m3/min).
Figure 8.
Formation pressure variation during water flooding under different fracturing pump rates.
High-rate fracturing can create fractures with half-lengths greater than 45 m and widths exceeding 7 mm. However, superposition analysis with the waterflooding-induced pressure field reveals that these high-rate fractures are prone to connecting with high-permeability streaks, which can lead to rapid water channeling and inter-well interference. Specifically, at an injection rate of 4.5 m3/min, the pressure systems of Well 34 and Well 35 interact, creating interference.
Therefore, it is recommended to control the fracturing injection rate within the range of 3.5 to 4.0 m3/min.
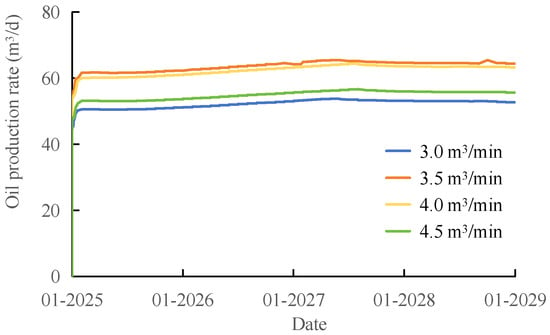
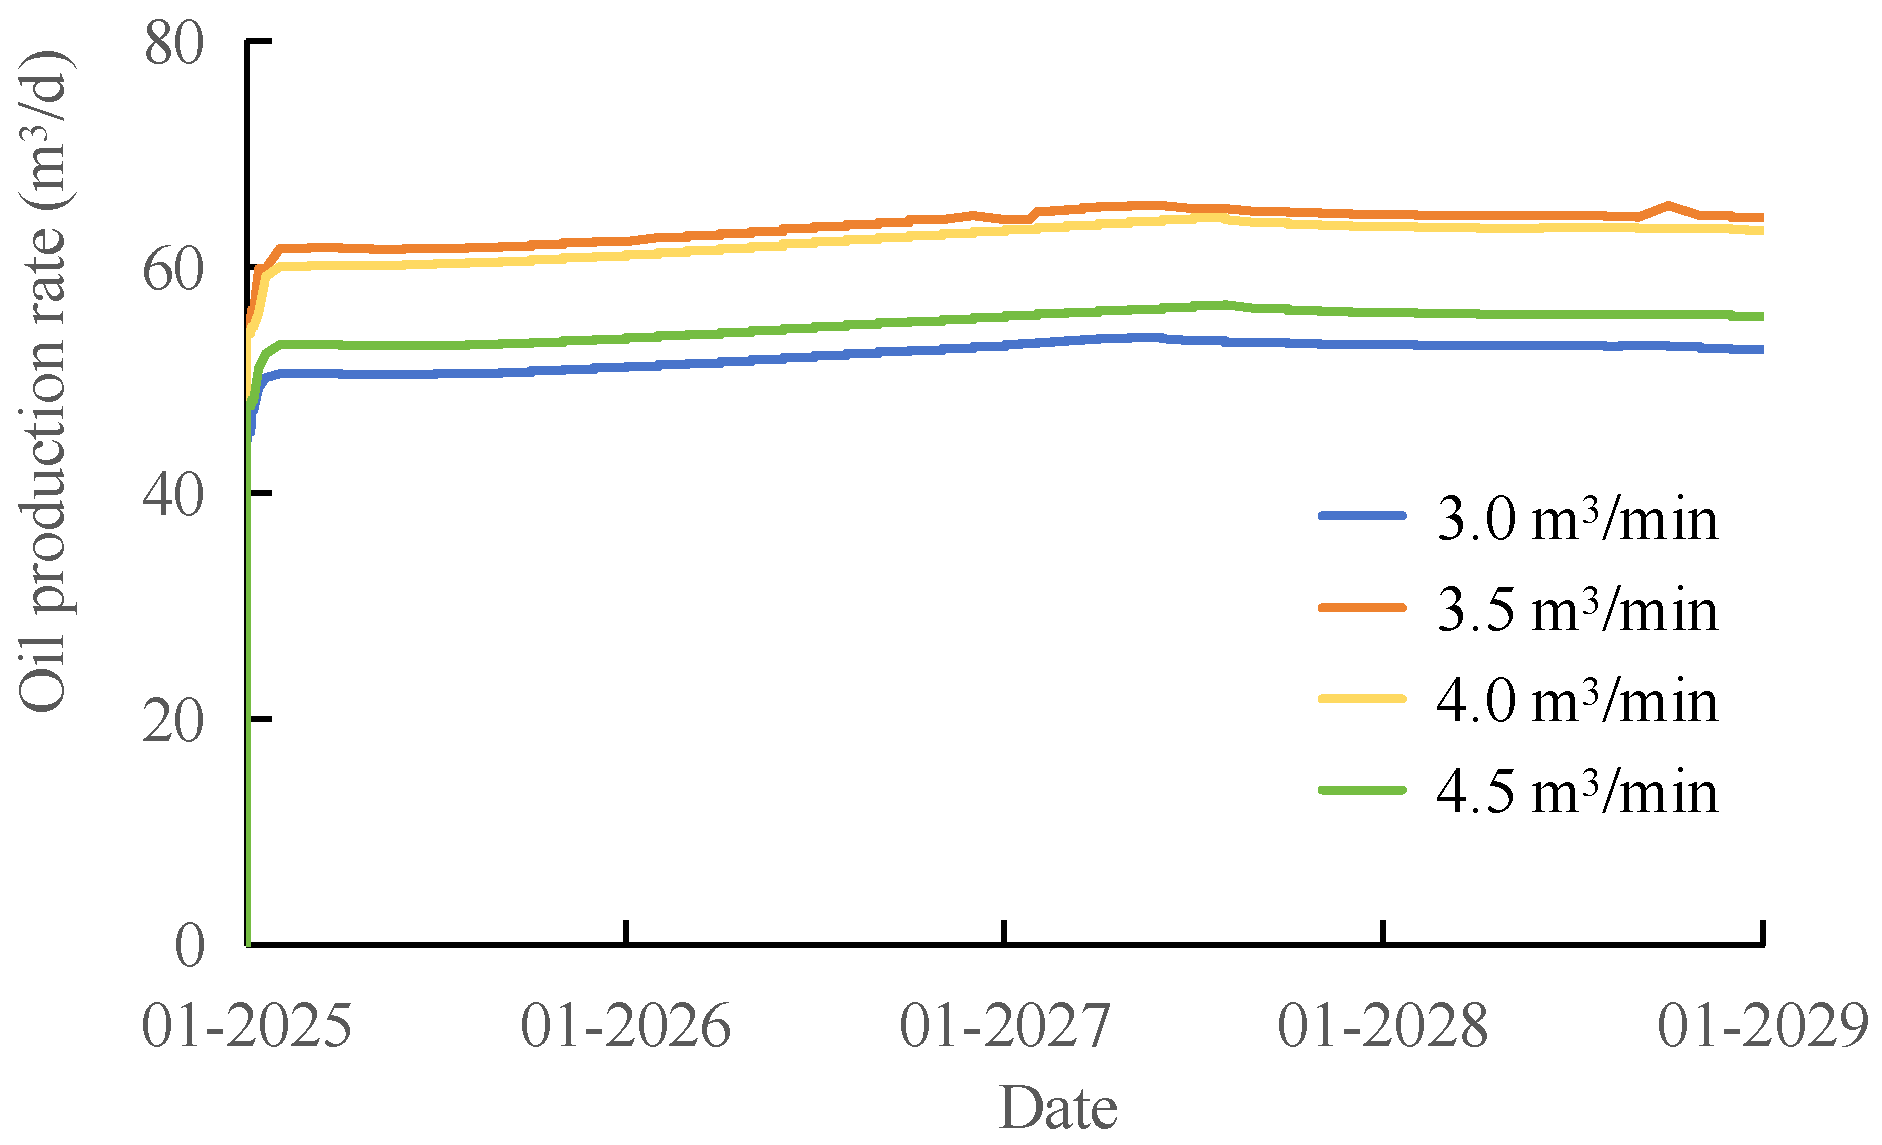
Figure 9 illustrates the dynamic production performance of the infill well group under different fracturing injection rates. Simulation results indicate that as the injection rate increases from 3.0 m3/min to 4.5 m3/min, oil production initially increases and then decreases. The highest oil production is achieved at an injection rate of 3.5 m3/min, accompanied by a significant production increase. However, when the rate continues to rise to 4.0 m3/min and beyond, the production enhancement effect diminishes, and a decline is even observed. This is attributed to excessive fracture extension, water channeling, and inter-well interference caused by the high injection rates. Therefore, to achieve optimal development benefits, it is recommended to maintain the fracturing injection rate at approximately 3.5 m3/min.
Figure 9.
Production oil curve under different fracturing pump rates.
6.2. Pad Fluid Ratio
6.2.1. Fracture Morphology Analysis
Figure 10 presents the simulation results of fracture geometry under different pad fluid ratios of 30%, 40%, 50%, and 60%. The results demonstrate that as the pad fluid ratio increases from 30% to 60%, the average fracture half-length increases from approximately 35 m to 58 m, representing a 65.7% increase. Conversely, the average fracture width decreases from 5.2 mm to 3.1 mm, a reduction of 40.4%. The results indicate that under the same fracturing injection conditions, increasing the pad fluid ratio leads to greater fracture length and width, thereby expanding the overall fracture area. Simultaneously, this causes the relative proportion of slurry carrying proppant to decrease, resulting in a lower proppant concentration per unit area, which weakens the support effect on the fracture walls. As a result, the final fracture width is somewhat reduced.
Figure 10.
Fracture morphology of the infilled well group under different pad fluid ratios: (a) 30%; (b) 40%; (c) 50%; (d) 60%.
For high-permeability formations, shorter and wider fractures are more favorable as they help avoid excessive fluid loss and enhance fracture conductivity. To achieve the optimization objective of controlling the fracture half-length within the 40–45 m range, a pad fluid ratio between 40% and 50% is optimal. Within this range, the fracture width can be maintained between 5.2 mm and 6.4 mm, ensuring effective conductivity while controlling vertical fracture growth.
6.2.2. The Effect of Water Flooding in the Infilled Well Group
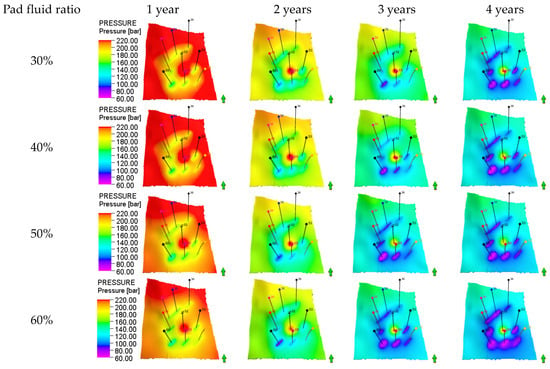
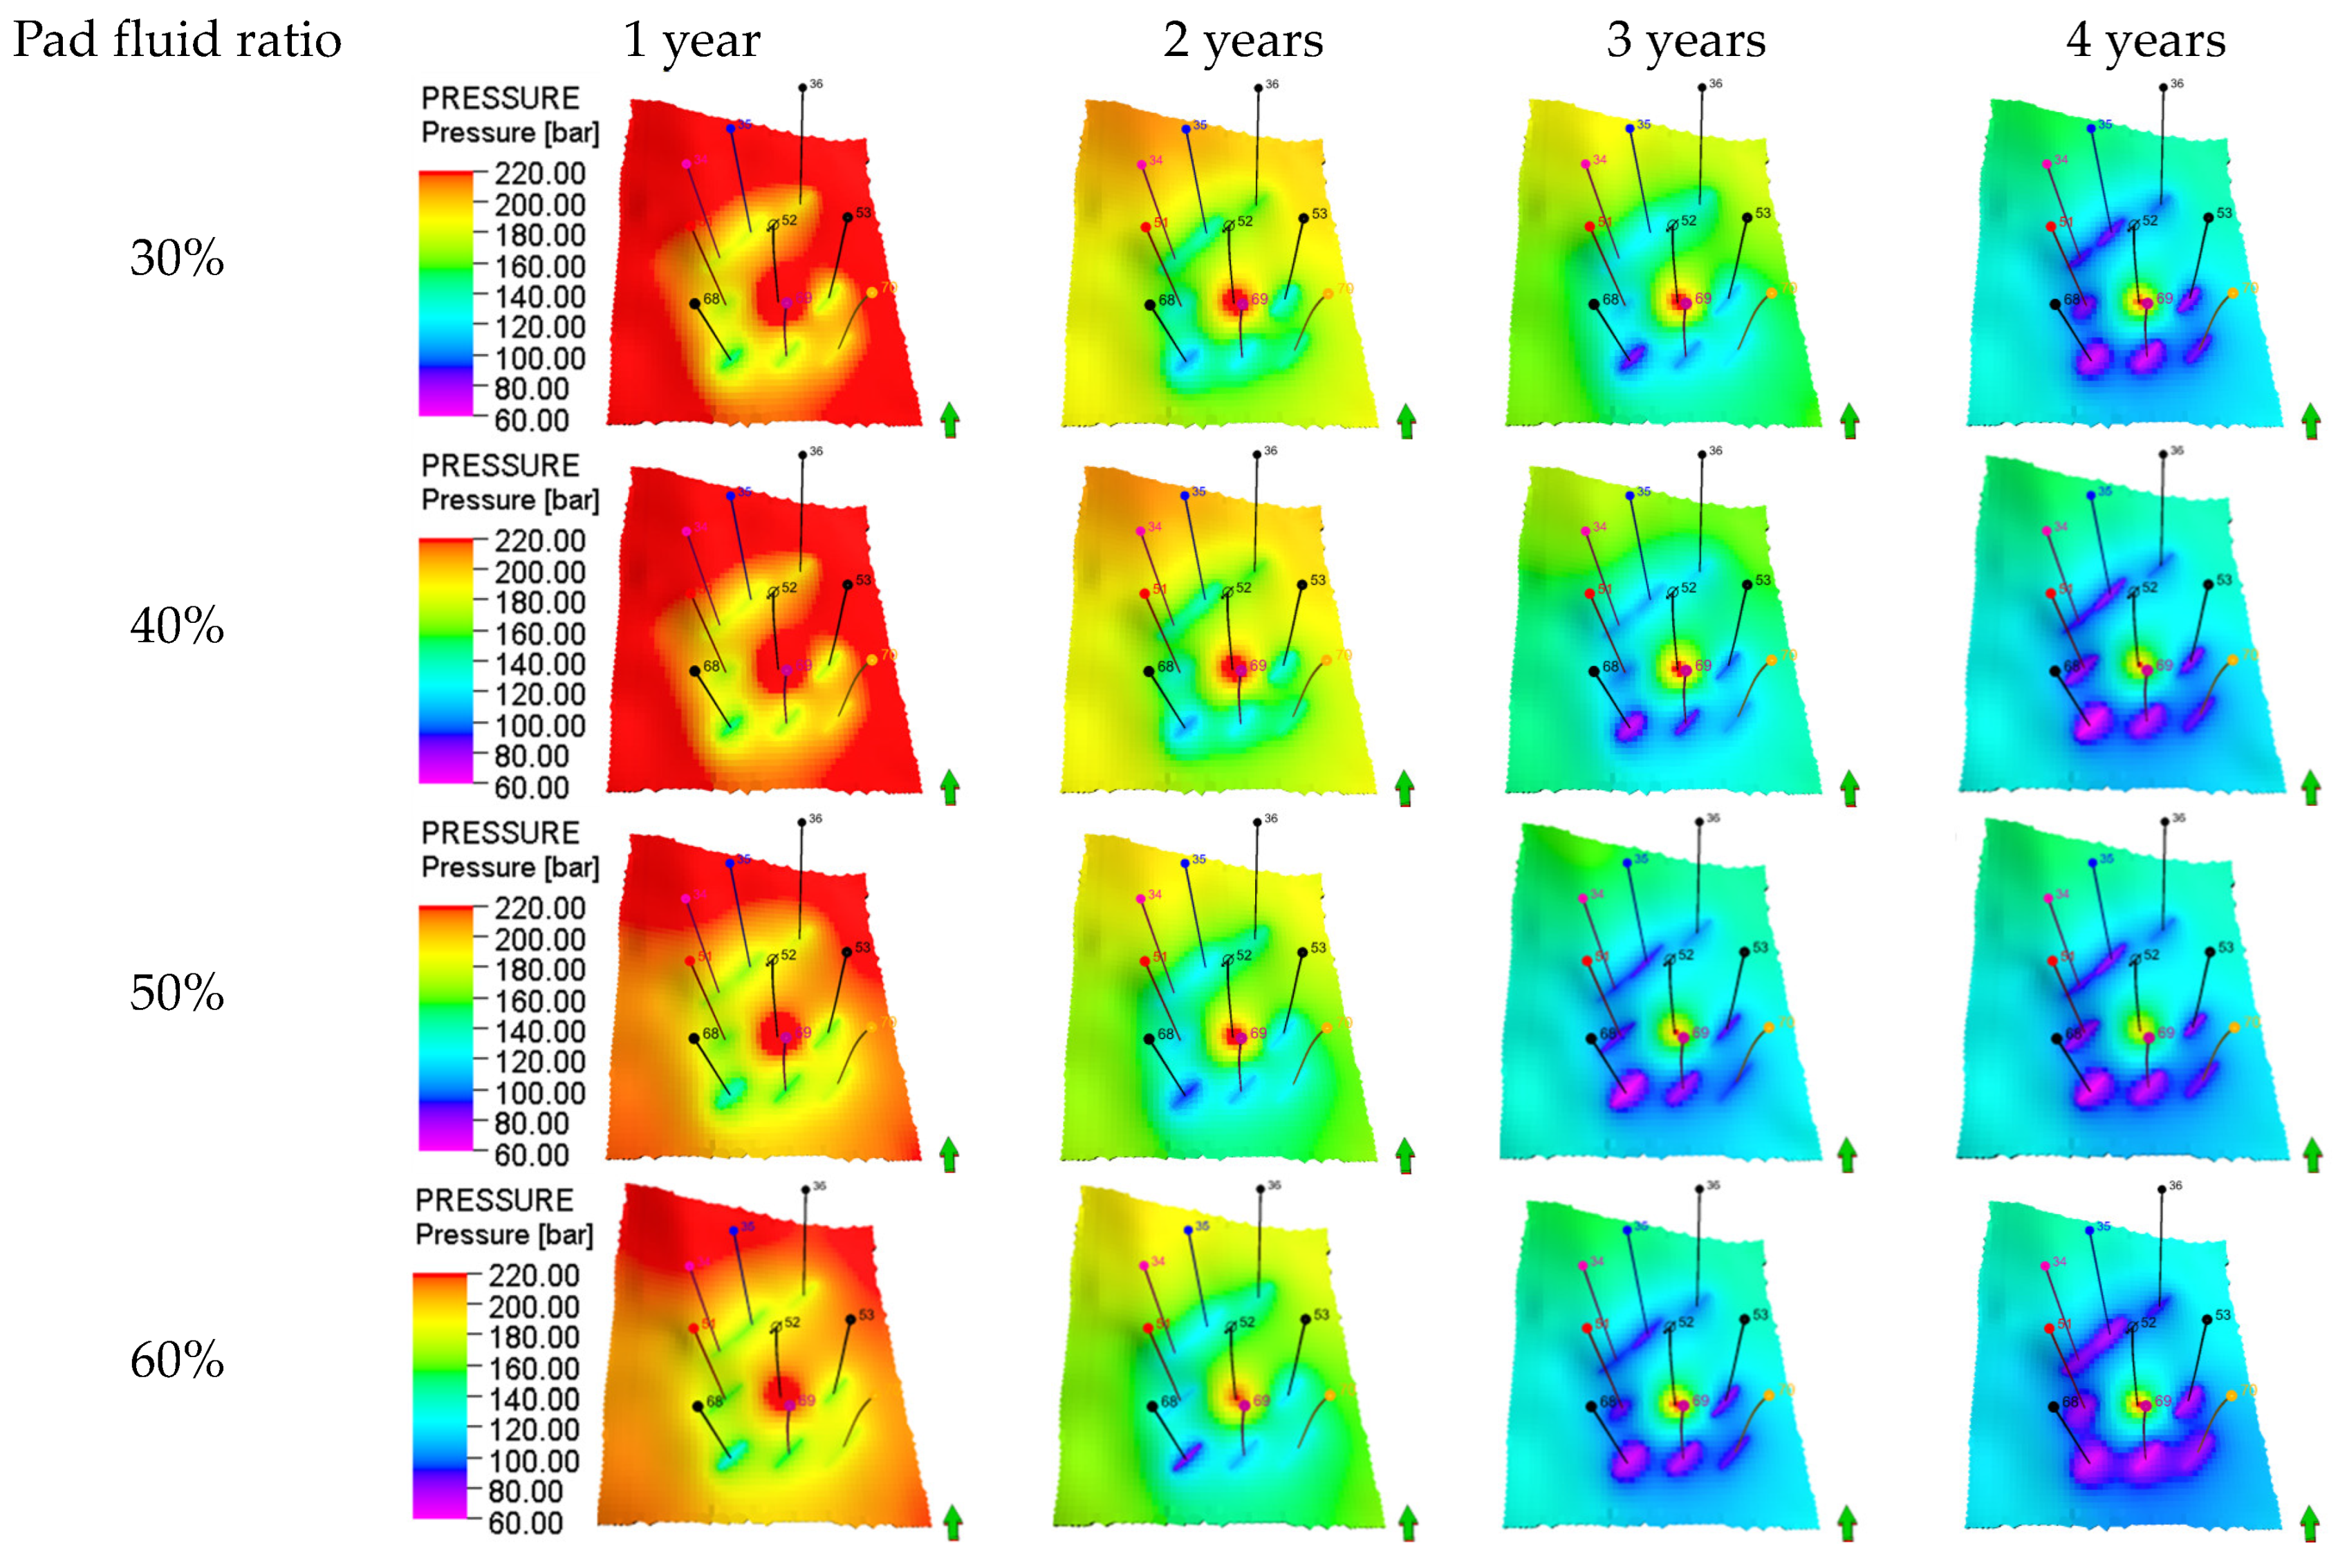
Figure 11 reveals the dynamic evolution of the formation pressure field during water flooding under different pad fluid ratios. The pad fluid ratio significantly influences both fracture geometry and conductivity. At a ratio of 50%, the pressure distribution is uniform, facilitating the formation of an effective networked displacement pattern that improves the areal sweep efficiency. Conversely, at a ratio of 60%, excessive fracture length leads to a distortion of the pressure front, which is detrimental to achieving balanced displacement. In summary, maintaining the pad fluid ratio within the range of 40% to 50% is recommended. This range effectively promotes fracture creation while maintaining formation pressure and ensuring stable displacement performance.
Figure 11.
Formation pressure variation during water flooding under different pad fluid rates.
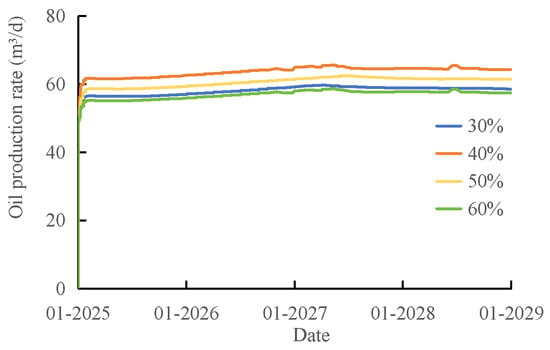
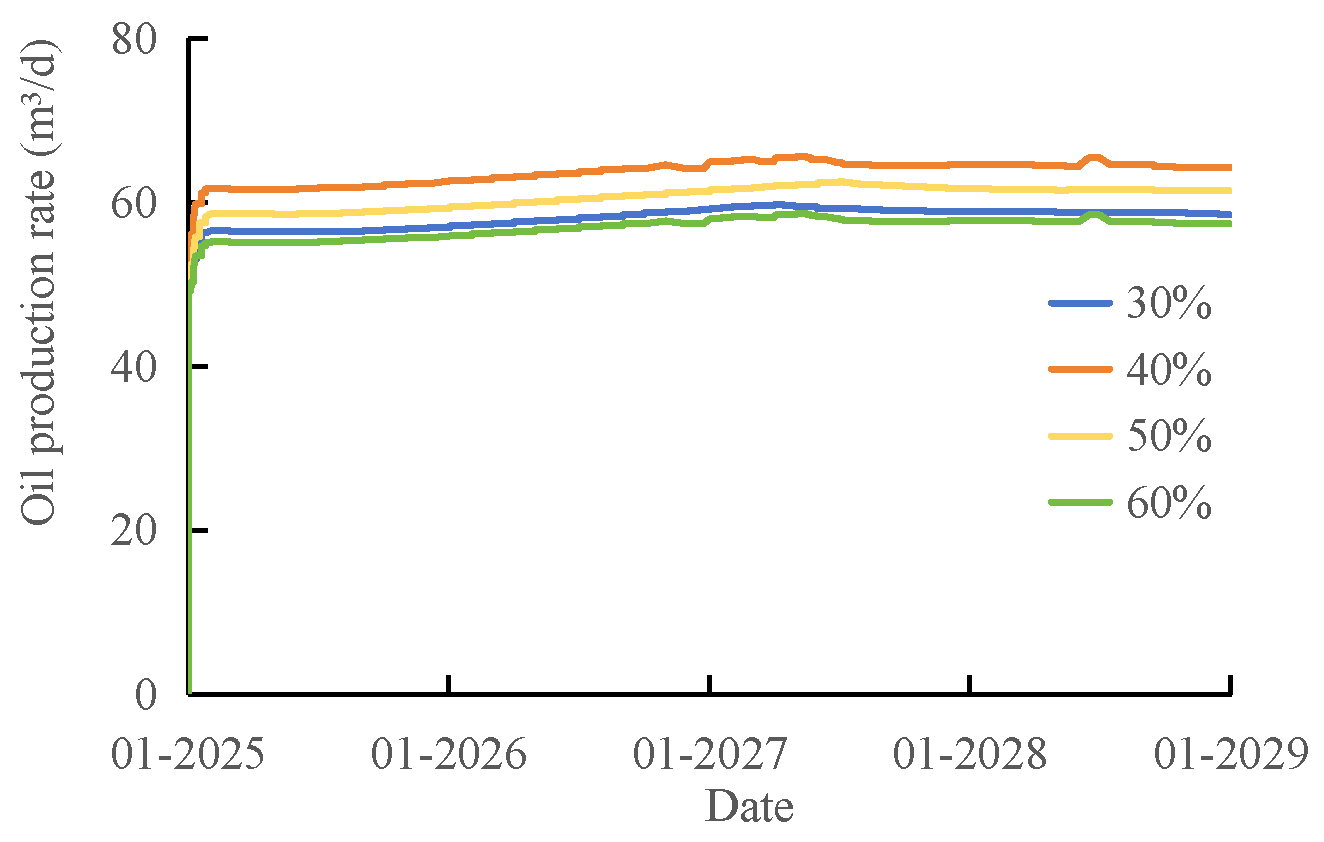
Figure 12 demonstrates the production performance of the infill well group under different pad fluid ratios. Simulation results indicate that the 40% ratio yields the consistently highest oil production with the most stable production profile, suggesting an optimal balance between fracture conductivity and sweep volume. The 30% ratio results in lower production due to insufficient stimulation coverage, while the 60% ratio causes production decline because of water channeling and well interference induced by excessive fracture length. This comprehensive analysis confirms that maintaining the pad fluid ratio at approximately 40% maximizes fracturing stimulation effectiveness.
Figure 12.
Production oil curve under different pad fluid rates.
6.3. Proppant Intensity
6.3.1. Fracture Morphology Analysis
This study developed fracturing models and performed numerical simulations for proppant intensities of 2.0 m3/m, 3.0 m3/m, 4.0 m3/m, and 5.0 m3/m, respectively. The simulation results demonstrate that as the proppant intensity increases from 2.0 m3/m to 5.0 m3/m, the average fracture width expands from approximately 2.5 mm to 6.8 mm, while the fracture half-length increases by approximately 43% (Figure 13). This improvement is primarily due to the enhanced effective proppant support on the fracture walls under higher proppant intensity, which consequently improves fracture conductivity. To optimize both fracture propagation control and conductivity performance, a proppant intensity range of 3.0–4.0 m3/m is recommended.
Figure 13.
Fracture morphology of the infilled well group under different proppant intensities: (a) 2.0 m3/m; (b) 3.0 m3/m; (c) 4.0 m3/m; (d) 5.0 m3/m.
6.3.2. The Effect of Water Flooding in the Infilled Well Group
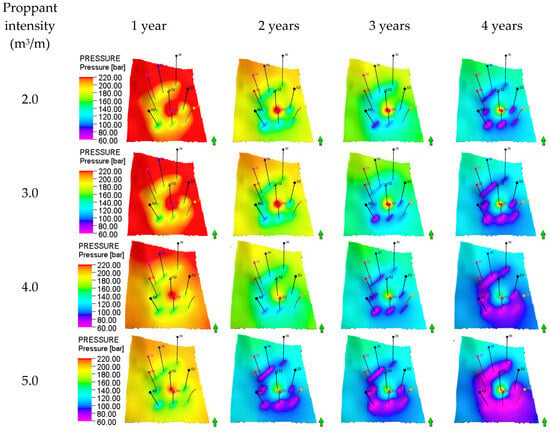
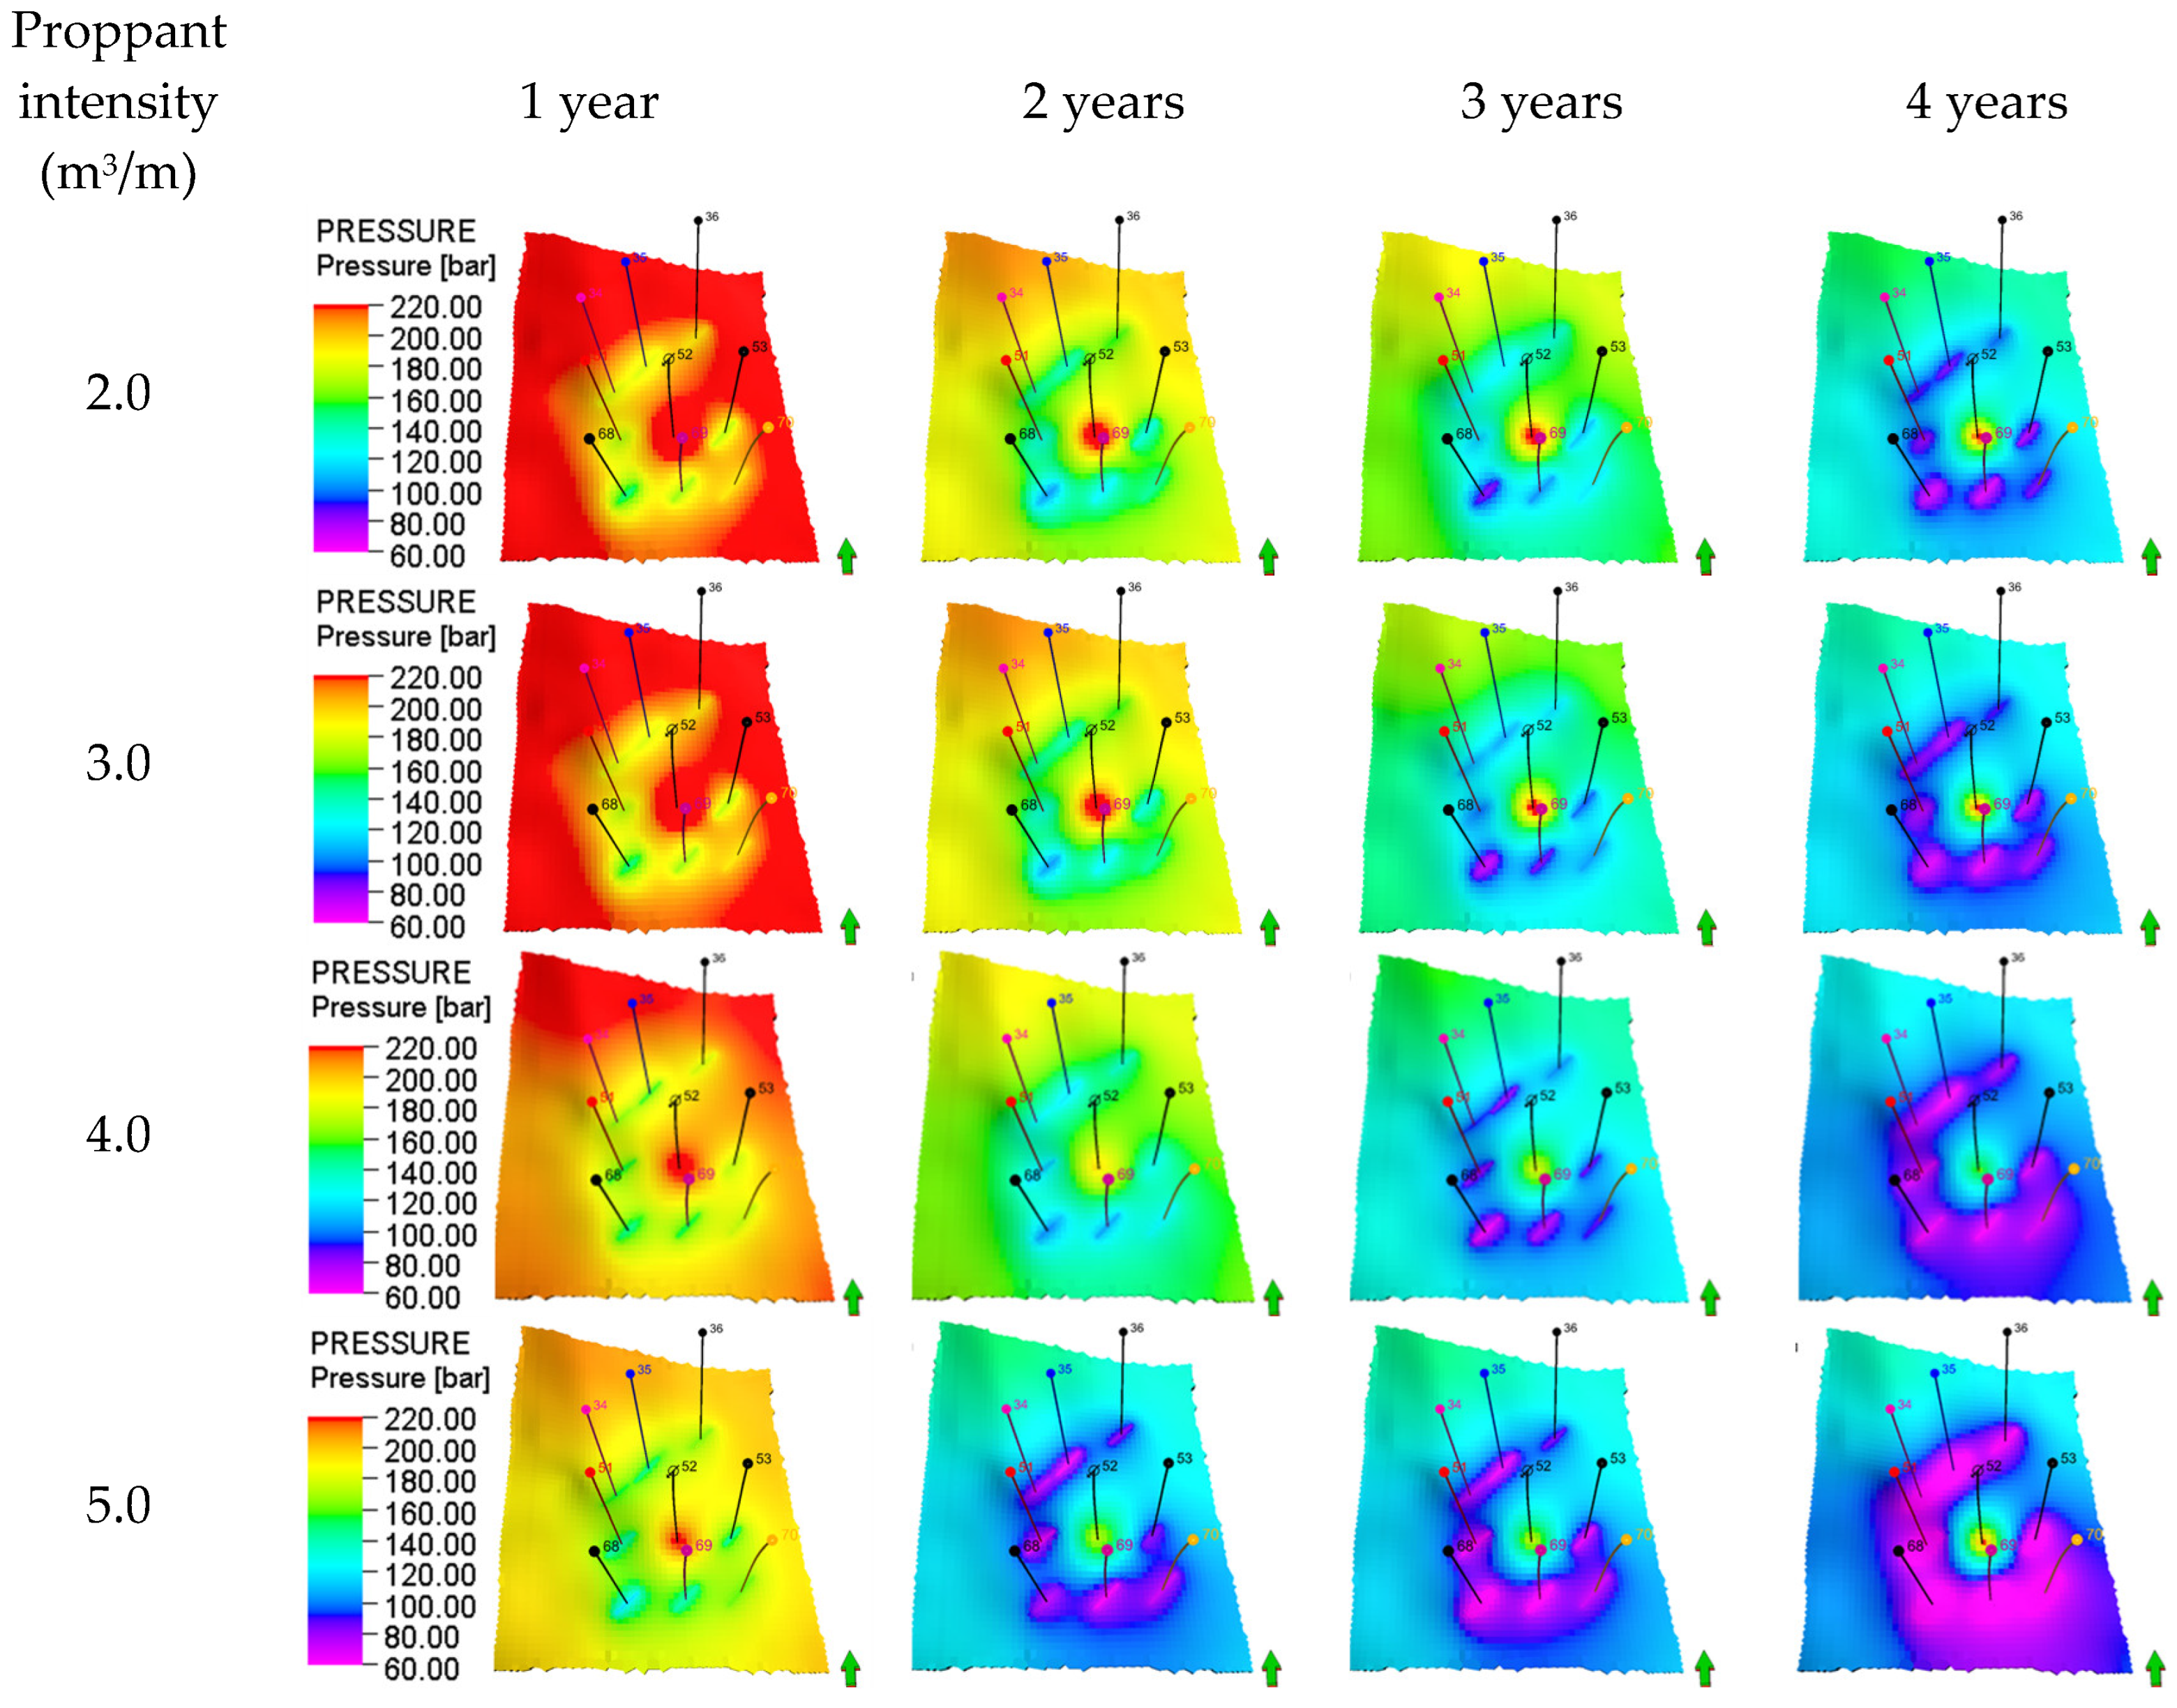
Figure 14 illustrates the evolution of the in situ stress field during waterflooding development under different proppant intensities. Increasing proppant intensity significantly enhances fracture-controlled reservoir capacity, expanding the pressure influence region under the same waterflooding duration. However, at a proppant intensity of 5.0 m3/m, excessive fracture extension and highly conductive fracture networks lead to inter-well interference between Well 34 and Well 35 after three years of waterflooding. The pressure systems of the infill well group intersect, adversely affecting the balanced advancement of the displacement front. In conclusion, to achieve synergistic enhancement between waterflooding and fracturing, it is recommended to maintain the proppant intensity within the range of 3.0–4.0 m3/m.
Figure 14.
Formation pressure variation during water flooding under different proppant intensities.
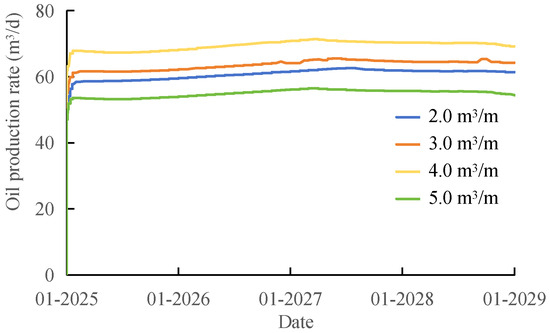
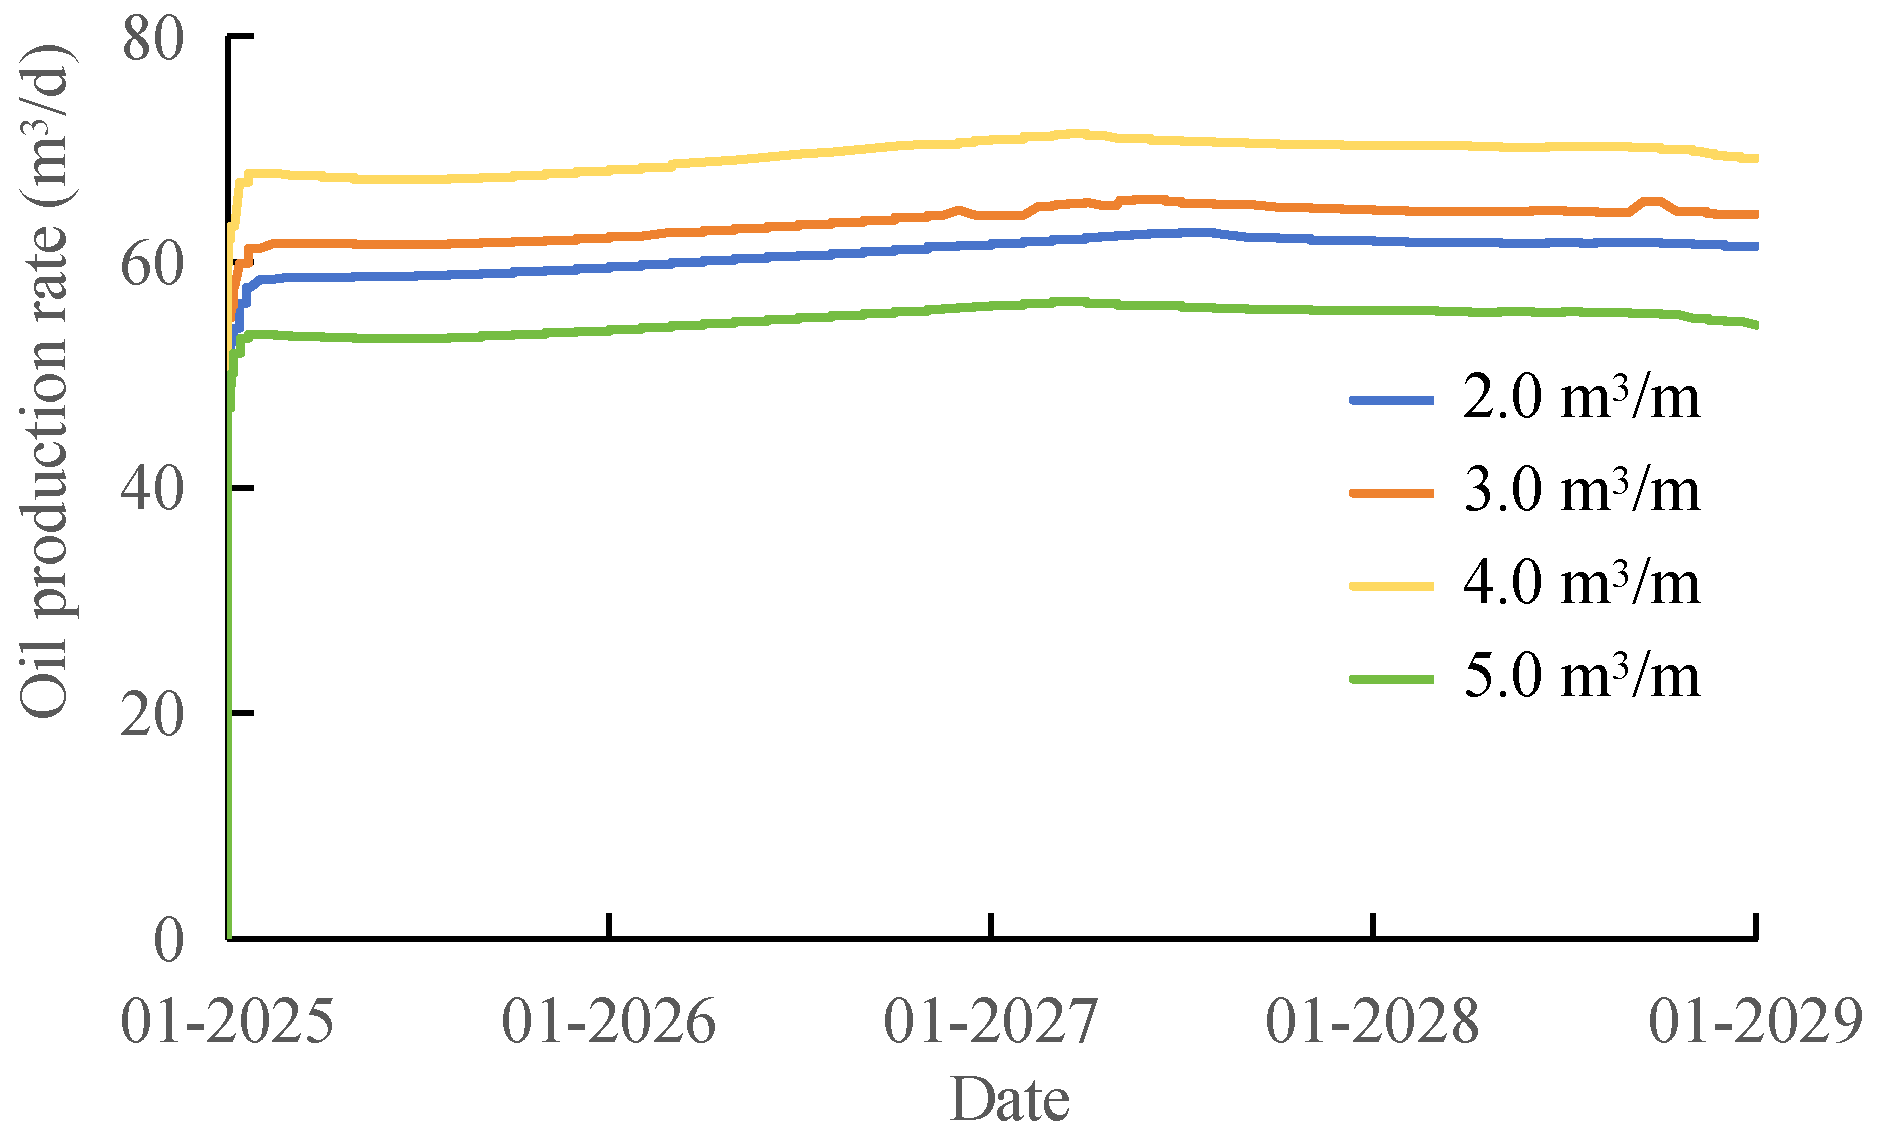
Figure 15 demonstrates the production performance of the infill well group under different proppant intensities. Simulation results indicate that proppant intensity significantly affects initial production rates. At a proppant intensity of 4.0 m3/m, the daily oil production of the infill well group consistently maintained around 68 m3/d and demonstrated the most stable performance. However, at 5.0 m3/m, excessive fracture height growth and highly conductive fracture networks led to water channeling and inter-well interference, resulting in production decline. Under lower proppant intensities of 2.0–3.0 m3/m, oil production remained below 62 m3/d due to limited fracture coverage and conductivity. In summary, maintaining the proppant intensity at 4.0 m3/m achieves an optimal balance between fracture conductivity, fracture network control, and production capacity.
Figure 15.
Production oil curve under different proppant intensities.
6.4. Analysis of Minimum Horizontal Principal Stress Evolution
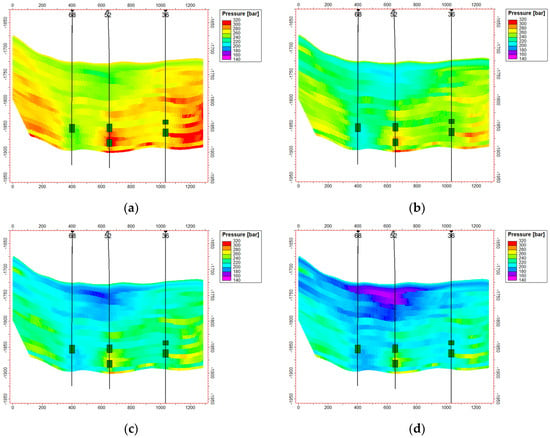
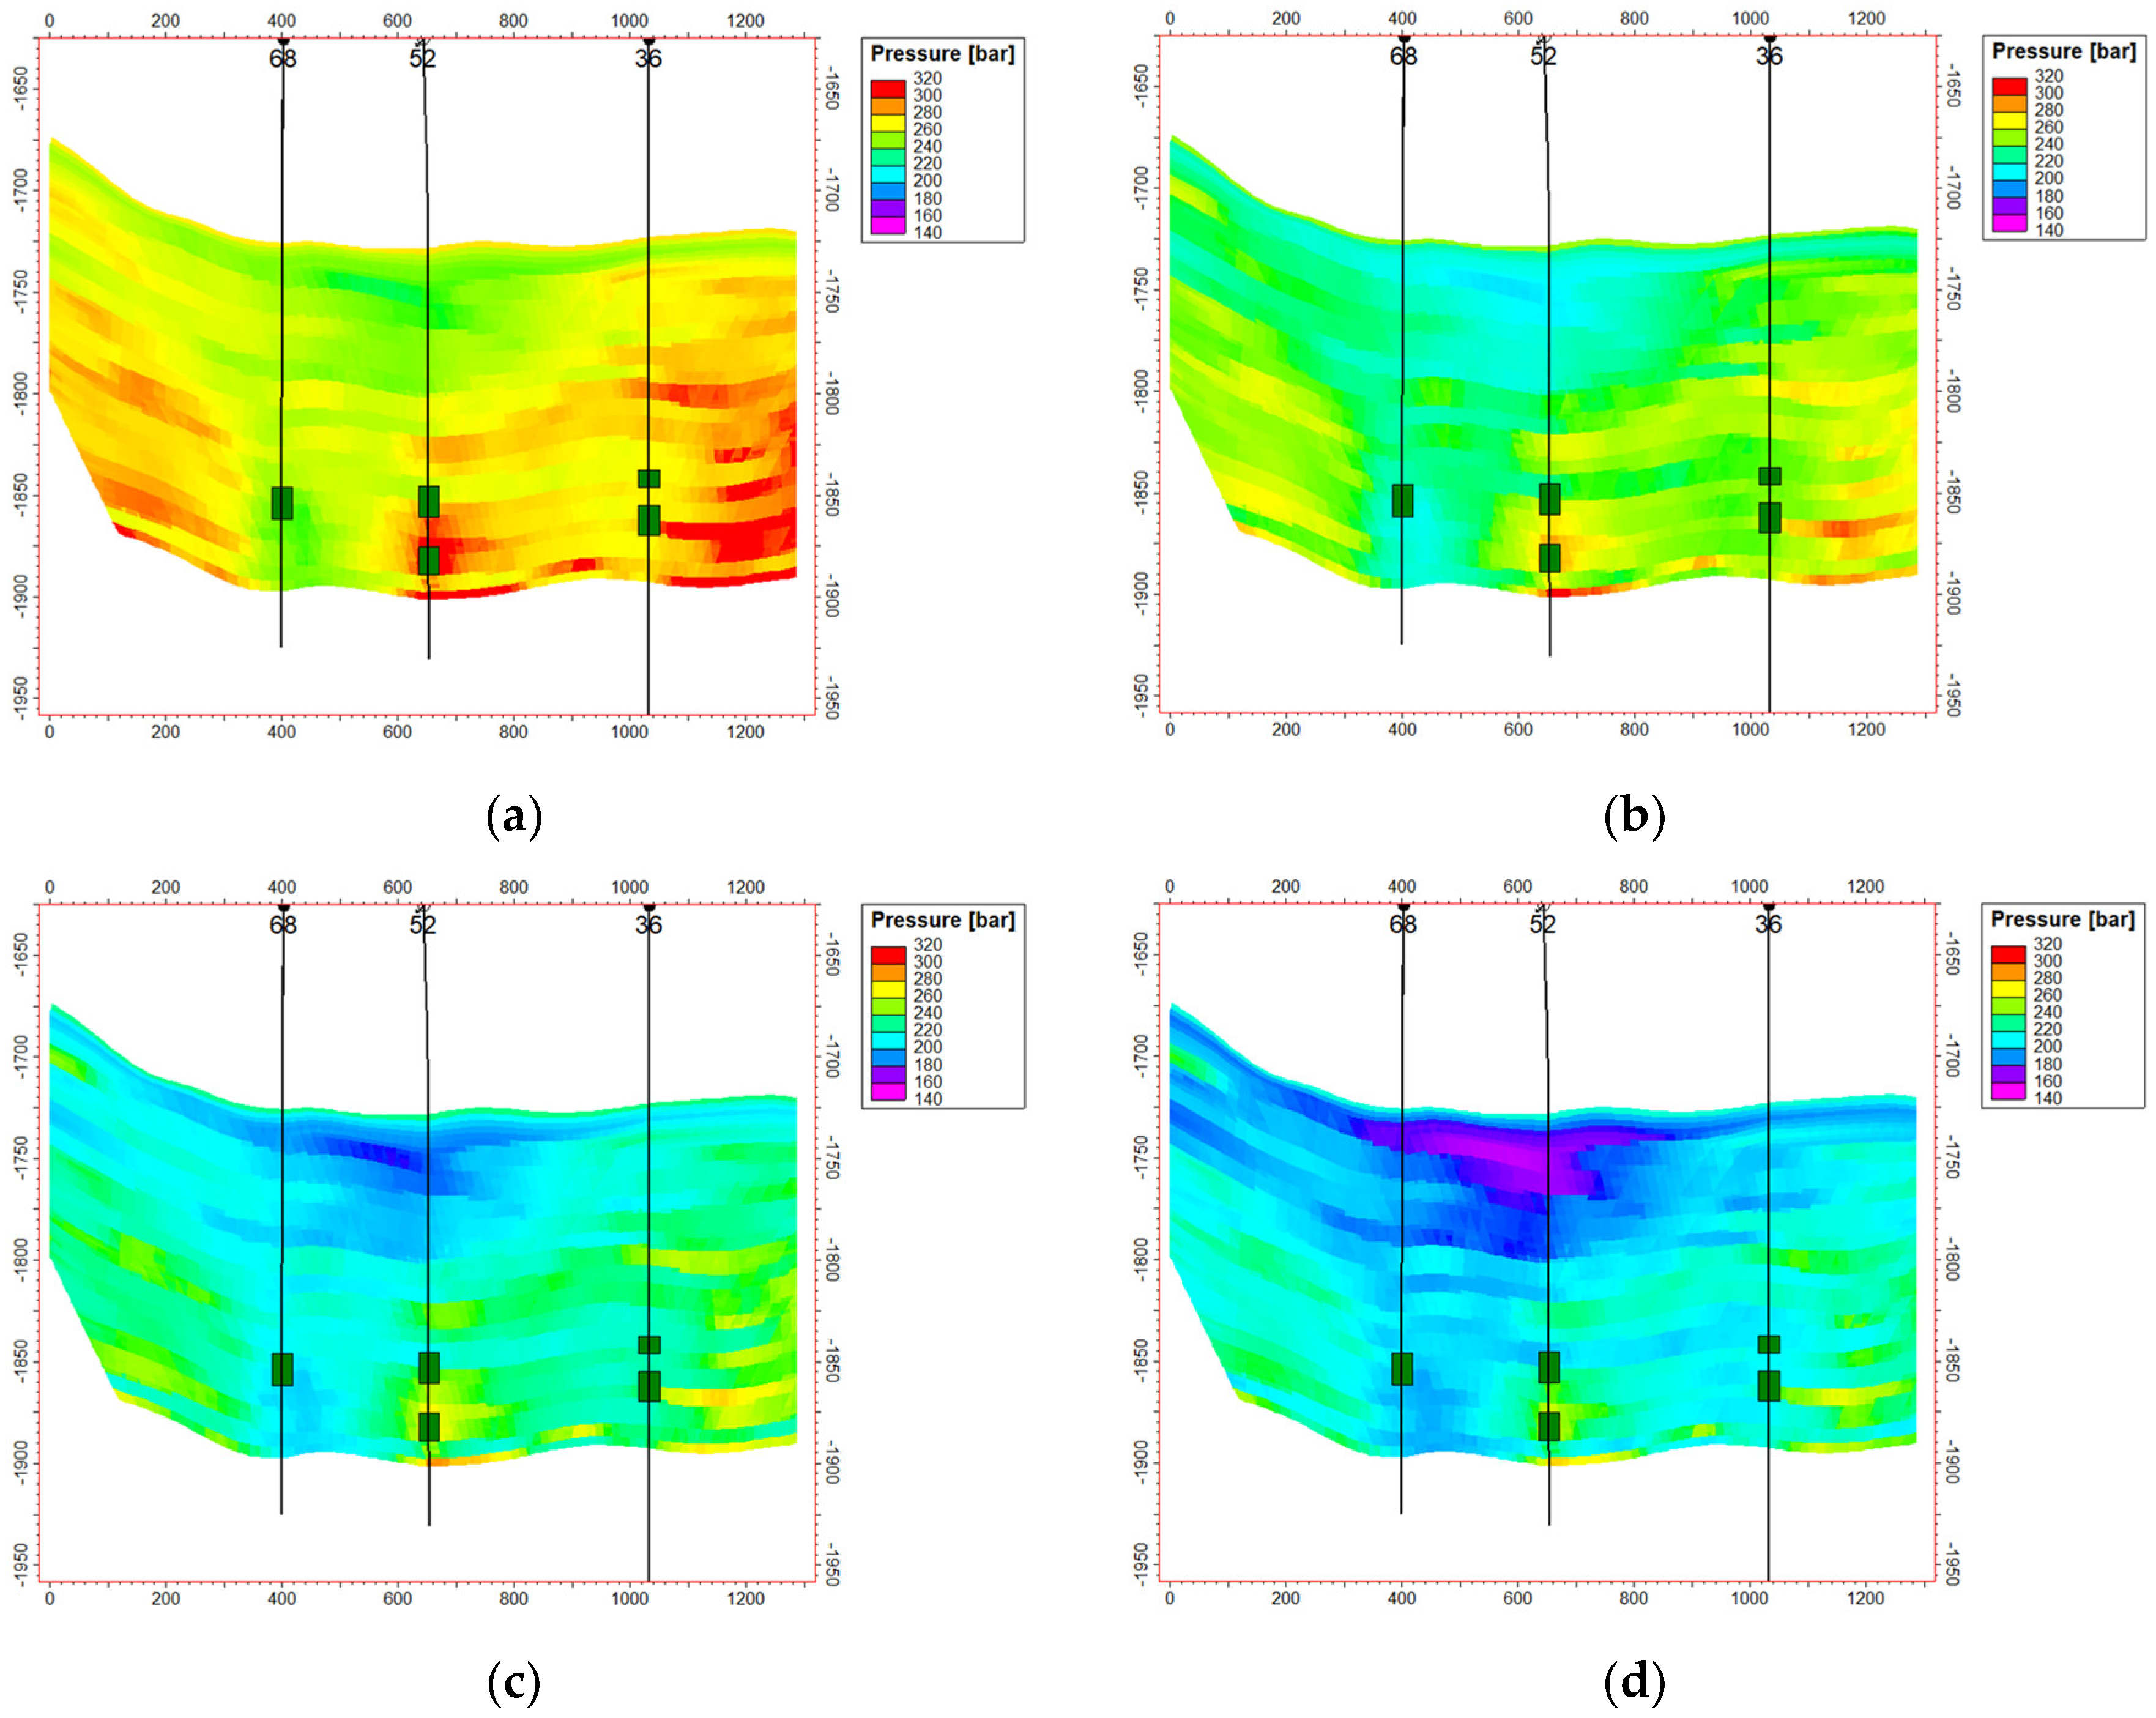
During the injection-production phase following hydraulic fracturing, the formation pressure remains at a relatively high level in the early production stage due to fluid injection and fracturing fluid retention, leading to a corresponding increase in in situ stress. Numerical simulation results from an inter-well profile connecting Well 68, Well 52, and Well 36 along the fracture propagation direction show that the stress near the injection well rose from an initial 270 bar to 320 bar in the first year of production, an increase of approximately 18.5%. Subsequently, it continuously decreased, dropping to 245 bar by the fourth year, which is 9.3% lower than the initial value. In contrast, the stress near the production well continuously declined from an initial 255 bar to 160 bar in the fourth year, a reduction of 37.3% (Figure 16). The dynamic changes in formation pore pressure during waterflooding development lead to alterations in the in situ stress field. In the near-wellbore zone of production wells, the extraction of formation fluids and the resulting pressure depletion cause local contraction of the rock matrix. However, under far-field displacement constraints, this contraction is restricted, which is equivalent to applying a tensile elastic reaction force to the contracted region, manifested as a decrease in in situ stress. Around injection wells, the confinement of near-field rock expansion during the initial injection phase leads to a temporary increase in total stress. As pressure diffuses and constraint relaxes, the stress gradually decreases thereafter, with the magnitude of in situ stress reduction being relatively smaller. This evolutionary pattern can guide the optimization of candidate wells/layers for re-fracturing. Performing re-fracturing in areas where the difference between the two horizontal principal stresses is smaller is conducive to promoting the initiation and propagation of multiple branch fractures.
Figure 16.
Evolution Process of Minimum Horizontal Principal Stress in the Infill Well Group under Different Proppant Intensities: (a) 1 year; (b) 2 year; (c) 3 year; (d) 4 year.
7. Conclusions
(1) To achieve effective synergy between fracture network propagation and injection-production dynamics, optimizing fracturing parameters is the key mechanism. This study found that controlling the pumping rate at 3.5–4.0 m3/min, maintaining a pad fluid ratio of 40–50%, and using a proppant intensity of 3.0–4.0 m3/m can reasonably control the fracture half-length to 40–45 m. This promotes fracture network formation while avoiding excessive fracture length that could lead to subsequent water channeling.
(2) The waterflooding dynamic response is directly influenced by fracture geometry: short, wide fractures facilitate a gentle and balanced waterflood front, improving sweep efficiency. Excessively long fractures, however, can cause rapid water channeling along the fractures, increasing the risks of water breakthrough and inter-well interference. This indicates that controlling fracture network architecture is crucial for achieving balanced displacement.
(3) The in situ stress field exhibits significant non-uniform evolution during injection and production in infill wells: stress around injection wells rises briefly before declining continuously, while stress around production wells decreases steadily. This reduces the horizontal stress contrast, a dynamic change that may impact fracture stability and long-term development effectiveness.
(4) The conclusions of this study are primarily based on simulations under specific geological and engineering conditions. Future work requires validation with more actual field data and further research into dynamic control methods for fracture network-injection-production synergy under different reservoir conditions.
Author Contributions
Conceptualization, X.M. and D.Z.; methodology, X.M. and D.Z.; validation, D.Z., B.D. and M.Z.; investigation, M.Z. and X.Z.; resources, B.D. and D.Z.; data curation, M.Z., X.Z., Y.W. and Q.W.; writing—original draft preparation, D.Z. and H.M.; writing—review and editing, D.Z. and H.M. All authors have read and agreed to the published version of the manuscript.
Funding
This research received no external funding.
Institutional Review Board Statement
Not applicable.
Informed Consent Statement
Not applicable.
Data Availability Statement
The original contributions presented in this study are included in the article. Further inquiries can be directed to the corresponding author.
Conflicts of Interest
Authors Dan Zhou, Bo Dong, Minghai Zhang, Xiao Zhang, were employed by the company PetroChina Xinjiang Oilfield Company. The remaining authors declare that the research was conducted in the absence of any commercial or financial relationships that could be construed as a potential conflict of interest.
References
- Liu, X.J.; Xiong, J.; Liang, L.X.; You, X.C. Rock Mechanical Characteristics and Fracture Propagation Mechanism of Sandy Conglomerate Reservoirs in Baikouquan Formation of Mahu Sag. Xinjiang Pet. Geol. 2018, 39, 84–91. [Google Scholar]
- Qin, J.H.; Wang, J.G.; Li, S.Y.; Li, S.; Dou, Z.; Peng, S.M. Characteristics and formation mechanism of hydraulic fractures in tight conglomerate reservoirs of Triassic Baikouquan Formation in Mahu Sag. Lithol. Reserv. 2023, 35, 29–36. [Google Scholar]
- Wang, J.B.; Hou, B.; Teng, W.W.; Li, X.D.; Liu, J.T.; Liang, B.X.; Zhang, Y.K.; Wei, Y. Research progress on mechanical characteristics and hydraulic fracture propagation mechanism of tight conglomerate reservoirs. Pet. Sci. Bull. 2024, 9, 972–990. Available online: https://cup.edu.cn/pub/sykxtb/docs//2024-12/b13140748f654ac6916bb3532cea308a.pdf (accessed on 2 January 2026).
- Zhang, J.; Hu, D.D.; Qin, J.H.; Wang, Y.W.; Tang, H.Y. Optimization of Key Fracturing Parameters for Profitable Development of Horizontal Wells in Mahu Conglomerate Reservoirs. Xinjiang Pet. Geol. 2023, 44, 184–194. [Google Scholar]
- Wang, Y.P.; Liao, K.; Xie, B.B.; Ma, X.F.; Guo, S.K. Optimization of Fracturing Process Parameters of Horizontal Well Groups in Mahu Tight Conglomerate Reservoir. Sci. Technol. Eng. 2024, 24, 12951–12961. [Google Scholar]
- Chen, X.L.; Lv, Z.H.; Lu, Z.Y.; Wu, H.; Kong, M.W.; Zhang, Y.P. Research and application of key technologies for volume fracturing of deep tight conglomerate reservoirs in Mahu Oilfield. Fault-Block Ol Gas Feld 2024, 31, 1098–1104. Available online: http://59.75.36.213/KCMS/detail/detail.aspx?filename=DKYT202406020&dbcode=CJFD&dbname=CJFD2024 (accessed on 2 January 2026).
- Yu, T.X.; Yuan, F.; Zhou, P.Y.; Hao, L.H.; Zou, Y.S.; Ma, X.F.; Zhang, Z.P. Fracture Propagating Shapes in Gravel-Supported Conglomerate Reservoirs of Upper Wuerhe Formation on Manan Slope, Mahu Sag. Xinjiang Pet. Geol. 2021, 42, 53–62. [Google Scholar]
- Xv, C.Z.; Zhang, G.Q.; Lyu, Y.J.; Wang, P. Experimental study on hydraulic fracture propagation in conglomerate reservoirs. In Proceedings of the 53rd US Rock Mechanics/Geomechanics Symposium, New York, NY, USA, 23–26 June 2019. [Google Scholar]
- Zheng, Y.; He, R.; Huang, L.; Bai, Y.; Wang, G.; Chen, W.; Wang, W. Exploring the effect of engineering parameters on the penetration of hydraulic fractures through bedding planes in different propagation regimes. Comput. Geotech. 2022, 146, 104736. [Google Scholar] [CrossRef] [Scilit]
- Shen, T.J.; Lin, B.; Dong, J.; Yu, H.; Shi, S.; Ma, J. Investigation of hydraulic fracture propagation in conglomerate reservoirs using discrete element method. In Proceedings of the ARMA-CUPB Geothermal International Conference, Beijing, China, 5–8 August 2019. [Google Scholar]
- Sheng, J.C. Fully coupled thermos-hydro-mechanical model of saturated porous media and numerical modelling. Chin. J. Rock Mech. Eng. 2006, 25, 3028–3033. [Google Scholar]
- Jahan, N. Coupled Thermohydroelasticity Phenomena in Variably Saturated Fractured Porous Rocks—Formulation and Numerical Solution. Dev. Geotech. Eng. 1996, 79, 93–134. [Google Scholar]
- Khalaf, M.S. Geomechanical Analysis of Hot Fluid Injection in Thermal Enhanced Oil Recovery. Energies 2026, 19, 386. [Google Scholar] [CrossRef] [Scilit]
- Zhu, H.Y.; Song, Y.J.; Xu, Y.; Li, K.D.; Tang, X.H. Four-dimensional in situ stress evolution of shale gas reservoirs and its impact on infill well complex fractures propagation. Acta Pet. Sin. 2021, 42, 1224–1236. [Google Scholar]
- Ren, G.C.; Ma, X.F.; Zhang, S.C.; Zou, Y.S.; Duan, G.F.; Xiong, Q.Y. Optimization of horizontal well pattern re-fracturing timing inconglomerate reservoir in Mahu Sag of Junggar Basin. Pet. Geol. Oilfield Dev. Daqing 2023, 42, 167–174. Available online: https://d.wanfangdata.com.cn/periodical/dqsydzykf202302020 (accessed on 2 January 2026).
- Zou, Y.S.; Shi, S.Z.; Zhang, S.C.; Li, J.M.; Wang, F.; Wang, J.C.; Zhang, X.H. Hydraulic fracture geometry and proppant distributionin thin interbedded shale oil reservoirs. Pet. Explor. Dev. 2022, 49, 1025–1032. [Google Scholar] [CrossRef] [Scilit]
- Busetti, S. Hydraulic Fracture Swarms and Irregular Stress Shadows. In Proceedings of the 53rd US Rock Mechanics/Geomechanics Symposium, New York, NY, USA, 23–26 June 2019. [Google Scholar]
- Li, J.J.; Pei, Y.L.; Jiang, H.Q.; Zhao, L.; Li, L.K.; Zhou, H.; Zhao, Y.Y. Tracer Flowback Based Fracture Network Characterization in Hydraulic Fracturing. In Proceedings of the Abu Dhabi International Petroleum Exhibition & Conference, Abu Dhabi, United Arab Emirates, 7–10 November 2016. [Google Scholar]
- Weng, X.; Kresse, O.; Cohen, C.; Wu, R.; Gu, H. Modeling of hydraulic-fracture-network propagation in a naturally fractured formation. SPE Prod. Oper. 2011, 26, 368–380. [Google Scholar]
- Zhu, W.C.; Wei, C.H.; Tian, J.; Yang, T.H.; Tang, C.A. Coupled thermal-hydraulic-mechanical model during rock damage and its preliminary application. Rock Soil Mech. 2009, 30, 3851–3857. [Google Scholar] [CrossRef]

Disclaimer/Publisher’s Note: The statements, opinions and data contained in all publications are solely those of the individual author(s) and contributor(s) and not of MDPI and/or the editor(s). MDPI and/or the editor(s) disclaim responsibility for any injury to people or property resulting from any ideas, methods, instructions or products referred to in the content. |
© 2026 by the authors. Licensee MDPI, Basel, Switzerland. This article is an open access article distributed under the terms and conditions of the Creative Commons Attribution (CC BY) license.