Article

SUVA-Based Modelling of THMFP Under Ozonation Using Regression and ANN Approaches
Department of Environmental Engineering, Faculty Engineering, Bursa Uludağ University, 16059 Bursa, Türkiye
Appl. Sci. 2026, 16(3), 1256; https://doi.org/10.3390/app16031256
Submission received: 20 December 2025 / Revised: 18 January 2026 / Accepted: 22 January 2026 / Published: 26 January 2026
(This article belongs to the Special Issue New Approaches to Water Treatment: Challenges and Trends, 2nd Edition)

Abstract

Drinking-water treatment systems must effectively control natural organic matter (NOM), a major precursor of regulated disinfection by-products (DBPs). Specific ultraviolet absorbance (SUVA) is widely used as an operational surrogate for NOM aromaticity and hydrophobicity; however, ozonation and subsequent filtration can disrupt the linear relationship between SUVA and trihalomethane formation potential (THMFP). This study evaluates whether SUVA can reliably predict THMFP under two ozonation configurations frequently applied in drinking-water treatment: pre-ozonation prior to coagulation–filtration and final ozonation following filtration. Experimental data were analyzed using conventional linear regression and artificial neural network (ANN) models, with SUVA employed as the sole predictor variable. Across all treatment configurations, reductions in SUVA were consistently more pronounced than corresponding decreases in THMFP, indicating a decoupling between chromophoric loss and chlorine-reactive precursor dynamics under ozonation-dominated conditions. Linear regression models exhibited only moderate predictive performance (R2 = 0.63–0.76), reflecting the limitations of proportional surrogate-based approaches when NOM undergoes oxidative and adsorptive transformation. In contrast, single-parameter ANN models captured the nonlinear SUVA–THMFP relationship with substantially higher accuracy across both pre- and final-ozonation regimes (R2 = 0.88–0.99), successfully resolving process-dependent patterns embedded within optically compressed SUVA signals. These findings demonstrate that, although SUVA alone cannot linearly represent the multistep transformation of NOM during ozonation and adsorption, it retains process-relevant structure information on DBP precursor reactivity that can be effectively extracted using nonlinear modelling. The results highlight the potential of integrating ANN-driven tools into advanced monitoring and DBP-control strategies in modern drinking-water treatment systems.

1. Introduction

Drinking-water treatment systems must effectively control natural organic matter (NOM), a complex and heterogeneous mixture of humic and non-humic substances originating from terrestrial runoff, soil–organic interactions, and microbial activity. NOM is of central importance in drinking-water quality management because it constitutes the primary precursor pool for regulated disinfection by-products (DBPs), particularly trihalomethanes (THMs) formed during chlorination. The reactivity of NOM toward chlorine is governed by its aromaticity, hydrophobicity, molecular-weight distribution, and the abundance of electron-donating functional groups—characteristics largely associated with humic-like fractions enriched in conjugated and phenolic moieties. Consequently, both NOM concentration and chemical character must be considered when assessing DBP formation potential and designing effective treatment strategies [1,2].
Specific ultraviolet absorbance (SUVA), defined as UV254 absorbance normalized to dissolved organic carbon (DOC), has long been used as a practical surrogate for NOM aromaticity and hydrophobicity. Seminal studies demonstrated that higher SUVA values are generally associated with increased aromatic carbon content and elevated trihalomethane formation potential (THMFP), particularly in humic-rich surface waters [2]. Subsequent investigations reported strong correlations between SUVA (or UV254) and DBP formation across a range of source waters, supporting the widespread use of SUVA for enhanced coagulation optimization, process monitoring, and preliminary DBP risk assessment [1,2,3,4]. Because SUVA integrates two routinely measured parameters into a single index, it remains attractive for drinking-water utilities seeking low-cost, operationally simple indicators compatible with online monitoring frameworks.
However, it is important to recognize that the majority of these foundational SUVA–reactivity relationships were established under conventional treatment frameworks dominated by coagulation and filtration, or within bulk DOM characterization contexts, rather than under ozonation-based treatment systems. The transferability of SUVA–THMFP correlations derived from non-ozonated conditions to ozonation treatment trains therefore requires careful evaluation. Ozone-induced transformations can substantially modify NOM reactivity without producing proportional changes in bulk optical properties, challenging the direct practical relevance of SUVA following oxidation [5,6,7,8].
More broadly, the SUVA–THMFP relationship is not universal and exhibits considerable variability depending on source-water characteristics, seasonal changes, land-use influences, and NOM molecular composition. Several studies have shown that waters dominated by low-molecular-weight or hydrophilic organic fractions can display weak or inconsistent correlations between SUVA and DBP formation despite similar DOC concentrations [3]. These findings indicate that aromaticity alone is insufficient to fully characterize DBP precursor reactivity, particularly when NOM composition deviates from classical humic-dominated matrices. Similar limitations of SUVA-based DBP prediction have been reported for waters enriched in hydrophilic and nitrogen-containing organic matter, where substantial DBP formation may occur with minimal changes in UV absorbance [9,10,11]. In practice, recent monitoring-focused studies emphasize that surrogate parameters such as SUVA remain operationally useful but require careful, context-dependent interpretation when treatment steps modify NOM composition [12,13].
Ozonation further complicates the interpretation of SUVA-based surrogate relationships by introducing oxidation pathways that are not directly reflected by bulk optical parameters. In aqueous systems, ozone reacts not only via selective electrophilic attack on activated aromatic structures but also through secondary pathways associated with ozone decomposition, generating highly reactive oxidants such as hydroxyl radicals. These concurrent mechanisms broaden oxidation chemistry and alter NOM transformation routes and by-product formation kinetics in ways that UV254 absorbance and SUVA do not reliably capture [14,15,16,17,18]. As a result, UV signals may decline rapidly while NOM is simultaneously converted into smaller, more oxygenated compounds that exhibit weak UV absorbance yet remain reactive toward chlorine. Consistent with these mechanistic considerations, recent full-scale and pilot-scale studies demonstrate that ozonation can decouple optical indicators from downstream DBP outcomes, such that reductions in SUVA do not necessarily imply proportional decreases in THMFP under subsequent chlorination [15,16,17,18,19].
As a strong and selective oxidant, ozone preferentially attacks electron-rich aromatic rings and conjugated double bonds, rapidly reducing UV254 absorbance and SUVA values. At the same time, ozonation fragments large humic macromolecules into smaller oxygenated intermediates, including aldehydes, ketones, α-dicarbonyl compounds, and short-chain carboxylic acids [5,20,21]. Many of these oxidation products exhibit limited absorbance at 254 nm yet retain substantial reactivity toward free chlorine, resulting in a decoupling between optical properties and DBP formation potential. This phenomenon has been consistently observed following ozonation and advanced oxidation processes [21,22,23,24]. Accordingly, recent practice-oriented studies increasingly emphasize that the interpretability of SUVA for trihalomethane (THM) formation is highly context-dependent, particularly under ozonation, where ozone dose and contact time govern the balance between chromophore destruction and precursor reactivity [3,25].
Downstream treatment processes further influence SUVA–THMFP dynamics. Coagulation and granular media filtration preferentially remove hydrophobic, high-molecular-weight NOM, while granular activated carbon (GAC) filtration can selectively adsorb aromatic and certain hydrophilic fractions depending on pore structure, contact time, and loading history [26,27]. As treatment advances, the remaining dissolved organic matter (DOM) becomes progressively homogenized and depleted in UV-absorbing chromophores, yielding a predominantly hydrophilic residual matrix. In this optically constrained regime, variations in DBP precursor reactivity increasingly arise from non-chromophoric functional transformations, rendering bulk optical surrogates such as SUVA less responsive to chemically meaningful changes in DOM. Recent studies have shown that adsorption following oxidation can further compress optical signals, producing DOM matrices that are chemically reactive yet optically muted, thereby limiting the interpretability of SUVA as a standalone surrogate [28,29,30].
Despite these limitations, SUVA remains attractive as a first-tier operational surrogate because it integrates UV254 absorbance and DOC into a single index conceptually linked to aromatic carbon, which is widely recognized as a dominant driver of THM precursor reactivity in many conventionally treated surface-water matrices. Its low analytical cost, straightforward interpretation, and compatibility with online monitoring systems make SUVA particularly suitable for routine process control and enhanced coagulation optimization in drinking-water utilities [1,4]. From an operational perspective, the central question is therefore not whether SUVA fully characterizes DBP precursor chemistry, but whether SUVA—after treatment-dependent calibration—can provide sufficiently reliable first-pass estimates of THMFP under routine plant constraints.
The limitations of surrogate-based empirical models for predicting DBP formation have been widely discussed, particularly under conditions where treatment processes induce nonlinear transformations of organic matter [31]. Given the increasing complexity of modern drinking-water treatment trains, simple linear regression approaches—which assume proportional and monotonic relationships—are often inadequate for predicting DBP formation from surrogate parameters alone. In contrast, data-driven nonlinear modelling approaches, particularly artificial neural networks (ANNs), have demonstrated strong predictive capability even when based on a limited number of bulk water quality parameters [32,33,34]. Recent comparative studies further indicate that model performance depends strongly on water-matrix characteristics and data homogeneity, underscoring the need for careful scope definition and transparent validation when datasets are limited [35,36].
To isolate treatment-induced effects on the SUVA–THMFP relationship, this study was intentionally confined to a single intake (Doğancı Dam) and a fixed operational period. While multi-source and seasonal datasets are essential for developing generalized DBP prediction models, they also introduce substantial source-water heterogeneity that can obscure process-level interpretation. By minimizing inter-source and seasonal variability, the present design enables a focused evaluation of SUVA as a process-relevant operational surrogate under ozonation–filtration conditions.
Accordingly, the objective of this study is not to develop a universal or high-accuracy THMFP prediction model, but to evaluate how ozonation affects the interpretability of SUVA as a single operational surrogate under ozonation–filtration treatment conditions. Because ozonation and subsequent filtration can decouple optical signals from chlorine-reactive precursor dynamics, proportional (linear) SUVA–THMFP relationships may be weakened under ozonation-dominated regimes. SUVA was therefore used as the sole predictor to examine the informational content and limits of this routinely monitored surrogate, prioritizing interpretability over multivariable model expansion.
Within this framework, a simple linear regression baseline was benchmarked against a deliberately compact artificial neural network with a single hidden layer to assess whether modest nonlinearity improves representation of SUVA–THMFP behaviour within the studied configurations, without increasing monitoring complexity. To reduce confounding variability from source-water heterogeneity and to enable process-level interpretation, experiments were confined to a single intake and controlled treatment conditions. Broader datasets and additional chemical descriptors would be required for mechanistic attribution and for cross-site or seasonal generalization; accordingly, the results are interpreted as process-specific within a clearly bounded operational context. This study does not aim to provide mechanistic identification of ozonation by-products or causal attribution of specific DBP precursor pathways but instead evaluates the operational relevance of SUVA as a first-tier indicator under ozonation–filtration treatment conditions.

2. Materials and Methods

2.1. Source Water

The water sample used in this study was collected at the inlet of the Dobruca Drinking-Water Treatment Plant, which receives raw water from the Doğancı Dam supplying the drinking, domestic, and industrial water demand of the central districts of Bursa. The Doğancı Dam has a drainage area of 450 km2 and a maximum storage capacity of 37.8 × 10⁶ m3. The raw water is conveyed to the treatment plant through an approximately 11 km long transmission line. The physicochemical characteristics of the dam water are presented in Table 1.

2.2. Treatment Processes

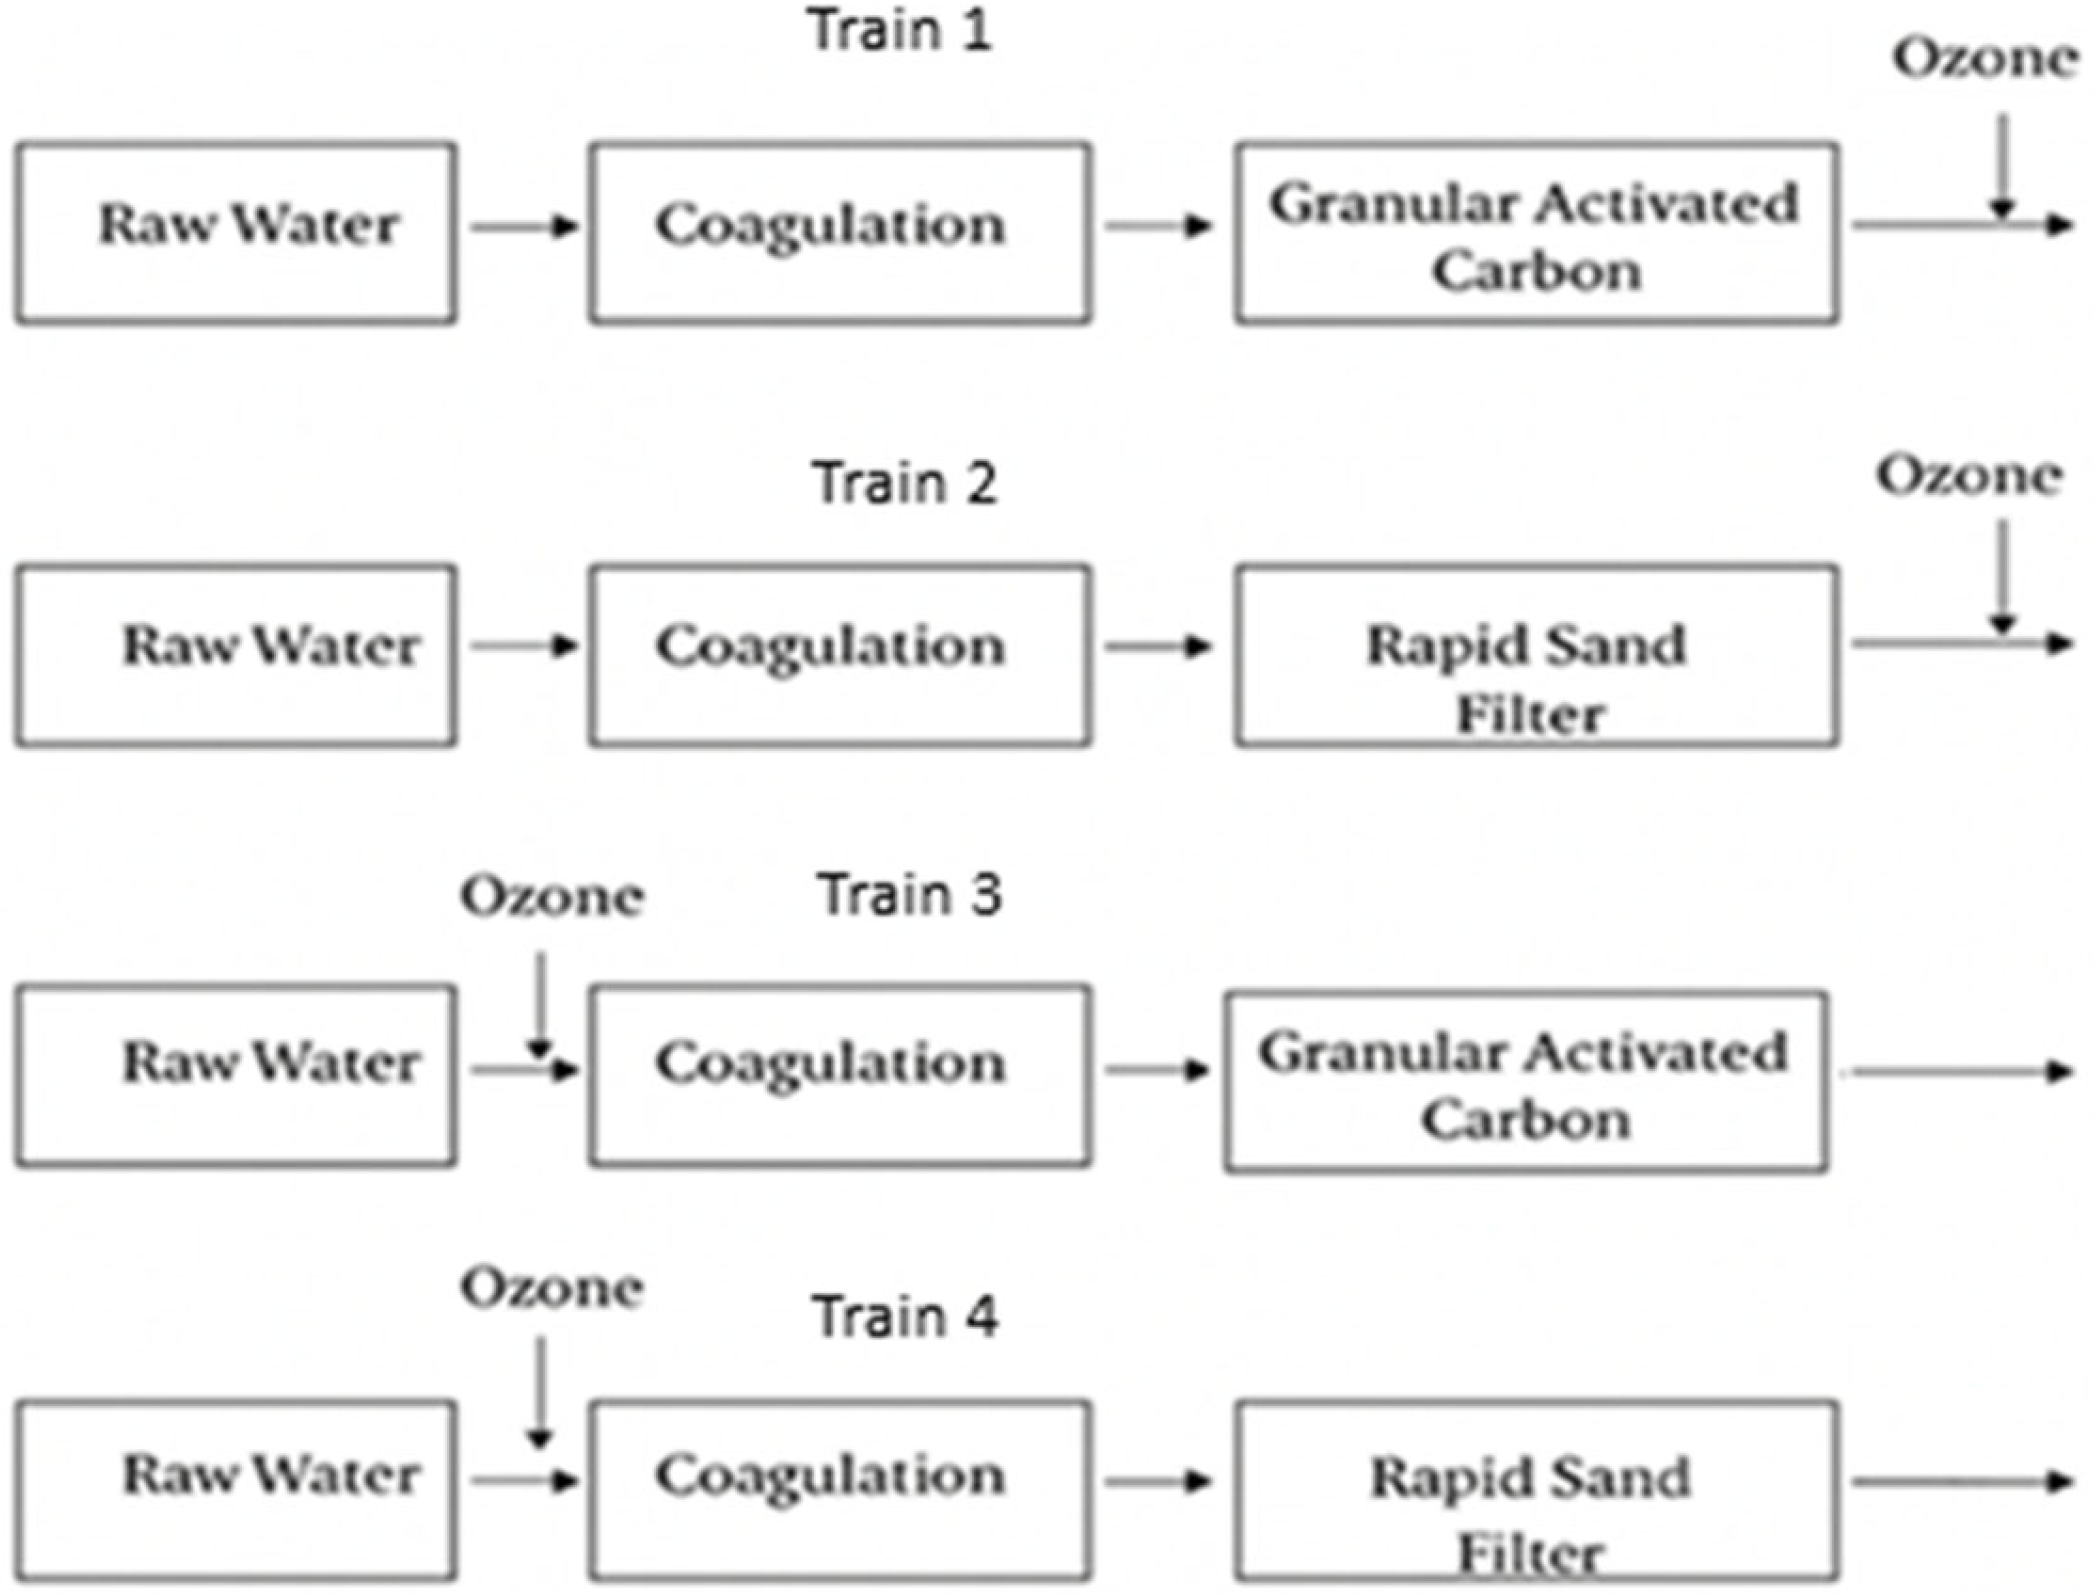
A schematic overview of the treatment sequences, including the placement of pre-ozonation and final-ozonation steps relative to coagulation, rapid sand filtration, and GAC filtration, is presented in Figure 1 to support interpretation of process-dependent changes in NOM characteristics.
Coagulation was conducted using ferric chloride (FeCl3) under optimized conditions. The optimum coagulant dose was determined as 27 mg/L FeCl3 at pH 5.5, with the addition of 0.05 mg/L anionic polymer. Jar tests were performed using a standard mixing protocol consisting of rapid mixing at 150 rpm for 1 min, followed by slow mixing at 40 rpm for 20 min, and a settling period of 30 min. The reported optimum coagulant dose and pH were determined through a series of jar-test experiments conducted over a wide range of ferric chloride doses and pH conditions. Optimization was based on the simultaneous minimization of residual turbidity and UV254 absorbance, and the selected conditions therefore represent operational optima for the studied raw water matrix rather than outcomes of a standalone coagulation performance investigation. Detailed dose–response relationships, including replicate measurements and variability, are provided in the Supplementary Materials (Figures S1–S4).
Following coagulation, rapid sand filtration was performed using a plexiglass column with a total height of 120 cm and an inner diameter of 7 cm, operated under downward-flow conditions. The filter bed had a total depth of 50 cm, consisting of an 8 cm gravel layer (0.5–1 cm) and a 42 cm sand layer (0.5–1 mm). The filtration rate was adjusted to 5.5 m/h using a peristaltic pump, and the filtrate was collected in a 40 L container for use in subsequent treatment processes.
Water samples collected after coagulation were subsequently passed through a granular activated carbon (GAC) filter operated in downward-flow mode. The GAC filter consisted of a plastic cylindrical column with an inner diameter of 7 cm and a height of 25 cm. The column was packed with granular activated carbon having a particle size range of 0.4–1.4 mm, providing a bed depth of 20 cm. The empty bed contact time (EBCT) was 15 min, and filtration was performed at a hydraulic loading rate of 0.8 m/h.
Ozonation experiments were conducted under controlled bench-scale conditions. Dissolved ozone concentrations were adjusted and verified using the indigo colorimetric method. Two target ozone doses (0.5 mg/L and 2 mg/L) were applied, each at contact times of 5 min and 20 min, resulting in four distinct ozonation scenarios.
Ozone was generated using an ozone generator (OPAL Genozon, Denizli, Turkey) operating on the corona discharge principle. Ozonation experiments were performed at ambient laboratory temperature, and the raw-water alkalinity during ozonation was maintained at 175 mg/L as CaCO3. At the end of each contact period, residual dissolved ozone was immediately quenched using sodium thiosulfate to prevent further oxidative transformation prior to subsequent SUVA and THMFP analyses.
Treatment trains comprising coagulation followed by rapid sand filtration without ozonation were evaluated in parallel with ozonated configurations. Although a fully replicated zero-ozone control was not implemented for all treatment trains, these non-ozonated filtration sequences provide a direct reference for assessing the contribution of filtration to observed changes in SUVA and THMFP.

2.3. Analysis

TOC and DOC analyses were performed using a TOC–V CSH analyzer (Shimadzu, Kyoto, Japan) based on the high-temperature combustion method. BDOC was determined using the sand column method [37] by passing samples through two sand-filled columns arranged in series and calculating the difference between inlet and outlet DOC concentrations. UV254 and SUVA measurements were conducted on 0.45 μm-filtered samples using a UV–visible spectrophotometer. THMFP was determined according to Standard Methods 5710 B [38] THM formation potential (THMFP) was determined in accordance with Standard Methods for the Examination of Water and Wastewater, Method 5710B [38]. Samples were adjusted to pH 7.0 ± 0.2 using a phosphate buffer and incubated in the dark for 7 days at 25 ± 2 °C to allow maximum THM formation under controlled conditions, as specified in the Standard Method.
Chlorination was performed using sodium hypochlorite (NaOCl) as the chlorine source. The initial chlorine dose was selected to ensure the presence of a measurable free chlorine residual at the end of the incubation period, in accordance with Method 5710B requirements. The free chlorine residual was monitored using the DPD colorimetric method (Standard Methods 4500-Cl) [38]. To minimize volatilization losses during incubation, samples were placed in glass bottles with PTFE-lined caps and filled to minimize headspace, consistent with Standard Method guidance. At the end of the incubation period, residual chlorine was immediately quenched using sodium thiosulfate to terminate further THM formation. Quenched samples were stored at 4 °C and analyzed for THMs as soon as possible. THMFP results are reported as total trihalomethanes (TTHMs). TTHM concentrations were measured using a gas chromatograph (Hewlett-Packard, CA, USA) equipped with an electron capture (EC) detector, with a detection limit of 0.001–0.005 ppb [38].
Bromide, ammonia, and catalytic metals were not measured in the present study. However, the experimental design explicitly included ozonation-free coagulation–rapid sand filtration configurations, which served as filtration-only baselines for isolating the contribution of filtration to changes in SUVA and THMFP independently of ozone oxidation. Turbidity was measured with a turbidimeter (Jenway, Staffordshire, UK).
This study does not aim to provide mechanistic identification of ozonation by-products or causal attribution of specific DBP precursor pathways. Advanced chemical characterization techniques, including mass spectrometry, chromatographic fractionation, fluorescence spectroscopy, and NMR, were not within the scope of the experimental design. Oxidation by-products such as aldehydes, ketones, α-dicarbonyl compounds, and short-chain carboxylic acids were therefore not directly quantified, and no molecular-level characterization was performed. Accordingly, the dataset does not support mechanistic attribution of individual oxidation products but instead focuses on evaluating the operational interpretability of SUVA as a surrogate parameter for THMFP following ozonation.

2.4. Statistical Modelling

2.4.1. Linear Regression Modelling

Linear regression analysis was performed to evaluate the ability of SUVA to predict trihalomethane formation potential (THMFP) under different ozonation configurations using a linear model relating THMFP to SUVA, as defined in Equation (1). Separate regression models were developed for the pre-ozonation and final-ozonation series in order to examine whether the stage at which ozone is applied influences the predictive relationship between SUVA and THMFP. For each model, the coefficient of determination (R2) was calculated to assess overall explanatory power, according to Equation (2), and residual diagnostics were conducted to evaluate model fit and underlying assumptions based on Equation (3). Statistical significance was determined using a threshold of p < 0.05. Linear regression analyses were carried out using IBM SPSS Statistics v.29 (IBM Corp., Armonk, NY, USA). The assumptions of the linear regression models were evaluated using residual versus fitted value plots and normal Q–Q plots, which are provided in the Supplementary Materials (Figures S5–S8).
T H M F P = β o + β 1 . S U V A
R 2 = ( y i ) 2 / ( y i i ) x 2  
R M S E = 1 n ( y i ) 2

2.4.2. Artificial Neural Network (ANN) Modelling

The size, structure, and scope of the available dataset were explicitly considered when selecting the modelling approach. Because the objective of this study was not to develop a high-dimensional or universally transferable machine learning model, complex architectures requiring large training datasets and extensive hyperparameter optimization were intentionally avoided. Instead, a compact artificial neural network (ANN) framework was adopted as a minimal nonlinear benchmark to evaluate whether SUVA contains process-dependent information related to trihalomethane formation potential (THMFP) that cannot be captured by linear regression following ozonation.
The structure of the modelling dataset, including the number of treatment configurations, process stages, experimental replicates, and the allocation of samples to training, validation, and test subsets for each treatment train, is summarized in Table 2.
The ANN architecture was deliberately kept simple to match the limited size of the dataset and to reduce the risk of overfitting. A single hidden layer was employed, consistent with universal approximation theory for low-dimensional nonlinear mappings, and the number of hidden neurons (six) was selected based on preliminary testing that balanced predictive stability and model simplicity without introducing unnecessary complexity. No extensive hyperparameter optimization or multivariable comparisons were conducted, as the ANN was not intended to demonstrate algorithmic superiority, but rather to serve as a controlled nonlinear mapping tool for probing the informational content of SUVA alone. In this context, the ANN functions as a diagnostic framework to test whether weak nonlinear structure exists between SUVA and THMFP after ozonation, where linear models are known to lose interpretability.
This methodological framing is consistent with prior disinfection by-product modelling studies demonstrating that neural networks can capture nonlinear surrogate–reactivity relationships under treatment-induced decoupling, where linear models may be systematically limited [39]. Moreover, recent methodological reviews of artificial intelligence and machine learning applications in water treatment and DBP control emphasize that such models often function as diagnostic nonlinear surrogates and should be interpreted alongside simpler baseline approaches to identify when and why linear relationships break down [40].
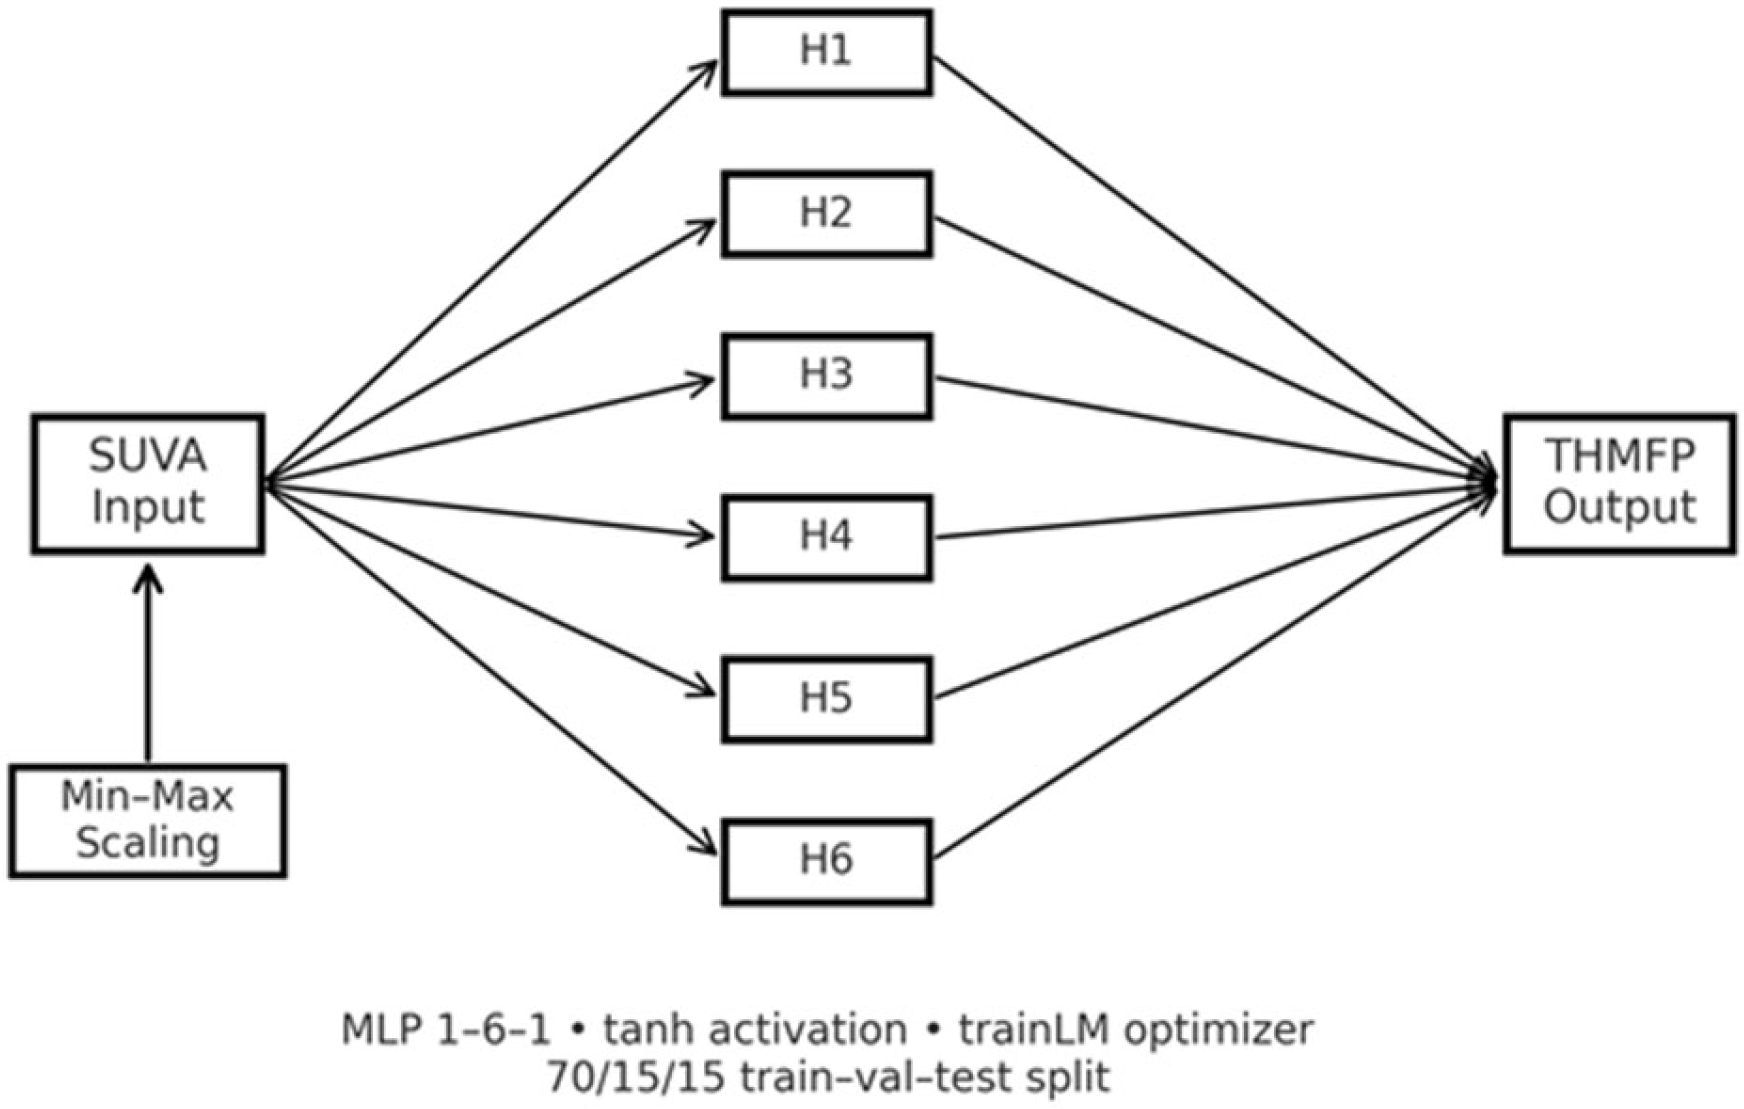
Artificial neural network models were constructed using SUVA as the sole input variable to assess how much THMFP-related information is inherently embedded in this surrogate parameter under different ozonation–filtration configurations. A feed-forward multilayer perceptron (MLP) architecture with a 1–6–1 structure (one input neuron, six neurons in a single hidden layer, and one output neuron) was applied (Figure 2). The use of a single hidden layer is consistent with universal approximation theory for low-dimensional nonlinear relationships, while the number of hidden neurons was selected based on preliminary sensitivity testing to balance predictive stability and model simplicity without introducing unnecessary complexity.
The hidden layer employed a hyperbolic tangent activation function, as defined in Equation (4), to enable nonlinear transformation of the input signal, while the output layer produced a continuous estimate of THMFP according to the standard MLP formulation (Equation (5)). Model training was performed using a mean squared error (MSE) loss function. The limited-memory Broyden–Fletcher–Goldfarb–Shanno (LBFGS) optimization algorithm was selected due to its stable and efficient convergence properties for relatively small datasets. Prior to training, all input data were normalized using min–max scaling.
h j = t a n h   ( w 1 . S U V A + b j )
T H M F P = w 2 j . h j . + b 2
The dataset was initially partitioned into training (70%), validation (15%), and test (15%) subsets for internal model development and evaluation. Model performance was assessed using the coefficient of determination (R2), root mean square error (RMSE), and mean absolute error (MAE). Learning curves were examined during training to verify stable convergence and the absence of divergence between training and validation losses, thereby reducing the risk of overfitting. Model training employed validation-based stopping criteria consistent with early stopping principles to prevent overfitting. Given the compact network architecture and limited number of trainable parameters, learning curves are provided in the Supplementary Materials (Table S5). Although the experiments were conducted over multiple independent experimental days using the same source water, the modelling objective remained restricted to within-system behaviour rather than cross-site or seasonal generalization.
To assess model robustness and to prevent potential information leakage between process-linked samples, two additional validation strategies were implemented. First, a day-wise external validation was performed by withholding one complete experimental day from all stages of model training, validation, and configuration, and using it exclusively as an external test set. Detailed results of the day-wise external validation, including R2, RMSE, and MAE values for the withheld experimental day, are provided in the Supplementary Materials (Table S2).
Second, a grouped cross-validation analysis was conducted as a robustness check, in which samples corresponding to the same ozonation condition (O1–O4) were constrained to remain within the same fold. A grouped 4-fold cross-validation scheme was applied consistently across all treatment trains, with model initialization controlled using a fixed random seed. These procedures were implemented solely as a robustness assessment and were not used to redefine the primary single-split model evaluation reported in the main text. Detailed results are provided in the Supplementary Materials (Table S3).
In the present study, the ANN is not intended as an optimized or deployable predictive model, but rather as a controlled nonlinear mapping tool to interrogate whether SUVA retains latent THMFP-relevant information under ozonation-induced restructuring of dissolved organic matter. By deliberately restricting input dimensionality and network complexity, the ANN serves as a diagnostic framework to test whether modest nonlinearity improves predictive performance relative to linear regression under defined treatment configurations.
The was deliberately constrained to a single hidden layer with a limited number of neurons. Model training was monitored using an independent validation subset, and optimization was terminated based on validation loss behaviour rather than training loss alone. This strategy ensured that model fitting did not continue beyond the point at which generalization performance stabilized. In addition, overly complex architectures and deep network configurations were intentionally avoided to maintain an appropriate balance between model flexibility and data support. All ANN modelling, preprocessing, normalization, training, and performance evaluation were performed in MATLAB R2023b (MathWorks Inc., Natick, MA, USA) using the Neural Network Toolbox.

3. Results and Discussion

In this study, trihalomethane formation potential (THMFP) was evaluated as total trihalomethanes (TTHMs), and bromide and bromate concentrations were not measured. Consequently, individual THM species (CHCl3, CHCl2Br, CHClBr2, CHBr3) and potential shifts in THM speciation following ozonation could not be resolved. It is well established that bromide plays a critical role in controlling halogen incorporation pathways and THM speciation, particularly under oxidative treatment conditions, and this constitutes a defined scope limitation of the present study.
Accordingly, in the absence of bromide concentration data and THM speciation information, species-specific or mechanistic interpretation of ozonation-induced changes in THMFP is methodologically not feasible. Nevertheless, the primary objective of this work was not to resolve THM species distributions, but to evaluate how ozonation-induced transformations of dissolved organic matter influence overall THM precursor reactivity, as reflected by TTHMFP. Therefore, the observed changes in THMFP are interpreted in terms of bulk precursor behaviour rather than species-specific formation pathways.
The evolution of SUVA and THMFP across the four treatment configurations (Figure 3 and Figure 4) reveals distinct and configuration-dependent pathways of dissolved organic matter (DOM) transformation. In all treatment trains, SUVA decreased progressively along the process sequence, whereas THMFP did not always exhibit a proportional decline. This divergence indicates that the relationship between optical properties and DBP precursor reactivity is strongly conditioned by ozonation placement, oxidation intensity, and the evolving chemical character of DOM. In particular, reductions in SUVA were consistently more pronounced than corresponding changes in THMFP, demonstrating that chromophoric loss alone is not a reliable proxy for precursor removal under ozonation-dominated conditions.
The non-proportional SUVA–THMFP trends observed in Figure 3 and Figure 4 reflect a clear decoupling between UV-absorbing aromatic structures and chlorine-reactive functional groups. Across several configurations, substantial decreases in SUVA coincided with only moderate or delayed reductions in THMFP, indicating the persistence of reactive, optically weak DOM fractions. This behaviour suggests that ozone-driven transformation increasingly shifts DBP precursor activity toward low-molecular-weight and weakly absorbing species, resulting in a compressed SUVA signal that masks chemically meaningful changes in precursor reactivity. As a consequence, apparent stabilization or minor variation in SUVA does not imply stagnation of THMFP, particularly after oxidative and adsorptive treatment steps. As expected, ANN performance became more conservative under grouped cross-validation and external validation, reflecting the strong process dependence of the SUVA–THMFP relationship across different ozonation conditions rather than model overfitting.
This study is subject to deliberate scope limitations, including reliance on a single intake (Doğancı Dam), absence of seasonal variability, a modest dataset size, and external validation confined to within-intake process-train separation. These constraints preclude broad model generalization and are not intended to support predictive deployment. Instead, they reflect a controlled experimental design aimed at evaluating the interpretability limits of SUVA as a standalone operational indicator under ozonation–filtration conditions.

3.1. Effects of Filtration Type on DOM Removal

The influence of filtration type on dissolved organic matter (DOM) removal is strongly dependent on the placement of ozonation within the treatment train. When pre-ozonation and final-ozonation configurations are compared, the role of filtration differs not only in terms of removal magnitude but also in how surrogate parameters such as SUVA and THMFP vary range, dispersion, and sensitivity.
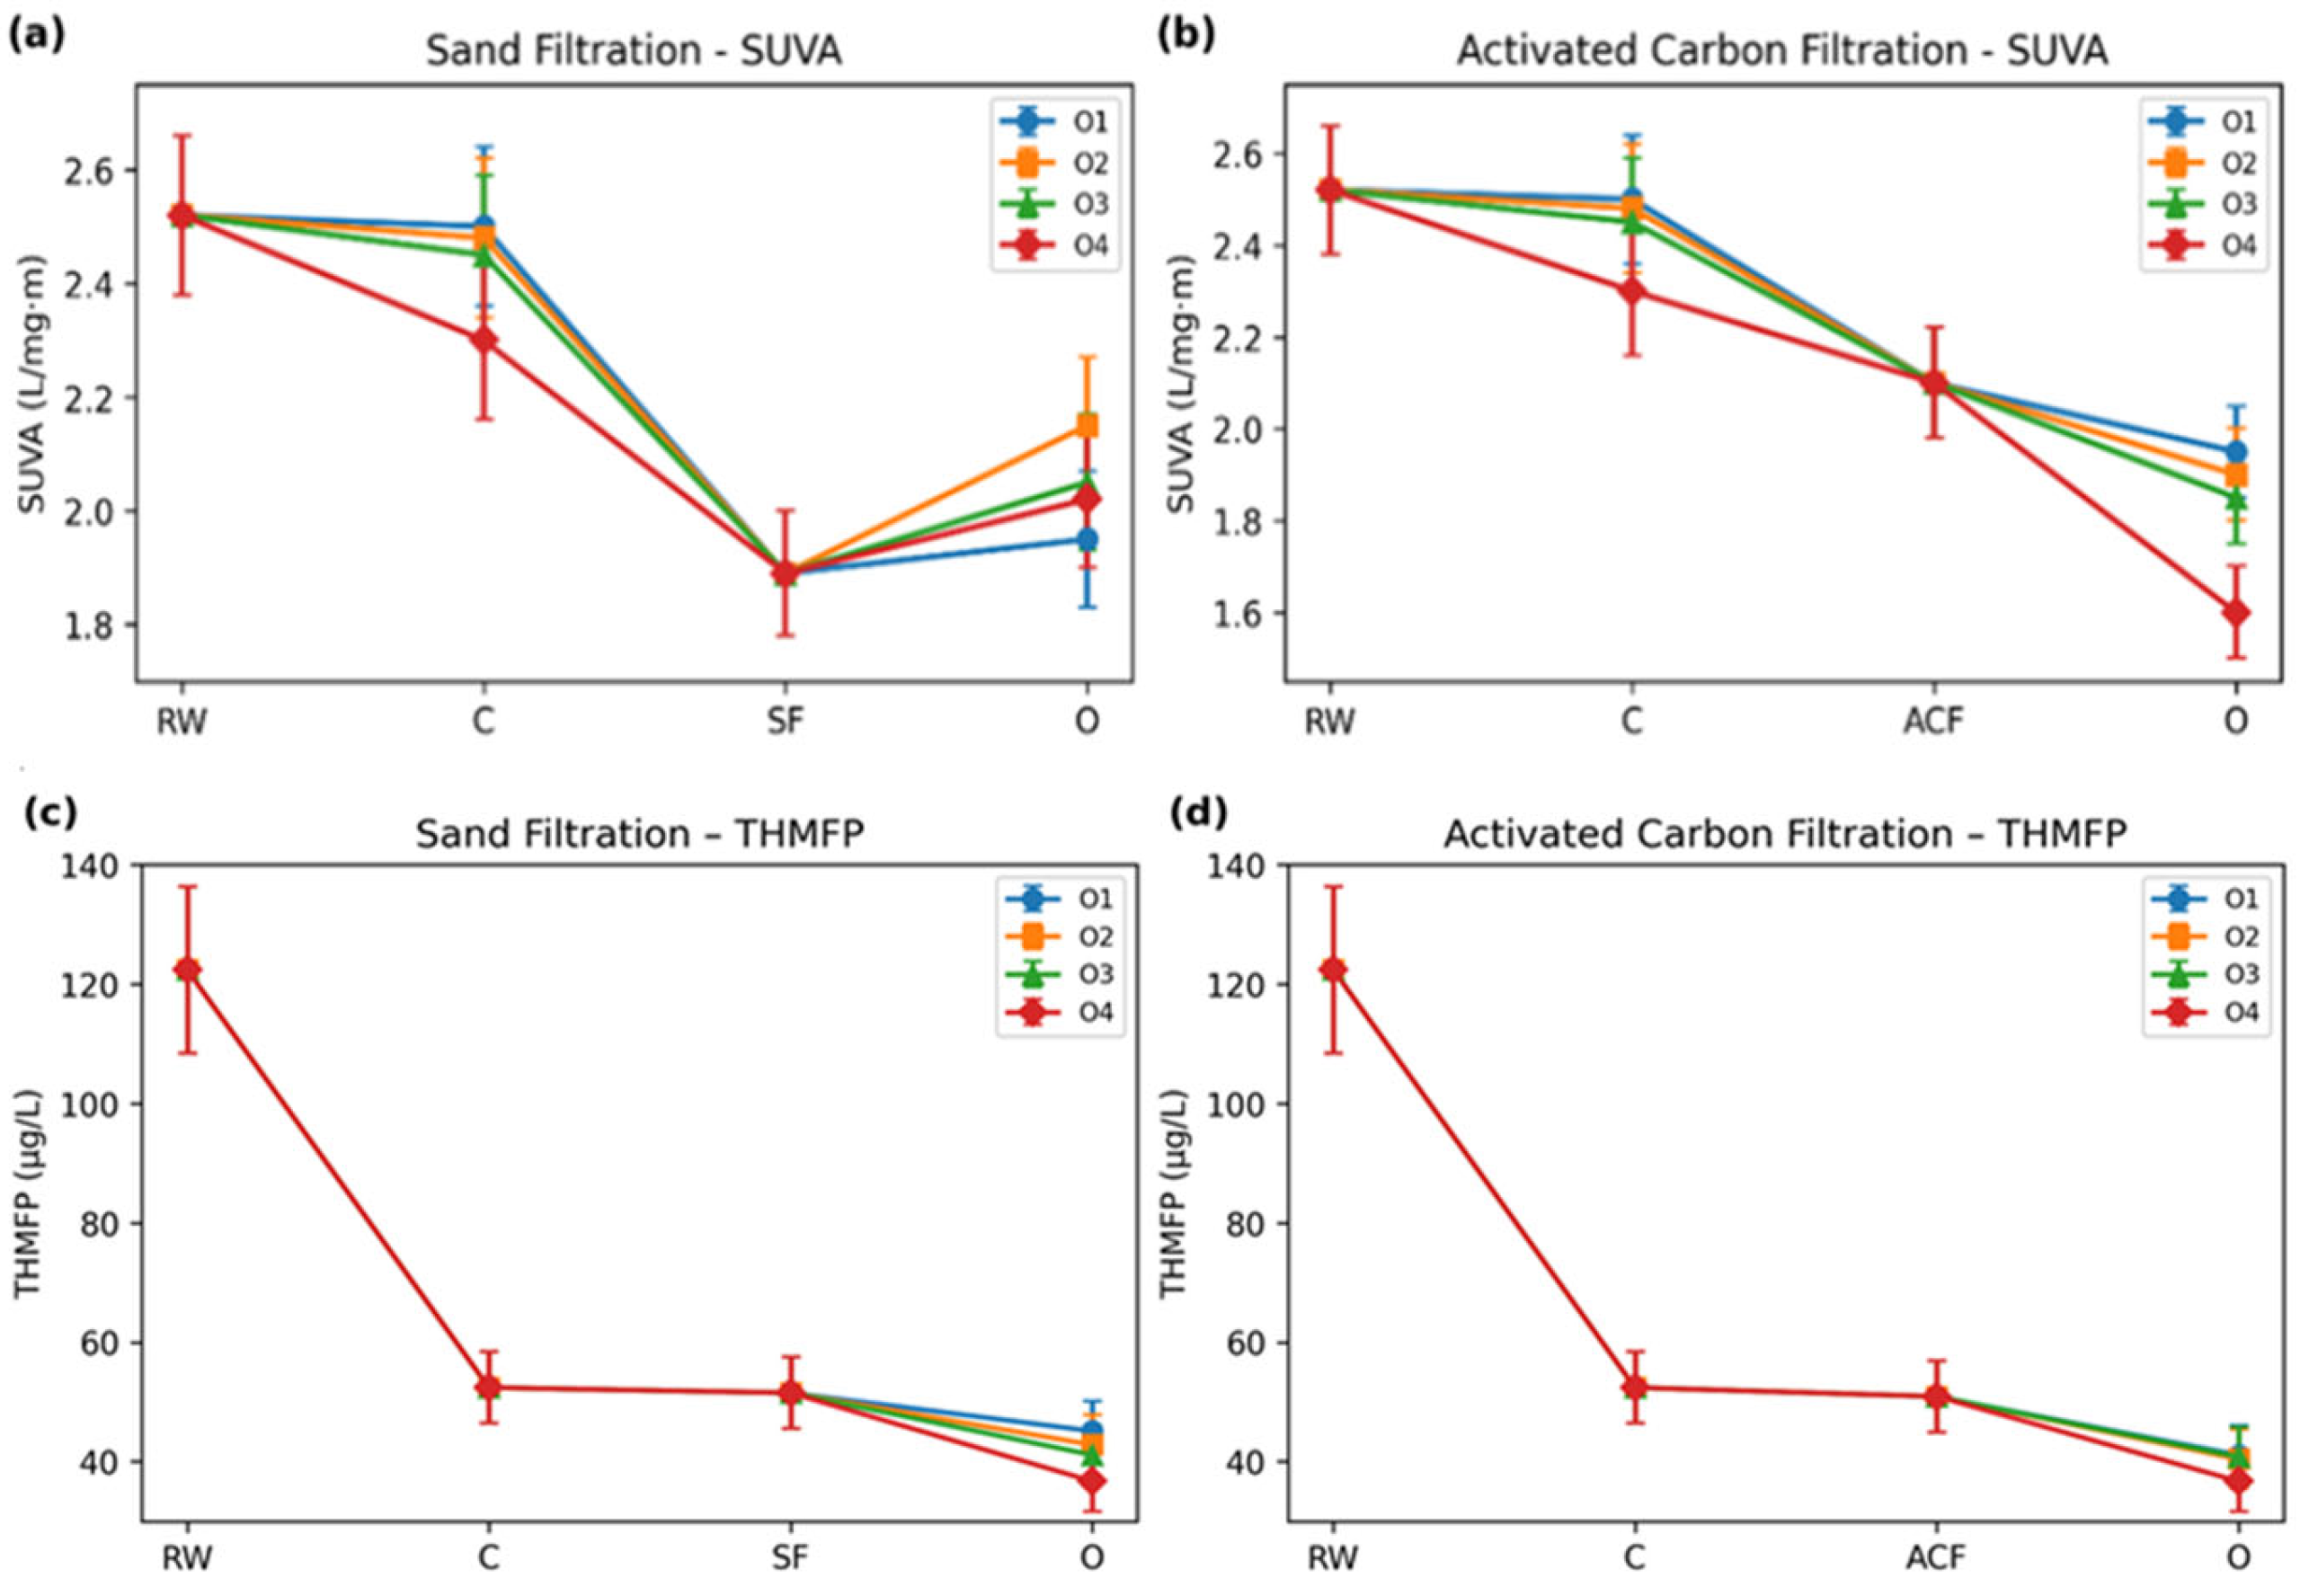
When ozonation is applied as a final treatment step, the influence of filtration emerges in a distinctly different context. In the Train 1 configuration, SUVA following activated carbon filtration is initially reduced to approximately 2.1 L·mg−1·m−1; however, subsequent final ozonation induces a dose-dependent redistribution of SUVA, with values spanning a broader range of 1.61–1.95 L·mg−1·m−1. This behaviour indicates that, once adsorption has removed a substantial fraction of strongly UV-absorbing aromatic material, ozonation further alters the residual DOM pool in a non-uniform manner rather than driving a monotonic decline in aromaticity. In parallel, THMFP decreases consistently from 50.9 µg·L−1 after activated carbon filtration to 40.8–41.1 µg·L−1 following ozonation, demonstrating that precursor reactivity is substantially suppressed despite the broadened SUVA response. This decoupled behaviour confirms that, in adsorption-dominated systems, changes in DBP formation potential are governed primarily by transformations of non-chromophoric but highly reactive DOM fractions rather than by bulk optical properties [26,30].
Following coagulation and sand filtration (Train 2), SUVA values converge to approximately 1.89 L·mg−1·m−1, indicating substantial compression of aromaticity prior to oxidation. Subsequent final ozonation does not further reduce SUVA; instead, SUVA exhibits a slight rebound and broader dispersion, increasing to ~1.95–2.15 L·mg−1·m−1 depending on ozone dose and contact time (Figure 3a). In contrast, THMFP decreases markedly from 51.5 µg·L−1 after sand filtration to 36.7–42.8 µg·L−1 following final ozonation, with the magnitude of reduction strongly dependent on ozone dose and contact time (Figure 3c). This pronounced divergence between the weak SUVA response and the strong THMFP reduction illustrates a regime of spectral–reactive decoupling, in which ozone primarily modifies non-chromophoric but highly reactive functional groups, including carbonyl-containing and nitrogenous moieties that contribute disproportionately to DBP formation [3,30].
Figure 3. SUVA and THMFP responses under different final-ozonation conditions (O1–O4; 0.5 mg/L–5 min, 0.5 mg/L–20 min, 2.0 mg/L–5 min, 2.0 mg/L–20 min) following sand filtration (SF) and activated carbon filtration (ACF), with RW (raw-water), C (coagulation), SF (sand filtration), ACF (activated carbon filtration), and O (final ozonation) representing treatment step. (a) SUVA values for post ozonation after SF, (b) Suva values fost ozonation after ACF, (c) THMFP values for post ozonation after SF, (d) THMFP values fost ozonation after ACF.
Applsci 16 01256 g003
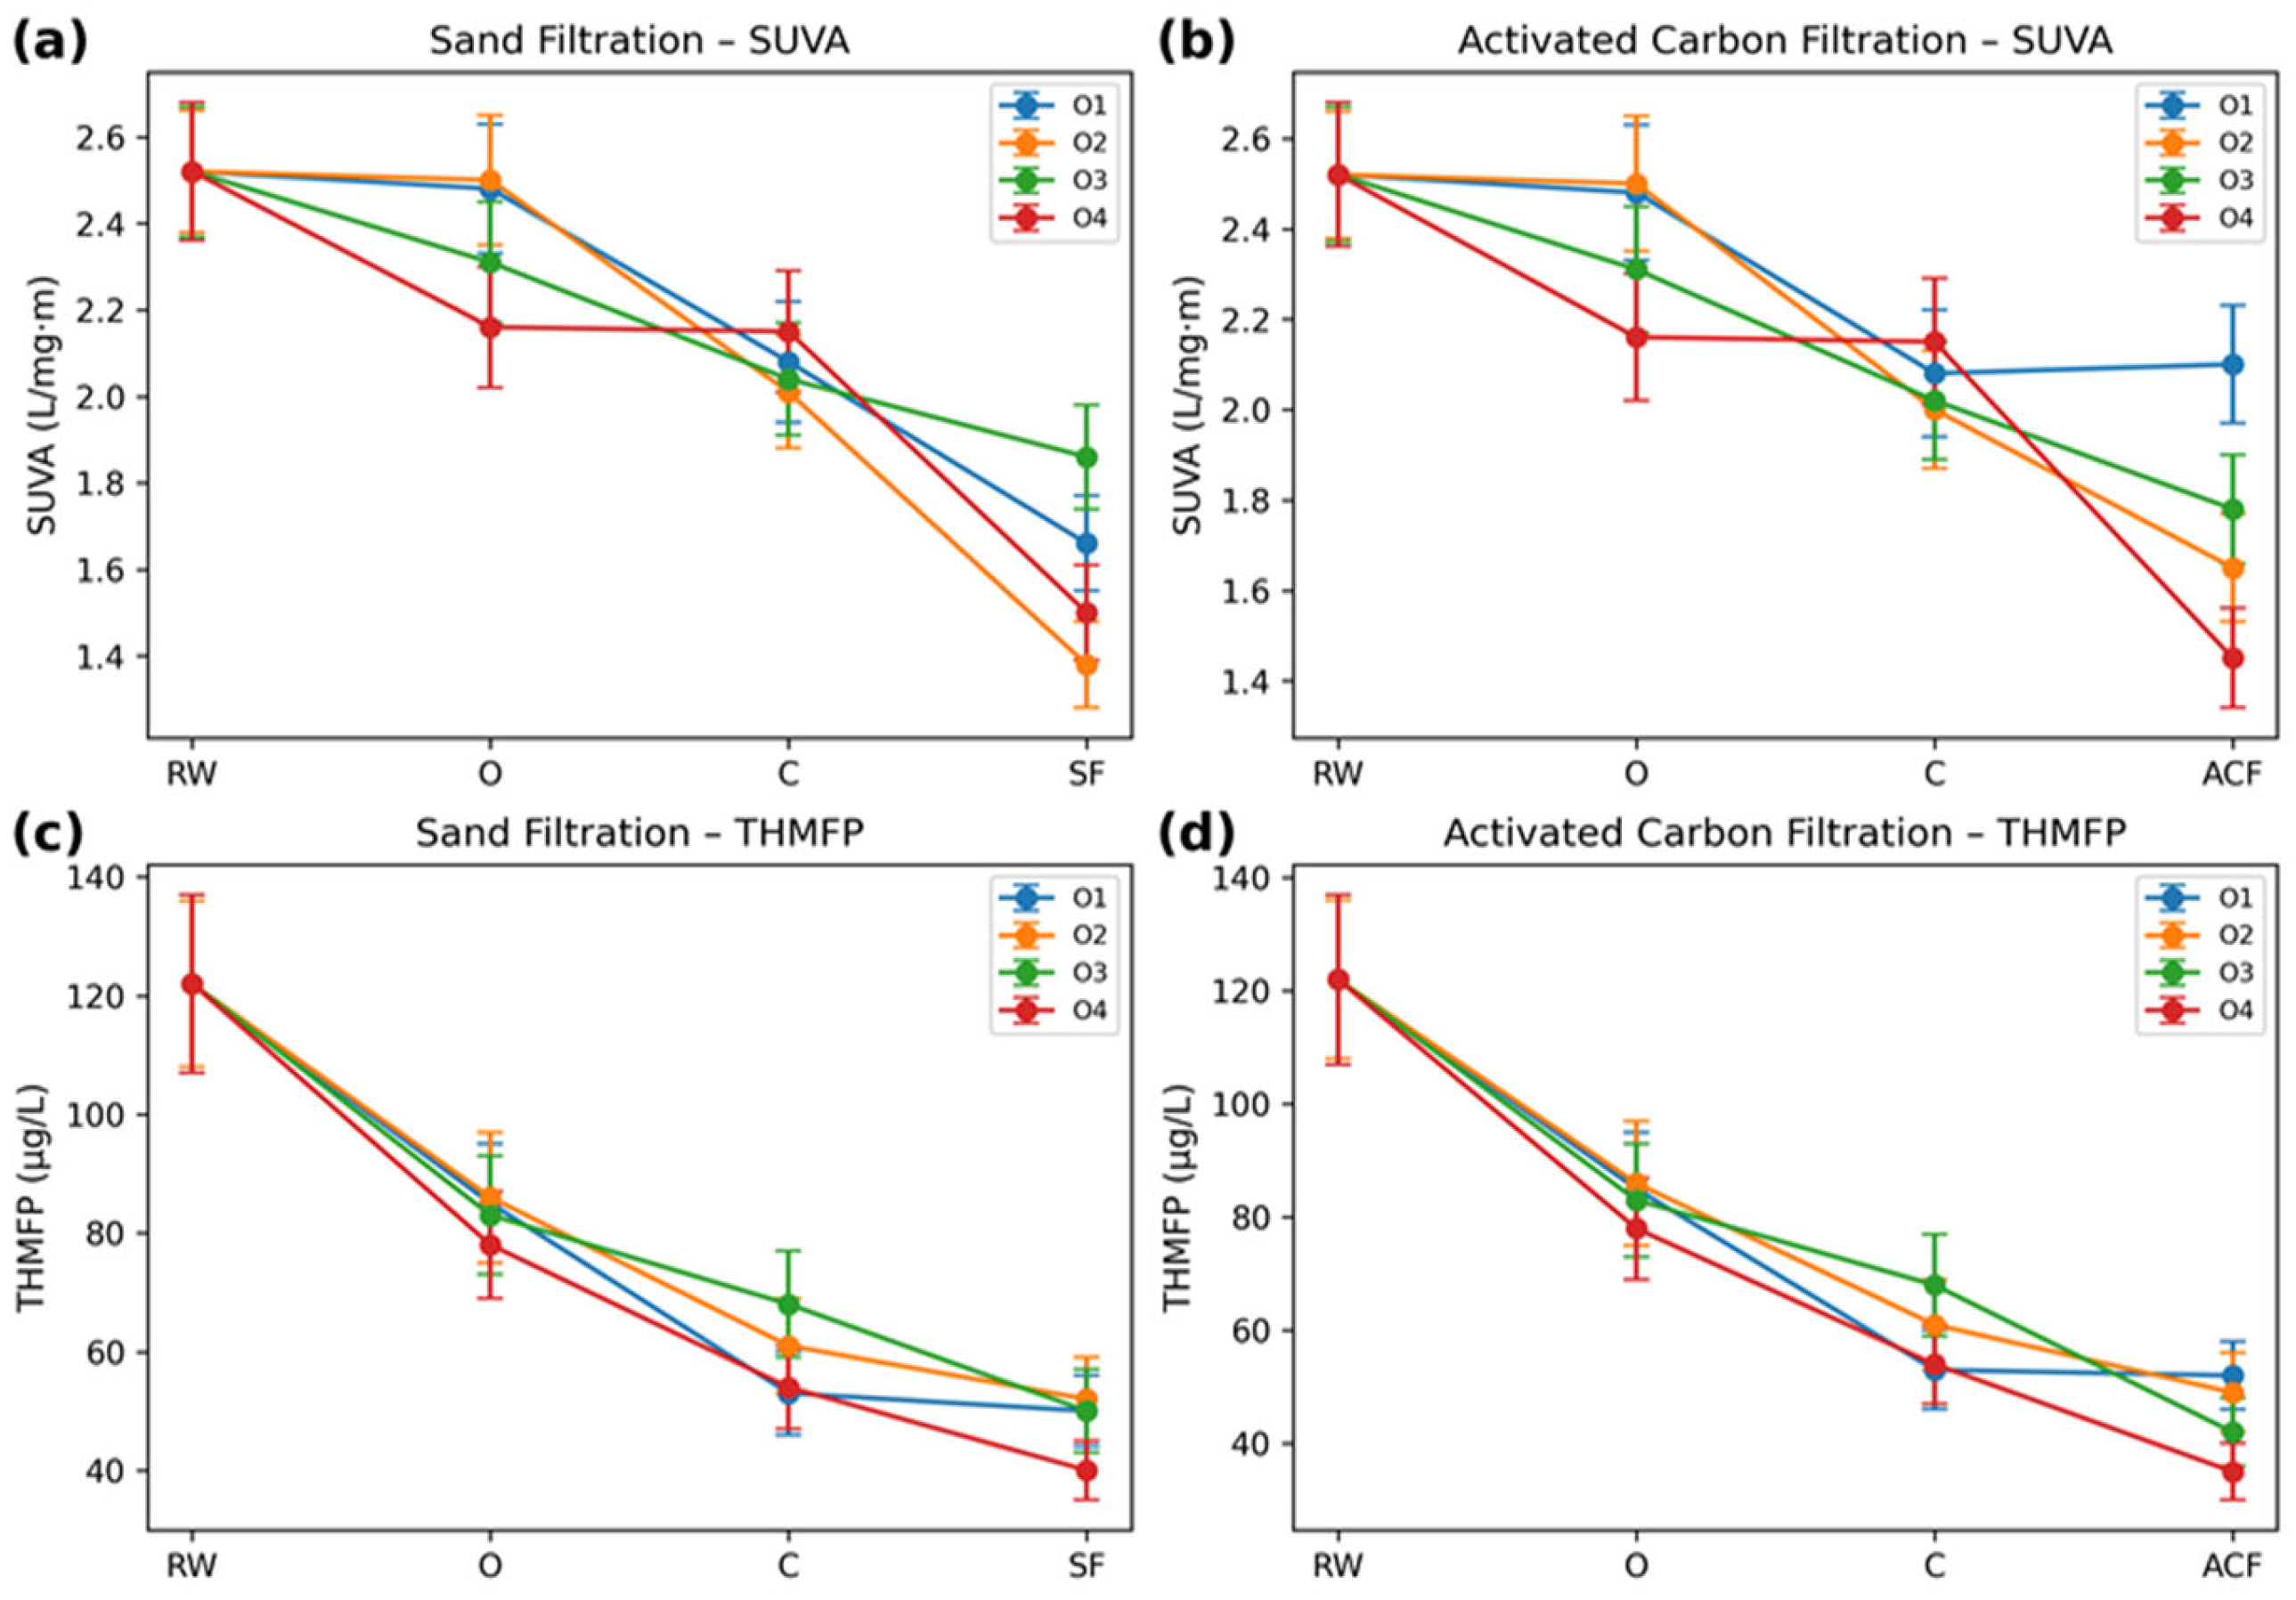
Under pre-ozonation conditions, ozone is applied directly to raw water rich in aromatic and humic constituents, resulting in a chemically heterogeneous DOM matrix entering subsequent filtration steps. The Train 3 configuration, in which granular activated carbon filtration is applied following pre-ozonation, produces a more coherent yet still moderate response in terms of both SUVA and THMFP, clearly demonstrating the stabilizing role of adsorption on an oxidatively transformed DOM pool (Figure 4b,d). Following pre-ozonation, SUVA values remain within the range of 2.16–2.50 L·mg−1·m−1 across O1–O4 conditions, indicating that although ozone partially disrupts aromatic chromophores, a substantial degree of optical heterogeneity is preserved. After coagulation, SUVA converges to a narrower interval of approximately 2.00–2.15 L·mg−1·m−1, reflecting the selective removal of high-molecular-weight, UV-absorbing humic fractions.
Subsequent activated carbon filtration induces a pronounced additional decrease in SUVA, with values converging from approximately ~2.10 L·mg−1·m−1 to ~1.45 L·mg−1·m−1 and exhibiting markedly reduced variability across ozonation conditions (Figure 4b). This convergence demonstrates that activated carbon preferentially adsorbs aromatic and micro-reactive fractions generated during pre-ozonation, thereby stabilizing DOM composition rather than fundamentally altering transformation pathways. Similar smoothing effects of post-oxidation adsorption on DOM optical properties have been widely reported [27,41]. With respect to THMFP, values decrease consistently along the treatment sequence. Following pre-ozonation, THMFP remains within the range of 78–86 µg·L−1, decreases to 52.8–68 µg·L−1 after coagulation, and is further reduced to 34–50.9 µg·L−1 following granular activated carbon filtration (Figure 4d). Compared with sand filtration, the narrower THMFP distribution observed after activated carbon filtration indicates that adsorption effectively suppresses residual chlorine-reactive precursors that persist after oxidation and clarification. Although the absolute reductions are relatively modest, the coupled convergence of SUVA and THMFP demonstrates that activated carbon filtration functions as a complementary control step that selectively suppresses residual reactive DOM fractions and enhances overall chemical stability within the pre-ozonation treatment train.
Figure 4. SUVA and THMFP responses under different pre-ozonation conditions (O1 = 0.5 mg/L–5 min, O2 = 0.5 mg/L–20 min, O3 = 2.0 mg/L–5 min, O4 = 2.0 mg/L–20 min) followed by coagulation, sand filtration (SF) and activated carbon filtration (ACF), with RW (raw water), O (pre-ozonation). (a) SUVA values for pre-ozonation before SF, (b) SUVA values for pre- ozonation before ACF, (c) THMFP values for pre-ozonation before SF, (d) THMFP values pre-ozonation before ACF.
Applsci 16 01256 g004
Following pre-ozonation, coagulation and subsequent sand filtration (Train 4) exert a comparatively limited additional influence on both SUVA and THMFP, indicating that physical filtration provides only weak control over the chemically transformed DOM pool generated during ozonation (Figure 4a,c). After sand filtration, SUVA decreases slightly but remains distributed within a narrow yet heterogeneous range of approximately 1.37–1.86 L·mg−1·m−1, with no clear dose–response separation among ozonation conditions (Figure 4a). This pattern indicates that sand filtration marginally reduces bulk aromaticity but does not exert systematic or selective control over DOM optical characteristics. Unlike activated carbon filtration, sand filtration does not promote convergence of SUVA responses, underscoring its limited affinity for oxidized aromatic or chromophoric DOM fractions.
A similar pattern is observed for THMFP following sand filtration, with values remaining clustered at approximately 40.3–52.4 µg·L−1 across ozonation conditions (Figure 4c). The absence of a pronounced dose-dependent separation, together with the persistence of relatively high THMFP levels, indicates that chlorine-reactive precursor pools are only weakly affected by sand filtration after ozonation. These results confirm that, under pre-ozonation conditions, sand filtration functions primarily as a physical and hydraulic control process rather than as an effective barrier for dissolved aromatic compounds or low-molecular-weight oxidation products [9,32]. In contrast to adsorption-based filtration, sand filtration lacks the capacity to selectively remove oxidized, non-chromophoric yet highly reactive DOM fractions that disproportionately contribute to DBP formation.
Overall, these quantitative trends demonstrate that under pre-ozonation conditions, filtration primarily governs the dispersion and uniformity of DOM transformation rather than its extent, whereas under final ozonation it predominantly controls the optical expression of chemically evolving DOM. In both cases, the compression and convergence of SUVA limit the effectiveness of linear surrogate-based interpretation, underscoring the need for modelling approaches capable of resolving subtle, process-dependent changes in DOM reactivity that are no longer directly observable through bulk optical parameters alone [2,33,34]. These observations also highlight why surrogate-based prediction performance should be interpreted within clearly defined process boundaries, particularly when nonlinear modelling approaches are applied to ozonation-driven systems. Regression diagnostics for the train-level linear models are provided in the Supplementary Materials (Figures S5–S7). Residual versus fitted plots did not reveal systematic patterns indicative of non-linearity or heteroscedasticity, and normal Q–Q plots showed acceptable normality given the experimental sample size.
To evaluate ANN robustness beyond internal validation, a day-wise external validation was performed by completely withholding one experimental day from all stages of model training, validation, and internal testing. Using the standard 70–15–15 internal data split, the ANN achieved an R2 of 0.91 with RMSE and MAE values of 11.17 and 9.59, respectively. When evaluated on the withheld day as an external test, model performance remained high (R2 = 0.88, RMSE = 11.84, MAE = 9.10), demonstrating robust predictive capability under unseen experimental conditions. Detailed external validation results are provided in the Supplementary Materials (Table S2). The close agreement between internal training, validation, and test results and the performance under external validation further indicates that the ANN is not overfitted. In particular, the consistency of predictive accuracy under the withheld-set external test suggests that the observed performance gains arise from genuine nonlinear structure in the data rather than memorization or record-wise information leakage.

3.2. Effect of Ozonation Placement on SUVA–THMFP Relationships

3.2.1. Final-Ozonation Dynamics

In the Train 1 configuration, granular activated carbon removes a broad spectrum of DOM—including hydrophobic aromatics and a portion of low-molecular-weight precursors—resulting in a residual DOM pool that is optically subdued but still chemically reactive. This phenomenon has been documented by Croué [31], who reported that post-ACF DOM often appears optically dull while retaining micro-reactive functional groups capable of forming DBPs [30]. Because ACF selectively eliminates strongly UV-absorbing material, the remaining DOM exhibits minimal variation in SUVA, even under different ozonation doses, creating a compressed optical range similar to that observed in the Train 2 configuration. Despite this optical compression, THMFP continues to decline substantially after final ozonation, reflecting chemical changes that SUVA cannot capture. Consequently, linear regression again yields weak performance (R2 = 0.67, RMSE = 5.3 µg/L), as the model is unable to relate small SUVA differences to large shifts in precursor reactivity (Table 3). The ANN, however, achieved the highest accuracy among all configurations (R2 = 0.95–0.99; RMSE ≈ 2.4 µg/L), capturing the layered transformations introduced by sequential adsorption and ozonation (Table 4). This demonstrates that the nonlinear behaviour of DOM in this configuration—where optical signals remain nearly constant despite substantial changes in DBP precursor activity—cannot be represented by a single-slope linear model.
The comparison between the single-split ANN performance reported in Table 4 and the results obtained under grouped cross-validation (see Supplementary Materials, Table S3) provides important insights into the scope and limitations of SUVA-based predictions. While ANN models achieve very high accuracy within individual ozonation–filtration configurations, their performance becomes more conservative when evaluated under grouped validation, where entire ozonation conditions (O1–O4) are withheld from training. This behaviour aligns with the process-dependent nature of dissolved organic matter transformation during ozonation, where the SUVA–THMFP relationship shifts across different oxidation regimes. Importantly, even under this leakage-resistant grouped validation, the ANN models retain predictive capability and generally outperform linear regression, indicating that SUVA contains latent, configuration-specific information that can be extracted through nonlinear modelling, though with limited cross-condition generalizability. Regression coefficients and goodness-of-fit metrics for the linear regression models are reported for each treatment train in Table 2 and Table 3. In the present study, linear regression is employed as a comparative baseline model to contextualize the performance of the nonlinear ANN approach, rather than as a standalone inferential framework. Accordingly, formal heteroscedasticity testing (e.g., Breusch–Pagan test) and the reporting of confidence intervals were not included. This scope is explicitly acknowledged to emphasize that the primary role of the linear regression analysis is to benchmark ANN performance under different ozonation–filtration configurations. In addition, the external and grouped validation results (Tables S2 and S3) confirm that the observed performance gains reflect configuration-specific nonlinear structures rather than stable predictive generalization across all conditions. This emphasizes that surrogate-based prediction performance should be interpreted within well-defined process boundaries, particularly when nonlinear modelling approaches are applied to ozonation-driven systems.
The close agreement between training, validation, and external test performance further indicates that the ANN model is not overfitted. In particular, the consistency of predictive accuracy obtained from the process-train holdout validation confirms that the observed performance gains arise from genuine nonlinear relationships in the data rather than from memorization or information leakage.
The external validation results obtained from the process-train holdout confirm that the observed predictive gains arise from genuine nonlinear structure in the SUVA–THMFP relationship rather than from record-wise information leakage or overfitting. However, because validation remains confined to a single intake and operational regime, the results should be interpreted as process-specific rather than broadly generalizable.
The objective of the present analysis was not to fully decouple all chemical and catalytic contributions to DBP formation, but to evaluate how ozonation alters the interpretability of SUVA as an operational surrogate when benchmarked against non-ozonated filtration baselines. Within this process-oriented framework, unmeasured bromide, ammonia, and catalytic metals represent acknowledged scope limitations rather than experimental oversights.
To further assess model robustness and to minimize the risk of information leakage, ANN performance was additionally evaluated using a grouped validation approach in which entire ozonation conditions were withheld from training. Under this more conservative validation framework, predictive performance was reduced compared with the single-split results reported in Table 4, reflecting the strong process dependence of SUVA–THMFP relationships across different oxidation regimes. Nevertheless, ANN models retained meaningful predictive capability and consistently outperformed linear regression, indicating that SUVA contains latent, configuration-specific information that can be extracted through nonlinear modelling, albeit with limited cross-condition generalizability.
In the Train 2 configuration, coagulation followed by sand filtration removes a substantial fraction of particulate and hydrophobic NOM; however, sand filtration preferentially eliminates low-aromatic, hydrophilic components rather than strongly chromophoric humic substances. As a result, the residual DOM pool becomes more compositionally homogeneous and appears proportionally more aromatic, despite an overall reduction in organic matter concentration. This selective removal behaviour is consistent with previous studies reporting minimal changes or slight increases in SUVA following granular media filtration, attributed to the preferential loss of non-UV-absorbing fractions [3,32]. Following final ozonation, SUVA therefore exhibits only limited variation, whereas THMFP decreases substantially, producing a clear example of spectral–reactive decoupling in which bulk optical properties no longer track the abundance of chlorine-reactive precursors (Figure 3a,c).
This decoupling is quantitatively reflected in model performance. For Train 2, linear regression explains only 63% of the variance in THMFP (R2 = 0.63) and yields a relatively high prediction error (RMSE = 7.2 µg/L; Table 2), indicating that a single linear SUVA–THMFP relationship is insufficient under these conditions. In contrast, the ANN model achieves markedly higher predictive accuracy, with R2 values ranging from 0.94 to 0.98 and substantially lower RMSE value (2.8 µg/L; Table 4). This represents an approximate 60% reduction in prediction error relative to linear regression, despite the muted SUVA response.
These results demonstrate that, under sand filtration–dominated treatment sequences followed by final ozonation, chemically meaningful transformations in DOM reactivity occur within an optically constrained domain. While linear regression fails to resolve these masked dynamics, the ANN model successfully captures the underlying nonlinear relationships, confirming that DBP precursor evolution proceeds largely independently of bulk optical indicators in this regime. Consequently, single-slope linear models are inadequate for surrogate-based THMFP prediction, whereas nonlinear learners provide a robust alternative when SUVA sensitivity is compressed. The ANN was therefore employed as a minimal nonlinear benchmark rather than a fully optimized machine learning model, with the objective of evaluating whether SUVA contains process-dependent nonlinear information related to THMFP following ozonation.

3.2.2. Pre-Ozonation Dynamics

Pre-ozonation significantly reduces SUVA due to the rapid and selective reaction of ozone with electron-rich aromatic chromophores, particularly phenolic and conjugated structures that dominate the UV254 signal. This behaviour is consistent with established ozonation mechanisms, whereby ozone preferentially targets activated aromatic rings and unsaturated bonds [20,41]. Clear dose–response separation among the O1–O4 conditions observed in Figure 4a,b confirms that increasing ozone exposure progressively intensifies the disruption of aromatic moieties.
In contrast, the corresponding reductions in THMFP shown in Figure 4c,d are more moderate and exhibit weaker dose dependence, highlighting a fundamental mechanistic distinction between chromophore destruction and DBP precursor elimination. Ozonation-induced ring opening and fragmentation of humic macromolecules generate smaller, oxygenated intermediates—such as aldehydes, ketones, α-dicarbonyl compounds, and short-chain carboxylic acids—that display limited absorbance at 254 nm but retain high reactivity toward free chlorine [3,11]. As a result, THM formation potential may persist despite substantial decreases in SUVA. Similar decoupling between UV absorbance loss and DBP precursor removal has been widely reported, with several studies demonstrating that rapid declines in SUVA are not accompanied by proportional reductions in THMFP following ozonation [20,24,27]. In some cases, pre-ozonation has even been shown to enhance the formation potential of certain DBP classes by generating low-molecular-weight, highly reactive precursors that are poorly captured by optical surrogates [5].
These chemically nonlinear transformation pathways are directly reflected in model performance under pre-ozonation conditions. Linear regression models, which assume a proportional and monotonic relationship between SUVA and THMFP, exhibit only moderate predictive capability. For pre-ozonation followed by sand filtration (Train 4), linear regression yields R2 = 0.71 with an RMSE of 6.8 µg·L−1, while for pre-ozonation followed by activated carbon filtration (Train 3), performance improves only marginally (R2 = 0.76; RMSE = 5.9 µg·L−1), as summarized in Table 3. Residual diagnostics suggest mild-to-moderate curvature and configuration-dependent deviations, reflecting the fact that SUVA declines more rapidly than THMFP and confirming a violation of linearity assumptions. These results underscore the inability of single-slope models to represent the branching and pathway-dependent reaction mechanisms introduced by ozonation. Although regression diagnostics indicate that the assumptions of linear regression are reasonably satisfied (Supplementary Figures S5–S8), the moderate R2 values and configuration-dependent variability highlight the limitations of linear models in capturing non-linear transformations induced by ozonation and filtration processes.
In contrast, artificial neural network (ANN) models capture these nonlinear patterns with substantially higher accuracy. For pre-ozonation configurations, ANN performance reaches R2 = 0.92–0.95 with an RMSE of 3.8 µg·L−1 for Train 4, and R2 = 0.88–0.93 with an RMSE of 4.5 µg·L−1 for Train 3, as reported in Table 4. This marked improvement demonstrates the ANN’s capacity to learn complex, non-proportional relationships arising from oxidative DOM restructuring, even when SUVA is used as the sole input variable.
The superior performance of the ANN further suggests that SUVA implicitly encodes process-dependent information related to DOM composition and reactivity that becomes accessible only through nonlinear modelling. Similar conclusions have been drawn in earlier DBP prediction studies, where ANN and other nonlinear algorithms consistently outperformed linear regression under ozonation and advanced oxidation conditions [29,34,42]. Collectively, these findings confirm that DOM transformation during pre-ozonation is inherently nonlinear and that surrogate-based DBP prediction under such conditions requires modelling frameworks capable of resolving decoupled optical and chemical responses.

3.3. Mechanistic Comparisons

Any references to low-molecular-weight oxygenated compounds in the following discussion are provided for contextual interpretation based on the established literature, rather than as experimentally verified species within the present dataset.
The mechanistic comparison across treatment configurations indicates that linear regression provides only a coarse representation of the SUVA–THMFP relationship, as reflected in the modest coefficients of determination and comparatively high prediction errors observed under both pre-ozonation and final-ozonation conditions. These trends are consistent with the curvature, scatter, and signal compression evident in Figure 3 and Figure 4, where reductions in SUVA do not translate proportionally into decreases in THMFP. Across both sand filtration and activated carbon filtration configurations, oxidative and adsorptive processes restructure dissolved organic matter (DOM) in ways that weaken simple linear associations between optical surrogates and chemical reactivity.
By contrast, artificial neural network (ANN) models demonstrate substantially improved predictive performance across all treatment trains. This improvement reflects the ability of nonlinear learners to accommodate the decoupling between chromophoric destruction and disinfection by-product (DBP) precursor reactivity that arises during ozonation and adsorption. Early applications of neural networks in DBP modelling already suggested that nonlinear approaches could outperform conventional multivariate regression, even when based on a limited number of bulk water quality parameters [29,34,43]. These studies emphasized that surrogate parameters often contain latent information related to DOM composition and reactivity that is expressed in a fundamentally nonlinear manner. However, when evaluated under grouped cross-validation that withholds entire ozonation conditions, ANN performance becomes more conservative. This behaviour reflects the inherent process dependence of the SUVA–THMFP relationship. This behaviour confirms that the observed predictive gains arise from genuine nonlinear structure in the data rather than from information leakage between adjacent process states.
Accordingly, ANN outcomes are interpreted here as a nonlinear modelling approach that reveals configuration-dependent deviations and signal compression effects induced by ozonation, rather than as a claim of universal predictive generalization from limited data. This interpretation aligns with the broader DBP literature showing that nonlinear ML approaches frequently outperform linear regression when DOM undergoes substantial chemical restructuring during treatment.
More recent comparative investigations have reinforced this conclusion, demonstrating that nonlinear and machine learning-based models—including artificial neural networks, random forests, support vector regression, and hybrid deep-learning architectures—consistently outperform linear approaches under conditions where DOM undergoes significant chemical restructuring [42,44,45,46,47,48,49]. Such conditions are characteristic of treatment trains incorporating ozonation and granular activated carbon filtration, where optical surrogate signals become compressed while precursor reactivity continues to evolve within an optically muted domain.
In this context, the present study demonstrates that even single-parameter ANN models are capable of extracting process-dependent information embedded in SUVA under ozonation-dominated treatment regimes where linear models exhibit systematic limitations. Rather than replacing conventional surrogate approaches, these findings indicate that ANN-based models can function as a complementary predictive tool for DBP formation potential, particularly in chemically mature and optically constrained systems. This interpretation is consistent with both classical ozonation theory and the contemporary machine learning literature, and it supports the cautious integration of nonlinear modelling frameworks into surrogate-based DBP monitoring and control strategies.
The observed reduction in ANN performance under external, train-wise validation is consistent with expectations for an independent test scenario and reflects realistic generalization behaviour rather than model deficiency. Importantly, the preservation of high predictive accuracy under unseen experimental groups confirms that the ANN captures reproducible, within-regime nonlinear relationships between SUVA and THMFP, rather than artefacts associated with record-wise data proximity. At the same time, the variability observed across withheld ozonation conditions highlights the inherently process-dependent nature of DOM transformation during oxidation, underscoring that surrogate-based predictions should be interpreted within clearly defined treatment boundaries.
This study is subject to deliberate scope limitations, including reliance on a single intake, absence of seasonal variability, a modest dataset size, and external validation confined to within-intake process-train separation. These constraints preclude broad model generalization and are not intended to support predictive deployment. Instead, they reflect a controlled experimental design aimed at evaluating the interpretability limits of SUVA as a standalone operational indicator under ozonation–filtration conditions.
A key limitation of this study is the absence of molecular-level characterization of ozonation by-products, including aldehydes, ketones, α-dicarbonyls, and short-chain acids. Consequently, causal attribution of DBP precursor transformation pathways is not possible within the present dataset. Comprehensive chemical analyses using advanced spectroscopic and chromatographic techniques are therefore required to complement the empirical findings reported here and represent an important direction for future work.

4. Conclusions

This study demonstrates that the relationship between specific ultraviolet absorbance (SUVA) and trihalomethane formation potential (THMFP) is strongly process-dependent and becomes increasingly nonlinear under ozonation-dominated treatment conditions. While SUVA reliably reflects dissolved organic matter (DOM) aromaticity in raw and minimally treated waters, ozonation and subsequent filtration steps fragment aromatic macromolecules into smaller, oxygenated intermediates that retain chlorine reactivity but exhibit limited UV absorbance. As a result, optical surrogate parameters and THM precursor abundance become progressively decoupled, constraining the applicability of conventional linear, single-parameter prediction approaches.
Within this context, artificial neural network (ANN) modelling using SUVA as the sole input consistently outperformed linear regression across all treatment configurations. Importantly, the improved performance of the ANN was not merely a numerical artefact, but reflected its ability to resolve nonlinear, process-dependent information embedded in SUVA, even under optically compressed and chemically evolved DOM conditions following ozonation. The consistency observed between internal validation, external process-train holdout testing, and grouped cross-validation further indicates that the model captures genuine structure in the data rather than overfitting sample-specific noise, despite the intentionally limited dataset size.
Overall, these findings indicate that, although SUVA alone cannot be interpreted as a universally linear surrogate for THMFP, it retains meaningful process-dependent information that can be effectively extracted through nonlinear learning. The results support the use of ANN-based surrogate modelling as a practical and robust approach for THMFP estimation in advanced drinking-water treatment systems, enabling reliable process-level assessment without the need for expanded analytical parameter sets or species-specific DBP measurements.

Supplementary Materials

The following supporting information can be downloaded at: https://www.mdpi.com/article/10.3390/app16031256/s1, Table S1. Performance of the ANN model under grouped 4-fold cross-validation using ozonation-condition–constrained folds.Table S2. Internal and external validation performance of the ANN model based on a withheld experimental group approach. External validation was performed by completely excluding one ozonation group (O1–O4) from all stages of ANN training, validation, and internal testing. Performance metrics include R2, RMSE, and MAE for both internal (remaining groups, 70–15–15 split) and external evaluations. Table S3. ANN performance under grouped 4-fold cross-validation stratified by ozonation condition, based on repeated model runs. Mean ± standard deviation of R2 and RMSE values are reported for each treatment train to assess robustness. Table S4. Sensitivity analysis of ANN performance to hidden-layer size and activation function. Mean ± standard deviation of R2 and RMSE values are reported across repeated model runs. Table S5. Normalization ranges used for min–max scaling Table S6. Sensitivity analysis: hidden-layer size and activation function. Figure S1. Effect of pH on turbidity and UV absorbance removal during coagulation with FeCl3·6H2O. Figure S2. Effect of FeCl3·6H2O concentration on turbidity and UV absorbance removal at pH 5.5. Figure S3. Effect of cationic polyelectrolyte concentration on turbidity and UV absorbance removal at pH 5.5 and 27 mg/L FeCl3·6H2O. Figure S4. Effect of anionic polyelectrolyte concentration on turbidity and UV absorbance removal during coagulation at pH 5.5 and 27 mg/L FeCl3·6H2O. Figure S5. Configuration-level linear regression R2 values ordered by treatment train. Figure S6. Residual versus fitted value plots for the linear regression models of Train 1–4 (panels a–d). Figure S7. Normal Q–Q plots of standardized residuals for the linear regression models of Train 1–4 (panels a–d). Figure S8. Training and validation loss histories (learning curves).

Funding

This research received no external funding.

Institutional Review Board Statement

Not applicable.

Informed Consent Statement

Not applicable.

Data Availability Statement

The original contributions presented in this study are included in the article. Further inquiries can be directed to the corresponding author.

Conflicts of Interest

The author declares no conflict of interest.

References

  1. Edzwald, J.K.; Tobiason, J.E. Enhanced coagulation: US requirements and a broader view. Water Sci. Technol. 1999, 40, 63–70. [Google Scholar] [CrossRef]
  2. Weishaar, J.L.; Aiken, G.R.; Bergamaschi, B.A.; Fram, M.S.; Fujii, R.; Mopper, K. Evaluation of specific ultraviolet absorbance as an indicator of the chemical composition and reactivity of dissolved organic carbon. Environ. Sci. Technol. 2003, 37, 4702–4708. [Google Scholar] [CrossRef]
  3. Hua, G.; Reckhow, D.A. Characterization of disinfection by-product precursors based on hydrophobicity and molecular size. Environ. Sci. Technol. 2007, 41, 3309–3315. [Google Scholar] [CrossRef] [PubMed]
  4. Chow, C.W.K.; Fabris, R.; van Leeuwen, J.; Wang, D.; Drikas, M. Assessing natural organic matter treatability using UV absorbance spectroscopy. Water Res. 2009, 43, 392–400. [Google Scholar] [CrossRef]
  5. Von Gunten, U. Ozonation of drinking water: Part I. Oxidation kinetics and product formation. Water Res. 2003, 37, 1443–1467. [Google Scholar] [CrossRef] [PubMed]
  6. Hua, G.; Reckhow, D.A. Effect of pre-ozonation on the formation and speciation of disinfection byproducts. Water Res. 2007, 41, 1667–1678. [Google Scholar] [CrossRef]
  7. Korshin, G.V.; Li, C.W.; Benjamin, M.M. Monitoring the properties of natural organic matter through UV spectroscopy: A consistent theory. Water Res. 1997, 31, 1787–1795. [Google Scholar] [CrossRef]
  8. Bond, T.; Templeton, M.R.; Graham, N.J.D. Precursors of nitrogenous disinfection by-products in drinking water—A critical review and analysis. J. Hazard. Mater. 2012, 235–236, 1–16. [Google Scholar] [CrossRef]
  9. Rosario-Ortiz, F.L.; Snyder, S.A.; Suffet, I.H. Characterization of dissolved organic matter in drinking water sources impacted by multiple tributaries. Water Res. 2007, 41, 4115–4128. [Google Scholar] [CrossRef]
  10. Krasner, S.W.; Westerhoff, P.; Chen, B.; Rittmann, B.E.; Nam, S.-N.; Amy, G. Impact of ozonation on the formation of disinfection by-products. Water Res. 2009, 43, 469–479. [Google Scholar] [CrossRef]
  11. Bond, T.; Huang, J.; Templeton, M.R.; Graham, N. Occurrence and control of nitrogenous disinfection by-products in drinking water—A review. Water Res. 2012, 46, 4433–4450. [Google Scholar] [CrossRef]
  12. DeMont, I.; Anderson, L.E.; Bennett, J.L.; Sfynia, C.; Bjorndahl, P.; Jarvis, P.; Stoddart, A.K.; Gagnon, G.A. Monitoring natural organic matter in drinking water treatment with photoelectrochemical oxygen demand. AWWA Water Sci. 2024, 6, e1378. [Google Scholar] [CrossRef]
  13. Wang, Y.; Li, L.; Sun, Z.; Dong, H.; Yu, J.; Qiang, Z. Removal of Disinfection By-Product Precursors in Drinking Water Treatment Processes: Is Fluorescence Parallel Factor Analysis a Promising Indicator? J. Hazard. Mater. 2021, 418, 126298. [Google Scholar] [CrossRef] [PubMed]
  14. Staehelin, J.; Hoigné, J. Decomposition of ozone in water: Rate of initiation by hydroxide ions and hydrogen peroxide. Environ. Sci. Technol. 1982, 16, 676–681. [Google Scholar] [CrossRef]
  15. Hoigné, J.; Bader, H. Rate constants of reactions of ozone with organic and inorganic compounds in water. Water Res. 1983, 17, 173–183. [Google Scholar] [CrossRef]
  16. Glaze, W.H.; Kang, J.-W.; Chapin, D.H. The chemistry of water treatment processes involving ozone, hydrogen peroxide and ultraviolet radiation. Ozone Sci. Eng. 1987, 9, 335–352. [Google Scholar] [CrossRef]
  17. Siddiqui, M.S.; Amy, G.L.; Murphy, B.D. Ozone enhanced removal of natural organic matter from drinking water sources. Water Res. 1997, 31, 3098–3106. [Google Scholar] [CrossRef]
  18. Camel, V.; Bermond, A. Ozonation of natural organic matter in water: A review. Water Res. 1998, 32, 3208–3222. [Google Scholar] [CrossRef]
  19. Siddique, M.S.; Lu, H.; Xiong, X.; Fareed, H.; Graham, N.; Yu, W. Exploring impacts of water-extractable organic matter on pre-ozonation followed by nanofiltration process: Insights from pH variations on DBPs formation. Sci. Total Environ. 2023, 876, 162695. [Google Scholar] [CrossRef]
  20. Deborde, M.; von Gunten, U. Reactions of chlorine with inorganic and organic compounds during water treatment—Kinetics and mechanisms. Water Res. 2008, 42, 13–51. [Google Scholar] [CrossRef]
  21. Phungsai, P.; Kurisu, F.; Kasuga, I.; Furumai, H. Molecular Characteristics of Dissolved Organic Matter Transformed by O3 and O3/H2O2 Treatments and the Effects on Formation of Unknown Disinfection By-Products. Water Res. 2019, 159, 214–222. [Google Scholar] [CrossRef] [PubMed]
  22. Huber, M.M.; Canonica, S.; Park, G.-Y.; von Gunten, U. Oxidation of pharmaceuticals during ozonation and advanced oxidation processes. Environ. Sci. Technol. 2003, 37, 1016–1024. [Google Scholar] [CrossRef]
  23. Wert, E.C.; Rosario-Ortiz, F.L.; Snyder, S.A. Using ultraviolet absorbance to assess disinfection by-product precursor reactivity. Water Res. 2007, 41, 2413–2423. [Google Scholar] [CrossRef]
  24. Chiang, P.-C.; Chang, E.-E.; Liang, C.-H.; Chen, Y.-J. Formation of disinfection by-products during ozonation and advanced oxidation processes. Chemosphere 2019, 217, 317–325. [Google Scholar] [CrossRef]
  25. Mash, H.E.; Westerhoff, P. Dissolved organic matter molecular weight distribution and reactivity after ozonation. Water Res. 2005, 39, 3641–3650. [Google Scholar] [CrossRef]
  26. Hu, J.; Song, H.; Karanfil, T. Comparative analysis of halonitromethanes and trihalomethanes formation potentials. Environ. Sci. Technol. 2010, 44, 7950–7956. [Google Scholar]
  27. Matilainen, A.; Vepsäläinen, M.; Sillanpää, M. Natural organic matter removal by coagulation during drinking water treatment. Adv. Colloid Interface Sci. 2011, 159, 189–197. [Google Scholar] [CrossRef]
  28. Velten, S.; Knappe, D.R.U.; Traber, J.; Kaiser, H.-P.; von Gunten, U.; Boller, M.; Meylan, S. Characterization of natural organic matter adsorption in granular activated carbon filters. Water Res. 2011, 45, 395–407. [Google Scholar] [CrossRef]
  29. Newcombe, G.; Drikas, M. Adsorption of natural organic matter onto activated carbon: Electrostatic and non-electrostatic effects. Carbon 2007, 45, 1977–1983. [Google Scholar] [CrossRef]
  30. Kennedy, A.M.; Reinert, A.M.; Knappe, D.R.U.; Ferrer, I.; Summers, R.S. Full-scale granular activated carbon adsorption of organic micropollutants. Water Res. 2015, 68, 337–348. [Google Scholar] [CrossRef]
  31. Croué, J.-P. Isolation of humic and non-humic fractions of natural organic matter: Structural characterization and reactivity. Environ. Monit. Assess. 2004, 92, 193–207. [Google Scholar] [CrossRef] [PubMed]
  32. Golfinopoulos, S.K.; Nikolaou, A.D. Disinfection by-products and their predictive models in drinking water—A review. Chemosphere 2005, 59, 889–907. [Google Scholar] [CrossRef]
  33. Najm, I.; Snoeyink, V.L.; Richard, Y. Effect of particle size and background water quality on adsorption of organic compounds. J. Am. Water Works Assoc. 1994, 86, 70–81. [Google Scholar]
  34. Wu, Y.; Zhang, H.; Liu, Y. Machine learning models for predicting disinfection by-product formation. Sci. Total Environ. 2020, 712, 136486. [Google Scholar]
  35. Zeng, Q.; Li, X.; Zhang, Y. Nonlinear modelling of disinfection by-product formation using ensemble learning approaches. Water Res. 2023, 233, 119765. [Google Scholar]
  36. Zhang, Y.; Wang, X.; Chen, J. Hybrid deep-learning models for surrogate-based DBP prediction. J. Hazard. Mater. 2024, 453, 131345. [Google Scholar] [CrossRef]
  37. Ribas, F.; Frias, J.; Lucena, F. Biodegradable dissolved organic carbon determination in drinking water. Water Res. 1991, 25, 719–727. [Google Scholar]
  38. APHA; AWWA; WEF. Standard Methods for the Examination of Water and Wastewater, 23rd ed.; Method 5710 B; American Public Health Association: Washington, DC, USA, 2017. [Google Scholar]
  39. Kulkarni, P.; Chellam, S. Disinfection by-product formation following chlorination of drinking water: Artificial neural network models and changes in speciation with treatment. Sci. Total Environ. 2010, 408, 4202–4210. [Google Scholar] [CrossRef]
  40. Lowe, M.; Qin, R.; Mao, X. A Review on Machine Learning, Artificial Intelligence, and Smart Technology in Water Treatment and Monitoring. Water 2022, 14, 1384. [Google Scholar] [CrossRef]
  41. Kristiana, I.; Joll, C.A.; Heitz, A. Powdered activated carbon adsorption of natural organic matter. Water Res. 2010, 44, 377–386. [Google Scholar] [CrossRef]
  42. Trueman, B.F.; MacIsaac, S.A.; Stoddart, A.K.; Gagnon, G.A. Prediction of disinfection by-product formation in drinking water via fluorescence spectroscopy. Environ. Sci. Water Res. Technol. 2016, 2, 383–389. [Google Scholar] [CrossRef]
  43. Hossain, M.; Rahman, M.; Karim, M. Machine-learning approaches for predicting disinfection by-products under varying natural organic matter characteristics. Water Res. 2023, 37, 120652. [Google Scholar] [CrossRef]
  44. Lim, S.; Shi, J.L.; von Gunten, U.; McCurry, D.L. Ozonation of organic compounds in water and wastewater: A critical review. Water Res. 2022, 213, 118053. [Google Scholar] [CrossRef] [PubMed]
  45. Krasner, S.W. The formation and control of emerging disinfection by-products of health concern. Philos. Trans. R. Soc. A 2009, 367, 4077–4095. [Google Scholar] [CrossRef] [PubMed]
  46. Rodriguez, M.J.; Serodes, J.-B. Spatial and temporal evolution of trihalomethanes in water distribution systems. Water Res. 2001, 35, 1572–1586. [Google Scholar] [CrossRef]
  47. Sadiq, R.; Rodriguez, M.J. Disinfection by-products in drinking water and predictive models for their occurrence. Sci. Total Environ. 2004, 321, 21–46. [Google Scholar] [CrossRef]
  48. Ersan, G.; Goz, E.; Karanfil, T. Performance analysis of machine learning algorithms for the prediction of disinfection byproducts formation during chlorination: Effect of background water characteristics. J. Environ. Manag. 2025, 389, 126144. [Google Scholar] [CrossRef]
  49. Liang, Y.; Huang, R.; Wang, J.; Han, Z.; Wu, S.; Tan, Y.; Huangfu, X.; He, Q. Machine learning-guided prediction of chlorinated/chloraminated disinfection by-product formation in drinking water treatment. Water Res. 2025, 283, 123849. [Google Scholar] [CrossRef]
Figure 1. Treatment train configurations showing pre- and final-ozonation sequences.
Applsci 16 01256 g001
Figure 2. Structure of the ANN model applied to SUVA-based THMFP prediction.
Applsci 16 01256 g002
Table 1. Characteristics of the raw-water sample collected from Doğancı Dam (n = 3).
ParameterValueSDCV (%)
pH7.860.0620.79
Turbidity (NTU)4.730.57812.22
Total Organic Carbon (TOC) (mg/L)4.880.3507.17
Dissolved Organic Carbon (DOC) (mg/L)4.120.3017.3
Biodegradable Dissolved Organic Carbon (BDOC) (mg/L)0.970.10510.80
UV254 Absorbance (cm−1)0.1040.00565.35
Specific UV Absorbance (SUVA) (L·mg−1·m−1)2.520.1676.62
Alkalinity (mg CaCO3/L)175.005.573.18
Trihalomethane Formation Potential (THMFP) (µg/L)122.4013.9511.4
Table 2. Dataset structure and ANN data splits for all treatment trains.
Treatment
Train
Ozonation ConditionsTreatment StepsReplicates per StepTotal N
(per Train)
Training (70%)Validation (15%)Test (15%)
Train 1O1–O4RW, C, O, SF3483477
Train 2O1–O4RW, C, O, ACF3483477
Train 3O1–O4RW, O, C, SF3483477
Train 4O1–O4RW, O, C, ACF3483477
Table 3. Performance of linear regression models (SUVA → THMFP) under different ozonation–filtration configurations.
TrainsRegression EquationR2RMSE (µg/L)
Train 1THMFP = 81.4 − 26.8·SUVA0.675.3
Train 2THMFP = 98.7 − 34.1·SUVA0.637.2
Train 3THMFP = 132.5 − 41.2·SUVA0.765.9
Train 4THMFP = 161.3 − 46.8·SUVA0.716.8
Table 4. Performance of ANN models (MLP 1–6–1) for predicting THMFP under different ozonation–filtration configurations.
TrainsANN R2ANN RMSE (µg/L)
Train 10.95–0.992.4
Train 20.94–0.982.95
Train 30.88–0.934.5
Train 40.92–0.953.8
Disclaimer/Publisher’s Note: The statements, opinions and data contained in all publications are solely those of the individual author(s) and contributor(s) and not of MDPI and/or the editor(s). MDPI and/or the editor(s) disclaim responsibility for any injury to people or property resulting from any ideas, methods, instructions or products referred to in the content.