


Abstract
Long underground expressways have emerged as an alternative to surface highways in densely urbanized areas; however, their enclosed geometry, extended length, and steep longitudinal gradients introduce traffic-flow dynamics distinct from those of surface roads. This study investigates the combined and interaction effects of traffic volume, heavy-vehicle ratio, longitudinal gradient, lane number, and lane-changing policy on traffic performance in long underground expressways using microscopic traffic simulation. A hypothetical 20 km underground expressway network was evaluated under 72 systematically designed scenarios. Weighted average speed and throughput were analyzed using nonparametric statistics, generalized linear models with interaction terms, and machine learning-based sensitivity analysis. While traffic volume and heavy-vehicle ratio were confirmed as dominant determinants of performance, a key contribution of this study is the identification of the density-dependent role of lane-changing policies. Under moderate traffic density, permissive lane-changing improves efficiency by enabling vehicles to bypass localized disturbances caused by heavy vehicles and longitudinal gradients, thereby enhancing capacity utilization. In contrast, under high-density conditions, permissive lane-changing amplifies lane-change conflicts and shockwave propagation within the confined underground environment, accelerating traffic instability and performance breakdown. These adverse effects are further intensified by steep uphill gradients. The findings demonstrate that lane-changing policies on long underground expressways should be designed in a context-sensitive manner, balancing efficiency and stability across traffic states.
1. Introduction
In recent years, escalating traffic congestion and the physical limitations of surface road expansion have prompted major cities to consider long underground expressways as an alternative transportation policy. Such facilities offer distinct advantages; for example, they can mitigate congestion on surface highways and allow the reutilization of valuable urban spaces above tunnels. However, their characteristics, such as extended length, enclosed spatial environment, restricted driver visibility, and steep entrance and exit gradients, introduce operational and safety challenges that are not typically encountered on surface highways. Therefore, it is essential to examine traffic flow characteristics quantitatively to provide a scientific foundation for the design and management of future underground expressway networks.
Recent studies have increasingly focused on driver behavior in tunnels and underground road segments. Bei et al. analyzed the effects of visual guidance systems at tunnel entrances in China and showed that drivers’ visual responses strongly influence speed and safety [1]. Liu et al. applied entropy methods and simulation models to evaluate geometric design lengths at tunnel exits, highlighting the close relationship between roadway geometry and traffic flow stability [2]. Sun et al. used driving simulations at tunnel-intersection sections and confirmed that segment length and signage density significantly affect car-following and lane-changing behavior [3]. Xing et al. developed a trajectory prediction model for ultra-long tunnels and demonstrated the importance of segment-level traffic data in evaluating efficiency and safety [4]. Similarly, Segarra-Morales et al. empirically examined the reduction in the speed of heavy vehicles on curved and graded mountain roads, emphasizing the joint influence of geometric conditions and the proportion of heavy vehicles on performance [5].
In addition, studies on simulation methodologies have advanced. Bloomberg and Dale compared VISSIM and CORSIM, highlighting the superior ability of VISSIM to model congested networks and vehicle-level interactions, supporting its suitability for complex environments such as underground expressways [6]. Łach and Svyetlichnyy provided a comprehensive review of traffic modeling, underscoring the expanding role of micro- and macro-models in the era of autonomous driving [7]. Collectively, these studies reaffirm that traffic simulation is a tool for capacity estimation and a rigorous means of evaluating transport policies and infrastructure designs.
Nevertheless, existing studies have addressed individual factors or localized segments, leaving a gap in the comprehensive analyses of environments, such as long underground expressways, where multiple factors interact simultaneously. Although longitudinal gradients and heavy-vehicle ratios are known to affect performance, their combined effects remain unclear. Similarly, the effects of lane configuration (for example, two or three lanes) and lane-changing policies (permitted or restricted) have not been fully quantified in the context of underground roads.
To address these gaps, this study applies a microscopic traffic simulation-based integrated sensitivity analysis to underground expressways longer than 20 km, which are currently planned in Korea. Five key variables, namely traffic volume, heavy-vehicle ratio, longitudinal gradient, lane number, and lane-changing policy, were systematically varied to design 72 scenarios. The weighted average speed and overall traffic throughput serve as performance measures, enabling the evaluation of both the main effects and interaction effects among the variables. The results provide practical and policy-relevant insights into slope design at entrances and exits, heavy-vehicle management, and lane-changing control strategies. To systematically investigate these interacting effects under controlled conditions, this study employs a microscopic traffic simulation framework that integrates geometric design, traffic composition, and operational policies within a unified experimental environment. The simulation-based approach enables the isolation of individual factors and the identification of nonlinear and density-dependent mechanisms that are difficult to observe in empirical settings, particularly for long underground expressways with limited real-world data availability. The key contributions of this study are threefold. First, it provides a systematic simulation-based analysis of traffic performance in long underground expressways by explicitly accounting for interaction effects among demand, vehicle composition, geometric conditions, and operational policies. Second, it reveals a density-dependent inversion effect of lane-changing policies, highlighting that strategies beneficial under moderate demand may exacerbate instability under high demand. Third, the study reframes performance evaluation from a static capacity perspective toward a stability-oriented interpretation more suitable for confined underground environments. All analyses in this study are based on data generated through microscopic traffic simulation, rather than empirical field observations.
2. Literature Review
Studies on the traffic flow characteristics of underground roads and long tunnels have spanned diverse topics and methodologies. To align with the objectives of this study, the literature is organized into four main research streams: (1) driver behavior and safety, (2) geometric and structural design factors, (3) traffic simulation and modeling, and (4) heavy-vehicle effects and related policy implications. This structure enables a systematic overview of previous findings and helps to clarify the research gaps addressed in the present work.
2.1. Traffic Flow and Driver Behavior in Underground Expressways
Studies on driver behavior have emphasized how spatial confinement, limited visibility, and steep gradients of tunnels affect perception, reaction, and driving stability. Wang et al. conducted a field study in Chinese highway tunnels and showed that linear visual guidance facilities can effectively reduce driver stress and lane-departure risk [8]. In a simulated driving experiment, the effects of lighting conditions and grades on driving speed, lane adherence, and gaze movements in an underwater tunnel were analyzed [9]. Qin et al. reported that in ultra-long tunnels, fatigue and monotony reduce driver performance after 5 ̶ 6 min, although moderate traffic volumes may help sustain attention. Moreover, they pointed out gender differences in stability [10]. Yang et el. highlighted that high geometric complexity in underwater tunnels improves behavior through elevated visual loads [11]. More recently, He et al. (2025) identified driving behavior inertia in tunnel diverging areas, demonstrating that drivers exhibit delayed adaptation when switching tasks under sudden geometric changes, which substantially increases instability and the probability of conflicts [12]. Likewise, Gu et al. (2024) provided a comprehensive investigation of tunnel-interchange connecting sections processes under confined underground conditions [13]. These findings expand the understanding of driver safety mechanisms in complex tunnel environments and underscore the importance of considering perceptual and cognitive adaptation, in addition to geometric and traffic flow factors, under real or simulated underground expressway conditions, which are still limited. Geometric design is essential in improving traffic performance and safety. Yang et al. found that small radii of curvature combined with steep longitudinal grades rapidly deteriorate stability [14]. Wang et al. assessed tunnel visual guidance systems using an improved matter-element method, underscoring the importance of visual environment design at the planning stage [15].
These findings underscore the influence of geometric variables on driver safety. However, few empirical analyses have linked these factors to real-world traffic conditions. In particular, heavy-vehicle proportions and high volumes are relatively rare, leaving a gap in the integrated evaluation of geometric effects in underground contexts.
2.2. Simulation-Based Analysis and Operational Factors
Traffic simulation is a central tool for replicating complex flow patterns and testing operational strategies. Yuan et al. investigated mandatory lane changes in weaving sections and revealed the link between headways, volume, and collision risk [16]. Ji et al. applied game theory to show that imposing costs on lane changes can reduce aggressive maneuvers [17]. Jin et al. employed reinforcement learning to design a dynamic variable speed limit (VSL) system for tunnels, demonstrating gains in both efficiency and safety [18]. Qu et al. validated the safety benefits of VSL policies using large-scale data, whereas Abdulghani et al. found that differentiating VSLs for trucks and passenger cars enhances stability [19,20]. Arora and Katten confirmed that integrated VSL and lane control systems significantly improve safety and throughput [21]. Beyond conventional simulation methods, machine learning approaches have emerged as powerful alternatives for traffic prediction and control. Sroczynski and Czyżewski (2023) demonstrated that road traffic can be predicted by machine learning models with accuracy comparable to that of complex microscopic simulations, highlighting the potential for reduced modeling complexity without sacrificing predictive performance [22]. Xing et al. (2023) provided a comprehensive overview of machine learning-based traffic flow prediction, identifying trends, challenges, and opportunities in applying data-driven approaches to dynamic transportation systems [23]. More recently, Wang and Zhen (2025) developed a predictive modeling framework for vehicle speed using traffic flow features, confirming that tree-based machine learning algorithms can effectively capture nonlinear dynamics in roadway operations [24]. These contributions indicate that machine learning can serve both as a complement to, and, in some cases, a substitute for, traditional microsimulation methods. However, most prior applications have focused on general freeway or urban networks, and explicit frameworks that integrate traffic composition, longitudinal gradients, and lane-change rules in underground expressways remain scarce. Heavy vehicles have consistently been found to influence both safety and performance outcomes. Xu et al. showed that higher freight vehicle shares increase the risk of severe crashes on expressways [25]. Guo et al. reported that requiring trucks to complete lane changes before reaching ramps improves both stability and safety [26]. These results reaffirm the importance of heavy-vehicle ratios and operational restrictions. However, systematic quantitative analyses under the distinctive conditions of long underground expressways are limited.
In summary, previous studies have made significant contributions to driver behavior, geometric design, simulation methodology, and policy measures [27,28]. However, most studies remain single-dimensional, leaving gaps in the understanding of how multiple factors interact simultaneously. In particular, few studies have quantitatively investigated the combined impacts of heavy-vehicle ratios and longitudinal gradients, along with lane configurations and lane-changing policies. To address this gap, this study applied a microscopic traffic simulation-based multi-factor sensitivity analysis of long underground expressways. The analysis integrated traffic volume, heavy-vehicle ratio, gradient, lane number, and lane-change policy to provide empirical guidance for the planning and operation of future underground expressway networks.
3. Methodology
3.1. Study Scope and Network Setup
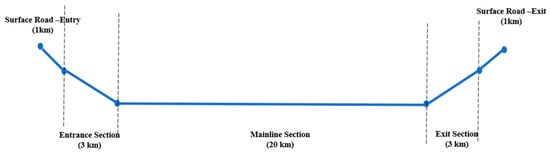
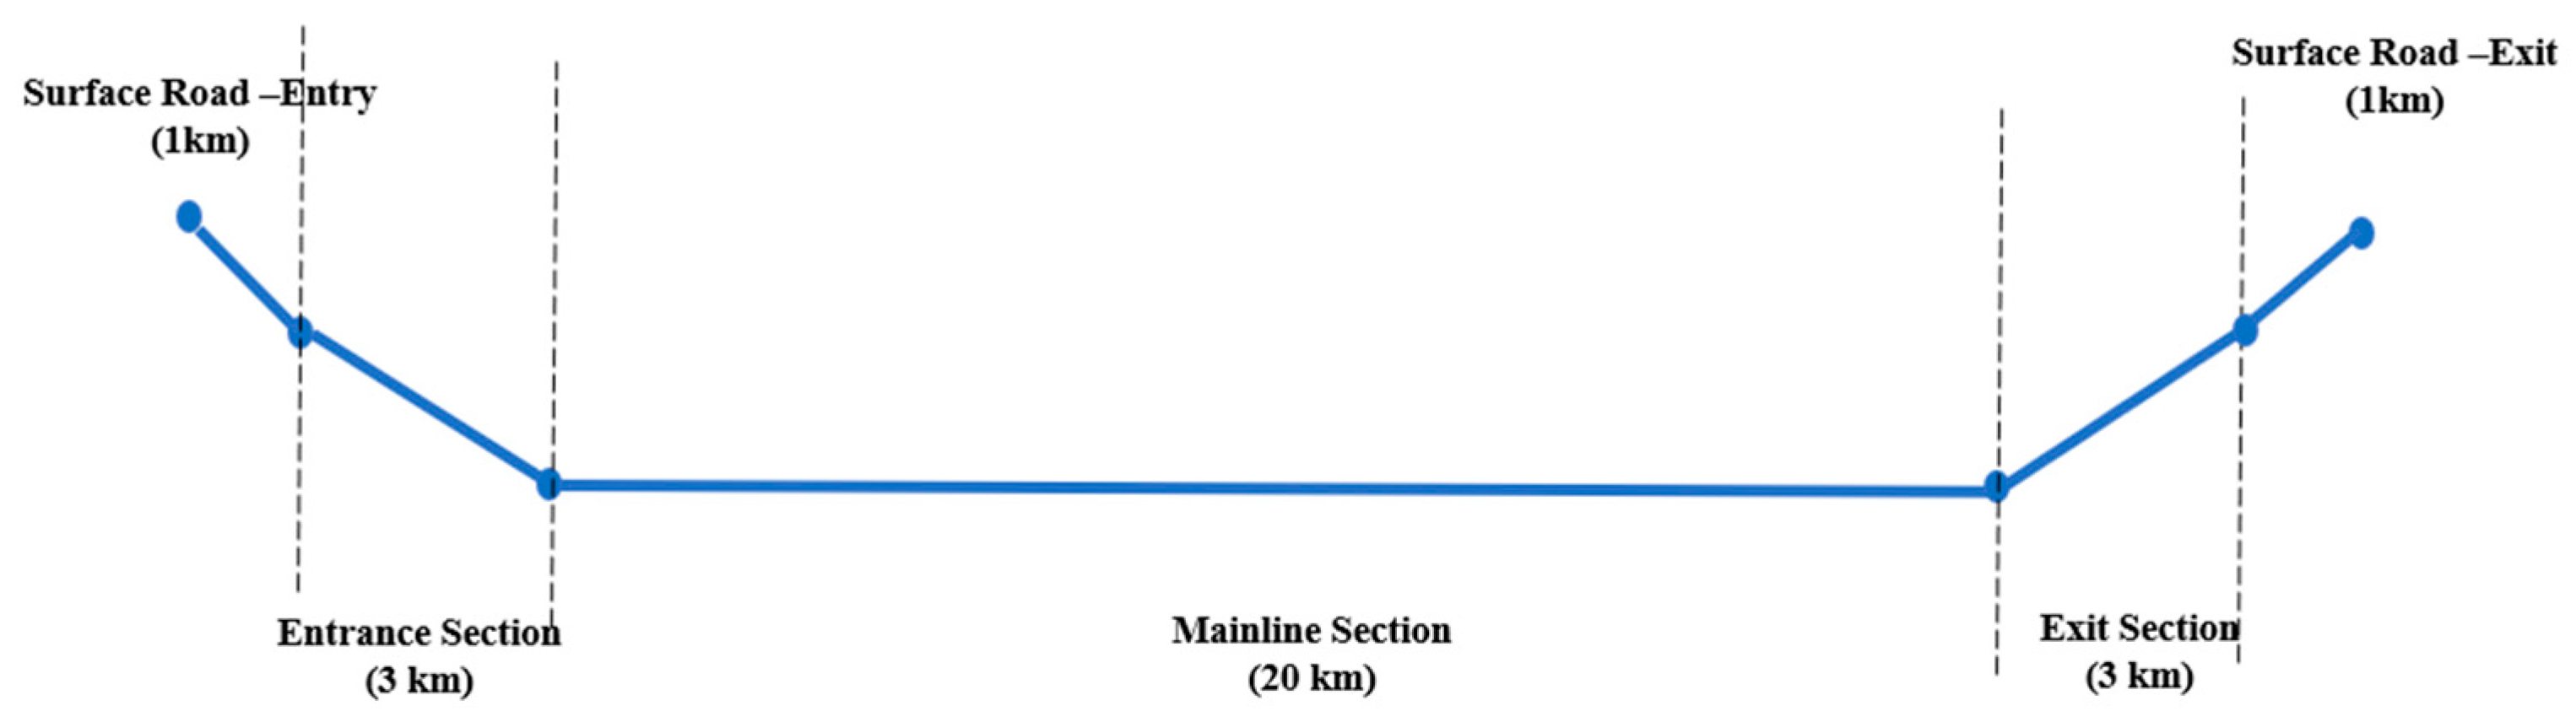
This study investigated the traffic flow characteristics of long underground expressways, focusing on facilities longer than 20 km, which are currently planned in Korea. Rather than analyzing a single segment, a hypothetical simulation network was constructed to incorporate the representative geometric and operational features of their facilities. A schematic of the network profile is shown in Figure 1.
Figure 1.
Schematic layout of the hypothetical underground expressway sections.
This approach enables the systematic testing of diverse variable combinations under controlled conditions, addressing the data constraints and site-specific limitations of real-world segments. The network comprised a 20 km mainline section with a 3 km entry and exit approach. Both two- and three-lane mainline scenarios were modeled, and the lane-changing conditions were differentiated using dotted (permitted) and solid (restricted) markings. The entry was designed with a descending gradient and the exit with an ascending gradient, reflecting the operational patterns observed on actual underground roads. Vehicle composition followed the Korean Highway Capacity Manual (KHCM), which distinguishes between passenger cars and heavy vehicles [29]. Overall, the network design captures the extended alignment, limited visibility, and steep gradients that define underground expressways, thereby establishing a sound experimental basis for performance evaluation. The dataset used in this study consists of simulation-generated traffic performance data obtained from a microscopic simulation model of a hypothetical long underground expressway. For each scenario, traffic demand, vehicle composition, geometric conditions, and operational policies were predefined as inputs, and performance measures were extracted from detector-based outputs.
3.2. Scenario Design and Model Calibration
This study employs the microscopic traffic simulation platform VISSIM as a controlled experimental environment rather than as a methodological contribution in itself. VISSIM was selected because its detailed representation of car-following and lane-changing behavior allows the systematic manipulation of traffic demand, vehicle composition, longitudinal gradients, and operational policies within a unified network framework. This capability is particularly important for long underground expressways, where confined geometry, limited recovery space, and heavy-vehicle interference jointly influence traffic stability. The innovative aspect of this study therefore lies in the experimental design and interaction-focused analysis enabled by the simulation framework, rather than in the simulation tool alone.
To evaluate traffic performance, five independent variables were examined: traffic volume, heavy-vehicle ratio, longitudinal gradient, lane number, and lane-changing policies. The variable ranges were determined with reference to national guidelines, international standards, and previous research, resulting in 72 simulation scenarios, as presented in Table 1.
Table 1.
Simulation variables, levels, and scenario combinations.
The 72 simulation scenarios were constructed using a structured full-factorial design to ensure balanced and systematic coverage of the key influencing factors. Specifically, predefined discrete levels were assigned to each variable—traffic volume (three levels), heavy-vehicle ratio (four levels), longitudinal gradient (three levels), number of lanes (two levels), and lane-changing policy (two levels)—and all possible combinations were enumerated. This approach ensures that each scenario represents an independent and equally weighted observation, allowing both main effects and interaction effects to be examined without bias toward specific operating conditions. The full-factorial structure also facilitates consistent comparison across factor levels, thereby supporting robust sensitivity analysis under controlled experimental conditions.
VISSIM was selected for its ability to represent microscopic traffic interactions, including car-following, lane-changing, and speed choice. VISSIM driver behavior parameters were adjusted to account for behavioral differences between surface and underground roads [30]. Simulator studies have indicated that underground conditions reduce visibility, discourage lane changes, increase headway, and reduce speeds. Accordingly, the following modifications were applied: the sight distance was reduced by 30% relative to surface roads, the time headway was increased from 1.5 to 1.8 s, gap acceptance thresholds were increased, and the desired speed was reduced by 10%. The parameter adjustments reflecting underground driving behavior are presented in Table 2.
Table 2.
Adjusted VISSIM parameters for underground driving behavior.
In VISSIM, CCO (standstill distance, m) specifies the minimum stopped gaps, CC1 (time headway, s) defines the desired following time, and CC2–CC5 represent the oscillation and perception thresholds in car-following. Among these, CC0 and CC1 are particularly critical for underground expressways, considering their influence on safety margins and capacity in high-speed, frequently congested tunnel environments. Each scenario was simulated for 1 h, with a 10 min warm-up to establish a stable flow. Multiple random seeds were used to reduce variability, and the mean values were reported.
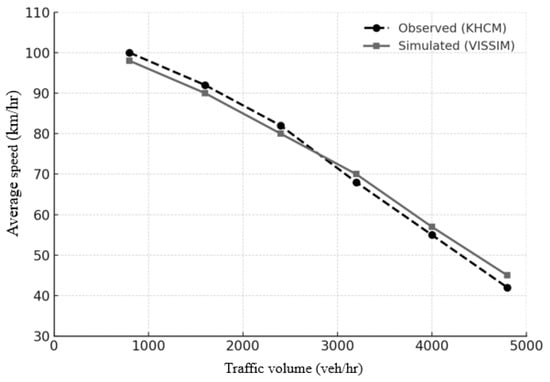
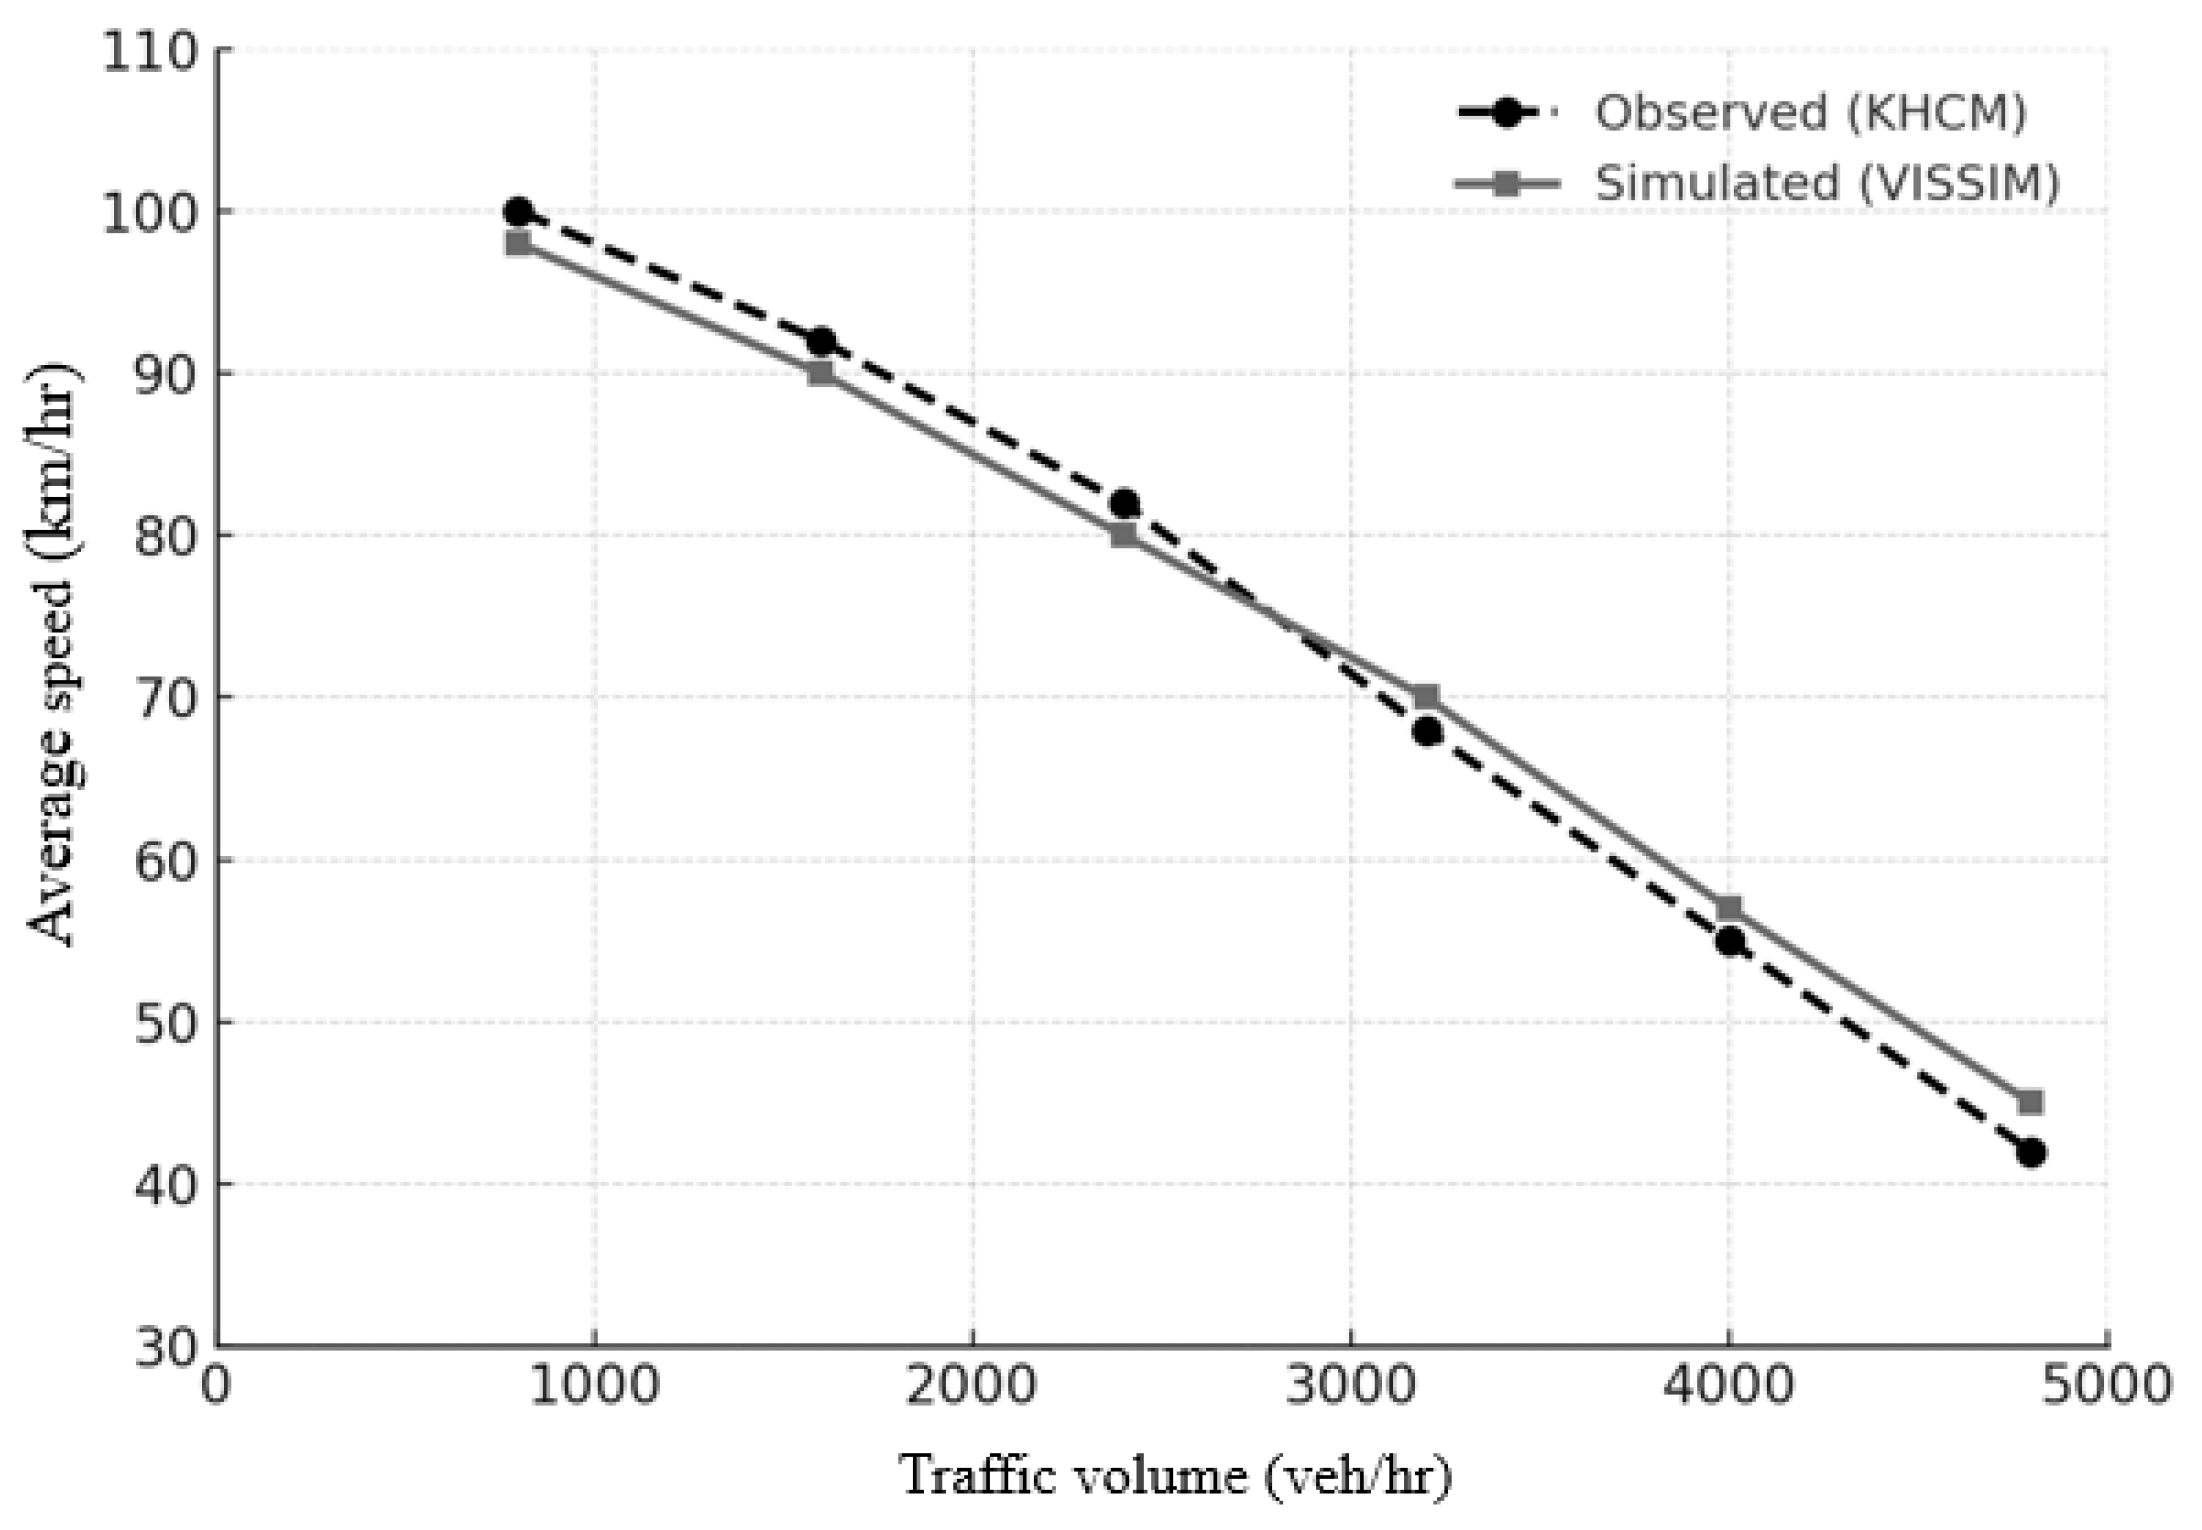
Calibration was performed in two stages. First, vehicle speed distribution and heavy-vehicle ratios were aligned with domestic traffic statistics. Second, critical parameters such as CC0, CC1, CC4, and CC5, and the desired speed distributions were refined to reflect underground driving conditions. Validation was achieved by comparing simulated capacities and speed ranges with KHCM benchmarks; the results agreed to ±5%. Figure 2 shows the validation results of model performance against KHCM benchmarks. In addition, the sensitivity of the average speed to heavy-vehicle ratios corresponded closely to the empirical findings, reinforcing model reliability.
Figure 2.
Comparison of observed (KHCM) and simulated (VISSIM) average speeds across traffic volume.
In this study, traffic volume denotes the imposed incoming demand at the network entry, which was predefined as an input variable in the simulation scenarios. Throughput, by contrast, represents the realized traffic flow measured by a loop detector and is defined as the number of vehicles passing the detector per unit time.
The detector was located at a representative mainline segment downstream of the entrance to capture stable flow conditions. Throughput values are reported in veh/h/lane, calculated by dividing the total measured flow across the cross-section by the number of lanes. For each scenario, throughput was aggregated over the analysis period and averaged across multiple simulation runs with different random seeds. The reported mean and standard deviation therefore reflect both temporal variability and stochastic variability across runs.
3.3. Performance Indicator and Analytical Methods
Two primary performance measures, namely the weighted average speed and throughput, were adopted. The weighted average speed incorporates the heavy-vehicle ratio to reflect system-wide effects, whereas the latter, defined as the number of vehicles passing a detector per unit time, captures network capacity and congestion. To explore complex interactions and nonlinear effects, additional analyses were conducted using regression models and machine learning (random forest—RF; Shapley additive explanations—SHAP). These methods enable the quantitative assessment of variable importance, threshold effects, and cross-factor sensitivities under varying traffic conditions. The performance indices were analyzed using a multi-step statistical process. Spearman’s rank correlation was first applied to examine the correlation between independent variables and outcomes, accommodating nonlinearities. The Kruskal–Wallis H test was used to identify significant differences across factor levels, offering a nonparametric alternative to ANOVA.
In this study, machine learning methods were applied for explanatory purposes rather than predictive modeling. Specifically, the random forest (RF) algorithm was used to quantify the relative importance of influencing factors and to explore nonlinear and interaction effects within the simulation-based dataset. Each simulation scenario represents an independent observation defined by a unique combination of traffic volume, heavy-vehicle ratio, longitudinal gradient, lane number, and lane-changing policy, with corresponding performance outcomes.
Given the controlled and finite nature of the simulation scenarios, conventional train–test data partitioning aimed at predictive validation was not adopted. Instead, the RF model was trained using the full scenario dataset to extract stable variable-importance measures and partial dependence patterns. This design choice reflects the study’s focus on structural interpretation rather than predictive generalization. To enhance interpretability, SHAP values were computed to quantify the marginal contribution of each factor under different traffic conditions, thereby revealing density-dependent nonlinear effects. Beyond univariate tests, a generalized linear model (GLM) with polynomial terms was constructed to analyze interaction effects, including threshold phenomena such as abrupt drops in performance. The GLM served as the primary framework for identifying statistically significant interaction terms, while RF-based analyses provided complementary, nonparametric insights. SHAP interaction values were examined to qualitatively assess nonlinear joint effects; however, because these patterns were consistent with the statistically significant interaction terms identified in the regression analysis, only the main-effect SHAP results are presented. Accordingly, RF and SHAP were employed to support and interpret nonlinear and density-dependent patterns identified in the preceding statistical analyses, rather than as standalone modeling frameworks. All analyses were performed in Python 3.11, using scikit-learn (v1.3.0), statsmodels (v0.14.0), and shap (v0.42.1).
4. Results and Analysis
This section presents the traffic performance analysis derived from the scenarios outlined in Section 3 and the calibrated simulation model. Results are organized into three sequential steps:
- Descriptive statistics summarizing the distributions of the weighted average speed and throughput across all scenarios, identifying general trends by factor levels.
- Univariate analysis of the single-variable effects of traffic volume, heavy-vehicle ratio, longitudinal gradient, lane count, and lane-changing policy using correlation and Kruskal–Wallis tests.
- Interaction and extended analysis using regression models and machine learning-based sensitivity techniques to capture nonlinearities and cross-factor dynamics.
This multi-step approach offers a comprehensive understanding of traffic flow characteristics in long underground expressways, moving beyond basic simulation output toward interpretable, policy-relevant insights.
The analysis was conducted using a hierarchical framework designed to progressively uncover traffic performance mechanisms at different levels of complexity. Descriptive statistics and univariate tests were first used to identify baseline sensitivities of performance measures to individual factors. These findings were then extended through regression-based analysis to quantify interaction effects among traffic demand, vehicle composition, geometric conditions, and operational policies. Finally, machine learning-based interpretability methods were employed to explore nonlinear and density-dependent patterns that are difficult to capture using parametric approaches alone.
4.1. Descriptive Statistics
Analysis of the 72 scenarios revealed noticeable patterns in the weighted average speed and throughput. The descriptive statistics of all scenarios are presented in Table 3, indicating variations in performance due to traffic volume, heavy-vehicle ratio, slope, lane configuration, and lane-changing policies. The speed declined monotonically with higher traffic volumes, whereas the LOS-averaged throughput exhibits a monotonic increase. Higher demand levels are associated with increased variability, indicating reduced stability of traffic flow and an increased risk of congestion-induced breakdown. Heavy-vehicle proportions had a strong negative effect, reducing both speed and throughput because of slower acceleration/deceleration and larger space requirements.
Table 3.
Mean ± SD of detector-measured throughput (veh/h/lane) under different incoming demand levels and LOS categories.
Longitudinal slope further constrained capacity, with steeper gradients, particularly at entry and exit ramps, resulting in a noticeable drop in performance. Lane configuration should be considered; for example, three-lane setups generally supported a higher throughput than a two-lane setup. However, under congested conditions, permissive lane changing accelerated declines in speed compared with restrictive policies, indicating that excessive lane-changing destabilizes flow under high-density conditions.
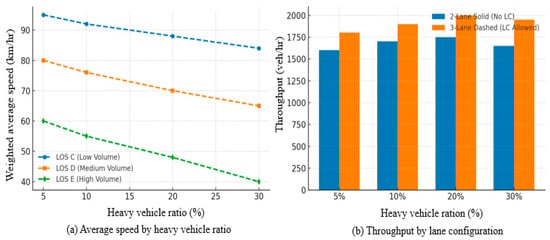
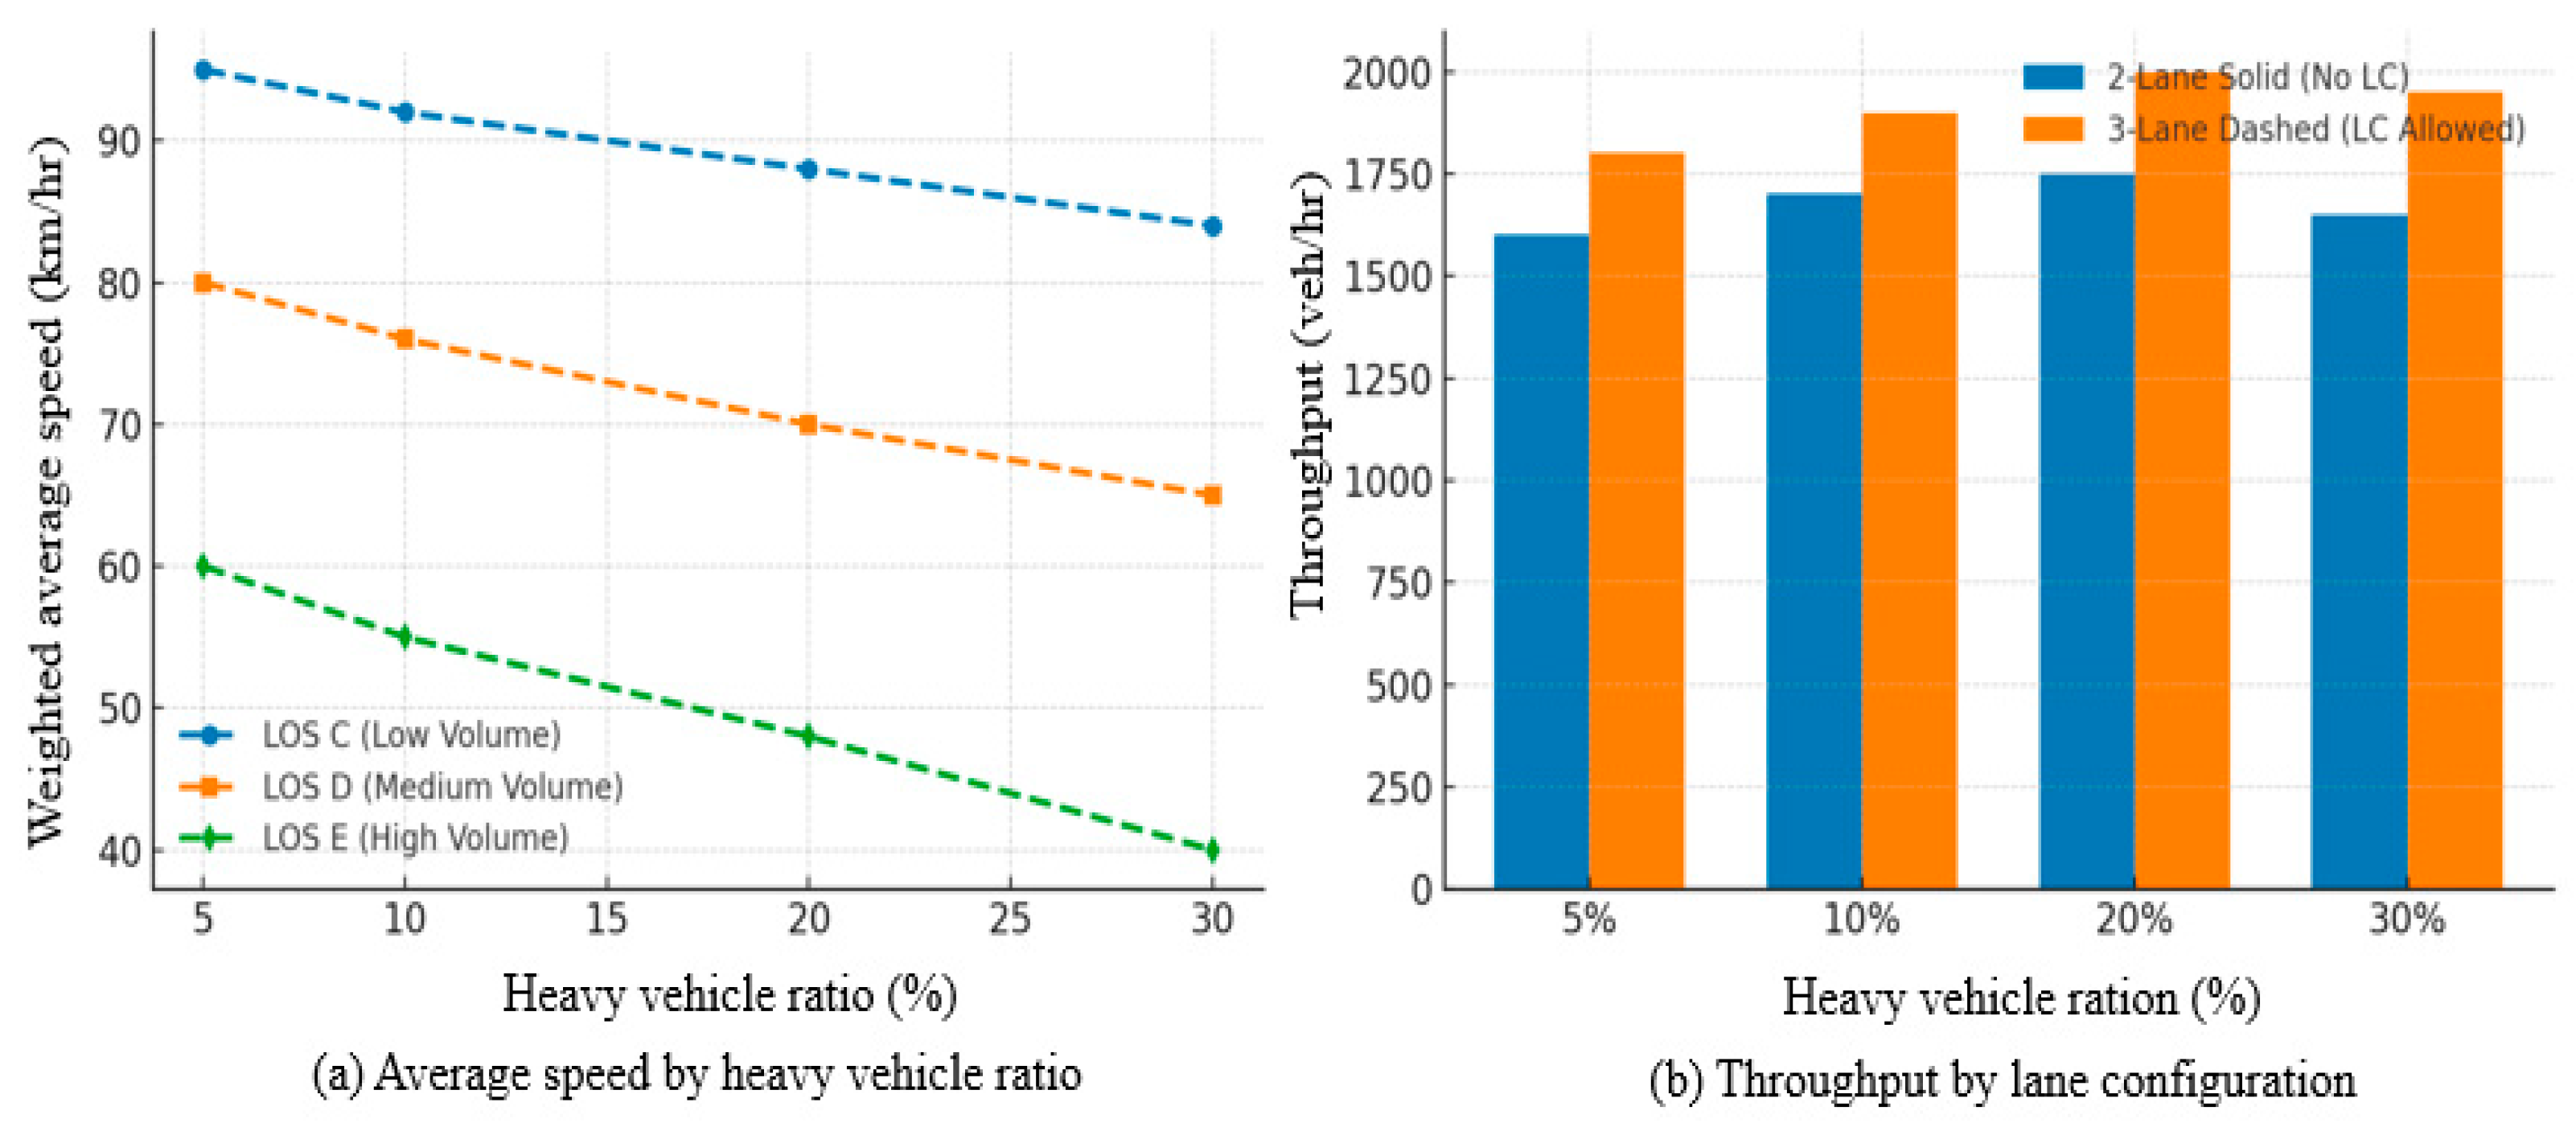
Figure 3 illustrates the distributions of the weighted average speed and throughput under various simulation scenarios. Figure 3a shows that the average speed declines sharply as the proportion of heavy vehicles increases across different traffic volumes (LOS C, D, and E), highlighting the dominant influence of the heavy-vehicle share on speed. Figure 3b compares the throughputs across lane configurations and lane-changing policies, where the three-lane permissive scenario (dashed markings) outperforms the two-lane restrictive scenario (solid markings), indicating that additional lanes combined with flexible lane-changing can sustain a high capacity under comparable demand.
Figure 3.
Weighted average speed (a) and throughput (b) under different traffic volumes, heavy-vehicle ratios, lane numbers, and lane-changing polices.
4.2. Univariate Analysis
Spearman’s correlation and Kruskal–Wallis tests confirmed the statistical significance of these patterns. The detailed correlation coefficients and H-test results are presented in Table 4. Traffic volume exhibits a strong negative correlation with average speed (ρ = −0.82, p < 0.01), whereas throughput exhibits a nonlinear response to traffic demand, with increasing flow accompanied by reduced stability and higher variability at elevated demand levels. The heavy-vehicle ratio has a negative correlation with speed (ρ = −0.71, p < 0.001), with significant differences observed between low (5%) and high (30%) truck scenarios (H = 18.42, p < 0.01).
Table 4.
Spearman’s correlation and Kruskal–Wallis H tests results for traffic variables and performance measures.
Longitudinal grade exerts consistent negative effects: uphill slope (+9%) reduces average speed by 15% and throughput by 12%, exceeding the comparable effects reported on surface roads, probably because of the enclosed tunnel environment. Lane number is positively associated with throughput (17% higher for three lanes), although it is not sufficient to prevent drops in speed during congestion. Lane-changing policies produce mixed results, improving throughput at moderate volumes but exacerbating speed declines at high densities, highlighting the trade-offs between stability and capacity.
4.3. Interaction and Extended Analysis
To capture joint effects, a GLM with polynomial terms and machine learning-based sensitivity analyses was applied. The detailed regression outcomes, including interaction coefficients and model fit statistics, are presented in Table 5. Results revealed strong interaction effects: traffic volume × heavy-vehicle ratio significantly amplified speed degradation, whereas volume × gradient interactions reduced the effectiveness of additional lanes under steep uphill conditions. The extended regression models explained 72% of the variance in average speed and 69% in throughput, demonstrating robust explanatory capacity.
Table 5.
GLS results with interaction terms for speed and throughput.
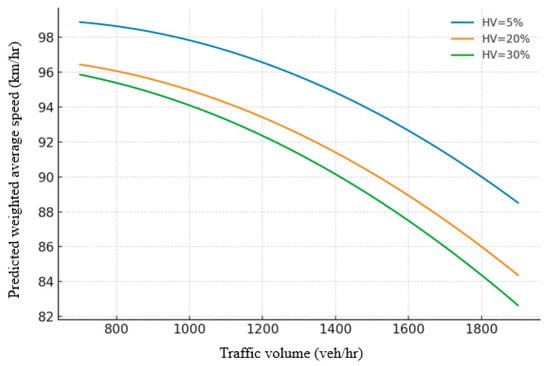
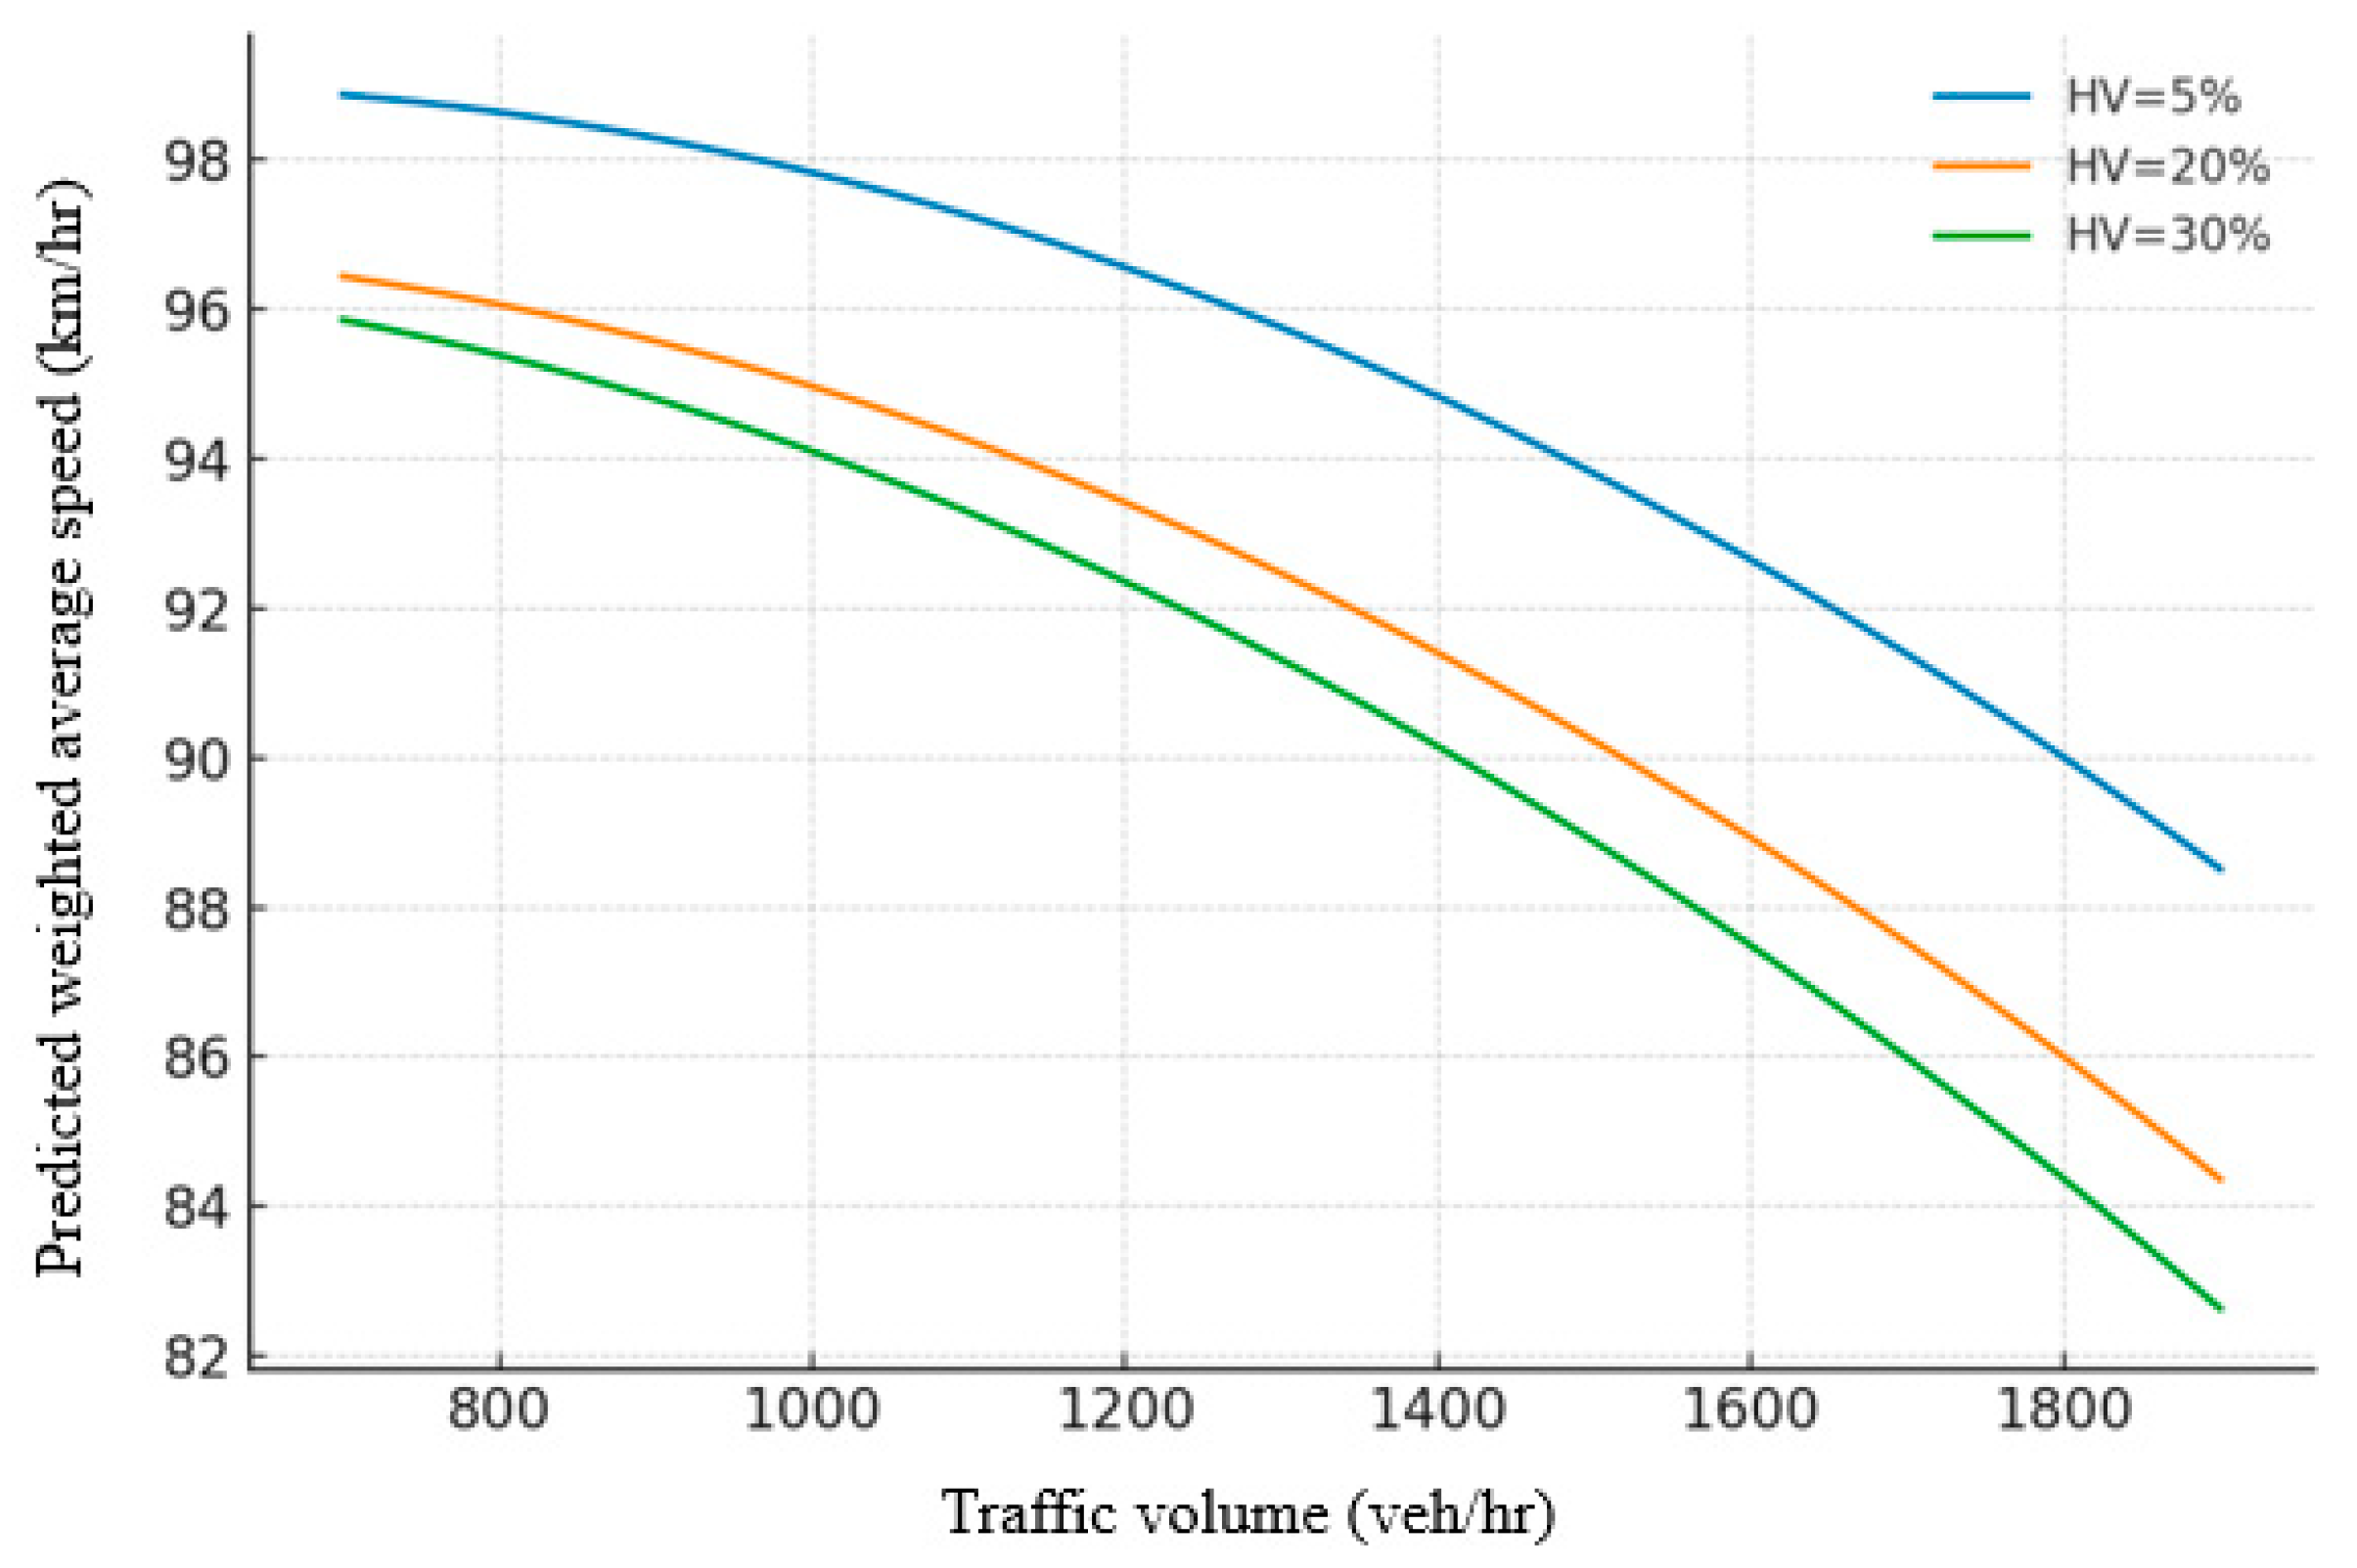
Figure 4 illustrates the interaction effects between traffic volume and heavy-vehicle ratio. The analysis reveals that under low-volume conditions, the differences in the heavy-vehicle ratio are minimal. However, under high-volume conditions, the average speed at a 30% heavy-vehicle ratio is approximately 25 km/h lower than that at a 5% ratio. These finding highlights that the interaction between traffic volume and heavy-vehicle share is particularly pronounced in congested regimes.
Figure 4.
Interaction effects of traffic volume and heavy-vehicle ratio on predicted average speed.
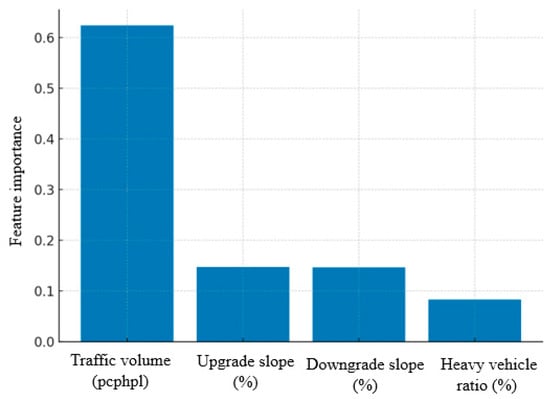
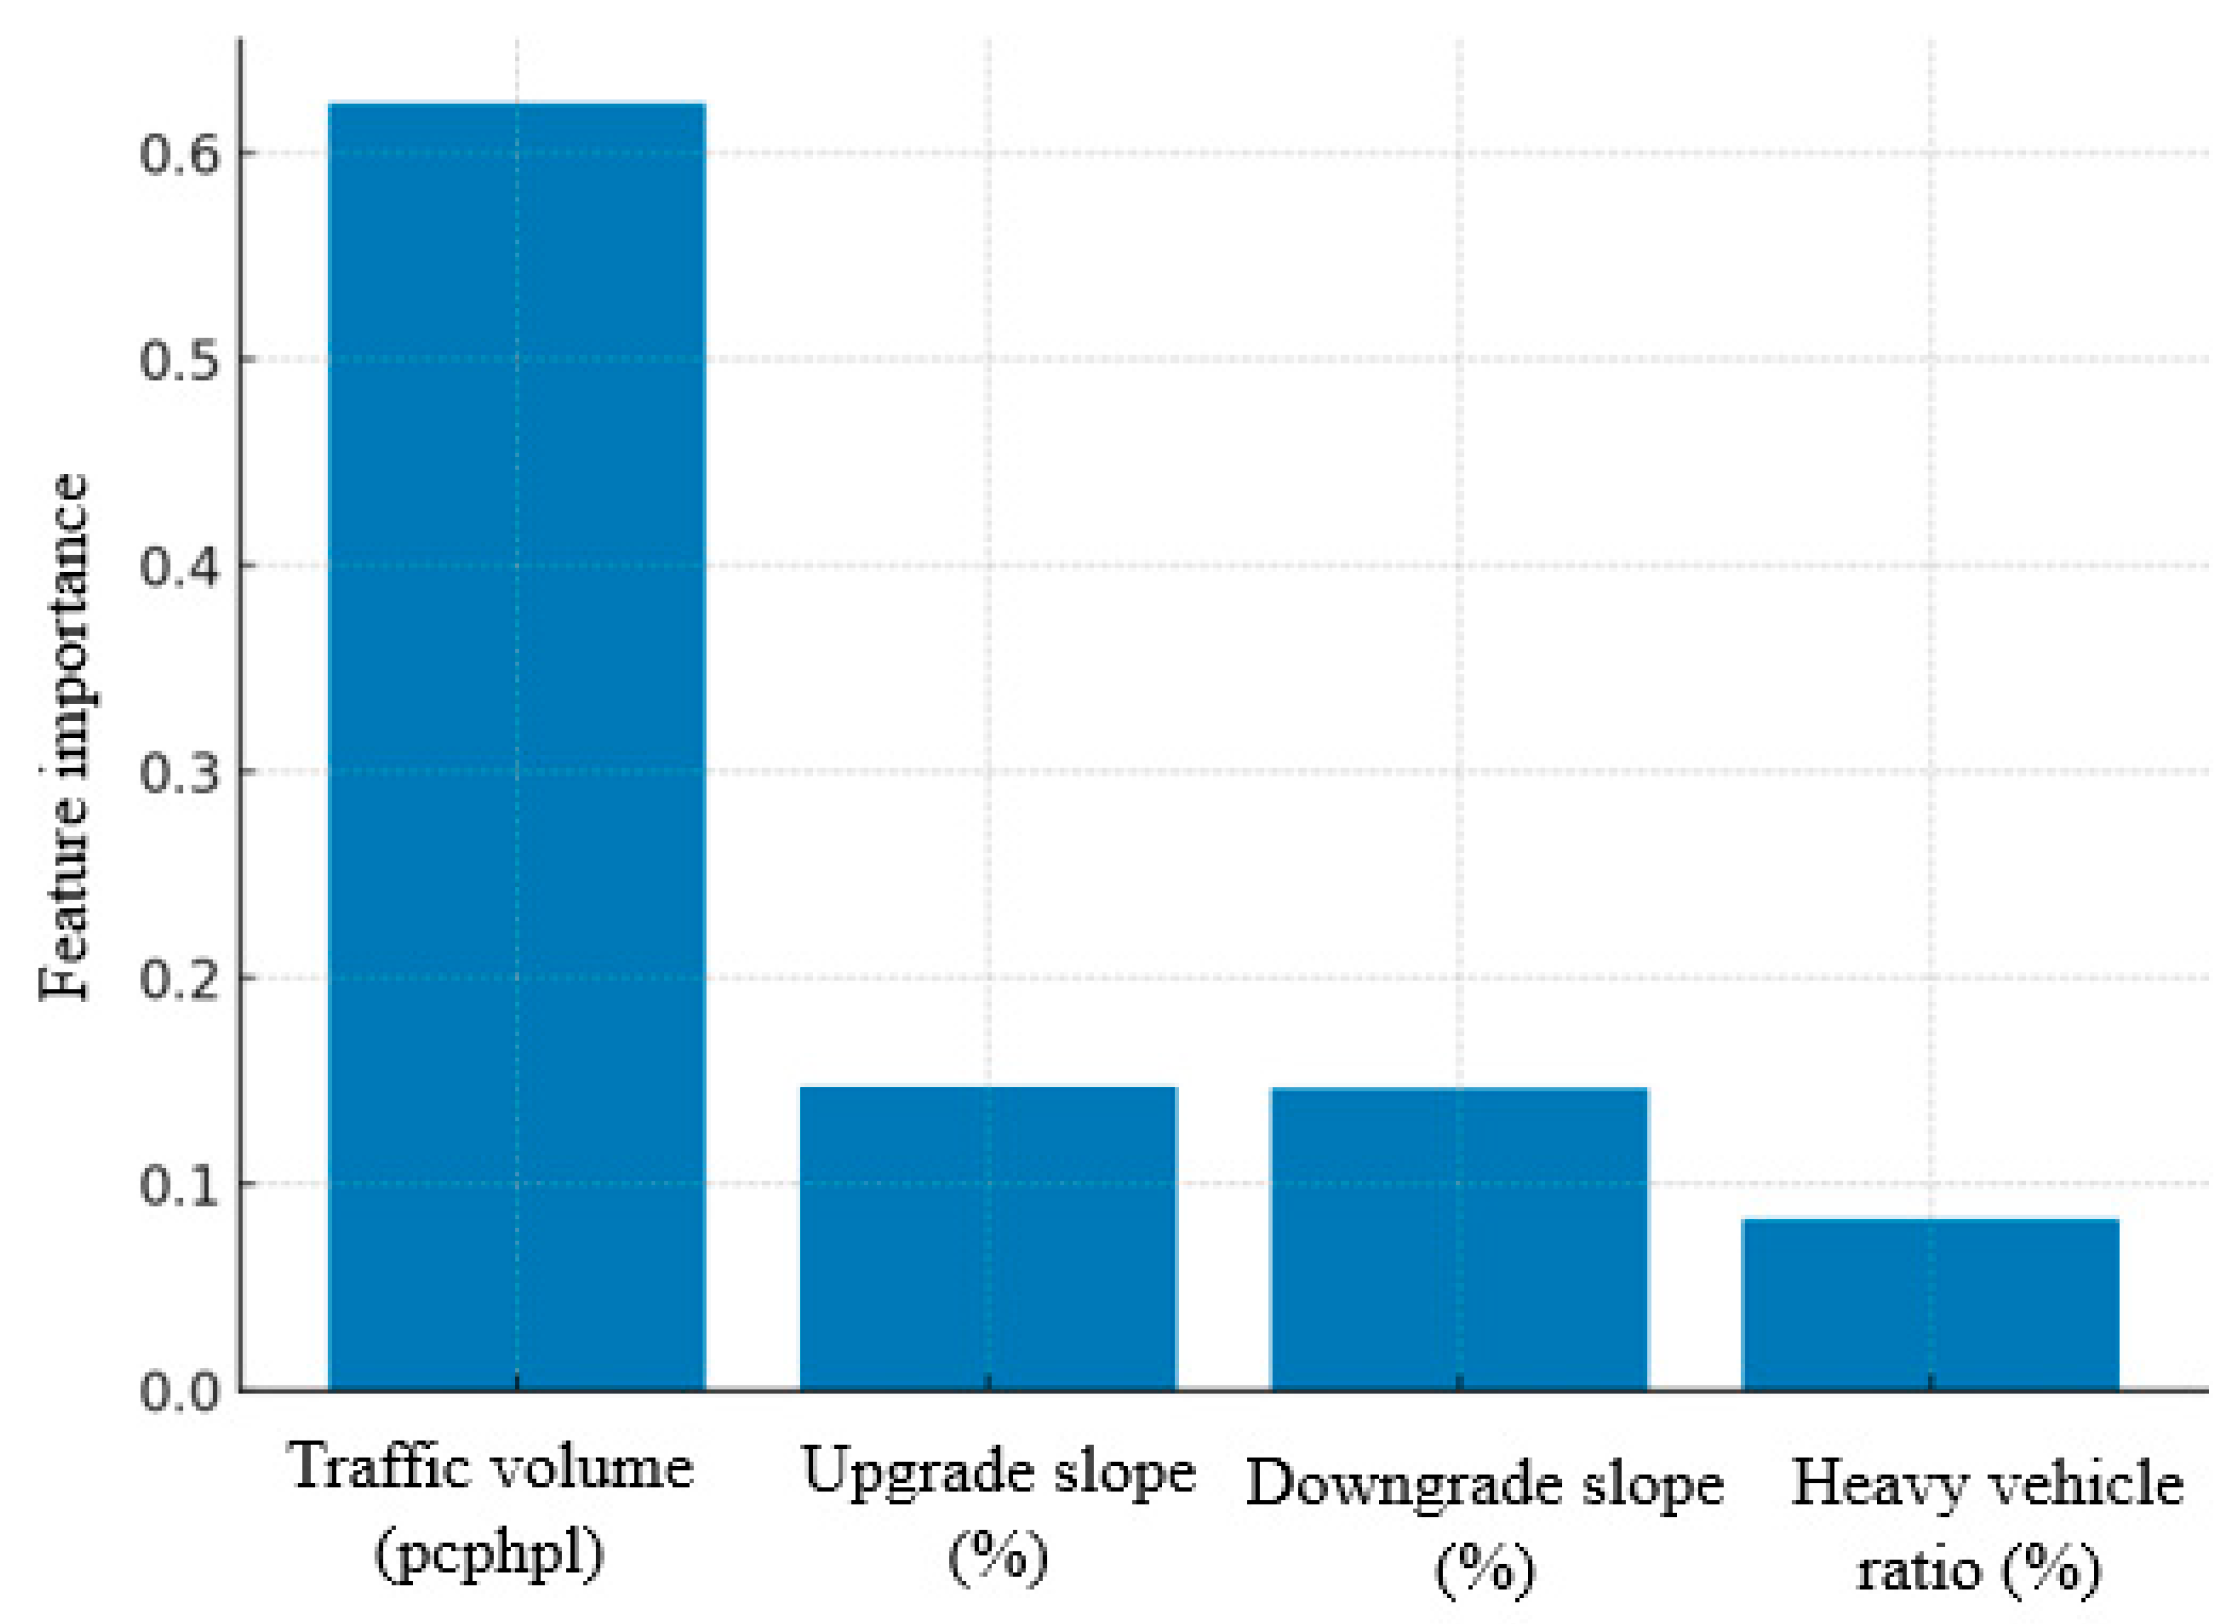
Variable importance estimated by RF and SHAP is presented in Figure 5. For the average-speed model, traffic volume exhibits the largest contribution (36%), followed by heavy-vehicle ratio (27%), longitudinal gradient (22%), and lane-change policy plus lane count (combined 15%). Complementary SHAP analyses further revealed that the contribution of the heavy-vehicle ratio escalates under high-volume, steep-grade conditions. This pattern indicates context-dependent effects, which are difficult to capture using linear regression coefficients alone.
Figure 5.
Variable importance from RF and SHAP analysis.
The SHAP-based interaction patterns were found to be consistent with the interaction effects identified in the GLM, particularly for traffic volume–heavy-vehicle ratio and traffic volume–gradient combinations.
4.4. Summary of Findings and Implications
Across the 72 scenarios, four consistent insights emerged.
- Traffic volume is the dominant determinant factor, shaping both speed and throughput through nonlinear congestion dynamics.
- The heavy-vehicle ratio significantly worsens congestion effects, with statistically verified effects on speed and throughput.
- A partially uphill longitudinal slope exerts strong negative effects that are magnified under tunnel conditions.
- Lane policies moderate flow: Additional lanes improve capacity, but permissive lane changes destabilize flow at high densities, and restrictive policies stabilize speeds at some cost to throughput.
Machine learning confirmed the central roles of traffic volume and heavy-vehicle ratio, whereas slope and lane management emerged as important secondary factors. Furthermore, comparative analyses between surface and underground road environments showed minor differences in speed and density, but negligible effects on overall capacity, indicating that behavioral differences influence safety to a greater extent than throughput.
In summary, traffic performance in long underground expressways arises from the interplay of multiple factors rather than isolated variables. Thus, effective congestion management requires strategies tailored to heavy-vehicle flow, geometric designs, and lane-changing policies. These findings provide an empirical basis for operational planning and contribute to bridging the research gap identified in Section 1 and Section 2.
5. Discussion and Conclusions
This study examined the effects of traffic volume, proportion of heavy vehicles, longitudinal slope, lane count, and lane-changing policies on the performance of long underground expressways using microscopic simulation methods. This contrasting effect of permissive lane-changing policies can be explained by the traffic-density-dependent mechanisms observed in long underground expressways. Under moderate density conditions, permissive lane-changing allows vehicles to bypass localized disturbances induced by heavy vehicles and longitudinal gradients, thereby improving lane utilization and delaying congestion onset. However, once traffic density approaches critical levels, the same permissive policy increases lane-change conflicts and accelerates shockwave propagation in the confined underground environment, where limited visibility and delayed recovery amplify flow instability and breakdown. These findings indicate that the effectiveness of lane-changing policies in underground expressways is inherently state-dependent rather than universally beneficial or detrimental.
By integrating univariate statistical tests, extended regression models, and machine learning approaches, the analysis quantitatively revealed the interaction effects among variables that have not been fully explored in previous research. Because the analysis relies on simulation-generated data, the findings should be interpreted as reflecting controlled experimental conditions rather than direct empirical observations. The main findings and their implications are discussed below.
First, the results are broadly consistent with those of international studies. Bei et al. highlighted how visual perception at tunnel entrances critically affects operating speeds and confirmed that restricted sight distance and increased heavy-vehicle proportions are key factors that reduce performance in underground contexts [1]. Similarly, the effects of longitudinal slope and lane-changing policies align with the findings of Liu et al. and Sun et al., who emphasized the significance of geometric design and behavioral adaptation at tunnel junctions [2,3]. By quantifying the differences between surface and underground environments, this study extends the global literature on underground roadway operations.
Second, although this analysis relied on simulations, model validity was supported via calibration against the KHCM and was consistent with the results of empirical studies. Although a direct field verification was not conducted, the results demonstrate the potential for empirical extension. Future research should strengthen external validity by cross-validating simulation outcomes with traffic detector data, CCTV monitoring, and vehicle trajectory datasets.
Third, the incorporation of machine learning offered a new interpretive approach beyond that of conventional statistical methods. RF and SHAP analyses provided intuitive visualizations of variable contributions under different conditions, particularly highlighting the amplified effects of heavy vehicles under congestion. These insights illustrate the added value of machine learning in revealing nonlinear context-dependent dynamics, which are difficult to capture using regression models alone.
Fourth, although the case study was in a Korean context, the findings have broader international relevance. Long underground expressways in dense urban settings worldwide commonly encounter increasing heavy-vehicle shares, steep entry and exit grades, and challenges in lane-change management. Nonetheless, variations in design standards and operational practices across countries highlight the need for comparative international studies to generalize the conclusions.
With respect to simulation platforms, alternative tools such as SUMO have been widely applied in traffic flow research, particularly for large-scale and open-source network simulations. However, the present study focuses on microscopic interaction mechanisms—including discretionary lane-changing behavior, heavy-vehicle interference, and gradient-induced speed adaptation—within long underground expressways characterized by confined geometry and delayed recovery dynamics. VISSIM was therefore selected for its well-established car-following and lane-changing models, as well as its flexibility in calibrating behavioral parameters to reflect underground driving conditions. While SUMO offers significant advantages in terms of openness and extensibility, reproducing the detailed behavioral adjustments required for this study would involve substantial model redevelopment. Future research may apply open-source platforms to further generalize and validate the findings of this study.
In summary, this study provides an integrated multi-factor sensitivity analysis of traffic performance on long underground expressways. The results confirm that traffic volume and ratio of heavy vehicles are the dominant determinants of performance, whereas slope and lane-changing policies serve as amplifying or moderating factors. The interaction between traffic volume and heavy-vehicle share has emerged as a decisive factor in congestion. This study makes the following academic contributions:
- A comprehensive analysis of factors that previous studies addressed only in isolation.
- Combined application of statistical and machine learning techniques to identify nonlinearities and interaction effects.
- A quantitative demonstration of how underground conditions differ from surface highway operations.
Policy implications follow directly from these findings. Heavy-vehicle management strategies, such as entry restrictions, differentiated lanes, and time-of-day controls, are essential for sustaining performance. Geometric design, including the mitigation of steep grades and provision of auxiliary facilities, should be carefully considered. Finally, phased or selective lane-change restrictions may help stabilize flow under congestion.
Rather than presenting isolated results, this study integrates multiple analytical layers to provide a coherent interpretation of traffic stability and vulnerability in confined underground expressway environments.
The primary limitation of this study is its reliance on a hypothetically simulated network. Future research should enhance generalizability through empirical validation and cross-national comparisons, thereby solidifying the practical value of the results for the planning and management of next-generation underground expressway systems.
Author Contributions
Conceptualization, C.Y. (Choongheon Yang); methodology, C.Y. (Choongheon Yang); software, C.Y. (Chunjoo Yoon); validation, C.Y. (Choongheon Yang) and C.Y. (Chunjoo Yoon); formal analysis, C.Y. (Chunjoo Yoon); investigation, C.Y. (Choongheon Yang); resources, C.Y. (Choongheon Yang); data curation, C.Y. (Choongheon Yang); writing—original draft preparation, C.Y. (Choongheon Yang); writing—review and editing, C.Y. (Choongheon Yang); visualization, C.Y. (Chunjoo Yoon); supervision, C.Y. (Choongheon Yang); project administration, C.Y. (Choongheon Yang); funding acquisition, C.Y. (Choongheon Yang). All authors have read and agreed to the published version of the manuscript.
Funding
This work was supported by the Korea Agency for Infrastructure Technology Advancement (KAIA) grant funded by the Korean Government (Project No.: RS-2024-00416524; Development of technology to enhance the safety and efficiency of ultra-long K-underground expressway infrastructure).
Institutional Review Board Statement
Not applicable.
Informed Consent Statement
Not applicable.
Data Availability Statement
The data supporting the findings of this study are available from the corresponding author upon request.
Conflicts of Interest
The authors declare no personal or financial conflicts of interest regarding the research findings.
References
- Bei, R.; Du, Z.; Huang, T.; Mei, J.; He, S.; Zhang, X. Analysis and regulation of driving behavior in the entrance zone of freeway tunnels: Implementation of visual guidance systems in China. Accid. Anal. Prev. 2024, 202, 107600. [Google Scholar] [CrossRef] [Scilit]
- Liu, Y.; Pan, B.; Zhang, Z.; Zhang, R.; Shao, Y. Evaluation of design method for highway adjacent tunnel and exit connection section length based on entropy method. Entropy 2022, 24, 1794. [Google Scholar] [CrossRef] [Scilit]
- Sun, Z.; Xu, J.; Gu, C.; Xin, T.; Zhang, W. Investigation of car following and lane changing behavior in diverging areas of tunnel-interchange connecting sections based on driving simulation. App. Sci. 2024, 14, 3768. [Google Scholar] [CrossRef] [Scilit]
- Xing, R.; Zhang, Y.; Cai, X.; Lu, J.; Peng, B.; Yang, T. Vehicle-trajectory prediction method for an extra-long tunnel based on section traffic data. Sustainability 2023, 15, 6732. [Google Scholar] [CrossRef] [Scilit]
- Segarra-Morales, M.; Lapo, D.F.O.; Vasquez-Monteros, J.V. Impact of horizontal curves and gradient on the speed of heavy vehicles on two-lane rural mountain roads: Case of the Loja catamayo road. In Proceedings of the 10th World Congress on New Technologies, Barcelona, Spain, 25–27 August 2024. [Google Scholar] [CrossRef] [Scilit]
- Bloomberg, L.; Dale, J. Comparison of VISSIM and CORSIM traffic simulation models on a congested network. Transp. Res. Rec. J. Transp. Res. Board 2000, 1727, 52–60. [Google Scholar] [CrossRef] [Scilit]
- Łach, Ł.; Svyetlichnyy, D. Comprehensive review of traffic modeling: Towards autonomous vehicles. App. Sci. 2024, 14, 8456. [Google Scholar] [CrossRef] [Scilit]
- Wang, S.; Du, Z.; Zheng, H.; Han, L.; Xia, X.; He, S. Improving driving safety in freeway tunnels: A field study of linear visual guiding facilities. Tunnell. Undergr. Space Technol. 2024, 143, 105489. [Google Scholar] [CrossRef] [Scilit]
- Shao, X.; Chen, F.; Ma, X.; Pan, X. The impact of lighting and longitudinal slope on driver behavior in underwater tunnels: A simulator study. Tunnell. Undergr. Space Technol. 2022, 122, 104367. [Google Scholar] [CrossRef] [Scilit]
- Qin, P.; He, J.; Zhang, C.; Ye, Y.; Zhang, H.; Wang, M.; Yan, T. How does an extra-long expressway tunnel influence driving performance? A comparative study of driving simulation. KSCE J. Civ. Eng. 2023, 27, 4043–4059. [Google Scholar] [CrossRef] [Scilit]
- Yang, Y.; Du, Z.; Huang, T.; Mei, J. Analysis of visual load on curve and longitudinal slope combination of extra-long underwater tunnel based on visual sensitive region. Transp. Res. Rec. J. Transp. Res. Board 2024, 2678, 138–152. [Google Scholar] [CrossRef] [Scilit]
- He, S.; Du, Z.; Mei, J.; Han, L. Driving behavior inertia in urban tunnel diverging areas: New findings based on task-switching perspective. Trans. Rec. Part F 2025, 109, 1007–1023. [Google Scholar] [CrossRef] [Scilit]
- Gu, C.; Liu, X.; Mao, N. Driver behavior mechanisms and conflict risk patterns in tunnel-interchange connecting sections: A comprehensive investigation based on the behavioral adaption theory. Sustainability 2024, 16, 8701. [Google Scholar] [CrossRef] [Scilit]
- Yang, Y.; Du, Z.; Pan, F.; Faus, M. Driving safety evaluation of longitudinal slope and curve combination of extra-long underwater tunnels. Cogn. Technol. Work 2024, 26, 603–618. [Google Scholar] [CrossRef] [Scilit]
- Wang, S.; Zheng, H.; Du, Z.; Han, L.; He, S.; Jiao, F. Comprehensive evaluation of visual guiding systems for enhancing traffic safety in freeway tunnels: An improved matter-element method with case study. Trans. Res. Rec. 2024, 2678. [Google Scholar] [CrossRef] [Scilit]
- Yuan, J.; Abdel-Aty, M.; Cai, Q.; Lee, J. Investigating driver’s mandatory lane change behavior on the weaving section of freeway with managed lanes: A driving simulator study. Trans. Rec. Part F 2019, 62, 11–32. [Google Scholar] [CrossRef] [Scilit]
- Ji, A.; Ramezani, M.; Levinson, D. Pricing lane changes. Trans. Rec. Part C 2023, 149, 104062. [Google Scholar] [CrossRef] [Scilit]
- Jin, J.; Li, Y.; Huang, Y.; Zhang, G.; Xie, K.; Liu, P. A variable speed limit control approach for freeway tunnels based on model-based reinforcement learning with safety perception. Accid. Anal. Prev. 2024, 201, 107570. [Google Scholar] [CrossRef] [Scilit]
- Qu, X.; Yang, M.; Ji, J.; Li, L.; Ran, B. Analyzing the safety impacts of variable speed limit control on aggregated driving behavior based on traffic big data. J. Adv. Transp. 2021, 2021, 8823292. [Google Scholar] [CrossRef] [Scilit]
- Abdulghani, A.; Rakha, H.; Yang, H. Differential variable speed limits to improve performance and safety of car-truck mixed traffic on freeways. Traffic Transp. Eng. 2022, 9, 1003–1016. [Google Scholar] [CrossRef] [Scilit]
- Arora, K.; Katten, L. Operational and safety impacts of integrated variable speed limit with dynamic hard shoulder running. J. Intell. Transp. Syst. 2023, 27, 769–798. [Google Scholar] [CrossRef] [Scilit]
- Sroczynski, A.; Czyżewski, A. Road traffic can be predicted by machine learning equally effectively as by complex microscopic model. Sci. rep. 2023, 13, 14523. [Google Scholar] [CrossRef] [Scilit]
- Xing, Z.; Huang, M.; Peng, D. Overview of machine learning-based traffic flow prediction. Digit. Transp. Saf. 2023, 2, 164−175. [Google Scholar] [CrossRef] [Scilit]
- Wang, M.; Zhen, J. Predictive modeling of vehicle speed using machine learning: A case study with traffic flow features. In Proceedings of the 4th Asia-Pacific Artificial Intelligence and Big Data Forum (AIBDF’24), Ganzhou, China, 27–29 December 2025; pp. 996–1000. [Google Scholar] [CrossRef] [Scilit]
- Xu, C.; Ozbay, K.; Liu, H.; Xie, K.; Yang, D. Exploring the impact of truck traffic on road segment-based severe crash proportion using extensive weigh-in-motion data. Saf. Sci. 2023, 166, 106996. [Google Scholar] [CrossRef] [Scilit]
- Guo, N.; Jiang, F.; Zhu, K.; Wu, C.; Hao, Q. The solid line prohibiting lane changing to improve traffic safety in ramp influence areas. Transp. B 2023, 11, 1218–1233. [Google Scholar] [CrossRef] [Scilit]
- Yang, C.; Yoon, C. Traffic sensitivity analysis of effects of lane configuration and lane change control on underground expressways. J. Digit. Content. Soc. 2025, 26, 1933–1942. (In Korean) [Google Scholar] [CrossRef] [Scilit]
- Yang, C.; Yoon, C.; Ko, S.; Lee, J. Analysis of traffic performance in underground expressways using microscopic traffic simulation. Int. J. Highw. Eng. 2025, 27, 103–115. (In Korean) [Google Scholar] [CrossRef] [Scilit]
- Ministry of Land, Infrastructure and Transport. Korean Highway Capacity Manual; Ministry of Land, Infrastructure and Transport: Sejong, Republic of Korea, 2013.
- Lee, J.; Park, S.; Bang, S. Analysis of driving characteristics by gradient and heavy vehicle ratio in underground road. Int. J. Highw. Eng. 2024, 26, 61–72. (In Korean) [Google Scholar] [CrossRef] [Scilit]

Disclaimer/Publisher’s Note: The statements, opinions and data contained in all publications are solely those of the individual author(s) and contributor(s) and not of MDPI and/or the editor(s). MDPI and/or the editor(s) disclaim responsibility for any injury to people or property resulting from any ideas, methods, instructions or products referred to in the content. |
© 2026 by the authors. Licensee MDPI, Basel, Switzerland. This article is an open access article distributed under the terms and conditions of the Creative Commons Attribution (CC BY) license.