


Abstract
Fissured rock masses in cold regions undergo matrix deterioration and structural weakening simultaneously, and separating the contribution of each remains difficult. Intact sandstone and parallel double-flawed sandstone with fissure inclinations of 30°, 45°, and 60° were therefore tested in uniaxial compression after 0, 10, 20, 30, and 50 freeze–thaw cycles, with digital image correlation (DIC), acoustic emission (AE), and scanning electron microscopy (SEM) linking macroscopic degradation to strain localization, crack activity, and microstructural change. Peak strength and apparent elastic modulus generally decreased with freeze–thaw cycling: after 50 cycles, the peak strength of intact specimens decreased from approximately 148 to 100 MPa, while the mean apparent elastic modulus of the 60° flawed group decreased from 13.14 to 6.49 GPa (49.36% retained). Freeze–thaw treatment altered the progressive development of surface strain localization and was associated with earlier AE activity, whereas fissure inclination influenced the spatial distribution of localized deformation and the resulting failure modes. Analysis based on the ratio of rise time to amplitude (RA) and average frequency (AF) showed a growing proportion of tensile cracking in every configuration; the 45° group shifted from 55.39% shear-dominated to 68.23% tensile-dominated. SEM images recorded progressive pore enlargement, interfacial debonding, and particle spalling. This study provides experimental evidence linking freeze–thaw-induced mechanical degradation with fissure inclination-dependent damage localization and fracture evolution in double-flawed sandstone. Freeze–thaw cycling thus sets the deterioration level of the material, while fissure inclination directs where and how failure develops.
1. Introduction
Natural rock masses commonly contain joints, bedding planes, and fractures that influence their strength, deformability, and crack initiation and coalescence under loading [1]. As mechanically weak interfaces and preferential pathways for fluid migration, these discontinuities can also govern coupled hydrological and mechanical behavior [2,3]. Their significance extends to naturally fractured reservoirs: Debossam et al. [4] simulated fluid transport in fractured oil reservoirs, while Shirzad et al. [5] examined hydrogen storage and cushion-gas behavior in naturally fractured formations. These studies provide a broader context for the roles of fractures and fracture–matrix interactions in natural rock masses.
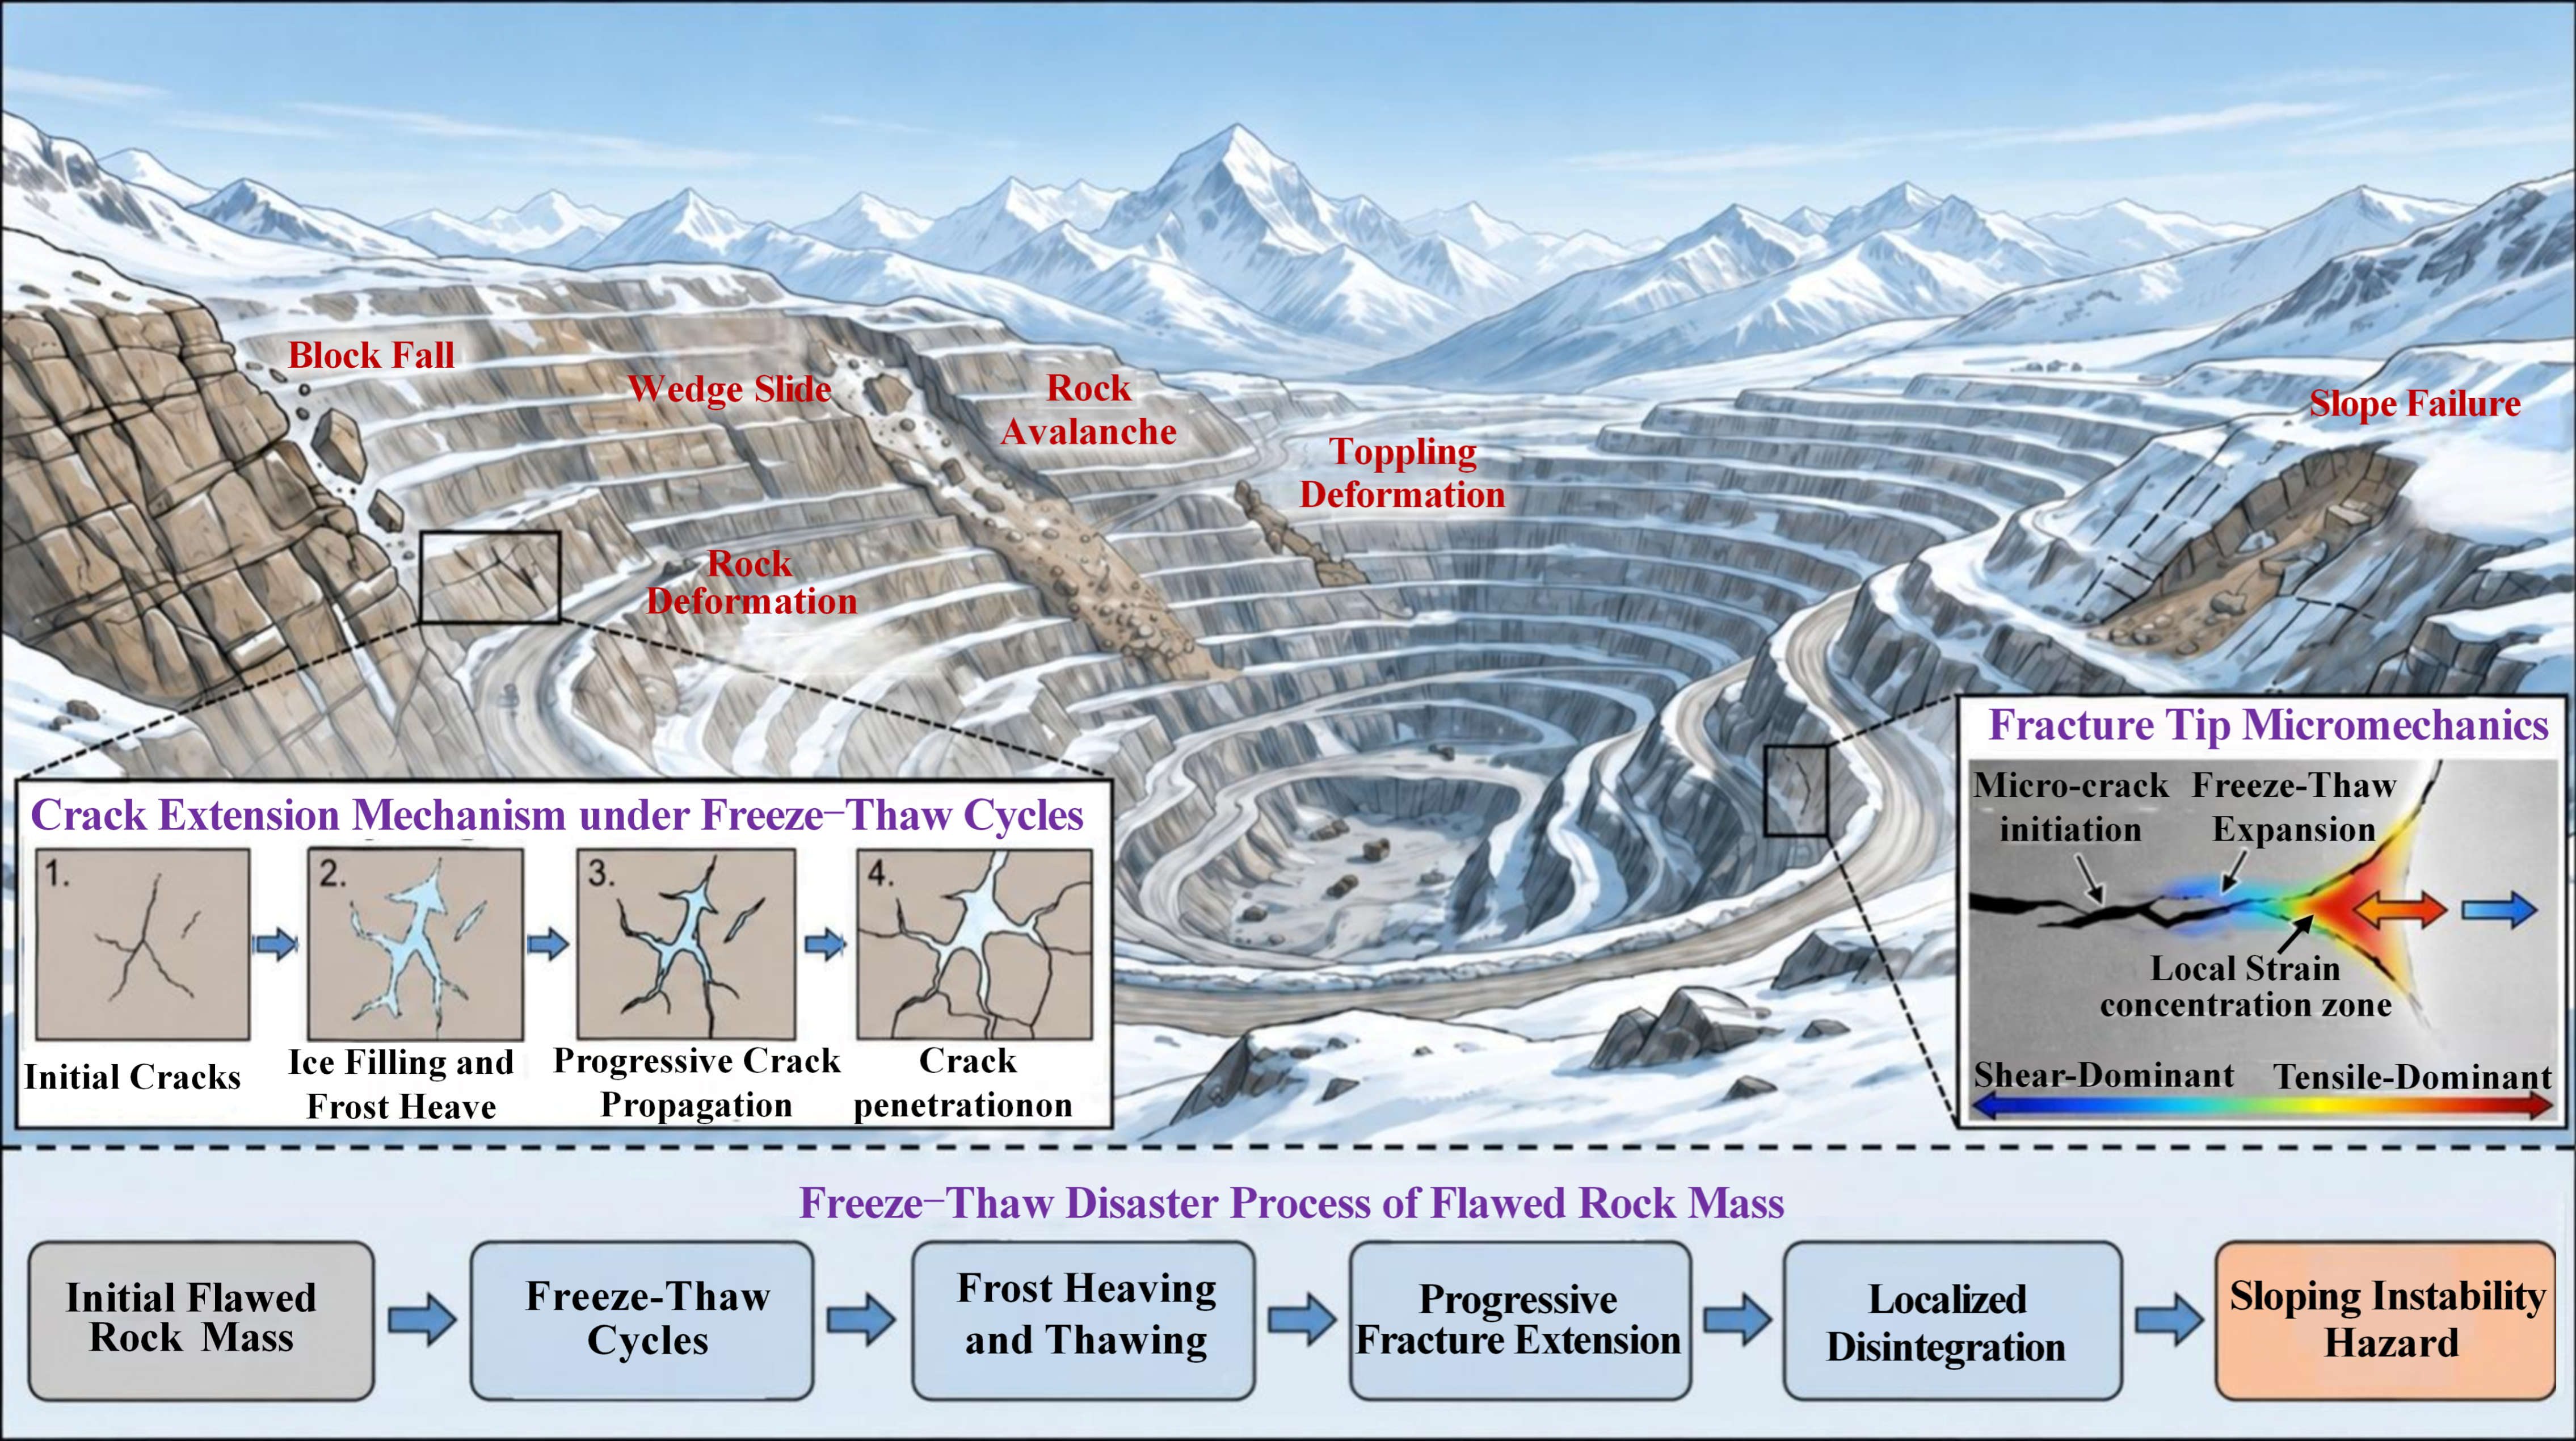
In cold and high-altitude environments, repeated freezing and thawing of water in rock pores and pre-existing fissures can generate frost-heave pressure, promote fissure opening, and contribute to local deterioration [6,7]. The consequences have been investigated in fractured rock associated with alpine open-pit mining [8], cold-region tunnels [9], and unstable or toppling rock masses exposed to freeze–thaw and ice-wedging processes [10,11,12]. Thus, freeze–thaw damage in fractured rock involves both changes in the rock matrix and the influence of water-filled discontinuities on subsequent deformation and instability (Figure 1).
Previous studies have reported changes in fracture toughness, strength, failure behavior, and acoustic activity in intact and fractured rocks after freeze–thaw exposure [13,14,15,16,17]. Microstructural investigations further indicate that freeze–thaw cycles can modify pore connectivity and promote crack growth. For example, Che et al. [18] investigated pore-network evolution in fractured rock using combined NMR and CT observations, Wang et al. [19] studied pore structure and permeability changes in slate, and Yu et al. [20] examined fracture-process-zone evolution in sandstone. These observations are consistent with the deterioration of rock-matrix integrity, which can contribute to the loss of stiffness and fracture resistance [21]. However, matrix deterioration alone does not determine the paths along which pre-existing fissures interact and ultimately coalesce.
Figure 1.
Schematic illustration of freeze–thaw-induced failure processes in flawed rock slopes.
Fissure geometry plays an additional structural role by modifying local stress concentrations and crack interactions. Sun et al. [22] examined frost-crack propagation and interaction in fissured rocks, and Huang et al. [23] investigated crack coalescence and strength loss in rock-like specimens containing two parallel water-filled flaws. Chen et al. [14] investigated freeze–thaw failure characteristics and strength loss in rock masses with different fracture densities, whereas Chen and Lin [24] examined the deterioration of Hoek–Brown parameters in multi-fractured rock masses under freeze–thaw cycling. Pan et al. [25] assessed the degradation of rock-joint shear resistance under cycling. These findings emphasize that fissure configuration influences how freeze–thaw-damaged rock deforms and fails.
The combined roles of freeze–thaw treatment and fissure configuration have also received increasing attention. Yu et al. [26] investigated the effects of rock-bridge inclination on the failure of fractured sandstone after freeze–thaw treatment, while Dai et al. [27] examined double-flawed sandstone with different flaw angles under combined freeze–thaw and cyclic loading. Zhang et al. [28] monitored frost-heave pressure and mechanical deterioration in flawed sandstone, Zhao et al. [29] studied crack propagation and acoustic emission in jointed rock using discrete-element modeling, and Liang et al. [30] explored acoustic emission indicators for failure prediction. Together with simulations of water-filled fractured rock [7], these studies connect fissure geometry with local deterioration and fracture evolution, although their loading schemes and monitoring approaches differ.
Nevertheless, several questions remain. Existing investigations have addressed intact or generally fractured rocks [31], single fissures [32], intersecting fissures [33], spatially rotated fissures [34], combined freeze–thaw and unloading conditions [35], and nonparallel double fissures [36]. Other work has focused on constitutive modeling [37] or crack-propagation patterns [38]. To the best of our knowledge, integrated experimental evidence remains limited for sandstone containing two parallel fissures of fixed length and width and a fixed rock-bridge length, with inclination varied across multiple freeze–thaw levels. In particular, the relationship among loss of load-bearing capacity, bridge-zone strain localization, acoustic-event characteristics, and final crack coalescence requires clarification, and the respective roles of matrix deterioration and fissure geometry should not be assumed to be statistically separable without quantitative examination.
To address these issues, the present study compares intact sandstone with parallel double-flawed sandstone containing fissures inclined at 30°, 45°, and 60° after 0, 10, 20, 30, and 50 freeze–thaw cycles. Fissure length, width, and rock-bridge length were kept constant, allowing the effects of freeze–thaw level and fissure inclination on the measured mechanical response to be compared. Uniaxial compression tests were combined with digital image correlation (DIC), acoustic emission (AE), rise-time-to-amplitude/average-frequency (RA–AF) analysis, and scanning electron microscopy (SEM) to relate macroscopic strength and apparent stiffness changes to deformation localization, acoustic-event characteristics, and post-failure microstructural observations.
This study examines three hypotheses: (1) increasing freeze–thaw exposure generally reduces peak strength and apparent elastic modulus within each specimen configuration; (2) at a given freeze–thaw level, fissure inclination influences strain localization and crack-coalescence patterns; and (3) the proportion of tensile-type AE events generally increases with freeze–thaw exposure, with an inclination-dependent magnitude of change. The combined observations are used to distinguish shared degradation trends from configuration-dependent failure characteristics.
2. Materials and Methods
2.1. Specimen Preparation
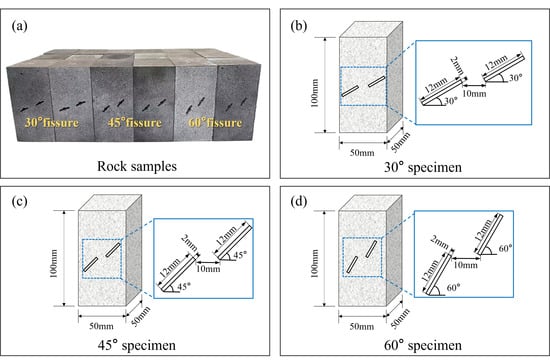
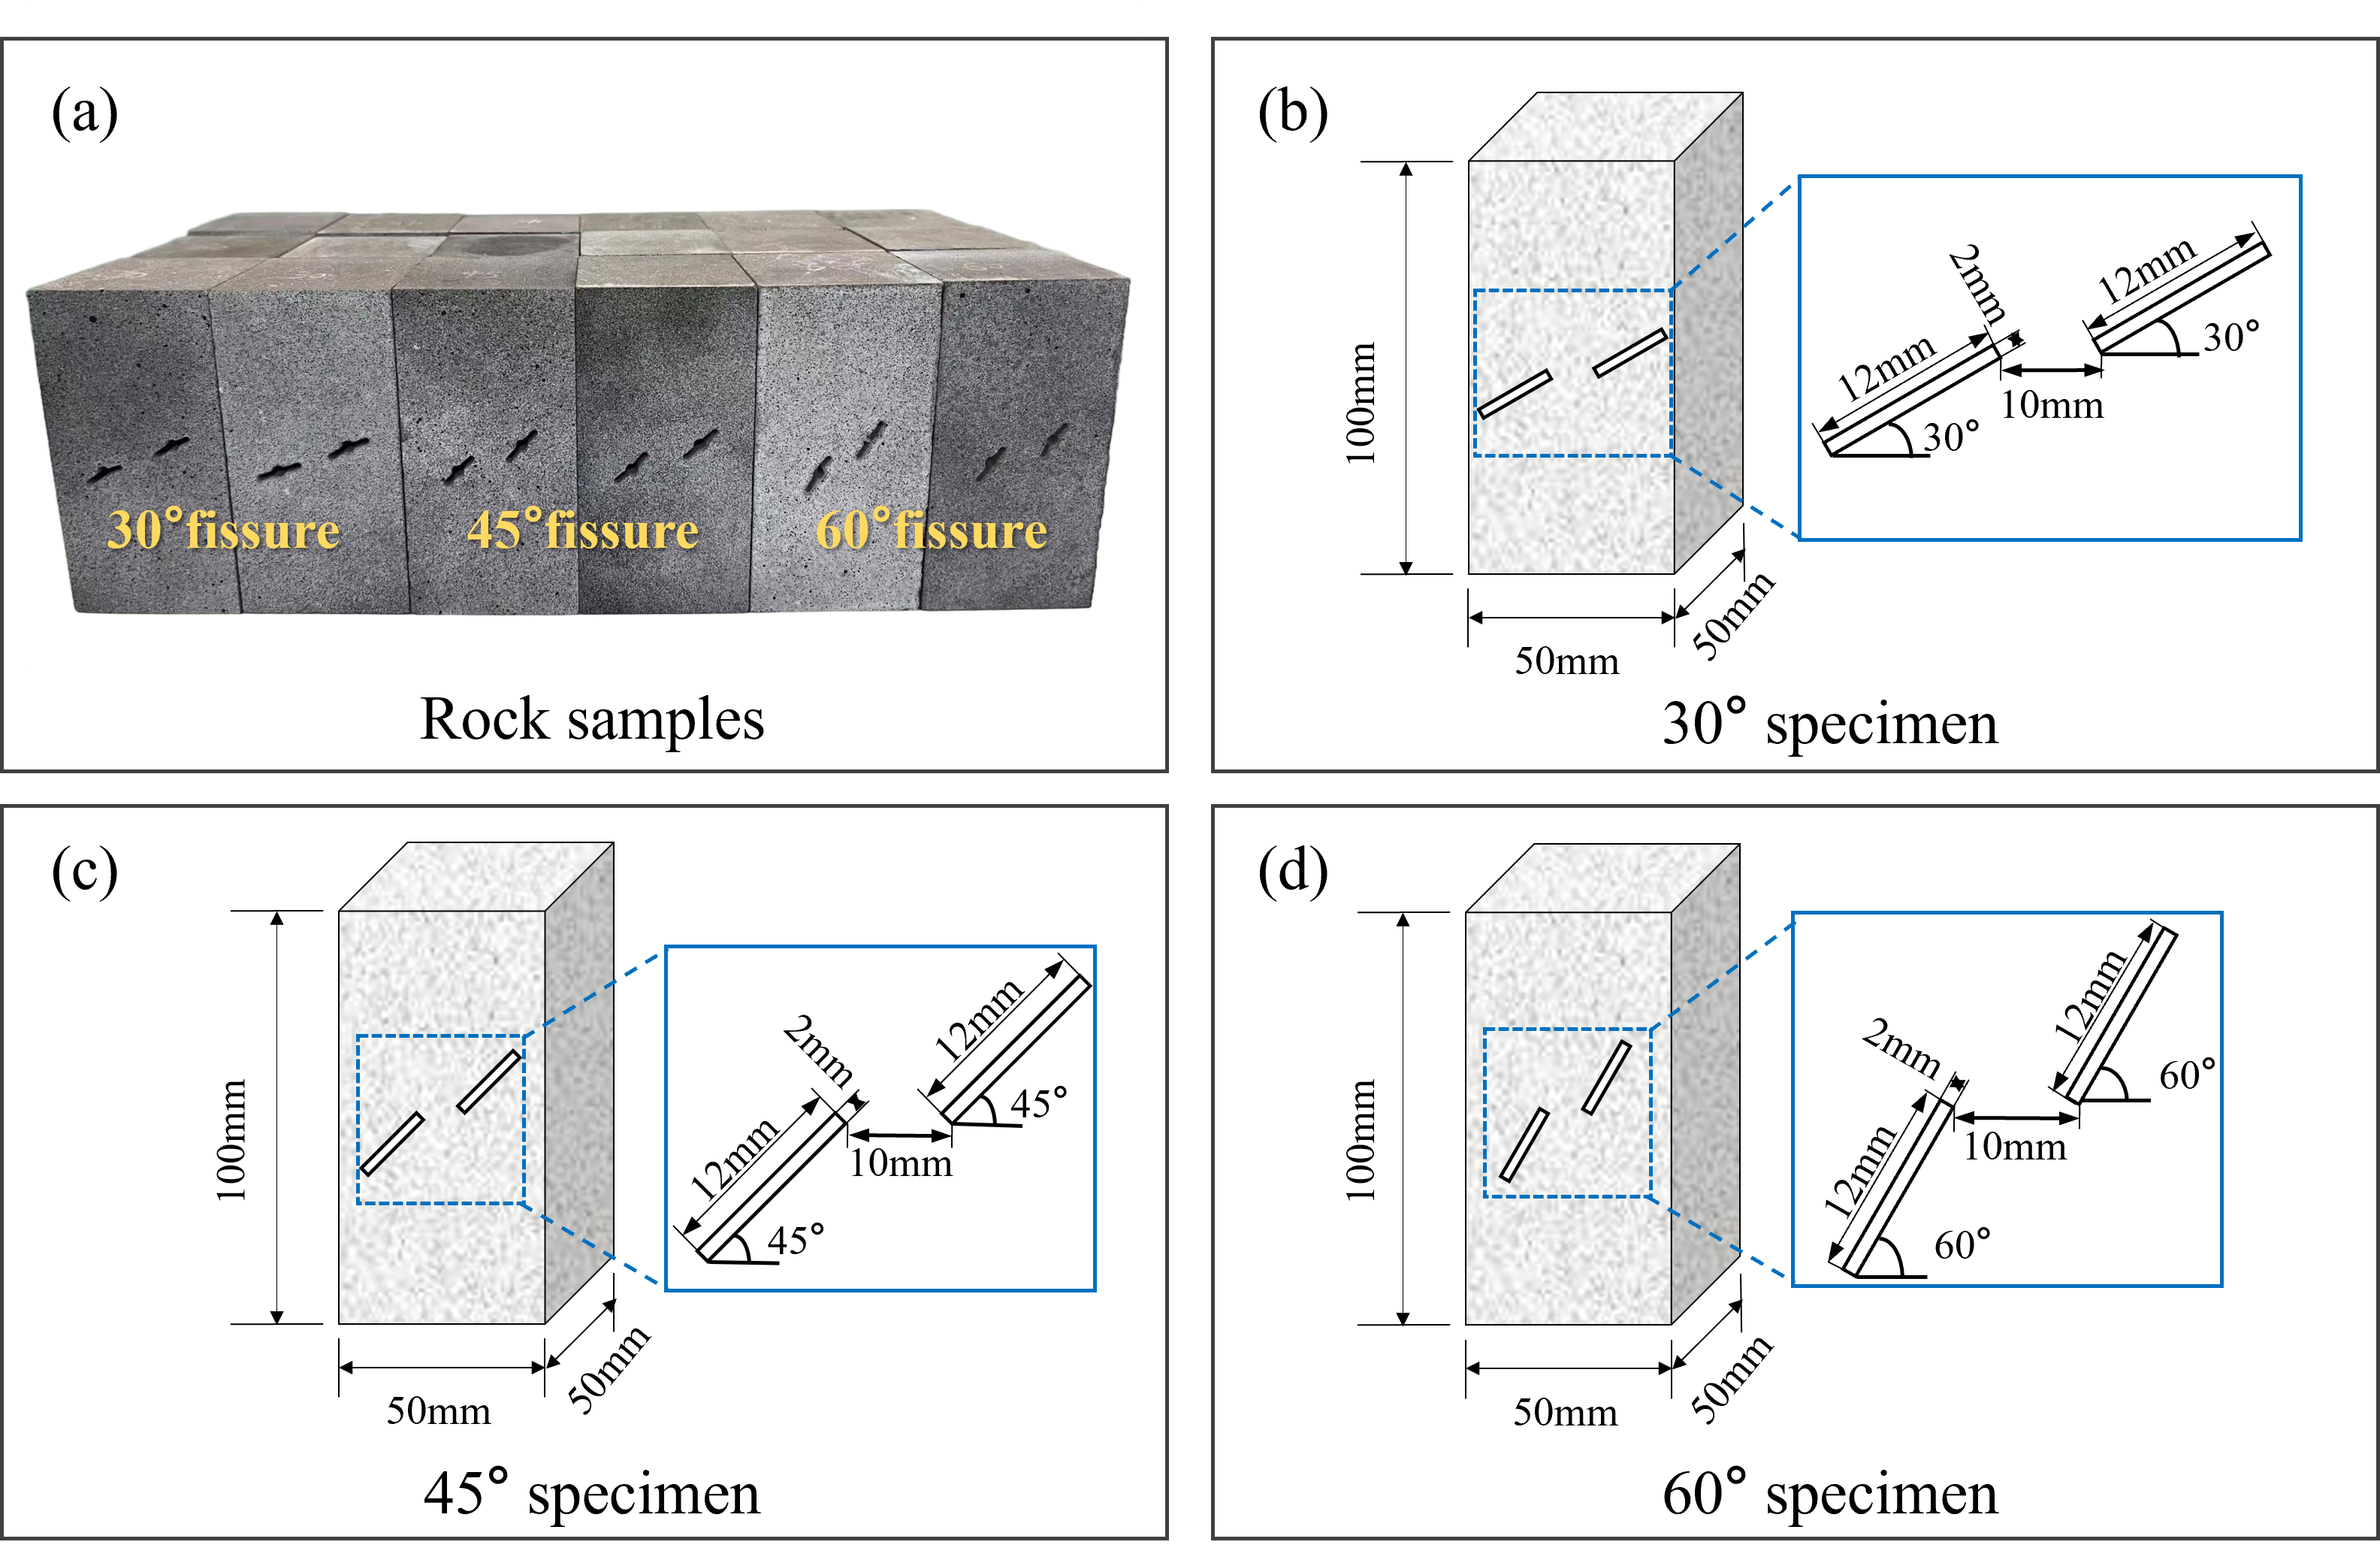
To minimize material scatter, every specimen was taken from a single sandstone block. Prismatic samples of 50 mm × 50 mm × 100 mm were cut and polished, and the two loading faces were ground flat and parallel to meet the tolerances required for uniaxial compression testing. Three groups of double-flawed sandstone specimens with fissure inclinations of 30°, 45°, and 60° were prepared together with intact controls (Figure 2). The prefabricated fissures were produced using water-jet cutting technology and extended through the entire 50 mm thickness of each specimen. Each flawed specimen contained two parallel fissures, each with a length of 12 mm and a nominal width of 2 mm. The fissure inclination was defined as the angle between the fissure centerline and the horizontal direction. The fissure inclinations of 30°, 45°, and 60° were selected based on previous experimental studies and mechanical considerations. Dai et al. [27] investigated double-flawed sandstone specimens with different fissure inclinations under combined freeze–thaw treatment and cyclic loading, including the three angles considered in the present study. From a mechanical perspective, under idealized uniaxial compression, the resolved shear stress on an inclined plane reaches its maximum at 45°. In contrast, the 30° and 60° orientations experience equal magnitudes of resolved shear stress but different normal compressive stresses. Therefore, these three angles provide a meaningful basis for comparing the effects of different combinations of normal and shear stresses on inclined fissures. The selected configurations also allow the influence of fissure orientation on mechanical response and crack propagation to be investigated while maintaining a manageable experimental program. The two fissures were arranged in an offset configuration, as illustrated in Figure 2. The rock-bridge length was defined as the straight-line distance between the adjacent inner fissure tips and was maintained at 10 mm. The rock-bridge orientation was defined by the line connecting these two tips. While the nominal fissure dimensions and rock-bridge length were kept constant, the relative geometric relationship between the fissures and the rock bridge was considered when evaluating the effects of fissure inclination.
Figure 2.
Prepared sandstone specimens and geometric configuration of the prefabricated fissures: (a) prepared specimens; (b) geometry of the specimen with 30° fissures; (c) geometry of the specimen with 45° fissures; and (d) geometry of the specimen with 60° fissures.
To minimize material variability, all specimens were obtained from the same sandstone block. The specimens were divided into three replicate groups, each containing 20 experimental conditions comprising four fissure configurations (intact, 30°, 45°, and 60°) and five freeze–thaw levels (0, 10, 20, 30, and 50 cycles). Thus, three specimens were prepared for each experimental condition, resulting in 60 specimens in total. This grouping arrangement provided a basis for evaluating experimental repeatability and the variability of the mechanical responses.
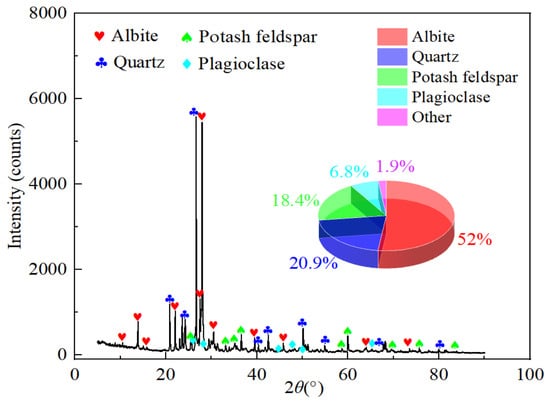
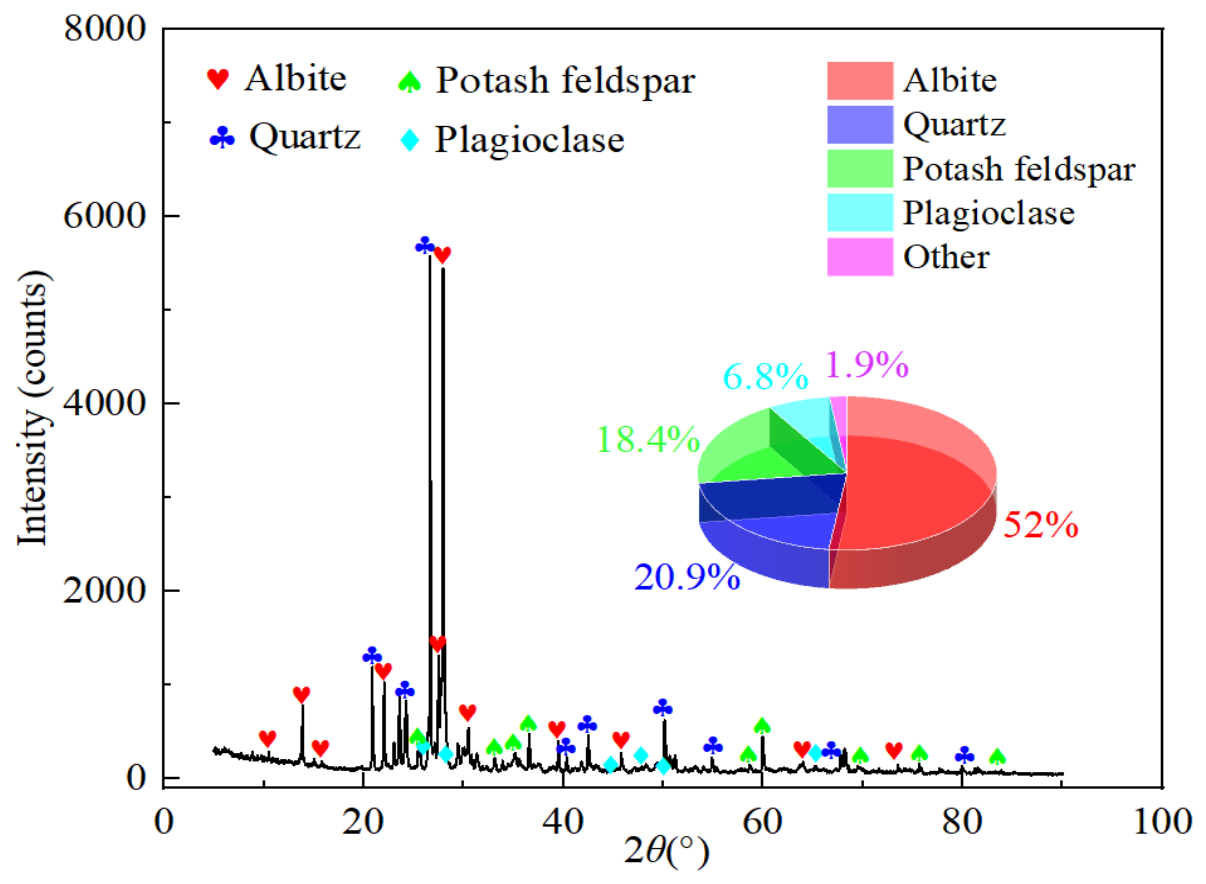
The mineral composition of the sandstone was determined by X-ray diffraction (XRD) using a Bruker D8 ADVANCE diffractometer (Bruker AXS, Karlsruhe, Germany) equipped with a Cu-target X-ray source. The diffraction patterns were analyzed using JADE software (Version 6.5), and the relative mineral contents were estimated through software-assisted semi-quantitative analysis. As shown in Figure 3, the sandstone consists mainly of albite (52.0%), quartz (20.9%), and potash feldspar (18.4%), together with 6.8% plagioclase and 1.9% other minerals. This feldspar-dominated, quartz-bearing mineral assemblage provides a basis for qualitatively interpreting the possible influence of mineral heterogeneity and intergranular contacts on microcrack development under freeze–thaw cycling, as further discussed in Section 4.3.
Figure 3.
X-ray diffraction pattern and mineral composition of the sandstone specimen.
2.2. Freeze–Thaw Cycle Treatment
Before freeze–thaw treatment, all sandstone specimens underwent vacuum saturation, consisting of 6 h of vacuum treatment followed by 24 h of water immersion. After saturation, excess water on the specimen surfaces was carefully wiped off, while water remained within the prefabricated fissures. The specimens were then assigned to five groups corresponding to 0, 10, 20, 30, and 50 freeze–thaw cycles, with the 0-cycle group serving as the control. The selected cycle intervals allowed the progressive deterioration of sandstone under different degrees of freeze–thaw exposure to be investigated.
The cycle intervals were designed to provide relatively detailed observations during the initial 0–30 cycles, while extending the interval to 50 cycles allowed the accumulated damage under prolonged freeze–thaw exposure to be evaluated with a manageable number of specimens.
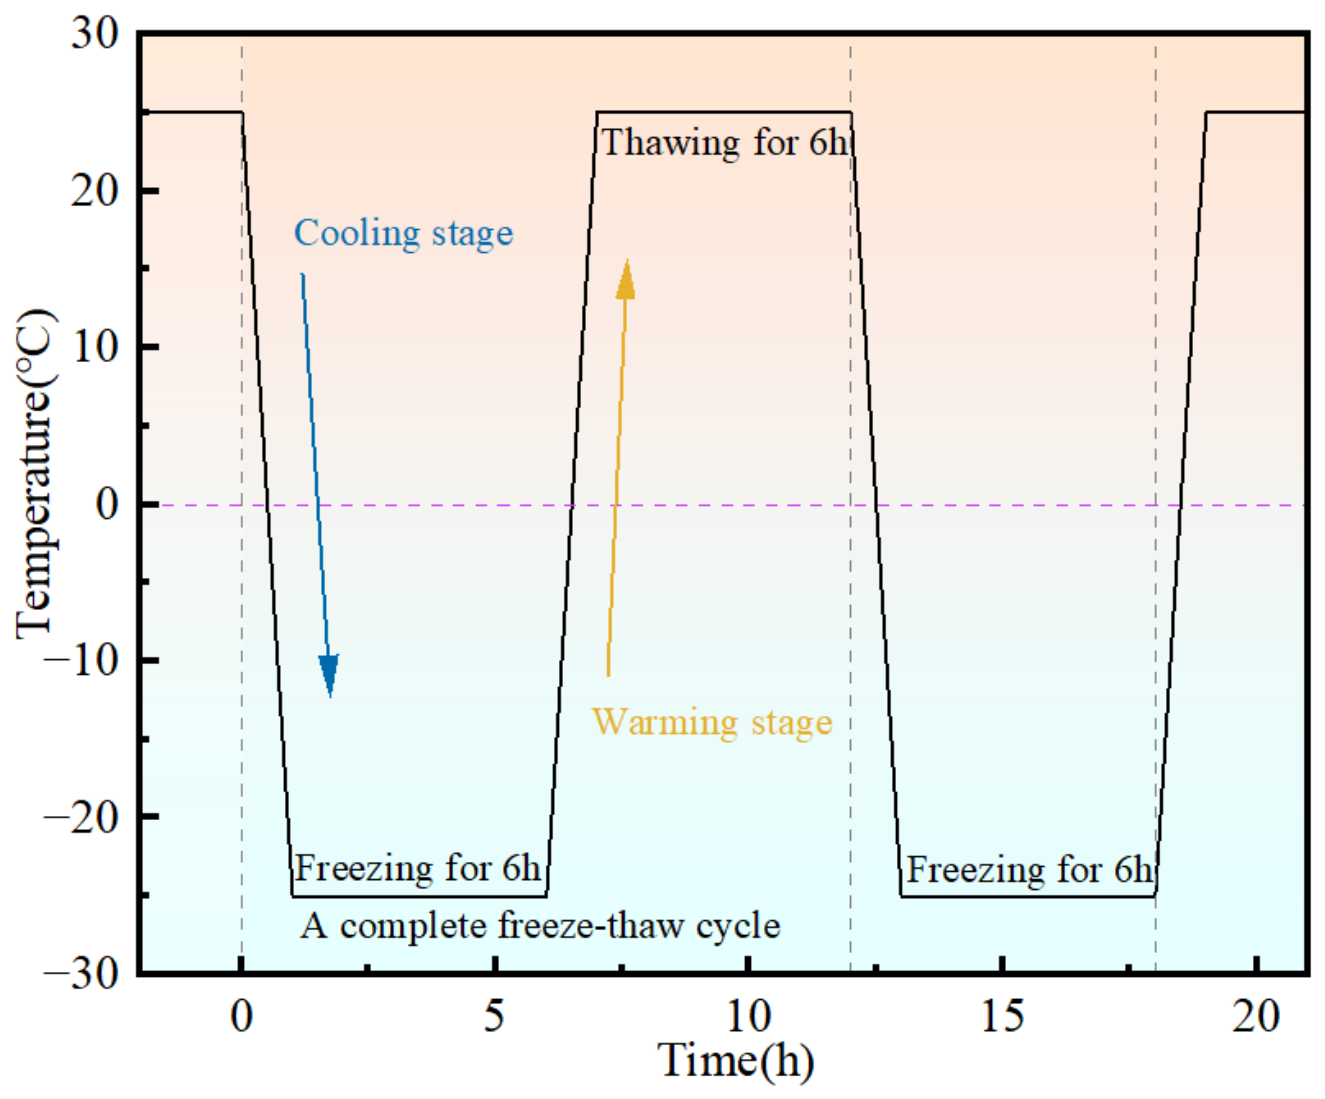
Freeze–thaw cycling was conducted following the temperature–time procedure shown in Figure 4. The saturated specimens were placed in specimen storage bags and frozen at −25 °C for 6 h using a DW-25 freezing chamber, including the cooling stage. Subsequently, the specimens were thawed in a water bath maintained at 25 °C for 6 h, including the warming stage [28]. Thus, each complete freeze–thaw cycle lasted 12 h. The presence of water within the prefabricated fissures provided conditions for ice formation during freezing. After completion of the designated freeze–thaw cycles, the specimens were dried in an oven to remove residual moisture before uniaxial compression testing. The 0-cycle specimens served as the reference group for evaluating the mechanical degradation associated with repeated freeze–thaw treatment.
The same freeze–thaw procedure was applied to all treatment groups to ensure consistent experimental conditions.
Figure 4.
Temperature–time path of the freeze–thaw cycle treatment.
2.3. Experimental Setup and Procedures
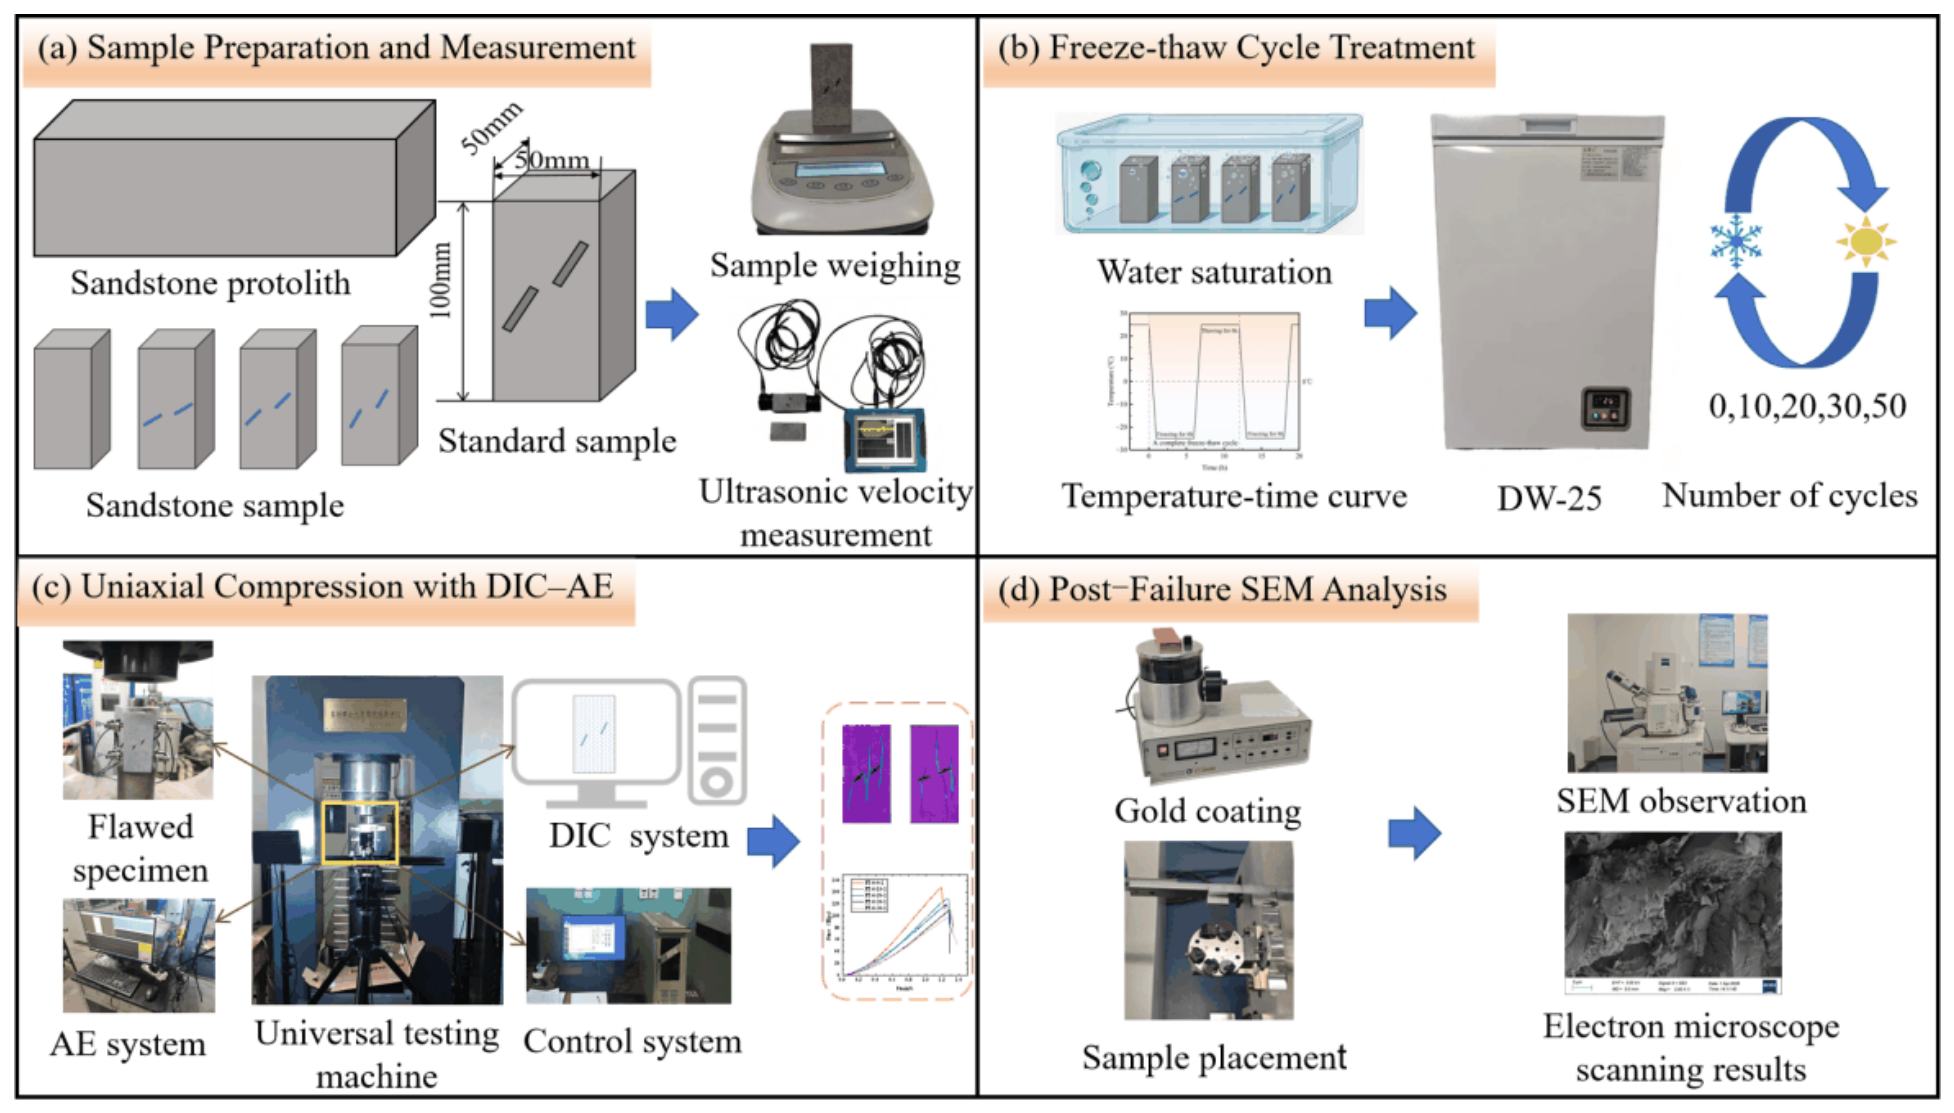
The experimental setup is illustrated in Figure 5. Uniaxial compression tests were conducted using a multi-field coupled high-load disturbance testing apparatus (Changchun Huiyang Scientific Instrument Co., Ltd., Changchun, China). Acoustic emission (AE) signals generated during the compression process were acquired using a full-information acoustic emission signal analyzer manufactured by Beijing Ruandao Times Technology Co., Ltd. (Beijing, China). Meanwhile, an optical imaging system was employed to synchronously record the fracture process of double-flawed sandstone specimens under uniaxial compressive loading.
The digital image correlation (DIC) system consisted of two LED light sources, a DaHeng industrial camera (MatchID, Ghent, Belgium), and an image analysis system. The camera was positioned approximately 0.5 m in front of the specimen, with an image acquisition rate of 5 frames per second and a resolution of 4096 × 3000 pixels, enabling continuous monitoring of crack initiation and propagation during loading. The acquired speckle images were subsequently imported into MatchID-2D 2026.2 software for digital image correlation analysis to determine the displacement and deformation fields of the specimens.
Figure 5.
Experimental workflow for flawed sandstone after freeze–thaw cycle treatment.
The multi-field coupled high-load disturbance testing apparatus is capable of performing various rock mechanics tests, including uniaxial compression creep tests, triaxial compression creep tests, and shear strength tests, allowing the determination of mechanical properties such as uniaxial compressive strength and elastic modulus.
The AE monitoring system was equipped with six RS-2A sensors, each with a central frequency of 150 kHz, which were mounted at different positions on the specimen surfaces. To improve acoustic coupling and minimize signal attenuation, petroleum jelly was applied between the sensors and the specimen surfaces. For AE source localization, a spatial geometric model was established based on the specimen dimensions, and the corresponding sensor coordinates were specified in the AE analysis system. The AE acquisition threshold was set to 40 dB. The AE event count was defined as the number of recorded acoustic emission events within a 1 s time interval, and the cumulative AE event count represented the total number of recorded events accumulated during loading. Prior to loading, a tapping test was performed on each specimen to verify the proper operation of all six AE acquisition channels.
Uniaxial compression tests were performed under displacement control at a constant loading rate of 0.2 mm/min. The mechanical loading, AE signal acquisition, and image acquisition were conducted synchronously throughout the tests. Following the experiments, the recorded data were processed and analyzed to characterize the mechanical response, deformation evolution, and fracture behavior of the double-flawed sandstone specimens.
For each experimental condition, the mean and sample standard deviation of the mechanical parameters were calculated from three independent specimens. The sample standard deviation was calculated using n − 1 as the denominator. To compare the relative degradation among different specimen configurations, the peak strength and apparent elastic modulus were normalized by their corresponding mean values at zero freeze–thaw cycles. An apparent stiffness degradation index was further introduced based on the normalized modulus.
A two-way analysis of variance (ANOVA) was performed on the individual results of 45 fissured specimens to examine the effects of freeze–thaw cycles (five levels), fissure inclination (three levels), and their interaction on peak strength and apparent elastic modulus. The significance level was set at 0.05, and partial eta-squared (η2p) was calculated to assess the magnitude of each effect. Residual normality and homogeneity of variance were evaluated using the Shapiro–Wilk and median-based Levene tests, respectively. The normalized mechanical parameters are defined as follows:
and
where Rσ(θ,N) and RE(θ,N) represent the peak strength retention ratio and apparent elastic modulus retention ratio, respectively; Dapp(θ,N) denotes the apparent stiffness degradation index; θ represents the specimen configuration, including intact specimens and specimens containing fissures inclined at 30°, 45°, and 60°; and N denotes the number of freeze–thaw cycles (0, 10, 20, 30, and 50).
The mean peak compressive strength (MPa) and mean apparent elastic modulus (GPa) after N freeze–thaw cycles are denoted by the corresponding symbols σc and Eapp with an overbar, respectively. The same symbols evaluated at N = 0 represent the initial mean values for each specimen configuration and serve as the reference values for normalization. The overbar indicates the arithmetic mean calculated from three independent specimens under each experimental condition.
The peak strength and apparent elastic modulus retention ratios are expressed as percentages. A retention ratio of 100% indicates that the corresponding mechanical property remains unchanged relative to its initial value, whereas a lower value indicates greater relative degradation. The apparent stiffness degradation index is dimensionless and is defined as one minus the ratio of the apparent elastic modulus after N freeze–thaw cycles to its corresponding initial value. Thus, Dapp = 0 at zero freeze–thaw cycles, and a larger positive value indicates greater relative stiffness degradation.
It should be noted that the apparent stiffness degradation index is derived from the measured apparent elastic modulus and does not directly quantify internal microstructural damage. All normalized indices were calculated separately for each specimen configuration to facilitate comparisons of relative mechanical degradation under different freeze–thaw conditions.
3. Mechanical Degradation Characteristics
3.1. Stress–Strain Response Under Different Freeze–Thaw Cycles
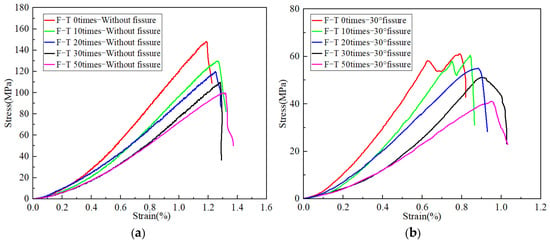
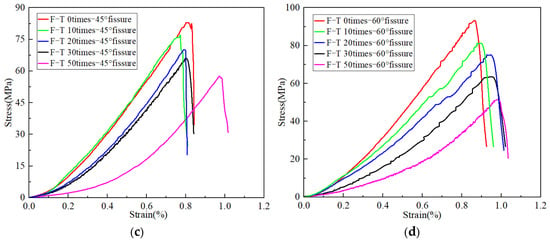
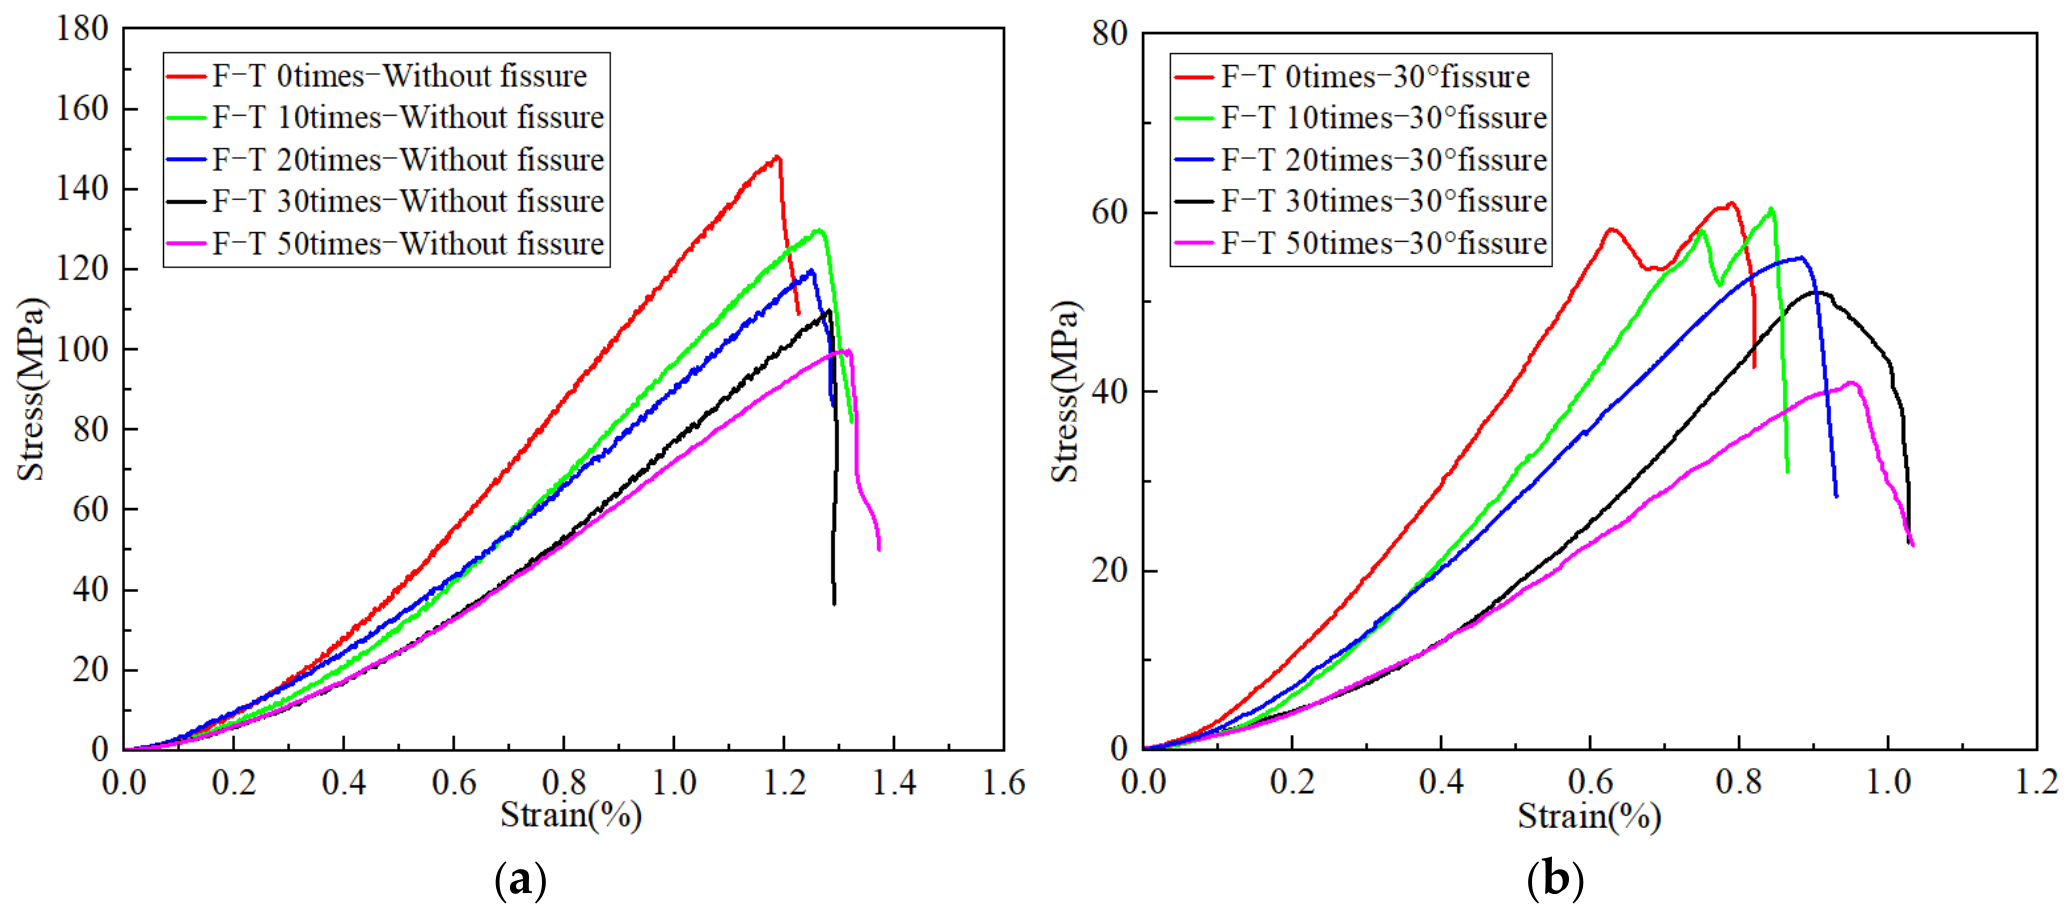
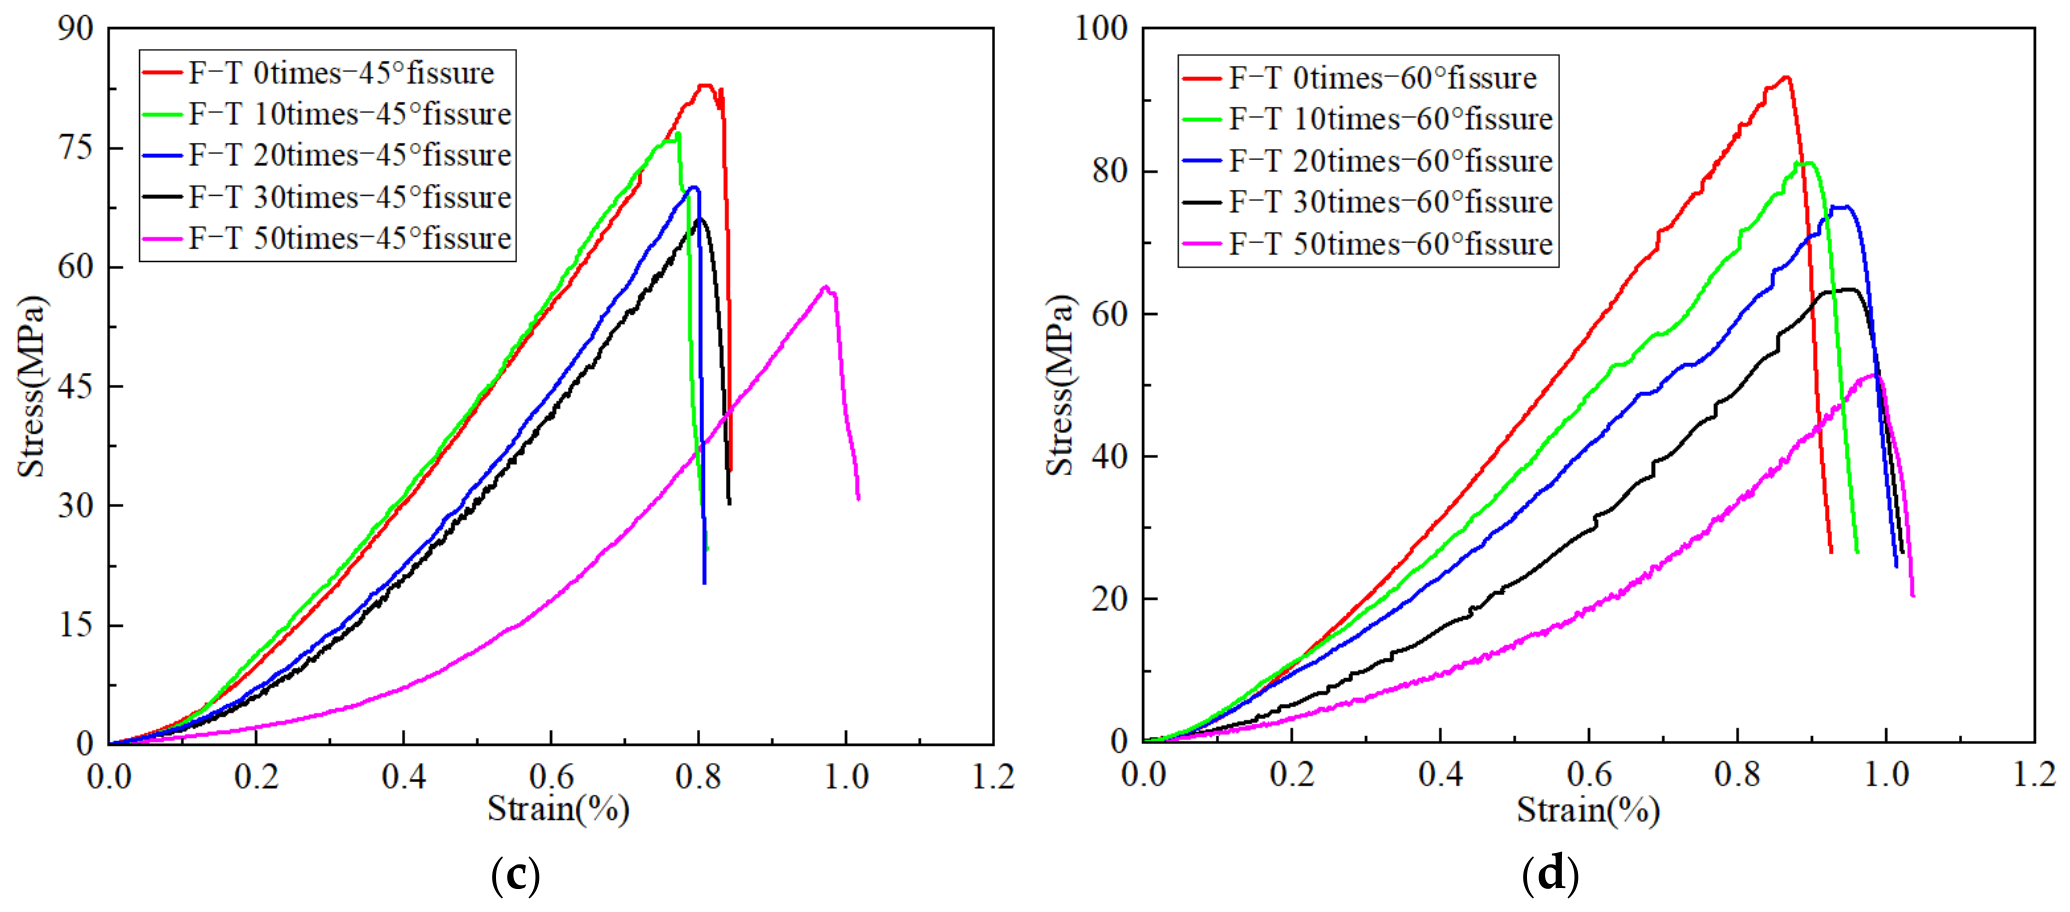
The deformation and failure behavior of the double-flawed sandstone under different freeze–thaw levels and fissure inclinations can be read directly from the stress–strain response [38,39]; the complete curves of all specimen groups are compiled in Figure 6, where the curve shown for each condition is representative of the three parallel tests. Irrespective of fissure geometry, every curve passes through four stages: initial compaction, quasi-linear deformation, nonlinear damage accumulation, and post-peak softening. Closure of pores and pre-existing microcracks accounts for the initial concave segment, while the departure from linearity that follows marks the onset of progressive crack growth toward the peak.
Figure 6.
Uniaxial stress–strain curves of sandstone specimens under different freeze–thaw cycles: (a) without fissure; (b) 30° fissure; (c) 45° fissure; (d) 60° fissure.
With increasing freeze–thaw cycles, the ascending branch of the stress–strain curves generally becomes flatter, accompanied by a reduction in peak stress. The peak strain exhibits an overall tendency to increase, particularly at higher freeze–thaw levels, although this variation is not strictly monotonic for all fissure inclinations. Intact specimens carry the highest loads at every freeze–thaw level, whereas the flawed groups peak at markedly lower stresses owing to the stress concentration around the prefabricated fissures. The pre-peak nonlinear portion also lengthens at higher cycle numbers, pointing to earlier and more widespread accumulation of irreversible deformation.
Fissure inclination also influences the morphology of the stress–strain curves. The 30° specimens generally exhibit lower peak strengths and more pronounced pre-peak fluctuations, which are consistent with the progressive crack interaction indicated by the DIC strain localization patterns (Figure 9) and the stepwise evolution of cumulative AE counts (Fifure 12). Compared with the 30° group, the 45° specimens exhibit higher peak strengths, although their strengths remain lower than those of the 60° specimens after 0–20 freeze–thaw cycles. The relatively concentrated pre-peak nonlinear deformation of the 45° specimens is consistent with the pronounced strain localization in the rock-bridge region (Figure 10) and the concentration of AE activity near peak loading (Figure 13). For the 60° specimens, the pre-peak fluctuations are accompanied by preferential axial strain localization and sustained AE activity, as illustrated in Figure 11 and Figure 14, respectively. These observations provide complementary evidence for interpreting the differences in mechanical response among the three fissure configurations.
The post-peak responses vary among specimens with different fissure inclinations and freeze–thaw cycles. As the post-peak segments presented in Figure 6 terminate at different residual stress levels, a consistent trend in post-peak softening cannot be established from the plotted curves. In particular, the 45° specimens still exhibit an abrupt post-peak stress drop after 50 freeze–thaw cycles. Therefore, the present analysis primarily focuses on the pre-peak deformation characteristics and peak strength to evaluate the effects of freeze–thaw cycling and fissure inclination on the mechanical response of sandstone. The stress–strain response thus records both effects examined in this work: matrix deterioration lowers the overall strength and stiffness, while fissure-controlled structural damage determines the pre-peak deformation pattern and the manner in which load-bearing capacity is lost.
3.2. Strength and Deformation Degradation
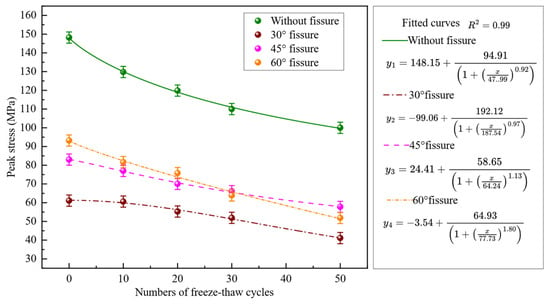
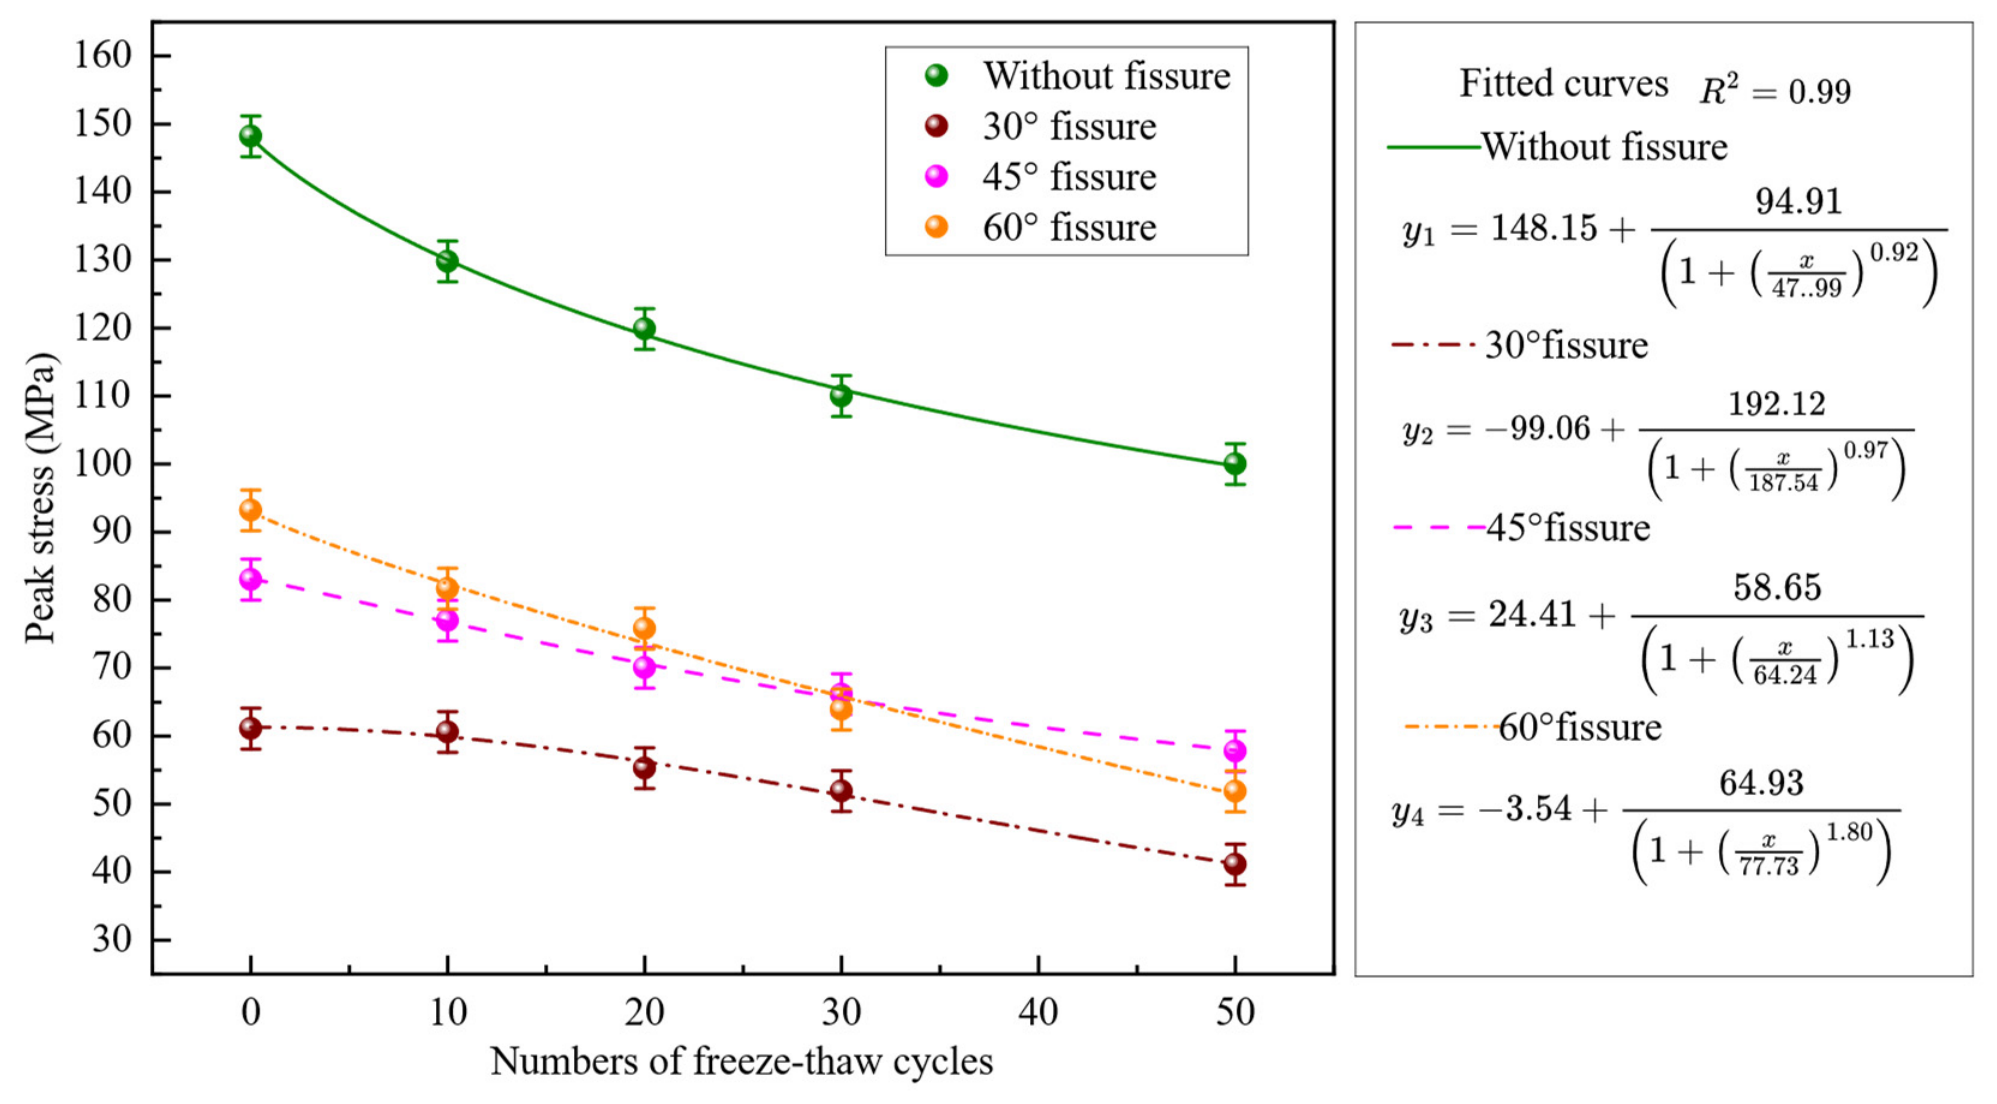
Peak strength and elastic modulus, extracted from these curves, quantify the deterioration more precisely (Figure 7 and Figure 8); each data point is the mean of the three parallel specimens, and the error bars in Figure 7 give the standard deviation. Compared with the 0-cycle control specimens, both parameters generally decreased with increasing freeze–thaw cycles, indicating progressive mechanical deterioration associated with repeated freeze–thaw treatment. At every freeze–thaw level, the intact specimens remain the strongest and stiffest, while the flawed groups sit markedly lower because their structural integrity is reduced.
Figure 7.
Variation in peak strength of sandstone specimens under different freeze–thaw cycles.
For the intact specimens, the peak strength decreased from approximately 148 MPa at zero cycles to approximately 100 MPa after 50 cycles. The flawed groups follow the same downward trend, reaching approximately 40, 57, and 50 MPa for the 30°, 45°, and 60° configurations, respectively, at 50 cycles; the 30° group fluctuates slightly at low cycle numbers but degrades over the long term. The strength–cycle relationship of each configuration was fitted with the four-parameter logistic function y = a + b/(1 + (x/c)^d), and all four fits give R2 values of approximately 0.99 (Figure 7), confirming that the strength loss follows a smooth, continuous decay. The largest relative loss occurs in the 60° group, which is therefore the most sensitive to accumulated freeze–thaw damage.
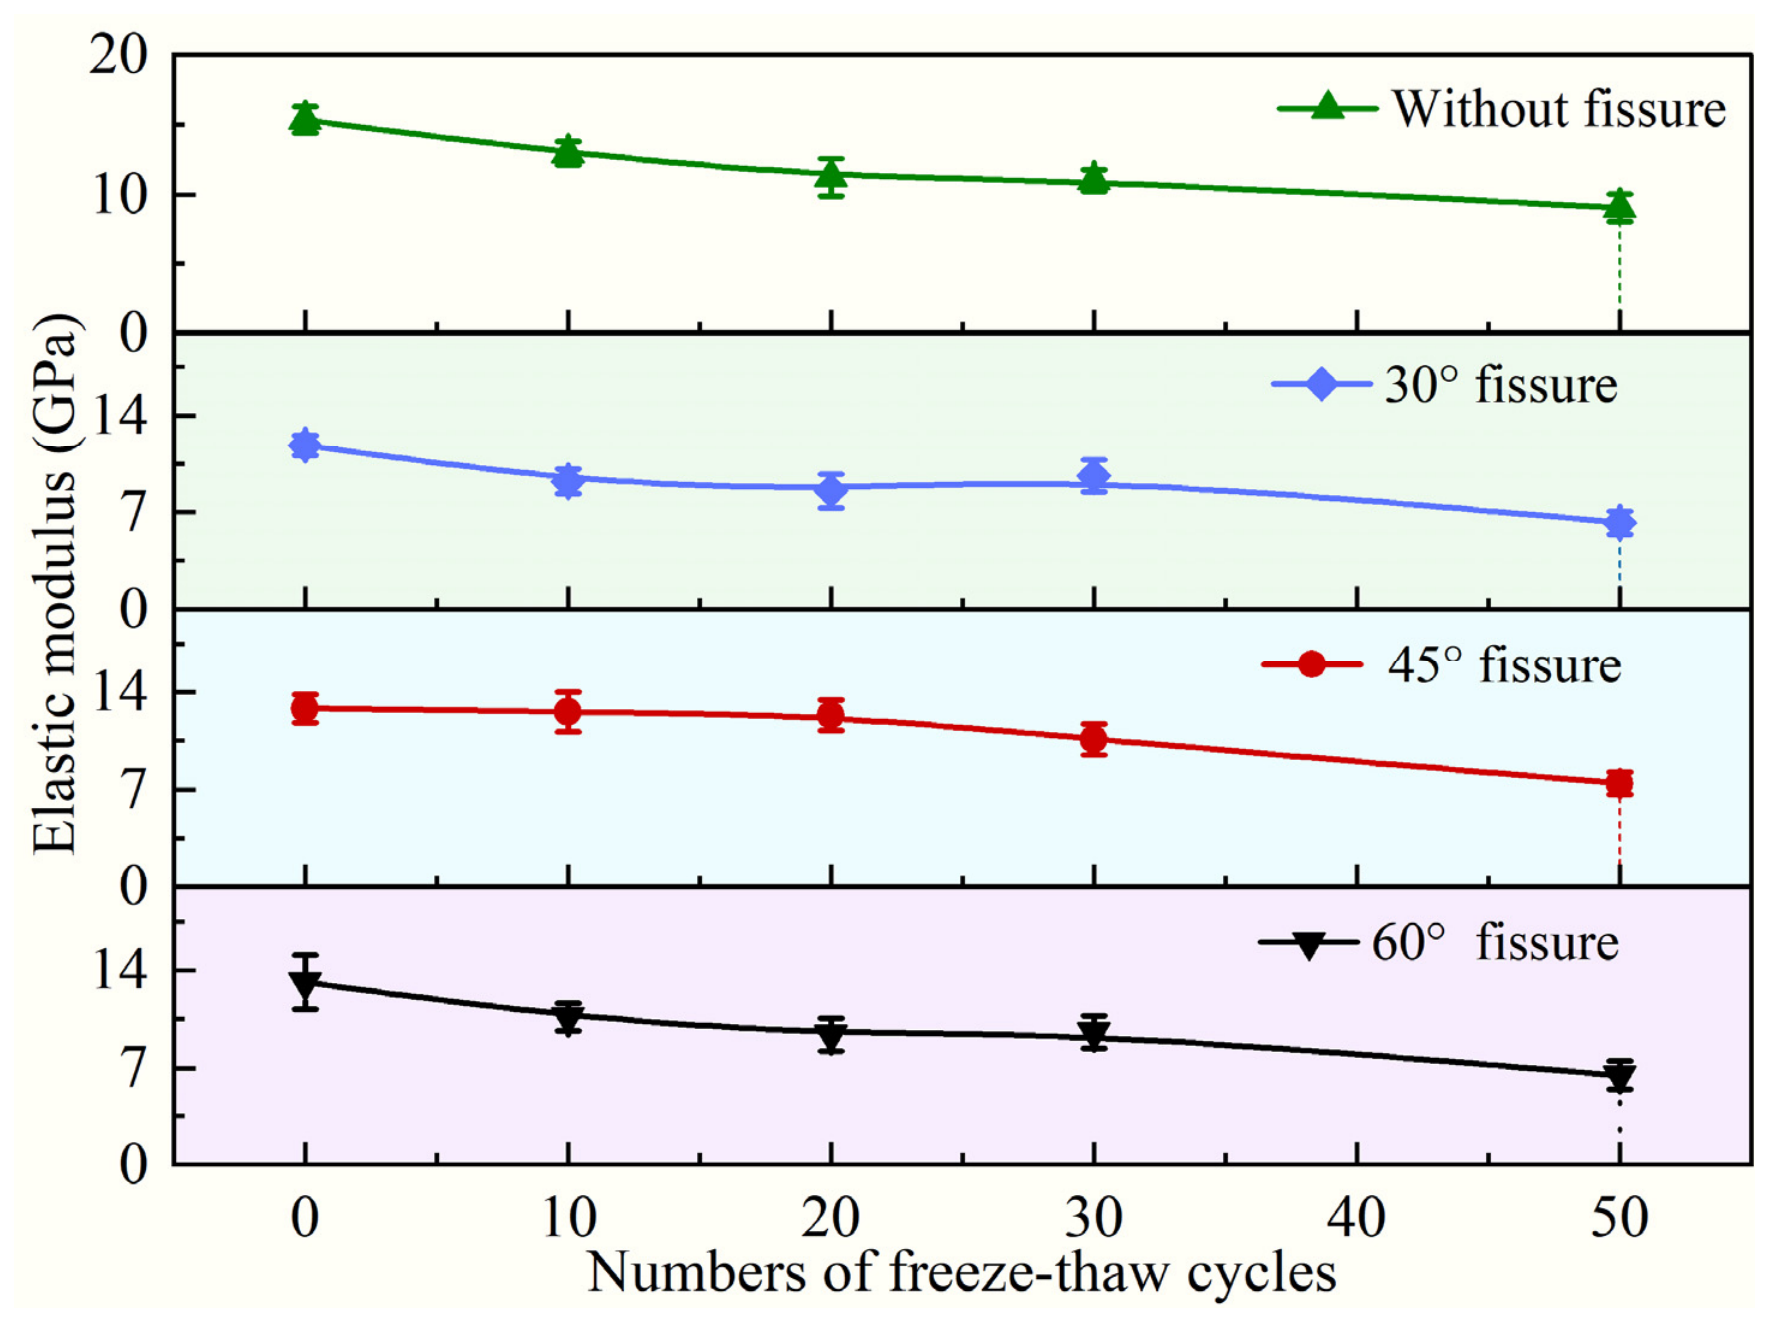
The apparent elastic modulus generally decreased with increasing freeze–thaw cycles (Figure 8). For the intact specimens, the mean modulus decreased from 15.34 ± 0.95 GPa to 9.04 ± 0.97 GPa after 50 cycles. The corresponding values decreased from 11.85 ± 0.74 GPa to 6.23 ± 0.82 GPa for the 30° specimens, from 12.82 ± 1.01 GPa to 7.45 ± 0.81 GPa for the 45° specimens, and from 13.14 ± 1.92 GPa to 6.49 ± 1.03 GPa for the 60° specimens. An individual 60° specimen yielded a corrected apparent elastic modulus of approximately 6.1885 GPa after 50 cycles; this individual value is distinct from the three-specimen mean of 6.49 GPa used in Figure 8 and Figure 9 and the statistical analysis. Although the overall trend indicates stiffness degradation, some non-monotonic variations were observed at intermediate cycle levels.
Figure 8.
Variation in apparent elastic modulus of sandstone specimens under different freeze–thaw cycles.
3.3. Normalized Mechanical Degradation and Statistical Analysis
Figure 9 presents the normalized retention ratios of peak strength and apparent elastic modulus under different freeze–thaw cycles. As shown in Figure 9a, the peak strength retention ratios generally decreased with increasing cycles, although variations were observed among fissure configurations. The 30°specimens exhibited a slight increase after 10 cycles, while the 45°specimens showed a relatively gradual decline. In contrast, the 60°specimens exhibited a more pronounced reduction. After 50 cycles, the strength retention ratios of the intact, 30°, 45°, and 60° specimens were 69.93%, 68.23%, 69.10%, and 56.26%, respectively.
Figure 9.
Normalized retention ratios of sandstone specimens under different freeze–thaw cycles: (a) peak strength retention ratio; (b) apparent elastic modulus retention ratio.
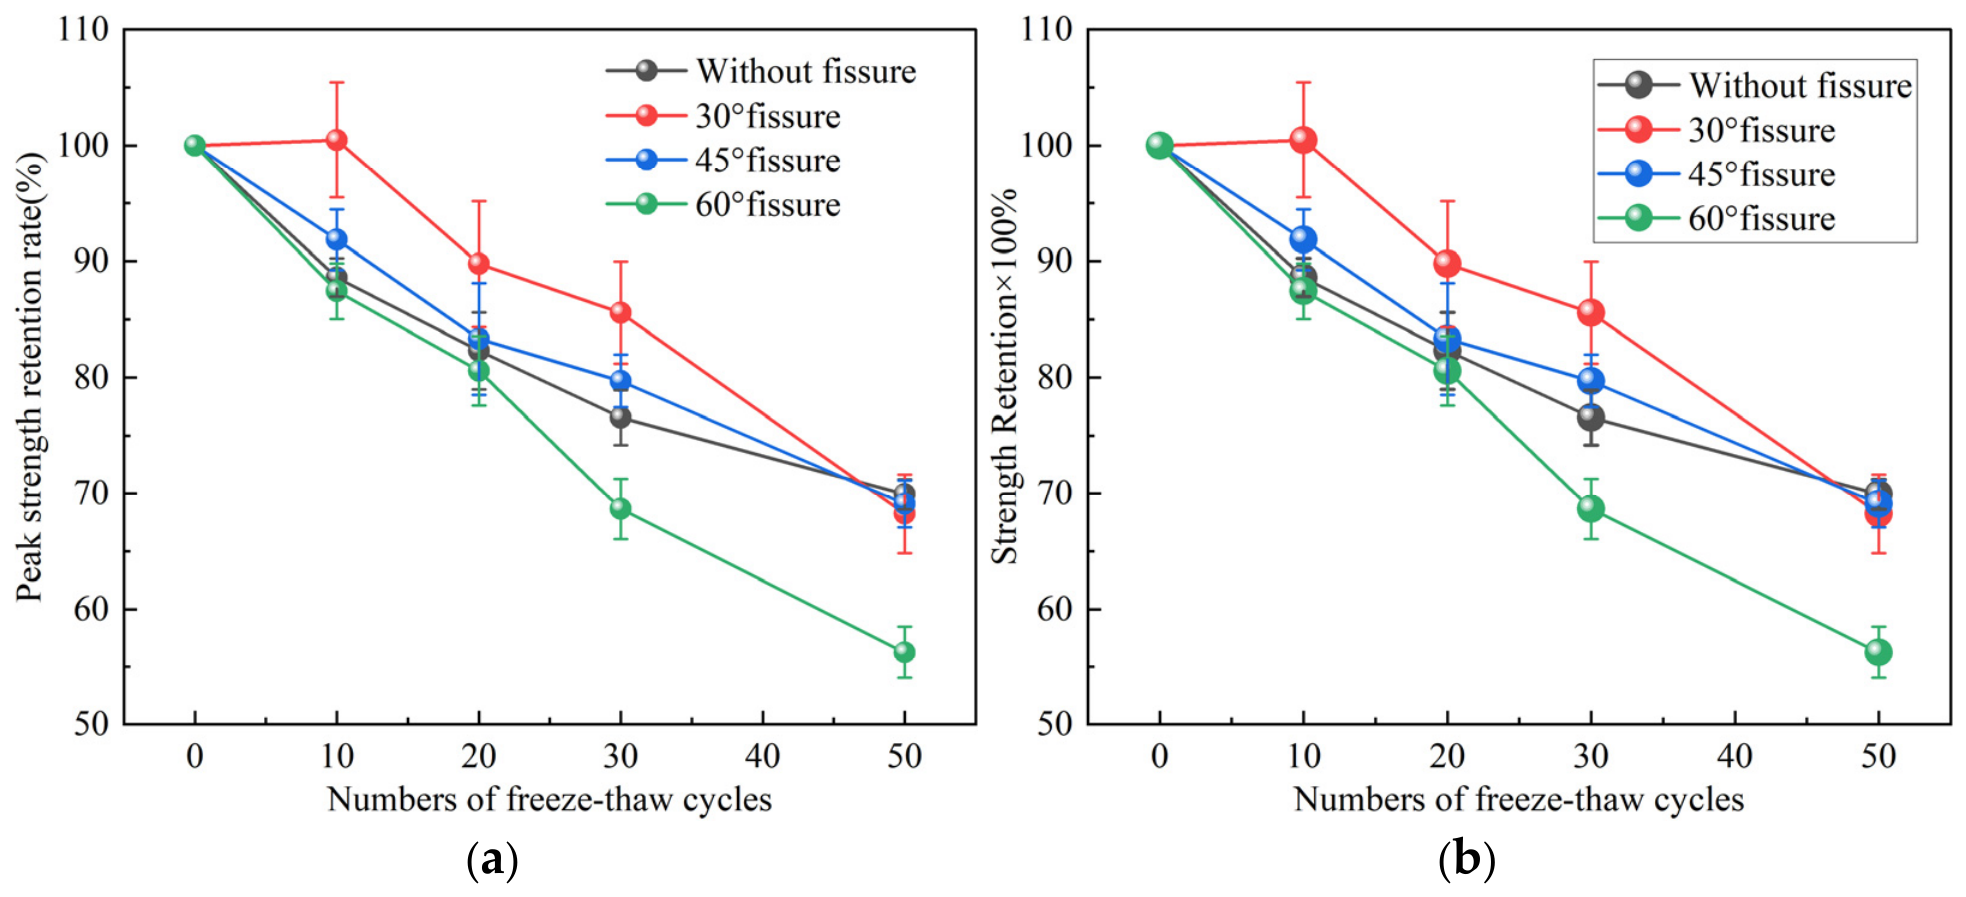
Similarly, the apparent elastic modulus retention ratios generally decreased with some fluctuations (Figure 9b). The 30°specimens showed a slight increase between 20 and 30 cycles, whereas the 45°specimens maintained relatively high retention ratios during the initial 20 cycles. After 50 cycles, the modulus retention ratios of the intact, 30°, 45°, and 60°specimens were 58.89%, 52.57%, 58.08%, and 49.36%, respectively.
Overall, the 60° specimens exhibited the greatest relative reductions in both peak strength and apparent elastic modulus after 50 cycles, whereas the 30°specimens showed the lowest absolute peak strength. These findings highlight the differences between absolute mechanical properties and relative degradation. The modulus retention ranking is descriptive and does not establish a significant freeze–thaw cycle × fissure inclination interaction for apparent modulus. The statistical significance of freeze–thaw cycles, fissure inclination, and their interaction was further evaluated using two-way ANOVA.
The two-way ANOVA results are summarized in Table 1. For peak strength, freeze–thaw cycles (F(4, 30) = 100.21, p < 0.001), fissure inclination (F(2, 30) = 150.58, p < 0.001), and their interaction (F(8, 30) = 5.65, p < 0.001) were statistically significant. For apparent elastic modulus, the effects of freeze–thaw cycles (F(4, 30) = 31.54, p < 0.001) and fissure inclination (F(2, 30) = 12.69, p < 0.001) were significant, whereas their interaction was not significant (F(8, 30) = 1.48, p = 0.206). Therefore, the strength degradation pattern showed a statistically significant dependence on the combination of freeze–thaw cycles and fissure inclination, while a comparable interaction was not established for apparent stiffness.
Table 1.
Two-way ANOVA results for peak strength and apparent elastic modulus of fissured sandstone specimens.
As shown in Table 1, the two-way ANOVA revealed statistically significant effects of freeze–thaw cycles (F(4, 30) = 100.21, p < 0.001), fissure inclination (F(2, 30) = 150.58, p < 0.001), and their interaction (F(8, 30) = 5.65, p < 0.001) on peak strength. This indicates that the effect of freeze–thaw cycling on peak strength varied significantly among the different fissure inclinations. For apparent elastic modulus, both freeze–thaw cycles (F(4, 30) = 31.54, p < 0.001) and fissure inclination (F(2, 30) = 12.69, p < 0.001) showed significant main effects. However, their interaction was not statistically significant (F(8, 30) = 1.48, p = 0.206). These findings suggest that the combined influence of freeze–thaw cycles and fissure inclination differs between strength degradation and apparent stiffness degradation.
4. Damage Evolution Characteristics
4.1. Strain Localization Evolution Revealed by DIC
Beyond the macroscopic response, the DIC measurements resolve how surface strain localization develops at each freeze–thaw level. Figure 10, Figure 11 and Figure 12 present the strain fields of the 30°, 45°, and 60° flawed specimens at 20%, 40%, 60%, 80%, and 100% of the peak stress after 0, 10, 20, 30, and 50 cycles. The strain fields shown in Figure 10, Figure 11 and Figure 12 were obtained from representative specimens under each experimental condition to illustrate the progressive development of surface strain localization during loading. Although all specimens were prepared from the same sandstone block under consistent geometric and experimental conditions, the inherent heterogeneity of the rock may contribute to variations in local strain distributions. Therefore, these DIC results are primarily used to characterize the spatial evolution and propagation patterns of strain localization rather than to establish quantitative reproducibility among replicate specimens.
Figure 10.
DIC strain fields of the 30° fissured sandstone under different freeze–thaw cycles.
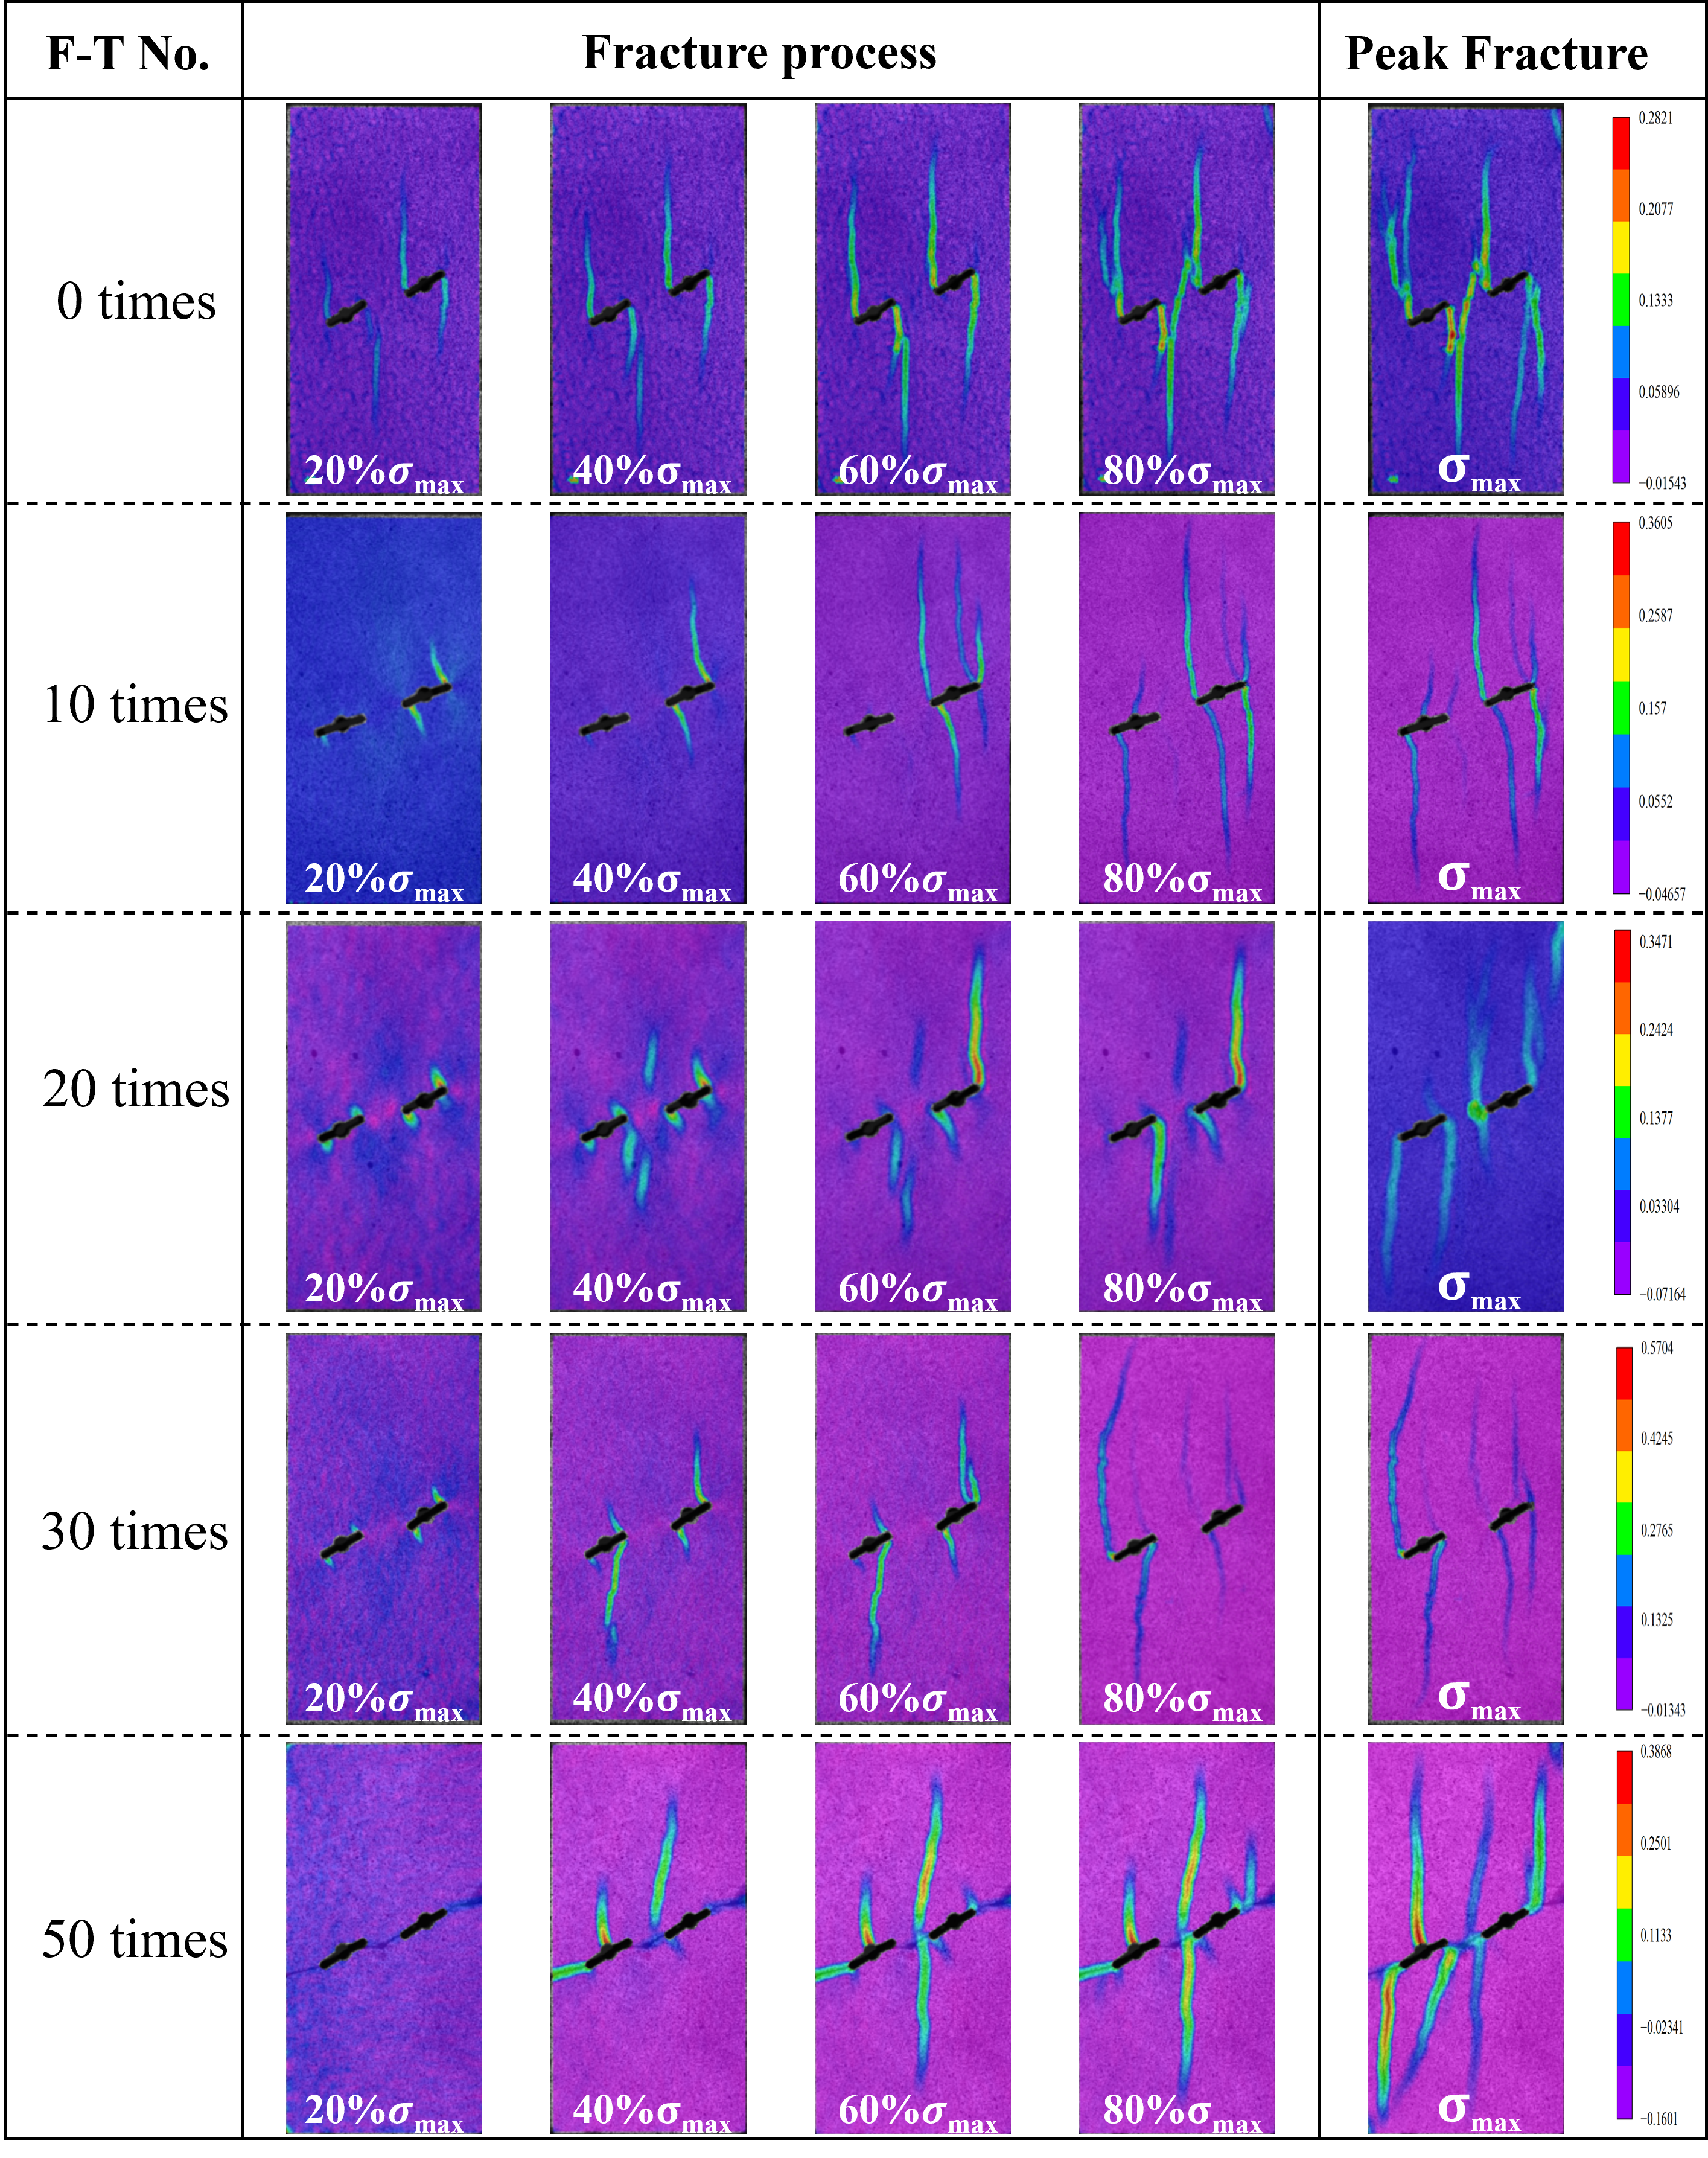
As shown in Figure 10, localized strain concentration can be observed near the prefabricated fissure tips even at relatively low stress levels in the 0-cycle specimens. With increasing loading, the localized deformation progressively extends from the fissure tips toward the rock-bridge region, accompanied by the development and coalescence of strain localization bands. Although the 50-cycle specimens exhibit relatively diffuse strain distributions at 20% of the peak stress, more developed and branched localization bands become evident during the subsequent loading stages. These observations indicate that freeze–thaw treatment influences the progressive development and spatial distribution of strain localization rather than necessarily advancing its initial appearance. Meanwhile, the AE results presented in Figure 13, Figure 14 and Figure 15 provide complementary information on the temporal evolution of internal damage activity.
Figure 11.
DIC strain fields of the 45° fissured sandstone under different freeze–thaw cycles.
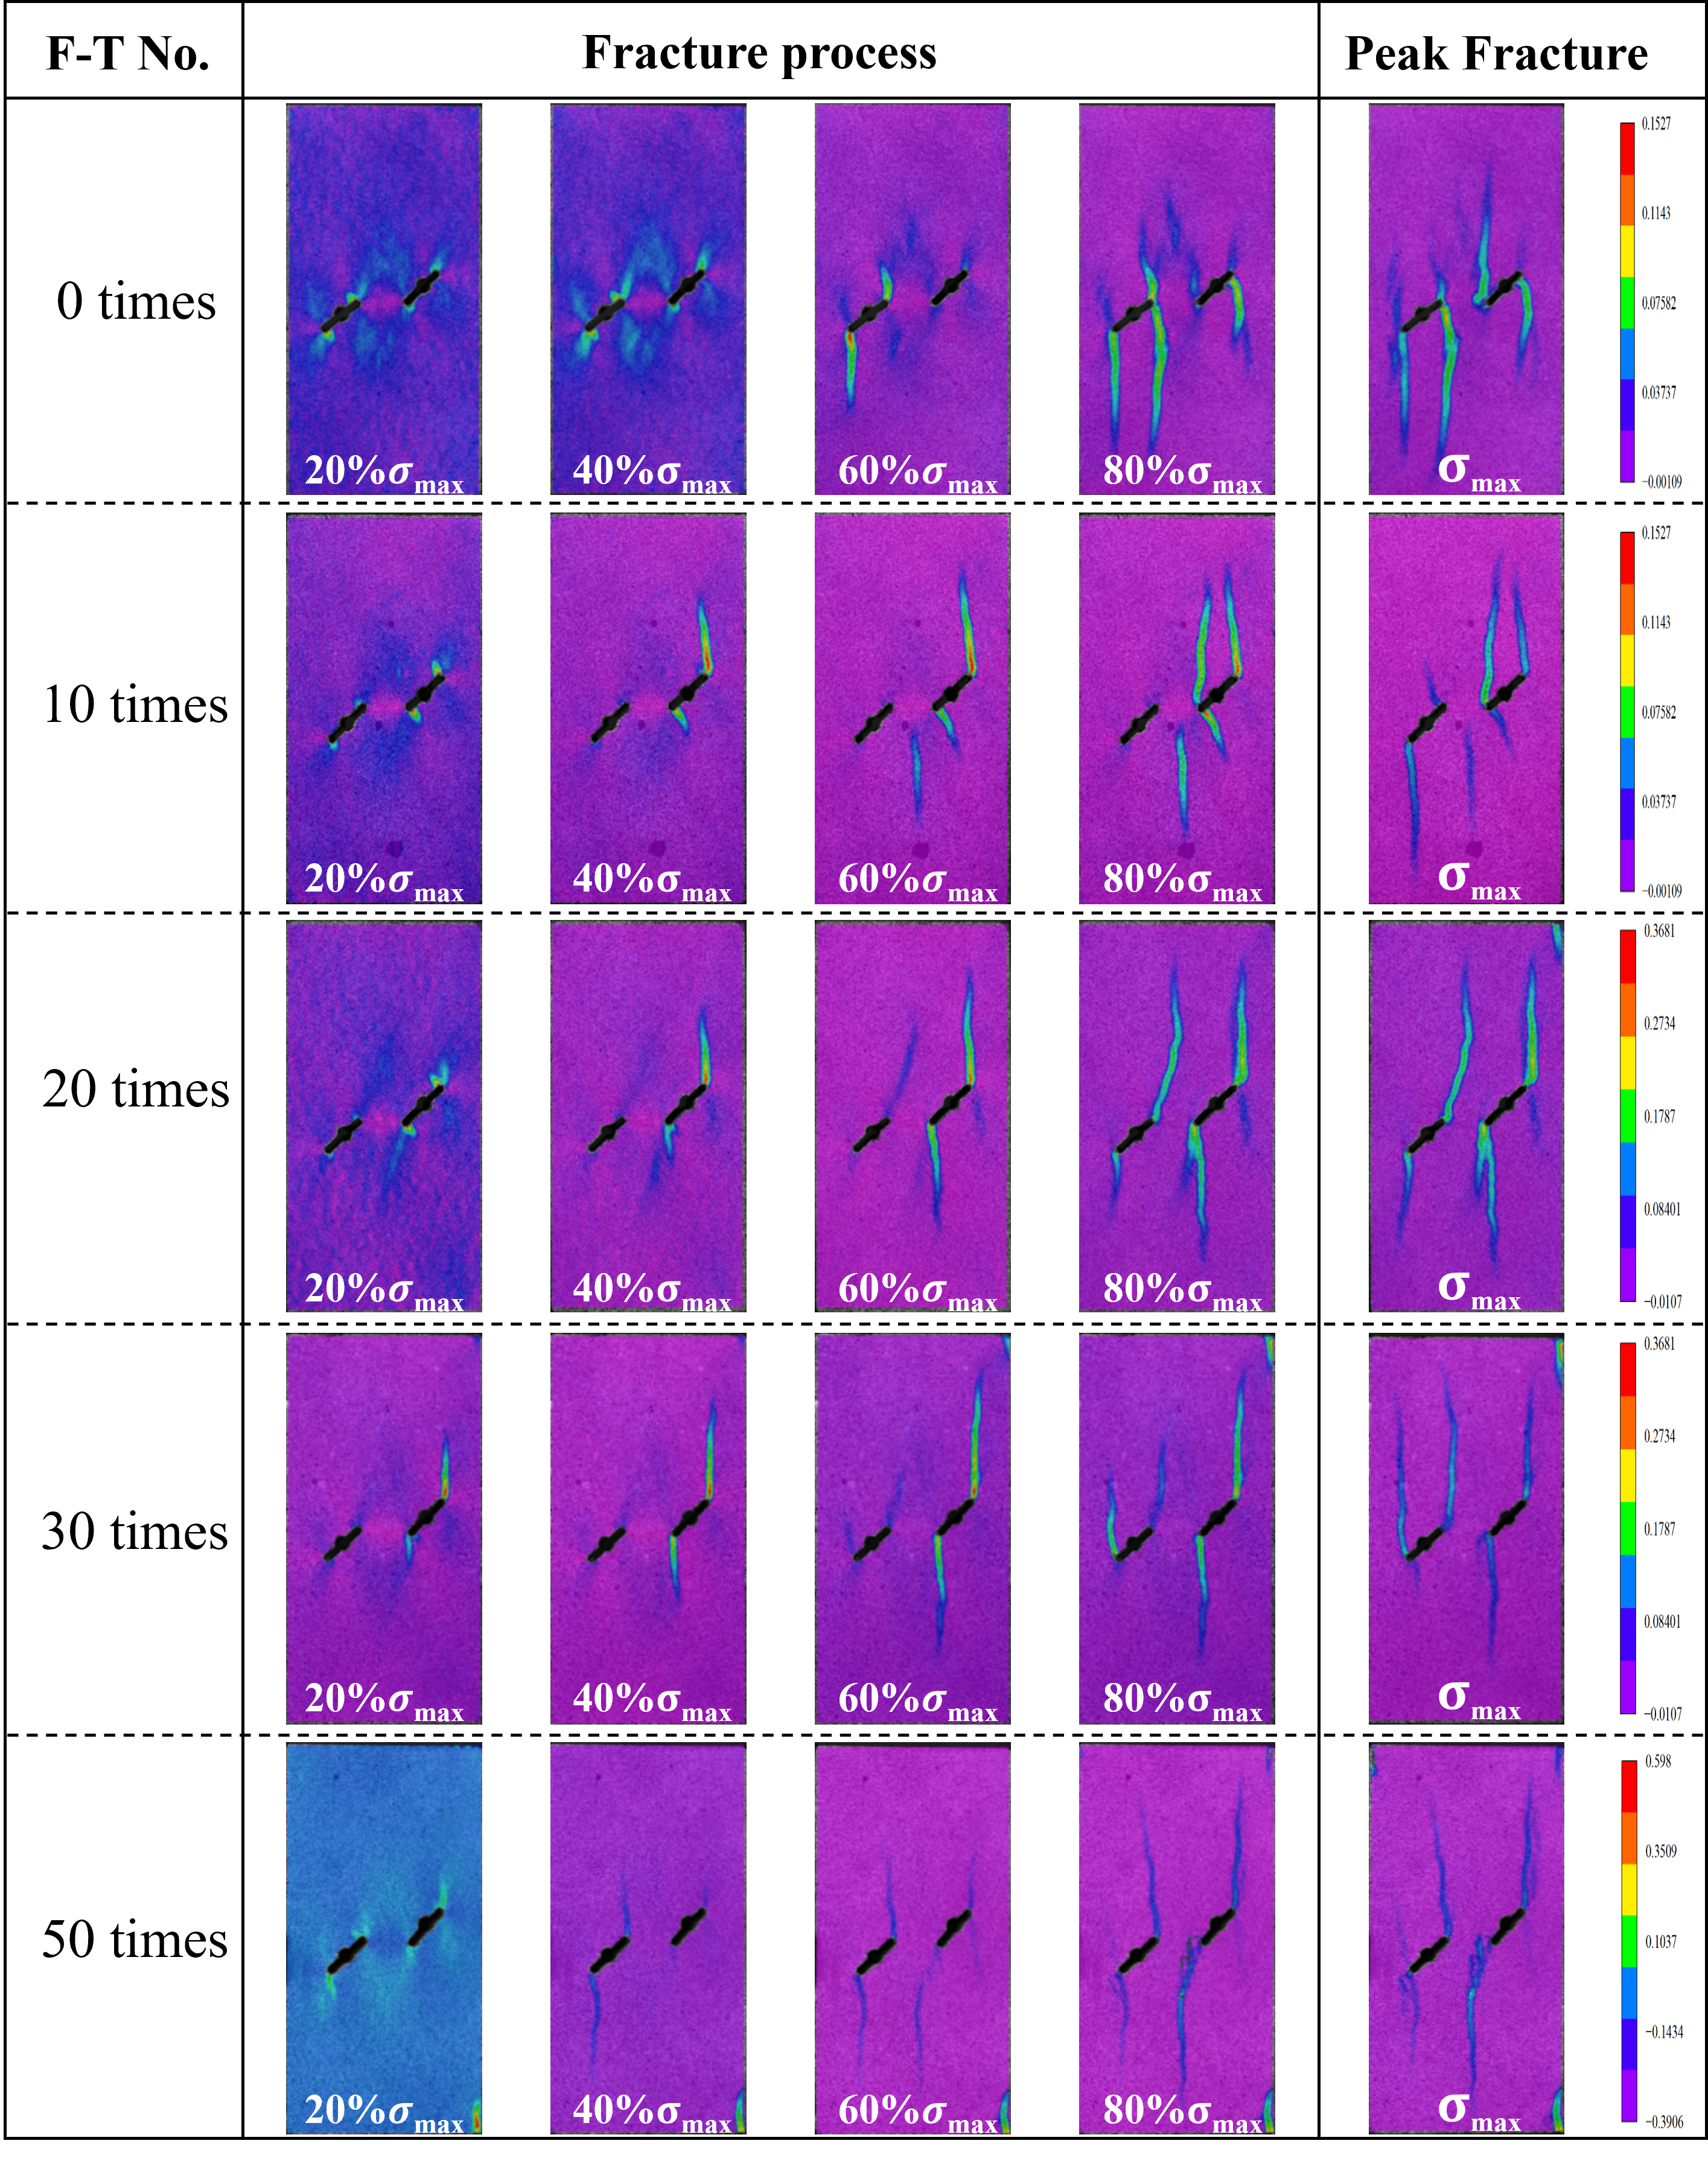
Figure 11 illustrates the progressive development of strain localization in the 45° fissured specimens under different freeze–thaw conditions. As loading proceeds, localized deformation develops around the fissure tips and rock-bridge region, followed by the extension and interaction of concentrated strain bands. Differences in the distribution, branching, and connectivity of these bands can be observed among specimens subjected to different freeze–thaw cycles, reflecting variations in their progressive deformation and fracture processes.
In the 30° specimens, strain concentration develops around the fissure tips and rock-bridge region before merging into dominant bands, indicating progressive crack interaction. The 45° specimens exhibit more concentrated bridge-zone localization, whereas the 60° specimens develop preferentially near-axial, through-going strain bands at later loading stages. These observations are broadly consistent with the fissure-tip and rock-bridge interactions observed by Yu et al. [26] using DIC in freeze–thaw-treated sandstone and with the crack-coalescence patterns reported by Niu et al. [36] for sandstone containing nonparallel flaws. However, because the fissure arrangements differ, the comparison concerns the localization and coalescence processes rather than identical inclination-dependent failure paths. The present results further indicate that freeze–thaw exposure affects the development and connectivity of localized deformation, while fissure inclination changes its spatial distribution.
Figure 12.
DIC strain fields of the 60° fissured sandstone under different freeze–thaw cycles.
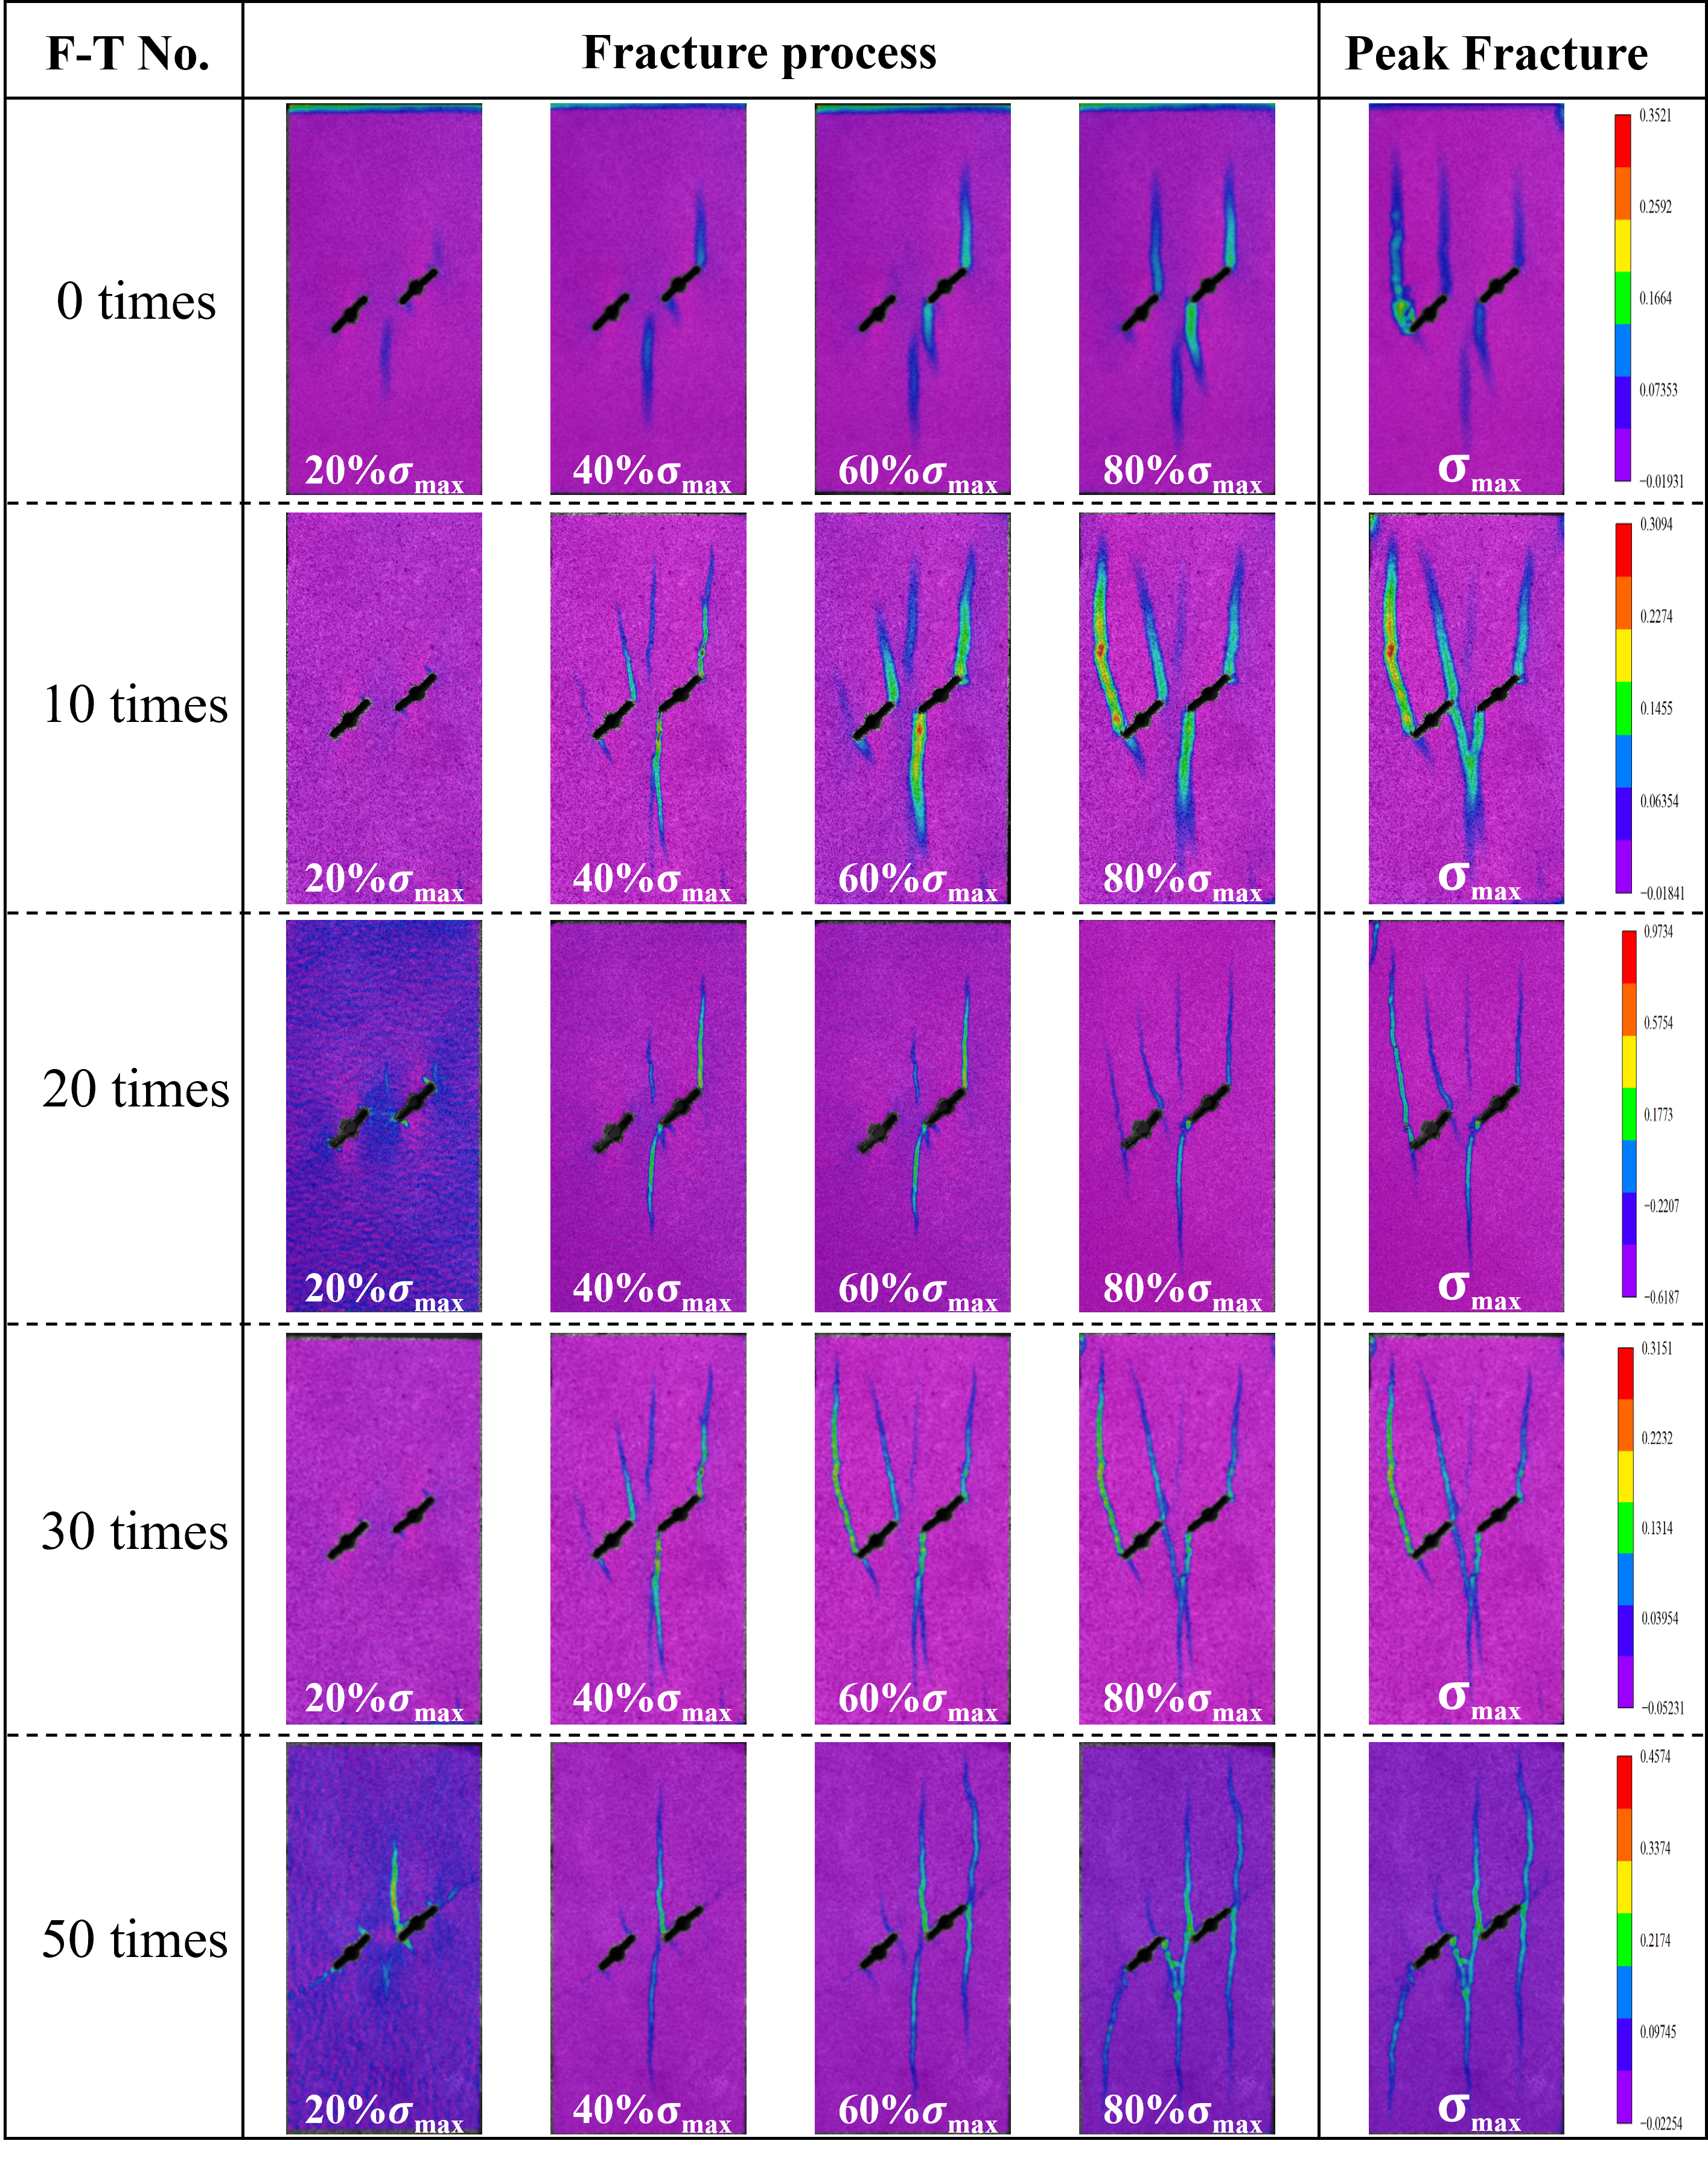
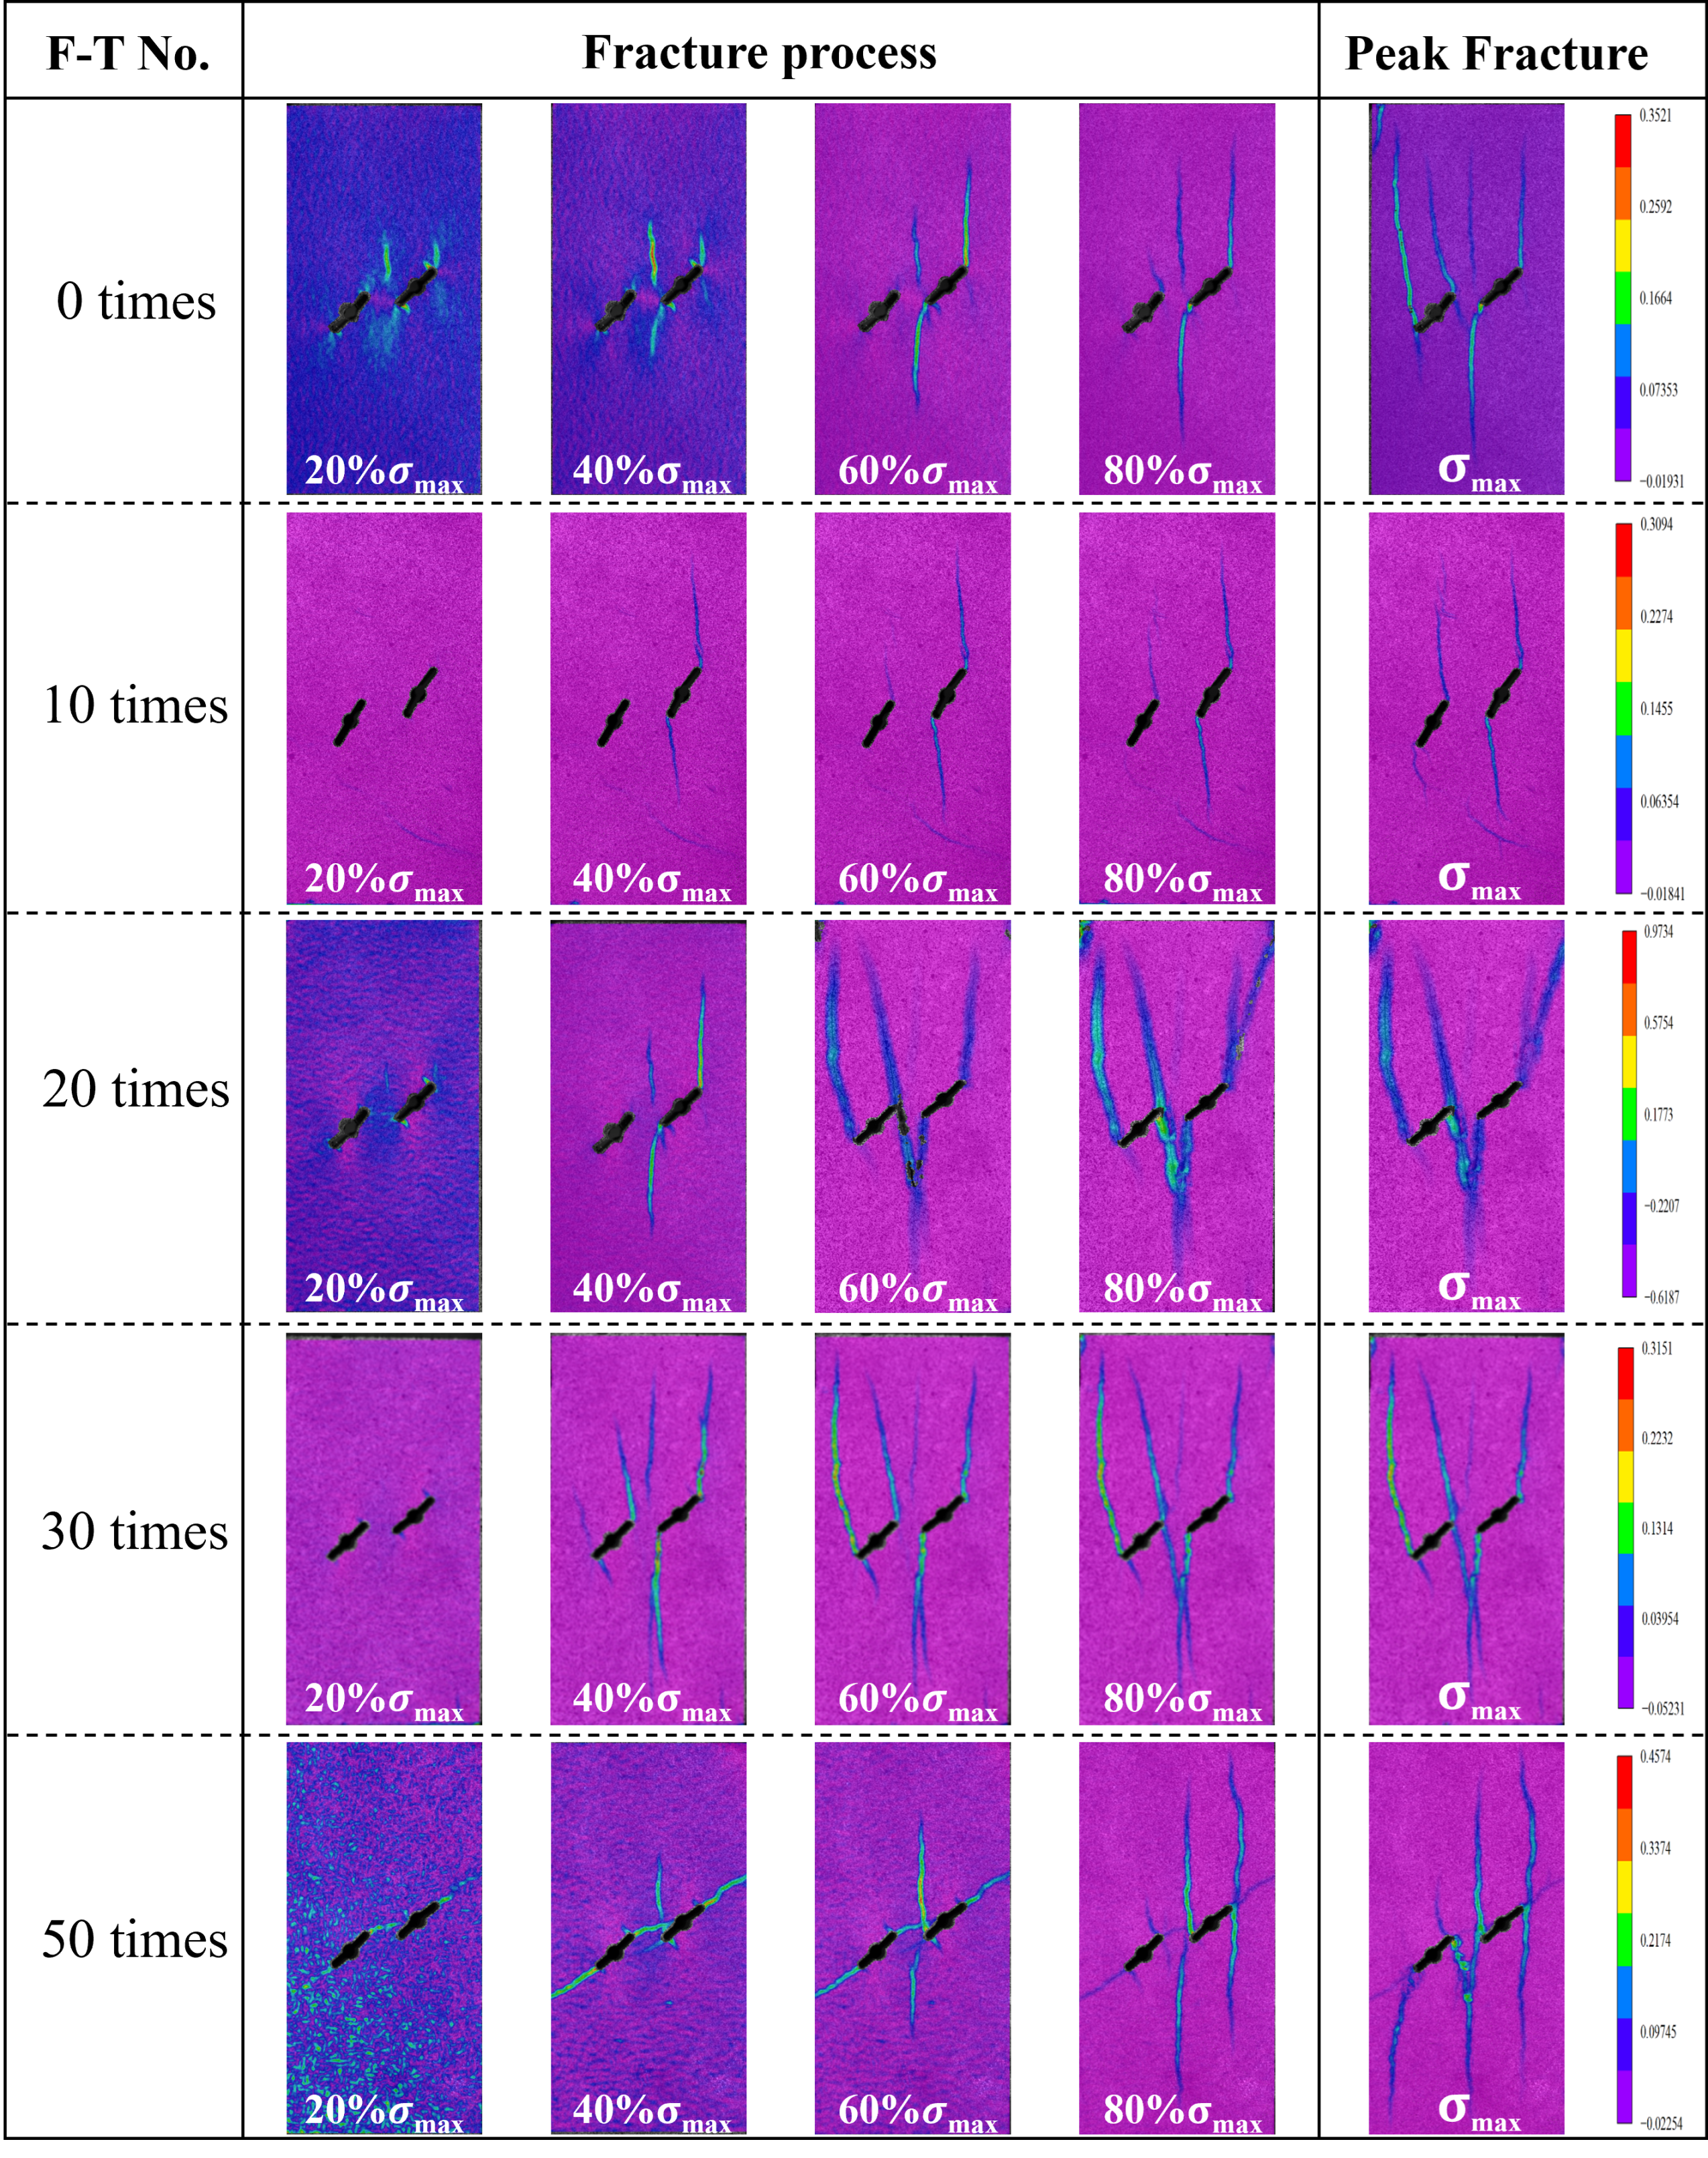
Compared with the representative 60° specimens in Figure 12, the additional DIC results in Figure 13 exhibit broadly similar spatial distributions of the main strain-localization bands. In both sets, localized deformation develops around the prefabricated fissures, and the dominant bands extend approximately along the loading direction during the later loading stages. Differences remain in band curvature, secondary branching, and local connectivity. These variations may be associated with the inherent heterogeneity of sandstone, whereas the similarity in the dominant localization regions provides additional qualitative support for the deformation pattern observed in the 60° configuration. The comparison therefore concerns the overall spatial characteristics of strain localization rather than identical propagation paths in individual specimens.
Figure 13.
DIC strain fields of additional 60° double-flawed sandstone specimens subjected to different numbers of freeze–thaw cycles.
4.2. AE Characteristics of Damage Evolution
4.2.1. AE Parameter Evolution
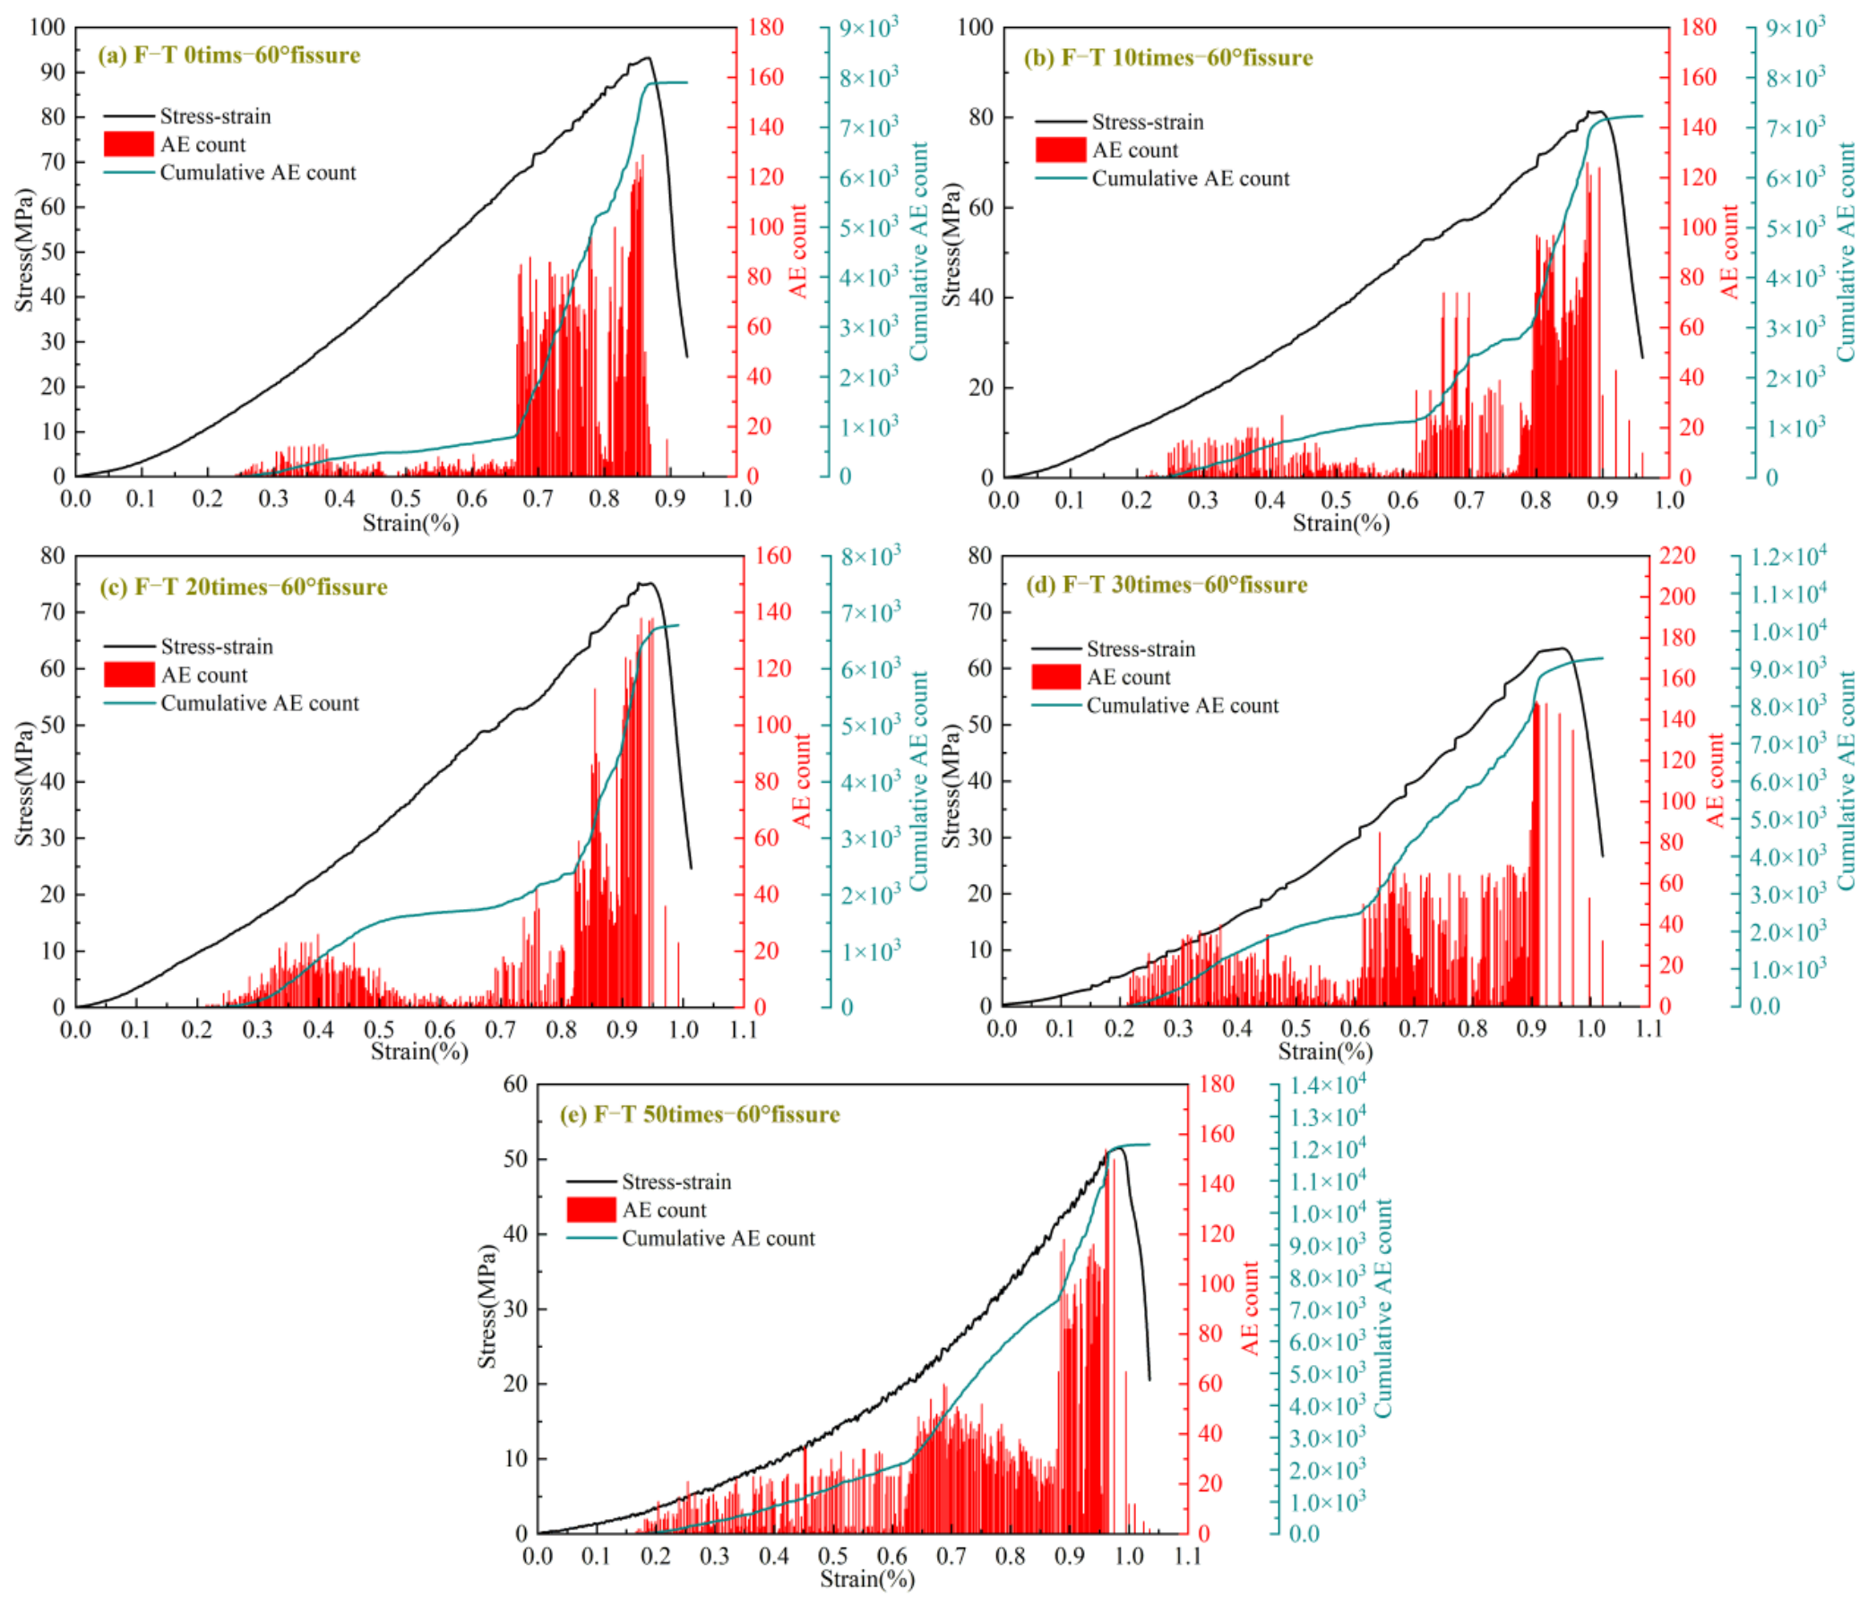
AE monitoring complements the DIC observations by recording the internal cracking process. Figure 14, Figure 15 and Figure 16 present the AE event counts and cumulative AE event counts against axial strain, together with the corresponding stress–strain curves. The analysis therefore focuses on the overall distribution and accumulation of AE activity throughout the deformation process, rather than on a strictly normalized comparison of AE initiation times among specimens. The AE responses of the 30°, 45°, and 60° specimens (Figure 14, Figure 15 and Figure 16) share the same stage-wise character. During initial loading, the AE count stays low and the cumulative count grows slowly, reflecting limited internal activity. Crack initiation and stable propagation then produce a steady rise in AE activity and in the cumulative count. Close to the peak, burst-type signals cluster densely and the cumulative count accelerates, marking the shift from stable damage accumulation to rapid crack coalescence.
For the 30° group, the effect of cycling is seen mainly in the timing and persistence of AE activity. Bursts in untreated specimens cluster late in loading, near the peak, whereas treated specimens emit earlier and over a wider strain interval. At 30 and 50 cycles, the cumulative count begins its accelerated rise well before the peak, showing that the matrix around the flaws has been weakened enough for cracks to activate at lower stress thresholds.
Figure 14.
AE count evolution curves of the 30° fissured sandstone under different freeze–thaw cycles.
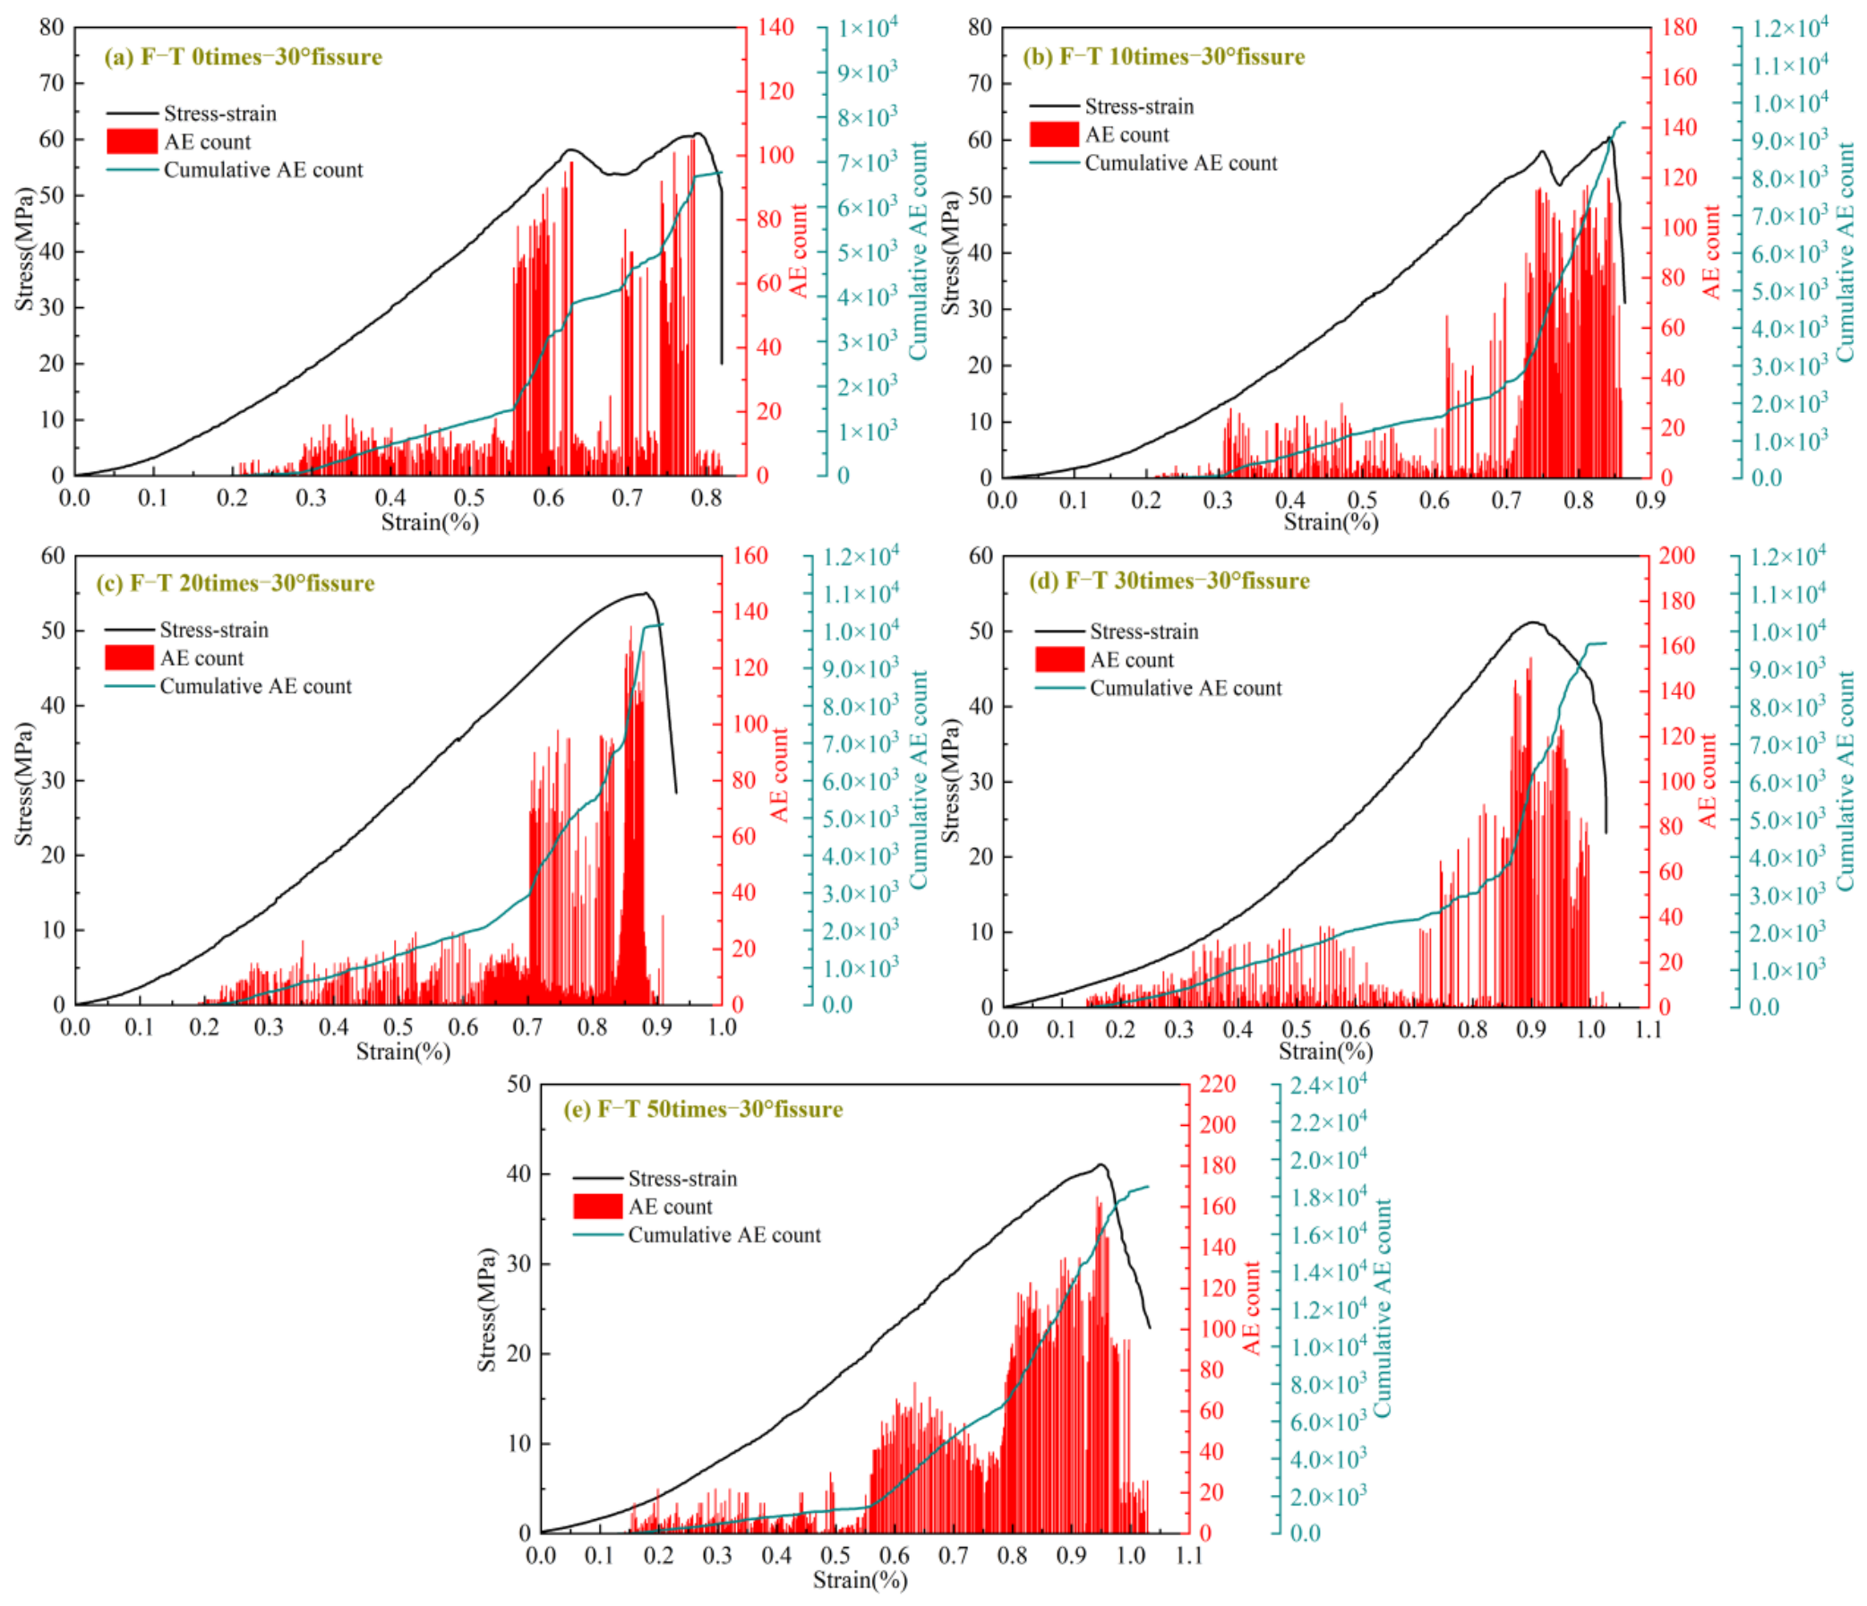
Figure 15.
AE count evolution curves of the 45° fissured sandstone under different freeze–thaw cycles.
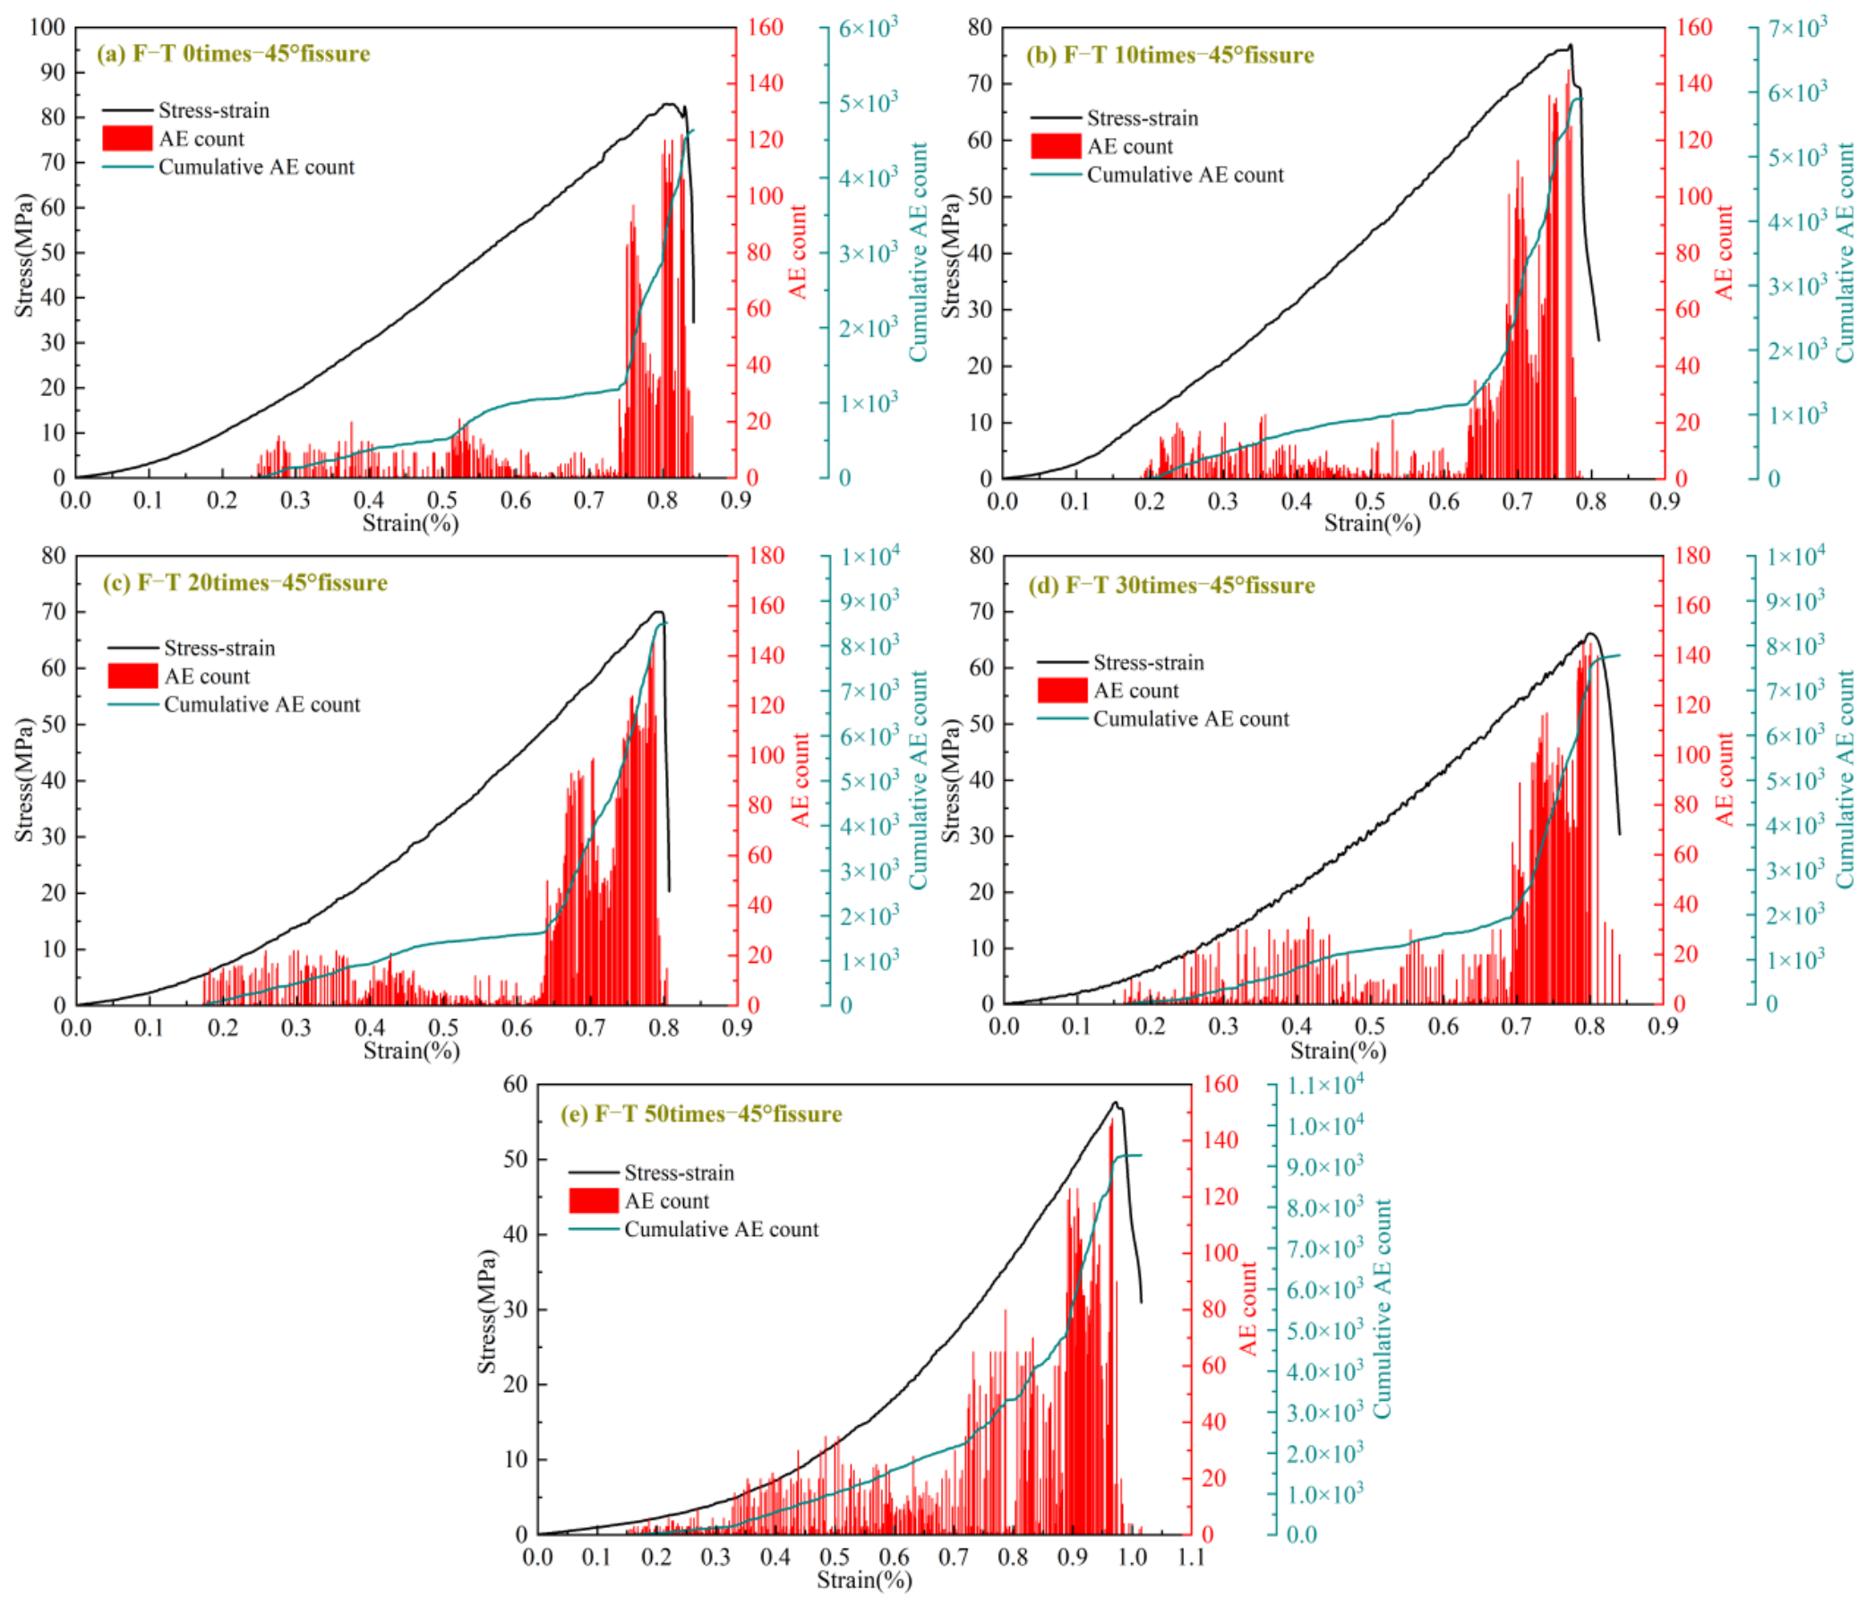
Fissure inclination also reorganizes the temporal pattern of AE activity. The 30° specimens exhibit AE activity over a relatively broad strain interval, and their cumulative AE counts frequently increase in steps during the later loading stages, consistent with progressive crack interaction within the rock-bridge region. In the 45° specimens, the bursts remain concentrated near the peak, although cycling shifts their onset to earlier stages, meaning that internal damage becomes active well before final instability. The 60° specimens, particularly at high cycle numbers, sustain active burst signals over a longer deformation interval, and their cumulative count increases rapidly and continuously rather than in steps.
Figure 16.
AE count evolution curves of the 60° fissured sandstone under different freeze–thaw cycles.
To quantify pre-peak acoustic emission (AE) activity, the stress–strain and cumulative AE count curves of the representative specimens in Figure 14, Figure 15 and Figure 16 were digitized along their common axial strain axis. The fraction of pre-peak AE counts accumulated by 80% of peak stress and the normalized strain interval for the middle 80% of those counts were calculated as follows.
In Equation (4), Cp is the cumulative AE count at peak stress and C80 is the cumulative count when the specimen first reaches 80% of its peak stress during loading. In Equation (5), is the axial strain at peak stress. The strains and correspond to the first attainment of 10% and 90% of Cp. A larger W10−90 value indicates that accumulation between these two fractions spanned a wider interval relative to the peak strain. As shown in Table 2:
The 30° specimens had the lowest mean peak strength at each freeze–thaw level (Figure 7). In the representative curves at 0 and 10 cycles (Figure 13), the stress decreased by approximately 4 and 6 MPa, respectively, from a local maximum to the subsequent minimum before reaching peak stress. During the same intervals, the cumulative AE count rose from approximately 56% to 61% and from 46% to 59% of the count at peak stress, respectively. The DIC fields show localized strain extending from the fissure tips toward the rock bridge (Figure 10). Taken together, these observations suggest that progressive damage around the fissure tips and rock bridge may have contributed to the lower strength of this configuration.
For the representative 60° specimens, F80 was approximately 35% at 0 cycles and reached 66% and 60% after 30 and 50 cycles, respectively. At 30 and 50 cycles, these fractions exceeded those of the corresponding 30° and 45° specimens. The corresponding W10−90 values were approximately 0.22, 0.59, and 0.51 at 0, 30, and 50 cycles. Thus, after 30 and 50 cycles, a larger share of the AE count accumulated by 80% of peak stress, and accumulation spanned a wider normalized strain interval than at 0 cycles. In the DIC fields, localized strain preferentially developed along bands nearly parallel to the loading axis (Figure 12).
4.2.2. AE RA-AF Distribution
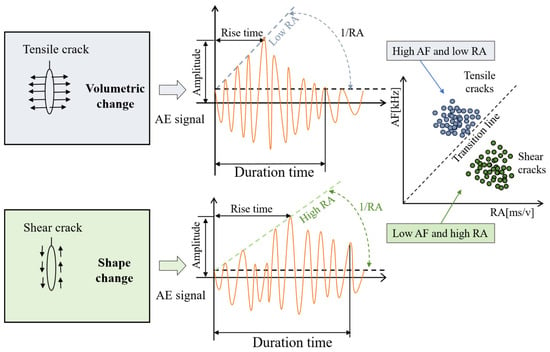
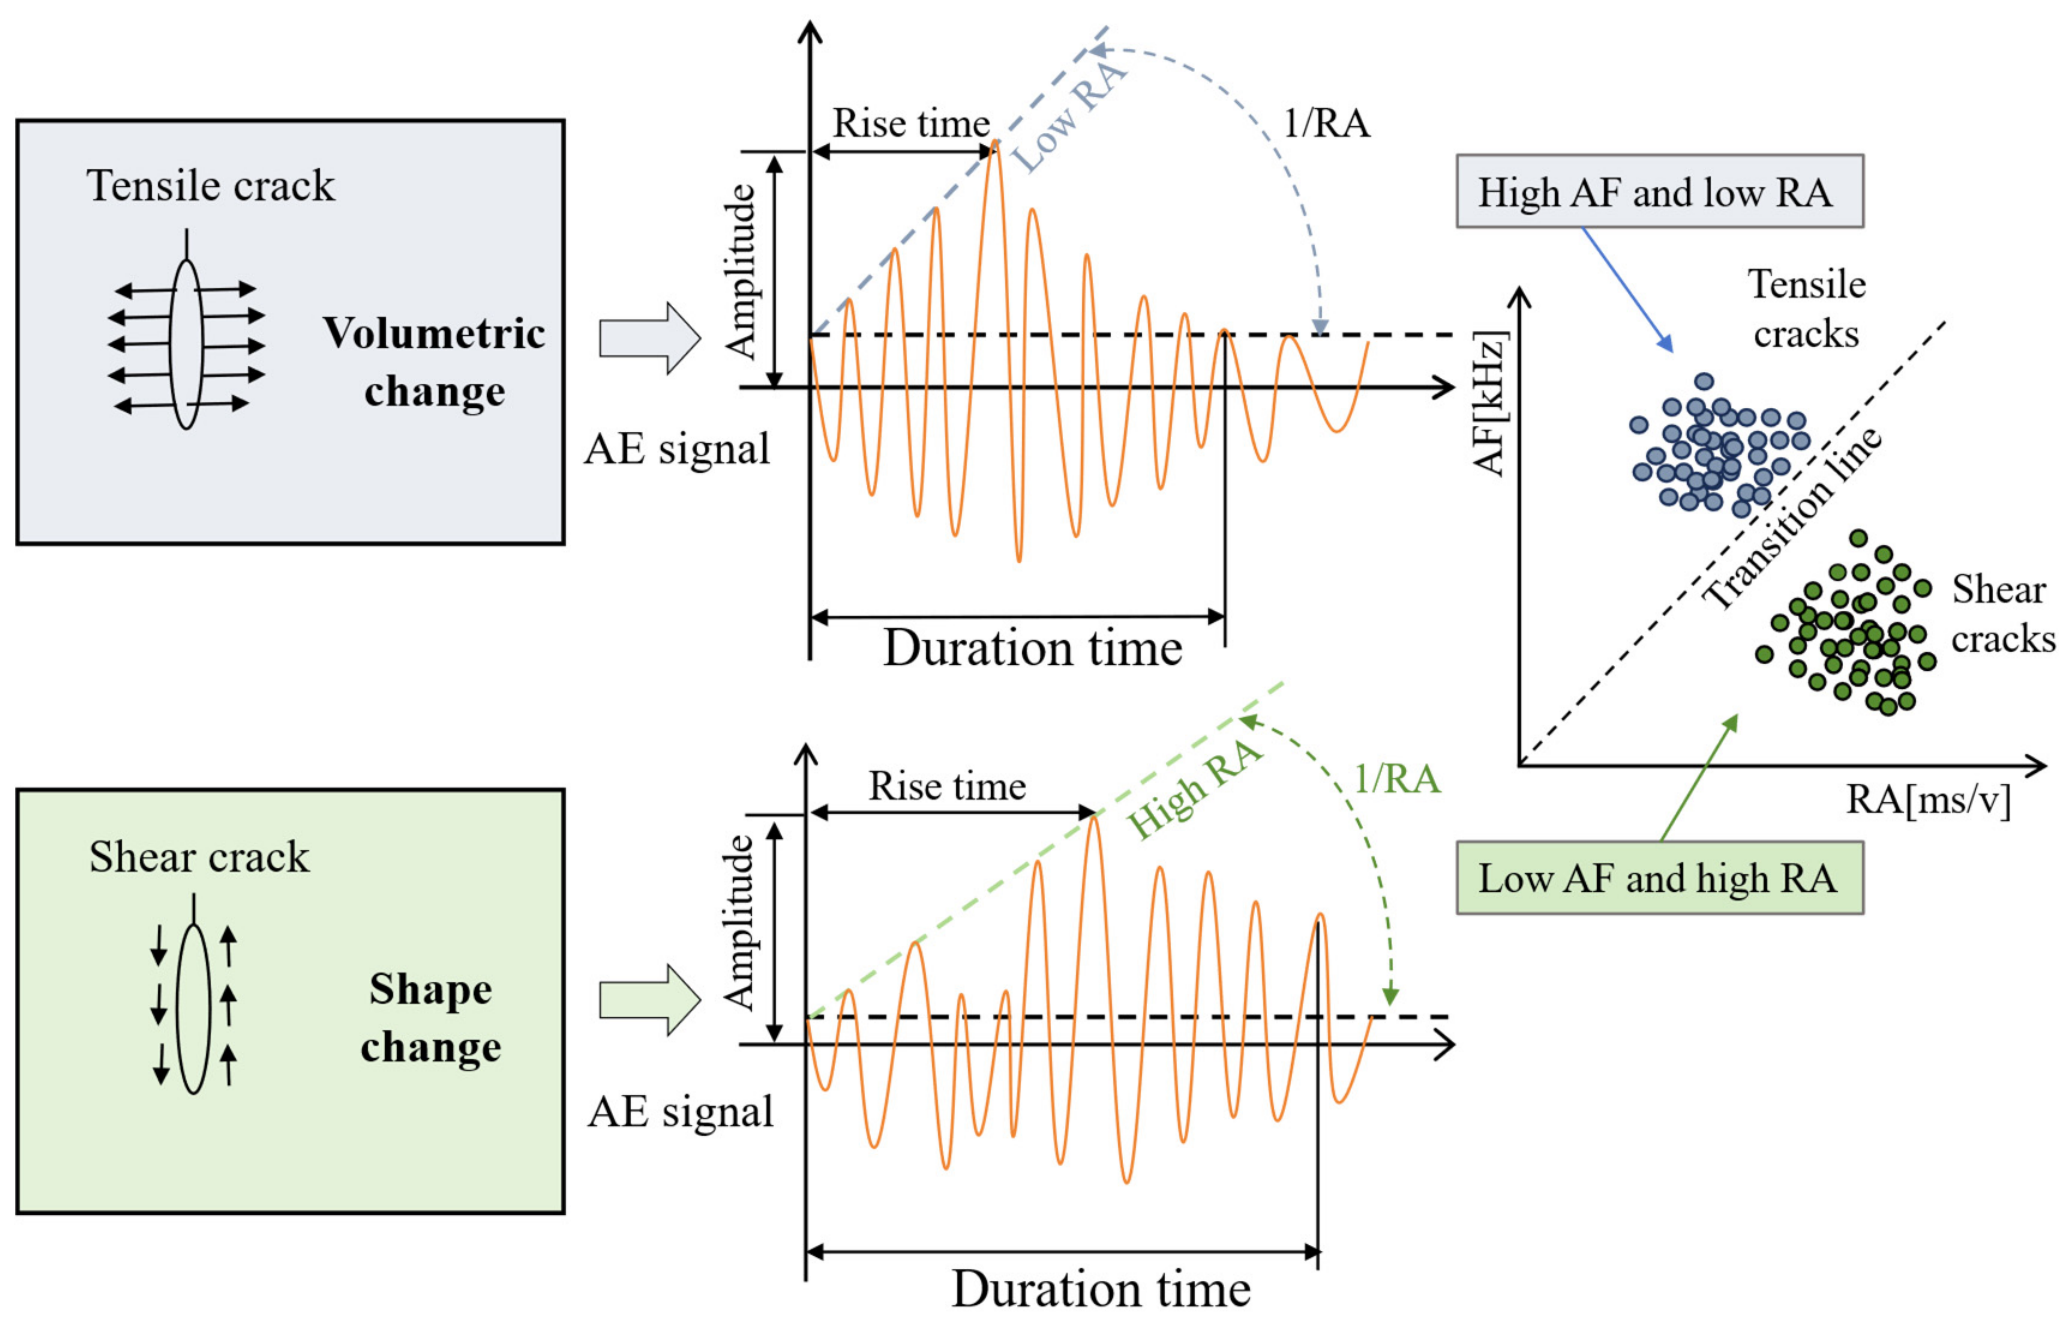
The rise-angle (RA)–average-frequency (AF) approach was used to classify recorded acoustic emission (AE) signals into tensile-type and shear-type events. Its use in crack classification was formalized in the RILEM TC 212-ACD recommendation for concrete [40]. For rock, Dong et al. [41] demonstrated that source scale, triggering, and wave attenuation can affect RA–AF classification, whereas Bi et al. [42] examined rock-specific tensile–shear boundaries using mechanical tests on brittle rocks. A related application of AE measurements to concrete under compression was reported by Watanabe et al. [43]. In general, comparatively low RA and high AF are associated with tensile-type cracking, while higher RA and lower AF tend to indicate shear-type activity. Accordingly, the present RA–AF results are interpreted as the relative proportions of classified AE events, rather than direct counts of tensile and shear cracks. The classification scheme is illustrated in Figure 16.
RA and AF can be defined as follows:
RA and AF were calculated using Equations (6) and (7), and the RA–AF distributions were plotted as shown in Figure 17. To distinguish tensile-type and shear-type AE events, the empirical RA–AF classification boundary was fixed at a ratio of 1:200 and applied consistently to all specimen configurations and freeze–thaw levels. This 1:200 criterion was retained for all comparisons in this study. Because the appropriate classification boundary may depend on the rock material and measurement conditions [40,41,42], the results are interpreted as relative AE event classifications rather than universally validated crack-mode proportions. In the plotted data, AF ranges from 0 to 1000 kHz, and RA ranges from 0 to 5 ms/V.
Figure 17.
Schematic diagram of crack identification using AE parameters.
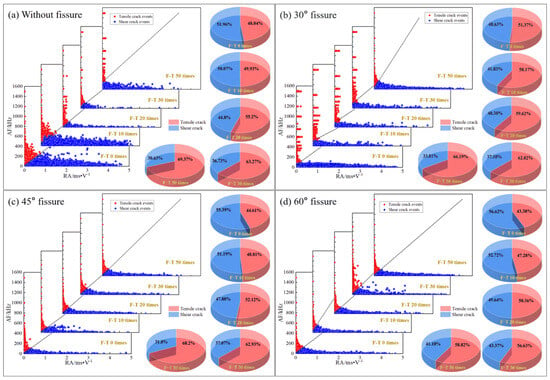
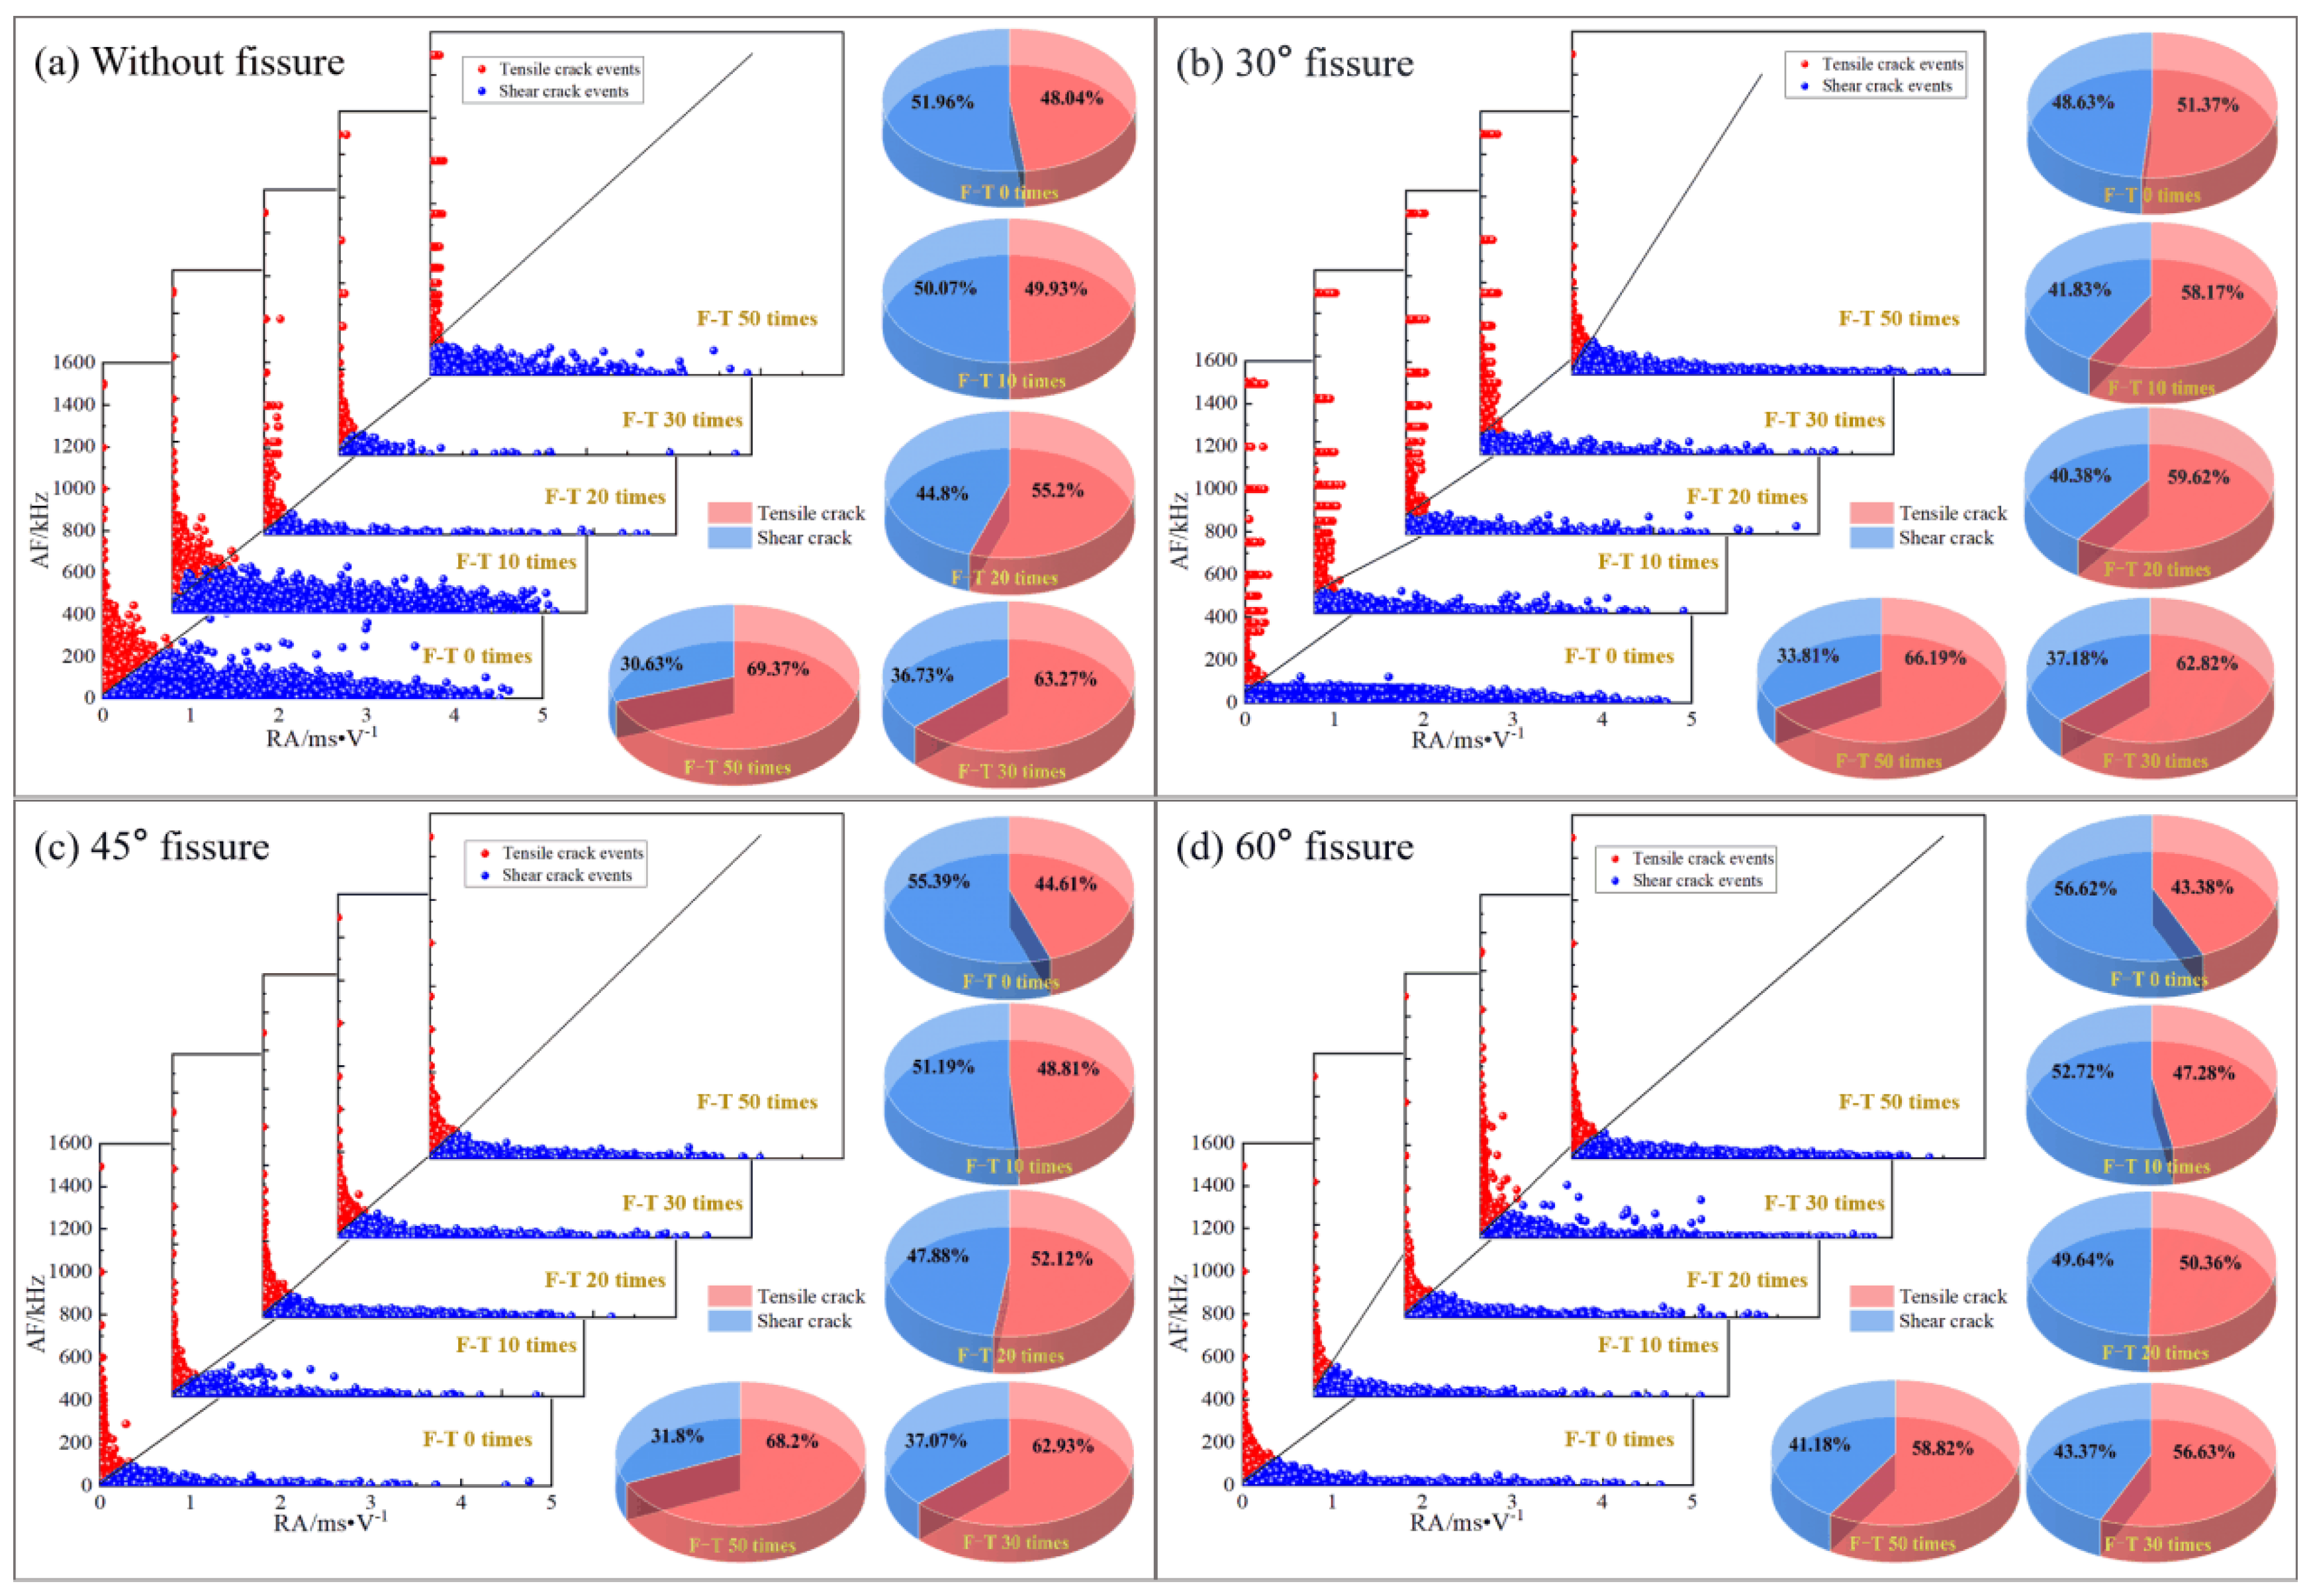
Figure 18 presents the RA–AF distributions and the proportions of recorded AE events classified as tensile-type or shear-type for intact and fissured sandstone under different freeze–thaw conditions. Both categories are observed in each configuration. For the intact specimens, the classified tensile-type event proportion generally increases with freeze–thaw exposure; nevertheless, the classification is indicative of AE signal characteristics rather than a direct measure of the number of physical cracks.
Figure 18.
Classification and proportions of tensile and shear cracks under different freeze–thaw cycles: (a) intact; (b) 30° fissure; (c) 45° fissure; (d) 60° fissure.
For the 30° specimens, tensile-type AE events accounted for 51.37% at zero cycles and 66.19% after 50 cycles; the initial proportion is close to an even tensile–shear balance. The 45° and 60° specimens initially exhibited greater shear-type event proportions (55.39% and 56.62%, respectively), while tensile-type events accounted for 68.23% and 58.82%, respectively, after 50 cycles. The most pronounced change was observed at 45°, where the tensile-type event proportion increased from 44.61% to 68.23% (a 23.62-percentage-point increase).
The inclination-dependent changes in RA–AF event proportions are consistent, in a qualitative sense, with the findings of Bi et al. [42] that AE feature distributions are sensitive to fracture mode and material conditions. The overall evolution of AE activity under freeze–thaw treatment also agrees with the trends discussed by Wang et al. [17] and Zhao et al. [29], although the latter used a numerical modeling approach. Unlike the present fixed-boundary comparison, those studies employed different configurations or analysis procedures, so a direct comparison of the reported event percentages is not warranted. Moreover, the uncertainties identified by Dong et al. [41] indicate that propagation and triggering effects may influence event classification. Thus, the observed shift toward tensile-type AE events is best interpreted as a relative acoustic signature associated with freeze–thaw exposure, which complements rather than duplicates the macroscopic DIC observations.
4.3. Microscopic Deterioration Features from SEM
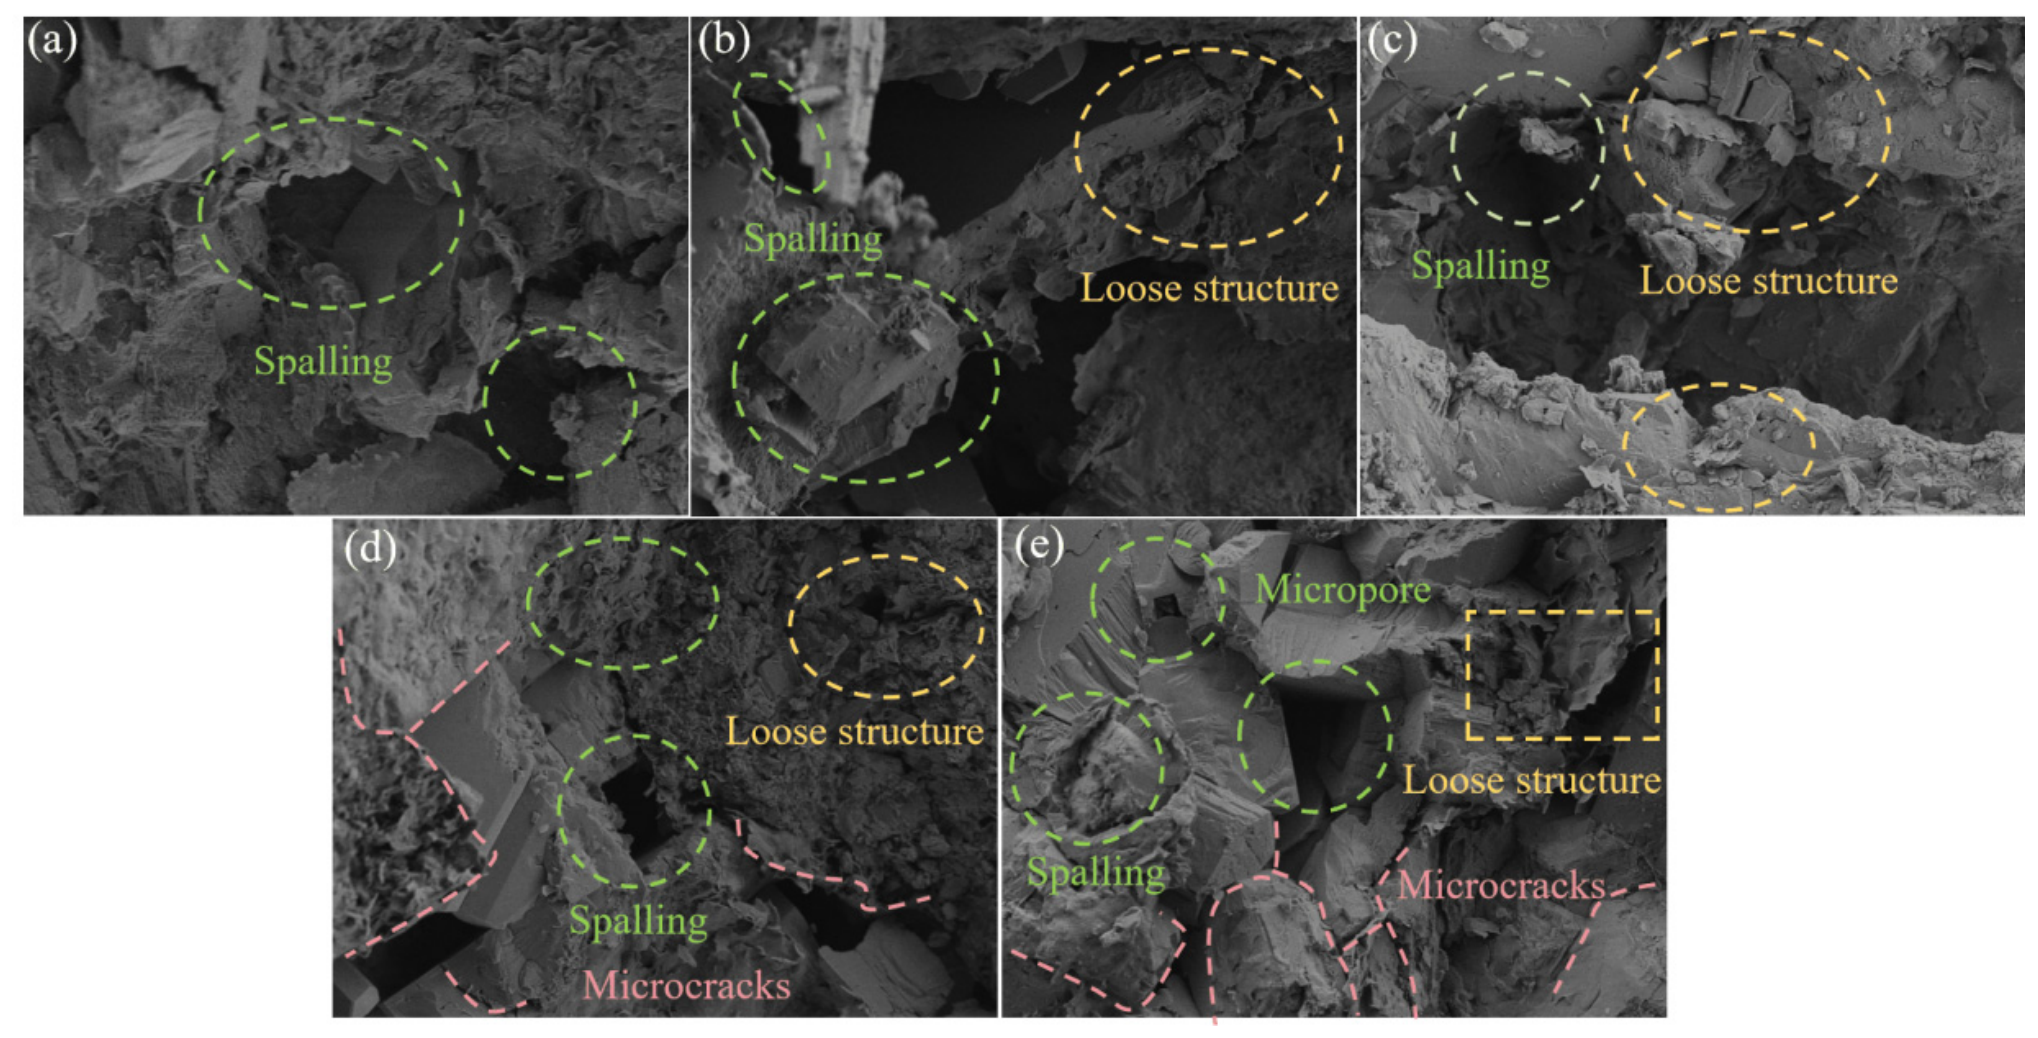
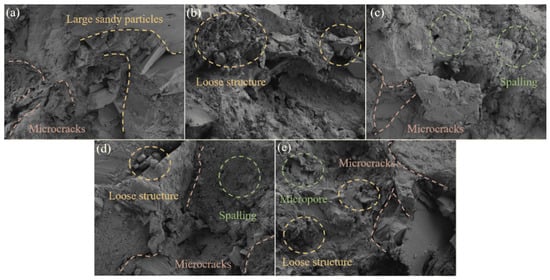
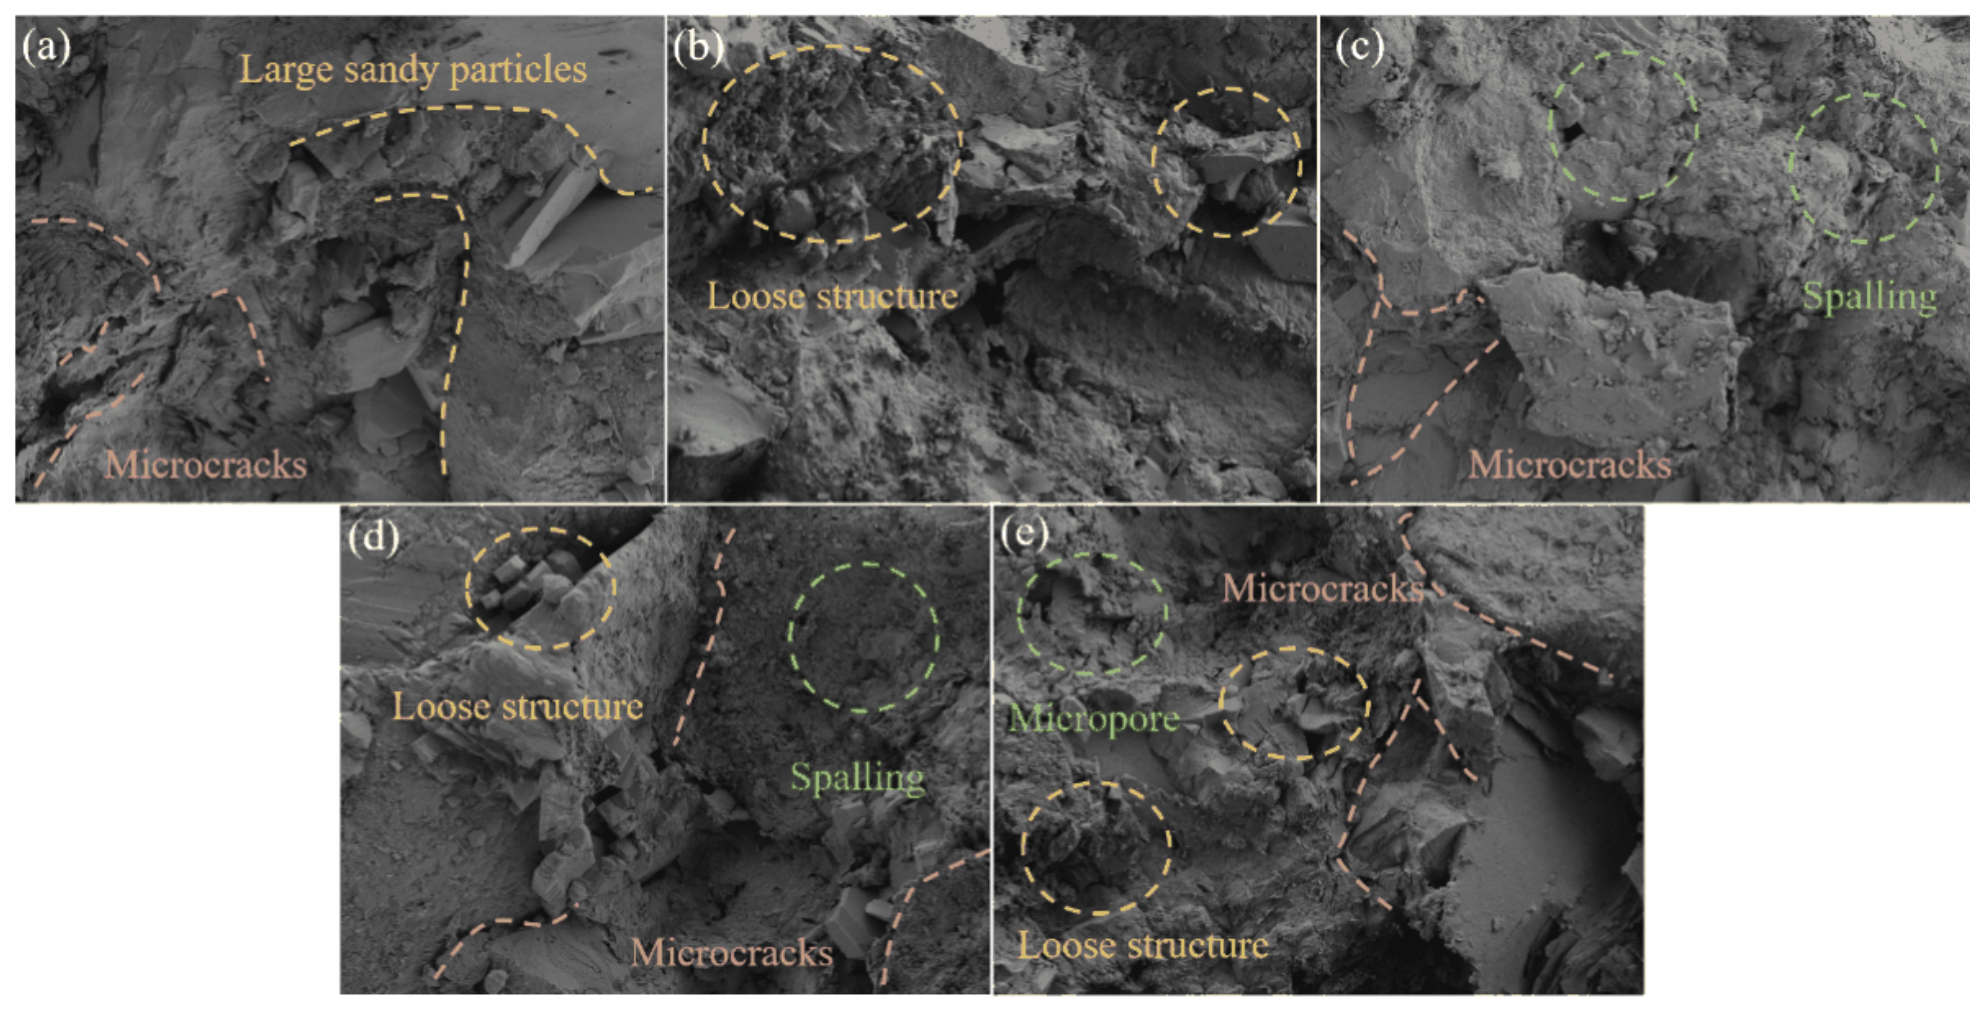
SEM examination was used to verify, at the particle scale, the deterioration mechanisms inferred from the mechanical and AE data [44,45]. Figure 19 and Figure 20 compare the fracture-surface morphologies after 0, 10, 20, 30, and 50 cycles at 500× and 2000× magnifications. Microcracks, loose structure, spalling, and microvoids appear at both scales: the 500× images give the overall distribution of damaged areas, while the 2000× images resolve finer particle-scale deterioration.
Figure 19.
SEM images (500×) of fissured sandstone under different freeze–thaw cycles: (a) 0; (b) 10; (c) 20; (d) 30; (e) 50 cycles.
The surface morphology changes systematically with cycle number. Before treatment and at low cycle numbers, the fracture surfaces stay relatively compact, with only local microcracks, slight spalling, and isolated loose patches. Continued cycling intensifies these features, and microvoids become increasingly visible. At high cycle numbers, microcracks, spalling, microvoids, and loose structure occur together within the same region, showing that repeated freeze–thaw action progressively destroys interparticle bonding and causes particle detachment, local debonding, and material loss. The micrographs at both magnifications consistently record a development from isolated defects to widespread particle-scale deterioration and structural loosening. This microscopic sequence provides direct evidence for the strength and modulus losses reported in Section 3 and for the earlier strain localization observed by DIC and AE.
The mineral composition of sandstone may also influence the development of microcracks under freeze–thaw cycling. As indicated by the XRD results (Figure 3), the investigated sandstone mainly contains albite (52.0%), quartz (20.9%), potash feldspar (18.4%), and an additional phase identified as plagioclase (6.8%). Quartz and feldspars exhibit differences in mechanical properties and crystallographic characteristics, which may contribute to local stress heterogeneity within the mineral framework. In particular, cleavage-related weaknesses in feldspar grains and pre-existing intergranular contacts may provide preferential paths for microcrack initiation and propagation, while differences in deformation behavior between adjacent quartz and feldspar grains may promote stress concentrations at their interfaces. During repeated freezing and thawing, the expansion of water within pores and pre-existing discontinuities may further weaken grain contacts and facilitate the opening of existing defects. Under subsequent compression, these weakened regions may favor intergranular debonding and microcrack coalescence. This interpretation is consistent with the microcracks, particle spalling, microvoids, and loose structures observed in Figure 18 and Figure 19, as well as previous observations of freeze–thaw-related intergranular deterioration in sandstone [44,45].
Figure 20.
SEM images (2000×) of fissured sandstone under different freeze–thaw cycles: (a) 0; (b) 10; (c) 20; (d) 30; (e) 50 cycles.
5. Discussion
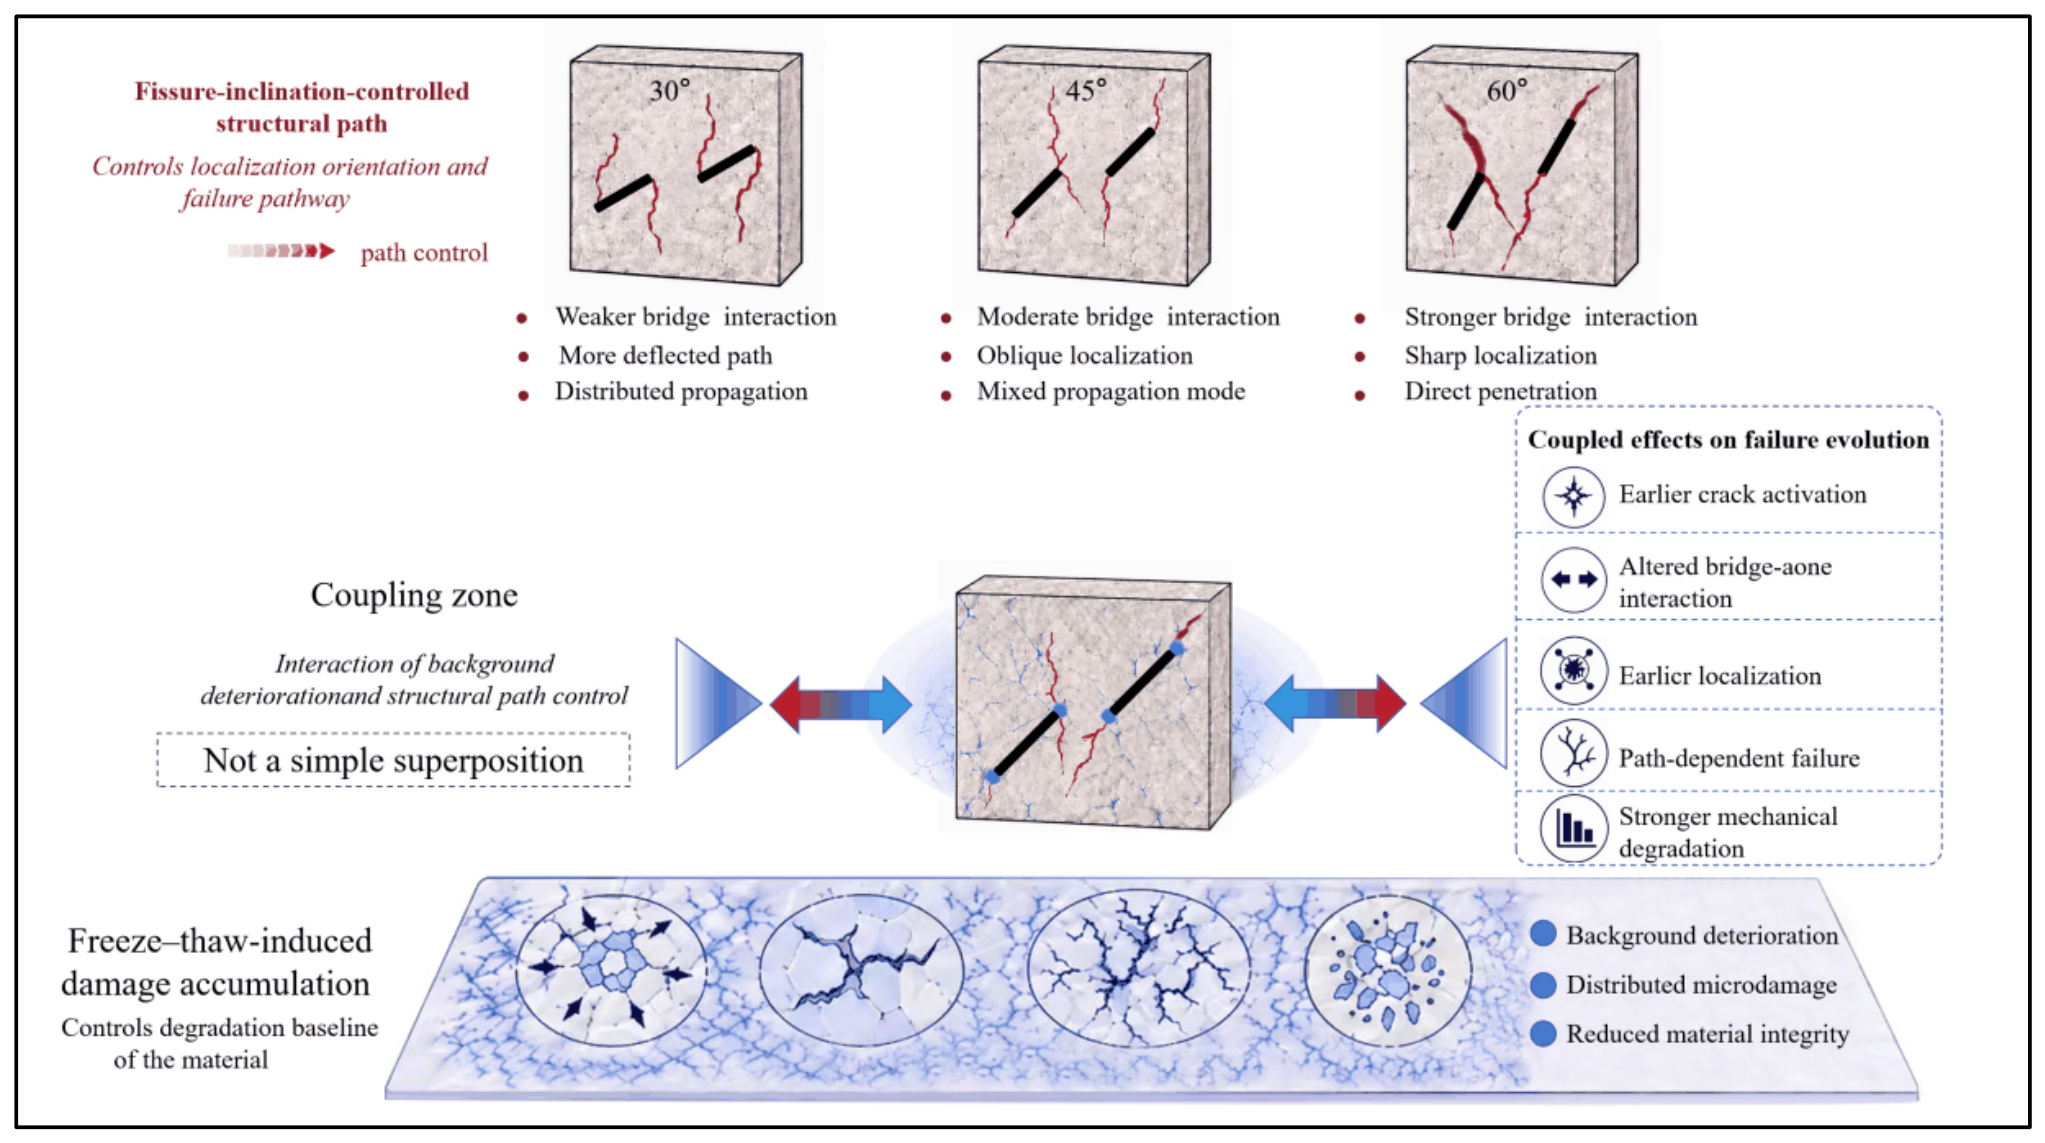
As illustrated in Figure 21, freeze–thaw cycling and fissure inclination jointly influence the mechanical degradation and failure behavior of double-flawed sandstone. Freeze–thaw cycling primarily contributes to material deterioration, as reflected by the overall reductions in peak strength and apparent elastic modulus (Figure 7 and Figure 8). The SEM observations reveal microcracks, interfacial debonding, and locally loosened structures, providing qualitative evidence consistent with microstructural deterioration. Meanwhile, DIC and AE measurements characterize the evolution of strain localization and acoustic activity during loading. Together, these observations provide complementary insights into the mechanical weakening and damage development of sandstone subjected to different freeze–thaw conditions.
Figure 21.
Schematic illustration of the coupling effect of freeze–thaw cycling and fissure inclination.
The second factor is the structural influence of fissure inclination. Although all flawed specimens have the same nominal fissure length, width, and rock-bridge length, variations in fissure inclination alter the overall fissure-bridge configuration, potentially affecting stress redistribution around the fissure tips, rock-bridge orientation, and ice-induced pressure development within water-filled fissures. Therefore, the observed differences in mechanical behavior are associated with changes in fissure configuration rather than solely with stress redistribution. The 30° configuration promotes gradual bridge-zone damage, the 45° configuration strengthens bridge interaction and concentrates localization, and the 60° configuration channels propagation along steep, near-axial paths and produces the clearest through-going failure. Fissure inclination therefore plays an important role in determining the spatial distribution of strain localization, crack propagation paths, and eventual failure modes, while its influence on the magnitude of mechanical degradation varies among the tested configurations.
Freeze–thaw cycling progressively deteriorates the sandstone matrix, whereas fissure inclination influences local stress redistribution and preferred crack-propagation paths. After 50 cycles, the 60° specimens displayed the lowest apparent elastic modulus retention ratio among the tested configurations (49.36%). However, the two-way ANOVA did not identify a statistically significant interaction between freeze–thaw cycles and fissure inclination for apparent modulus (p = 0.206). Thus, the observed retention ranking should not be interpreted as evidence that the 60° geometry systematically causes a greater stiffness loss; its influence on strain localization and final fracture paths is supported separately by the DIC and AE observations.
Taken as a whole, the coupled damage evolution of double-flawed sandstone under freeze–thaw cycling is the outcome of background deterioration combined with path control. Their combined influence helps determine crack activation, bridge-zone interaction, localized deformation, and final failure modes. These qualitative fracture observations should be distinguished from the statistical interaction tests for the measured mechanical parameters.
The overall reductions in peak strength and elastic modulus with freeze–thaw cycling support the first hypothesis, despite local fluctuations between adjacent cycle levels. The inclination-dependent differences in strain localization and crack-coalescence paths provide qualitative support for the second hypothesis. The RA–AF results show increasing tensile-type event proportions with cycling, with different increases among the fissure inclinations, providing descriptive support for the third hypothesis.
This study has several limitations. First, three specimens were tested under each experimental condition, and the investigation was limited to one sandstone type and selected fissure configurations. Second, the DIC and AE results primarily characterize the progressive deformation and damage evolution, while RA–AF classification may be affected by signal propagation and attenuation. Third, the SEM observations were obtained from post-failure fracture surfaces and therefore cannot independently distinguish freeze–thaw-induced damage from loading-induced damage. Furthermore, the absence of additional non-freezing control groups limits the separation of individual deterioration mechanisms. Consequently, the findings should be interpreted within the investigated laboratory conditions. Future studies incorporating larger sample sizes, additional control groups, and quantitative microstructural characterization would help further validate the proposed interpretations.
6. Conclusions
This study examined the mechanical degradation and damage evolution of double-flawed sandstone under 0–50 freeze–thaw cycles, with emphasis on the effect of fissure inclination. The following conclusions can be drawn:
- (1)
- Freeze–thaw cycling progressively weakens the sandstone matrix, producing stronger pre-peak nonlinearity and overall reductions in strength and stiffness. After 50 cycles, the peak strength of intact specimens decreased from approximately 148 to 100 MPa. The mean apparent elastic modulus of the 60° flawed group declined from 13.14 to 6.49 GPa (49.36% retained), while an individual specimen gave the corrected value of approximately 6.1885 GPa.
- (2)
- Fissure inclination controls where strain localizes and how the specimen finally fails. The 30° specimens developed gradual bridge-zone damage, the 45° specimens showed the strongest fissure interaction and the most concentrated localization, and the 60° specimens formed directional, through-going axial bands. Freeze–thaw treatment modified the development and connectivity of strain localization bands, while fissure inclination influenced their spatial distribution and propagation paths.
- (3)
- AE and RA-AF results show that cycling triggers crack activity earlier, sustains it over a wider strain range, and shifts the crack population toward tension in every configuration. The 30° group was slightly tensile-dominated even before treatment (51.37%), whereas the 45° and 60° groups moved from shear-dominated mixed failure to tensile-dominated failure, reaching 68.23% and 58.82% tensile cracks, respectively, at 50 cycles.
- (4)
- Taken together, DIC, AE, RA–AF, and SEM show that freeze–thaw exposure is associated with matrix deterioration, whereas fissure inclination influences strain localization and crack coalescence. These observations help explain the different failure patterns observed among the tested configurations.
Author Contributions
Conceptualization, H.W., H.L., S.J., L.T., and T.X.; methodology, H.W. and H.L.; software, H.L.; validation, Z.W. and L.T.; formal analysis, Z.W.; investigation, Z.W. and M.Y.; resources, H.W. and M.Y.; data curation, H.L., S.J., M.Y., and L.T.; writing—original draft preparation, H.L.; writing—review and editing, H.W. and T.X.; project administration, H.W.; funding acquisition, H.W. and S.J. All authors have read and agreed to the published version of the manuscript.
Funding
This research was funded by the National Natural Science Foundation of China (Grant No. 52374136), the Natural Science Basic Research Foundation of Shaanxi Province (Grant No. 2023-JCQN-0443, 2026JC-YBMS-0533), the Shaanxi Provincial Postdoctoral Science Foundation Project (Grant No. 2023BSHYDZZ141) and the Natural Science Foundation of Hunan Province, China (Grant No. 2024JJ6386).
Institutional Review Board Statement
Not applicable.
Informed Consent Statement
Not applicable.
Data Availability Statement
The original contributions presented in this study are included in the article. Further inquiries can be directed to the corresponding author.
Acknowledgments
The authors thank the technical staff of the Geotechnical and Underground Space Engineering Laboratory for their assistance with the freeze–thaw and mechanical tests. During the preparation of this manuscript, the authors used an AI-based tool for language polishing and paraphrasing only. The authors reviewed and edited all content and take full responsibility for the integrity of this publication.
Conflicts of Interest
The authors declare no conflicts of interest.
References
- Cao, R.-H.; Cao, P.; Lin, H.; Fan, X.; Zhang, C.; Liu, T. Crack initiation, propagation, and failure characteristics of jointed rock or rock-like specimens: A review. Adv. Civ. Eng. 2019, 2019, 6975751. [Google Scholar] [CrossRef] [Scilit]
- Viswanathan, H.S.; Ajo-Franklin, J.; Birkholzer, J.T.; Carey, J.W.; Guglielmi, Y.; Hyman, J.D.; Karra, S.; Pyrak-Nolte, L.J.; Rajaram, H.; Srinivasan, G.; et al. From fluid flow to coupled processes in fractured rock: Recent advances and new frontiers. Rev. Geophys. 2022, 60, e2021RG000744. [Google Scholar] [CrossRef] [Scilit]
- Bons, P.D.; Cao, D.; de Riese, T.; González-Esvertit, E.; Koehn, D.; Naaman, I.; Sachau, T.; Tian, H.; Gomez-Rivas, E. A review of natural hydrofractures in rocks. Geol. Mag. 2022, 159, 1952–1977. [Google Scholar] [CrossRef] [Scilit]
- Debossam, J.G.S.; Heringer, J.D.S.; de Souza, G.; Souto, H.P.A. Numerical simulation of single-phase two-components flow in naturally fractured oil reservoirs. Coupled Syst. Mech. 2019, 8, 129–146. [Google Scholar] [CrossRef]
- Shirzad, G.; Shirkhani, A.; Hoseinzadeh, S. Underground hydrogen storage in naturally fractured reservoirs: Matrix scale modeling for cushion gas selection. Int. J. Hydrogen Energy 2025, 116, 266–278. [Google Scholar] [CrossRef] [Scilit]
- Zhang, Q.; Liu, Y.; Dai, F. A frost heave pressure model for fractured rocks subjected to repeated freeze-thaw deterioration. Eng. Geol. 2024, 337, 107587. [Google Scholar] [CrossRef] [Scilit]
- Shen, F.; Qiu, W.; Xie, K.; Xing, M.; Zhu, H.; Huang, S. A discrete element-based study of freeze–thaw damage in water-filled fractured rock. Comput. Geotech. 2025, 185, 107343. [Google Scholar] [CrossRef] [Scilit]
- Wang, X.; Mu, W.; Li, L.; Yang, T.; Bai, M.; Du, S. Study on freeze-thaw damage and mechanical properties of fractured rock mass grouting reinforcement in alpine region open-pit mines. Int. J. Rock Mech. Min. Sci. 2025, 192, 106143. [Google Scholar] [CrossRef] [Scilit]
- Qiu, W.; Shen, F.; Qi, L.; Lin, L. Evolution mechanism of frost heaving pressure in cold-region tunnels considering freeze-thaw cycling effects. Smart Undergr. Eng. 2026, 2, 163–182. [Google Scholar] [CrossRef] [Scilit]
- Shu, J.; Deng, Z.; Huang, J.; Wu, B.; Zhang, X.; Ai, H. Stability Deterioration Analysis of Toppling Dangerous Rock Mass under the Combined Effect of Vibration and Freeze-Thaw Cycles. KSCE J. Civ. Eng. 2024, 28, 1729–1738. [Google Scholar] [CrossRef] [Scilit]
- Xia, W.; Li, Y.; Zhang, Y.; Li, Z.; Zhang, B.; Xu, N. Stability prediction and failure mechanisms of toppling perilous rocks under ice-wedge freeze-thaw cycles. Cold Reg. Sci. Technol. 2026, 248, 104942. [Google Scholar] [CrossRef] [Scilit]
- Xia, C.; Shi, Z.; Li, H.; Peng, M.; Zhang, L. Freeze-thaw cycles threaten high-altitude cold-region rock slopes stability: Advances in SPH simulation. Int. J. Rock Mech. Min. Sci. 2026, 203, 106553. [Google Scholar] [CrossRef] [Scilit]
- Zhang, J.; Wang, M.; Wang, F.; Ren, L.; Dai, F. Physics-informed prediction of freeze-thaw-induced fracture toughness degradation in hard rock under high-altitude cryospheric engineering environments. Int. J. Min. Sci. Technol. 2026; in press. [CrossRef] [Scilit]
- Chen, Y.; Lin, H.; Liang, L. Freeze-thaw failure characteristics and strength loss of non-penetrating fractured rock mass with different fracture densities. Theor. Appl. Fract. Mech. 2023, 124, 103792. [Google Scholar] [CrossRef] [Scilit]
- Li, X.; Yan, Y.; Zhang, Z.; Qi, C. Freeze–thaw effect on micro-macro fracture in brittle rocks under compression. Int. J. Rock Mech. Min. Sci. 2026, 204, 106582. [Google Scholar] [CrossRef] [Scilit]
- Wang, Z.; Yu, M.; Zuo, J.; Xu, Y.; Ma, D.; Ge, J.; Wang, L. Fracture characteristics and evolution mechanism of freeze-thaw rock under mixed mode I/II loading. Theor. Appl. Fract. Mech. 2025, 139, 105105. [Google Scholar] [CrossRef] [Scilit]
- Wang, C.; You, R.; Lv, W.; Sui, Q.; Yan, Y.; Zhu, H. Damage Evolution and Acoustic Emission Characteristics of Sandstone under Freeze-Thaw Cycles. ACS Omega 2024, 9, 4892–4904. [Google Scholar] [CrossRef] [Scilit] [PubMed]
- Che, Y.; Song, Y.; Yang, H.; Tan, H.; Zhang, L. Freeze-thaw induced structural deterioration of fractured rock: A coupled NMR–CT study on pore network evolution. Theor. Appl. Fract. Mech. 2026, 141, 105274. [Google Scholar] [CrossRef] [Scilit]
- Wang, D.; Xu, P.; Lu, J.; Lei, S.; Yin, L.; Li, L.; Yang, X.; Zhu, Z.; Chen, L.; Wang, Z. Investigation on the pore structure and permeability of slate exposed to freeze–thaw cycles. Int. J. Min. Sci. Technol. 2026; in press. [CrossRef] [Scilit]
- Yu, M.; Wang, Z.; Ma, D.; Ge, J.; Wang, Y.; Xie, H.; Wu, G.; Meng, Y. Fracture characteristics and process zone evolution in sandstone under freeze-thaw cycles. Res. Cold Arid Reg. 2025, 17, 217–228. [Google Scholar] [CrossRef] [Scilit]
- Deng, Z.; Zhang, X.; Wang, Z.; Min, J.; Wei, J. Analysis of fracture toughness deterioration and instability model of dangerous rock masses under freeze–thaw cycles. Theor. Appl. Fract. Mech. 2024, 131, 104398. [Google Scholar] [CrossRef] [Scilit]
- Sun, L.; Tao, S.; Liu, Q. Frost Crack Propagation and Interaction in Fissured Rocks Subjected to Freeze–thaw Cycles: Experimental and Numerical Studies. Rock Mech. Rock Eng. 2023, 56, 1077–1097. [Google Scholar] [CrossRef] [Scilit]
- Huang, S.; Wang, J.; Liu, Y.; Tian, Q.; Cai, C. Experimental investigation on crack coalescence and strength loss of rock-like materials containing two parallel water-filled flaws under freeze–thaw. Theor. Appl. Fract. Mech. 2023, 123, 103669. [Google Scholar] [CrossRef] [Scilit]
- Chen, Y.; Lin, H. Deterioration laws of Hoek-Brown parameters in freeze–thaw multi-fractured rock mass. Theor. Appl. Fract. Mech. 2023, 123, 103716. [Google Scholar] [CrossRef] [Scilit]
- Pan, Z.; Jia, H.; Yang, G.; Wang, T.; Liang, B.; Xie, L.; Bao, H. Revealing degradation mechanisms of rock joint under freeze-thaw cycles using a modified joint roughness coefficient-joint wall compressive strength model. J. Rock Mech. Geotech. Eng. 2026; in press. [CrossRef] [Scilit]
- Yu, M.; Wang, Z.; Xu, Y.; Chang, Y.; Wang, L.; Zhu, Y. The failure behavior of prefabricated fractured sandstone with different rock bridge inclination angles under freeze-thaw cycles. Unconv. Resour. 2025, 6, 100152. [Google Scholar] [CrossRef] [Scilit]
- Dai, F.; Zhang, Q.; Yan, Z.; Liu, Y. Mechanical deterioration of flawed rocks under freeze-thaw and cyclic loading. J. Rock Mech. Geotech. Eng. 2026; in press. [CrossRef] [Scilit]
- Zhang, Q.; Liu, Y.; Dai, F. Deterioration of flawed sandstone after freeze-thaw treatment considering frost heave pressure. J. Rock Mech. Geotech. Eng. 2026, 18, 92–112. [Google Scholar] [CrossRef] [Scilit]
- Zhao, Y.; Zhao, Q.; Yang, T.; Chen, Y.; Zhang, P.; Liu, H. Investigation of crack propagation and acoustic emission characteristics in jointed rock under freeze–thaw cycles based on DEM. Int. J. Min. Sci. Technol. 2025, 35, 1171–1195. [Google Scholar] [CrossRef] [Scilit]
- Liang, X.; Liu, Z.; Peng, K.; Wang, H.; Zhang, S.; Yuan, C. Failure prediction of fissured rock under freeze-thaw cycles based on critical slowing down theory of acoustic emission multi-parameter. Results Eng. 2025, 25, 103874. [Google Scholar] [CrossRef] [Scilit]
- Tan, T.; Zhang, C.; Li, W.; Zhao, E. Evolution of Freeze–Thaw Damage Characteristics and Corresponding Models of Intact and Fractured Rocks Under Uniaxial Compression. Rock Mech. Rock Eng. 2024, 57, 8013–8033. [Google Scholar] [CrossRef] [Scilit]
- Tan, T.; Zhang, C.; Dai, B.; Zhao, K. Damage and failure characteristics of single fractured cyan sandstone subjected to freeze–thaw cycles under uniaxial compression. Theor. Appl. Fract. Mech. 2024, 130, 104272. [Google Scholar] [CrossRef] [Scilit]
- Cao, J.; Hu, J.; Wang, X.; Yang, Y.; Xia, Z.; Wang, H.; Yang, B. Numerical simulation of the meso-mechanical properties of double cruciform fissures rocks after freeze–thaw cycles. Comput. Part. Mech. 2025, 12, 1549–1564. [Google Scholar] [CrossRef] [Scilit]
- Li, Y.; Huang, D. Damage Properties and Rheological Model of Spatial-Rotation Fissured Red Sandstone Subjected to Freeze–Thaw and Loading. Rock Mech. Rock Eng. 2024, 57, 8993–9017. [Google Scholar] [CrossRef] [Scilit]
- Tan, Q.; Wen, T.; Wang, Y.; Zhang, B.; Chen, N. Failure mechanism and multi-scale damage evolution of fractured conglomerate under freeze-thaw cycles and unloading. Theor. Appl. Fract. Mech. 2026, 146, 105715. [Google Scholar] [CrossRef] [Scilit]
- Niu, Y.; Zhou, X.P.; Zhang, J.Z.; Qian, Q.H. Experimental study on crack coalescence behavior of double unparallel fissure-contained sandstone specimens subjected to freeze-thaw cycles under uniaxial compression. Cold Reg. Sci. Technol. 2019, 158, 166–181. [Google Scholar] [CrossRef] [Scilit]
- Chen, H.; Zhao, C.; Zhang, R.; Xing, J.; Huang, L.; Qian, Y. Macro-micro damage model of the effect of freeze–thaw on jointed rocks considering compaction deformation. Eng. Fail. Anal. 2023, 151, 107407. [Google Scholar] [CrossRef] [Scilit]
- Ma, D.; Yu, M.; He, L.; Wang, Z.; Yang, Z.; Wu, G. Research on Fracture Characteristics and Crack Propagation Patterns of Freeze-Thaw Damaged Rock Under Loading. Appl. Geophys. 2026; in press. [CrossRef] [Scilit]
- Li, K.-S.; Yang, S.-Q.; Song, Y.; Li, Y. Numerical characterization on fracture evolution behavior of pre-flawed sandstone under monotonic and multilevel cyclic loading. Theor. Appl. Fract. Mech. 2024, 133, 104634. [Google Scholar] [CrossRef] [Scilit]
- RILEM Technical Committee 212-ACD. Recommendation of RILEM TC 212-ACD: Acoustic emission and related NDE techniques for crack detection and damage evaluation in concrete: Test method for classification of active cracks in concrete structures by acoustic emission. Mater. Struct. 2010, 43, 1187–1189. [Google Scholar] [CrossRef] [Scilit]
- Dong, L.; Zhang, Y.; Bi, S.; Ma, J.; Yan, Y.; Cao, H. Uncertainty investigation for the classification of rock micro-fracture types using acoustic emission parameters. Int. J. Rock Mech. Min. Sci. 2023, 162, 105292. [Google Scholar] [CrossRef] [Scilit]
- Bi, J.; Zhao, Y.; Wu, Z.; Li, J.; Wang, C. Research on crack classification method and failure precursor index based on RA-AF value of brittle rock. Theor. Appl. Fract. Mech. 2024, 129, 104179. [Google Scholar] [CrossRef] [Scilit]
- Watanabe, T.; Nishibata, S.; Hashimoto, C.; Ohtsu, M. Compressive failure in concrete of recycled aggregate by acoustic emission. Constr. Build. Mater. 2007, 21, 470–476. [Google Scholar] [CrossRef] [Scilit]
- Niu, C.; Zhu, Z.; Zhou, L.; Li, X.; Ying, P.; Dong, Y.; Deng, S. Study on the microscopic damage evolution and dynamic fracture properties of sandstone under freeze-thaw cycles. Cold Reg. Sci. Technol. 2021, 191, 103328. [Google Scholar] [CrossRef] [Scilit]
- Zhang, R.; Yang, Y.; Ma, D.; Ping, Q. Experimental study on effect of freeze-thaw cycles on dynamic mode-Ι fracture properties and microscopic damage evolution of sandstone. Eng. Fract. Mech. 2023, 279, 109043. [Google Scholar] [CrossRef] [Scilit]

Disclaimer/Publisher’s Note: The statements, opinions and data contained in all publications are solely those of the individual author(s) and contributor(s) and not of MDPI and/or the editor(s). MDPI and/or the editor(s) disclaim responsibility for any injury to people or property resulting from any ideas, methods, instructions or products referred to in the content. |
© 2026 by the authors. Licensee MDPI, Basel, Switzerland. This article is an open access article distributed under the terms and conditions of the Creative Commons Attribution (CC BY) license.