


Abstract
Repeated template–copy images create a methodological challenge for participant-level prediction because each participant contributes many observations but only one outcome; image-level evaluation can misalign analytical units and permit participant leakage. This study developed a single artificial intelligence (AI) framework with two separately evaluated representation pathways to quantify Chinese character copying deviations and predict questionnaire-derived grit scores. The main cohort included 191 undergraduates (48,826 images), and a non-overlapping same-university validation cohort included 62 participants (13,803 images). The pathways comprised 48-dimensional handcrafted morphological descriptors and shared-weight Siamese deep visual representations. Participant-identity-based partitioning and within-participant aggregation aligned repeated observations with participant-level evaluation. After a held-out comparison of seven backbones, DenseNet121 was selected; subsequent cross-validation estimates were treated as post-selection estimates. In participant-grouped five-fold cross-validation, DenseNet121 achieved mean absolute error (MAE) = 0.233, Pearson correlation coefficient (PCC) = 0.579, and coefficient of determination () = 0.284, versus 0.279, 0.451, and 0.176 for the handcrafted pathway. In validation, DenseNet121 achieved 0.249, 0.507, and 0.205. SHapley Additive exPlanations (SHAP) identified model-relevant handcrafted features related to spatial ink distribution, character proportion, and texture. The findings provide proof-of-concept evidence for participant-aligned behavioral-image modeling, but prediction remained moderate and incomplete; they do not establish construct-specific measurement, causality, or cross-institutional generalizability.
1. Introduction
Standardized paper-based copying tasks generate paired visual observations in which each produced image has an explicit reference. Unlike unconstrained handwriting, where written content and visual context may vary substantially across samples, template-based copying permits deviations between a reference image and its corresponding reproduction to be quantified under a controlled task structure. A methodological challenge arises when repeated template–copy observations are used to predict an outcome defined only once per participant: the analysis must preserve the exact template reference, prevent observations from the same participant from crossing development and evaluation partitions, and align pair-level predictions with the participant-level criterion. The present study addresses this need through participant-aligned representation and evaluation of standardized copying deviations.
Chinese character copying provides a structured setting for template-referenced image analysis because Chinese characters require organized spatial arrangement of strokes and components [1]. Producing a copy requires visual analysis of the reference, representation of spatial relationships, sensorimotor transformation, motor execution, and monitoring of the produced output. Handwriting research has shown that written production reflects interactions among perceptual, motor, orthographic, and control processes rather than a single isolated source of variation [2,3]. Consequently, deviations between a copied character and its exact template can be treated as observable task-performance differences. At the same time, such deviations may reflect multiple participant- and task-related sources of variation and should not, by themselves, be interpreted as direct indicators of a specific psychological construct.
Computer vision and machine-learning methods provide complementary approaches for representing these paired visual differences. Handcrafted descriptors can quantify predefined properties such as geometry, contour structure, foreground distribution, spatial organization, and texture, thereby retaining explicit morphological meanings. Deep visual architectures can instead learn complex image representations that are difficult to specify manually. Convolutional neural networks, vision transformers, and pretrained visual encoders have demonstrated strong representation capacity across visual prediction tasks [4,5,6,7,8,9,10]. Shared-weight Siamese architectures are particularly suitable for template–copy data because paired images can be processed by identical parameter-sharing branches within a common representation space before comparison [11]. For downstream nonlinear regression, Light Gradient Boosting Machine (LightGBM) provides an efficient framework for modeling derived representations [12]. When the input dimensions retain predefined meanings, SHapley Additive exPlanations (SHAP) can further provide feature-level traceability of fitted-model dependence [13].
Previous computational studies of Chinese calligraphy copying have demonstrated the utility of handcrafted visual descriptors, template-referenced comparison, and Siamese or transformer-enhanced deep architectures for automated image evaluation [14,15,16]. However, prediction from repeated template–copy observations introduces a different methodological problem when the image-acquisition unit and the prediction unit are not the same. In the present setting, each participant contributed many copied-character images, whereas the target outcome was defined only once for each participant. Treating individual images as statistically independent participant samples would overstate the effective sample size and could introduce information leakage if observations from the same participant were distributed across model-development and evaluation partitions. Reliable participant-level modeling therefore requires participant-identity-based partitioning, within-participant prediction aggregation, and evaluation on previously unseen individuals [17].
A related issue concerns model selection and performance estimation. Comparing multiple visual architectures and subsequently evaluating a selected architecture within the same broader dataset can produce optimistic performance estimates when selection is not fully separated from evaluation [18,19]. In the present study, candidate deep architectures were therefore compared using a participant-held-out subset and the selected pathway was subsequently evaluated using participant-grouped five-fold cross-validation. Because architecture selection preceded cross-validation within the main cohort, the resulting cross-validated estimates are interpreted transparently as post-selection estimates rather than fully selection-adjusted evidence of architectural superiority. A completely non-overlapping same-university cohort was additionally reserved for evaluation after the analytical configuration had been fixed.
The participant-level prediction criterion in this study was the composite score obtained from a bilingual administration of the original 12-item Grit Scale [20]. The score was used as an observed questionnaire-derived continuous outcome rather than as an error-free estimate of a latent personality construct. This distinction defines the inferential scope of the study: the computational question is whether repeated standardized template–copy deviations contain reproducible visual information that supports prediction of an observed participant-level questionnaire score. Predictive performance does not establish that the image-derived representations are specific to grit or measure the underlying psychological construct [21,22]. Nor does it establish independence from other individual or task-related factors or suitability for personality diagnosis.
The same main-cohort image resource has also supported previous computational studies of Chinese calligraphy imitation and trait emotional intelligence prediction [16,23]. The present study reuses this previously described image resource but addresses a distinct prediction criterion and evaluation framework. Specifically, the target is an observed participant-level questionnaire-derived grit score rather than a character-level aesthetic rating or a trait-emotional-intelligence outcome. Repeated template–copy observations are treated as observations nested within participants, and predictive performance is evaluated only after aggregation to the participant level. Accordingly, the present contribution concerns participant-aligned representation and evaluation rather than claiming novelty for Siamese learning, handcrafted descriptors, or convolutional networks themselves.
To address this methodological need, the contribution of this study is threefold. First, it constructs two separate template-referenced deviation representations from verified presented-template/copy pairs: a predefined 48-dimensional morphological representation and a learned Siamese deep visual representation. Second, it evaluates these pathways using participant-identity-based partitioning, within-participant prediction aggregation, and participant-level performance metrics, explicitly distinguishing the image-pair training unit from the participant-level outcome unit. Third, it combines held-out candidate comparison, participant-grouped five-fold cross-validation, cross-validated SHAP analysis, aggregation-sensitivity analysis, and evaluation in a completely non-overlapping same-university validation cohort. The study therefore examines whether participant-aligned modeling of template-referenced copying deviations yields reproducible predictive correspondence while explicitly defining the methodological limits of that evidence and without claiming that the image deviations constitute a construct-specific measure of grit.
Figure 1 summarizes the complete analytical framework.
Figure 1.
Overview of the AI-based analytical framework for participant-level prediction from standardized Chinese character template–copy deviations, including separate handcrafted and Siamese deep visual representation pathways, participant-level candidate-pathway selection and grouped evaluation, non-overlapping same-university validation, and cross-validated SHAP analysis. AI, artificial intelligence; CV, cross-validation; LightGBM, Light Gradient Boosting Machine; MAE, mean absolute error; PCC, Pearson correlation coefficient; , coefficient of determination; SHAP, SHapley Additive exPlanations. The Chinese glyphs are examples of the original standardized copying-task stimuli. Colored arrows show schematic workflow connections and do not encode quantitative values.
2. Materials and Methods
2.1. Study Design and Analytical Overview
This study used a participant-level predictive modeling design to evaluate computational representations derived from standardized hard-pen Chinese character template–copy images. The analysis comprised a main modeling cohort and a completely non-overlapping same-university validation cohort. The composite questionnaire-derived grit score was treated as a continuous participant-level prediction criterion.
Within this single analytical framework, two alternative image-representation pathways were evaluated separately rather than as different end-to-end AI systems. The handcrafted pathway quantified predefined morphological deviations between each copied character and its exact presented template, whereas the deep visual pathway used shared-weight Siamese networks to learn template–copy deviation representations directly from paired images. Both pathways fed their respective deviation representations into the same downstream Light Gradient Boosting Machine (LightGBM) regression stage. They were analyzed in parallel for comparison and were not concatenated, fused, or ensembled.
Because each participant contributed multiple template–copy image pairs but only one questionnaire-derived criterion value, image observations were treated as repeated observations nested within participants. Participant identity was therefore preserved throughout model development and evaluation so that observations from the same participant did not appear in both model-development and evaluation partitions.
Candidate deep architectures were first compared using a held-out participant subset. The selected deep pathway and the prespecified handcrafted pathway were subsequently evaluated using participant-grouped five-fold cross-validation, within-participant prediction aggregation, and participant-level performance metrics. Cross-validated SHapley Additive exPlanations (SHAP) were used to characterize the handcrafted pathway, and aggregation-sensitivity analyses were used to examine the stability of participant-level predictions under alternative within-participant aggregation rules. The finalized analytical configurations were further evaluated in the non-overlapping same-university validation cohort. Figure 1 summarizes the overall analytical framework.
2.2. Participants, Cohorts, and Ethical Considerations
Participants were undergraduate students recruited through elective hard-pen calligraphy courses at Jiangnan University. The main modeling cohort comprised 191 participants and was used for representation development, candidate deep-pathway comparison, participant-grouped cross-validation, model interpretation, and aggregation-sensitivity analysis. A separate validation cohort comprised 62 participants recruited from a different data-collection batch and grade level at the same university. No participant appeared in both cohorts.
After image-quality screening and template–copy correspondence verification, the main modeling cohort contributed 48,826 valid copied-character images, whereas the validation cohort contributed 13,803 valid copied-character images. Participant characteristics and dataset composition are summarized in Table 1.
Table 1.
Participant characteristics and dataset composition of the main modeling and same-university independent validation cohorts. M, mean; SD, standard deviation.
The validation cohort followed the same questionnaire-administration format, standardized copying-task protocol, image-acquisition procedure, preprocessing rules, quality-screening criteria, and template–copy verification procedure as the main cohort. Validation participants and their data were not used for candidate architecture comparison, DenseNet121 selection, representation learning, model fitting, checkpoint selection, hyperparameter determination, aggregation-rule selection, training-length determination, or evaluation-rule development.
The study protocol was approved by the Medical Ethics Committee of Jiangnan University (protocol code JNU202409RB0029; approval date: 27 September 2024). The approval covered both cohorts. All participants provided written informed consent before participation. Image data, questionnaire responses, and analytical records were de-identified before analysis.
2.3. Participant-Level Prediction Criterion
The participant-level prediction criterion was the composite score obtained from the original 12-item Grit Scale, which assesses perseverance of effort and consistency of interest in pursuing long-term goals [20]. The questionnaire was administered online using a bilingual presentation in which the original English items were accompanied by Chinese wording to support comprehension among Chinese-speaking participants. The Chinese wording served as language support and was not treated as an independently validated Chinese adaptation of the scale. No separate English-proficiency examination or formal item-comprehension assessment was conducted.
Participants responded using the original five-point response format ranging from 1 (“not at all like me”) to 5 (“very much like me”). Negatively keyed items were reverse-scored according to the original scoring procedure, and the participant-level criterion was calculated as the mean of all 12 item responses.
The resulting composite score was treated throughout this study as an observed questionnaire-derived continuous prediction target rather than as an error-free estimate of a latent personality construct. Internal consistency of the 12-item composite score was estimated separately in the main and validation cohorts using Cronbach’s . Descriptive characteristics of the prediction criterion are reported in Section 3.1.
2.4. Standardized Hard-Pen Chinese Character Copying Task
Participants completed a standardized hard-pen Chinese character copying task under common classroom conditions. They were instructed to reproduce the presented template characters as accurately as possible with respect to overall structure, spatial organization, and stroke arrangement.
The task comprised 55 designated Chinese characters. Eleven regular-script template instances, corresponding to 11 calligrapher-specific reference sets, were prepared for each character, yielding a pool of 605 template instances. During course-based data collection, participants were randomly assigned works by calligraphers as reference templates, and repeated copying sessions were conducted over an eight-week period [23]. During each trial, the copied character was linked to the exact template instance presented in that trial, thereby forming an explicit template–copy image pair.
To characterize the visual composition of the standardized task, the 55 designated characters were summarized according to structural category and the pre-existing stroke-count-based complexity grouping used in the stimulus set. Structural categories comprised horizontal composition, vertical composition, full enclosure, semi-enclosure, and interlocking structure, while the low-, medium-, and high-complexity labels followed the designated characters’ stroke-count grouping. The numbers of characters and the mean and standard deviation of stroke counts in each complexity group are reported in Table 2; the assigned group for each character is shown in Appendix A Figure A1. These classifications describe the composition of the task stimuli only and were not used for model selection or primary predictive evaluation.
Table 2.
Composition of the 55 designated Chinese characters by structural category and stroke-count-based complexity. M, mean; SD, standard deviation.
The distribution of the designated characters across structural categories and complexity levels is summarized in Table 2. The complete character set is provided in Appendix A Figure A1.
The standardized task therefore provided an explicit visual reference for every retained copied-character image, allowing subsequent computational representations to be defined from deviations relative to the corresponding presented template rather than from unconstrained handwriting appearance.
2.5. Image Acquisition, Preprocessing, and Pair Verification
Completed copying sheets were digitized using an Epson Perfection V39 scanner (Seiko Epson Corporation, Suwa, Japan) at 600 dpi in 8-bit grayscale mode. Identical acquisition settings and image-quality screening procedures were applied to the main modeling and validation cohorts.
For quality-control accounting, each candidate copied-character image was treated as one candidate observation and linked to the exact presented template used in that trial. The copied-character image, rather than the template and copied image counted together, was the unit used to report image counts. The linked template served as the reference for checking content correspondence and was retained as the paired input for subsequent representation construction. Candidate copied-character images were excluded if (1) scan quality was insufficient to identify the primary character structure, (2) the page or designated character region was missing, (3) cropping rendered the character clearly incomplete, or (4) the copied content did not match the designated template. Only observations satisfying all image-quality and template–copy correspondence requirements were retained.
The number of copied-character images meeting each exclusion criterion and the total number of uniquely excluded images were recorded separately for the main and validation cohorts. Criterion-specific counts were not mutually exclusive because an individual image could meet more than one exclusion criterion. Such an image was counted under each applicable criterion but only once in the total number of uniquely excluded images. The overall exclusion rate was calculated as
where is the number of distinct copied-character images excluded and is the total number of candidate copied-character images submitted to quality control.
For each participant p, the participant-level exclusion rate was calculated as
where denotes the number of uniquely excluded copied-character images and denotes the number of candidate copied-character images submitted to quality control for that participant. The number of retained copied-character images was calculated as the difference between these quantities. The mean participant-level exclusion rate was calculated as
where P is the number of participants in the cohort. This participant-weighted mean gives each participant equal weight and differs from the overall exclusion rate in Equation (1), which is calculated from pooled image counts. Participant-level exclusion rates and retained copied-character image counts were summarized separately for each cohort using the mean, standard deviation, median, interquartile range (IQR), minimum, and maximum. The cohort-specific quality-control results and participant-level image-retention distributions are reported in Appendix A Table A3.
Template and copied-character images were processed separately using the same preprocessing pipeline. Each 8-bit grayscale scan was binarized using a fixed threshold of 127, with pixels at or below the threshold treated as foreground ink and represented as black (0) against a white (255) background. The smallest rectangular region containing the foreground-ink pixels was extracted and proportionally resized so that its longer side measured 160 pixels, using nearest-neighbor interpolation. The resized image was placed on a -pixel white canvas. The centroid was calculated from the black foreground-ink pixels, rather than from the background within the cropped region. The image was translated toward the canvas center using an integer-pixel shift constrained by the foreground bounding limits so that no foreground pixels were clipped. When exact centering would have required clipping, the largest non-clipping translation was applied.
These operations standardized each foreground character’s scale and approximate position within the -pixel canvas. Consequently, original scan-level character size and page location were not retained as raw spatial information, whereas aspect ratio and relative within-character spatial organization remained represented in the standardized image coordinate system. Contour and texture descriptors therefore characterize the resized images at the standardized resolution and may reflect effects of resampling. No rotation correction, nonlinear deformation, elastic transformation, or pairwise geometric registration between a copied character and its paired template was applied. The resulting template–copy representations therefore characterize morphological differences between independently preprocessed images rather than differences in original absolute character size or page position.
Each retained copied-character image was linked to participant, designated-character, and template identifiers. These identifiers were used to verify that each copied character corresponded to the exact template instance presented during the relevant trial. Each retained image therefore formed one verified template–copy pair for subsequent representation construction. The released analysis scripts take this verified correspondence as input and do not infer template identity from image content.
2.6. Template–Copy Deviation Representations
Two alternative computational representation pathways were constructed within the same analytical framework from each verified template–copy pair: a handcrafted morphological representation and a Siamese deep visual representation. For both pathways, the exact template presented during the corresponding trial served as the reference image, and deviation direction was defined consistently as copied-character representation minus template representation. The pathways were evaluated separately through the same downstream regression-and-participant-aggregation logic and were not concatenated, fused, or ensembled. Figure 2 illustrates the representation-construction and pair-level prediction procedure.
Figure 2.
Construction of template–copy deviation representations and pathway-specific prediction modeling. Each verified pair was processed through two separately modeled representation pathways: a handcrafted morphological pathway and a shared-weight Siamese deep visual pathway. Both pathways produced 48-dimensional copied-minus-template deviation representations, which were subsequently supplied to separate LightGBM regressors. In the deep visual pathway, the Siamese regression head was used only to supervise representation learning and did not directly generate the final reported predictions. CLS, class token; DWConv, depthwise convolution; LightGBM, Light Gradient Boosting Machine; MSE, mean squared error; ViT, vision transformer. The Chinese glyphs are original template and copied-character task stimuli. Yellow arrows show processing flow, while blue curved arrows indicate shared-weight learning connections; colored symbols are identified in the figure legend.
2.6.1. Handcrafted Morphological Representation
The handcrafted pathway comprised 48 predefined morphological descriptors characterizing character dimensions and proportion, bounding geometry, contour properties, spatial and foreground-ink distribution, structural organization, and texture-related characteristics. The 48-dimensional descriptor system was adapted from an interpretable handcrafted-feature framework previously developed for computational evaluation of Chinese calligraphy imitation [16].
For verified template–copy pair i, each descriptor was calculated separately from the copied image and its corresponding template image . Let denote the kth descriptor. The corresponding template–copy deviation feature was defined as
Each verified pair therefore yielded a 48-dimensional handcrafted morphological deviation vector. Positive and negative values indicate that the corresponding descriptor value was higher or lower, respectively, in the copied character than in its paired template. Because individual descriptors represent different morphological quantities and measurement scales, raw deviation values were not interpreted as directly comparable deviation magnitudes across dimensions.
The predefined descriptors retained explicit morphological meanings and therefore enabled subsequent feature-level model interpretation. All descriptors were calculated from the preprocessed -pixel images and therefore characterize morphology in the standardized image coordinate system rather than original scan-level character dimensions or page coordinates. No individual descriptor was assigned a direct psychological meaning. Detailed definitions of the 48 descriptors and their corresponding deviation features are provided in Appendix A Table A1.
2.6.2. Siamese Deep Visual Representation
Deep visual deviation representations were constructed using two-branch shared-weight Siamese neural networks [11]. For each verified template–copy pair, the copied character and its corresponding template were processed by identical network branches with shared parameters, allowing both images to be represented within the same visual feature space.
For template–copy pair i and candidate backbone b, the deep deviation representation was defined as
where and denote the copied and template images, respectively, and denotes the 48-dimensional latent representation produced by candidate backbone b after the task-specific projection layer. The subtraction direction was therefore defined consistently with the handcrafted pathway as copied-character representation minus template representation.
During Siamese representation learning, each pair-level deviation vector was associated with the participant-level questionnaire criterion of the participant who produced the corresponding copy. A regression head operating on the 48-dimensional deviation vector was optimized using a mean squared error objective to provide supervised learning of the visual representation. Participant identities were kept strictly separated between model-development and evaluation partitions throughout this procedure.
Seven backbones were compared: ResNet101, DenseNet121, EfficientNet-B0, Vision Transformer (ViT-B/16), ConvNeXt-Tiny, DINOv2 ViT-S/14, and CLIP ViT-B/32 [4,5,6,7,8,9,10]. For every candidate pathway, the backbone output was mapped through a task-specific projection layer to a 48-dimensional latent representation before copied-minus-template subtraction. The seven candidate backbones were instantiated using timm (version 0.9.16). The selected DenseNet121 pathway used for subsequent fold-wise evaluation and final refitting was implemented in the released PyTorch code using the standard DenseNet121 configuration, with four dense blocks containing 6, 12, 24, and 16 layers, respectively, a growth rate of 32, and 64 initial feature channels. For convolutional architectures such as DenseNet121, the final feature map was reduced using adaptive global average pooling and flattening before projection to the 48-dimensional latent space.
For DINOv2 and CLIP, the official pretrained visual encoders were used with their encoder parameters frozen and their encoder modules kept in evaluation mode during optimization; only the newly added 48-dimensional projection and regression layers were optimized. ResNet101, DenseNet121, EfficientNet-B0, ViT-B/16, and ConvNeXt-Tiny, together with their task-specific projection and regression layers, were trained entirely from scratch. Because the candidate pathways differed in initialization and training strategy, the held-out candidate comparison was used to designate a representative deep pathway under the evaluated configurations rather than as a controlled benchmark isolating backbone architecture as the sole determinant of performance.
After Siamese representation learning, the regression head was not used to generate the final reported predictions. Instead, the learned 48-dimensional template–copy deviation vectors were extracted and supplied as inputs to the pathway-specific LightGBM regression model described in Section 2.7.1. Thus, the Siamese regression head served only to supervise representation learning, whereas the final predictive evaluation reported in this study was based on LightGBM predictions generated from the learned deep deviation representations.
2.7. Prediction Modeling and Participant-Grouped Evaluation
The questionnaire-derived criterion was defined once per participant, whereas each participant contributed multiple template–copy observations. Image pairs were therefore treated as repeated observations nested within participants rather than as independent participant samples. For both representation pathways, each pair-level representation was associated with the criterion value of the corresponding participant during regressor training, pair-level predictions were generated by the fitted models, and final performance was evaluated only after within-participant aggregation.
All model-development and evaluation partitions were defined according to participant identity.
2.7.1. Model Training and Common Settings
During candidate comparison and participant-grouped cross-validation, Siamese networks were optimized using mean squared error (MSE) loss and the Adam optimizer. Models were trained for a maximum of 50 epochs with a batch size of 32 and an initial learning rate of . Checkpoint selection was performed only using a development subset defined by participant identity and drawn from the corresponding training-side participants, and the checkpoint with the lowest development loss was retained. Neural-network training and development MSE were calculated over template–copy pair observations; batch losses were accumulated in proportion to batch size, so each pair contributed equally to the pair-level mean. Participants belonging to the corresponding held-out evaluation subset were never used for checkpoint selection or any other model-development decision.
Preprocessed binary images were converted to tensors with values between 0 and 1. For visual backbones requiring three-channel input, the grayscale channel was replicated across three channels. No channel-wise mean–standard-deviation normalization was applied to any candidate backbone; the same replicated grayscale tensors scaled to the range 0–1 were supplied to all models, including the frozen pretrained DINOv2 and CLIP encoders. No stochastic image augmentation, rotation, elastic deformation, or other data-dependent geometric transformation was used during model training.
For candidate comparison and participant-grouped cross-validation, handcrafted and deep deviation representations were supplied separately to LightGBM regressors [12]. The regressors used a regression objective with the pair-level L2 metric for monitoring, 255 leaves, a learning rate of 0.1, a feature fraction of 1, and a maximum of 500 boosting rounds. The development subset was defined by participant identity, but LightGBM early stopping evaluated the L2 metric over all template–copy pair observations contributed by those development participants, with each pair contributing equally. Training was stopped when the monitoring metric failed to improve for 50 consecutive rounds, and the best-performing boosting iteration was retained.
Each retained template–copy pair was treated as one training observation and was assigned the questionnaire-derived score of the participant who produced it. The pair-level MSE objective and LightGBM fitting procedure did not apply participant-balanced sampling, participant-level loss weights, or normalization by the number of pairs contributed by each participant. Consequently, participants contributing more retained pairs contributed more training observations and therefore had greater aggregate representation in pair-level model fitting. Participant-level aggregation was applied only when converting pair-level predictions to participant-level predictions for evaluation; it did not rebalance the training data.
The candidate-comparison participant partition used random seed 2026. In five-fold cross-validation, internal development-participant selection and the corresponding neural-network and LightGBM fold runs used the fold-specific seed , where denotes the one-based fold index used in the implementation. The final DenseNet121 refit and the corresponding LightGBM models for same-university validation used the base seed 2026. Participant-level bootstrap procedures also used seed 2026. For neural-network runs, Python, NumPy (version 1.24.4), and PyTorch random generators were seeded, with cuDNN deterministic mode enabled and benchmarking disabled. The implementation used Python 3.8, PyTorch 1.7.0, torchvision 0.8.1, timm 0.9.16, LightGBM 4.1.0, SHAP 0.44.1, and scikit-learn 1.3.2; GPU computation used CUDA 11.0 on an NVIDIA GeForce RTX 3080 Ti. The complete pinned dependency list is provided in Supplementary File S1.
2.7.2. Candidate Pathway Selection and Held-Out Comparison
For candidate-pathway selection, the 191 participants in the main modeling cohort were partitioned by participant identity into training (), development-validation (), and held-out comparison () subsets. All template–copy observations contributed by the same participant remained within a single subset. The candidate partition was generated using random seed 2026.
The training subset was used for representation learning and model fitting. The development-validation subset was used exclusively for checkpoint selection and Light-GBM early stopping. The held-out subset was excluded from representation learning, model fitting, checkpoint selection, hyperparameter tuning, and other model-development decisions, and was used only for the final comparison of the prespecified handcrafted pathway and the seven candidate deep visual pathways.
A constant mean predictor was included as a descriptive baseline. Its prediction was calculated from the 153 unique training participants, with each participant contributing exactly one questionnaire-derived score:
where denotes the set of 153 training participants and is the single questionnaire-derived score for participant p. The resulting constant prediction was assigned to each of the 19 held-out participants. The mean was therefore calculated across participants, not across the repeated image-pair labels contributed by those participants. Because all held-out participants received the same predicted value, the baseline PCC was undefined.
DenseNet121 showed the most favorable numerical performance among the evaluated deep visual pathways and was therefore designated as the representative deep pathway for subsequent analyses under the present experimental configuration. The handcrafted pathway was retained separately because it was prespecified and provided explicitly interpretable morphological descriptors. The candidate comparison involved only 19 held-out participants and was treated as an exploratory pathway-selection step. Its point estimates do not establish statistically reliable ranking among the seven backbones or general architectural superiority. The candidate configurations also differed in initialization and training strategy, as described in Section 2.6.2; observed differences therefore reflect the complete configurations rather than architecture alone.
Because DenseNet121 was selected through candidate comparison within the main modeling cohort before participant-grouped five-fold cross-validation, the subsequent cross-validated performance estimates are post-selection estimates rather than fully selection-adjusted estimates of architecture performance. They may be optimistic relative to estimates obtained from a fully nested participant-level model-selection procedure [18,19].
2.7.3. Participant-Grouped Five-Fold Cross-Validation
The prespecified handcrafted pathway and the selected DenseNet121 pathway were evaluated using five-fold cross-validation with participant identity as the grouping variable. The outer folds were generated using GroupKFold, with participant identifiers as groups. This deterministic procedure does not require a random seed: all template–copy observations contributed by one participant were assigned to the same outer fold, and each participant appeared in the held-out portion of exactly one outer fold. Identical outer-fold participant assignments were used for both representation pathways.
Within each outer fold, 11% of the outer training-side participants were randomly selected for the internal development subset, with the number rounded up to the next whole participant. Selection was performed using a pseudorandom generator initialized with seed , where denotes the one-based fold index used in the implementation. The internal development subset was used exclusively for model-development procedures requiring validation data: Siamese checkpoint selection for the DenseNet121 pathway and LightGBM early stopping for both representation pathways. All observations contributed by a given participant remained within the same subset. Participants assigned to the outer held-out fold were not used for representation learning, checkpoint selection, model fitting, early stopping, or any other data-dependent model-development decision.
The candidate deep architectures were not re-compared or reselected within individual outer folds. DenseNet121 remained the selected deep pathway throughout the five-fold evaluation, while the handcrafted pathway was retained as the prespecified morphological representation. The five outer held-out folds collectively generated out-of-fold pair-level predictions for all participants in the main modeling cohort. These predictions were subsequently aggregated within participants before calculation of the primary performance estimates. Because architecture selection preceded this cross-validation, the DenseNet121 estimates remain post-selection estimates.
2.7.4. Participant-Level Prediction Aggregation
For participant i, the primary participant-level prediction was calculated as the arithmetic mean across the retained template–copy observations:
where denotes the pair-level prediction for observation j contributed by participant i. All primary performance metrics were calculated only after this within-participant aggregation.
2.7.5. Performance Metrics
Predictive performance was evaluated at the participant level using mean absolute error (MAE), Pearson correlation coefficient (PCC), and the out-of-sample coefficient of determination (). Let and denote the observed and predicted questionnaire-derived scores, respectively, for participant i, and let N denote the number of evaluated participants.
MAE was calculated as
PCC was calculated as
Out-of-sample was calculated as
Lower MAE indicates smaller prediction error, whereas higher positive PCC indicates stronger linear correspondence between observed and predicted participant-level scores. Out-of-sample evaluates predictive error relative to an observed-score mean reference and can take negative values when prediction performs worse than that reference.
For participant-grouped five-fold cross-validation, the primary metrics were calculated from pooled participant-level out-of-fold predictions. MAE was additionally expressed relative to the observed standard deviation of the questionnaire-derived criterion as a descriptive scale-relative interpretation of prediction error.
2.8. Statistical Analysis and Uncertainty Estimation
Uncertainty in participant-level MAE, PCC, and was estimated using 10,000 nonparametric bootstrap resamples of participants [24]. Participants were sampled with replacement, and observed and predicted participant-level scores were resampled jointly within each bootstrap replicate. Performance metrics were recalculated for each replicate, and percentile-based 95% confidence intervals were obtained from the resulting empirical distributions.
Paired participant-level bootstrap resampling was used to compare the handcrafted and DenseNet121 pathways because both pathways were evaluated on the same participants. Within each bootstrap replicate, the same resampled participant indices were applied to both pathways, and paired differences in MAE, PCC, and were calculated. Percentile-based 95% confidence intervals were obtained from the empirical paired-difference distributions. Two-sided resampling-based p-values were calculated from the proportions of paired bootstrap differences falling on either side of zero, with the smaller tail proportion doubled to obtain the two-sided value.
Predictive models were not retrained within bootstrap replicates. The reported confidence intervals and paired-comparison p-values therefore characterize uncertainty conditional on the generated out-of-fold predictions rather than uncertainty arising from the complete representation-learning, architecture-selection, and model-development process.
For the same-university validation cohort, uncertainty was estimated separately using 10,000 participant-level bootstrap resamples of the observed and predicted participant-level scores. Models were not retrained within validation-cohort bootstrap replicates.
For the held-out candidate comparison, 10,000 participant-level bootstrap resamples were also used to obtain percentile-based 95% uncertainty intervals for the candidate performance metrics. Given the small held-out sample (), these intervals were treated as descriptive uncertainty summaries; the candidate comparison was not used for inferential claims of general architectural superiority.
2.9. Cross-Validated SHAP Analysis
SHapley Additive exPlanations (SHAP) were used to characterize how the handcrafted LightGBM models depended on the predefined morphological deviation descriptors [13]. Interpretation was restricted to the handcrafted pathway because its input dimensions had explicit morphological meanings, whereas the dimensions of the learned deep representation did not.
SHAP analysis was embedded within the same participant-grouped five-fold cross-validation framework used for predictive evaluation. Within each fold, the LightGBM model was fitted using training participants only, and SHAP values were calculated exclusively for template–copy observations from the corresponding held-out participants.
To prevent participants contributing larger numbers of image pairs from disproportionately influencing feature-importance summaries, absolute pair-level SHAP values were first averaged within participant and subsequently summarized across held-out participants. Signed SHAP values used for visualization were aggregated using the same participant-level procedure.
Cross-fold stability was characterized by the recurrence of features among the top 10 ranked descriptors in each fold and by pairwise Spearman correlations between fold-specific feature rankings. SHAP values were interpreted as descriptions of fitted-model dependence on observable morphological descriptors rather than as evidence of causal effects, psychological mechanisms, or construct-specific behavioral markers.
2.10. Participant-Level Aggregation Rules and Sensitivity Assessment
The primary participant-level prediction was defined as the arithmetic mean of the pair-level predictions contributed by each participant. To examine whether the reported predictive pattern depended materially on this aggregation choice, two alternative within-participant aggregation rules were evaluated: the median and a 10% trimmed mean.
For each alternative rule, the existing pair-level out-of-fold predictions from the participant-grouped five-fold cross-validation were re-aggregated within participants, after which participant-level MAE, PCC, and were recalculated. No model retraining, representation relearning, architecture reselection, hyperparameter modification, or additional fitting was performed for these aggregation-sensitivity analyses.
2.11. Same-University Independent Validation Procedure
A completely non-overlapping cohort of 62 participants was reserved to evaluate whether the finalized analytical framework retained predictive performance in previously unseen participants from the same institutional context. The validation cohort was collected in a separate data-collection batch and followed the same questionnaire-administration format, copying-task protocol, image-acquisition procedure, preprocessing rules, quality-screening procedure, and template–copy verification procedure as the main modeling cohort.
Validation participants and their data were not used for handcrafted descriptor definition, candidate deep-architecture comparison, DenseNet121 selection, representation learning, model fitting, checkpoint selection, hyperparameter determination, aggregation-rule selection, training-length determination, or evaluation-rule development.
Before final refitting, training length was fixed exclusively from the main modeling cohort. For the DenseNet121 representation model, the number of epochs used for final training was set to the median of the fold-specific best epochs identified during participant-grouped five-fold cross-validation. For each LightGBM pathway, the final number of boosting iterations was likewise set to the median of the fold-specific best iterations identified through early stopping during the main-cohort cross-validation procedure. All training-length decisions were completed before the validation cohort was evaluated.
The DenseNet121 representation model was subsequently reinitialized and trained using the complete main modeling cohort for the predetermined number of epochs, without further early stopping. The handcrafted and DenseNet121 LightGBM regressors were then fitted using the corresponding representations from the complete main modeling cohort for their predetermined numbers of boosting iterations. The resulting finalized models were applied once to the validation cohort without additional architecture selection, checkpoint selection, early stopping using validation participants, hyperparameter modification, retraining on validation data, or post hoc recalibration.
Pair-level predictions were aggregated within participant using the same arithmetic-mean procedure defined in Section 2.7.4. Validation performance was evaluated using participant-level MAE, PCC, and out-of-sample , with uncertainty estimated using the participant-level bootstrap procedure described in Section 2.8.
Internal consistency of the questionnaire-derived composite criterion was estimated separately in the validation cohort and reported together with the validation results because criterion reliability contributes to uncertainty in observed-score prediction.
Because the validation cohort was recruited from the same university under a closely matched protocol, this analysis was interpreted as evidence of within-institution reproducibility rather than cross-institutional or broader population generalizability.
3. Results
3.1. Prediction-Criterion Characteristics
The main modeling cohort comprised 191 participants who contributed 48,826 valid copied-character images, as summarized in Table 1. The validation cohort comprised 62 participants who contributed 13,803 valid copied-character images. The participant-level distributions of retained copied-character images and the corresponding cohort-specific quality-control statistics are provided in Appendix A Table A3.
The participant-level questionnaire-derived grit score in the main modeling cohort had a mean of 3.10 and a standard deviation of 0.38. The 12-item composite score showed a Cronbach’s of 0.831, indicating the observed reliability of the prediction criterion in the main modeling cohort (Table 3).
Table 3.
Descriptive characteristics and internal consistency of the participant-level questionnaire criterion in the main modeling cohort. SD, standard deviation.
These characteristics are reported to describe the observed participant-level criterion and the composition of the image dataset used in the subsequent predictive analyses rather than to establish a separate psychometric model of the underlying construct.
3.2. Held-Out Candidate Comparison
Candidate representation pathways were compared using the participant-level held-out comparison subset () from the main modeling cohort. Table 4 summarizes MAE and PCC for the participant-level constant mean baseline, the prespecified handcrafted morphological pathway, and the seven candidate deep visual pathways.
Table 4.
Participant-level performance and percentile-bootstrap 95% confidence intervals in the held-out candidate-comparison subset (). MAE, mean absolute error; PCC, Pearson correlation coefficient; CI, confidence interval.
The mean baseline yielded an MAE of 0.303. Its prediction was calculated as the arithmetic mean of the questionnaire-derived scores of the 153 unique training participants, with each participant contributing exactly one score irrespective of the number of copied-character images contributed. The resulting constant prediction was assigned to all 19 held-out participants. Because all predicted values were identical, the baseline PCC was undefined. The handcrafted pathway achieved an MAE of 0.264 and a PCC of 0.482.
Among the candidate deep visual pathways, DenseNet121 showed the most favorable numerical performance, with the lowest MAE (0.221) and the highest PCC (0.612). DINOv2 ViT-S/14 and ResNet101 also yielded positive point-estimate correlations, with MAE/PCC values of 0.234/0.565 and 0.244/0.546, respectively. The remaining candidate configurations showed less favorable combinations of prediction error and correlation in this held-out subset.
DenseNet121 was therefore designated as the representative deep visual pathway for subsequent participant-grouped analyses. This designation was pragmatic and exploratory: the comparison involved only 19 held-out participants, and the candidate models differed in initialization and training strategy. Participant-level bootstrap uncertainty intervals were generated for the candidate metrics, but the comparison was not used for inferential testing or to establish a statistically reliable ranking among the seven configurations. The ranking should not be interpreted as an inferential demonstration that DenseNet121 is generally superior to the other architectures. The handcrafted pathway was retained separately because it was prespecified and provided explicitly interpretable morphological descriptors. The candidate comparison was a model-selection step within the main modeling cohort, not an independent estimate of final predictive generalization; the subsequent five-fold results are therefore interpreted as post-selection estimates.
3.3. Participant-Grouped Five-Fold Cross-Validation Performance
The primary participant-grouped five-fold cross-validation results are summarized in Table 5. Both representation pathways produced positive out-of-fold correspondence with the observed participant-level criterion, while DenseNet121 showed consistently more favorable overall predictive performance, with lower prediction error and higher PCC and out-of-sample than the handcrafted pathway.
Table 5.
Participant-grouped five-fold cross-validation performance and participant-level uncertainty for the two representation pathways. MAE, mean absolute error; PCC, Pearson correlation coefficient; , coefficient of determination; SD, standard deviation; CI, confidence interval.
The 95% confidence intervals for the paired participant-level bootstrap differences excluded zero for MAE, PCC, and out-of-sample (Table 5). Under the present modeling and evaluation procedure, the learned deep visual deviation representation therefore provided more favorable participant-level predictive performance than the predefined handcrafted morphological representation.
Prediction nevertheless remained incomplete. Relative to the observed main-cohort criterion standard deviation (), pooled out-of-fold MAE corresponded to approximately 73% of one standard deviation for the handcrafted pathway and 61% for DenseNet121. The positive but modest out-of-sample indicated improved predictive performance relative to the observed-score mean reference, while substantial participant-level prediction error remained. The results therefore indicate positive but incomplete predictive correspondence rather than near-deterministic correspondence.
Because DenseNet121 had been selected through the preceding held-out candidate comparison within the main modeling cohort, these cross-validated estimates remain post-selection performance estimates. They may be optimistic relative to estimates from a fully nested participant-level model-selection procedure and should not be interpreted as independent, selection-adjusted evidence of architectural superiority.
3.4. Cross-Validated SHAP Attribution and Feature Stability
Cross-validated SHAP analysis was used to examine the morphological descriptors on which the handcrafted LightGBM pathway relied when generating predictions for held-out participants. Figure 3 summarizes participant-weighted feature importance and signed attribution patterns, while Appendix A Table A2 reports the corresponding cross-fold ranking stability.
Figure 3.
Cross-validated SHAP attribution and feature stability for the handcrafted morphological pathway. Panel (A) shows mean absolute SHAP values after absolute pair-level attributions were averaged within each participant and then summarized across participants; orange markers indicate fold-specific mean absolute SHAP values. For each feature, indicates the number of folds in which it appeared among the top 10 ranked descriptors, and the accompanying value gives its mean fold rank ± standard deviation (SD). Panel (B) shows signed SHAP distributions for the selected leading features, with color indicating relative feature value from low to high. The median pairwise Spearman correlation across fold-specific rankings was 0.68 (interquartile range, IQR: 0.60–0.75). IQR, interquartile range; SD, standard deviation; SHAP, SHapley Additive exPlanations.
The features that ranked most consistently across folds primarily represented spatial ink distribution, overall character proportion, local texture contrast, and spatial organization. In particular, the stable high-ranking descriptors included quadrant and central-grid ink-distribution deviations (, , and ), texture-contrast deviation (), and overall character-proportion deviation (). Their definitions are provided in Appendix A Table A1.
The signed SHAP distributions showed that attribution patterns varied across descriptors and feature-value ranges rather than following a single uniform directional pattern. The handcrafted model therefore relied on a combination of morphological deviation dimensions rather than on one dominant visual characteristic.
These attribution results characterize the dependence of the fitted prediction models on observable image descriptors. They are not interpreted as causal effects of individual morphological deviations or as evidence that particular handwriting characteristics constitute construct-specific indicators of grit.
3.5. Participant-Level Aggregation Sensitivity
Sensitivity of participant-level predictive performance to alternative within-participant aggregation rules is summarized in Table 6. Replacing the primary arithmetic mean with either median or 10% trimmed-mean aggregation produced only limited changes in performance for both representation pathways. The relative performance ordering of the handcrafted and DenseNet121 pathways was retained across all three aggregation procedures.
Table 6.
Sensitivity of participant-level predictive performance to alternative within-participant aggregation rules. MAE, mean absolute error; PCC, Pearson correlation coefficient; , coefficient of determination.
These results indicate that the primary participant-level predictive pattern was not materially dependent on the use of a single within-participant aggregation rule. The prespecified arithmetic mean was therefore retained for the primary analyses.
3.6. Same-University Independent Validation
Participant-level performance in the completely non-overlapping same-university validation cohort is summarized in Table 7. DenseNet121 showed positive validation evidence on both PCC and out-of-sample : its PCC was 0.507 (95% CI: 0.288–0.666), and its was 0.205 (95% CI: 0.041–0.334). The handcrafted pathway also showed a positive PCC (0.398; 95% CI: 0.159–0.584), but its confidence interval included zero (point estimate 0.112; 95% CI: to 0.249). Accordingly, the validation results support positive linear correspondence for both pathways, whereas evidence that the handcrafted pathway reduced squared prediction error relative to the observed-score mean reference is less conclusive. The two pathways should not be described as having equivalent validation evidence across all metrics.
Table 7.
Participant-level predictive performance in the same-university independent validation cohort (). MAE, mean absolute error; PCC, Pearson correlation coefficient; , coefficient of determination; CI, confidence interval.
For DenseNet121, validation MAE was 0.249, compared with 0.233 in the main-cohort pooled cross-validation. The handcrafted pathway had a validation MAE of 0.286, compared with 0.279 in cross-validation. These comparisons are descriptive because the main-cohort cross-validation estimates are post-selection and the validation cohort differs in criterion reliability. The validation cohort’s 12-item questionnaire criterion showed lower internal consistency () than the main modeling cohort (). Lower criterion reliability may increase measurement uncertainty and attenuate observed prediction–criterion associations; however, the observed difference in reliability does not establish the cause of any difference in predictive performance. No correction for attenuation was applied.
Because the validation cohort was collected from the same university under a closely matched protocol, these results support reproducibility among non-overlapping participants within the examined institutional setting rather than cross-institutional or population-level generalizability.
4. Discussion
4.1. Principal Findings and Technical Interpretation
This study examined whether deviations between standardized Chinese character templates and their corresponding copied images could be transformed into computational representations for participant-level prediction of an observed questionnaire-derived criterion. The results provide proof-of-concept evidence that the participant-aligned framework can yield participant-level predictive information under the examined protocol; here, proof of concept refers to the viability of the analytical design rather than to complete prediction or deployment-ready accuracy. In the main-cohort participant-grouped cross-validation, both the predefined handcrafted morphological pathway and the selected DenseNet121 pathway showed positive predictive correspondence, with DenseNet121 achieving more favorable performance across the primary metrics. In the non-overlapping same-university validation cohort, both pathways showed positive PCC confidence intervals, but the evidence differed for out-of-sample : the DenseNet121 interval remained above zero, whereas the handcrafted pathway’s interval included zero. The two pathways therefore should not be described as having equivalent validation evidence across all metrics.
The principal methodological contribution lies in treating each copied character together with its exact visual template rather than modeling the copied image in isolation. This paired formulation provides an explicit reference against which observable differences in geometry, spatial organization, foreground-ink distribution, texture, and learned visual representation can be expressed. The resulting variables should therefore be understood as representations of standardized task-performance deviations rather than as generic handwriting characteristics. At the same time, template referencing does not make those deviations psychologically specific: they may reflect multiple participant- and task-related sources of variation, including visuomotor execution, copying proficiency, attention, engagement, prior writing experience, and other unmeasured factors.
Consistent with this distinction, the predictive results were moderate and incomplete. In particular, the out-of-sample performance observed for the deep pathway indicates that standardized copying deviations contain information associated with the observed questionnaire criterion, while the remaining prediction error and unexplained variance show that the visual representations account for only part of the between-participant variation in questionnaire scores. The present evidence therefore supports a methodological proof of concept under a standardized template–copy protocol rather than a claim of complete or deployment-ready individual prediction. The current performance does not support replacing validated questionnaires, estimating an individual’s grit with sufficient certainty for consequential decisions, or using the model for diagnosis, screening, or personnel selection. Successful prediction of an observed questionnaire score also does not establish that the image representation measures the underlying psychological construct or identifies a construct-specific behavioral signature.
Accordingly, the present framework is better interpreted as an AI-based representation and prediction pipeline for structured behavioral image data than as a handwriting-based personality inference system. Its contribution is methodological: standardized template–copy pairs can be converted into reproducible computational representations, evaluated under participant-level separation, and linked to an observed participant-level criterion while retaining explicit limits on what the resulting predictions imply.
4.2. Complementary Roles of Deep and Handcrafted Representations
The two representation pathways addressed different aspects of the template–copy modeling problem. The DenseNet121 pathway provided greater predictive flexibility by learning visual deviation representations directly from paired images, whereas the handcrafted pathway encoded a predefined set of morphologically interpretable differences. The stronger predictive performance of DenseNet121 is compatible with the learned representation capturing predictive structure not fully expressed by the 48 predefined descriptors. However, because the candidate pathways differed in architecture, initialization, and training strategy, the present comparison cannot determine which pathway-specific factor produced the performance difference. This result does not imply that DenseNet121 is universally superior to the other candidate architectures or that its learned representation has a more direct relationship with the questionnaire construct.
The handcrafted pathway remains important because its inputs have explicit visual semantics. Cross-validated SHAP analysis showed that the fitted models relied on multiple deviation dimensions, with stable high-ranking features involving spatial ink distribution, overall character proportion, texture contrast, and spatial organization. The recurrence of these feature classes across participant folds indicates that model dependence was distributed across several observable morphological properties rather than concentrated on a single descriptor. This provides a level of feature-level traceability that is not directly available from the learned deep representation.
Such traceability should nevertheless be distinguished from psychological explanation. SHAP was applied only to the handcrafted pathway because its 48 input dimensions have predefined morphological meanings; the learned dimensions of the deep pathway do not have the same direct feature-level interpretation. The SHAP values characterize how the fitted handcrafted LightGBM models depend on the observed morphological descriptors when generating predictions. They do not establish causal effects, latent psychological mechanisms, or features uniquely specific to grit [13,25]. More generally, predictive explanation and explanation of the underlying phenomenon are distinct analytical goals [26,27]. Consequently, the high-ranking handcrafted deviations should be interpreted as model-relevant visual descriptors under the present task and dataset, not as morphological manifestations or validated indicators of grit.
Within the single analytical framework, the value of the two-pathway design is methodological complementarity rather than representation fusion or convergent measurement of the same psychological attribute. The deep pathway emphasizes predictive capacity, whereas the handcrafted pathway provides an inspectable representation space for examining model reliance on predefined visual characteristics. Evaluating these alternative representation pathways separately makes it possible to compare predictive flexibility with morphological traceability without presenting them as different application systems, implying statistical independence between the representations, or combining them into a single measurement model.
4.3. Hierarchical Evaluation and Model-Selection Considerations
The hierarchical structure of the data is central to the interpretation of predictive performance. Each participant contributed many template–copy observations but only one participant-level questionnaire criterion. Consequently, copied-character images from the same participant cannot be treated as statistically independent criterion observations. Random image-level partitioning would allow observations from the same participant to appear in both training and evaluation data, creating a substantial risk of information leakage and overly optimistic performance estimates [17]. The present evaluation therefore maintained participant-level separation throughout model comparison and cross-validation.
The same hierarchy also determines the appropriate level of prediction evaluation. Pair-level predictions were aggregated within participants before comparison with the participant-level criterion, thereby aligning the prediction unit with the outcome unit. Alternative median and trimmed-mean aggregation procedures produced similar overall performance patterns, indicating that the principal participant-level findings were not materially dependent on the use of arithmetic-mean aggregation. Nevertheless, the large number of image pairs should not be interpreted as the number of independent criterion observations: the effective sample size for participant-level generalization remains determined primarily by the number of participants.
Model selection introduces a separate qualification. DenseNet121 was selected after comparison with the other candidate deep backbones in a held-out subset of the main modeling cohort and was subsequently evaluated using participant-grouped five-fold cross-validation across the full main cohort. Because architecture selection was not repeated within an outer nested cross-validation procedure, the resulting DenseNet121 cross-validation estimates are post-selection estimates and may be optimistic relative to estimates from a fully nested participant-level selection procedure [18,19]. They describe the performance of the already selected analytical pathway under participant-grouped resampling; they are not independent evidence that DenseNet121 is intrinsically or generally superior to the other candidate architectures. The same-university validation cohort provides a separate assessment of the selected pathway in previously unseen participants, but it does not remove the post-selection character of the main-cohort cross-validation estimates or constitute an independent comparison of all seven backbones.
The non-overlapping validation cohort provides a stronger test of whether the selected pathway retained predictive correspondence in previously unseen participants, because those participants were not involved in architecture selection or model-development decisions. Even so, this validation evaluates the already selected DenseNet121 pathway rather than repeating selection across all candidate architectures. Future studies designed specifically to compare architectures should therefore use nested participant-level model selection or a larger independent development–validation design, while continuing to treat participants rather than images as the primary independent units of generalization.
4.4. Reproducibility, Applicability, and Scope of Generalization
The non-overlapping validation cohort provides an important complement to the resampling-based evidence from the main modeling cohort. The previously specified representation pathways and analytical settings were applied to participants who were not involved in model development. DenseNet121 retained positive validation correspondence on both PCC and out-of-sample , whereas the handcrafted pathway showed positive PCC but less conclusive evidence on out-of-sample because its confidence interval included zero. The validation evidence therefore differed across pathways and metrics rather than indicating uniformly positive performance for both pathways. This assessment reduces the likelihood that the DenseNet121 findings arose solely from a particular participant partition within the main cohort and provides evidence of positive participant-level predictive correspondence in a separate data-collection batch under closely matched conditions.
The strength of this evidence should nevertheless be interpreted according to the validation design. Because the validation cohort was drawn from the same university and followed the same task, acquisition, preprocessing, and template–copy verification procedures, the analysis evaluates reproducibility among previously unseen participants under closely matched within-institution conditions; it is not cross-institutional external validation. The questionnaire criterion also showed lower internal consistency in the validation cohort () than in the main cohort (). Lower reliability may increase measurement error and attenuate the observed association between predictions and questionnaire scores. The bilingual administration used Chinese wording as language support for the original English items, not as an independently validated Chinese adaptation. Although the same questionnaire format and scoring procedure were used in both cohorts, the available data do not establish why reliability differed, and the difference should not be attributed to language or administration format without further evidence. Accordingly, differences in validation performance cannot be attributed exclusively to changes in model generalization.
From an applied AI perspective, the present framework is most directly relevant to settings in which the acquisition process can preserve the same core structure: a known reference template, a corresponding copied image, standardized preprocessing, and participant-level aggregation of repeated observations. These design constraints are not merely implementation details; they define the conditions under which the template-referenced representations evaluated here were constructed. Generalization to unconstrained handwriting, different writing instruments, alternative character sets, other imaging pipelines, or different behavioral tasks should therefore be treated as a separate empirical question rather than assumed from the present results.
The immediate value of the framework is methodological rather than diagnostic: it provides a reproducible way to quantify template-referenced copying deviations, compare interpretable and learned visual representations, and evaluate participant-level predictive associations without image-level leakage. It can therefore support controlled behavioral-image research, hypothesis generation, and the development and evaluation of participant-aligned predictive methods. Translation to diagnosis, screening, personnel selection, or other high-stakes individual decisions would require independent multi-institutional validation, assessment of acquisition and domain shifts, evidence of test–retest stability, and substantially stronger evidence regarding the interpretation and reliability of individual-level predictions.
4.5. Limitations and Future Directions
The following limitations delimit the scope of interpretation and generalization of the proof-of-concept findings. They primarily concern external validity, criterion measurement, model-development choices, participant contribution imbalance, and the information available from static copying images. First, both cohorts were recruited from elective hard-pen calligraphy courses at a single university. This sampling frame may involve self-selection related to prior writing experience, interest in calligraphy, task engagement, or other participant characteristics that were not independently controlled in the present analysis. Although the validation cohort was completely non-overlapping and collected in a separate batch, it remained within the same institutional setting and closely matched protocol. Future studies should therefore evaluate the framework across institutions, participant populations, levels of writing experience, and independently implemented acquisition settings.
Second, the prediction criterion was an observed questionnaire-derived grit score obtained under the present bilingual administration procedure. The Chinese wording was provided as language support for the original English items and was not treated as an independently validated Chinese-language adaptation. In addition, criterion reliability was lower in the validation cohort than in the main modeling cohort. The reported predictive associations should therefore be interpreted as correspondence with the observed questionnaire score under measurement uncertainty rather than as prediction of an error-free latent construct. Future work should incorporate independently validated language-specific instruments and, where possible, multimethod or longitudinal criteria to evaluate whether predictive correspondence extends beyond a single self-report measure [21,22].
Third, DenseNet121 was designated through an exploratory comparison of seven candidate configurations in a single held-out subset of 19 participants before the participant-grouped five-fold cross-validation analysis. The candidate comparison was small and involved models with different initialization and training strategies. In addition, DINOv2 and CLIP were evaluated using the shared replicated-grayscale inputs scaled to without encoder-specific channel-wise normalization. Their results therefore reflect the common-input configuration adopted in this study rather than performance under their respective canonical pretrained preprocessing pipelines. Together, these differences limit interpretation of the held-out comparison to the evaluated configurations rather than a controlled benchmark of intrinsic backbone superiority. Because architecture selection was not embedded within a nested outer evaluation procedure, the main-cohort DenseNet121 cross-validation estimates remain post-selection estimates and may be optimistic relative to estimates from fully nested participant-level model selection. The non-overlapping same-university validation cohort assesses the selected pathway in new participants but does not independently compare all candidate architectures. Future confirmatory studies should use nested participant-level architecture selection or sufficiently large, fully separated development, model-selection, and external-validation cohorts.
Fourth, participants contributed different numbers of retained copied-character images, each linked to its corresponding presented template and used as one template–copy observation in pair-level model fitting. The cohort-specific quality-control results and participant-level distributions of retained copied-character images are reported in Appendix A Table A3. The training objective treated each verified template–copy pair as one observation and did not use participant-balanced sampling, participant-level loss weights, or normalization by participant-specific image counts. Participants contributing more retained copied-character images therefore contributed more observations and had greater aggregate representation during pair-level model fitting. The same unequal contribution structure applied to development-based checkpoint selection and early stopping because their monitoring losses were calculated over pair-level observations without participant-specific normalization. Participant-level partitioning prevented the same participant from appearing across development and evaluation subsets, while aggregation of pair-level predictions within each participant aligned the evaluation unit with the questionnaire criterion; neither procedure removed the unequal contribution of participants during training or development-based monitoring. For SHAP interpretation, pair-level SHAP values were first averaged within each participant and the resulting participant-level values were then summarized across participants. This equal-participant aggregation reduced the direct influence of participants contributing more retained pairs on the feature-importance summaries. However, unequal pair counts may still have indirectly influenced SHAP attributions through the fitted LightGBM models because each template–copy pair contributed equally during model training. The resulting SHAP rankings should therefore be interpreted with this training imbalance in mind. The present study describes this imbalance but does not evaluate participant-balanced sampling or weighting. Future work should examine participant-balanced sampling, weighting, or hierarchical learning as separate modeling strategies.
Fifth, the current representations were derived from static images of final copying outcomes. These images preserve information about character geometry, spatial organization, foreground-ink distribution, contour, and texture, but they do not directly capture stroke order, writing speed, pauses, pressure, pen trajectories, or online correction processes. Moreover, the observed copying deviations may reflect multiple nonspecific sources of variation, including visuomotor execution, handwriting proficiency, attention, task engagement, prior writing experience, and other unmeasured participant or situational factors. Consequently, the present predictive correspondence should not be interpreted as evidence that the represented image deviations are specific to grit. Future studies could combine template-referenced image representations with digital-pen trajectories, temporal signals, and independently measured task-process variables to determine which components of copying behavior contribute to predictive performance.
Finally, the study used a cross-sectional predictive design and did not evaluate test–retest stability of either the copying-deviation representations or the resulting participant-level predictions. The current findings therefore demonstrate statistical predictive correspondence under the examined task conditions but do not establish temporal stability, causal direction, or psychological mechanism. Repeated-session and longitudinal designs, together with larger participant samples and explicit evaluation of acquisition and domain shifts, will be necessary to determine which aspects of the learned representations are stable across time and context and whether the present framework generalizes beyond the controlled conditions examined here. Taken together, these limitations identify the validation steps required for broader application; they do not alter the central methodological finding that repeated template-referenced observations can be modeled with participant-level separation and aggregation, with moderate predictive correspondence observed under the present standardized protocol.
5. Conclusions
This study addressed the methodological need to align repeated standardized Chinese character template–copy observations with a participant-level outcome while preserving participant independence during model development and evaluation. Within a single AI-based analytical framework, two alternative representation pathways were evaluated separately: a predefined 48-dimensional handcrafted morphological representation and a shared-weight Siamese deep visual representation. Model development and evaluation partitions were defined by participant identity, and pair-level predictions were aggregated within participants before comparison with the participant-level criterion. Following an exploratory held-out comparison of seven candidate deep configurations, DenseNet121 was selected as the representative deep pathway. In participant-grouped five-fold cross-validation, DenseNet121 achieved an MAE of 0.233, PCC of 0.579, and out-of-sample of 0.284, compared with 0.279, 0.451, and 0.176, respectively, for the handcrafted pathway. In the non-overlapping same-university validation cohort, DenseNet121 achieved an MAE of 0.249, PCC of 0.507, and out-of-sample of 0.205.
The findings illustrate the methodological value of exact template–copy pairing for constructing visual deviation representations and evaluating them at the participant level. The deep pathway provided more favorable predictive performance under the evaluated configuration, whereas the handcrafted pathway retained explicit morphological semantics and supported participant-weighted SHAP analysis of model dependence on spatial ink distribution, character proportion, and texture. The main-cohort cross-validation estimates for DenseNet121 remain post-selection estimates, and the held-out candidate comparison does not establish general architectural superiority. In validation, the handcrafted pathway’s PCC interval was positive but its interval included zero; the validation evidence therefore differs across pathways and metrics.
The findings show that the participant-aligned framework can produce reproducible predictive correspondence under the examined standardized task and same-university sampling conditions, while the observed prediction remains moderate and incomplete. They do not establish construct-specific psychological measurement, causal interpretation, or readiness for high-stakes individual assessment. The validation cohort does not establish cross-institutional generalizability, and its lower questionnaire reliability adds measurement uncertainty to the observed associations. Participant-level copied-character image-retention distributions are reported in Appendix A Table A3; however, participants contributed unequal numbers of training observations, and no participant-balanced sampling, participant-level loss weighting, or normalization by participant-specific pair counts was used during pair-level model fitting. Future work should include nested participant-level model selection, participant-balanced sampling or weighting, independent multi-institutional validation, independently validated criterion measures, repeated-session designs, and multimodal writing data.
Supplementary Materials
The following supporting information can be downloaded at: https://www.mdpi.com/article/10.3390/app162211416/s1, Supplementary File S1: Analysis code for image preprocessing, handcrafted feature extraction, Siamese representation learning, candidate-backbone comparison, participant-grouped cross-validation, LightGBM modeling, and same-university validation. The code archive includes a README and a pinned Python dependency specification. Participant images, questionnaire responses, participant-level criterion linkage, validation-cohort records, and the internal quality-control ledger are not included in the code archive.
Author Contributions
Conceptualization, G.F.; methodology, G.F.; software, G.F.; validation, G.F.; formal analysis, G.F.; investigation, G.F.; resources, R.L. and Z.X.; data curation, G.F.; writing—original draft preparation, G.F.; writing—review and editing, R.L. and Z.X.; supervision, R.L. and Z.X.; project administration, G.F. All authors have read and agreed to the published version of the manuscript.
Funding
This research received no external funding.
Institutional Review Board Statement
The study was conducted in accordance with the Declaration of Helsinki and was reviewed and approved by the Medical Ethics Committee of Jiangnan University (protocol code JNU202409RB0029; approval date: 27 September 2024). Both the main modeling cohort and the same-university independent validation cohort were covered by this ethical approval.
Informed Consent Statement
Written informed consent was obtained from all participants in accordance with the approved study protocol. All research data used for analysis were de-identified to protect participant privacy.
Data Availability Statement
The template-character images, copied-character images, and template–copy correspondence information for the main modeling cohort are publicly available through the Zenodo repository at https://doi.org/10.5281/zenodo.14166945. The analysis code for image preprocessing, handcrafted feature extraction, Siamese representation learning, candidate-backbone comparison, participant-grouped cross-validation, LightGBM modeling, and same-university validation is provided as Supplementary File S1. Participant-level questionnaire-derived grit scores and linkage information for the main modeling cohort, as well as all data from the validation cohort, are not publicly available because public sharing was not covered by the applicable participant-consent and ethical conditions and could compromise participant privacy.
Acknowledgments
The authors thank all participants who took part in the standardized copying task and questionnaire survey. During manuscript preparation, ChatGPT (OpenAI; https://chatgpt.com/; accessed on 13 November 2026) was used for language refinement and editorial assistance. The authors reviewed and verified the resulting text and take full responsibility for the content of the manuscript.
Conflicts of Interest
The authors declare no conflicts of interest.
Appendix A
Figure A1.
Complete set of the 55 designated Chinese characters organized by prespecified structural category and stroke-count-based complexity level. The Chinese glyphs are the original task stimuli, retained to preserve the visual forms evaluated in the study.
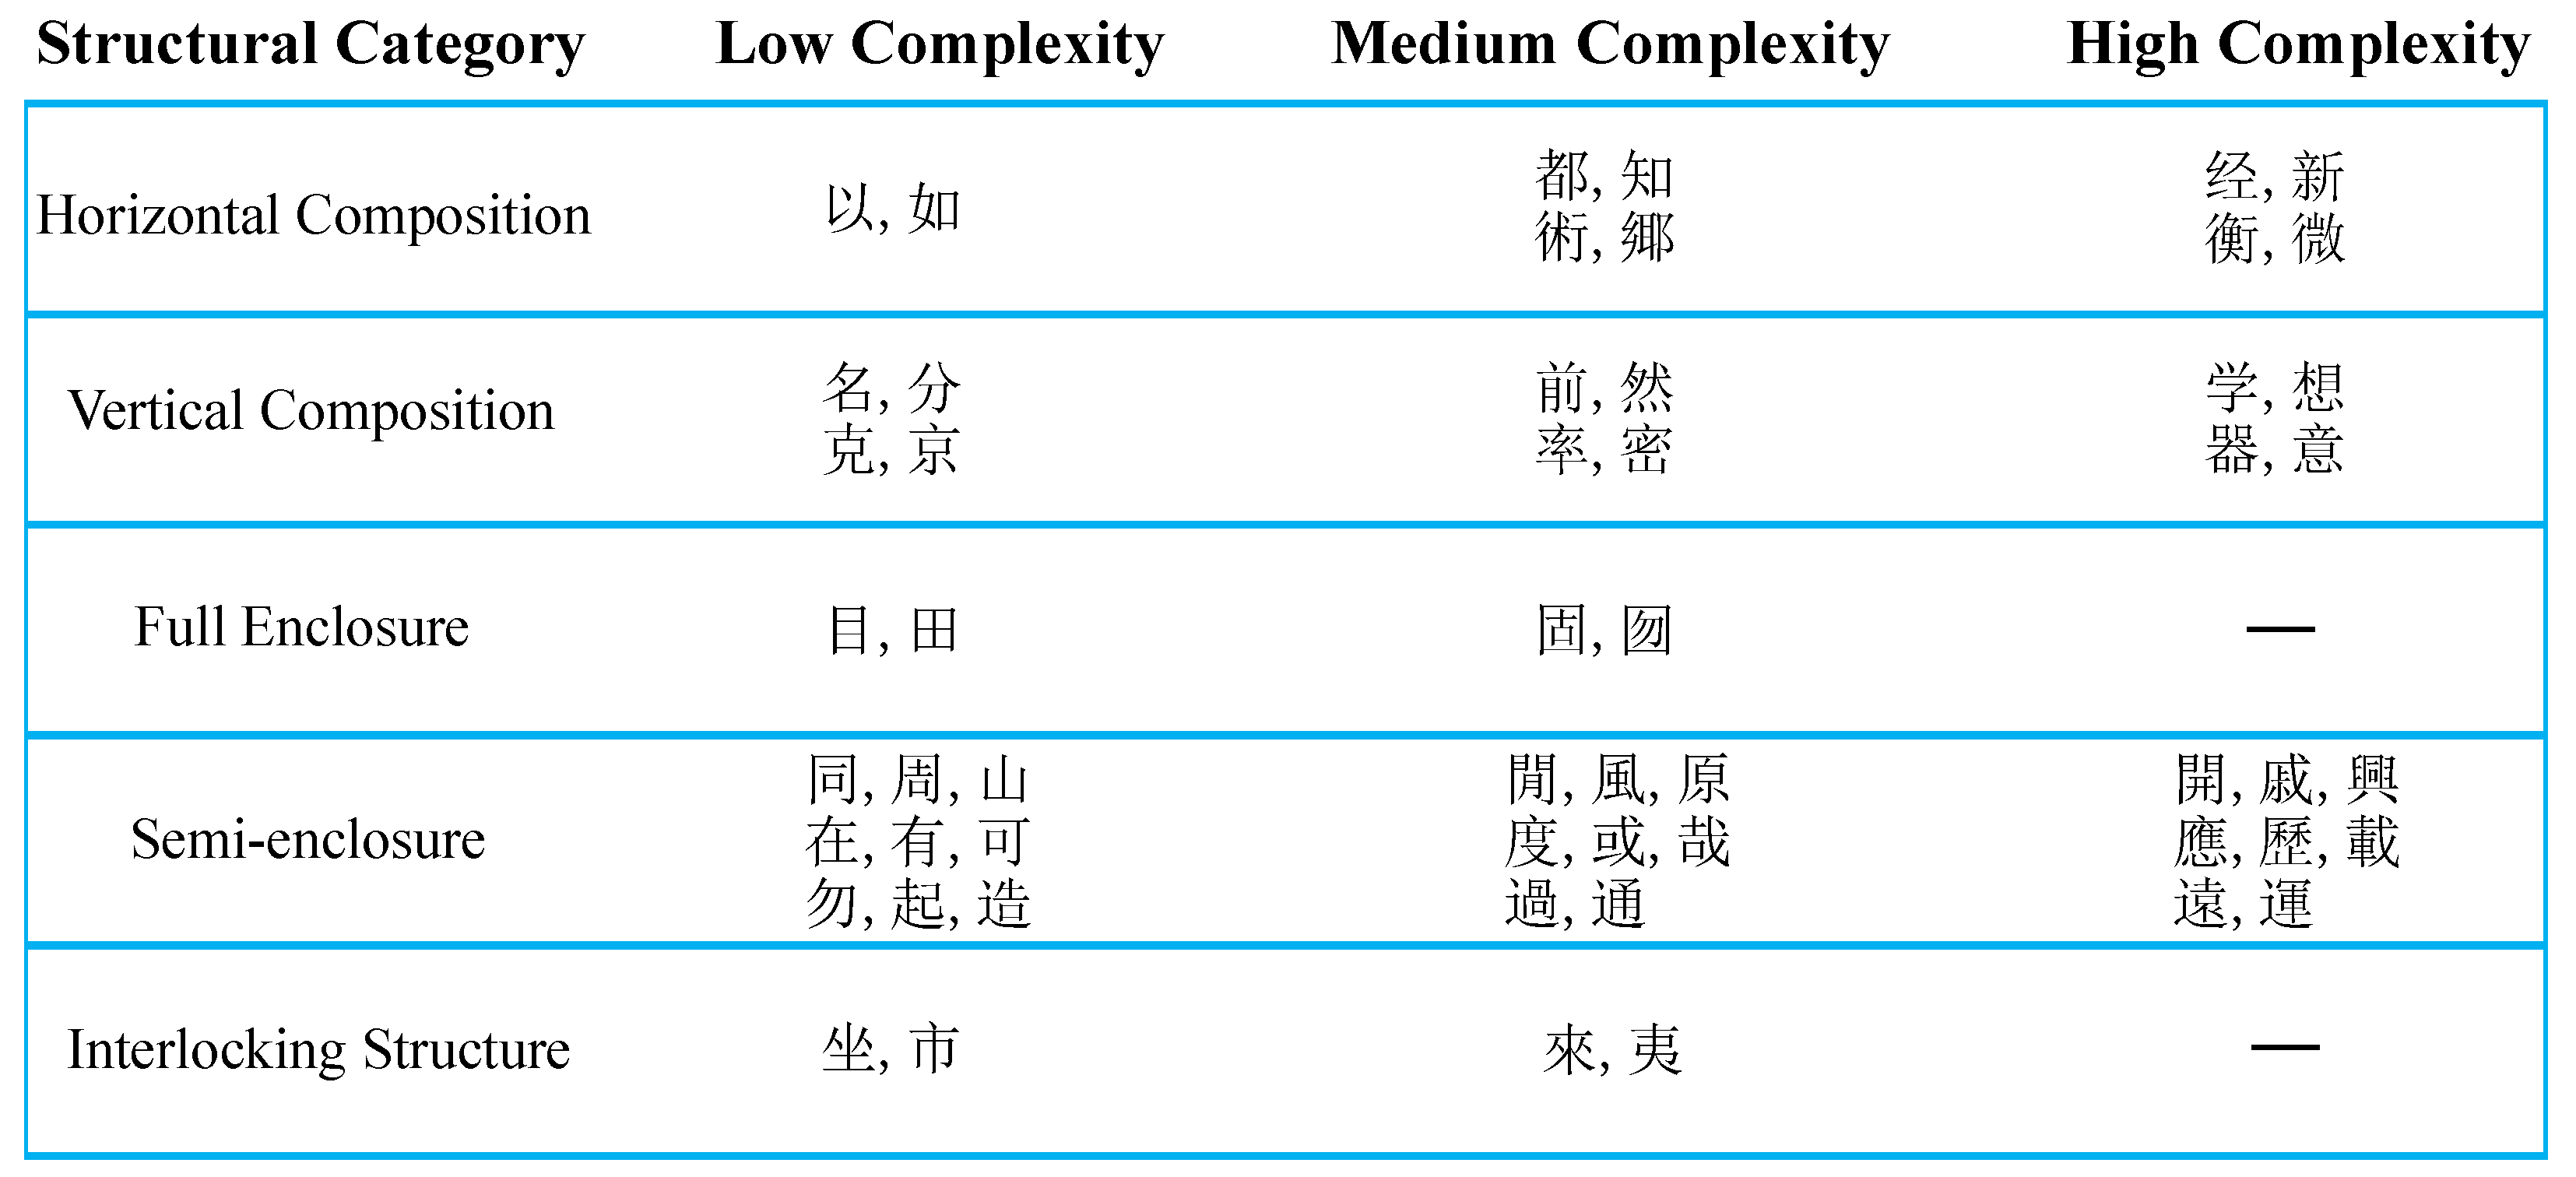
Morphological Descriptor Definitions
The 48 basic morphological descriptors used in the handcrafted pathway and their corresponding template–copy deviation features are defined in Table A1. The descriptor set was adapted from an interpretable handcrafted-feature framework previously used in computational research on Chinese character copying [16]. Here, denotes the kth morphological descriptor calculated from a single preprocessed character image, whereas denotes the corresponding template–copy deviation, defined as the descriptor value of the copied character minus that of its paired template. The descriptors quantify geometric, contour, spatial-distribution, structural, and texture-related image properties and are not assigned construct-specific psychological meanings. For descriptors –, the gray-level co-occurrence matrix (GLCM) was computed from the full preprocessed -pixel 8-bit grayscale canvas using a one-pixel distance, a zero-degree angle, 256 gray levels, a symmetric matrix, and normalized co-occurrence counts.
Table A1.
Definitions of the 48 basic morphological descriptors and their corresponding copying-deviation features. GLCM, gray-level co-occurrence matrix; ASM, angular second moment.
Table A2.
Cross-fold ranking stability of the leading handcrafted copying-deviation features in the cross-validated SHAP analysis. SHAP, SHapley Additive exPlanations; SD, standard deviation; IQR, interquartile range.
Table A3.
Image quality control and copied-character image retention by cohort. IQR, interquartile range.
References
- Tse, L.F.L.; Siu, A.M.H.; Li-Tsang, C.W.P. Development of Chinese handwriting skills among kindergarten children: Copying of the composition in Chinese characters and name writing. J. Occup. Ther. Sch. Early Interv. 2017, 10, 40–51. [Google Scholar] [CrossRef] [Scilit]
- Van Galen, G.P. Handwriting: Issues for a psychomotor theory. Hum. Mov. Sci. 1991, 10, 165–191. [Google Scholar] [CrossRef] [Scilit]
- Yang, Y.; Zhang, J.; Meng, Z.-L.; Qin, L.; Liu, Y.-F.; Bi, H.-Y. Neural correlates of orthographic access in Mandarin Chinese writing: An fMRI study of the word-frequency effect. Front. Behav. Neurosci. 2018, 12, 288. [Google Scholar] [CrossRef] [Scilit] [PubMed]
- He, K.; Zhang, X.; Ren, S.; Sun, J. Deep residual learning for image recognition. In Proceedings of the 2016 IEEE Conference on Computer Vision and Pattern Recognition (CVPR), Las Vegas, NV, USA, 27–30 June 2016; pp. 770–778. [Google Scholar] [CrossRef] [Scilit]
- Huang, G.; Liu, Z.; Van Der Maaten, L.; Weinberger, K.Q. Densely connected convolutional networks. In Proceedings of the 2017 IEEE Conference on Computer Vision and Pattern Recognition (CVPR), Honolulu, HI, USA, 21–26 July 2017; pp. 2261–2269. [Google Scholar] [CrossRef] [Scilit]
- Tan, M.; Le, Q.V. EfficientNet: Rethinking model scaling for convolutional neural networks. In Proceedings of the 36th International Conference on Machine Learning, Long Beach, CA, USA, 9–15 June 2019; PMLR: Cambridge, MA, USA, 2019; Volume 97, pp. 6105–6114. [Google Scholar]
- Dosovitskiy, A.; Beyer, L.; Kolesnikov, A.; Weissenborn, D.; Zhai, X.; Unterthiner, T.; Dehghani, M.; Minderer, M.; Heigold, G.; Gelly, S.; et al. An image is worth 16 × 16 words: Transformers for image recognition at scale. In Proceedings of the International Conference on Learning Representations (ICLR), Virtual Event, 3–7 May 2021. [Google Scholar]
- Liu, Z.; Mao, H.; Wu, C.-Y.; Feichtenhofer, C.; Darrell, T.; Xie, S. A ConvNet for the 2020s. In Proceedings of the 2022 IEEE/CVF Conference on Computer Vision and Pattern Recognition (CVPR), New Orleans, LA, USA, 18–24 June 2022; pp. 11966–11976. [Google Scholar] [CrossRef] [Scilit]
- Oquab, M.; Darcet, T.; Moutakanni, T.; Vo, H.V.; Szafraniec, M.; Khalidov, V.; Fernandez, P.; Haziza, D.; Massa, F.; El-Nouby, A.; et al. DINOv2: Learning robust visual features without supervision. Trans. Mach. Learn. Res. 2024, 2024, 1–32. [Google Scholar]
- Radford, A.; Kim, J.W.; Hallacy, C.; Ramesh, A.; Goh, G.; Agarwal, S.; Sastry, G.; Askell, A.; Mishkin, P.; Clark, J.; et al. Learning transferable visual models from natural language supervision. In Proceedings of the 38th International Conference on Machine Learning, Virtual Event, 18–24 July 2021; PMLR: Cambridge, MA, USA, 2021; Volume 139, pp. 8748–8763. [Google Scholar]
- Bromley, J.; Bentz, J.W.; Bottou, L.; Guyon, I.; LeCun, Y.; Moore, C.; Säckinger, E.; Shah, R. Signature verification using a “Siamese” time delay neural network. Int. J. Pattern Recognit. Artif. Intell. 1993, 7, 669–688. [Google Scholar] [CrossRef] [Scilit]
- Ke, G.; Meng, Q.; Finley, T.; Wang, T.; Chen, W.; Ma, W.; Ye, Q.; Liu, T.-Y. LightGBM: A highly efficient gradient boosting decision tree. In Advances in Neural Information Processing Systems; Curran Associates, Inc.: Red Hook, NY, USA, 2017; Volume 30, pp. 3146–3154. [Google Scholar]
- Lundberg, S.M.; Lee, S.-I. A unified approach to interpreting model predictions. In Advances in Neural Information Processing Systems; Curran Associates, Inc.: Red Hook, NY, USA, 2017; Volume 30, pp. 4765–4774. [Google Scholar]
- Sun, M.; Gong, X.; Nie, H.; Iqbal, M.M.; Xie, B. SRAFE: Siamese regression aesthetic fusion evaluation for Chinese calligraphic copy. CAAI Trans. Intell. Technol. 2023, 8, 1077–1086. [Google Scholar] [CrossRef] [Scilit]
- Yan, F.; Lan, X.; Zhang, H.; Li, L. Intelligent evaluation of Chinese hard-pen calligraphy using a Siamese Transformer network. Appl. Sci. 2024, 14, 2051. [Google Scholar] [CrossRef] [Scilit]
- Sun, W.; Cheng, Y.; Lyu, R. Interpretable modeling of aesthetic evaluation in calligraphy imitation. In Proceedings of the 2025 International Joint Conference on Neural Networks (IJCNN), Rome, Italy, 30 June–5 July 2025; pp. 1–10. [Google Scholar] [CrossRef] [Scilit]
- Roberts, D.R.; Bahn, V.; Ciuti, S.; Boyce, M.S.; Elith, J.; Guillera-Arroita, G.; Hauenstein, S.; Lahoz-Monfort, J.J.; Schröder, B.; Thuiller, W.; et al. Cross-validation strategies for data with temporal, spatial, hierarchical, or phylogenetic structure. Ecography 2017, 40, 913–929. [Google Scholar] [CrossRef] [Scilit]
- Cawley, G.C.; Talbot, N.L.C. On over-fitting in model selection and subsequent selection bias in performance evaluation. J. Mach. Learn. Res. 2010, 11, 2079–2107. [Google Scholar]
- Varma, S.; Simon, R. Bias in error estimation when using cross-validation for model selection. BMC Bioinform. 2006, 7, 91. [Google Scholar] [CrossRef] [Scilit] [PubMed]
- Duckworth, A.L.; Peterson, C.; Matthews, M.D.; Kelly, D.R. Grit: Perseverance and passion for long-term goals. J. Personal. Soc. Psychol. 2007, 92, 1087–1101. [Google Scholar] [CrossRef] [Scilit] [PubMed]
- Messick, S. Validity of psychological assessment: Validation of inferences from persons’ responses and performances as scientific inquiry into score meaning. Am. Psychol. 1995, 50, 741–749. [Google Scholar] [CrossRef]
- Borsboom, D.; Mellenbergh, G.J.; van Heerden, J. The concept of validity. Psychol. Rev. 2004, 111, 1061–1071. [Google Scholar] [CrossRef] [Scilit] [PubMed]
- Lyu, R.; Sun, W.; Cheng, Y.; Shi, Y.; Wang, N.; Bhattacharya, J.; Yang, G. Predict the writer’s trait emotional intelligence from reproduced calligraphy. Sci. Rep. 2025, 15, 28717. [Google Scholar] [CrossRef] [Scilit] [PubMed]
- Efron, B.; Tibshirani, R.J. An Introduction to the Bootstrap; Chapman & Hall: New York, NY, USA, 1993; Volume 57. [Google Scholar]
- Janzing, D.; Minorics, L.; Bloebaum, P. Feature relevance quantification in explainable AI: A causal problem. In Proceedings of the 23rd International Conference on Artificial Intelligence and Statistics (AISTATS), Online, 26–28 August 2020; PMLR: Cambridge, MA, USA, 2020; Volume 108, pp. 2907–2916. [Google Scholar]
- Shmueli, G. To explain or to predict? Stat. Sci. 2010, 25, 289–310. [Google Scholar] [CrossRef] [Scilit]
- Yarkoni, T.; Westfall, J. Choosing prediction over explanation in psychology: Lessons from machine learning. Perspect. Psychol. Sci. 2017, 12, 1100–1122. [Google Scholar] [CrossRef] [Scilit] [PubMed]
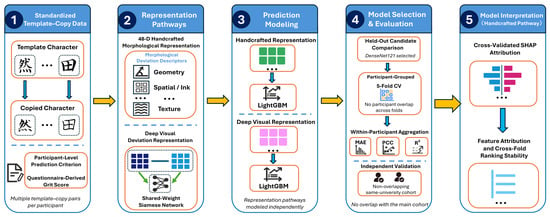
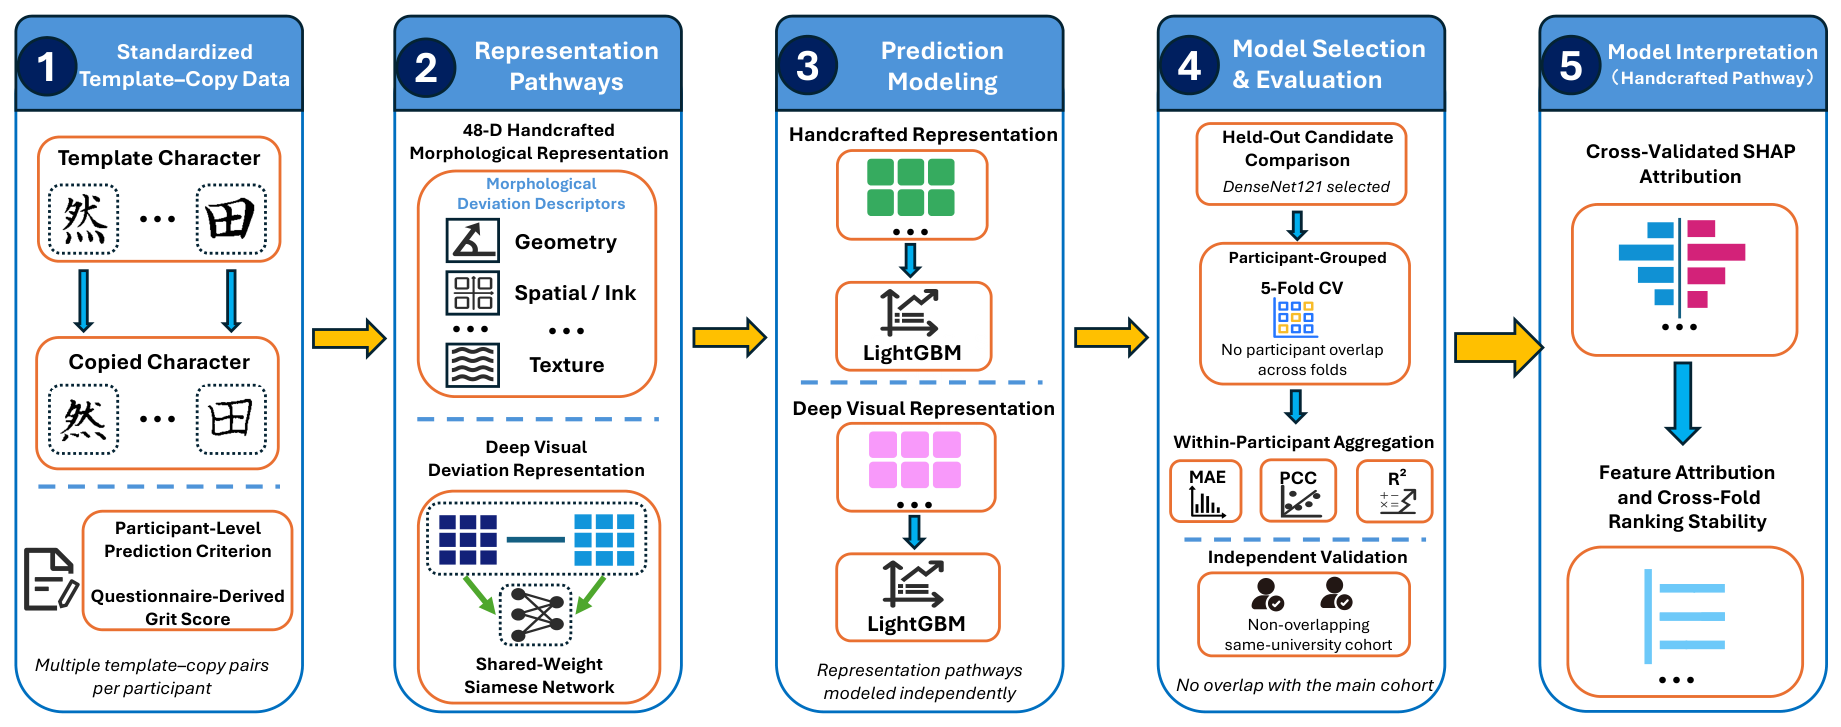
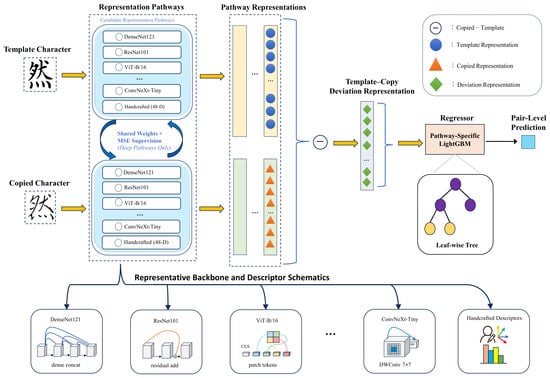
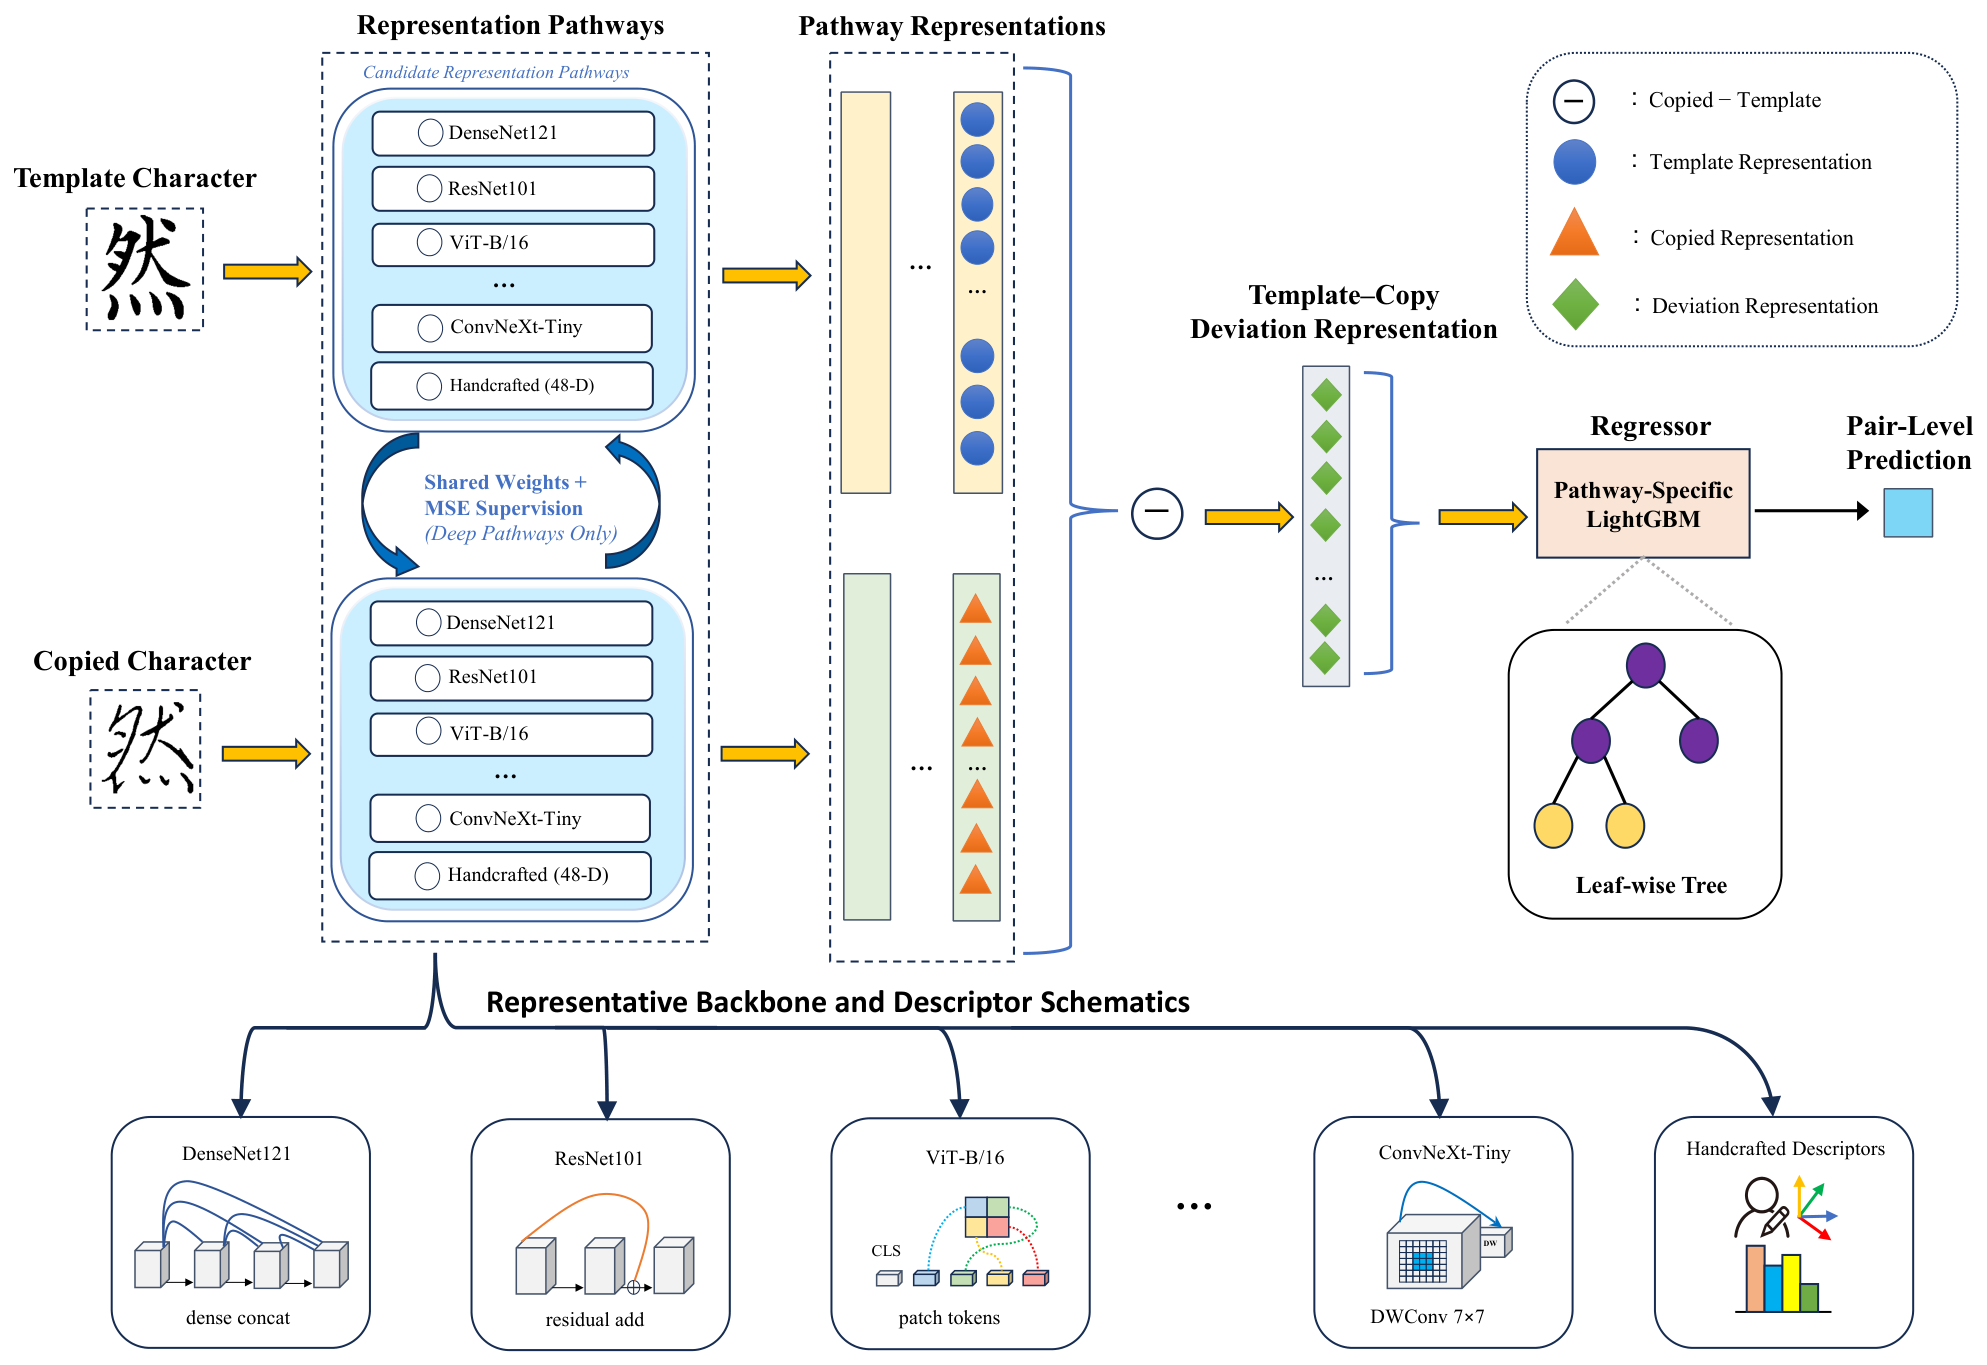
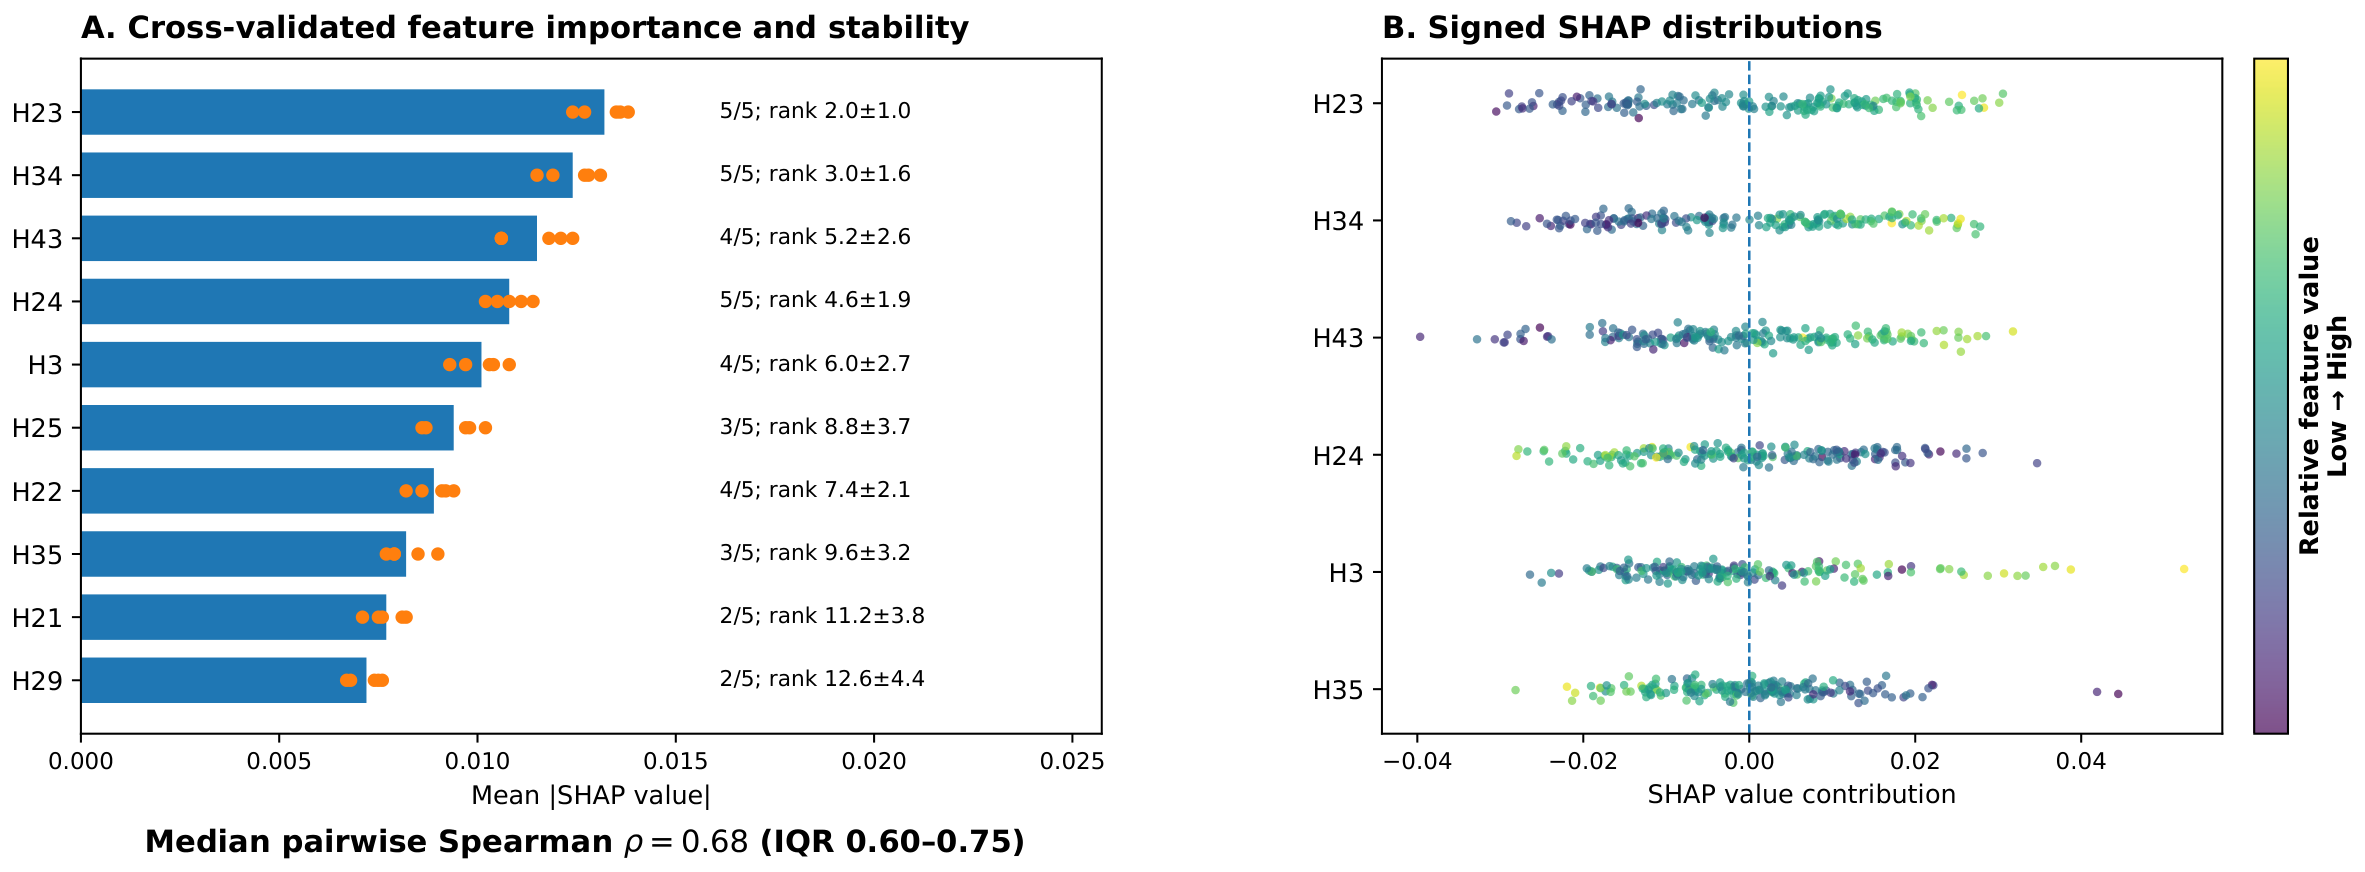

Disclaimer/Publisher’s Note: The statements, opinions and data contained in all publications are solely those of the individual author(s) and contributor(s) and not of MDPI and/or the editor(s). MDPI and/or the editor(s) disclaim responsibility for any injury to people or property resulting from any ideas, methods, instructions or products referred to in the content. |
© 2026 by the authors. Licensee MDPI, Basel, Switzerland. This article is an open access article distributed under the terms and conditions of the Creative Commons Attribution (CC BY) license.