


Abstract
In the context of climate change, the quality of bee products may be influenced by the interaction between colony nutrition, floral resources, and meteorological conditions. The present study aimed to evaluate interannual variability in the physicochemical and mineral composition of Apis mellifera bee venom in relation to nutritional regimes and local meteorological conditions. An integrative comparative analysis was conducted using experimental datasets from two previously published studies carried out in 2024 and 2025. Honey bee colonies were analyzed under conditions of nutritional supplementation and during natural foraging periods, with moisture, dry matter, pH, ash, total amino acids, and macro- and microelement contents being determined. Pearson correlations were also calculated between venom parameters and air temperature, relative humidity, and vapor pressure deficit. The results revealed important variations between years, treatments, and foraging periods, with the most stable values observed for pH, while ash, amino acids, and mineral elements showed higher variability. In 2025, several significant correlations were identified between meteorological factors and the analyzed parameters. The heavy metals Pb, Cd, and Cr were mostly below the detection limit and were therefore not included in the statistical analysis. The study shows that bee venom reflects the combined influence of nutrition, floral sources, and climatic conditions, highlighting the need to integrate these factors into the quality assessment of this bee product.
1. Introduction
Honey bees (Apis mellifera) are among the most important pollinating insect species, playing an essential role in maintaining biodiversity, ensuring ecosystem functioning, and supporting agricultural production worldwide [1,2,3,4,5,6,7,8]. Approximately 75% of food crops intended for human consumption benefit, at least partially, from animal-mediated pollination, particularly by insects, highlighting the major contribution of honey bees to global food security [1,2]. In addition to their ecological importance, honey bee colonies produce apicultural products with high economic and biological value, including honey, pollen, propolis, royal jelly, and bee venom, all of which are widely used in the food, pharmaceutical, and cosmetic industries [1,4,9,10,11,12]. During recent decades, however, colony health and productivity have been adversely affected by the combined action of multiple stressors, including climate change, agricultural intensification, pesticide use, declining floral resources, pathogens, and parasites [1,3,4]. Among these, climate change is considered one of the greatest challenges facing modern apiculture, as it affects the distribution and phenology of melliferous plants, the availability of nutritional resources, and colony development, as highlighted by recent systematic reviews addressing the impact of climate change on honey bees and beekeeping [13,14,15].
Meteorological conditions can influence honey bee foraging activity, colony physiology, and the availability of nectar and pollen resources [13,16,17,18,19]. Previous studies have also indicated that bee venom composition may vary according to season, environmental conditions, geographic origin, botanical source, bee age, colony physiological status, and collection method [20,21,22,23,24,25,26]. These findings highlight the importance of examining local meteorological variability alongside nutritional conditions when evaluating bee venom composition.
Nutrition is one of the principal factors determining the development, health, and productivity of honey bee colonies, influencing both individual physiological processes and the functioning of the colony as a superorganism [27,28,29]. Pollen represents the primary source of proteins, lipids, vitamins, and minerals, whereas nectar provides the carbohydrates required to sustain metabolic and energetic activities. The quality and diversity of these nutritional resources directly influence brood development, worker longevity, immune responses, and colony resilience against both biotic and abiotic stressors [27,30,31,32]. However, climate change and habitat degradation frequently reduce the quantity and diversity of available floral resources, potentially leading to nutritional deficiencies and decreased colony performance [13]. Under such conditions, supplementary feeding during periods characterized by nectar and pollen shortages has become an increasingly common management practice aimed at maintaining colony development and mitigating the negative effects of nutritional and climatic stress [33].
Bee venom is considered one of the most valuable bee products owing to its complex composition and its wide range of biological and pharmacological properties. It consists of a complex mixture of peptides, enzymes, proteins, and low-molecular-weight compounds, among which melittin, phospholipase A2, apamin, and mast cell-degranulating peptides are recognized as the principal bioactive constituents responsible for many of the therapeutic effects reported in the scientific literature [9,34]. Due to its anti-inflammatory, antimicrobial, antioxidant, immunomodulatory, and antitumor properties, bee venom has become an important subject of biomedical research and is currently being investigated for its potential applications in the treatment of inflammatory, neurological, metabolic, and neoplastic disorders [9]. Nevertheless, the therapeutic efficacy and safety of bee venom depend directly on its chemical composition, emphasizing the importance of identifying and understanding the factors responsible for the variability of this valuable apicultural product.
Previous studies have investigated the influence of supplementary feeding on honey bee venom characteristics. Rășinar et al. (2025) [35] evaluated the effects of stimulatory feeding on venom production, antioxidant activity, and mineral composition, while Rășinar et al. (2026) [36] examined physicochemical and mineral variability across feeding regimes and natural foraging periods. Although these studies provided experimental evidence of variations in bee venom composition, a direct integrative comparison of the two experimental years, including the relationships between venom characteristics and local meteorological conditions, was not addressed in the same analytical framework. The present study therefore reanalyzes the previously published datasets to investigate interannual variability and identify associations among nutritional regimes, harvesting periods, meteorological conditions, and the physicochemical and mineral composition of bee venom.
Although previous studies have documented the effects of climate change on honey bee colony development and the influence of nutritional supplementation on colony health and certain characteristics of bee products, information regarding the interaction between climatic and nutritional factors affecting bee venom quality remains limited. Most available studies have evaluated independently the effects of feeding regimes, seasonal variation, or environmental conditions, without integrating the relationships among air temperature, relative humidity, supplementary feeding strategies, and changes in the physicochemical properties and mineral composition of bee venom. Furthermore, correlation-based approaches capable of identifying the relationships between meteorological variables and bee venom quality parameters remain poorly represented in the current scientific literature. Identifying these relationships is essential for understanding the mechanisms through which climate change and nutritional management influence bee venom quality and for developing sustainable beekeeping practices adapted to current climatic challenges [13,36].
Considering these aspects, the present study aimed to evaluate interannual variability in the physicochemical properties and mineral composition of honey bee venom (Apis mellifera) under different nutritional regimes and meteorological conditions. Specifically, experimental datasets obtained in 2024 and 2025 were comparatively analyzed to examine the relationships among supplementary feeding strategies, natural foraging periods, air temperature, relative humidity, vapor pressure deficit (VPD), and the physicochemical and mineral characteristics of bee venom. The analysis focused on associations with local meteorological conditions rather than on the direct effects of long-term climate change. By integrating previously published experimental datasets within a comparative analytical framework, this study sought to provide additional insights into the variability of bee venom composition across two consecutive experimental years.
2. Materials and Methods
The present study was designed as an integrative and comparative analysis of experimental datasets generated in two previous scientific studies on Apis mellifera bee venom. The first dataset, corresponding to the 2024 experimental year, originated from a study investigating the effects of stimulatory feeding on bee venom production, antioxidant activity, and mineral composition [35]. The second dataset, corresponding to the 2025 experimental year, was derived from a subsequent study that expanded the analytical framework by including physicochemical parameters, macro- and microelement profiles, heavy metal determination, and continuous meteorological monitoring [36]. Both datasets were obtained from the same experimental apiary belonging to the University of Life Sciences “King Mihai I” from Timișoara, Romania, using comparable biological material, management practices, and bee venom collection procedures.
No additional biological experiments were conducted on honey bee colonies for the present manuscript. Instead, the original datasets were integrated into a unified database to evaluate the relationships among nutritional supplementation strategy, natural foraging period, meteorological conditions, and the physicochemical and mineral characteristics of bee venom. This approach enabled a comparative assessment of the two experimental years and allowed the associations between climatic variables and bee venom quality parameters to be examined through statistical and correlation analyses.
The biological material used in both experiments consisted of Apis mellifera carpatica colonies maintained under the same management and technological conditions and managed according to standard beekeeping practices specific to western Romania. To minimize the influence of technological factors on the experimental outcomes, all colonies were kept under comparable husbandry conditions, using the same hive type, management system, and bee venom collection procedures throughout both experimental years.
In both studies, eight experimental treatments were evaluated, consisting of one control group and seven treatment groups that received different dietary supplements administered in sugar syrup before the onset of the major nectar flows. Following the stimulatory feeding period, the comparative analysis included two natural foraging periods, corresponding to rapeseed (Brassica napus) and acacia (Robinia pseudoacacia). Accordingly, the integrated dataset comprised 24 experimental variants (V1–V24), representing eight nutritional treatment groups evaluated across three harvesting periods: stimulatory feeding (V1–V8), rapeseed foraging (V9–V16), and acacia foraging (V17–V24). Sunflower (Helianthus annuus) foraging was excluded from the present interannual comparison because corresponding experimental data were available only for 2025. This selection ensured that the comparisons between 2024 and 2025 were restricted to harvesting periods represented in both datasets. The experimental treatments, supplement doses, harvesting periods, and biological replication are summarized in Table 1. The experimental design is illustrated in Figure 1.
Table 1.
Experimental design, nutritional treatments, harvesting periods, and biological replication in 2024 and 2025.
Figure 1.
Experimental Design.
Each experimental treatment group consisted of three honey bee colonies, representing three independent biological replicates. Bee venom was collected separately from each colony, without pooling samples from different colonies. Within each experimental year, the same colonies were monitored and sampled during three successive harvesting periods: stimulatory feeding, rapeseed foraging, and acacia foraging. However, the colonies included in the 2024 experiment were different from those used in 2025. Therefore, the observations were independent between experimental years, whereas repeated measurements were obtained from the same colonies across harvesting periods within each year.
No additional biological experiments were performed on honey bee colonies in the present study. Instead, the research represents an integrative analysis based on the correlation of the two experimental datasets (2024 and 2025) [35,36], aiming to evaluate the relationships among nutritional factors, meteorological conditions, and the principal physicochemical and biochemical characteristics of bee venom. For this purpose, variables describing the feeding regime, sampling period, air temperature, relative humidity, mineral composition, and physicochemical parameters of bee venom were integrated into a single database in order to identify the statistical relationships among these factors and to evaluate their influence on bee venom quality.
Meteorological data corresponding to the 2024 and 2025 experimental periods were integrated with the previously obtained bee venom datasets. The meteorological variables considered in the analysis were air temperature (°C), relative humidity (%), and vapor pressure deficit (VPD, kPa). The meteorological records were used to characterize the local environmental conditions associated with the bee venom harvesting periods included in the interannual comparison, namely stimulatory feeding, rapeseed foraging, and acacia foraging.
Vapor pressure deficit (VPD) was calculated using mean air temperature and relative humidity according to the following equations:
where (es) represents the saturation vapor pressure (kPa), (T) is the mean air temperature (°C), (UR) is the mean relative humidity (%), and (VPD) represents the vapor pressure deficit (kPa). VPD was analyzed as a continuous variable, and its values were expressed as mean ± standard deviation (SD).
Data were expressed as mean ± standard deviation (SD), and the normality of the distribution was verified using the Shapiro–Wilk test. Mean temperature, relative humidity, and vapor pressure deficit (VPD, kPa), calculated based on temperature and relative humidity, were used to characterize the thermo-hygrometric conditions. The relationships between these parameters and the physicochemical characteristics of venom during the harvesting months were evaluated using Pearson’s correlation coefficient (r). Differences between the two study years were analyzed using the independent samples t-test, at a significance threshold of p < 0.05. Because the present study was based on integrated datasets obtained from two previous experiments, the statistical analyses were used to identify comparative patterns and associations between years, nutritional strategies, harvesting periods, and meteorological variables. Therefore, Pearson correlations were interpreted as associative relationships and not as evidence of direct causality.
Statistical analyses were performed using IBM SPSS Statistics, version 26, and graphical representations were created in GraphPad Prism, version 8.0.1. In the graphs, statistical significance was indicated by * p < 0.05; ** p < 0.01; *** p < 0.001.
3. Results
3.1. Characterization of Climatic Conditions During the Experimental Period
3.1.1. Thermo-Hygrometric Regime
The meteorological conditions recorded in 2024 and 2025 (Table 2) showed seasonal variations in air temperature, relative humidity (RH), and vapor pressure deficit (VPD). Differences between the two experimental years were particularly evident during spring, when the mean air temperatures in April and May were higher in 2024 (16.61 °C and 19.72 °C, respectively) than in 2025 (13.97 °C and 15.18 °C, respectively). In contrast, relative humidity during these months was higher in 2025, while VPD values were higher in 2024. These interannual differences provide the meteorological context for interpreting the variability in bee venom composition during the analyzed harvesting periods.
Table 2.
Monthly and annual characterization of thermo-hygrometric parameters.
The distribution of daily mean temperatures differed between the two experimental years, particularly during spring (Table S1). In April 2024, 20.00% of days had mean temperatures between 20 and 30 °C, compared with 13.33% in 2025. A more pronounced difference was observed in May, when the corresponding proportions were 54.84% and 6.45%, respectively. During June, 86.67% of days fell within this temperature range in both years. These results indicate substantial interannual differences in the thermal conditions recorded during the spring harvesting period.
Relative humidity (RH) showed an inverse evolution compared to temperature, with the highest values recorded during the cold season and the lowest during the summer period. Although the annual means were comparable (68.89% in 2024 and 67.74% in 2025), the monthly distribution highlighted important differences between the two years. Spring 2025 was characterized by higher relative humidity values, while summer 2024 was associated with higher temperatures and higher VPD values, suggesting drier atmospheric conditions and a higher evaporative potential.
Overall, the integrated analysis of thermo-hygrometric parameters and the distribution of temperature classes highlights the existence of distinct climatic conditions between the two experimental years. The year 2024 was characterized by a warmer spring and more pronounced summer thermal intensity, whereas 2025 showed a cooler spring and a more uniform temperature distribution during the active season. These climatic particularities represent an essential element for interpreting the relationships between meteorological conditions, nutritional supplementation strategies, and changes in the physicochemical properties and mineral composition of bee venom, analyzed in the following sections.
3.1.2. Distribution of Humidity and Potentially Favorable Conditions for Beekeeping Activity
The distribution of daily mean relative humidity differed between the two experimental years, particularly during the active beekeeping season (Table S2). In 2024, the proportion of days with relative humidity between 60% and 70% was 36.67% in April, 38.71% in May, and 40.00% in June. The corresponding values in 2025 were 36.67%, 41.94%, and 20.00%, respectively. These differences indicate variations in atmospheric humidity during the spring and early summer periods, with a lower frequency of days within this humidity range in June 2025.
The simultaneous occurrence of daily mean temperatures between 20 and 30 °C and relative humidity between 60% and 70% was also evaluated as a descriptive indicator of potentially favorable thermo-hygrometric conditions (Table S3). At the annual level, these conditions were recorded on 33 days in both 2024 (9.02%) and 2025 (9.04%). However, their seasonal distribution differed, with higher frequencies in May and June 2024 (25.81% and 40.00%, respectively), compared with May and June 2025 (3.23% and 20.00%, respectively). These findings highlight differences in the temporal distribution of the selected meteorological conditions between the two experimental years.
3.1.3. Comparative Analysis Between Experimental Years
The comparison of meteorological conditions between 2024 and 2025 focused on the differences in air temperature, relative humidity, and vapor pressure deficit (VPD), particularly during the bee venom harvesting periods. Although annual meteorological indicators showed relatively similar overall values between the two years (Table S4), more pronounced differences were recorded during individual months of the active beekeeping season. Monthly comparisons of the main thermo-hygrometric parameters are presented in Table 2.
During April and May, mean air temperatures were higher in 2024 than in 2025, while relative humidity was lower and VPD was higher (Table 3). In June, mean air temperatures were similar between the two years (24.52 °C in 2024 and 24.38 °C in 2025), whereas relative humidity decreased from 66.17% in 2024 to 55.77% in 2025. In July, mean air temperature was higher in 2024 (27.13 °C) than in 2025 (24.44 °C). These differences characterize the meteorological conditions prevailing during the principal harvesting months included in the comparative analysis.
Table 3.
Monthly comparison of thermo-hygrometric parameters between the two years.
At the annual level, the differences between 2024 and 2025 were not statistically significant for mean air temperature (p = 0.263), relative humidity (p = 0.264), or vapor pressure deficit (p = 0.114), based on the reported comparisons (Table S5). Nevertheless, the monthly data revealed variations in the seasonal distribution of meteorological conditions, particularly during the spring and summer periods. These findings indicate that similar annual averages may coexist with different meteorological conditions during the bee venom harvesting periods.
Figure 2 illustrates the monthly variation in mean air temperature and relative humidity during 2024 and 2025. The most noticeable differences between the experimental years occurred during spring, particularly in April and May, when higher temperatures and lower relative humidity values were recorded in 2024 compared with 2025. These variations provide additional context for the meteorological conditions characterizing the two experimental years.
Figure 2.
Monthly evolution of mean temperature and relative humidity.
3.2. Physicochemical Characterization of Bee Venom
3.2.1. Total Amino Acids
The content of total amino acids (AA) (Figure 3) in bee venom showed a relatively constant pattern between the two experimental years, with variations depending on both the supplementation strategy and the harvesting period. Overall, the values determined in 2025 were slightly higher than those recorded in 2024 for most experimental variants, with the differences being statistically significant in numerous cases.
Figure 3.
Total amino acid content in bee venom according to supplementation strategy and harvesting period in 2024 and 2025. * p < 0.05; ** p < 0.01; *** p < 0.001. Values without asterisks are not statistically significant (p ≥ 0.05).
During the stimulatory feeding period (V1–V8), the differences between the two years were smaller and depended on the applied treatment. Variants V4, V7, and V8 showed significant increases in total amino acid content in 2025, while groups V1–V3 and V5–V6 showed minor or statistically nonsignificant changes.
During the rapeseed foraging period (V9–V16), the total amino acid content increased compared to the stimulation stage, with significant differences being highlighted for most experimental variants. The most pronounced increases were observed in groups V13, V14, and V15, where the values in 2025 significantly exceeded those in 2024, while variants V11 and V12 showed more moderate increases, and V10 did not show significant differences.
The highest values of total amino acids were recorded during the acacia foraging period (V17–V24), when almost all experimental variants showed concentrations higher than those determined during the stimulation stage. Significant differences between the two years were observed for variants V17, V18, and V20–V24, with the strongest levels of statistical significance being highlighted for V21, V22, and V23 (***, p < 0.001). The only variant that did not show significant differences during this stage was V19.
Overall, the analysis of all experimental variants indicates that the total amino acid profile was characterized by a general increasing trend from the stimulatory feeding period toward the natural foraging periods, with maximum values during the acacia foraging period. Compared to 2024, 2025 was associated with a slightly higher total amino acid content in most groups, suggesting that variations in environmental conditions between the two years influenced, to some extent, their accumulation in bee venom, without modifying the general trend determined by the harvesting period and supplementation strategy.
3.2.2. Dry Matter
The dry matter (DM) of bee venom (Figure 4) generally remained stable between the two study years, with most groups showing similar values in 2024 and 2025. However, certain experimental variants showed statistically significant differences, indicating that the effect of supplementation and harvesting period on dry matter content was not uniform.
Figure 4.
Dry matter content in bee venom according to supplementation strategy and harvesting period in 2024 and 2025. * p < 0.05; ** p < 0.01. Values without asterisks are not statistically significant (p ≥ 0.05).
During the stimulatory feeding period (V1–V8), dry matter content remained relatively stable between the two experimental years. A statistically significant increase was observed only in V4 (p < 0.05), whereas the remaining variants showed no statistically significant differences. Overall, dry matter values remained within an approximate range of 82–87%, indicating limited interannual variability during this harvesting period.
During the rapeseed foraging period (V9–V16), the differences were also limited. A significant increase was recorded only in V9, while V11 showed a significant decrease in dry matter content in 2025 compared to 2024 (p < 0.01). The other variants (V10 and V12–V16) showed only minor variations, without statistical significance.
During the acacia foraging period (V17–V24), most groups maintained very similar values between the two years. The only significant difference was observed in V24, where the dry matter content was slightly lower in 2025 than in 2024 (p < 0.05). In the remaining variants (V17–V23), the differences between years were nonsignificant.
The significant differences were isolated and appeared only in a few variants (V4, V9, V11, and V24), without highlighting a general increasing or decreasing trend in dry matter content in 2025 compared to 2024. This behavior suggests that annual variations had a limited impact on this physicochemical indicator of bee venom compared to other parameters analyzed in the study.
3.2.3. Moisture
The moisture content (Figure 5) of bee venom showed relatively constant values between 2024 and 2025, with most experimental variants recording small differences between the two years. However, statistically significant differences were observed in a few groups, suggesting that the effect of supplementation and harvesting period on moisture was limited and dependent on the experimental variant.
Figure 5.
Moisture content in bee venom according to supplementation strategy and harvesting period in 2024 and 2025. * p < 0.05; ** p < 0.01. Values without asterisks are not statistically significant (p ≥ 0.05).
During the stimulatory feeding period (V1–V8), most variants did not show significant changes in moisture content between the two years. The only exception was V4, where moisture was significantly lower in 2025 compared to 2024 (p < 0.05). In the other variants (V1–V3 and V5–V8), the differences were statistically nonsignificant.
During the rapeseed foraging period (V9–V16), a significant difference was observed in V9, where the moisture content was significantly lower in 2025 than in 2024 (p < 0.01). In contrast, for variants V10–V16, no significant differences between years were highlighted.
During the acacia foraging period (V17–V24), moisture values generally remained stable between the two experimental years. The only statistically significant difference was recorded in V24, where moisture was slightly higher in 2025 compared to 2024 (p < 0.05), while variants V17–V23 showed only minor variations, without statistical significance.
The significant differences were limited to variants V4, V9, and V24, without highlighting a general increasing or decreasing trend in moisture content in 2025 compared to 2024.
3.2.4. pH
The pH values of bee venom (Figure 6) fell within a narrow range (approximately 5.8–6.4) in both experimental years, indicating high stability of this physicochemical parameter, regardless of the applied nutritional supplementation or the harvesting period. However, statistically significant differences between 2024 and 2025 were identified for certain experimental variants.
Figure 6.
pH values of bee venom according to supplementation strategy and harvesting period in 2024 and 2025. * p < 0.05; ** p < 0.01. Values without asterisks are not statistically significant (p ≥ 0.05).
During the stimulatory feeding period (V1–V8), most variants did not show significant differences in pH between the two study years. Significant differences were highlighted only in V1, where the pH value was significantly lower in 2025 compared to 2024 (p < 0.01), and in V7, where the pH was significantly higher in 2025 (p < 0.01). For variants V2–V6 and V8, only minor variations were observed, without statistical significance.
During the rapeseed foraging period (V9–V16), pH values remained very similar between the two experimental years. A statistically significant difference was observed only for V10, where the pH was slightly higher in 2025 compared to 2024 (p < 0.05). For variants V9 and V11–V16, no significant differences were recorded.
During the acacia foraging period (V17–V24), bee venom pH also showed high stability. The only statistically significant difference was observed for V19, where the pH value was slightly higher in 2025 than in 2024 (p < 0.05). For variants V17, V18, and V20–V24, no significant differences were identified between the two study years.
Overall, the results obtained highlight that bee venom pH represents one of the most stable physicochemical parameters analyzed, being influenced to a limited extent by nutritional supplementation and by the specific conditions of each experimental year. Statistically significant differences were limited to variants V1, V7, V10, and V19, while all other variants showed comparable values between 2024 and 2025, suggesting that the observed changes had a limited amplitude and did not substantially affect the acidic character of bee venom.
3.2.5. Ash Content
The ash content of bee venom (Figure 7) showed considerable variations between 2024 and 2025, with differences being much more pronounced than those observed for other analyzed physicochemical parameters. Statistically significant differences were recorded in most experimental variants, indicating that this parameter is influenced both by the specific conditions of each year and by the harvesting period.
Figure 7.
Ash content in bee venom according to supplementation strategy and harvesting period in 2024 and 2025. * p < 0.05; ** p < 0.01; *** p < 0.001. Values without asterisks are not statistically significant (p ≥ 0.05).
During the stimulatory feeding period (V1–V8), statistically significant differences were observed for most variants. In the case of V1 and V2, ash content was significantly lower in 2025 compared to 2024 (p < 0.001). V6 and V7 also recorded very pronounced significant reductions in 2025 (p < 0.001). In contrast, ash content was significantly higher in 2025 for V4 (p < 0.01), whereas V8 showed an increase that was not statistically significant. No significant differences between the two experimental years were observed for V3 and V5.
During the rapeseed foraging period (V9–V16), ash content showed variable patterns between the two experimental years. Statistically significant increases in 2025 were observed for V9 (p < 0.01), V13 (p < 0.01), and V16 (p < 0.001). Although higher values were also recorded for V11 and V15, these differences were not statistically significant. In contrast, significantly lower ash content was observed in 2025 for V10, V12, and V14 (p < 0.001).
During the acacia foraging period (V17–V24), the differences between the two years remained evident. Ash content increased significantly in 2025 for V17 and V18 (p < 0.001), as well as for V19 (p < 0.01) and V20 (p < 0.001). In contrast, variants V21, V22, V23, and V24 showed significantly lower values in 2025 compared to 2024 (p < 0.001 for V21 and V22; p < 0.01 for V23 and V24).
Overall, the results highlight that ash content represents one of the parameters with the greatest variability between the experimental years, being influenced by both nutritional supplementation and the specific conditions of each beekeeping season. Unlike pH, where differences were limited to a few experimental variants, ash content showed significant changes in most of the analyzed variants, suggesting a high sensitivity of the mineral fraction of bee venom to environmental factors and production conditions.
3.3. Macroelements Content in Bee Venom
3.3.1. Calcium (Ca) Content in Bee Venom
Calcium content (Figure 8) in bee venom showed important variations between 2024 and 2025, with most differences being statistically significant. The changes depended on both the applied treatment and the harvesting period, highlighting the influence of experimental conditions and melliferous resources on the concentration of this macroelement.
Figure 8.
Ca content in bee venom according to supplementation strategy and harvesting period in 2024 and 2025. *** p < 0.001. Values without asterisks are not statistically significant (p ≥ 0.05).
During the stimulatory feeding period (V1–V8), calcium values varied considerably between the two years. For V2, V3, V5, V7, and V8, calcium concentration was significantly lower in 2025 compared to 2024 (p < 0.001). In contrast, variants V4 and V6 recorded significant increases in 2025 (p < 0.001), while V1 showed no significant differences between the two years.
During the rapeseed flowering period (V9–V16), the response differed depending on the variant. Calcium concentration increased significantly in 2025 for V10, V13, V15, and V16 (p < 0.001), while for V9, V11, V12, and V14, the values were significantly lower than in 2024 (p < 0.001).
During the acacia flowering period (V17–V24), the general trend was an increase in calcium content in 2025. Thus, variants V18, V19, V22, and V23 showed significantly higher values compared to the previous year (p < 0.001). In contrast, V20 and V21 recorded significant reductions in calcium concentration (p < 0.001), while no significant differences between the two years were observed for V17 and V24.
Overall, the results indicate that the calcium level in bee venom is strongly influenced by annual conditions and the harvesting period, although the response differs among experimental variants. While decreases in calcium concentration in 2025 predominated during the stimulatory feeding period, significant increases in this macroelement were frequently observed during the rapeseed flowering period and, especially, during the acacia flowering period. These results suggest that the availability of natural food sources and environmental conditions may modify the mineral intake reflected in the composition of bee venom.
3.3.2. Phosphorus (P) Content in Bee Venom
Phosphorus (P) concentration in bee venom (Figure 9) varied significantly between 2024 and 2025, with the differences being influenced by both the harvesting period and the experimental variant. During the stimulatory feeding period (V1–V8), the values showed a heterogeneous response. Significant increases in 2025 were recorded in variants V1 (p < 0.05), V2 (p < 0.001), and V7 (p < 0.001), while in V3 (p < 0.001), V6 (p < 0.01), and V8 (p < 0.001), the concentrations were significantly lower compared to 2024. In the case of variants V4 and V5, phosphorus was not determined in 2024.
Figure 9.
P content in bee venom according to supplementation strategy and harvesting period in 2024 and 2025. * p < 0.05; ** p < 0.01; *** p < 0.001. Values without asterisks are not statistically significant (p ≥ 0.05).
During the rapeseed foraging period (V9–V16), phosphorus concentration showed a predominantly increasing trend in 2025. Significant differences were observed in variants V9 (p < 0.01), V10 (p < 0.001), V13 (p < 0.01), and V15 (p < 0.001), while variants V11 and V14 did not show significant changes. The only exception was variant V16, where phosphorus concentration was significantly lower in 2025 than in 2024 (p < 0.05).
During the acacia foraging period (V17–V24), the response depended on the applied treatment. Significantly higher phosphorus concentrations in 2025 were recorded in variants V17, V18, V19, V20, and V22 (p < 0.001), while variants V21, V23, and V24 showed significantly lower values compared to 2024 (p < 0.001).
3.3.3. Magnesium (Mg) Content in Bee Venom
Magnesium (Mg) concentration (Figure 10) in bee venom showed significant variations between 2024 and 2025, with the differences being influenced by both the harvesting period and the experimental variant. During the stimulatory feeding period (V1–V8), most variants recorded significantly lower concentrations in 2025 compared to 2024, namely V1, V2, V3, V4, V5, V6, V7, and V8 (p < 0.001).
Figure 10.
Mg content in bee venom according to supplementation strategy and harvesting period in 2024 and 2025. ** p < 0.01; *** p < 0.001. Values without asterisks are not statistically significant (p ≥ 0.05).
During the rapeseed foraging period (V9–V16), the same decreasing trend in magnesium concentration in 2025 was observed in variants V9, V10, V11, V12, V13, V14, and V16 (** p < 0.001). The only exception was variant V15, where magnesium concentration was significantly higher in 2025 compared to the previous year (p < 0.001). During the acacia foraging period (V17–V24), the response depended on the applied treatment. Magnesium concentration increased significantly in 2025 in variants V18 (p < 0.001), V19 (p < 0.001), and V23 (p < 0.001), while in variants V17 (p < 0.001), V21 (p < 0.01), and V22 (p < 0.001), significantly lower values were recorded compared to 2024. Variant V20 did not show significant differences between the two years.
3.3.4. Potassium (K) Content in Bee Venom
Potassium (K) concentration in bee venom (Figure 11) varied significantly between 2024 and 2025, with the differences depending on both the harvesting period and the experimental variant. During the stimulatory feeding period (V1–V8), potassium concentration was significantly lower in 2025 in variants V1 (p < 0.001), V2 (p < 0.001), V7 (p < 0.05), and V8 (p < 0.001), while variants V3, V4, V5, and V6 recorded significantly higher values compared to 2024 (V3, V4, V5, and V6, p < 0.001).
Figure 11.
K content in bee venom according to supplementation strategy and harvesting period in 2024 and 2025. * p < 0.05; ** p < 0.01; *** p < 0.001. Values without asterisks are not statistically significant (p ≥ 0.05).
During the rapeseed foraging period (V9–V16), the response differed among variants. Potassium concentration was significantly lower in 2025 in variants V10 (p < 0.01), V13 (p < 0.001), and V16 (p < 0.01), while variants V11 (p < 0.001), V12 (p < 0.01), V14 (p < 0.001), and V15 (p < 0.001) showed significantly higher values compared to 2024. Variant V9 did not show significant differences between the two years.
During the acacia foraging period (V17–V24), potassium concentration increased significantly in 2025 in variants V17 (p < 0.001), V18 (p < 0.01), V19 (p < 0.001), V21 (p < 0.05), V22 (p < 0.01), and V23 (p < 0.001). In contrast, variant V20 showed a significant decrease in potassium concentration in 2025 compared to 2024 (p < 0.001), while for variant V24, potassium determinations were not performed in 2024.
3.4. Microelement Content in Bee Venom
3.4.1. Copper (Cu) Content in Bee Venom
Copper (Cu) concentration in bee venom (Figure 12) showed important variations between 2024 and 2025, with a differentiated response depending on the experimental variant and the harvesting period. During the stimulatory feeding period (V1–V8), Cu values were significantly higher in 2025 in variants V2 and V3 (p < 0.001), while variants V4 (p < 0.05), V6 (p < 0.01), V7, and V8 (p < 0.001) recorded significant decreases compared to 2024. For variants V1 and V5, no significant differences were highlighted between the two years.
Figure 12.
Cu content in bee venom according to supplementation strategy and harvesting period in 2024 and 2025. * p < 0.05; ** p < 0.01; *** p < 0.001. Values without asterisks are not statistically significant (p ≥ 0.05).
During the rapeseed foraging period (V9–V16), copper concentration showed a nonuniform evolution. The values were significantly higher in 2025 in variants V11, V12, and V13 (p < 0.001), while significant decreases compared to 2024 were observed in variants V10, V14, V15, and V16 (p < 0.001). Variant V9 did not show significant differences between the two years.
During the acacia foraging period (V17–V24), the differences between years were more pronounced in most variants. Cu concentration was significantly lower in 2025 in variants V17 (p < 0.001), V18 (p < 0.01), V20 (p < 0.001), and V23 (p < 0.001), while variants V19 (p < 0.001), V21 (p < 0.01), and V22 (p < 0.05) showed significantly higher values in 2025. For variant V24, no significant differences were highlighted between the two years.
3.4.2. Iron (Fe) Content in Bee Venom
Iron (Fe) concentration in bee venom (Figure 13) showed evident variations between 2024 and 2025, with the differences depending on the experimental variant and the harvesting period. During the stimulatory feeding period (V1–V8), Fe values were significantly higher in 2025 in variants V1 (p < 0.001) and V6 (p < 0.001), while variants V2 (p < 0.01), V3 (p < 0.001), V4 (p < 0.01), V5 (p < 0.001), V7 (p < 0.01), and V8 (p < 0.001) recorded significant decreases compared to 2024.
Figure 13.
Fe content in bee venom according to supplementation strategy and harvesting period in 2024 and 2025. * p < 0.05; ** p < 0.01; *** p < 0.001. Values without asterisks are not statistically significant (p ≥ 0.05).
During the rapeseed foraging period (V9–V16), Fe concentration was generally lower in 2025 than in 2024. Significant differences were observed in all analyzed variants, with decreases in V9 (p < 0.05), V10, V11, V12, V13, and V14 (p < 0.001), as well as in V15 and V16 (p < 0.01). These results indicate a pronounced decrease in iron content in the venom harvested in 2025 during this foraging period.
During the acacia foraging period (V17–V24), Fe variations were more pronounced between the two years. In variants V19 and V23, Fe concentration was significantly higher in 2025 (p < 0.001), while variants V18, V20, V21, V22, and V24 showed significant decreases in 2025 compared to 2024 (p < 0.001). Variant V17 did not show significant differences between the two years.
3.4.3. Manganese (Mn) Content in Bee Venom
Manganese (Mn) concentration in bee venom (Figure 14) showed marked differences between 2024 and 2025, with a general decreasing profile in 2025, regardless of the experimental variant or harvesting period. During the stimulatory feeding period (V1–V8), all analyzed variants recorded significantly lower Mn values in 2025 compared to 2024 (p < 0.001). The most pronounced differences were observed in variants V1 and V3, where the values in 2024 were considerably higher, suggesting a strong influence of the harvesting year on manganese accumulation in the venom.
Figure 14.
Mn content in bee venom according to supplementation strategy and harvesting period in 2024 and 2025. * p < 0.05; ** p < 0.01; *** p < 0.001. Values without asterisks are not statistically significant (p ≥ 0.05).
During the rapeseed foraging period (V9–V16), Mn concentration followed the same downward trend in 2025. The differences between the two years were significant for all analyzed variants (p < 0.001), with the 2024 values being consistently higher than those in 2025. This uniform decrease indicates that, during the rapeseed foraging period, the mineral composition of the venom was strongly influenced by the specific conditions of 2025.
During the acacia foraging period (V17–V24), Mn content was also higher in 2024 compared to 2025. Significant differences were observed in V17, V20, V21, V22, and V23 (p < 0.001), in V18 (p < 0.01), and in V24 (p < 0.05). Variant V19 did not show evident significant differences between the two years. Overall, the results indicate a marked reduction in manganese concentration in the venom harvested in 2025, especially in variants V21–V23.
3.4.4. Zinc (Zn) Content in Bee Venom
Zinc (Zn) concentration in bee venom (Figure 15) showed variations between 2024 and 2025, with the general trend being an increase in values in 2025 for several experimental variants. During the stimulatory feeding period (V1–V8), the differences between years were more evident in variants V2, V3, V4, and V6, where Zn values were significantly higher in 2025 compared to 2024. The most pronounced increases were observed in V2, V4, and V6 (p < 0.001), while V3 showed a lower significant difference (p < 0.01). In variants V1, V5, V7, and V8, no clear significant differences were highlighted between the two years.
Figure 15.
Zn content in bee venom according to supplementation strategy and harvesting period in 2024 and 2025. * p < 0.05; ** p < 0.01; *** p < 0.001. Values without asterisks are not statistically significant (p ≥ 0.05).
During the rapeseed foraging period (V9–V16), Zn content showed a nonuniform evolution. The values were significantly higher in 2025 in V9, V12, and V13, with statistically significant differences (p < 0.01 for V9 and V13; p < 0.001 for V12). In contrast, in V10, Zn concentration was higher in 2024 compared to 2025 (p < 0.01). For variants V11, V14, V15, and V16, no evident significant differences were observed between the two years.
During the acacia foraging period (V17–V24), Zn variations were more pronounced in some variants but were not uniform. In V17, V18, V19, and V23, the values in 2025 were higher compared to those in 2024, with statistically significant differences (p < 0.01 for V17 and V18; p < 0.05 for V19; p < 0.001 for V23). In the case of variants V20, V21, V22, and V24, the differences between harvesting years were reduced and did not show evident statistical significance. Overall, the results indicate a tendency toward greater zinc accumulation in the venom harvested in 2025, especially during the stimulatory feeding period and in certain variants from the acacia foraging period.
3.5. Heavy Metal Content in Bee Venom
In the case of the heavy metals Pb, Cd, and Cr, statistical processing could not be performed because, in the two studies/experimental datasets, most determinations were below the detection limit of the analytical method. This situation prevented the generation of a complete series of quantifiable values required for statistical comparison between experimental variants and for the integration of these elements into the correlation analysis.
3.6. Relationship Between Meteorological Conditions and the Compositional Variability of Bee Venom
Pearson correlation analysis (Table 4) highlighted clear differences between 2024 and 2025 regarding the relationship between meteorological factors and the physicochemical and mineral parameters of bee venom. In 2024, most correlations between meteorological variables and the analyzed parameters were not statistically significant, indicating a weaker or less consistent association between climatic conditions and venom composition. The only statistically significant correlation reported for 2024 was between air temperature and total amino acid content (AA), with a strong positive association (r = 1.00; p < 0.05). This result indicates an association between the two variables within the observations included in the correlation analysis, without establishing a causal relationship.
Table 4.
Pearson correlations between meteorological variables and physicochemical and mineral parameters of bee venom in 2024 and 2025.
In 2025, the relationships between meteorological variables and venom composition were much more evident, with numerous significant correlations being observed, especially with temperature and relative humidity. Venom moisture was strongly positively correlated with both temperature (r = 0.97; p < 0.001) and relative humidity (r = 0.96; p < 0.001), while VPD showed a significant negative correlation with this parameter (r = −0.63; p < 0.01). In contrast, dry matter and pH were negatively correlated with temperature and relative humidity, indicating that an increase in these meteorological variables was associated with a decrease in the values of these parameters.
Ash content showed significant positive correlations in 2025 with temperature (r = 0.93; p < 0.001) and relative humidity (r = 0.69; p < 0.01), indicating a possible influence of meteorological conditions on the accumulation of the total mineral fraction in venom. Total amino acid content (AA) was positively correlated with air temperature (r = 0.99; p < 0.001) and relative humidity (r = 0.83; p < 0.01) in 2025. These results indicate statistical associations between meteorological conditions and the amino acid content of bee venom during the analyzed periods.
Regarding macroelements and microelements, significant correlations were observed in 2025 between temperature and several mineral elements, namely Ca, K, Mg, P, Fe, Mn, and Cu. Calcium was negatively correlated with temperature (r = −0.98; p < 0.001) and RH (r = −0.96; p < 0.01) but positively correlated with VPD (r = 0.63; p < 0.05). In contrast, K, Mg, P, Fe, and Cu showed significant positive correlations with temperature, indicating that higher temperature values were associated with an increase in the concentration of these elements in venom. Zinc showed a different behavior, being positively and significantly correlated with VPD (r = 0.79; p < 0.001), suggesting a more pronounced association with atmospheric dryness conditions.
Overall, the results indicate that 2025 showed a more pronounced compositional response of bee venom to meteorological variations compared to 2024. T and RH were the main variables associated with changes in the physicochemical and mineral parameters, while VPD had a more selective role, being significantly correlated especially with moisture, calcium, and zinc. These correlations support the idea that meteorological factors may contribute to the compositional variability of venom; however, the intensity and direction of these relationships may differ from one year to another.
4. Discussion
The comparative analysis of the 2024 and 2025 datasets revealed variability in the physicochemical and mineral composition of bee venom across nutritional treatments and harvesting periods. These differences may be associated with several interacting factors, including the availability of floral resources, local meteorological conditions, and colony physiological status. However, because harvesting period, floral resources, and meteorological conditions varied simultaneously, their individual contributions cannot be fully distinguished within the present analytical framework. Previous studies have also reported variability in bee venom composition in relation to bee age, season, botanical origin, environmental conditions, and nutritional management [18,24,35,36]. Therefore, the observed differences should be interpreted as associations rather than evidence of direct causal effects attributable to individual environmental or nutritional factors.
Physicochemical parameters showed different degrees of sensitivity to variations between years. pH generally remained within a relatively stable range, indicating that venom acidity is largely controlled by the internal physiological mechanisms of bees. However, the significant differences observed in some variants suggest that the food source and harvesting conditions may punctually modify the balance of acidic and basic compounds in the venom. This interpretation is in agreement with the data reported by Rășinar et al. (2026) [36], where bee venom pH ranged between 5.6 and 6.25, but was considered a relatively stable parameter, less influenced by supplementation than by species physiology and harvesting conditions. The literature also mentions that bee venom pH reflects the presence of acidic peptides, free amino acids, and other bioactive components specific to apitoxin [22,26].
Moisture and dry matter content showed more pronounced variability than pH, indicating greater sensitivity of these parameters to environmental conditions. The differences between 2024 and 2025 may be associated with relative humidity, temperature, and the characteristics of nectar during the foraging periods. In the study conducted by [35], bee venom samples had a higher moisture content than that reported in other studies, with the authors suggesting that atmospheric humidity at the time of harvesting may contribute to this difference [35]. In the same sense, the study conducted by [36] shows that moisture varied between 11.2 and 19.2%, and the variations were more evident during natural foraging periods than during artificial feeding, supporting the determining role of botanical source and season.
Ash content showed important differences between variants and years, reflecting the variation in the total mineral fraction in the venom. This variability may be explained by differences in the mineral composition of floral resources, by the pedological characteristics of the area, and by the influence of the supplements administered during the stimulation period. Rășinar et al. (2026) [36] reported ash values between 3.1 and 5.5%, with higher values in some variants supplemented with essential oils, but without a uniform response to supplementation. Therefore, the data obtained in the present study support the idea that supplementation may punctually influence the mineral fraction, while botanical origin and ecological conditions remain the main factors determining the mineral profile of venom. This observation is in agreement with Scaccabarozzi et al. (2021) [24], El Mehdi et al. (2022) [37], Sabo et al. (2024) [38] și Rășinar et al. (2025) [35], who showed that region, flora, and the local environment can generate important differences in venom composition.
The analyzed macroelements, namely Ca, K, Mg, and P, showed clear differences between variants and years, with a profile generally dominated by potassium. This result is in agreement with previously reported data, where potassium was the main macroelement identified in venom, followed by calcium, magnesium, and phosphorus [35,36]. The differences observed between 2024 and 2025 may be explained by changes in the available floral resources, in nectar and pollen composition, as well as by the indirect effects of temperature and humidity on foraging activity. In the 2026 study, the highest concentrations of macroelements were associated with the acacia foraging period, indicating the important role of botanical origin in the mineral composition of venom. Similar results were also mentioned by Sabo et al. (2024) [38], who reported important variations in essential elements in venom originating from different areas.
The microelements Fe, Mn, Cu, and Zn showed more complex variation patterns than the macroelements, indicating increased sensitivity to the food source, experimental year, and foraging environment. In 2025, Rășinar et al. [35] showed that Fe was influenced by both supplements and floral origin, with the highest values being associated in some cases with sunflower and acacia. Mn showed a strong dependence on the botanical source, with high values during the sunflower period, while Cu was more pronounced in samples associated with acacia foraging. Zn showed moderate variation, being influenced by both supplements and natural foraging [36]. These results support the observations of the present study, where the differences between 2024 and 2025 for Fe, Mn, Cu, and Zn indicate that microelements more accurately reflect environmental and nutritional changes than more stable physicochemical parameters, such as pH.
The differences observed for Fe and Mn may have particular biological importance, considering the role of these elements in oxidative metabolism and enzymatic activity. Iron is involved in numerous transport processes and redox reactions, while manganese may participate in antioxidant mechanisms and in the functioning of certain enzymes. In the previous 2025 study, Fe, Mn, Cu, and Zn were identified as important microelements of venom, and Zn was reported as the predominant element, followed by Fe, Cu, and Mn, depending on the harvest and variant [35]. Comparing these data with the current study shows that the variations between 2024 and 2025 do not represent isolated deviations, but are part of a broader biological behavior, in which microelements respond differently to nutritional and environmental conditions. In addition, the data reported by Gernt et al. (2024) [27] and Ansaloni et al. (2025) [39] support the importance of nutritional resources, including minerals, proteins, amino acids, and compounds derived from pollen and nectar, for the physiological functioning of bees and for the response of colonies to environmental variations.
Pearson correlation analysis provided additional information regarding the associations between meteorological variables and the physicochemical and mineral characteristics of bee venom. A greater number of statistically significant correlations was reported for 2025 than for 2024, suggesting differences in the relationships observed between the two experimental years. Positive associations were identified between air temperature and several venom parameters, including moisture, ash content, total amino acids, K, Mg, P, Fe, and Cu, whereas negative associations were observed for dry matter, pH, Ca, and Mn in 2025. However, these correlations should be interpreted cautiously, as meteorological conditions, harvesting periods, and available floral resources varied simultaneously. Consequently, the observed relationships cannot be attributed exclusively to individual meteorological factors. Previous research has indicated that temperature and humidity may affect honey bee foraging activity, colony physiology, and floral resource availability [36,40], providing possible biological explanations for the associations observed in the present study.
The observed correlations suggest that certain physicochemical and mineral characteristics of bee venom may be associated with local meteorological variability. Previous analyses of bee venom composition have also identified relationships among biochemical components, mineral elements, harvesting periods, and floral resources [36]. Nevertheless, the present results should be considered exploratory, particularly because the integrated datasets originated from two experimental years and the individual effects of nutritional treatments, floral sources, and meteorological conditions could not be fully separated. Therefore, further studies involving additional experimental years and independently replicated observations are needed to clarify the relationships between environmental conditions and bee venom composition.
Regarding heavy metals, namely Pb, Cd, and Cr, the results of the present study must be discussed separately from the essential macro- and microelements. In the experiments analyzed here, most determinations for Pb, Cd, and Cr were below the detection limit of the analytical method, which is why no statistical processing was performed and these elements were not included in the correlation analysis with meteorological variables. This limitation does not indicate the complete absence of ecotoxicological risk but shows that the number of quantifiable values was insufficient for a valid statistical comparison between years, variants, and foraging periods. At the same time, the result is important from the perspective of the safety of the analyzed samples, as it suggests very low levels of these contaminants in most samples. The literature mentions that bees and bee products can reflect heavy metal contamination from air, water, soil, and plants, being used as bioindicators of pollution [41]. This interpretation is supported by Mair et al. (2023) [42] and Zavrtnik et al. (2024) [43], who show that bees and hive products can accumulate or reflect contaminants originating from the surrounding environment, including heavy metals.
The heavy metal results included in the present analysis originated from the previously published experimental datasets [35,36]. Therefore, these findings should be interpreted as a re-evaluation of existing measurements rather than as independent experimental evidence. The detection of Pb, Cd, and Cr varied among the original samples, and the occurrence of values below the analytical detection limits restricted the possibility of conducting reliable interannual statistical comparisons. Consequently, these elements were excluded from the correlation analysis with meteorological variables. Further investigations involving a larger number of quantifiable observations would be necessary to evaluate potential associations between heavy metal concentrations and environmental conditions.
Compared to previous studies, the current results regarding Pb, Cd, and Cr show a profile different from that observed in the 2026 study, where Pb and Cr were detected in certain foraging periods, and Cd was mainly associated with artificial feeding [36]. This difference may be explained by annual variations in environmental exposure, by the particularities of floral sources, and by differences between areas or harvesting periods. In the research conducted by [35], Pb was detected in the analyzed samples, and the authors discussed the possibility that its presence may reflect local pollution and transfer from soil and plants to bee products. Therefore, the fact that in the present experiment most values for Pb, Cd, and Cr were below the detection limit supports the need for continuous monitoring of heavy metals but does not allow the formulation of robust statistical correlations for these elements.
Overall, the results of this study support the hypothesis that bee venom variability is the result of a complex interaction between nutrition, season, flora, and meteorological conditions. Supplementation with essential oils and probiotics may punctually modify certain venom components, especially some microelements or antioxidant activity; however, its effects are not uniform and may be masked by the stronger influence of natural foraging. Thus, venom quality depends not only on the technological interventions applied by the beekeeper, but also on the ecological context in which the colony develops.
From an applied perspective, these results are important for the standardization of bee venom harvesting and valorization. For the use of venom in apitherapy, pharmacy, or cosmetics, it is necessary to know the factors that can modify pH, amino acid content, the mineral fraction, and contaminant levels. Previous studies have shown that venom has anti-inflammatory, antimicrobial, antioxidant, and therapeutic potential, but its composition may vary depending on season, species, floral source, and harvesting method [8,9,10,26]. Therefore, integrating meteorological data with the physicochemical and mineral profile of venom may contribute to establishing optimal harvesting periods and obtaining a more predictable product from a qualitative point of view.
By correlating the results from 2024 and 2025, the present study completes the existing data regarding the influence of nutritional and climatic factors on bee venom. The comparison of the two years highlights that some venom components are relatively stable, such as pH, while others, such as ash, total amino acids, macroelements, and microelements, are more sensitive to environmental conditions and food source. At the same time, the lack of statistical processing for Pb, Cd, and Cr, determined by values mostly below the detection limit, represents a methodological limitation, but also a relevant result regarding the low level of contamination in the analyzed samples. In conclusion, bee venom can be considered both a valuable bee product and a useful biological matrix for evaluating the interaction between colony nutrition, floral resources, and local climatic conditions.
5. Conclusions
The present study showed that bee venom is a complex biological product whose physicochemical and mineral composition is influenced by the interaction between nutritional regime, floral source, experimental year, and meteorological conditions during the harvesting period. The comparison between the 2024 and 2025 datasets indicated that pH was one of the most stable parameters, whereas moisture, dry matter, ash, total amino acids, and the mineral profile showed greater variability in relation to seasonal conditions and available trophic resources.
Variations in bee venom composition were observed across nutritional treatments and harvesting periods in both experimental years. Although certain differences were associated with supplementation strategies, their magnitude and direction were not consistent across all experimental variants. The rapeseed and acacia foraging periods were also characterized by changes in several physicochemical and mineral parameters. However, because floral resource availability, harvesting period, and meteorological conditions varied simultaneously, their individual contributions could not be fully distinguished. These findings suggest that bee venom composition may reflect the combined influence of nutritional management and environmental conditions, rather than the isolated effect of a single factor.
The mineral profile of bee venom was dominated by potassium, calcium, magnesium, and phosphorus, while Fe, Mn, Cu, and Zn were the main microelements identified. The differences observed between years indicate that mineral elements reflect both the mineral availability of floral resources and local pedoclimatic conditions. Pearson correlation analysis further showed that temperature, relative humidity, and VPD may be associated with changes in venom quality parameters, particularly in 2025, supporting the relevance of climatic monitoring in studies on bee venom composition.
Most values recorded for Pb, Cd, and Cr were below the detection limit of the analytical method, preventing robust statistical comparisons or correlation analyses for these elements. Although this represents a methodological limitation, it also suggests a low level of contamination in most analyzed samples. Overall, the results indicate that bee venom may be considered both a valuable apicultural product and a sensitive biological matrix for evaluating the interaction between colony nutrition, floral resources, and local climatic conditions. These findings may support the optimization of harvesting practices and the quality standardization of bee venom under variable climatic conditions.
Supplementary Materials
The following supporting information can be downloaded at: https://www.mdpi.com/article/10.3390/app162211220/s1, Table S1. Monthly distribution of days according to daily mean temperature classes in 2024 and 2025; Table S2. Monthly distribution of days according to daily mean relative humidity classes in 2024 and 2025; Table S3. Monthly frequency of potentially favorable thermo-hygrometric conditions for beekeeping activity in 2024 and 2025; Table S4. Annual thermo-hygrometric indicators recorded in 2024 and 2025; Table S5. Summary of the statistical comparison of annual meteorological indicators between 2024 and 2025.
Author Contributions
Conceptualization, A.-D.R., I.R., A.B. and S.P.; methodology A.-D.R., I.R., A.B. and S.P.; validation, A.-D.R., I.R., A.B. and S.P.; formal analysis, A.-D.R., E.S., I.R., A.B. and S.P., statistical analysis, E.S., F.D.S., I.R. and A.B.; writing—original draft preparation, A.-D.R., I.R., A.B. and S.P.; writing—review and editing, A.-D.R., I.R., A.B. and S.P. All authors have read and agreed to the published version of the manuscript.
Funding
The publication of the present paper was supported by the University of Life Sciences “King Mihai I” from Timisoara, Romania.
Institutional Review Board Statement
Not applicable.
Informed Consent Statement
Not applicable.
Data Availability Statement
The original contributions presented in the study are included in the article. Further inquiries can be directed to the corresponding authors.
Acknowledgments
The authors would like to thank to the Doctoral School “Engineering of Vegetable and Animal Resources”, University of Life Sciences “King Mihai I” from Timişoara (Calea Aradului 119, 300645 Timişoara, Romania), for the academic support and resources provided throughout the development of this research.
Conflicts of Interest
The authors declare no conflicts of interest.
References
- Potts, S.G.; Imperatriz-Fonseca, V.; Ngo, H.T.; Aizen, M.A.; Biesmeijer, J.C.; Breeze, T.D.; Dicks, L.V.; Garibaldi, L.A.; Hill, R.; Settele, J.; et al. Safeguarding pollinators and their values to human well-being. Nature 2016, 540, 220–229. [Google Scholar] [CrossRef] [Scilit] [PubMed]
- Klein, A.-M.; Vaissière, B.E.; Cane, J.H.; Steffan-Dewenter, I.; Cunningham, S.A.; Kremen, C.; Tscharntke, T. Importance of pollinators in changing landscapes for world crops. Proc. R. Soc. B Biol. Sci. 2006, 274, 303–313. [Google Scholar] [CrossRef] [Scilit] [PubMed]
- Dicks, L.V.; Breeze, T.D.; Ngo, H.T.; Senapathi, D.; An, J.; Aizen, M.A.; Basu, P.; Buchori, D.; Galetto, L.; Garibaldi, L.A.; et al. A global-scale expert assessment of drivers and risks associated with pollinator decline. Nat. Ecol. Evol. 2021, 5, 1453–1461, Correction in Nat. Ecol. Evol. 2021, 5, 1462. [Google Scholar] [CrossRef] [Scilit] [PubMed]
- Tlak Gajger, I.; Mutinelli, F. Impact of Environmental Factors and Management Practices on Bee Health. Insects 2024, 15, 996. [Google Scholar] [CrossRef] [Scilit] [PubMed]
- Hellner, M.; Winter, D.; von Georgi, R.; Münstedt, K. Apitherapy: Usage and experience in german beekeepers. Evid.-Based Complement. Altern. Med. 2008, 5, 475–479. [Google Scholar] [CrossRef] [Scilit] [PubMed]
- Fratellone, P.M.; Tsimis, F.; Fratellone, G. Apitherapy Products for Medicinal Use. J. Altern. Complement. Med. 2016, 22, 1020–1022. [Google Scholar] [CrossRef] [Scilit] [PubMed]
- Isidorov, V.; Zalewski, A.; Zambrowski, G.; Swiecicka, I. Chemical Composition and Antimicrobial Properties of Honey Bee Venom. Molecules 2023, 28, 4135. [Google Scholar] [CrossRef] [Scilit] [PubMed]
- Ullah, A.; Aldakheel, F.M.; Anjum, S.I.; Raza, G.; Khan, S.A.; Tlak Gajger, I. Pharmacological properties and therapeutic potential of honey bee venom. Saudi Pharm. J. 2023, 31, 96–109. [Google Scholar] [CrossRef] [Scilit] [PubMed]
- Sadek, K.M.; Shib, N.A.; Taher, E.S.; Rashed, F.; Shukry, M.; Atia, G.A.; Taymour, N.; El-Nablaway, M.; Ibrahim, A.M.; Ramadan, M.M.; et al. Harnessing the power of bee venom for therapeutic and regenerative medical applications: An updated review. Front. Pharmacol. 2024, 15, 1412245. [Google Scholar] [CrossRef] [Scilit] [PubMed]
- Wehbe, R.; Frangieh, J.; Rima, M.; El Obeid, D.; Sabatier, J.M.; Fajloun, Z. Bee Venom: Overview of Main Compounds and Bioactivities for Therapeutic Interests. Molecules 2019, 24, 2997. [Google Scholar] [CrossRef] [Scilit] [PubMed]
- Azam, M.N.K.; Ahmed, M.N.; Biswas, S.; Ara, N.; Rahman, D.M.M.; Hirashima, A.; Hasan, D.M.N. A Review on Bioactivities of Honey Bee Venom. Annu. Res. Rev. Biol. 2019, 30, 1–13. [Google Scholar] [CrossRef] [Scilit]
- Silva, J.; Monge-Fuentes, V.; Gomes, F.; Lopes, K.; dos Anjos, L.; Campos, G.; Arenas, C.; Biolchi, A.; Gonçalves, J.; Galante, P.; et al. Pharmacological Alternatives for the Treatment of Neurodegenerative Disorders: Wasp and Bee Venoms and Their Components as New Neuroactive Tools. Toxins 2015, 7, 3179–3209. [Google Scholar] [CrossRef] [Scilit] [PubMed]
- Zapata-Hernández, G.; Gajardo-Rojas, M.; Calderón-Seguel, M.; Muñoz, A.A.; Yáñez, K.P.; Requier, F.; Fontúrbel, F.E.; Ormeño-Arriagada, P.I.; Arrieta, H. Advances and knowledge gaps on climate change impacts on honey bees and beekeeping: A systematic review. Glob. Change Biol. 2024, 30, e17219. [Google Scholar] [CrossRef] [Scilit] [PubMed]
- Oddie, M.A.Y.; Dahle, B. One for all and all for one: A review on the commonality of risk to honeybees and wild pollinators and the benefits of beekeepers in conservation. Front. Bee Sci. 2024, 2, 1305679. [Google Scholar] [CrossRef] [Scilit]
- Rășinar, A.-D.; Grozea, A.; Boldea, M.; Polen, T.; Pătruică, S. Use Supplementary Feedings on Bee Colony Development and Venom Production. Sci. Pap. Anim. Sci. Biotechnol. 2024, 57, 251. [Google Scholar]
- Kazenel, M.R.; Wright, K.W.; Griswold, T.; Whitney, K.D.; Rudgers, J.A. Heat and desiccation tolerances predict bee abundance under climate change. Nature 2024, 628, 342–348. [Google Scholar] [CrossRef] [Scilit] [PubMed]
- Owen, M.D.; Pfaff, L.A.; Reisman, R.E.; Wypych, J. Phospholipase A2 in venom extracts from honey bees (Apis mellifera L.) of different ages. Toxicon 1990, 28, 813–820. [Google Scholar] [CrossRef] [Scilit] [PubMed]
- Owen, M.D.; Sloley, B.D. 5-Hydroxytryptamine in the venom of the honey bee (Apis mellifera L.): Variation with season and with insect age. Toxicon 1988, 26, 577–581. [Google Scholar] [CrossRef] [Scilit] [PubMed]
- Goulson, D.; Nicholls, E.; Botías, C.; Rotheray, E.L. Bee declines driven by combined stress from parasites, pesticides, and lack of flowers. Science 2015, 347, 1255957. [Google Scholar] [CrossRef] [Scilit] [PubMed]
- Schmidt, J.O. Toxinology of venoms from the honeybee genus Apis. Toxicon 1995, 33, 917–927. [Google Scholar] [CrossRef] [Scilit] [PubMed]
- Dotimas, E.M.; Hider, R.C. Honeybee Venom. Bee World 1987, 68, 51–70. [Google Scholar] [CrossRef] [Scilit]
- Hider, R.C. Honeybee venom: A rich source of pharmacologically active peptides. Endeavour 1988, 12, 60–65. [Google Scholar] [CrossRef] [Scilit] [PubMed]
- Klupczynska, A.; Plewa, S.; Dereziński, P.; Garrett, T.J.; Rubio, V.Y.; Kokot, Z.J.; Matysiak, J. Identification and quantification of honeybee venom constituents by multiplatform metabolomics. Sci. Rep. 2020, 10, 21645. [Google Scholar] [CrossRef] [Scilit] [PubMed]
- Scaccabarozzi, D.; Dods, K.; Le, T.T.; Gummer, J.P.A.; Lussu, M.; Milne, L.; Campbell, T.; Wafujian, B.P.; Priddis, C. Factors driving the compositional diversity of Apis mellifera bee venom from a Corymbia calophylla (marri) ecosystem, Southwestern Australia. PLoS ONE 2021, 16, e0253838. [Google Scholar] [CrossRef] [Scilit] [PubMed]
- Benton, A.W.; Morse, R.A.; Stewart, J.D. Venom Collection from Honey Bees. Science 1963, 142, 228–230. [Google Scholar] [CrossRef] [Scilit] [PubMed]
- de Graaf, D.C.; Brochetto Braga, M.R.; de Abreu, R.M.M.; Blank, S.; Bridts, C.H.; De Clerck, L.S.; Devreese, B.; Ebo, D.G.; Ferris, T.J.; Hagendorens, M.M.; et al. Standard methods for Apis mellifera venom research. J. Apic. Res. 2021, 60, 1–31. [Google Scholar] [CrossRef] [Scilit]
- Gernt, P.; Dittes, J.; Vervuert, I.; Emmerich, I.U. Review: Nutritional Needs of Honeybees and Legislation on Apiculture By-Products in Animal Nutrition. Animals 2024, 14, 2208. [Google Scholar] [CrossRef] [Scilit] [PubMed]
- Pătruică, S.; Dumitrescu, G.; Popescu, R.; Filimon, N.M. The effect of prebiotic and probiotic products used in feed to stimulate the bee colony (Apis mellifera) on intestines of working bees. J. Food Agric. Environ. 2013, 11, 2461–2464. [Google Scholar]
- Borges, D.; Guzman-Novoa, E.; Goodwin, P.H. Effects of Prebiotics and Probiotics on Honey Bees (Apis mellifera) Infected with the Microsporidian Parasite Nosema ceranae. Microorganisms 2021, 9, 481. [Google Scholar] [CrossRef] [Scilit] [PubMed]
- Hasan, A.; Iqbal Qazi, J.; Tabssum, F.; Hussain, A. Increased bee venom production in Apis mellifera workers on the provision of probiotics and organic acids. Biocatal. Agric. Biotechnol. 2023, 48, 102616. [Google Scholar] [CrossRef] [Scilit]
- Pătruică, S.; Mot, D. The effect of using prebiotic and probiotic products on intestinal micro-flora of the honeybee (Apis mellifera carpatica). Bull. Entomol. Res. 2012, 102, 619–623. [Google Scholar] [CrossRef] [Scilit] [PubMed]
- Martin Ewert, A.; Simone-Finstrom, M.; Read, Q.; Husseneder, C.; Ricigliano, V. Effects of ingested essential oils and propolis extracts on honey bee (Hymenoptera: Apidae) health and gut microbiota. J. Insect Sci. 2023, 23, 15. [Google Scholar] [CrossRef] [Scilit] [PubMed]
- Sultana, N.; Reza, M.E.; Alam, M.N.; Siddiquee, M.N.A.; Islam, M.S.; Rahman, M.A.; Sayed, M.A.; Rahman, M.M. Evaluating the efficiency of supplementary feeding as a management strategy for enhancing honeybee (Apis mellifera L.) colony growth and productivity. Front. Bee Sci. 2024, 2, 1386799. [Google Scholar] [CrossRef] [Scilit]
- Zarić, N.M.; Brodschneider, R.; Goessler, W. Honey bees as biomonitors–Variability in the elemental composition of individual bees. Environ. Res. 2022, 204, 112237. [Google Scholar] [CrossRef] [Scilit] [PubMed]
- Rășinar, A.D.; Radulov, I.; Berbecea, A.; Floares, D.; Vicar, N.; Simiz, E.; Dragomirescu, M.; Pătruică, S. Assessing the Influence of Stimulatory Feeding of Bee Colonies on Mineral Composition and Antioxidant Activity of Bee Venom. Insects 2025, 16, 423. [Google Scholar] [CrossRef] [Scilit] [PubMed]
- Rășinar, A.-D.; Radulov, I.; Berbecea, A.; Pătruică, S. Physico-Chemical and Mineral Variability of Apis mellifera Bee Venom Across Seasons and Feeding Regimes. Molecules 2026, 31, 1834. [Google Scholar] [CrossRef] [Scilit] [PubMed]
- El Mehdi, I.; Falcão, S.I.; Boujraf, S.; Mustapha, H.; Campos, M.G.; Vilas-Boas, M. Analytical methods for honeybee venom characterization. J. Adv. Pharm. Technol. Res. 2022, 13, 154–160. [Google Scholar] [CrossRef] [Scilit] [PubMed]
- Sabo, R.; Staroň, M.; Sabová, L.; Jančo, I.; Tomka, M.; Árvay, J. Toxic and essential elements in honeybee venom from Slovakia: Potential health risk to humans. Heliyon 2024, 10, e39282. [Google Scholar] [CrossRef] [Scilit] [PubMed]
- Ansaloni, L.S.; Kristl, J.; Domingues, C.E.C.; Gregorc, A. An Overview of the Nutritional Requirements of Honey Bees (Apis mellifera Linnaeus, 1758). Insects 2025, 16, 97. [Google Scholar] [CrossRef] [Scilit] [PubMed]
- Gunasekara, P.; Handunnetti, S.M.; Premawansa, S.; Dasanayake, W.M.D.K.; Ratnayake, I.P.; Dias, R.K.S.; Premakumara, G.A.S.; Seneviratne, S.L.; de Silva, R. Impact of environmental factors on Apis dorsata (giant Asian honeybee) venom in Bandarawela, Sri Lanka. Toxicon 2024, 252, 108163. [Google Scholar] [CrossRef] [Scilit] [PubMed]
- Conti, M.E.; Botrè, F. Honeybees and their products as potential bioindicators of heavy metals contamination. Environ. Monit. Assess. 2001, 69, 267–282. [Google Scholar] [CrossRef] [Scilit] [PubMed]
- Mair, K.S.; Irrgeher, J.; Haluza, D. Elucidating the Role of Honey Bees as Biomonitors in Environmental Health Research. Insects 2023, 14, 874. [Google Scholar] [CrossRef] [Scilit] [PubMed]
- Zavrtnik, S.; Loborec, J.; Kapelj, S.; Grčić, I. Environmental Biomonitoring of Heavy and Toxic Metals Using Honeybees and Their Products—An Overview of Previous Research. Sustainability 2024, 16, 8526. [Google Scholar] [CrossRef] [Scilit]
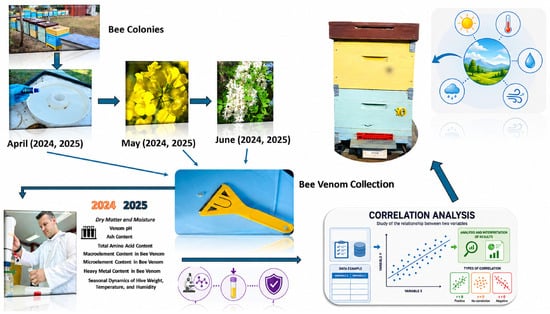
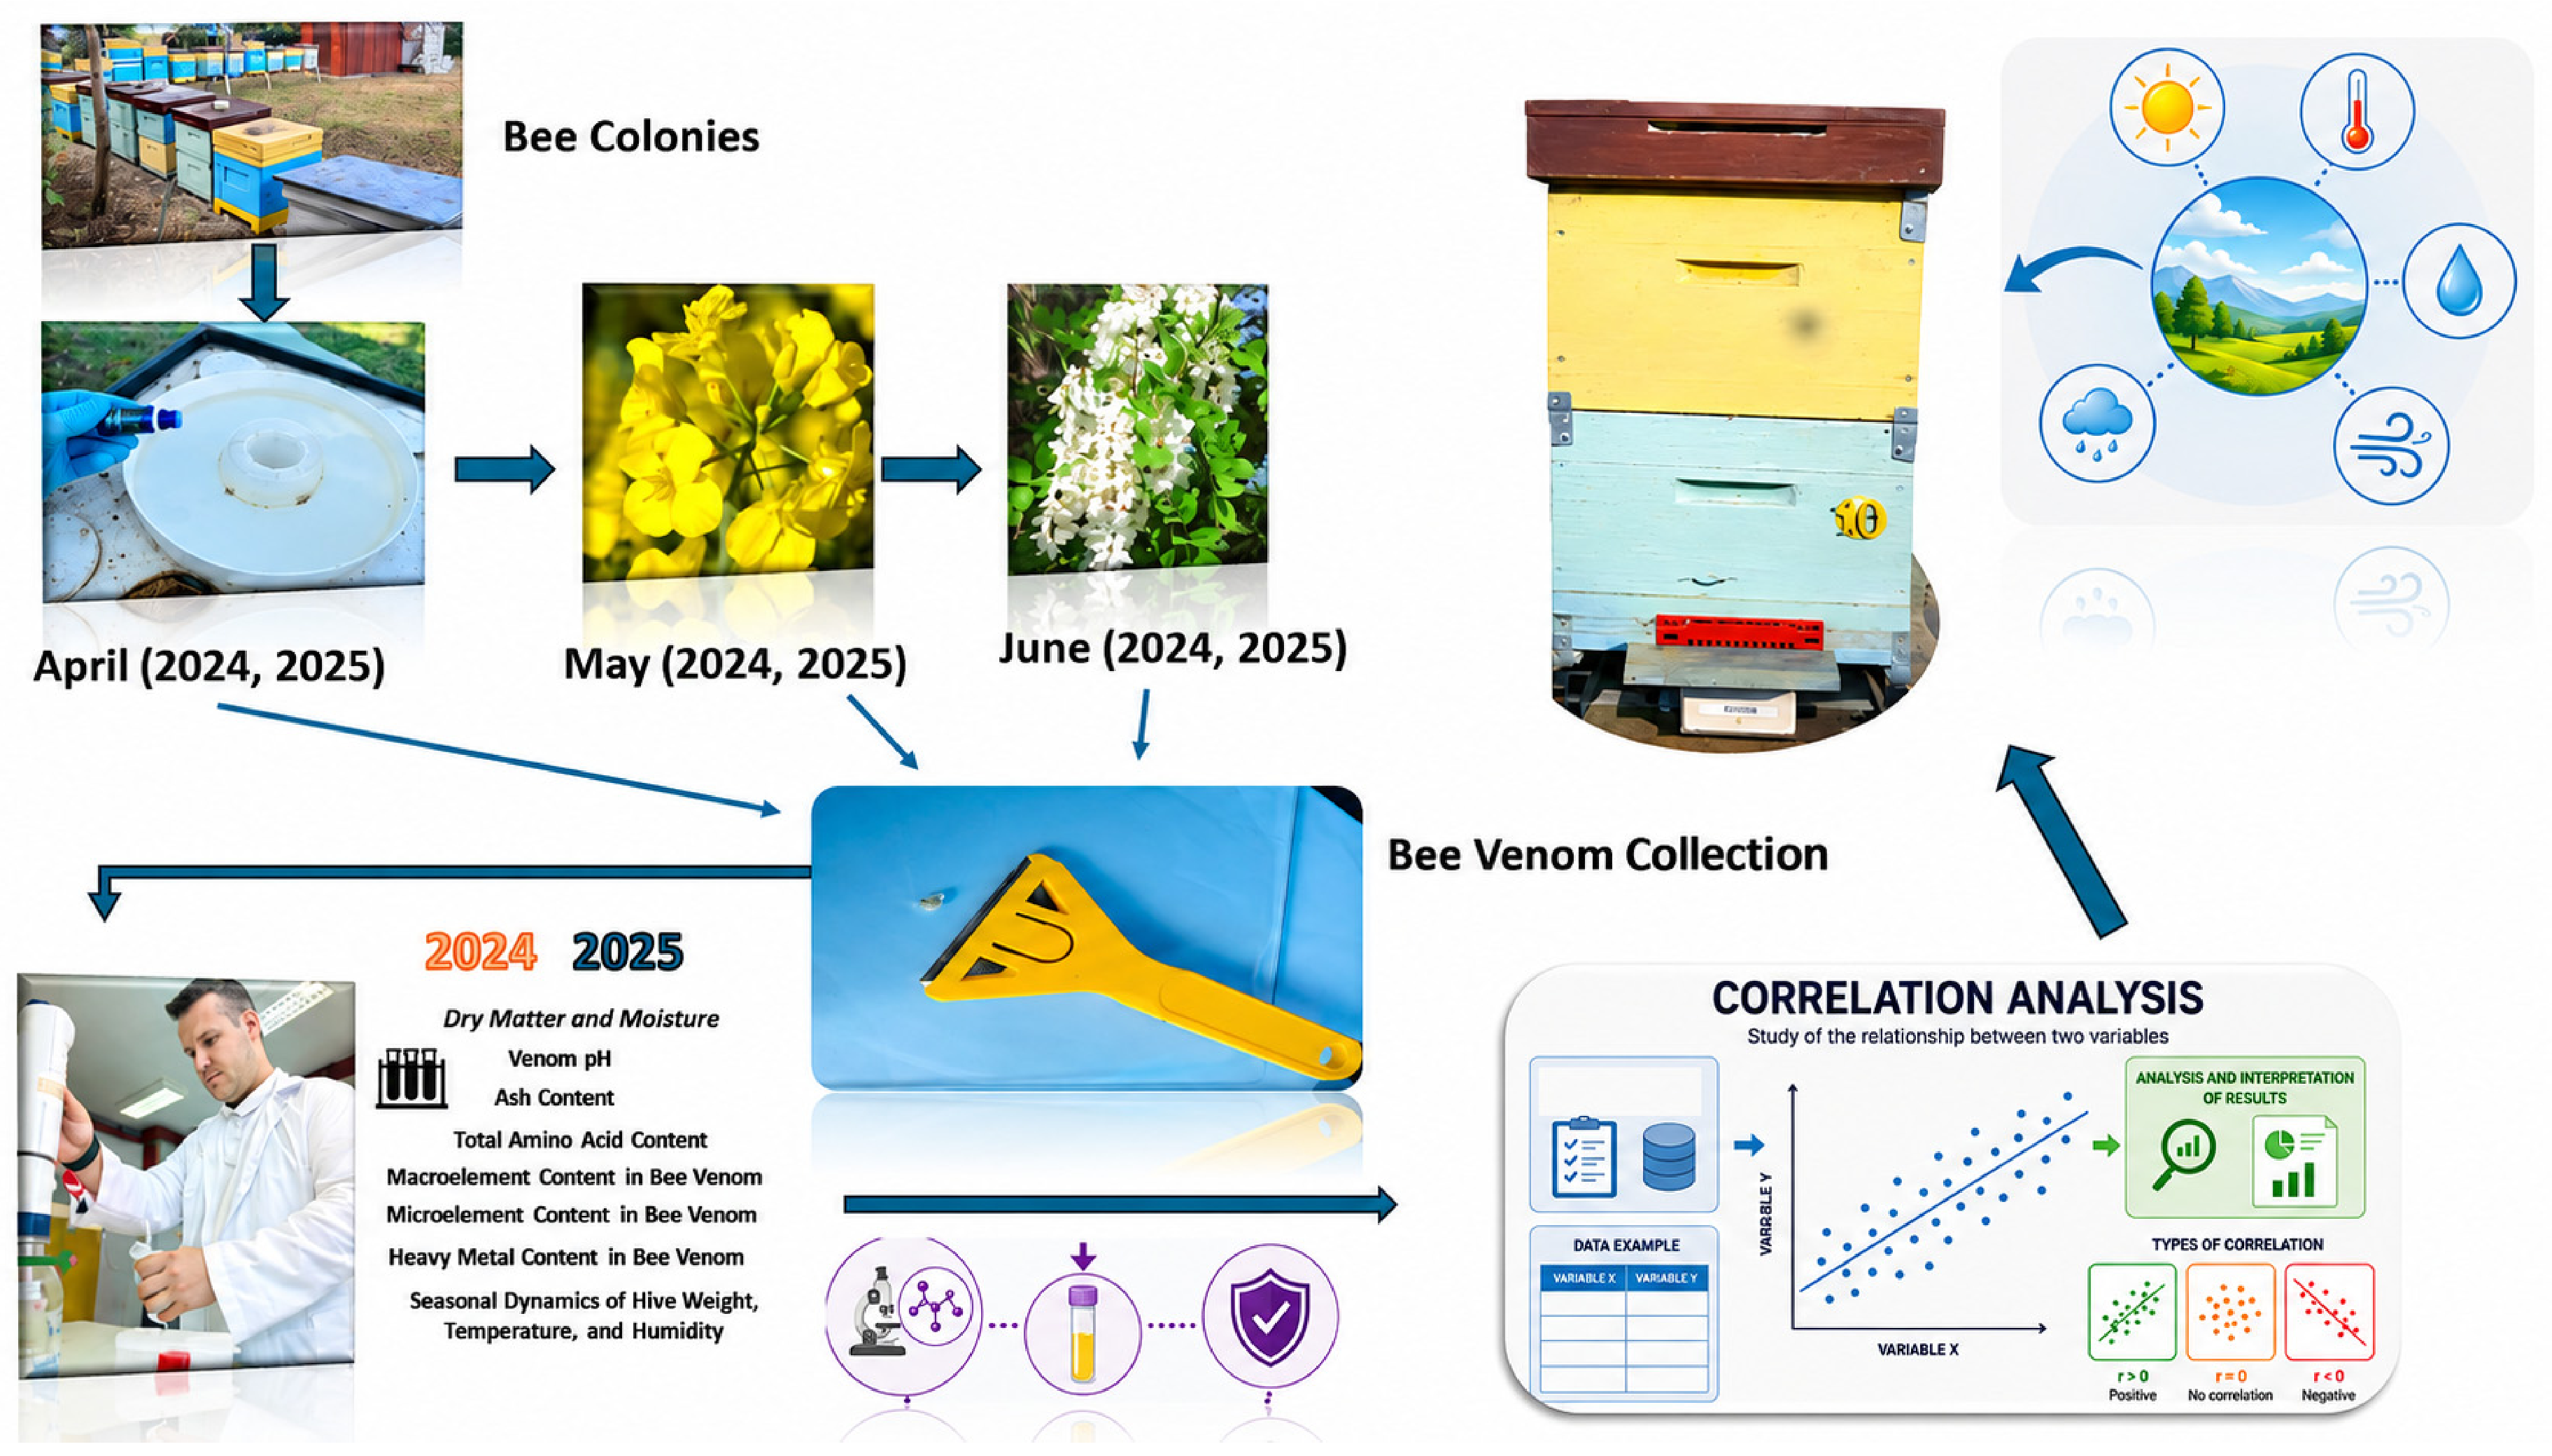
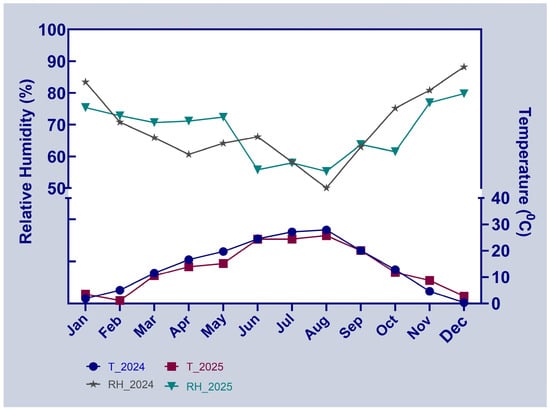
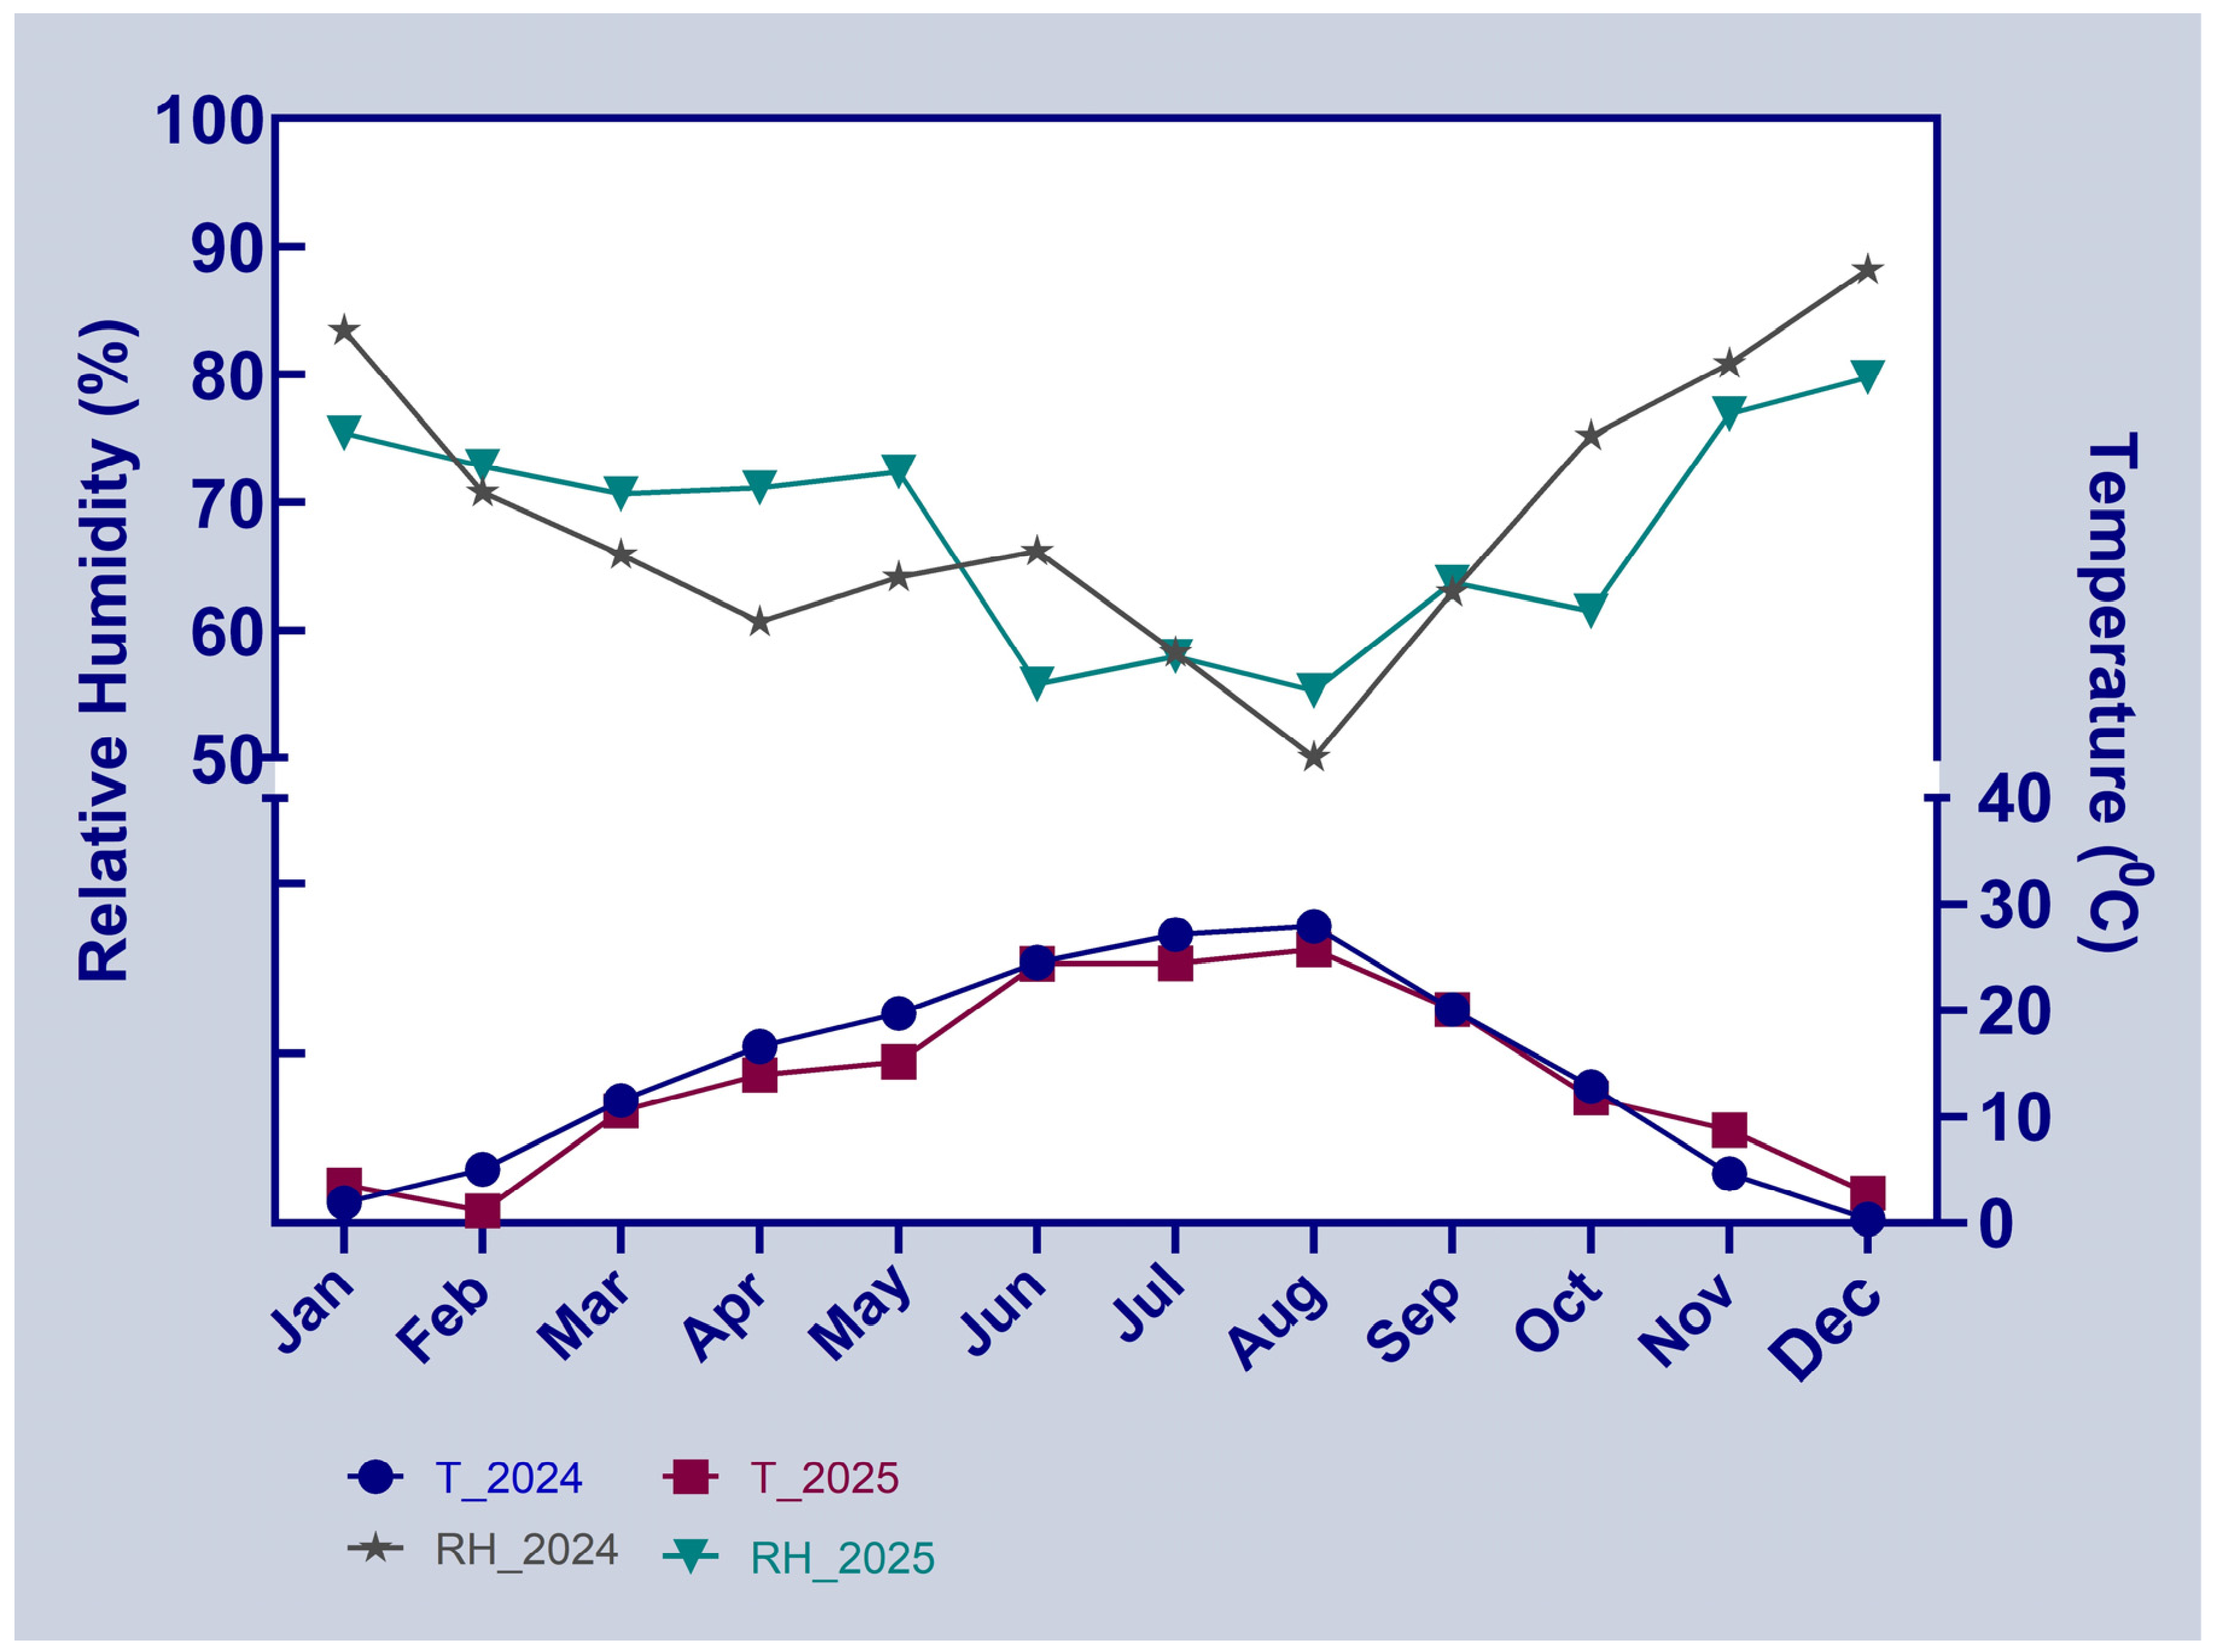
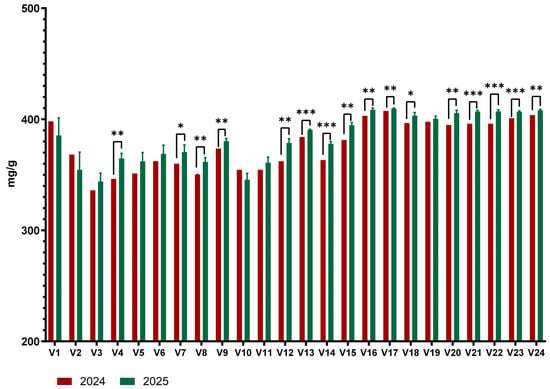
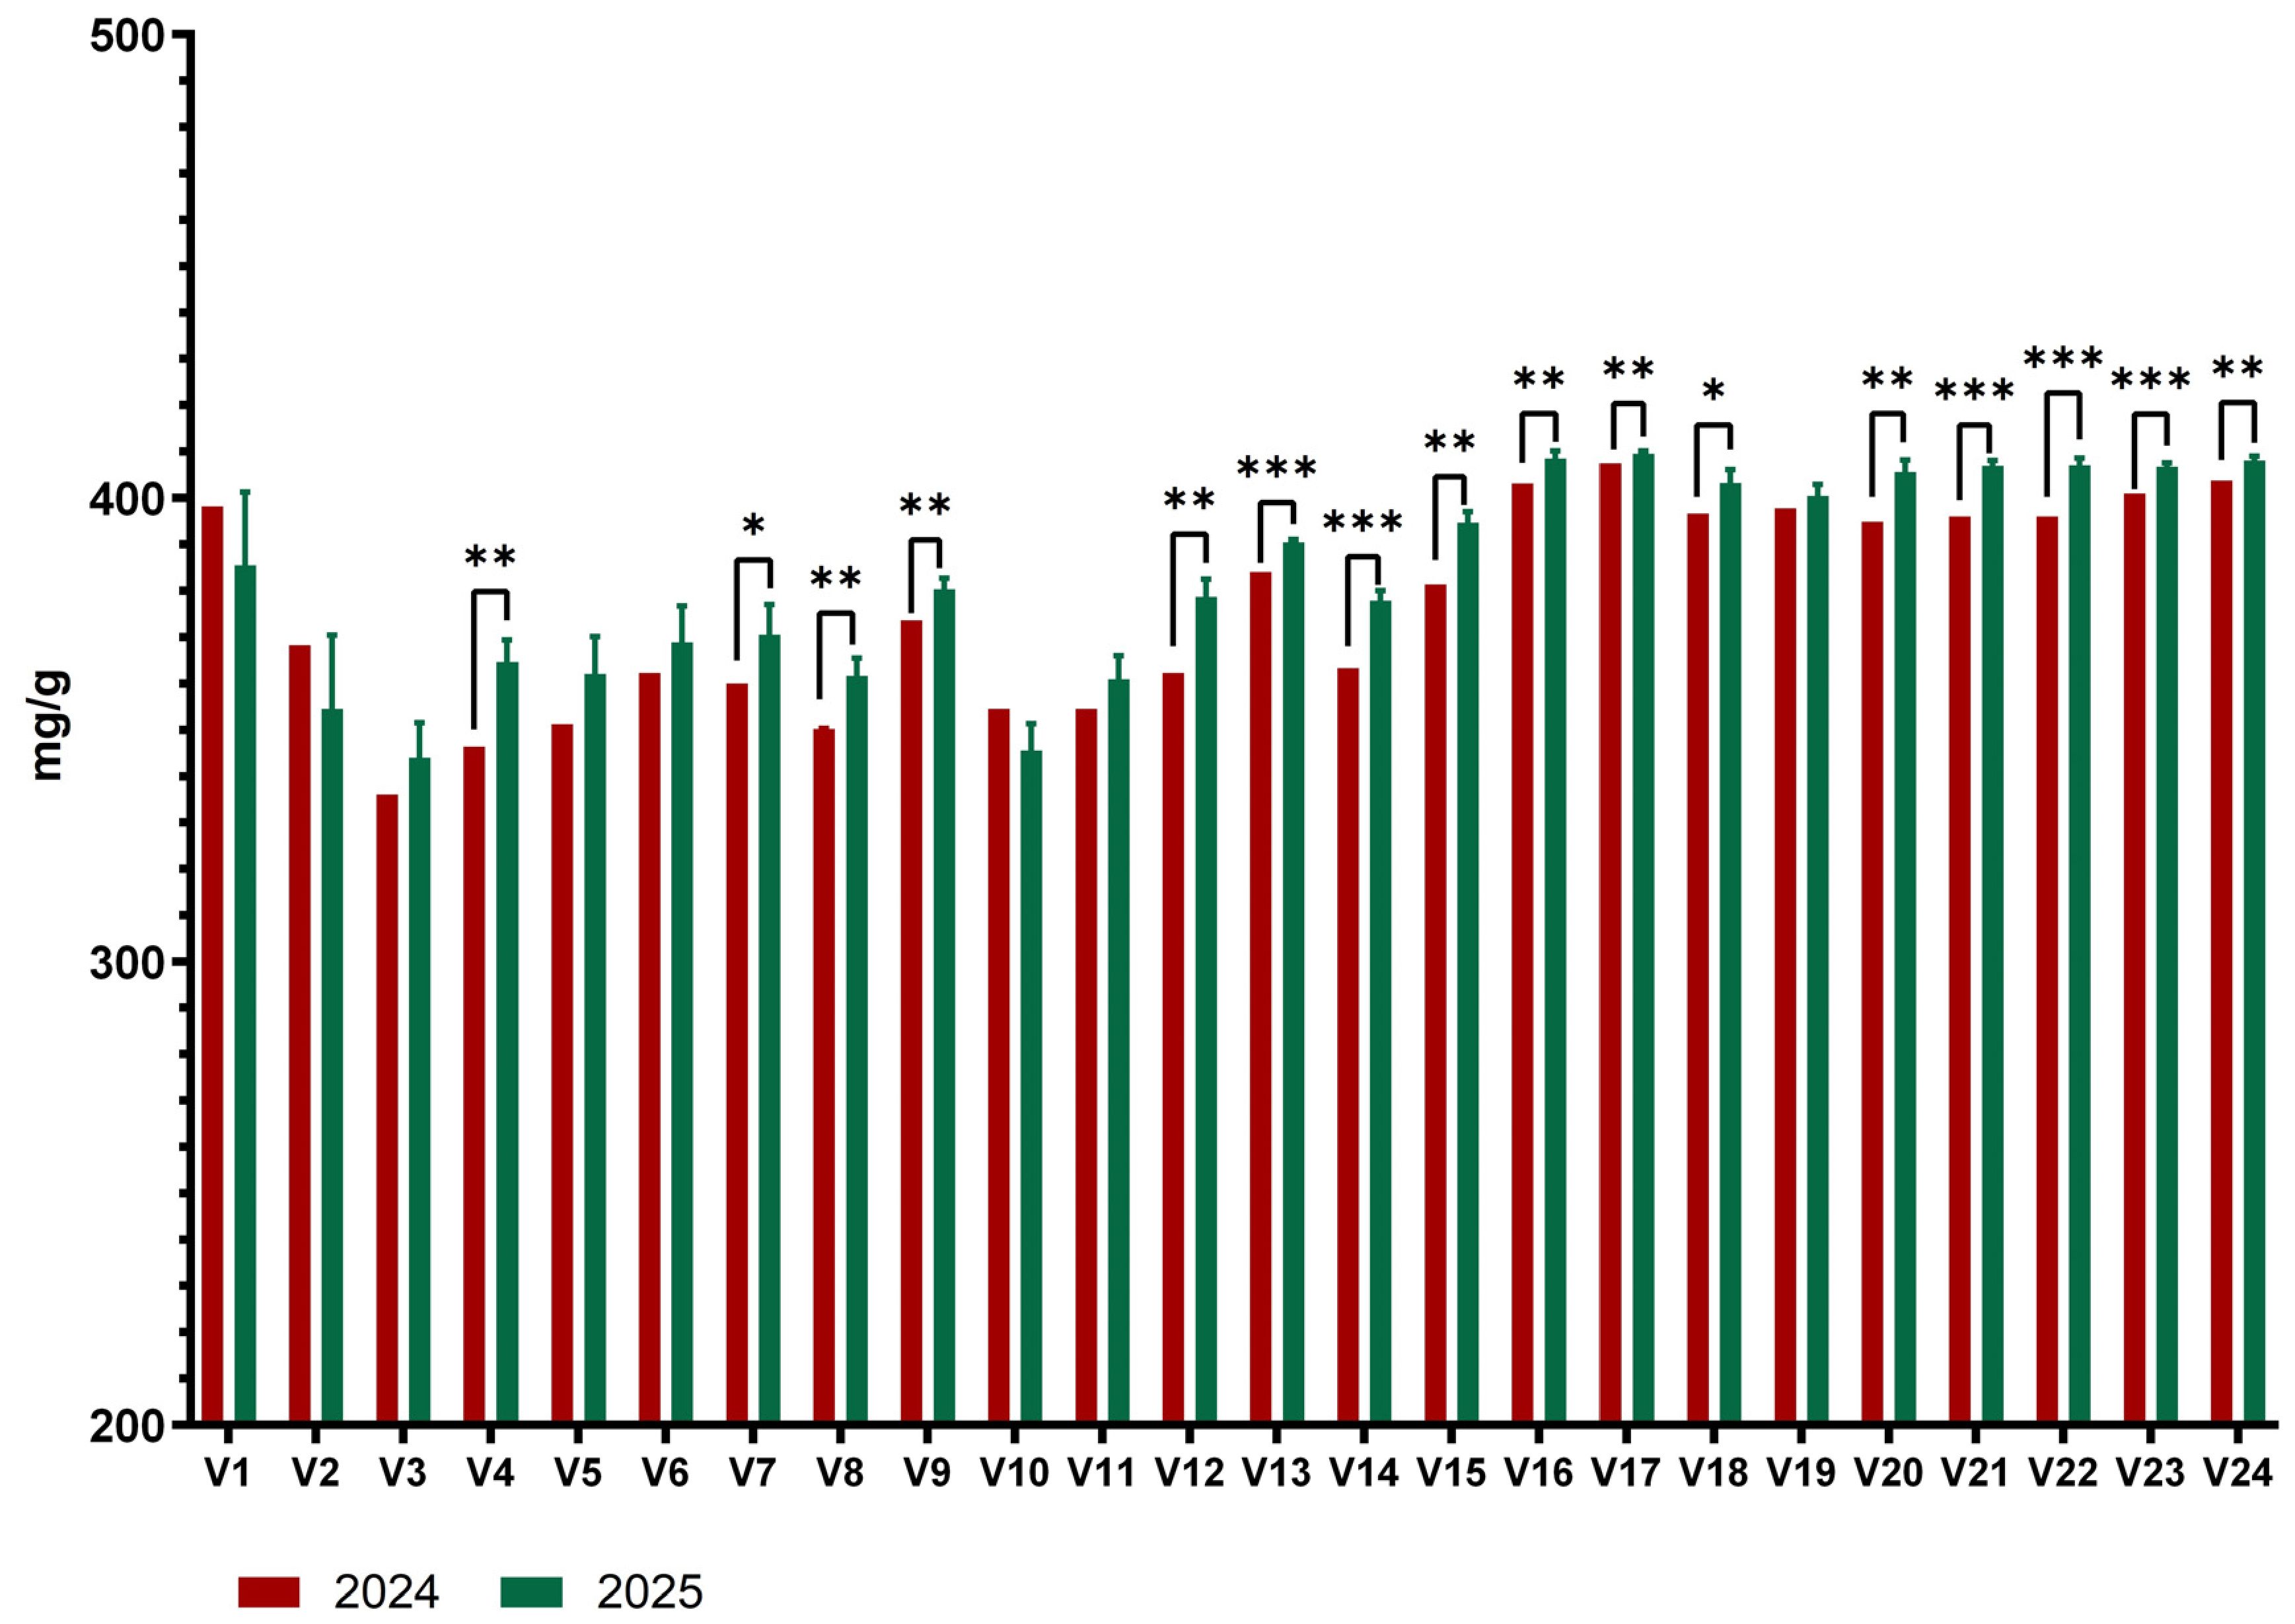
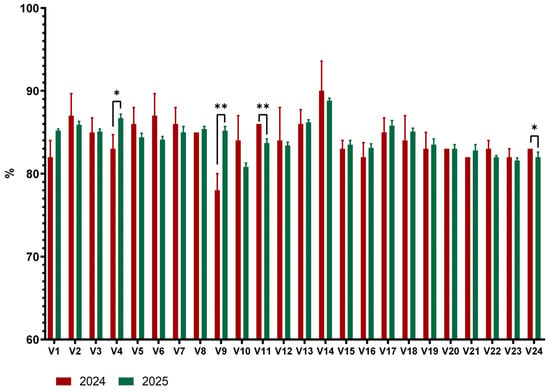
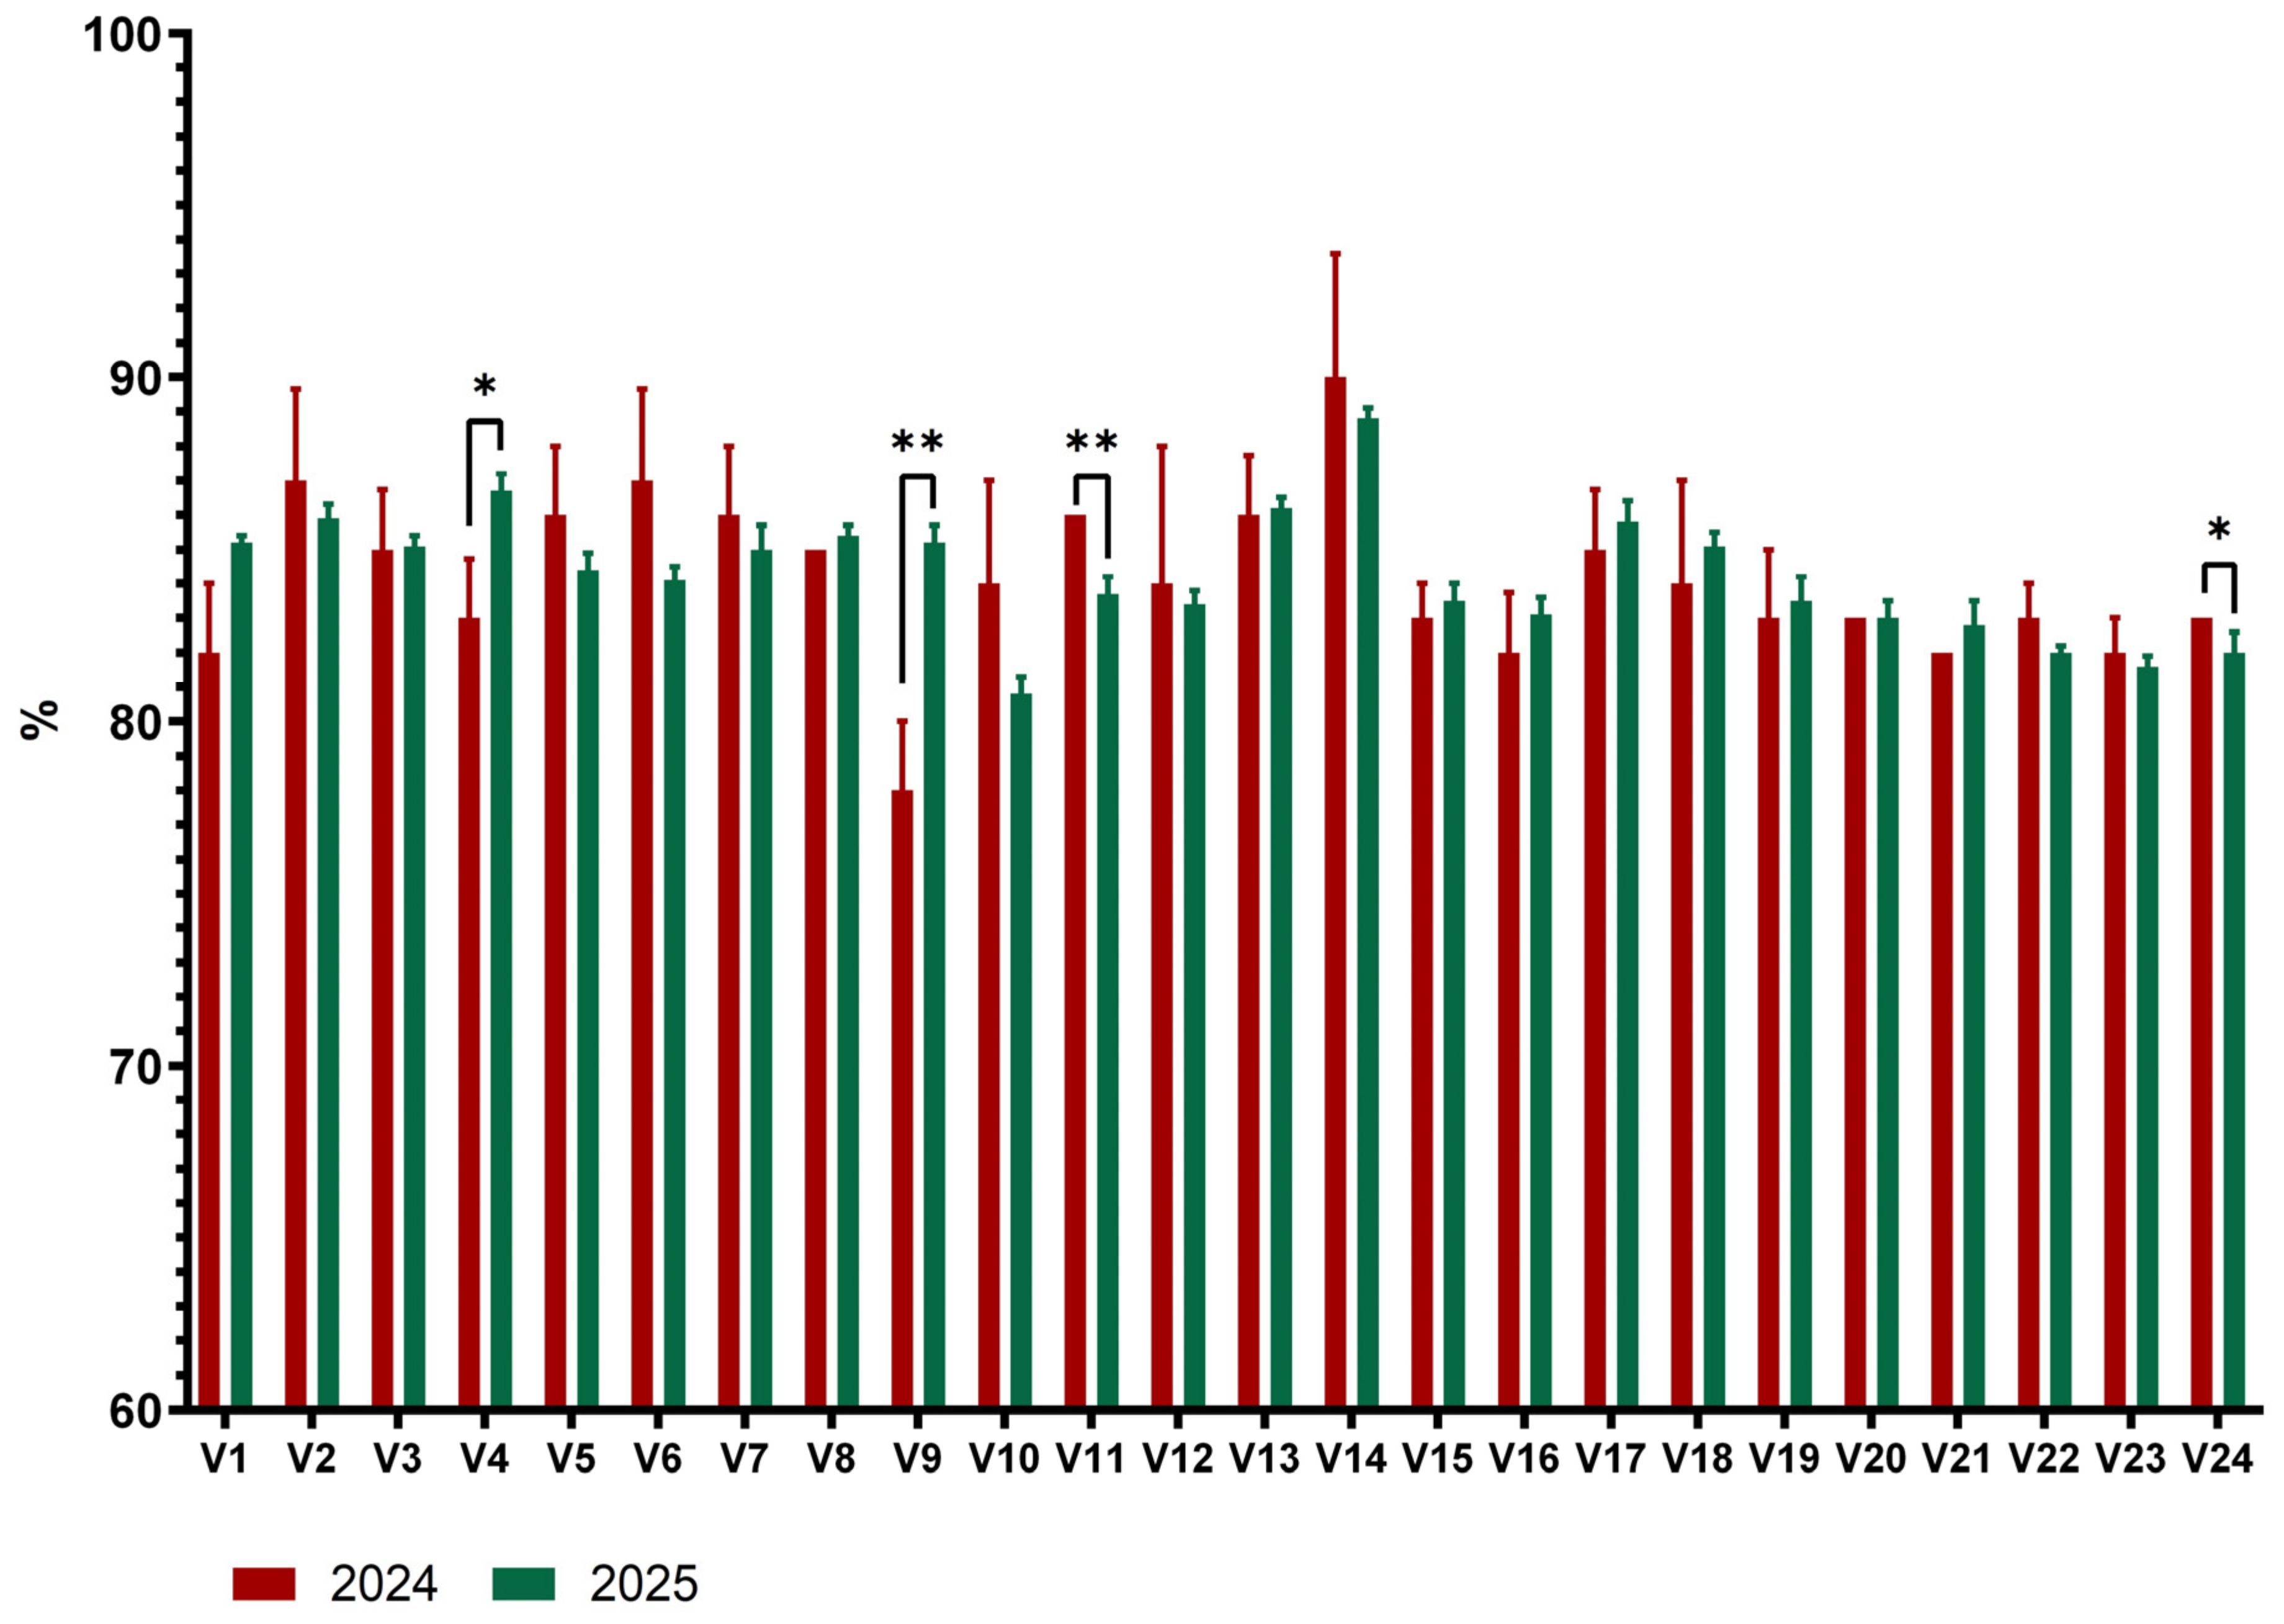
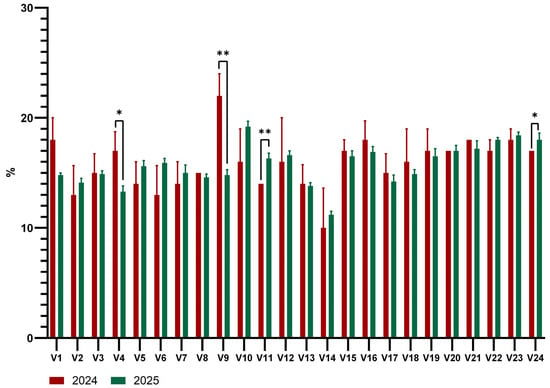
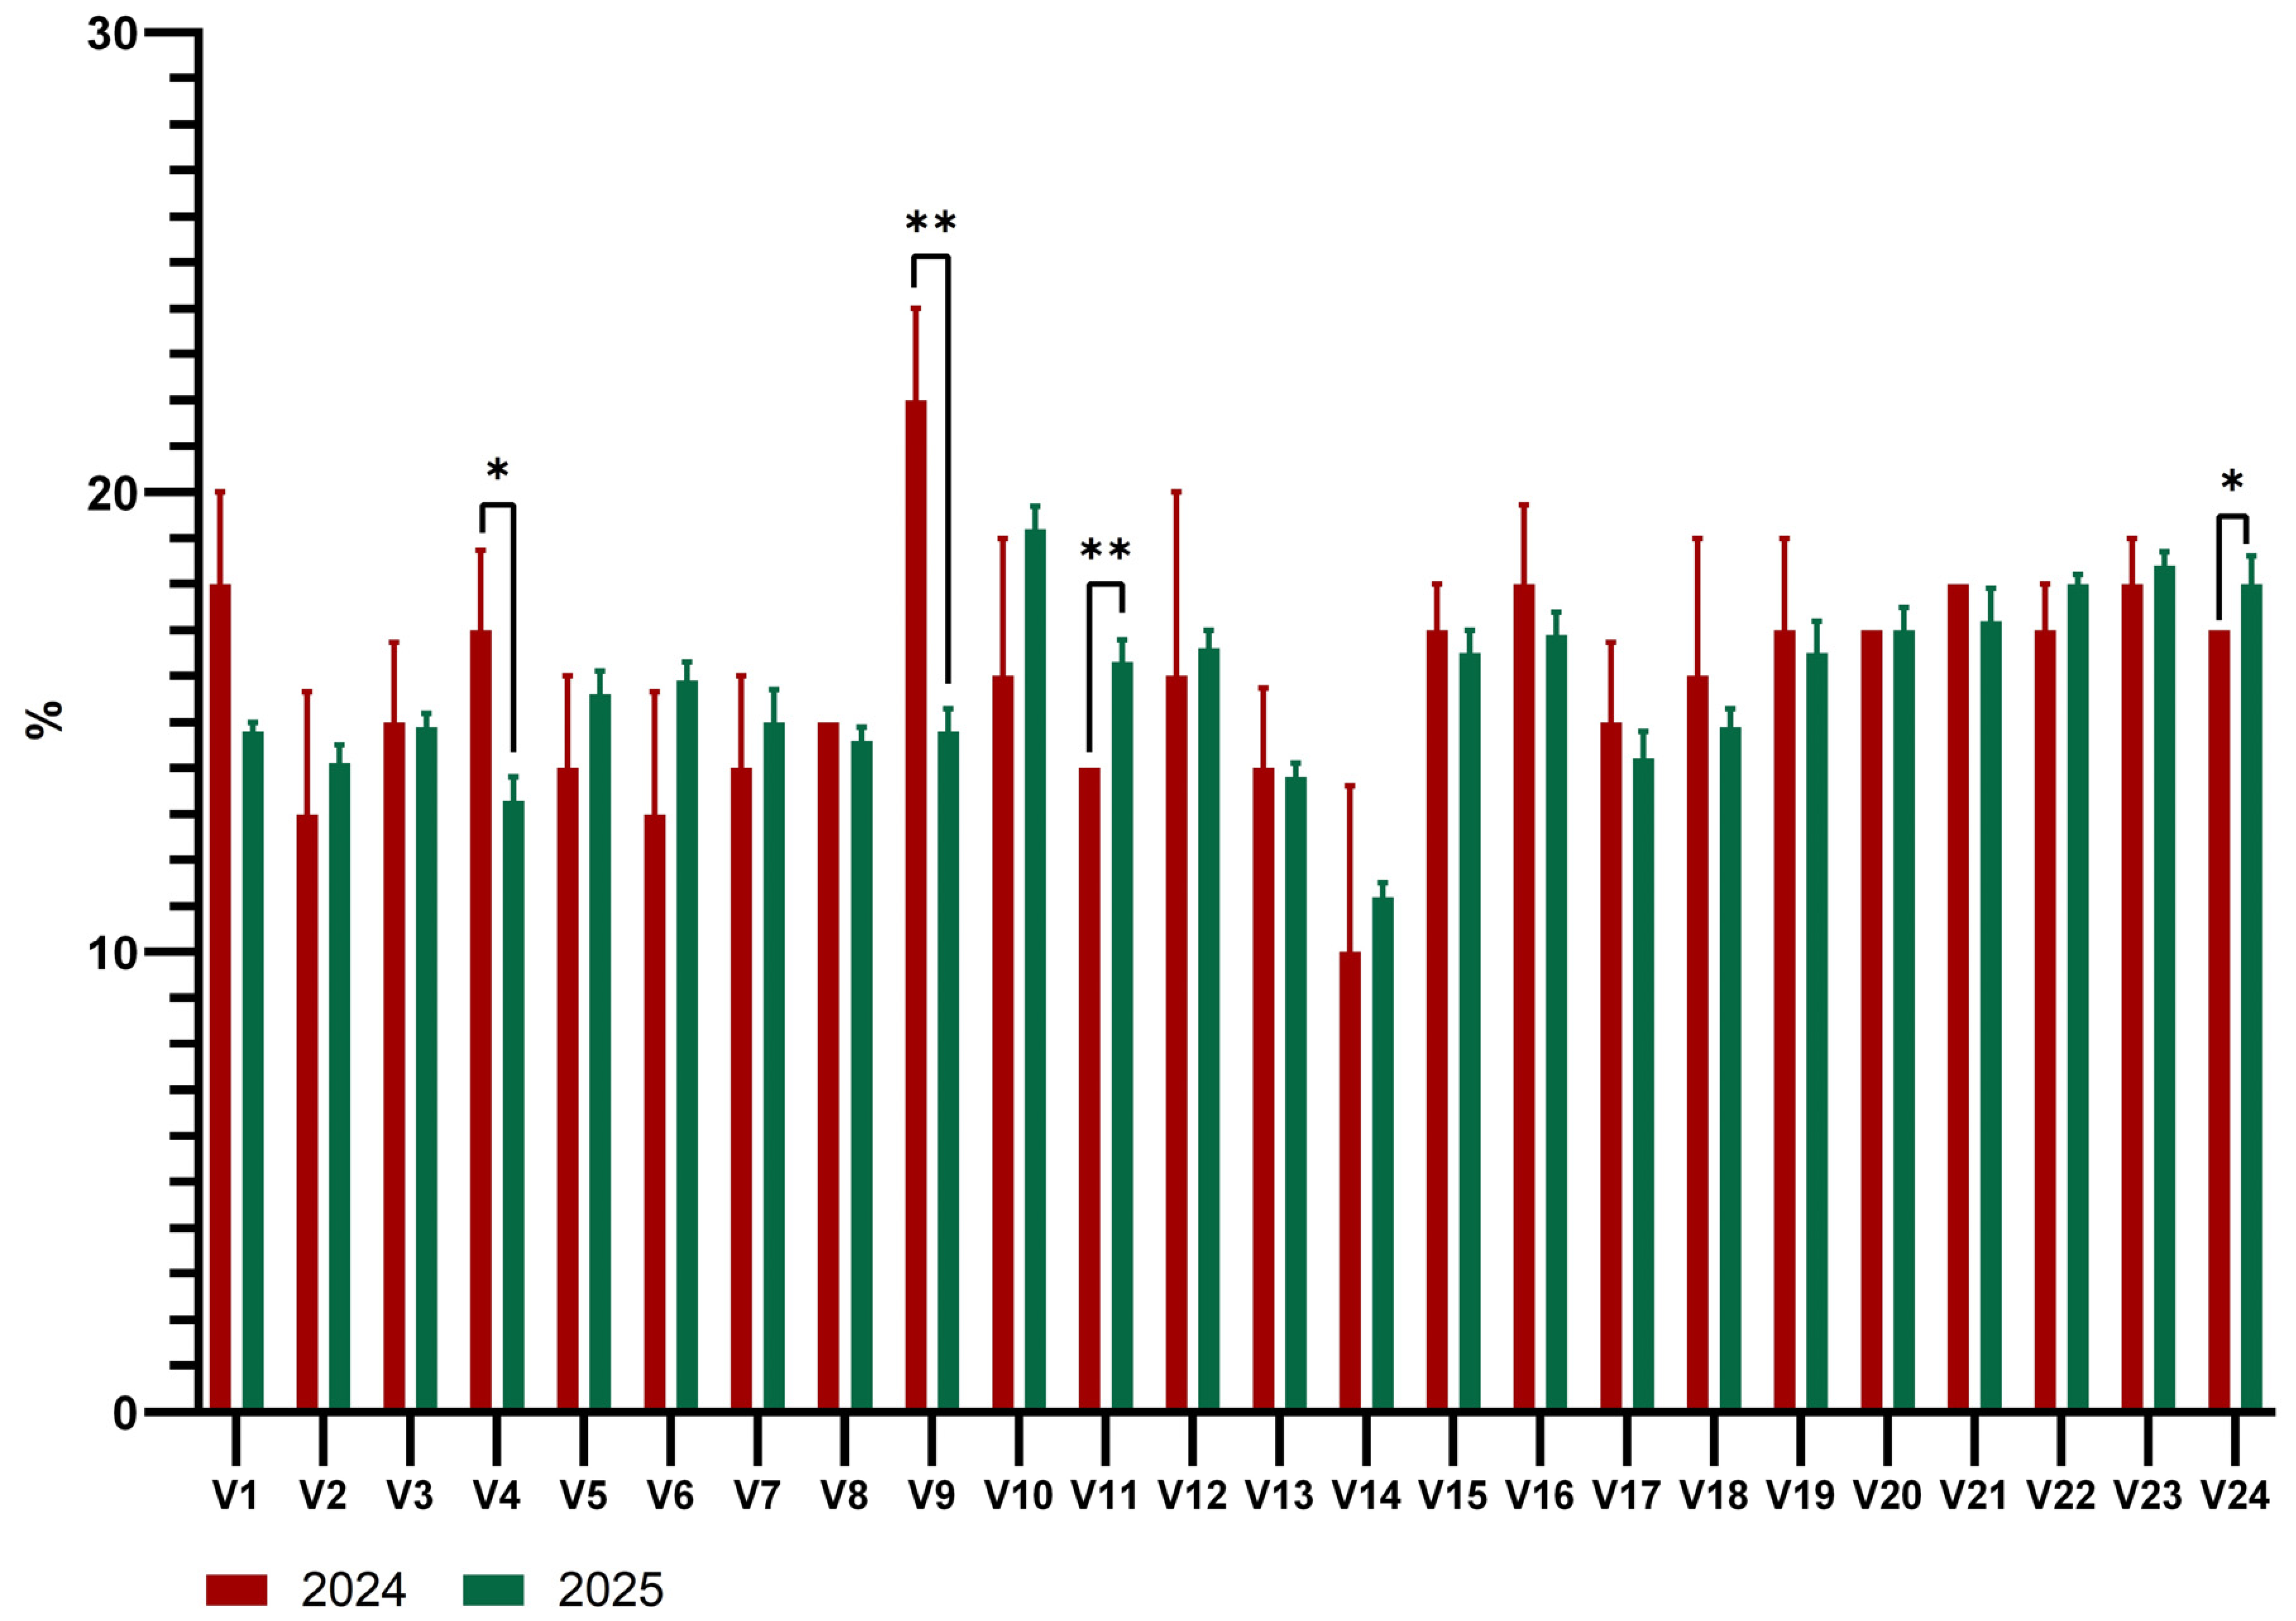
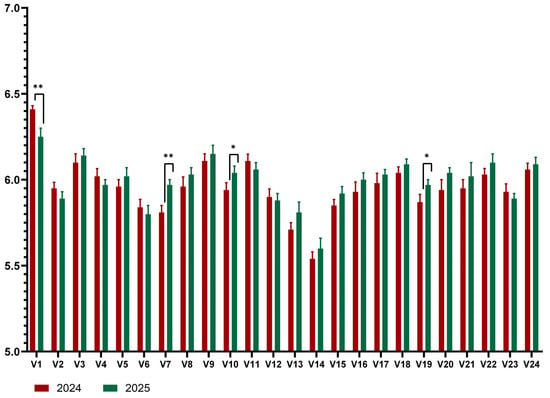
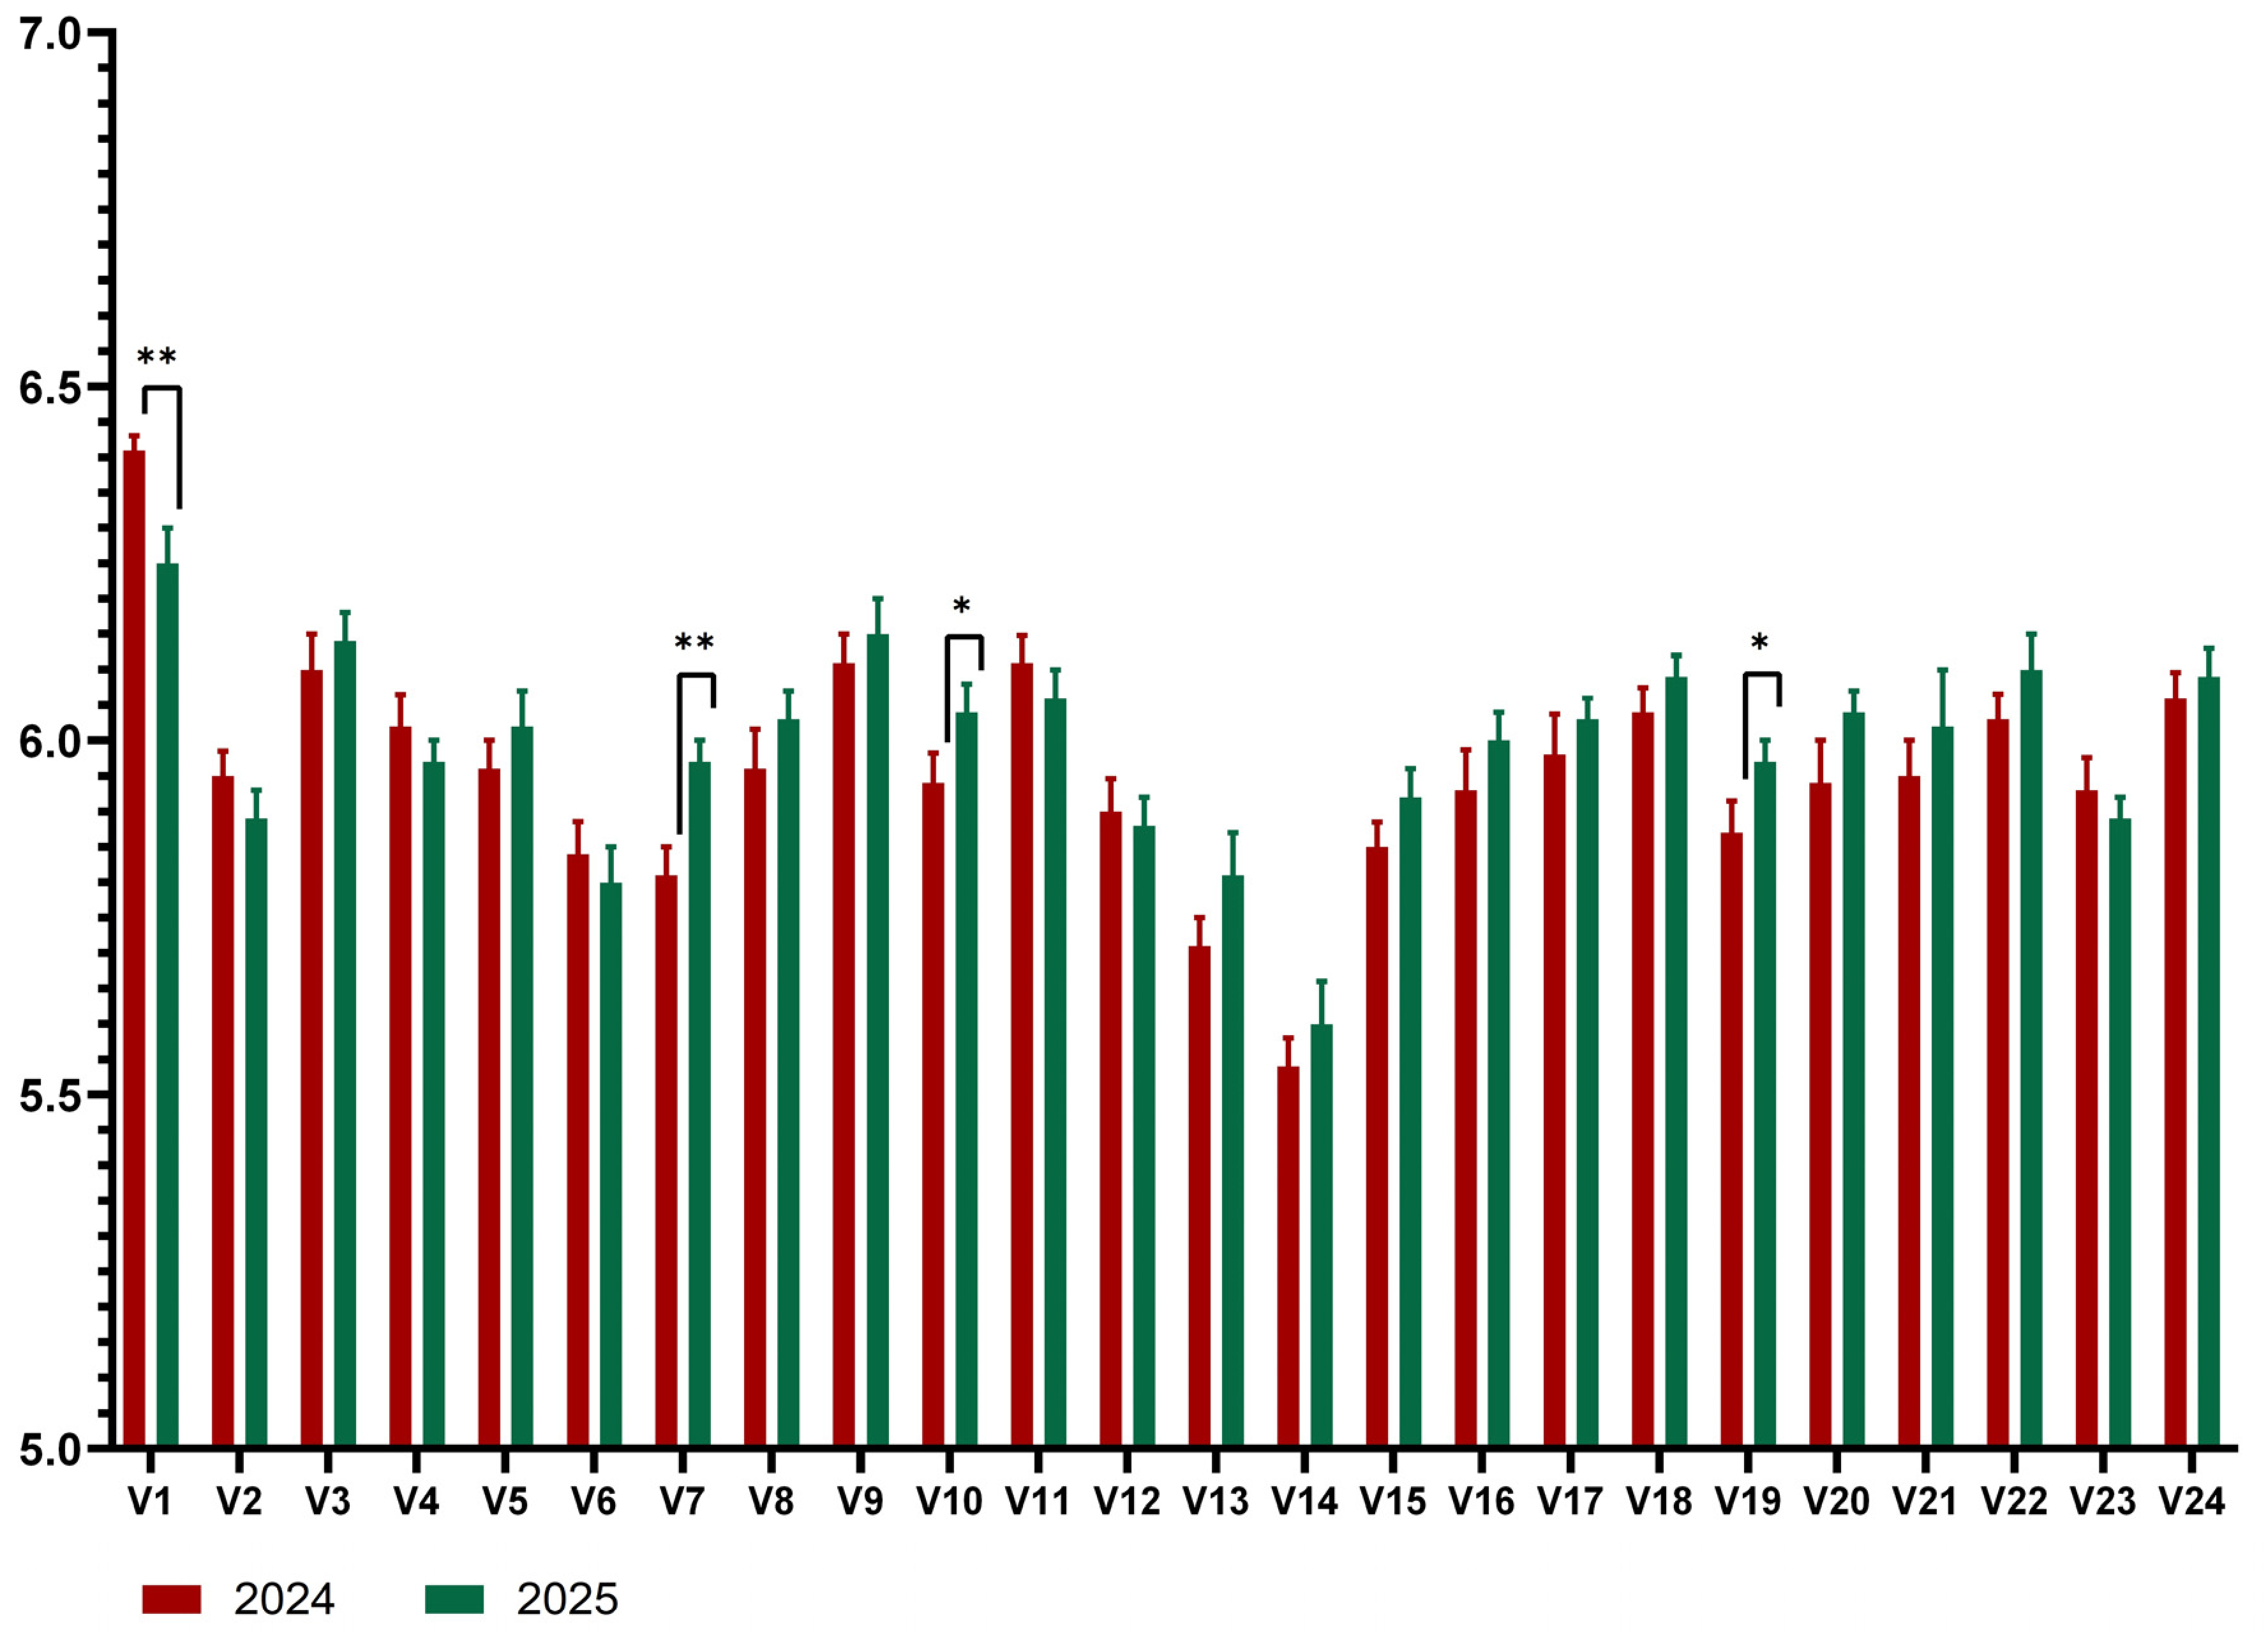
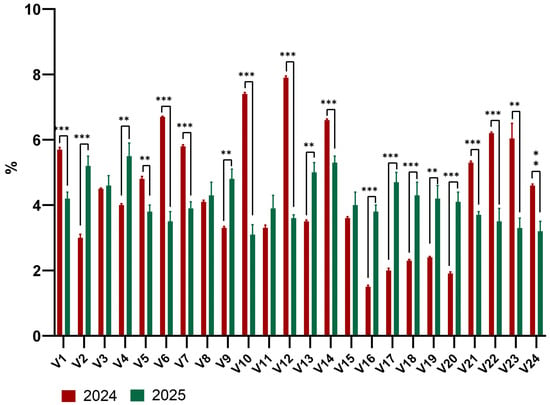
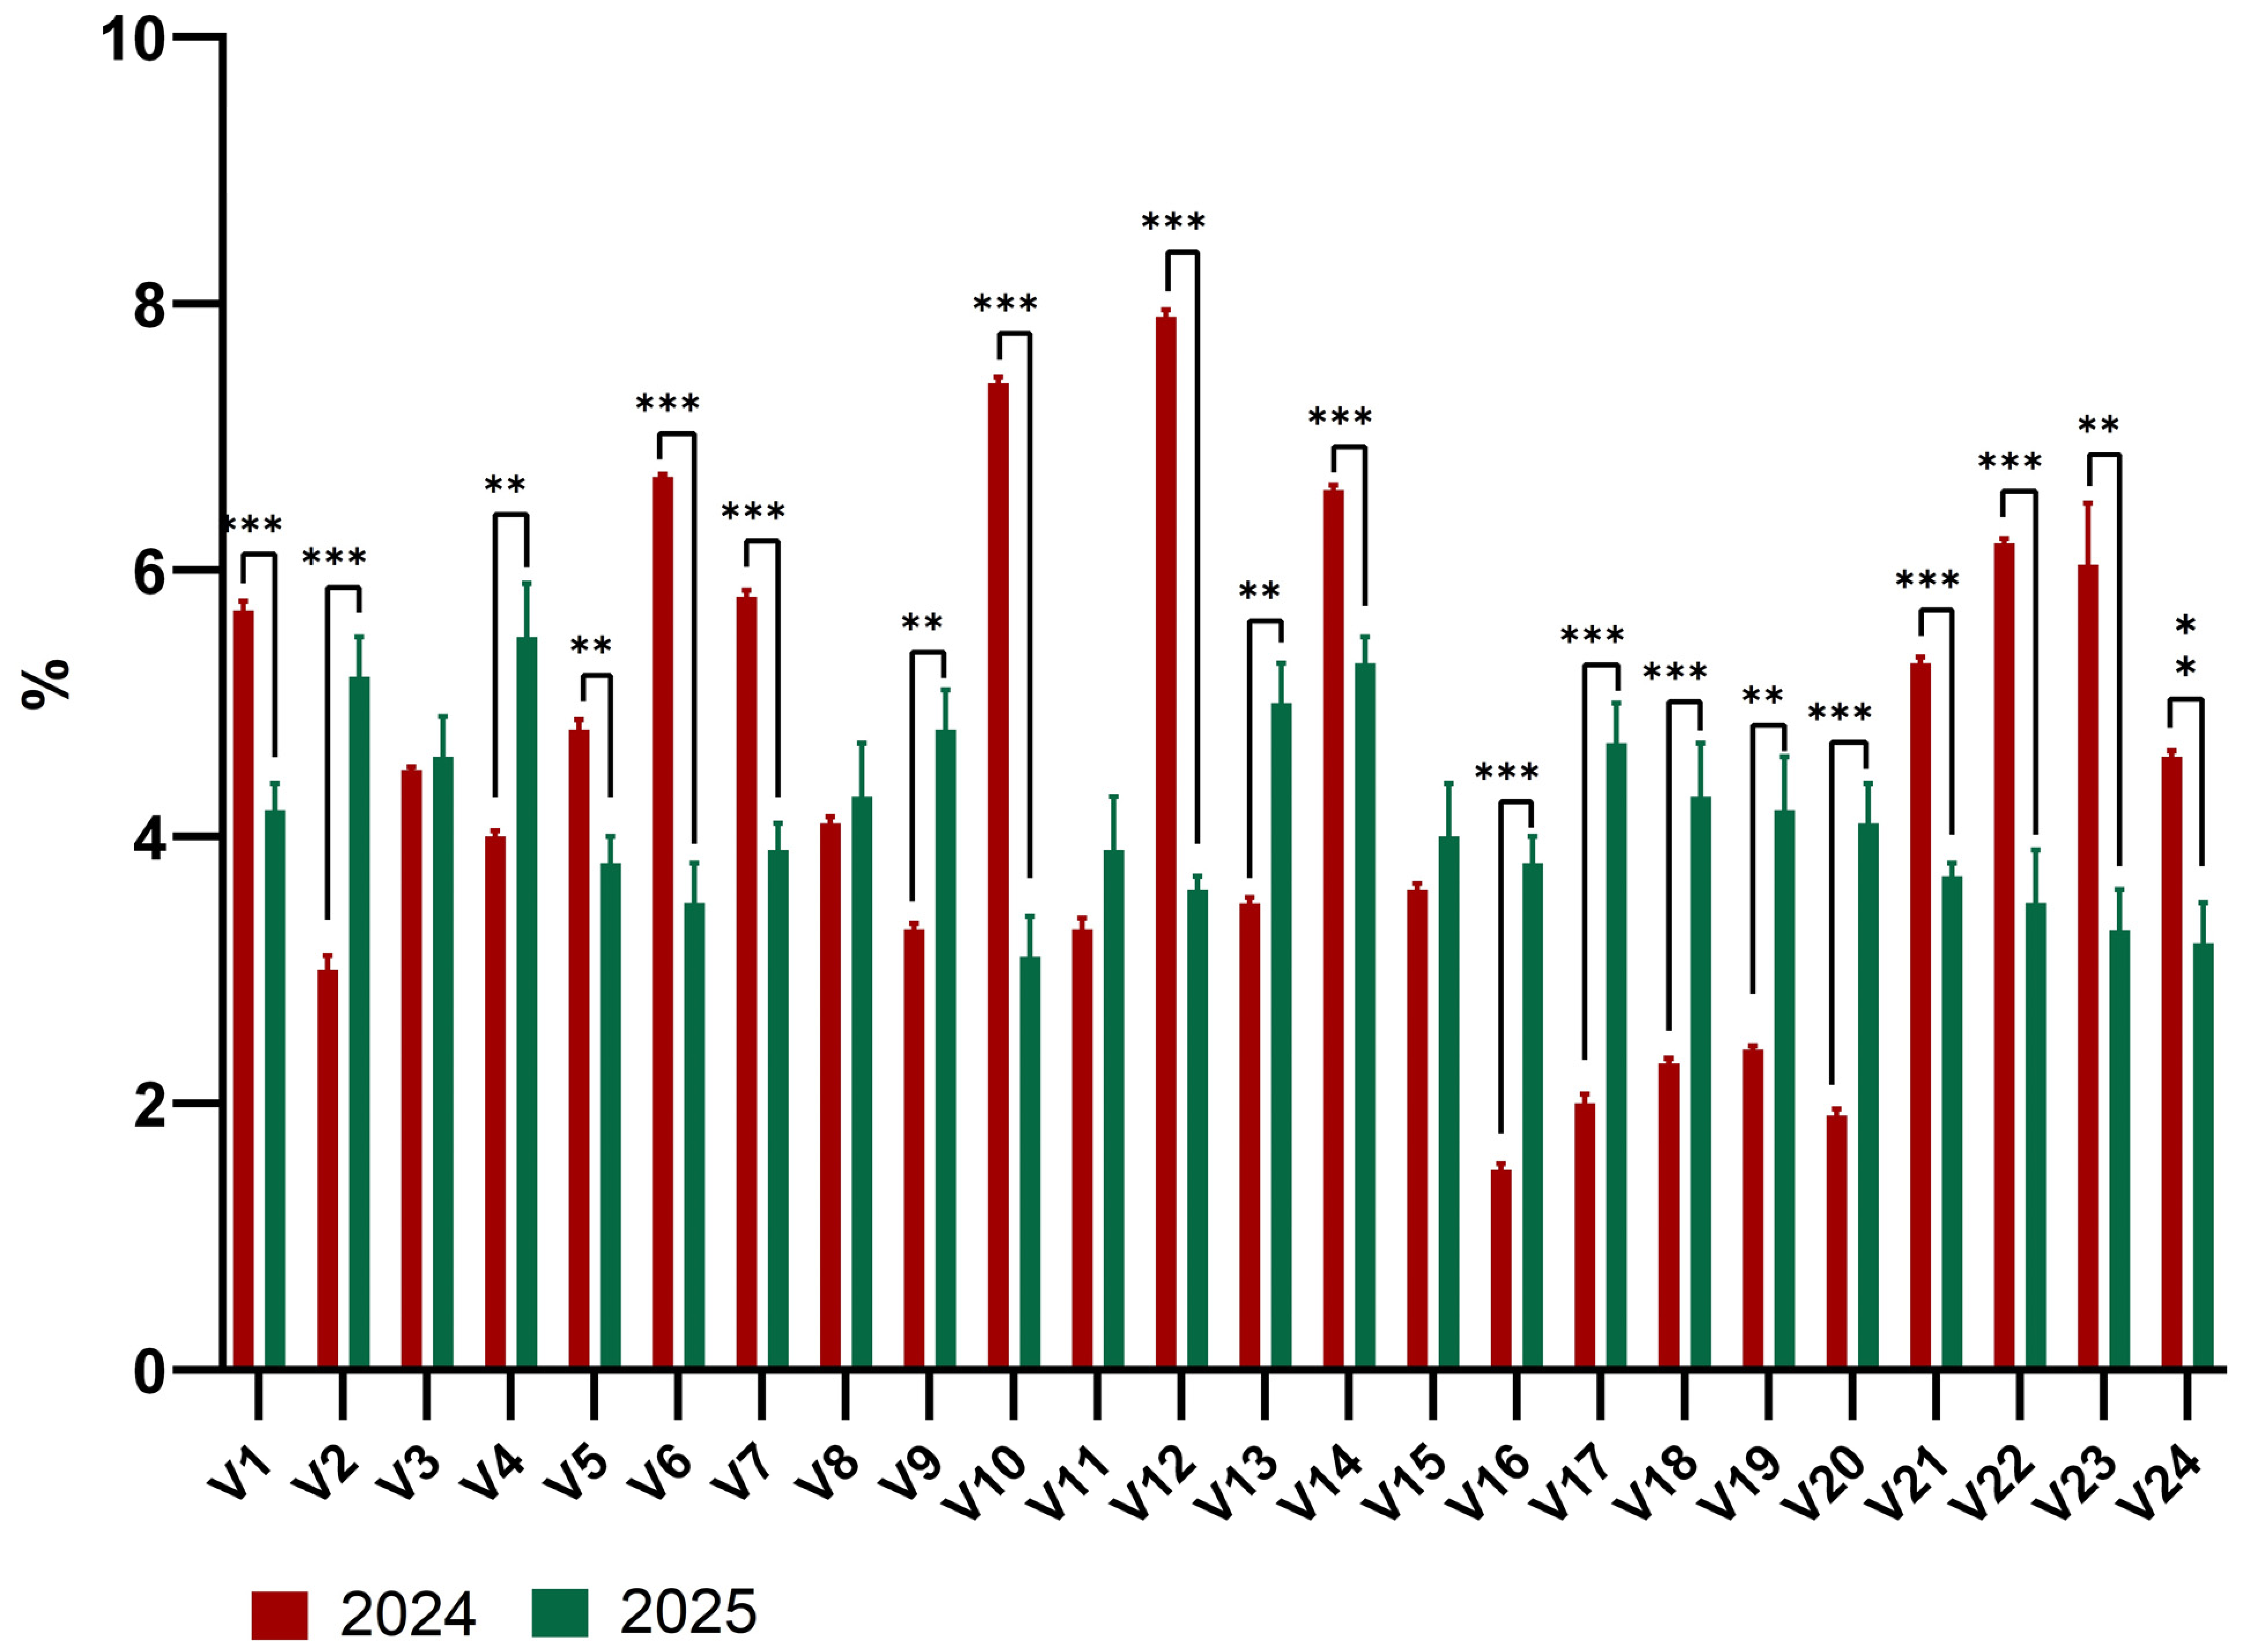
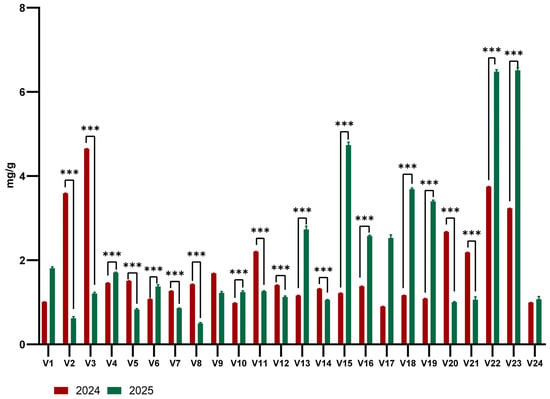
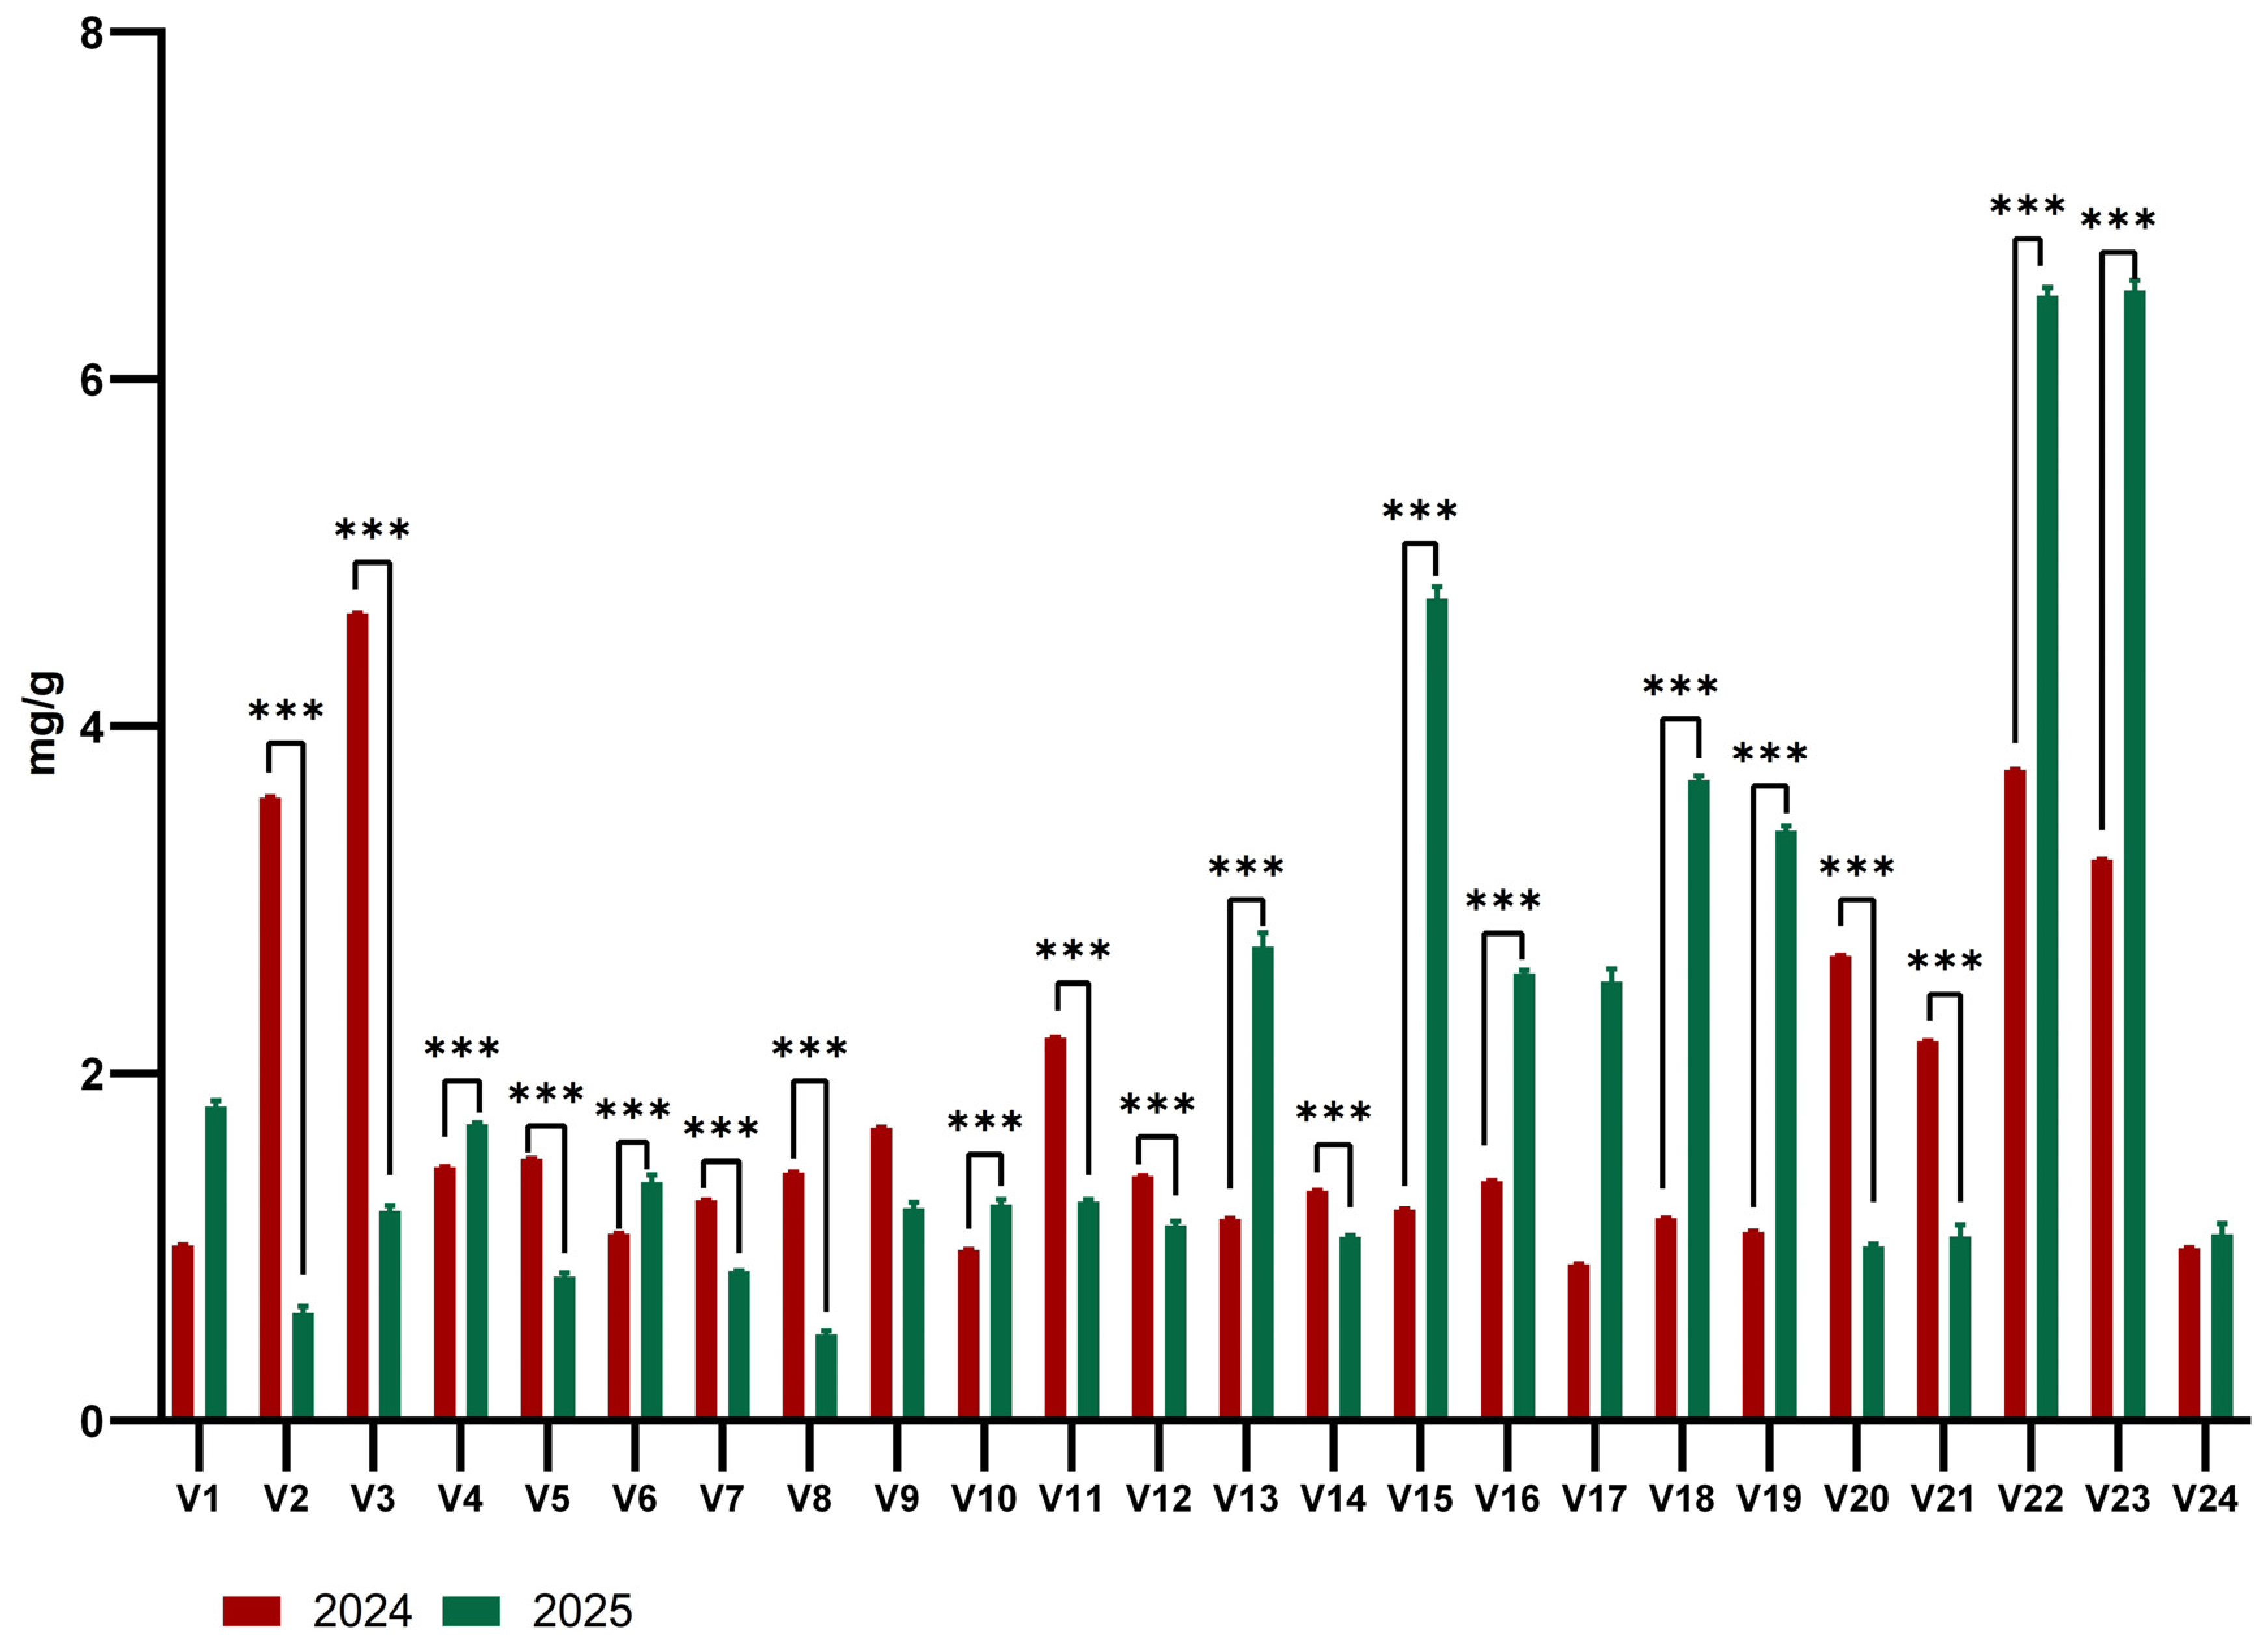
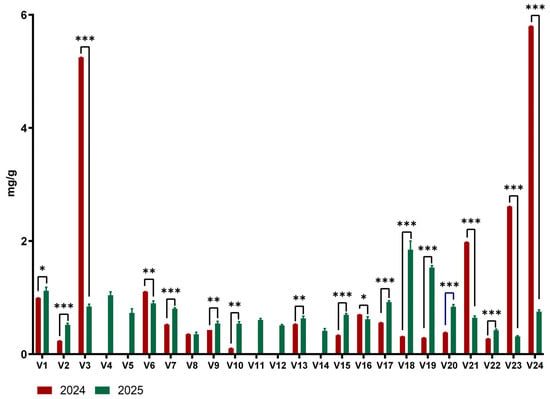
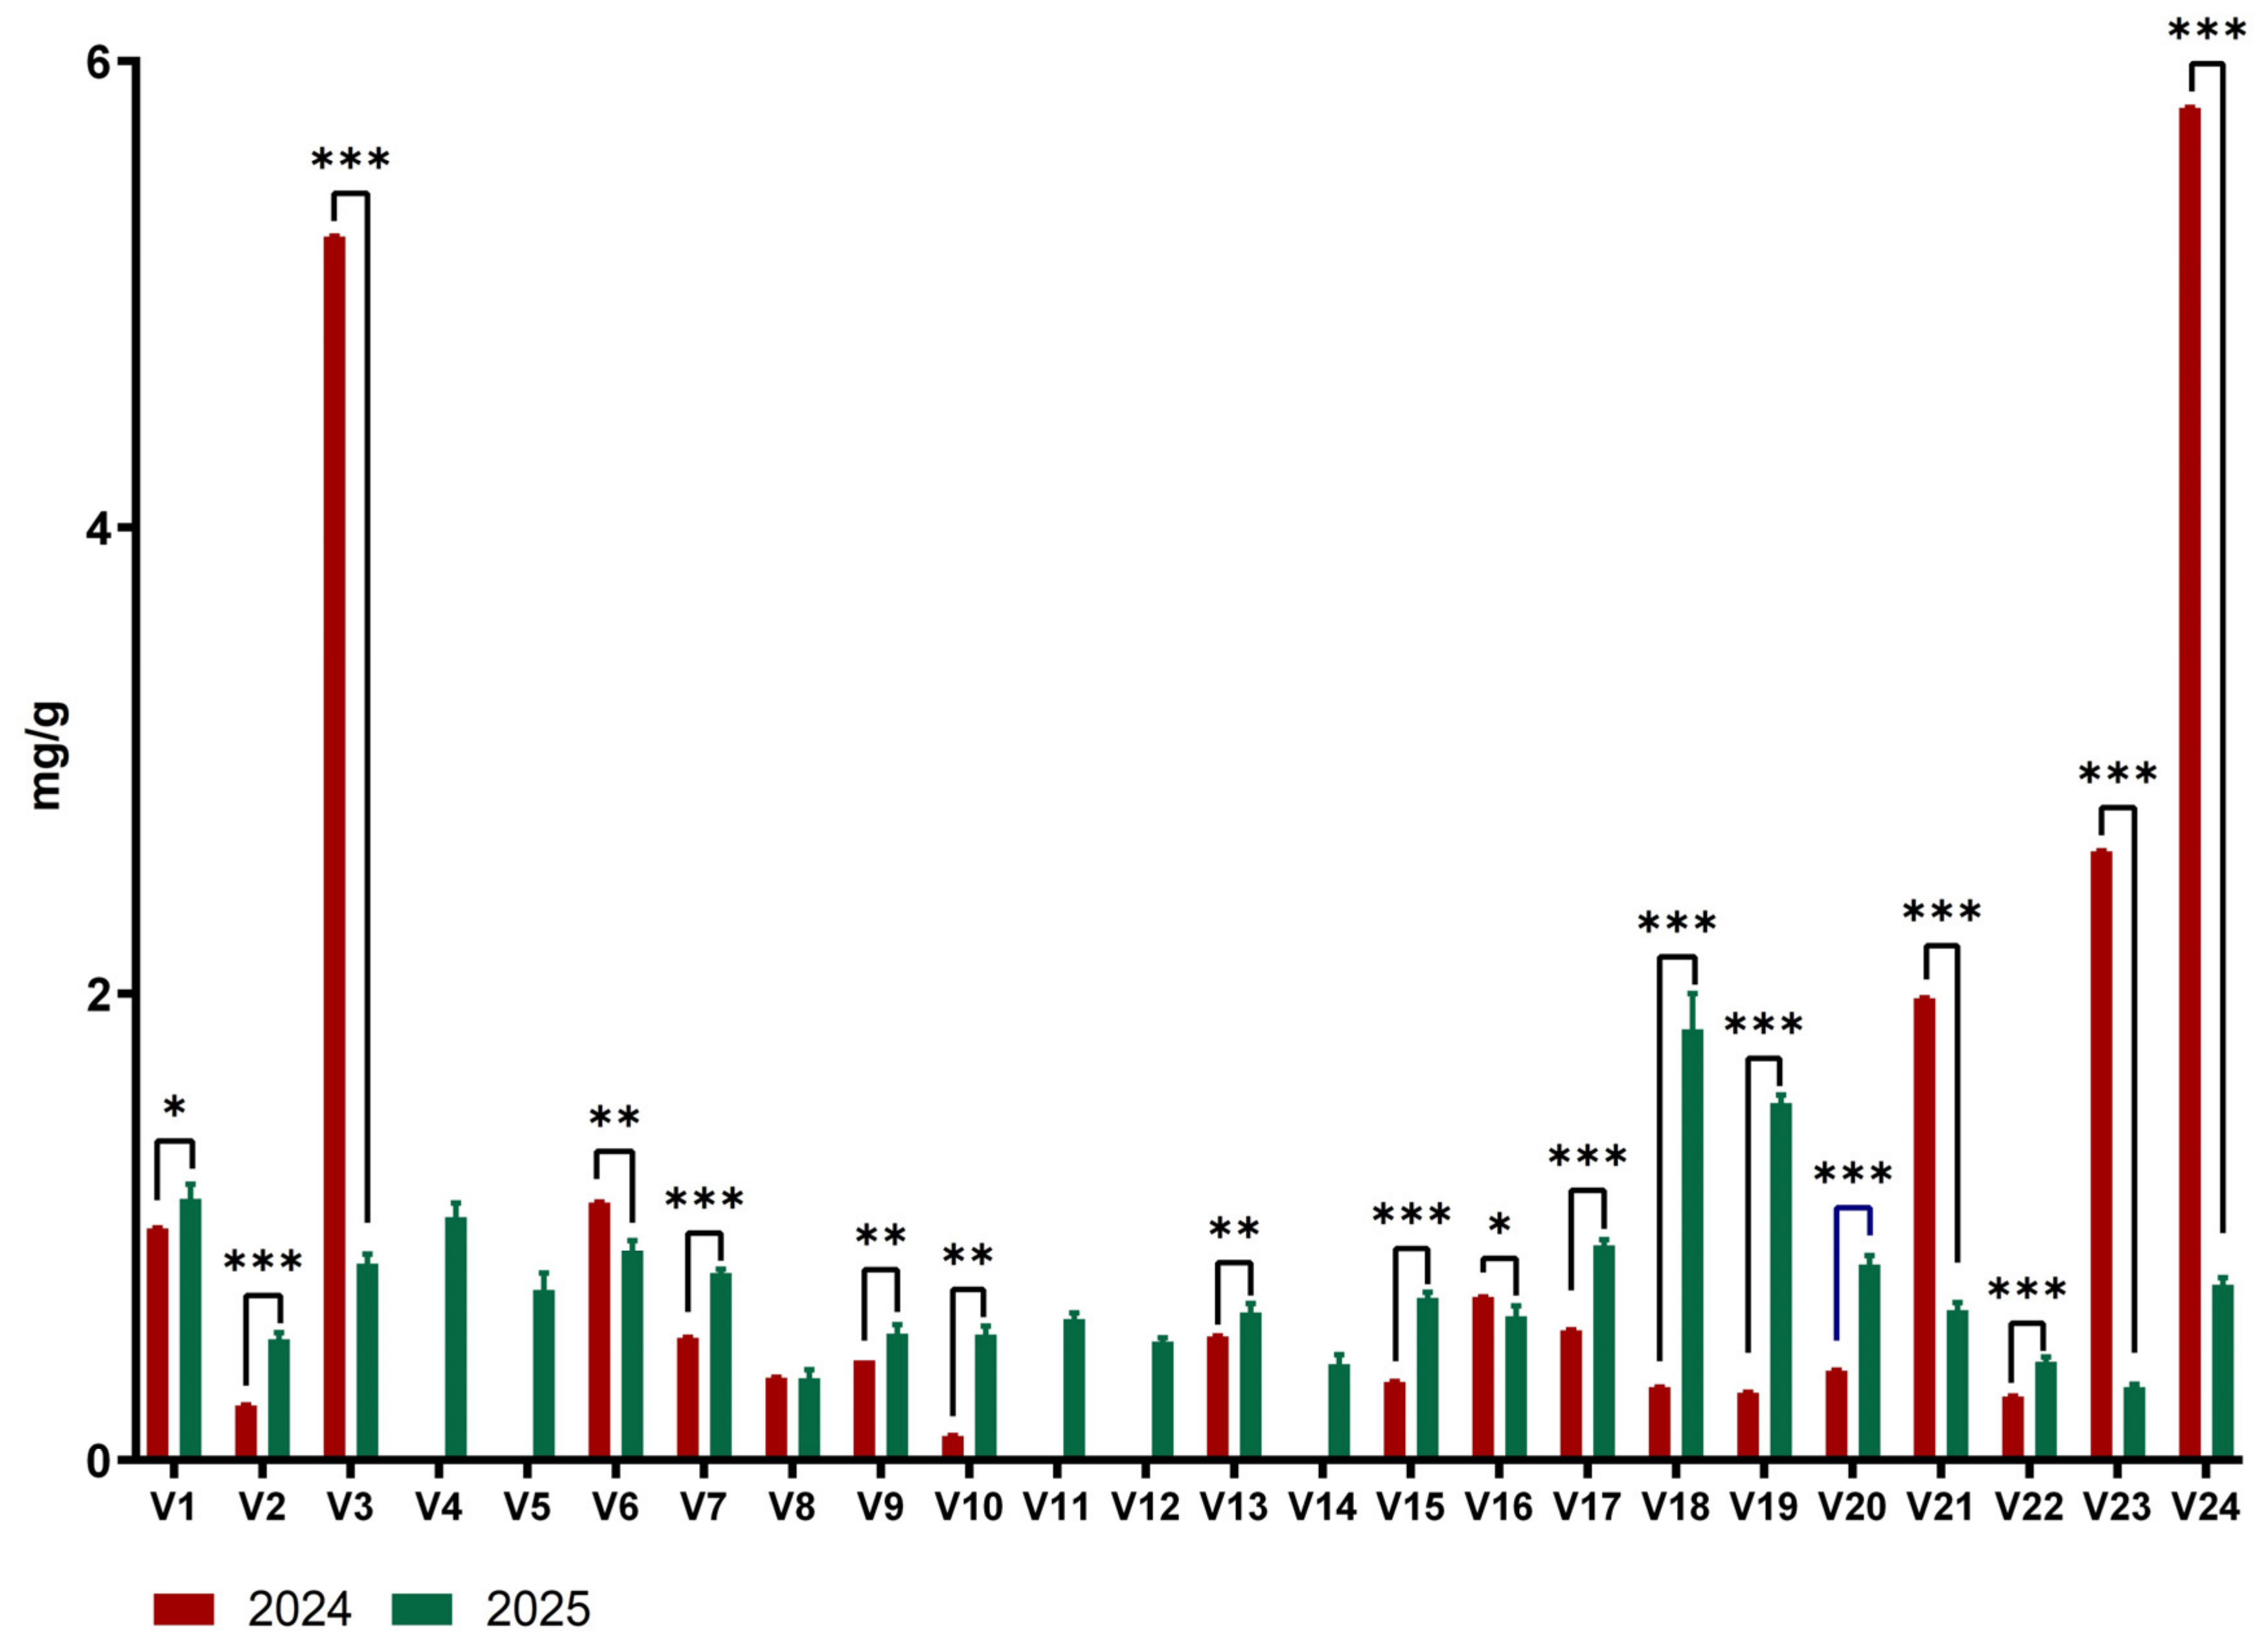
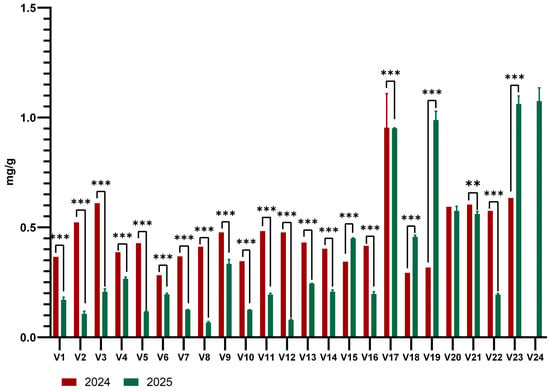
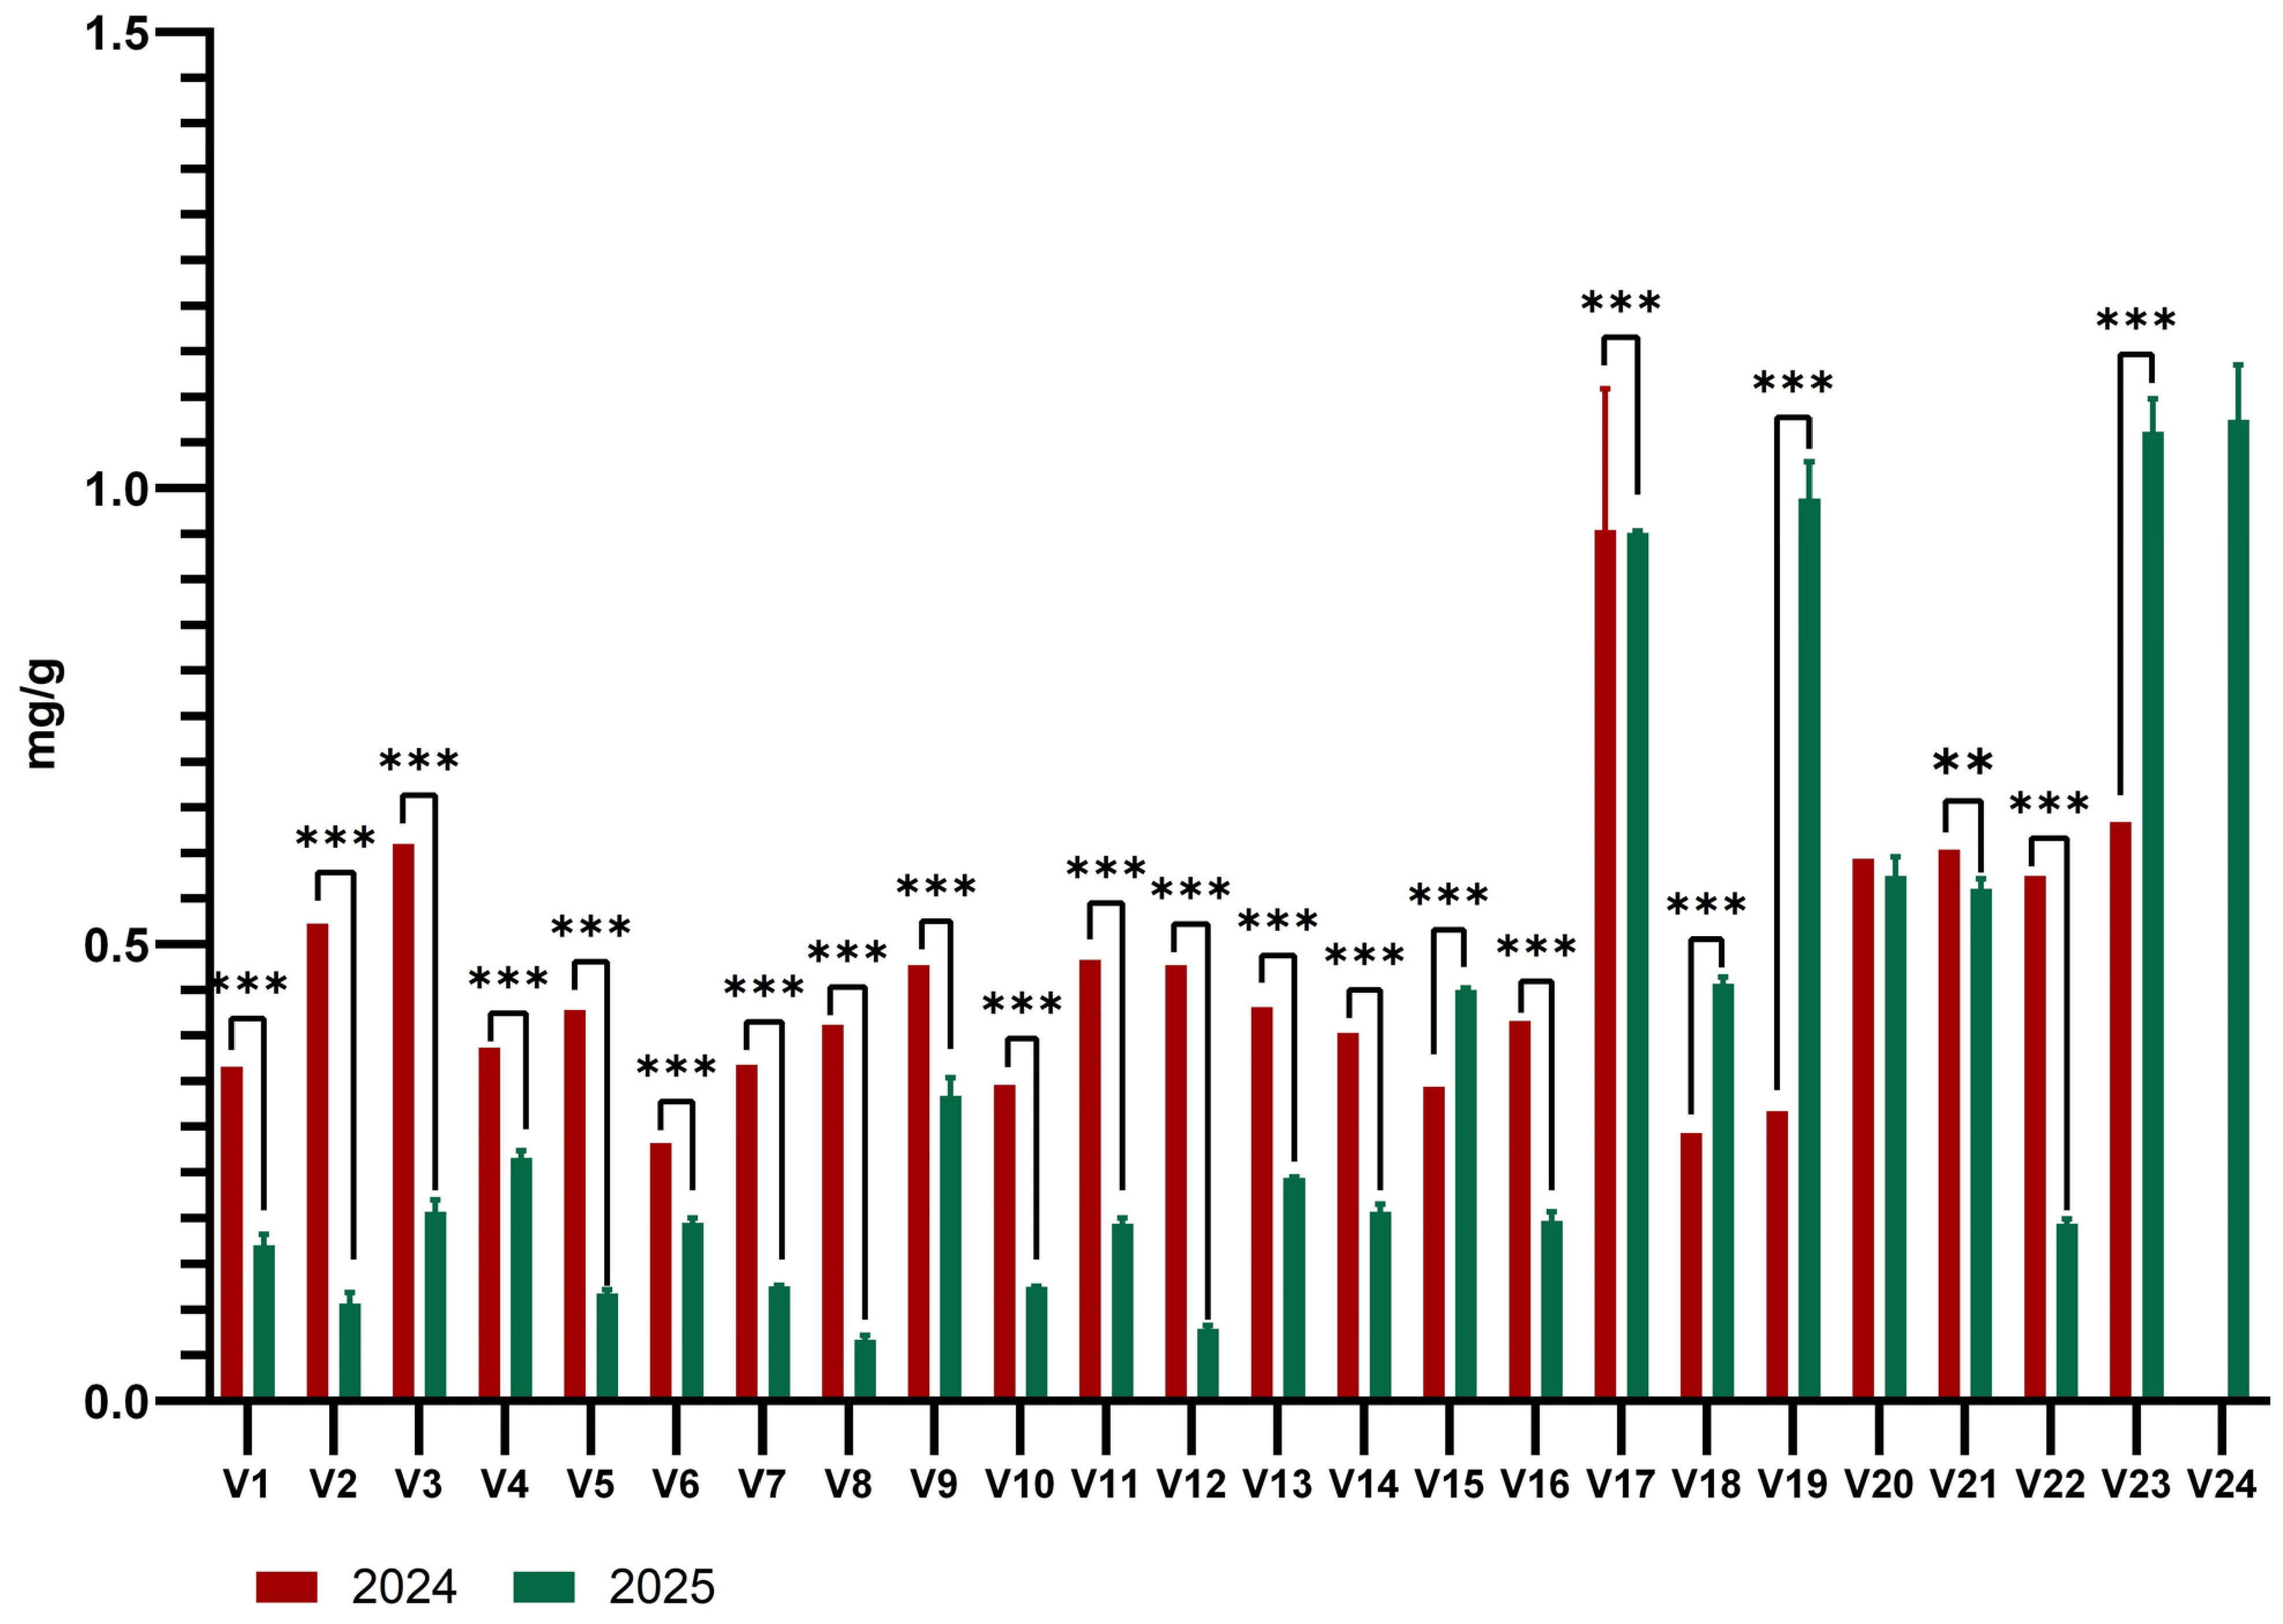
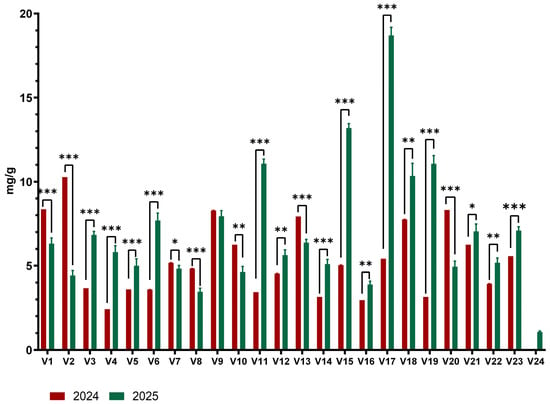
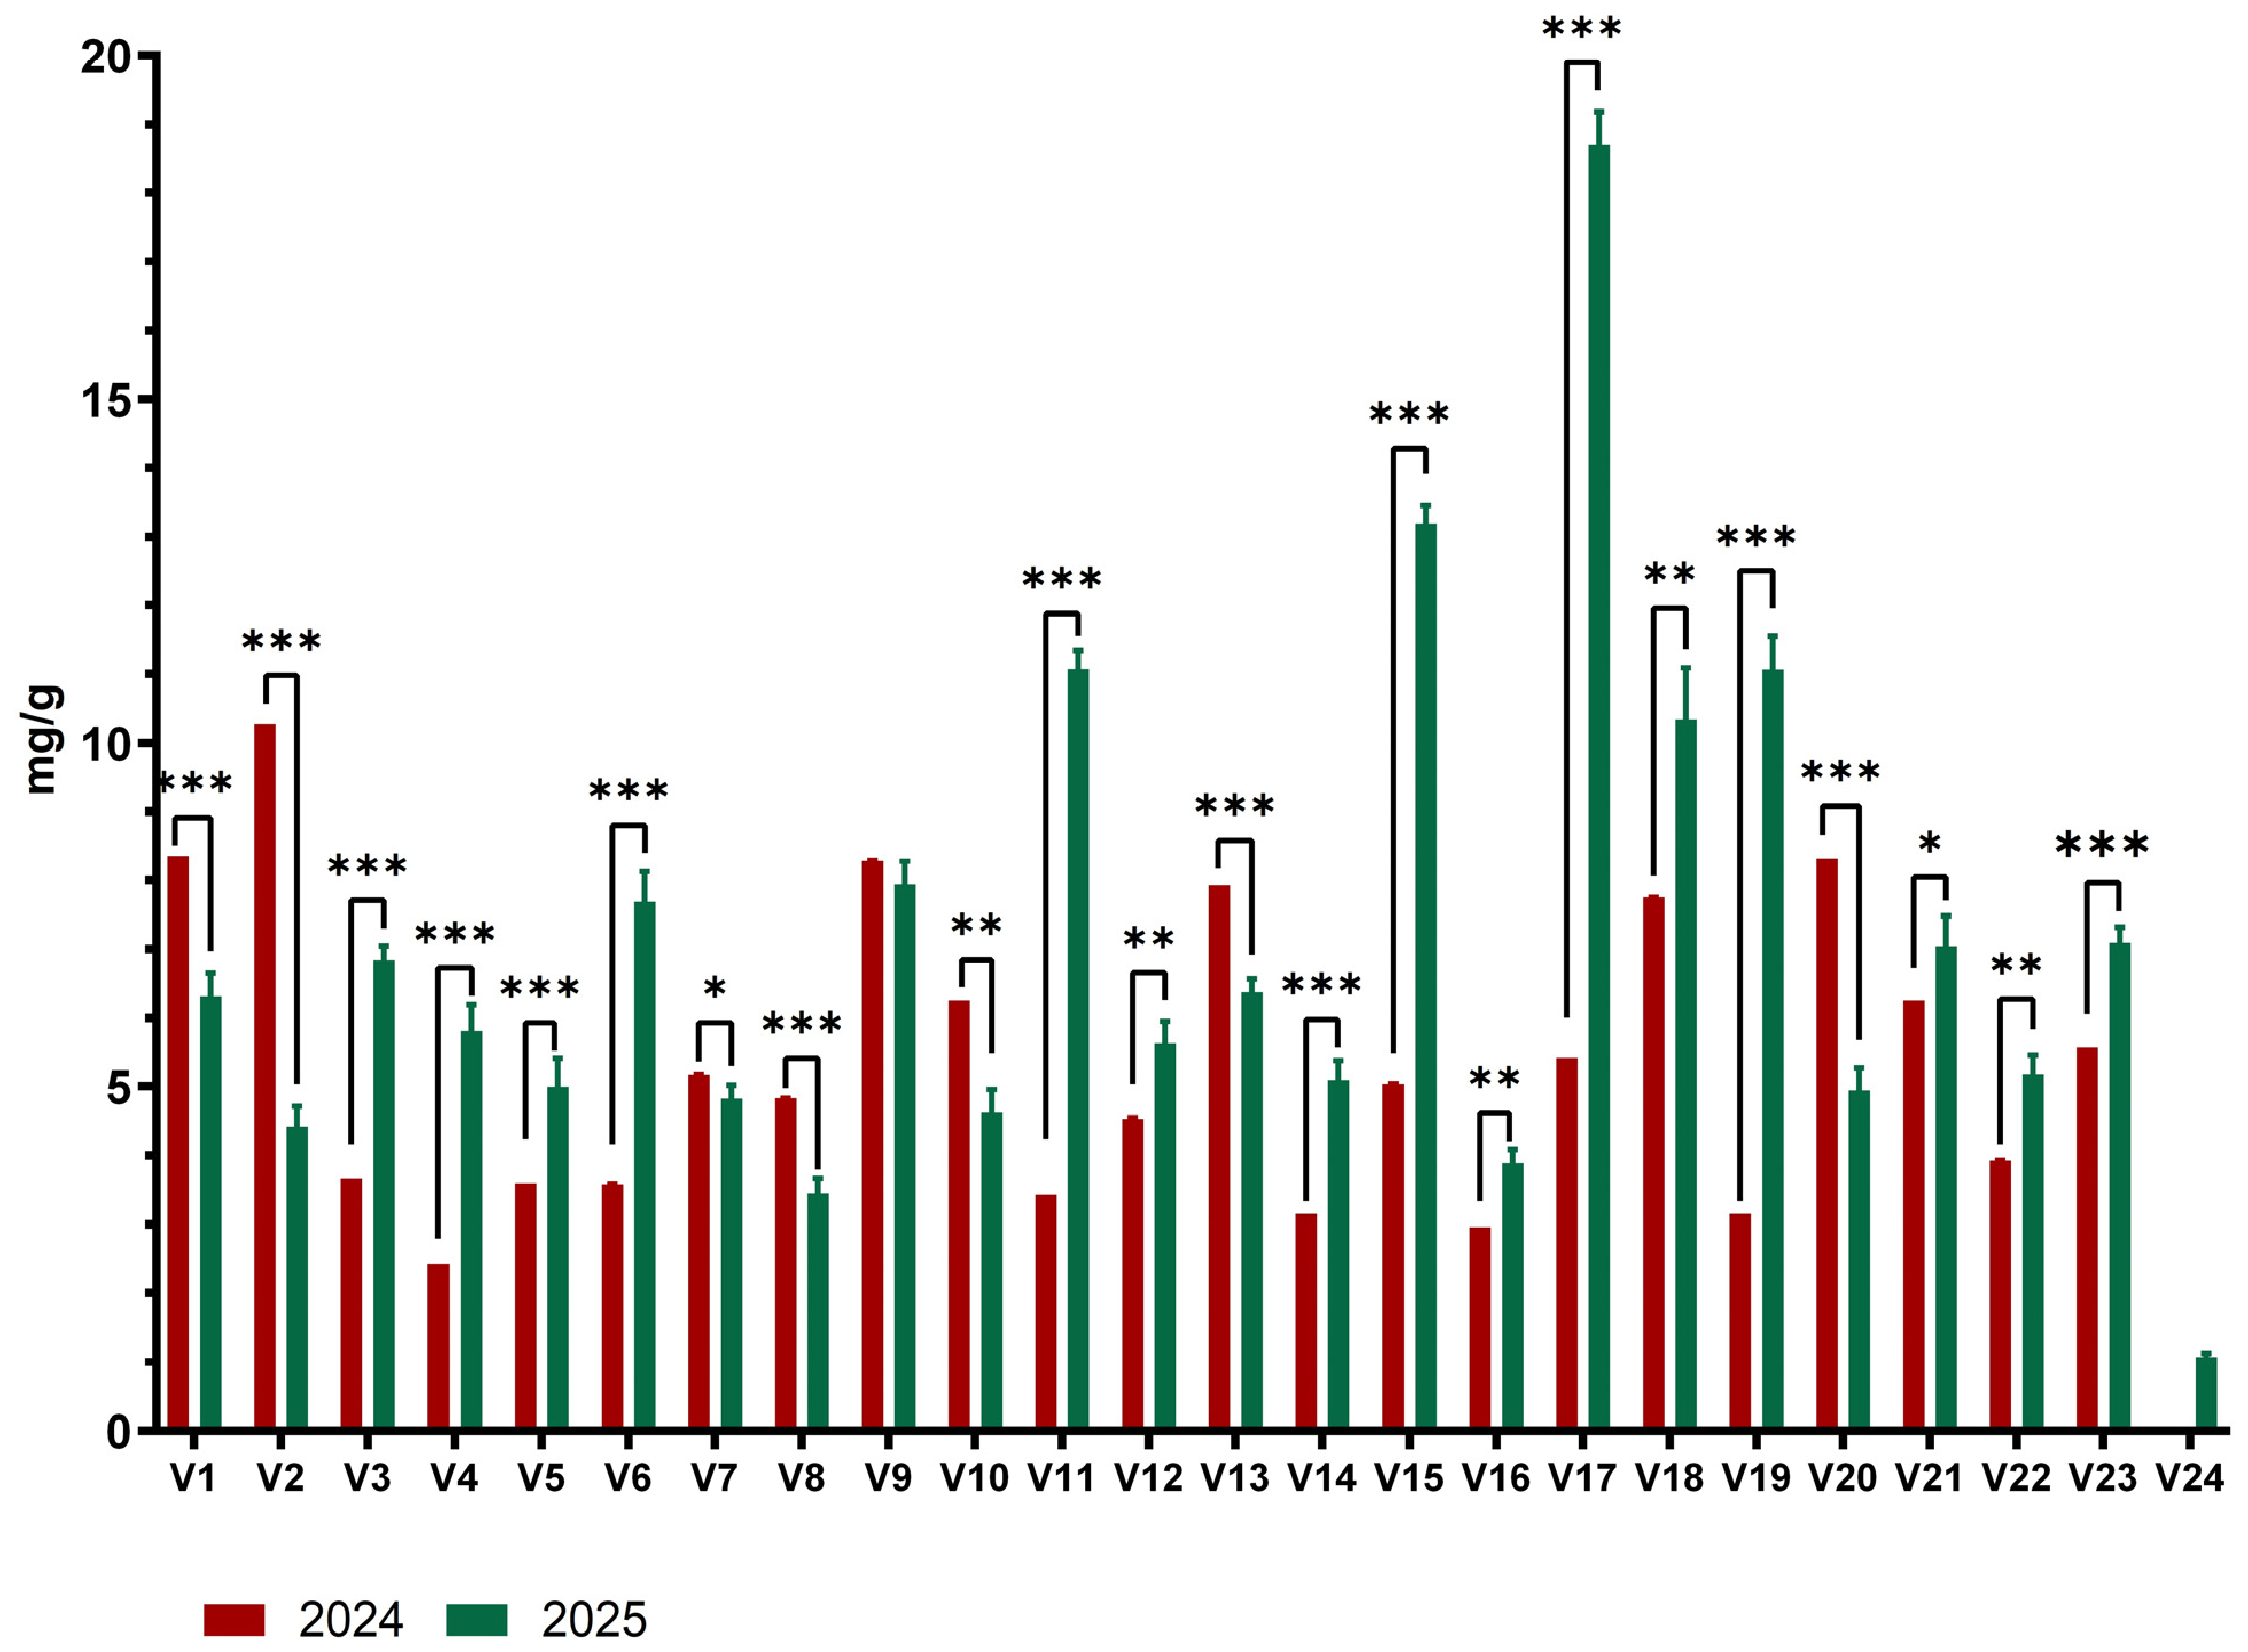
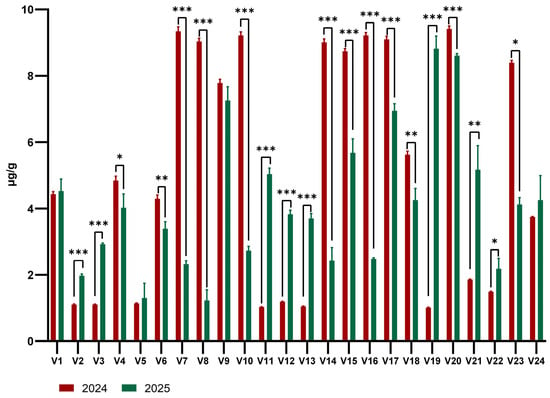
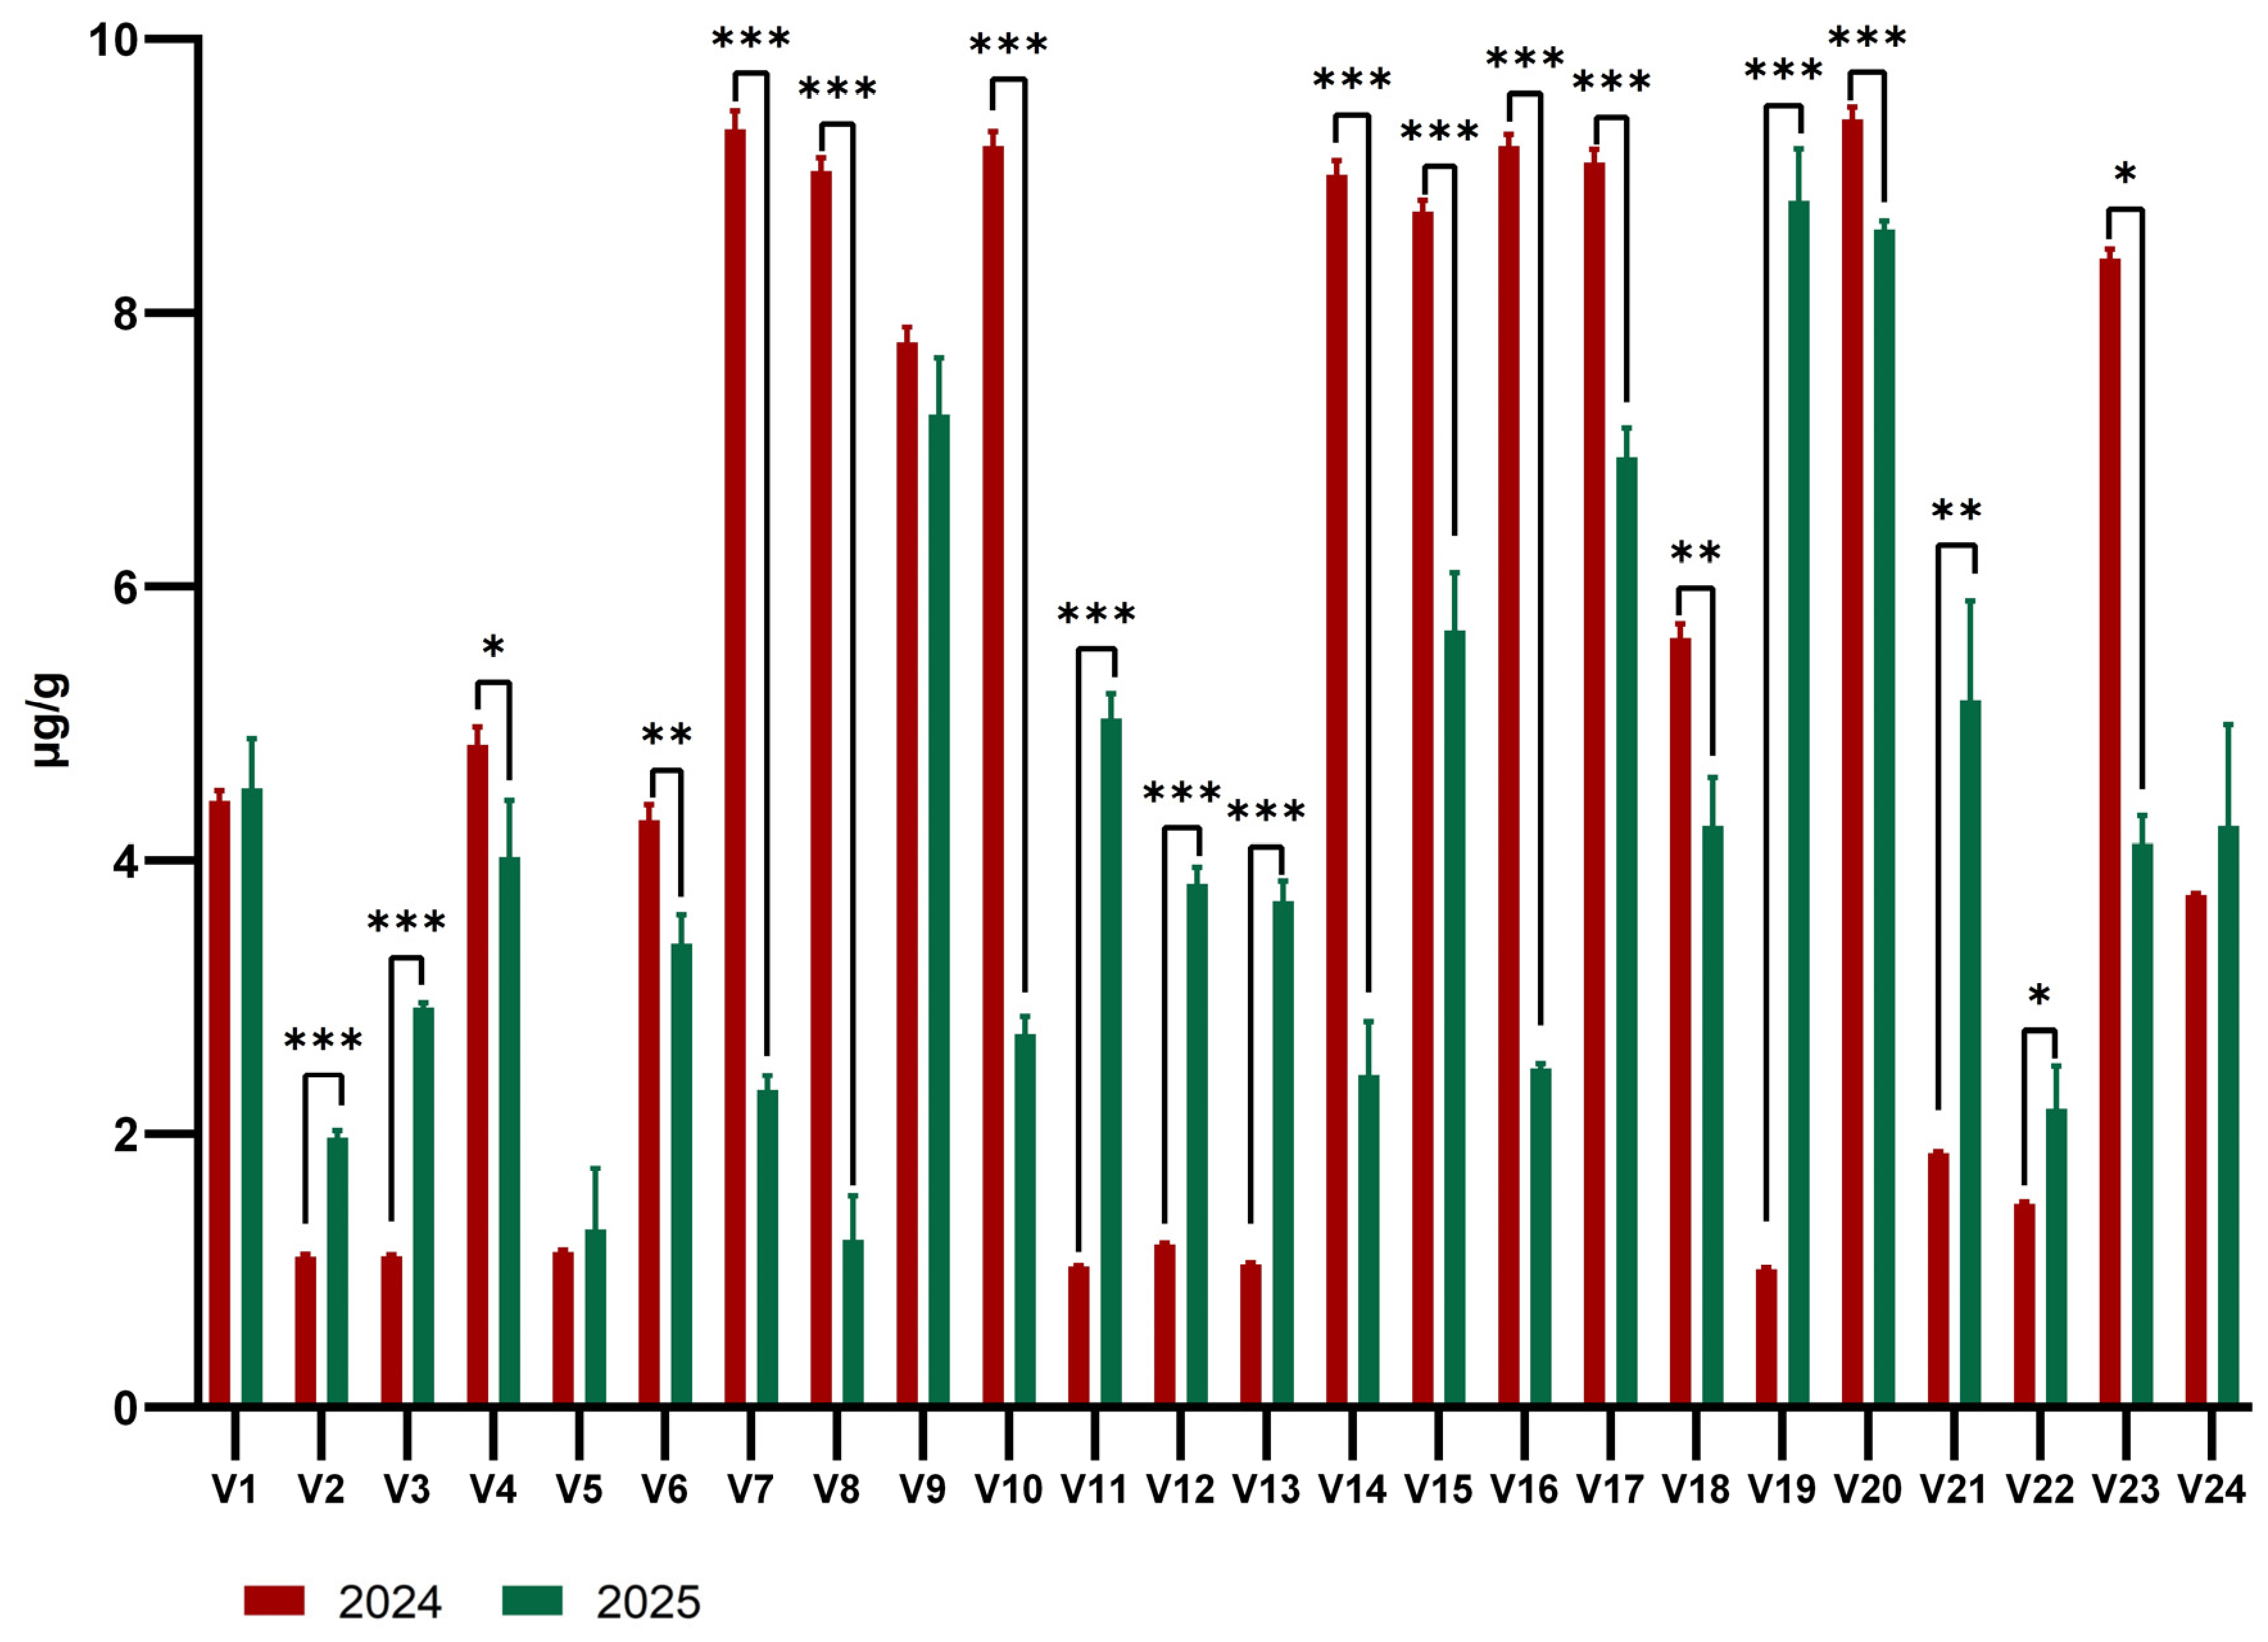
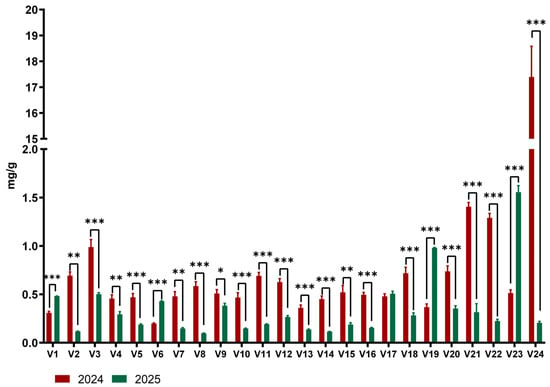
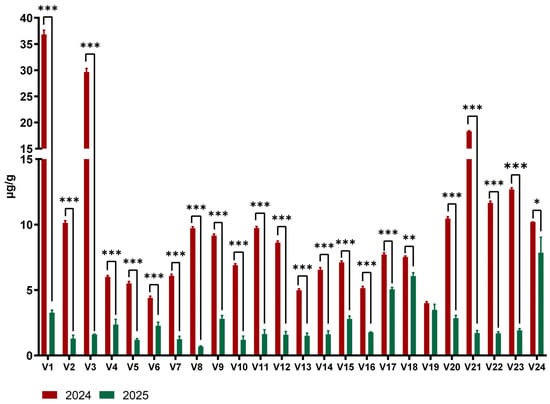
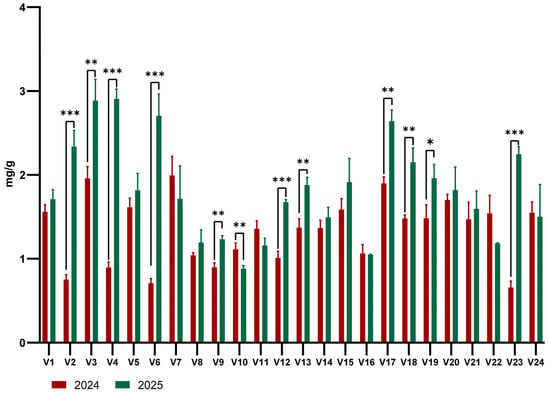
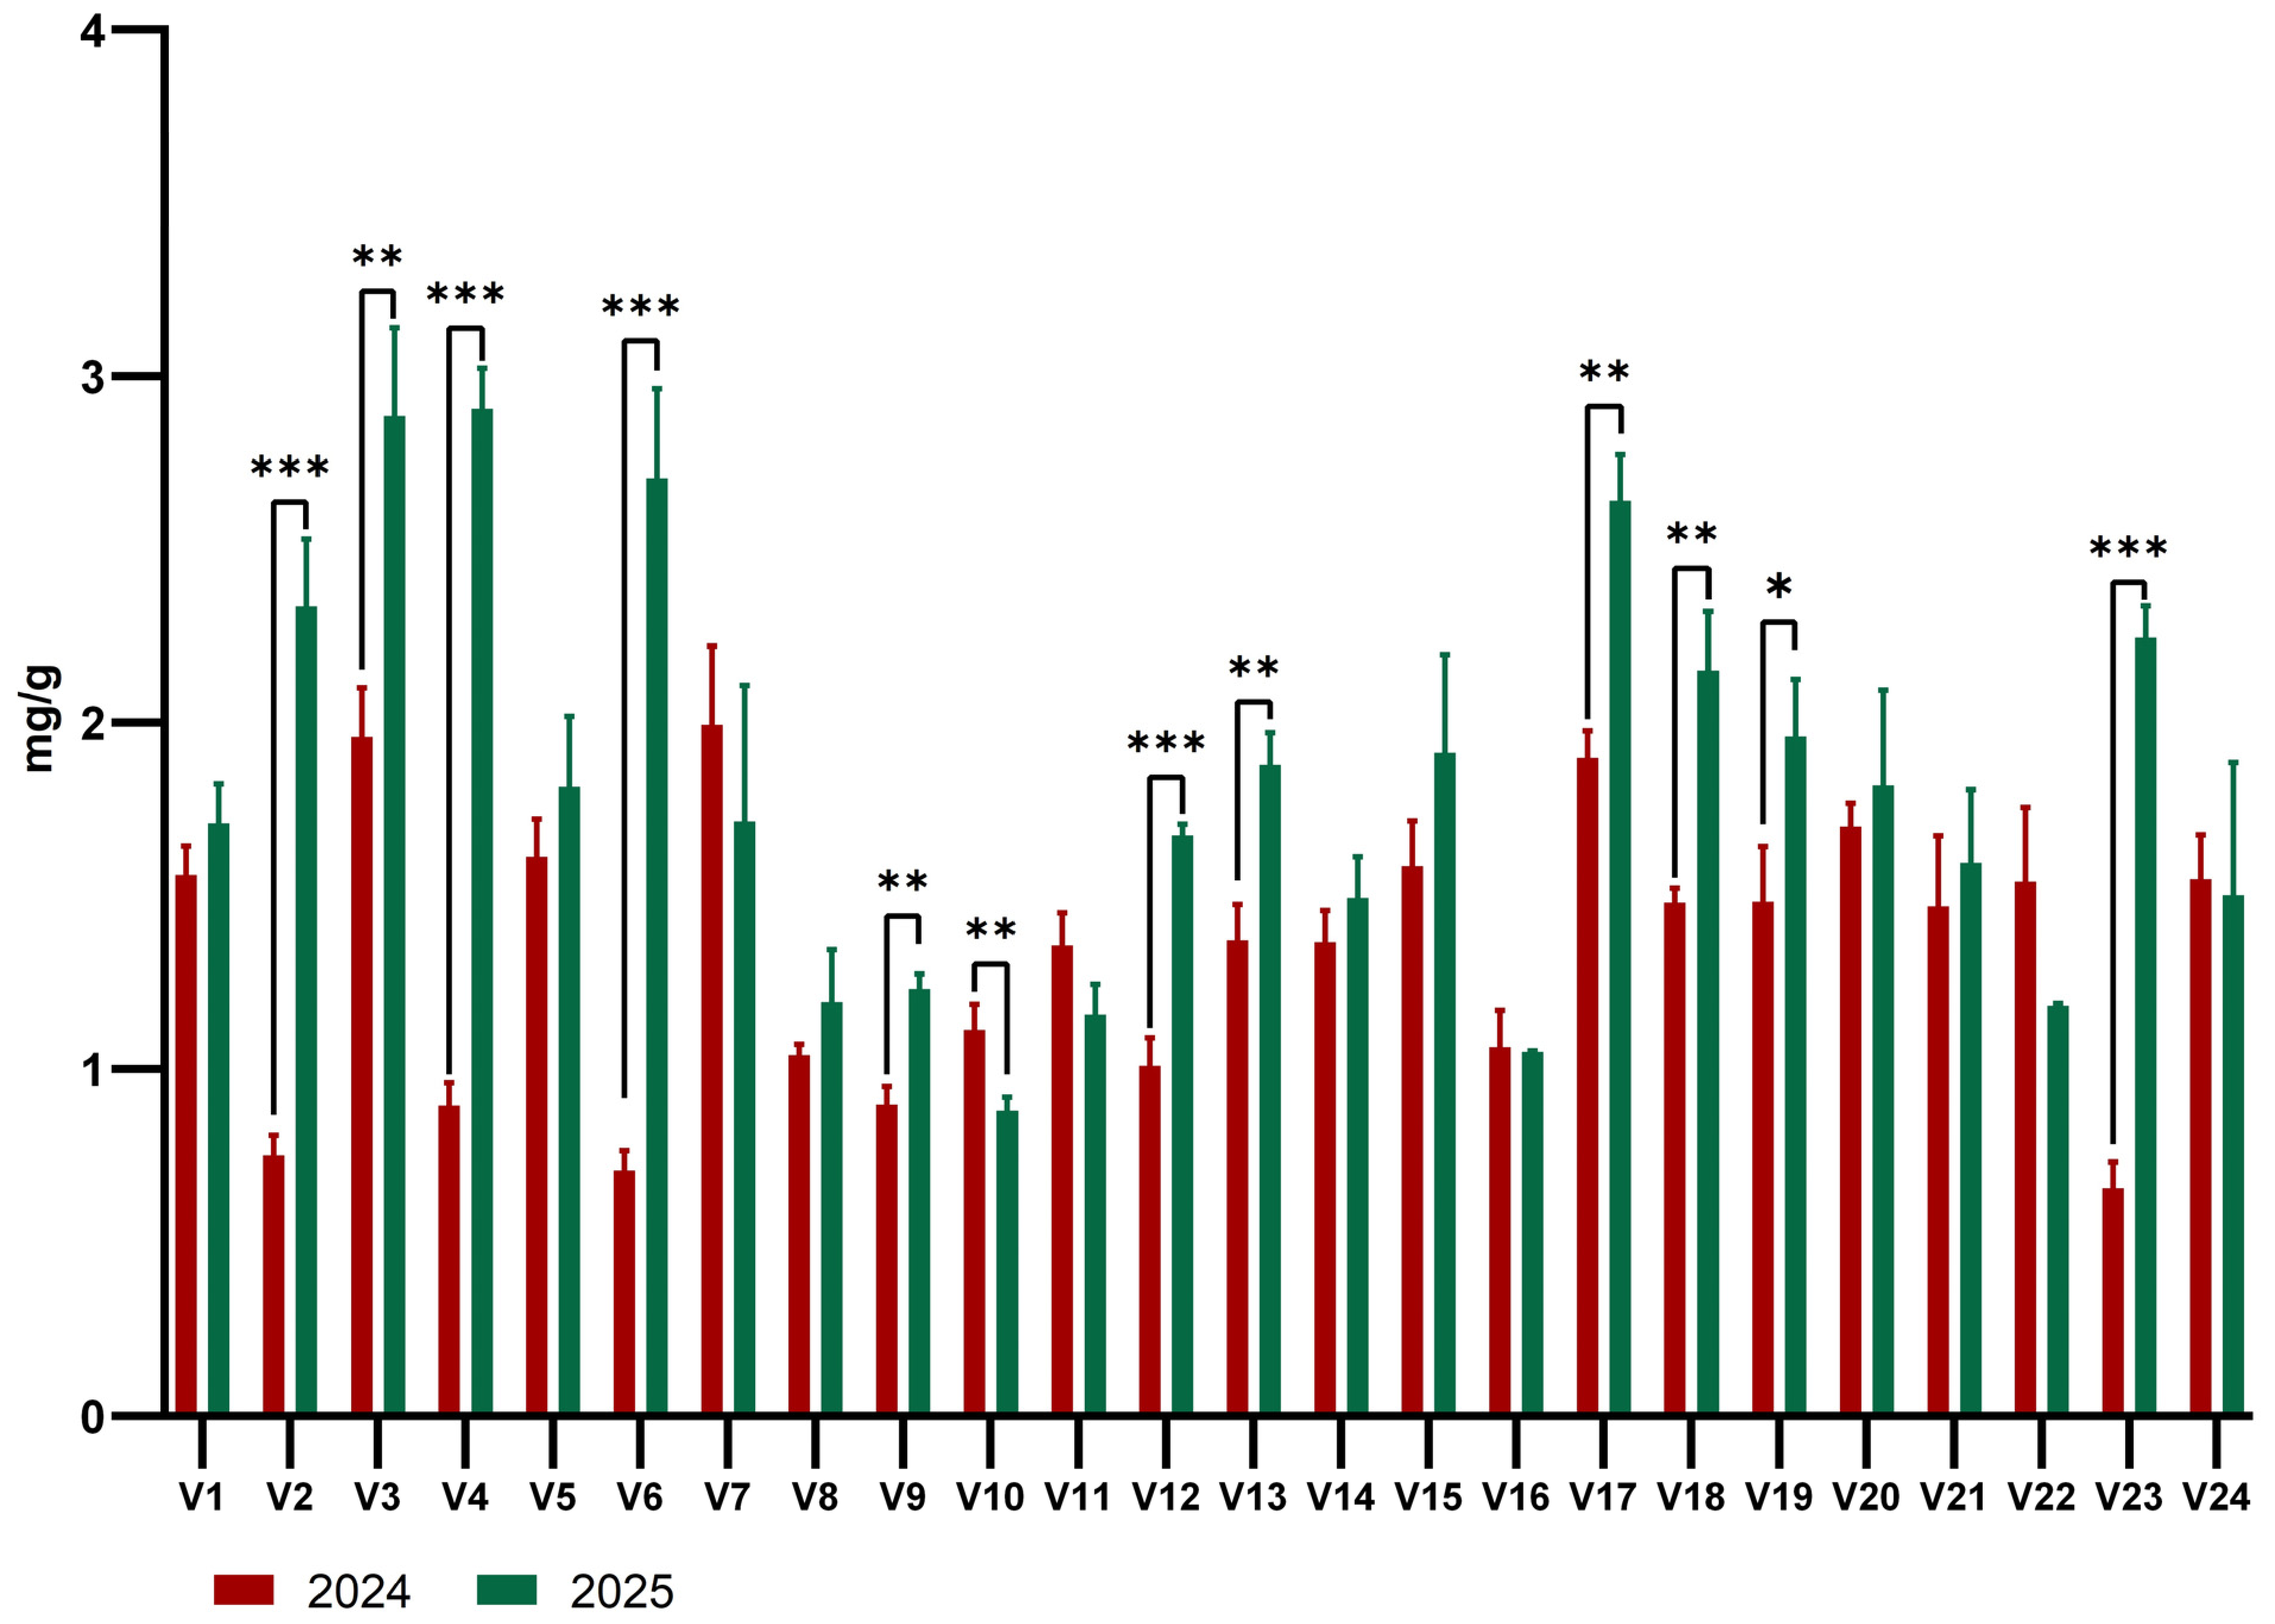

Disclaimer/Publisher’s Note: The statements, opinions and data contained in all publications are solely those of the individual author(s) and contributor(s) and not of MDPI and/or the editor(s). MDPI and/or the editor(s) disclaim responsibility for any injury to people or property resulting from any ideas, methods, instructions or products referred to in the content. |
© 2026 by the authors. Licensee MDPI, Basel, Switzerland. This article is an open access article distributed under the terms and conditions of the Creative Commons Attribution (CC BY) license.