


Abstract
Background/Objectives: Maximal strength, eccentric knee-flexor force, dynamic balance and movement quality are routinely profiled in soccer, yet which of them discriminate competitive level under multiplicity control, and whether they are similarly organized across levels, is unclear. We compared these attributes in professional versus amateur male soccer players and exploratorily examined level-related differences in correlation structure. Methods: Male outfield players (n = 144; 72 per group) were tested in-season, 48 h post-match: 1RM back squat and deadlift, eccentric knee-flexor force (NordBord), squat- and countermovement-jump (SJ, CMJ) height, Y-Balance Test (YBT) composites, and the seven-item Functional Movement Screen (FMS). Sixteen primary comparisons were false-discovery-rate (FDR)-controlled (Benjamini–Hochberg) with effect sizes and 95% CIs; a pre-specified secondary family covered body-mass-normalized strength and inter-limb asymmetry, and within-group correlations were compared by Fisher’s r-to-z. Results: Professionals were superior for 1RM back squat (d = 0.73), 1RM deadlift (r = 0.41), eccentric knee-flexor force (r = 0.34/0.26) and FMS composite, in-line lunge and deep squat (r = 0.20–0.25; q < 0.05); jump height did not differ, and shoulder mobility, rotary stability and left-limb YBT composite did not survive FDR control. Differences persisted, with similar magnitude, after normalization to body mass (relative deadlift 1.84 vs. 1.66 kg·kg−1, d = 0.90, r-equivalent = 0.41), and on a common r scale the largest effect was eccentric inter-limb asymmetry, threefold greater in amateurs (12.5% vs. 3.8%, r = 0.55). Correlation structure also differed (all p < 0.01; FDR q < 0.01): squat–deadlift near-zero in professionals but moderate in amateurs, eccentric symmetry higher in professionals, SJ–CMJ coupling stronger in amateurs (z = −3.04, 6.84, −4.64). Conclusions: Competitive level was robustly associated with maximal and eccentric strength, both absolute and relative to body mass, and most strongly with inter-limb symmetry, but not with jump height or dynamic balance. These observational findings are hypothesis-generating.
1. Introduction
Soccer performance depends on a set of physical capacities—maximal strength, power, dynamic balance and movement quality—that together support the accelerations, decelerations, changes of direction, jumps and duels that characterise match play [1,2]. Maximal lower-limb strength is of particular interest because it constrains the force available for these actions, and in elite players it is related to both sprinting and jumping [3]. Systematic reviews of soccer profiling data further indicate that anthropometric and physiological characteristics differ systematically with competitive level, playing position and age group [2], which makes competitive level a natural framework for interpreting physical test batteries.
Movement quality is commonly screened with the Functional Movement Screen (FMS), a seven-item battery that samples fundamental patterns and integrates mobility, stability, coordination and neuromuscular control into a single ordinal profile [4,5]. The FMS is widely used for monitoring and for informing corrective programming, and its composite score shows modest associations with some performance measures [6]. Its value as an injury-prediction tool is, however, contested: meta-analytic evidence does not support the composite score as a predictor of subsequent injury [7,8], and the general logic of using a single screening test to predict injury has been criticised on methodological grounds [9]. The FMS is therefore best treated in the present context as a descriptor of movement competency rather than as a risk score.
Dynamic balance is most often quantified with the Y-Balance Test (YBT), in which single-limb reach distances in three directions are normalised to limb length to yield a composite score [10,11]. YBT performance integrates proprioceptive feedback, trunk and lower-limb strength and neuromuscular control [12], and both reach distance and inter-limb asymmetry have been shown to vary with competitive level and playing position in soccer [13]. Eccentric knee-flexor capacity, measured during the Nordic hamstring exercise on an instrumented device, has become a further standard component of soccer profiling because low eccentric force and large inter-limb asymmetries have been associated with hamstring-injury risk [14] and because between-session reliability and reference ranges are now available for professional players [15].
Although each of these qualities has been examined individually, they are rarely measured in the same cohort, and two questions remain open. First, when several qualities are compared simultaneously, which of them actually discriminate competitive level after the resulting multiplicity is taken into account? Existing level-based comparisons have generally examined one domain at a time—the FMS [16] or the YBT [13]—without controlling for the number of tests performed. Second, and more fundamentally, level-based comparisons implicitly assume that the physical qualities relate to one another in the same way at every level; whether the internal structure of a test battery is itself level-dependent has, to our knowledge, not been tested directly. The distinctive feature of the present study is therefore that these five qualities were measured together in the same players and analysed as one physical profile: although they are routinely administered as a combined battery in soccer practice, they are usually interpreted in isolation, and only a combined battery allows both questions—which qualities distinguish competitive level, and whether they are organised in the same way at each level—to be examined within a single cohort.
The aims of the present study were therefore (i) to compare maximal strength, eccentric knee-flexor force, jump height, dynamic balance and FMS scores between professional and amateur male soccer players with explicit control of multiplicity, and (ii) to test, as a pre-specified exploratory aim, whether the within-group correlation structure of these qualities differs between competitive levels. We hypothesised that professionals would show higher maximal and eccentric strength (H1) and a higher FMS composite score (H2). No directional hypothesis was formulated for jump height or dynamic balance (H3, exploratory). For the correlation structure we hypothesised that the associations among physical qualities would be weaker in professionals than in amateurs (H4, exploratory), on the assumption that a more homogeneous and more specifically trained population attenuates the shared variance among test outcomes.
2. Materials and Methods
2.1. Study Design, Ethics and Reporting
This was a single-centre, cross-sectional comparative study conducted during the competitive season. The study was performed in accordance with the Declaration of Helsinki and was approved on 2 May 2025 by the Ethics Committee of the Istanbul Gedik University Faculty of Medicine (decision number E-71457743-050.04-2025.173340.20).
All participants received written and verbal information about the purpose, procedures and risks of the study and provided written informed consent before any assessment. Because the study was observational and involved no allocation of participants to an intervention, it was not registered in a clinical-trial registry; no trial-registration number applies.
2.2. Participants
A total of 144 male outfield soccer players, 72 competing in professional licensed leagues and 72 in amateur licensed leagues, were recruited. Group allocation was determined solely by the players’ existing competitive registration and no randomization was involved. Participants were eligible if they were (i) male soccer players aged 18–40 years, (ii) actively registered and licensed in a professional or amateur league, (iii) completing four to five team training sessions and one official match per week at the time of testing, and (iv) fully participating in team training without restriction. Players were excluded if they had (i) sustained a lower-limb musculoskeletal injury or undergone lower-limb surgery in the previous six months, (ii) a current cardiovascular, neurological or vestibular condition that could affect strength or balance testing, (iii) missed any scheduled assessment session, or (iv) played as a goalkeeper, in order to preserve homogeneity of outfield performance demands. The eligibility criteria therefore required players to be free of recent injury and unrestricted at the time of testing; no restriction was placed on injury history beyond the six-month window.
Players were recruited from professional clubs competing in the second division and amateur clubs competing in the regional amateur division. Recruitment was by convenience sampling and took place in May 2025. Playing position was not recorded. Training history was not quantified: training age and the frequency, volume and intensity of resistance training were not recorded for individual players. The only information available on resistance-training content was obtained from the clubs’ coaching staff, who confirmed that the barbell back squat and the conventional deadlift were both included in the regular resistance-training programmes of both groups; this is a qualitative, club-level confirmation rather than a measure of individual exposure. The implications are addressed in the Limitations.
2.3. Sample Size
The required sample size was determined a priori with G*Power 3.1 [17] for the pre-specified primary outcome, the 1RM back squat. Assuming a between-group difference of Cohen’s d = 0.70, consistent with the magnitude of professional–amateur strength differences reported in profiling reviews [2], a two-tailed independent-samples comparison with α = 0.05 and power (1 − β) = 0.80 required 68 participants (34 per group). To allow pre-specified secondary and exploratory analyses, including the within-group correlation analyses, which require substantially larger samples for stable estimation, 72 players per group were recruited. No post hoc power calculation was performed, because power computed from observed effects is a monotone transformation of the observed p-value and provides no additional information.
2.4. Testing Procedures and Standardization
Assessments were completed over two sessions separated by 48 h, at the same time of day (09:00–12:00). All players in both groups played one official match per week, and the testing schedule relative to that match was identical in both groups: the first session took place 48 h after the most recent official match and the second session a further 48 h later, that is, approximately 96 h after the match, with no match in between. The post-match recovery interval was therefore the same for professional and amateur players. A minimum of 48 h was chosen because most neuromuscular, biochemical and perceptual markers of match-induced fatigue return towards baseline within 48–72 h [18,19]; because some measures of maximal and eccentric strength may remain depressed for longer [18,19], the most fatigue-sensitive maximal tests (1RM and eccentric knee-flexor force) were placed in the second session. An orientation and familiarization session preceded the first testing session, during which the procedures were demonstrated, and submaximal practice trials of every test were performed. The first session comprised anthropometry, body composition, the FMS and the Y-Balance Test; the second session comprised the squat jump, the countermovement jump, the 1RM back squat, the 1RM deadlift and, last, the eccentric knee-flexor assessment. The order of the two 1RM tests was fixed and identical for all participants: the 1RM back squat was always completed first and the 1RM deadlift second (Section 2.5.6). Within each session, tests were administered in a fixed order from least to most fatiguing in order to minimise the influence of preceding tests on subsequent measures; because the deadlift always followed a maximal squat, some carry-over fatigue to the deadlift cannot be excluded (Section 4.7). Each session began with a standardized 15 min warm-up consisting of low-intensity running, dynamic mobility drills and submaximal practice repetitions of the tests to follow. All tests were administered by the same FMS-certified and testing-certified assessors, using identical verbal instructions, standardized verbal encouragement and standardized scoring criteria. Rest intervals of 3–5 min were enforced between maximal efforts. Assessors were not blinded to group membership, since competitive status was evident from the testing context; this is acknowledged as a limitation.
Test–retest reliability was not established locally for this cohort. Published reliability data are available for each of the instruments used: the NordBord shows good between-session reliability for peak eccentric knee-flexor force in professional soccer players [15], the directly measured 1RM shows good to excellent test–retest reliability across exercises and training backgrounds [20], and the instrumented Y-Balance device shows good reliability for the individual reach directions and the composite score [11]. The absence of cohort-specific reliability estimates is acknowledged as a limitation.
2.5. Measures
2.5.1. Anthropometry and Body Composition
Stature was measured to the nearest 0.5 cm and body mass to the nearest 100 g with a Seca stadiometer and scale, with participants barefoot and in light clothing.
Body-fat percentage was estimated from skinfold thicknesses measured by a single trained assessor with a Holtain skinfold calliper (Holtain Ltd., Crymych, UK) at three sites (chest, abdominal and thigh), following standardised anatomical landmarks. Each site was measured in duplicate and the mean was retained; the sum of skinfolds was converted to body-fat percentage with the Jackson–Pollock equation. All anthropometric measurements were taken in the morning, before breakfast and before any training. Demographic information was collected with a researcher-designed questionnaire.
2.5.2. Squat Jump
Vertical jump height without a countermovement was assessed with an optical measurement system (Witty, Microgate, Bolzano, Italy; software version 1.13.0). From a static half-squat position with an approximate knee angle of 90° and the hands placed on the hips, participants performed a maximal upward jump without any preparatory downward movement. Because this protocol excludes the countermovement, the test is a squat jump (SJ) and is designated as such throughout; it was referred to as a “vertical jump” in the original test battery and retains that label in the figure panels. Two maximal trials were performed and the mean of the two trials was retained for analysis.
2.5.3. Countermovement Jump
Countermovement-jump (CMJ) height was assessed with the same optical measurement system. Participants performed a maximal vertical jump with a self-selected countermovement depth, with the hands placed on the hips, landing at the midpoint of the mat. Two maximal trials were performed and the mean of the two trials was retained for analysis, matching the procedure used for the SJ.
2.5.4. Functional Movement Screen
Movement quality was assessed with the standard seven-item FMS: deep squat, hurdle step, in-line lunge, shoulder mobility, active straight-leg raise, trunk-stability push-up and rotary stability [4]. Each item is scored on the conventional four-point ordinal scale from 0 to 3, where 0 denotes pain during the movement, 1 an inability to complete the pattern, 2 completion with compensation, and 3 completion without compensation. For the five bilateral items, both sides were screened and the lower of the two scores was carried into the composite, following the standard scoring convention. The composite score is the sum of the seven item scores (range 0–21).
No participant scored 0 on any item, that is, no pain was reported during any screened movement; item scores ranged from 1 to 3 in both groups.
Screening was carried out by three trained and certified assessors, who provided standardized instructions and demonstrations before testing. Only the carried-forward score of each bilateral item was recorded, so the individual left and right scores are not available and FMS asymmetry could not be quantified; this is acknowledged as a limitation. FMS scoring reliability was not assessed in this cohort. Each assessor scored according to the standard criteria [4], but inter-rater agreement among the three assessors was not quantified in this sample. Published estimates indicate good inter-rater reliability for the FMS composite score (pooled ICC ≈ 0.84 [7]), but because item scoring involves subjective judgement, between-group differences of about one point on individual items should be interpreted with caution.
2.5.5. Y-Balance Test
Dynamic balance was assessed with the lower-quarter Y-Balance Test. Participants stood barefoot on the central platform on a single limb and reached as far as possible with the contralateral limb in the anterior, posteromedial and posterolateral directions [11]. After the practice trials completed during familiarization, three recorded trials were performed per direction for each limb and the maximum reach distance in each direction was retained. Reach distances were normalized to limb length, measured from the anterior superior iliac spine to the medial malleolus, and the composite score was calculated as the sum of the three maximal normalized reach distances divided by three times the limb length, expressed as a percentage [10]. Trials were discarded and repeated if the participant lifted or moved the stance foot, touched down with the reach foot, or failed to return to the starting position under control.
2.5.6. One-Repetition Maximum Strength
Maximal dynamic strength was assessed as the one-repetition maximum (1RM) for the barbell back squat and the conventional deadlift; no other lift was tested. After the standardized warm-up, participants completed a specific warm-up of progressively heavier submaximal sets, after which load was increased in decreasing increments until the heaviest load that could be lifted once with acceptable technique was identified, normally within three to five attempts [20]. Rest intervals of 3–5 min separated attempts. The back squat was always tested first and the deadlift second, in the same order for every participant; after the final squat attempt, participants completed the deadlift-specific warm-up of progressively heavier submaximal sets before the first deadlift attempt. Squat depth was standardized to the thighs reaching parallel with the floor, and the conventional deadlift was performed from the floor to full hip and knee extension. According to the clubs’ coaching staff, both lifts formed part of the regular resistance-training programmes of both groups, so neither test is expected to have been an unfamiliar movement; individual exposure to either lift (frequency, volume, training age) was, however, not recorded (Section 2.2). Attempts were terminated on any technical fault, and no eccentric–concentric pause manipulation was applied [21].
2.5.7. Eccentric Knee-Flexor Force
Maximal eccentric knee-flexor force was assessed during the bilateral Nordic hamstring exercise on an instrumented device (NordBord, VALD Performance, Newstead, Australia) sampling at 50 Hz. Participants knelt on the padded board with the ankles secured above the lateral malleoli by individual load cells and were instructed to lower themselves forward as slowly as possible while maintaining a neutral hip position and to resist the fall maximally throughout the range. Peak force (N) was recorded separately for the left and right limbs, and the between-limb asymmetry was calculated as the difference between limbs expressed as a percentage of the higher limb [14,15]. Three repetitions were performed after submaximal familiarization repetitions, and the highest peak force per limb was retained.
Between-limb asymmetry was calculated for each participant as |left − right| expressed as a percentage of the higher limb. In addition, because absolute force and absolute barbell loads scale with body size, eccentric knee-flexor force was also expressed relative to body mass (N·kg−1) and the two 1RM measures relative to body mass (kg·kg−1) and allometrically as kg·kg−0.67. These normalised variables and the two asymmetry indices form a pre-specified secondary family of six comparisons with its own Benjamini–Hochberg adjustment.
2.6. Statistical Analysis
Before analysis, the data were screened for implausible values and the distribution of every continuous variable was inspected within each group. Normality was assessed with the Shapiro–Wilk test and homogeneity of variance with Levene’s test, separately for each dependent variable (Section 3.2). The 1RM back squat was pre-specified as the primary outcome; all other comparisons are secondary or exploratory and are interpreted as such. Because players were recruited from several clubs, observations from players of the same club may not be fully independent; club membership was not modelled as a random effect in the between-group analyses, and the consequences of this are considered in the Limitations.
Continuous variables that satisfied both assumptions in both groups were compared with independent-samples t-tests and are summarised as mean ± SD, together with the mean difference and its 95% confidence interval (CI). Variables that violated normality in at least one group, or for which variances were heterogeneous, were compared with the Mann–Whitney U test and are summarised as median [interquartile range]. Because the seven FMS items and the FMS composite score are ordinal, they were analysed with the Mann–Whitney U test a priori, irrespective of the distributional checks; the Levene’s test values reported for these variables in Section 3.2 are provided for completeness only and did not influence test selection.
Effect sizes were Cohen’s d for t-tests and the rank-based correlation r = |z|/√N for Mann–Whitney tests, where z is the standardised test statistic and N the total sample size. They were interpreted using conventional thresholds (d: 0.20 small, 0.50 medium, 0.80 large; r: 0.10 small, 0.30 medium, 0.50 large) [22]. Multiplicity was controlled within two pre-specified families using the Benjamini–Hochberg procedure, with the false discovery rate set at 5% [23]: a primary family comprising the 16 between-group comparisons of the measured variables, and a secondary family comprising the six comparisons of body-mass-normalised strength and inter-limb asymmetry. Both the unadjusted p-value and the adjusted q-value are reported (Section 3.8). Because Cohen’s d and r are expressed on different scales, they were not ranked against each other directly. To compare effect magnitudes across variables analysed with different tests, each Cohen’s d was additionally converted to its r-equivalent, r = d/√(d2 + a) with a = (n1 + n2)2/(n1n2) [24], so that every comparison is also expressed on a common r scale; all statements about the relative size of effects, including their ordering in Section 3.8, refer to this common metric.
Associations among the performance, movement-quality and balance measures were examined separately within each group. For each variable pair the coefficient was selected on the basis of the distributional checks described in Section 3.2: Pearson’s r when both variables satisfied normality within that group, and Spearman’s ρ otherwise, including every pair involving an ordinal FMS score. Coefficients were interpreted as trivial (<0.10), small (0.10–0.29), moderate (0.30–0.49), large (0.50–0.69), very large (0.70–0.89) or near-perfect (≥0.90) [25]. Because the difference between a significant and a non-significant coefficient is not itself a test of the difference between coefficients [26], every claim that an association differed between competitive levels was tested formally: the two independent coefficients were transformed with Fisher’s r-to-z transformation and their difference was tested with a z-test, using the standard error √[c/(n1 − 3) + c/(n2 − 3)], with c = 1 for Pearson coefficients and the conservative c = 1.06 whenever at least one of the two coefficients was a Spearman coefficient. Each difference between coefficients (professional minus amateur) is reported with its 95% CI computed with Zou’s method [27], which combines the confidence limits of the two individual coefficients (obtained on the Fisher z scale with the same c) into an interval for the difference on the correlation scale (Section 3.10). These comparisons were pre-specified as exploratory. Because eight between-group contrasts were tested, they were treated as a third family and adjusted with the Benjamini–Hochberg procedure; both unadjusted p-values and adjusted q-values are reported (Section 3.10). The remaining coefficients in the correlation matrices (Section 3.10) are descriptive and unadjusted, and no inference is drawn from their individual p-values.
Statistical significance was set at p < 0.05 (two-tailed) for unadjusted tests and at q < 0.05 within each adjusted family. Descriptive and inferential analyses were performed in IBM SPSS Statistics v.32.0.0 (IBM Corp., Armonk, NY, USA). The Benjamini–Hochberg adjustment, the Fisher r-to-z comparisons, the derived relative-strength and asymmetry variables, and all figures were produced in Python v.3.14.4 using SciPy v.1.18.1, pandas v.3.0.5, Matplotlib v.3.10.9 and seaborn v.0.13.2.
3. Results
3.1. Participant Characteristics
The two groups were closely matched on all baseline characteristics, with no statistically significant differences in age, stature, body mass or body-fat percentage (all p ≥ 0.62; Table 1). Subsequent between-group differences in performance are therefore unlikely to be attributable to gross demographic or body-composition disparities.
Table 1.
Baseline characteristics of the two groups (mean ± SD).
3.2. Distributional Assumptions
The distributional checks and the resulting choice of inferential test for each dependent variable are shown in Table 2. The 1RM deadlift, both eccentric knee-flexor force variables and the squat jump deviated significantly from normality in at least one group, and the variances of the 1RM deadlift and the in-line lunge were heterogeneous between groups; these variables were therefore analysed with the Mann–Whitney U test. The seven FMS items and the composite score were analysed non-parametrically by design.
Table 2.
Distributional assumption checks and the inferential test applied to each dependent variable.
3.3. Data Screening
During data screening, one professional participant recorded an anatomically implausible left-limb YBT composite score of 16.84%, whereas the remaining 143 observations ranged from 68.8% to 97.2% and the same participant’s right-limb score was 79.1%. The value was judged to be a transcription error and was excluded from the left-limb balance analysis and from the balance-asymmetry analysis only; the analysed sample for those variables is therefore n = 71 in the professional group. The Shapiro–Wilk and Levene values reported for this variable in Table 2 were computed after the exclusion. No other value was removed, and no participant was excluded from any other analysis.
The implausible value was identified during post-collection data screening; no outlier rule had been specified in advance. Because the exclusion was therefore made post hoc, a sensitivity analysis was performed. Retaining the observation, the professional left-limb composite becomes 84.03 ± 10.48% and the parametric comparison is no longer significant (t(142) = 0.89, p = 0.373, d = 0.15), whereas the rank-based comparison, which is insensitive to the magnitude of a single extreme value, remains nominally significant (U = 2088, z = −1.98, p = 0.048, r = 0.17). The left-limb result is therefore sensitive to this single observation under the parametric test.
3.4. Maximal and Eccentric Strength
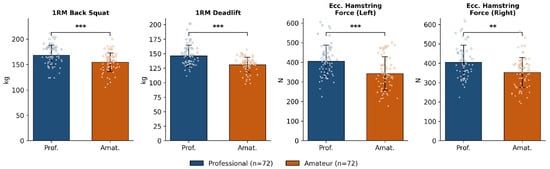
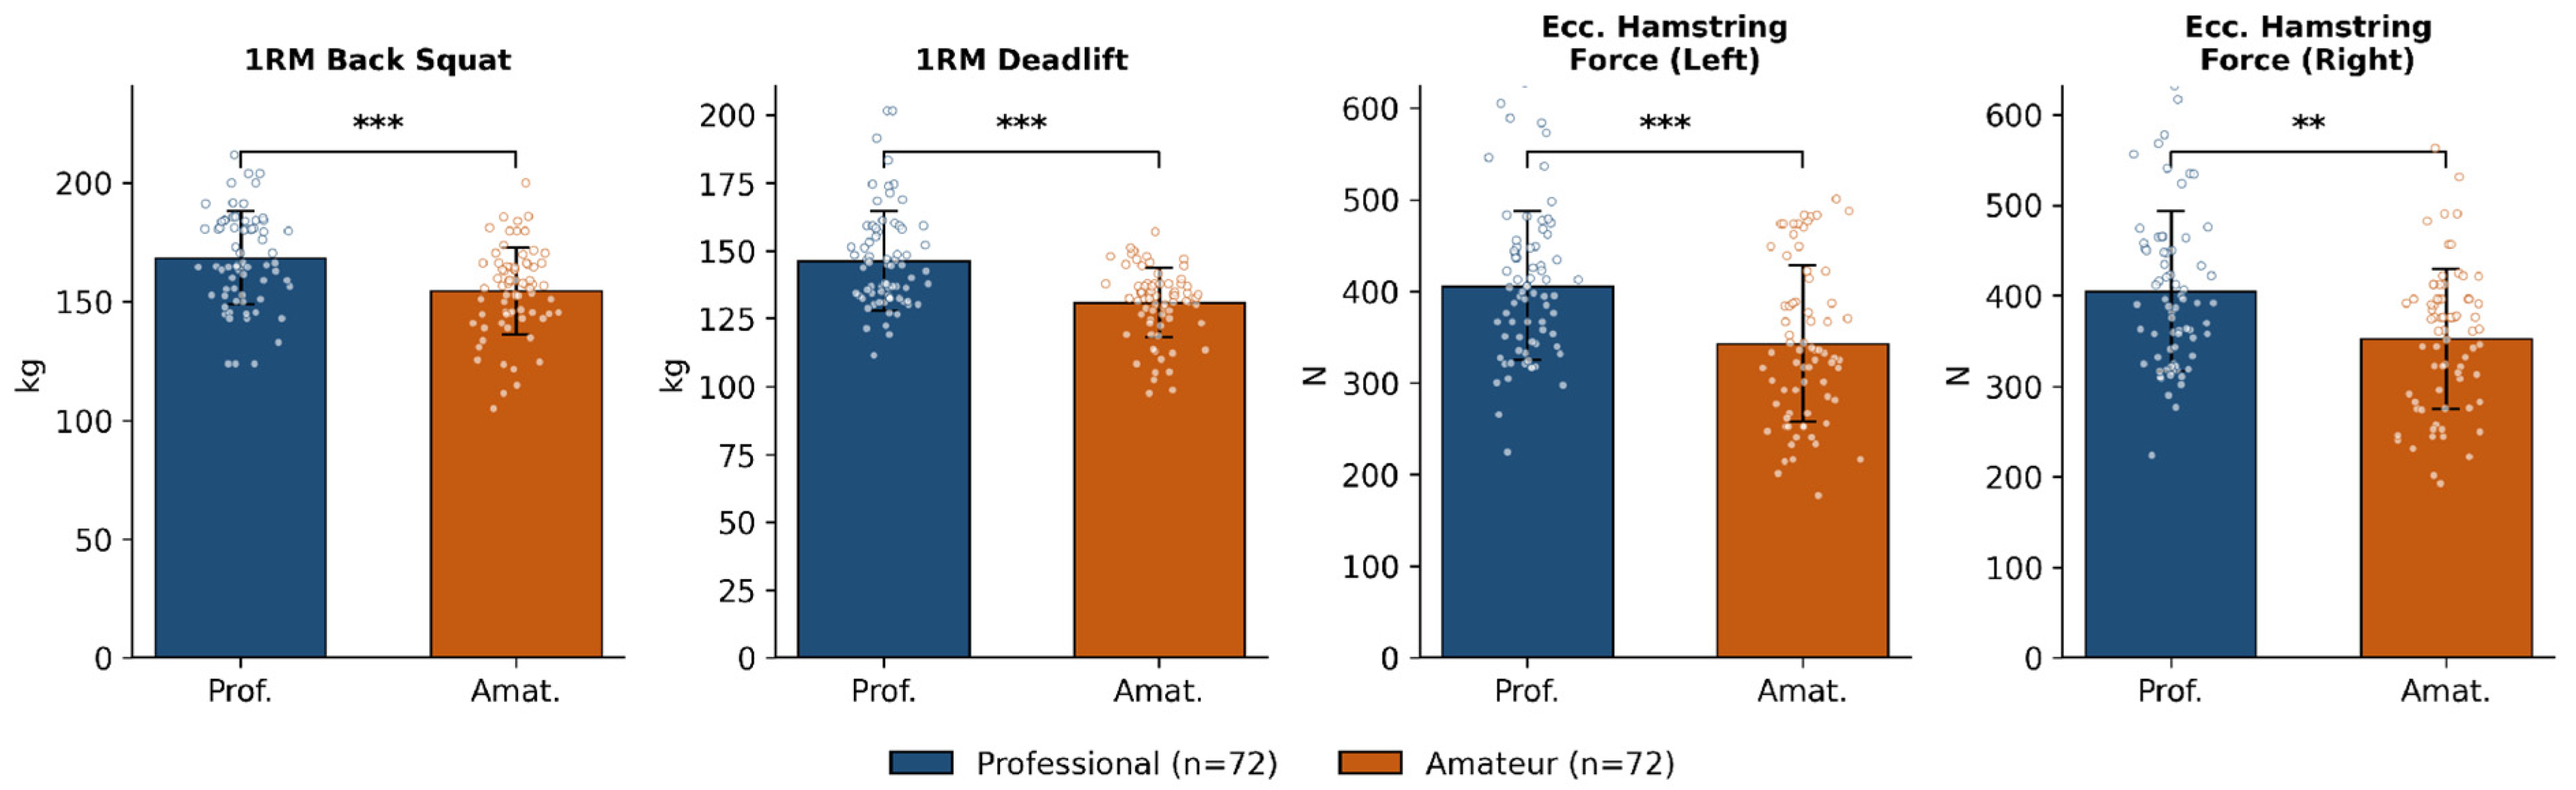
Professional players were stronger than amateur players on every strength measure (Figure 1). The 1RM back squat was higher in professionals (168.4 ± 19.5 vs. 154.6 ± 18.2 kg; t(142) = 4.41, p < 0.001, mean difference 13.8 kg, 95% CI [7.6, 20.0], Cohen’s d = 0.73), as was the 1RM deadlift (median 143.2 [133–157] vs. 132.7 [125–138] kg; U = 1354, z = −4.95, p < 0.001, r = 0.41). Eccentric knee-flexor force was likewise higher in professionals for the left limb (399.0 [344–448] vs. 333.1 [275–395] N; U = 1578, z = −4.05, p < 0.001, r = 0.34) and the right limb (391.2 [334–451] vs. 362.5 [289–396] N; U = 1814, z = −3.11, p = 0.002, r = 0.26). All four comparisons remained significant after FDR control (Section 3.8).
Figure 1.
Maximal strength (1RM back squat, 1RM deadlift) and eccentric knee-flexor force (left, right) in professional and amateur players. Bars show mean ± SD with individual data points overlaid. Inference for the deadlift and both eccentric-force variables was by Mann–Whitney U test; ** q < 0.01, *** q < 0.001 after Benjamini–Hochberg correction.
3.5. Jump Performance
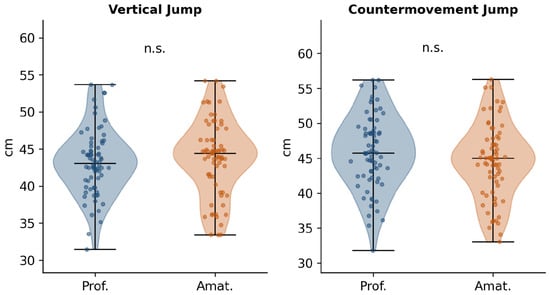
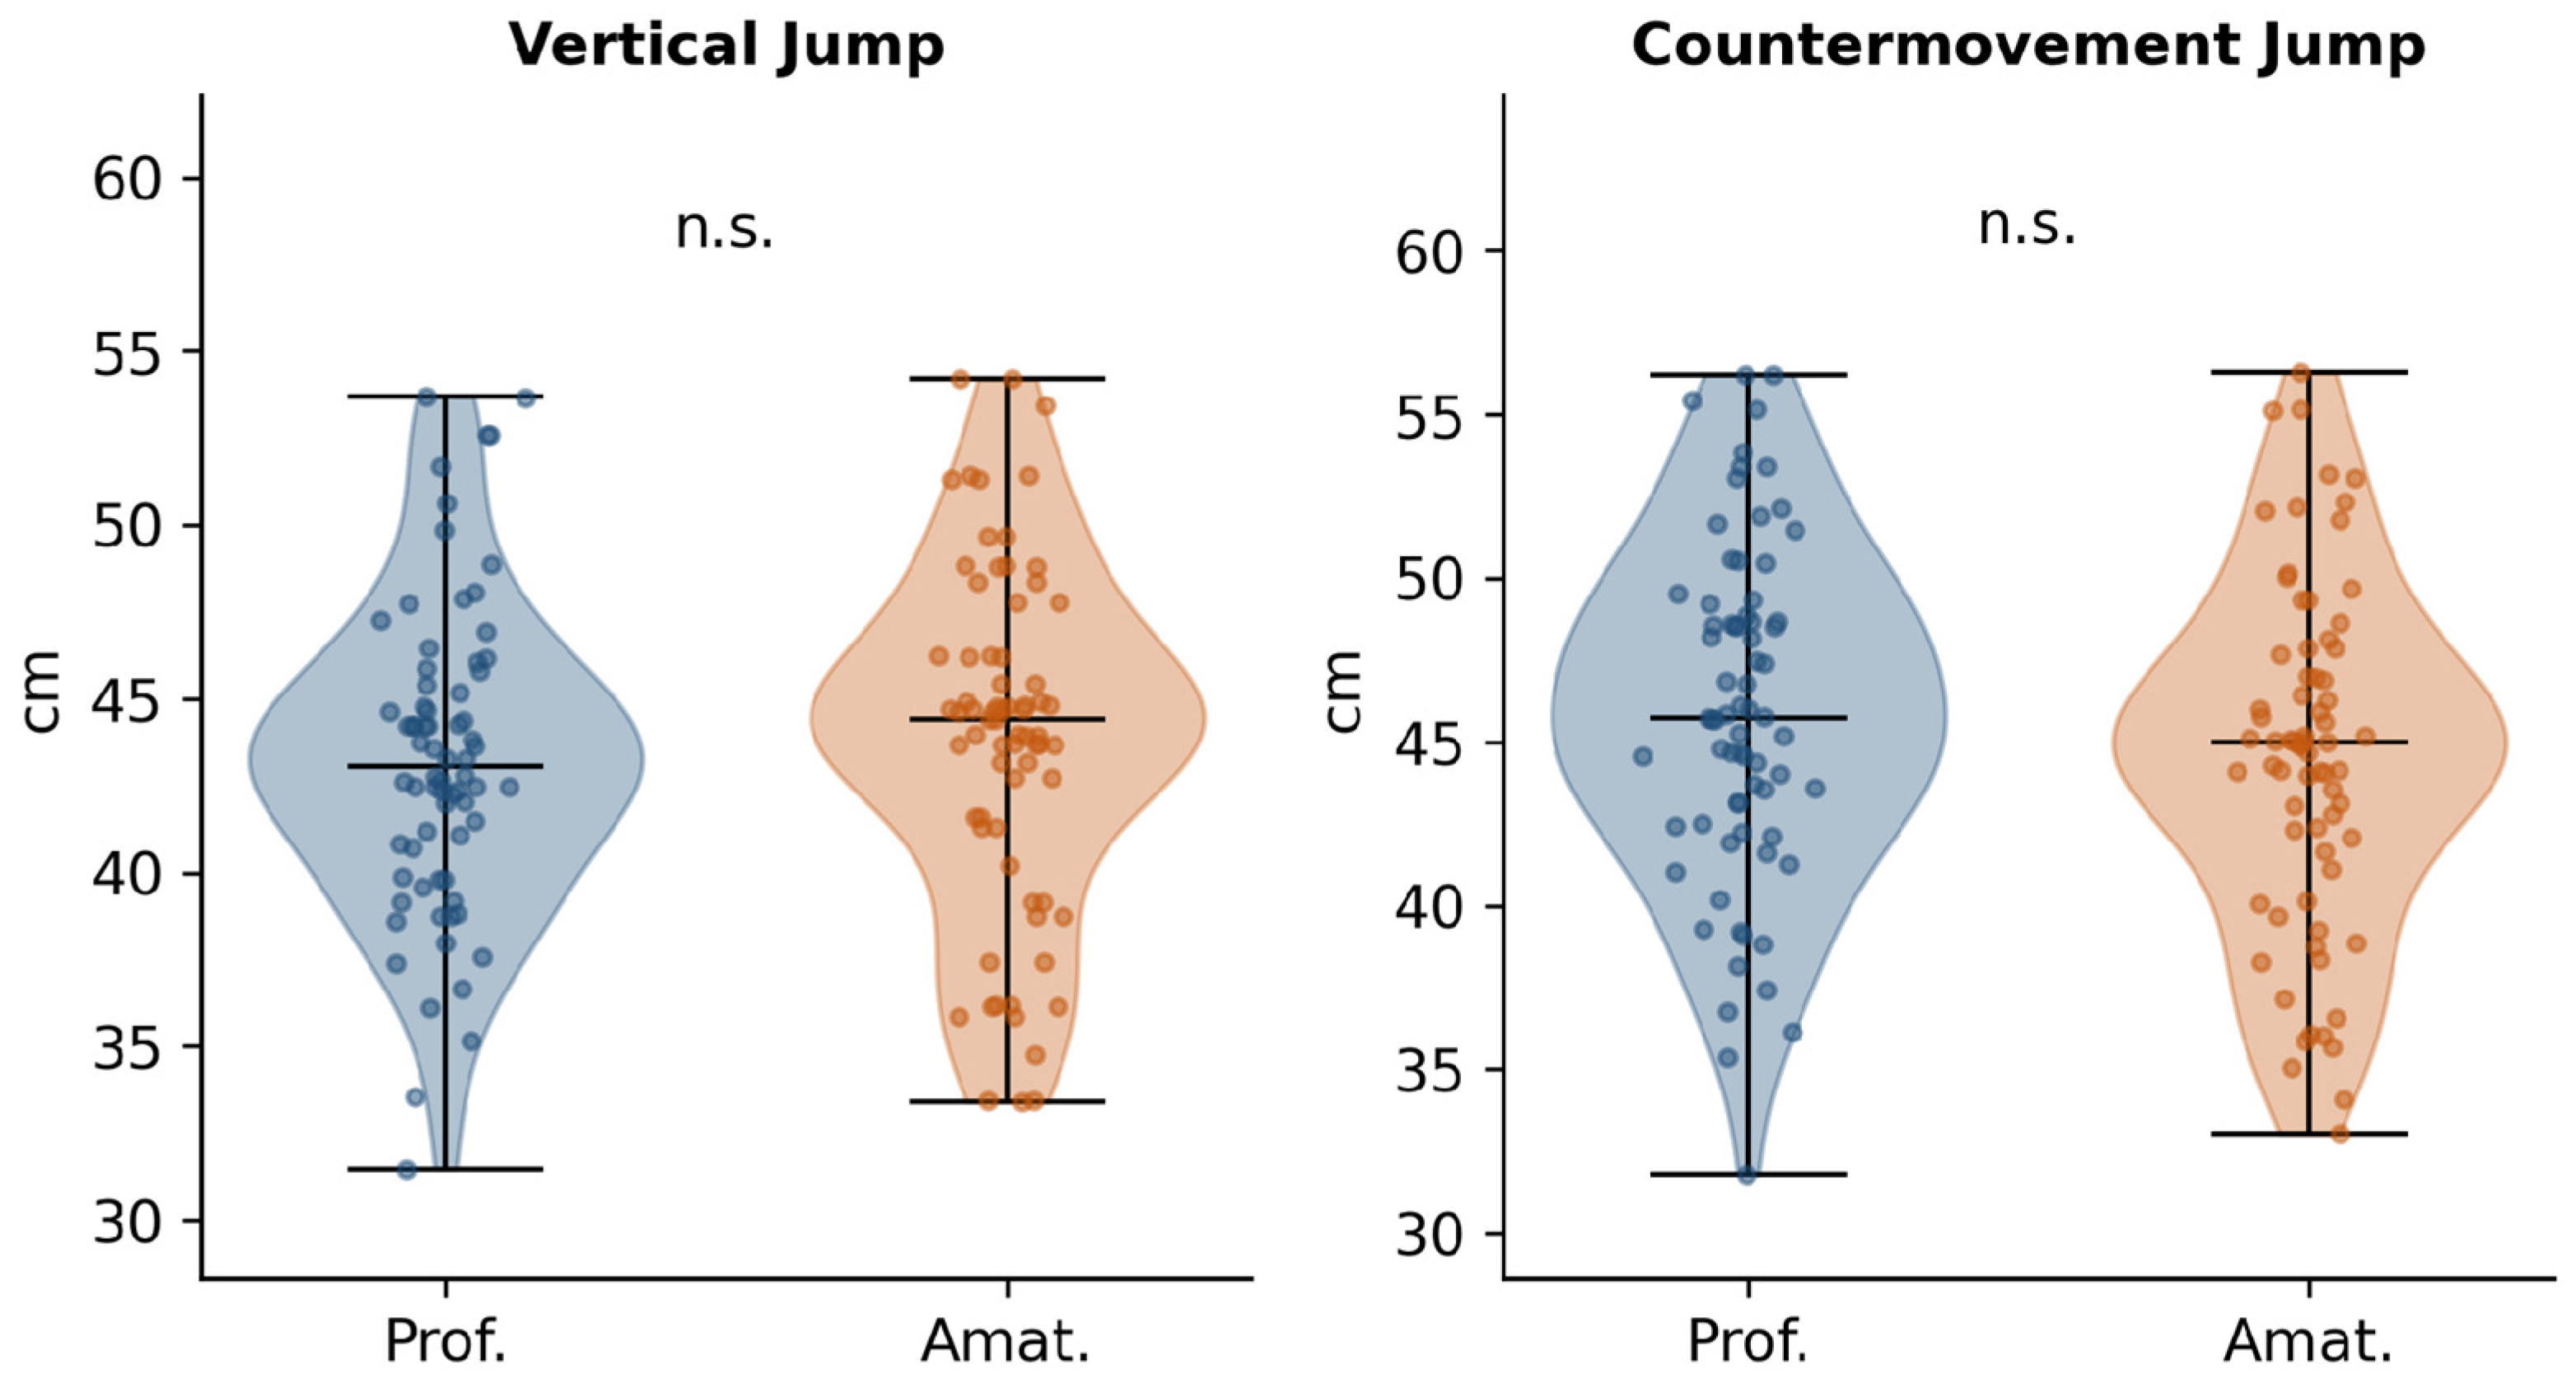
In contrast to the strength measures, jump height did not differ between groups (Figure 2). Countermovement-jump height was comparable in professionals and amateurs (45.9 ± 5.2 vs. 44.5 ± 5.3 cm; t(142) = 1.57, p = 0.119, d = 0.26), and squat-jump height was also statistically similar (43.0 [40–46] vs. 44.4 [41–46] cm; U = 2271, z = −1.28, p = 0.200, r = 0.11), with amateurs jumping marginally higher on average in the squat jump. Neither comparison approached significance after FDR control.
Figure 2.
Squat-jump and countermovement-jump height by competitive level. Violin plots show the full distribution; the horizontal line denotes the median. The panel labelled “Vertical Jump” corresponds to the squat jump as defined in the Methods. Differences were non-significant.
3.6. Movement Quality
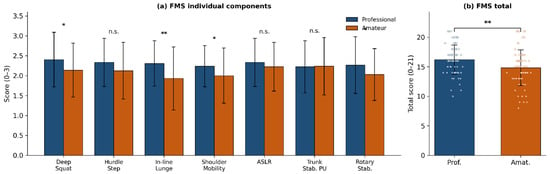
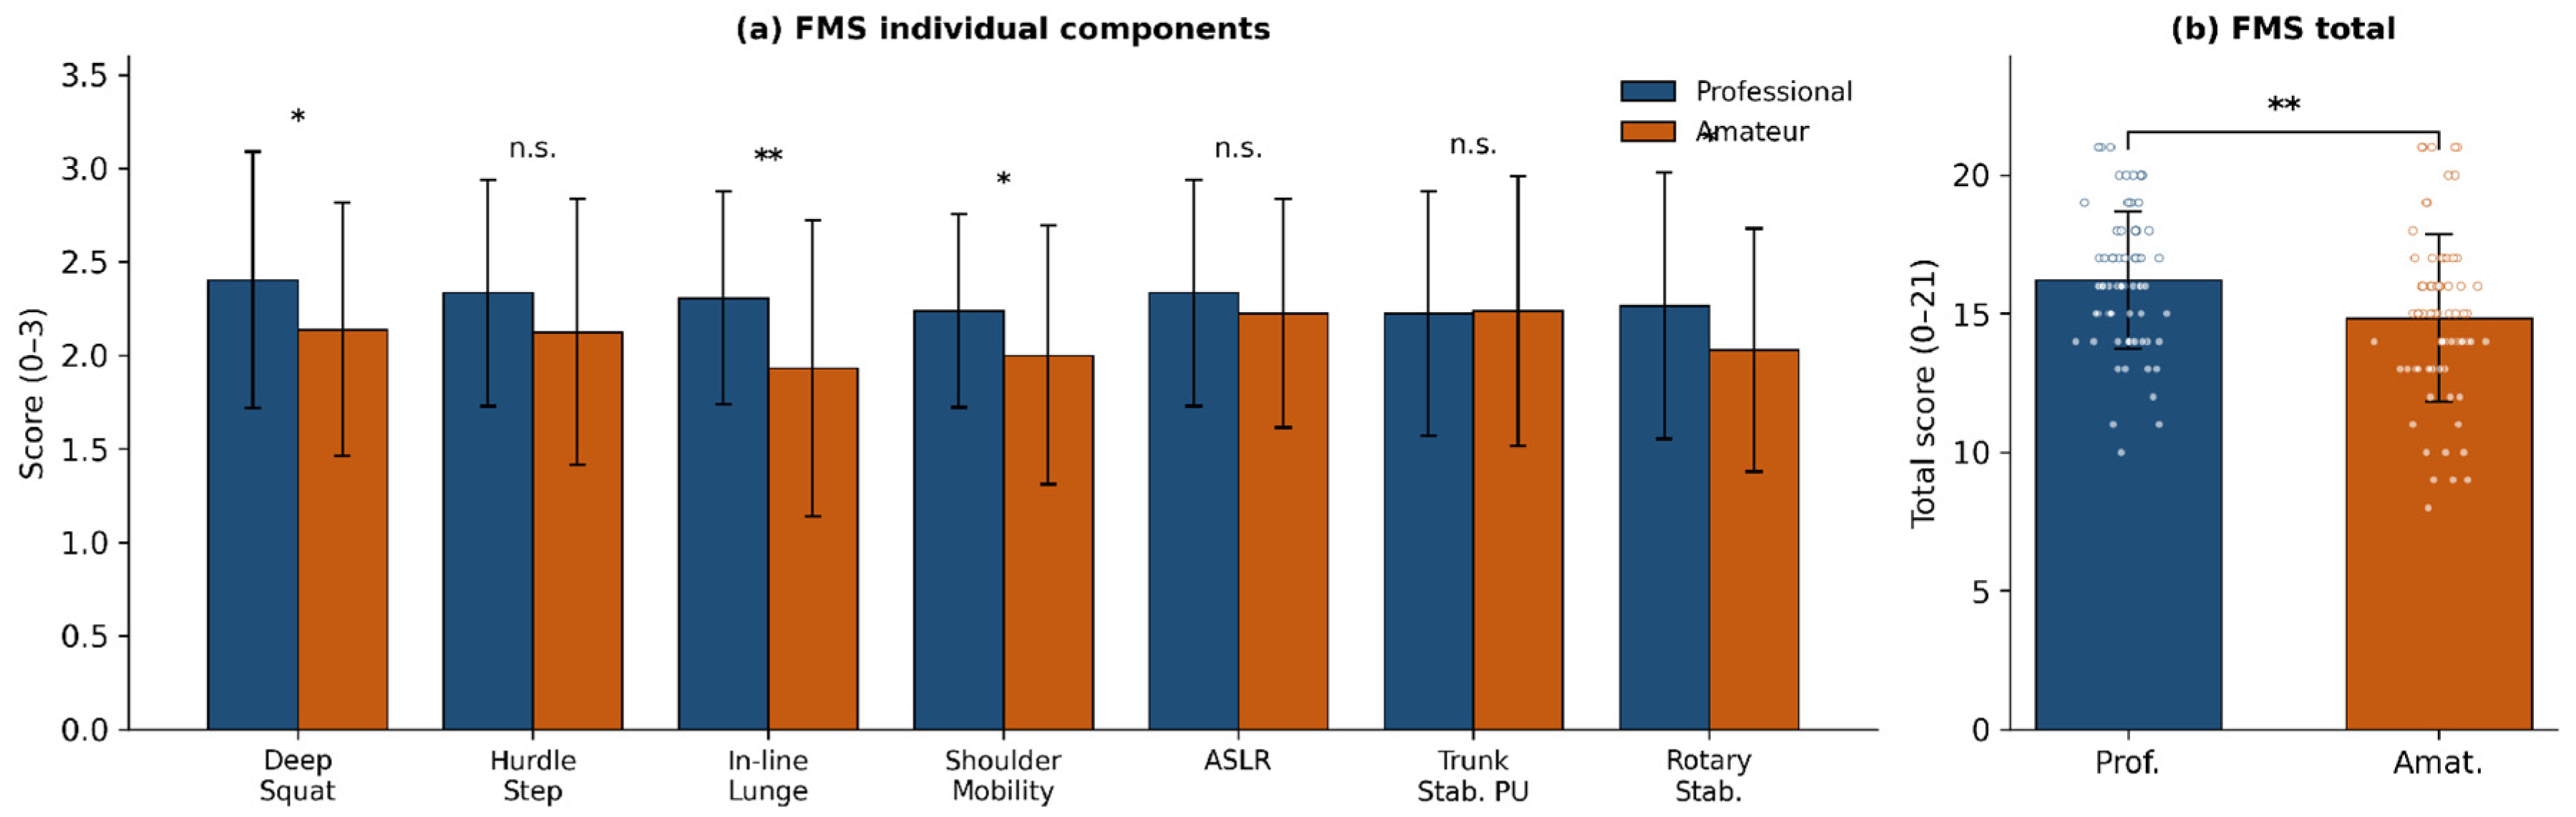
FMS scores were compared with the Mann–Whitney U test (Table 3, Figure 3). Professional players scored higher than amateurs on the deep squat, the in-line lunge, shoulder mobility and rotary stability, and on the FMS composite score (median 16 [14–18] vs. 15 [13–16]; U = 1834, z = −3.05, p = 0.002, r = 0.25). No differences emerged for the hurdle step, the active straight-leg raise or the trunk-stability push-up. After FDR control, the composite score, the in-line lunge and the deep squat remained significant, whereas the differences in shoulder mobility and rotary stability did not (both q = 0.057; Section 3.8). The magnitude of every FMS effect was small (r = 0.02–0.25), and the group medians differed by at most one point on any single item.
Table 3.
Functional Movement Screen scores by competitive level (Mann–Whitney U test).
Figure 3.
(a) Individual FMS item scores and (b) FMS composite score by competitive level. Means ± SD are shown for visualisation only; all inference was by Mann–Whitney U test on the ordinal scores. * p < 0.05, ** p < 0.01, n.s. = not significant (unadjusted).
3.7. Dynamic Balance
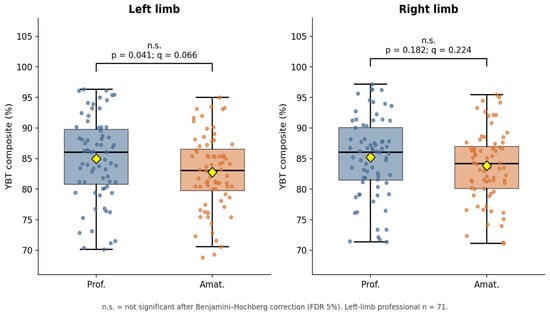
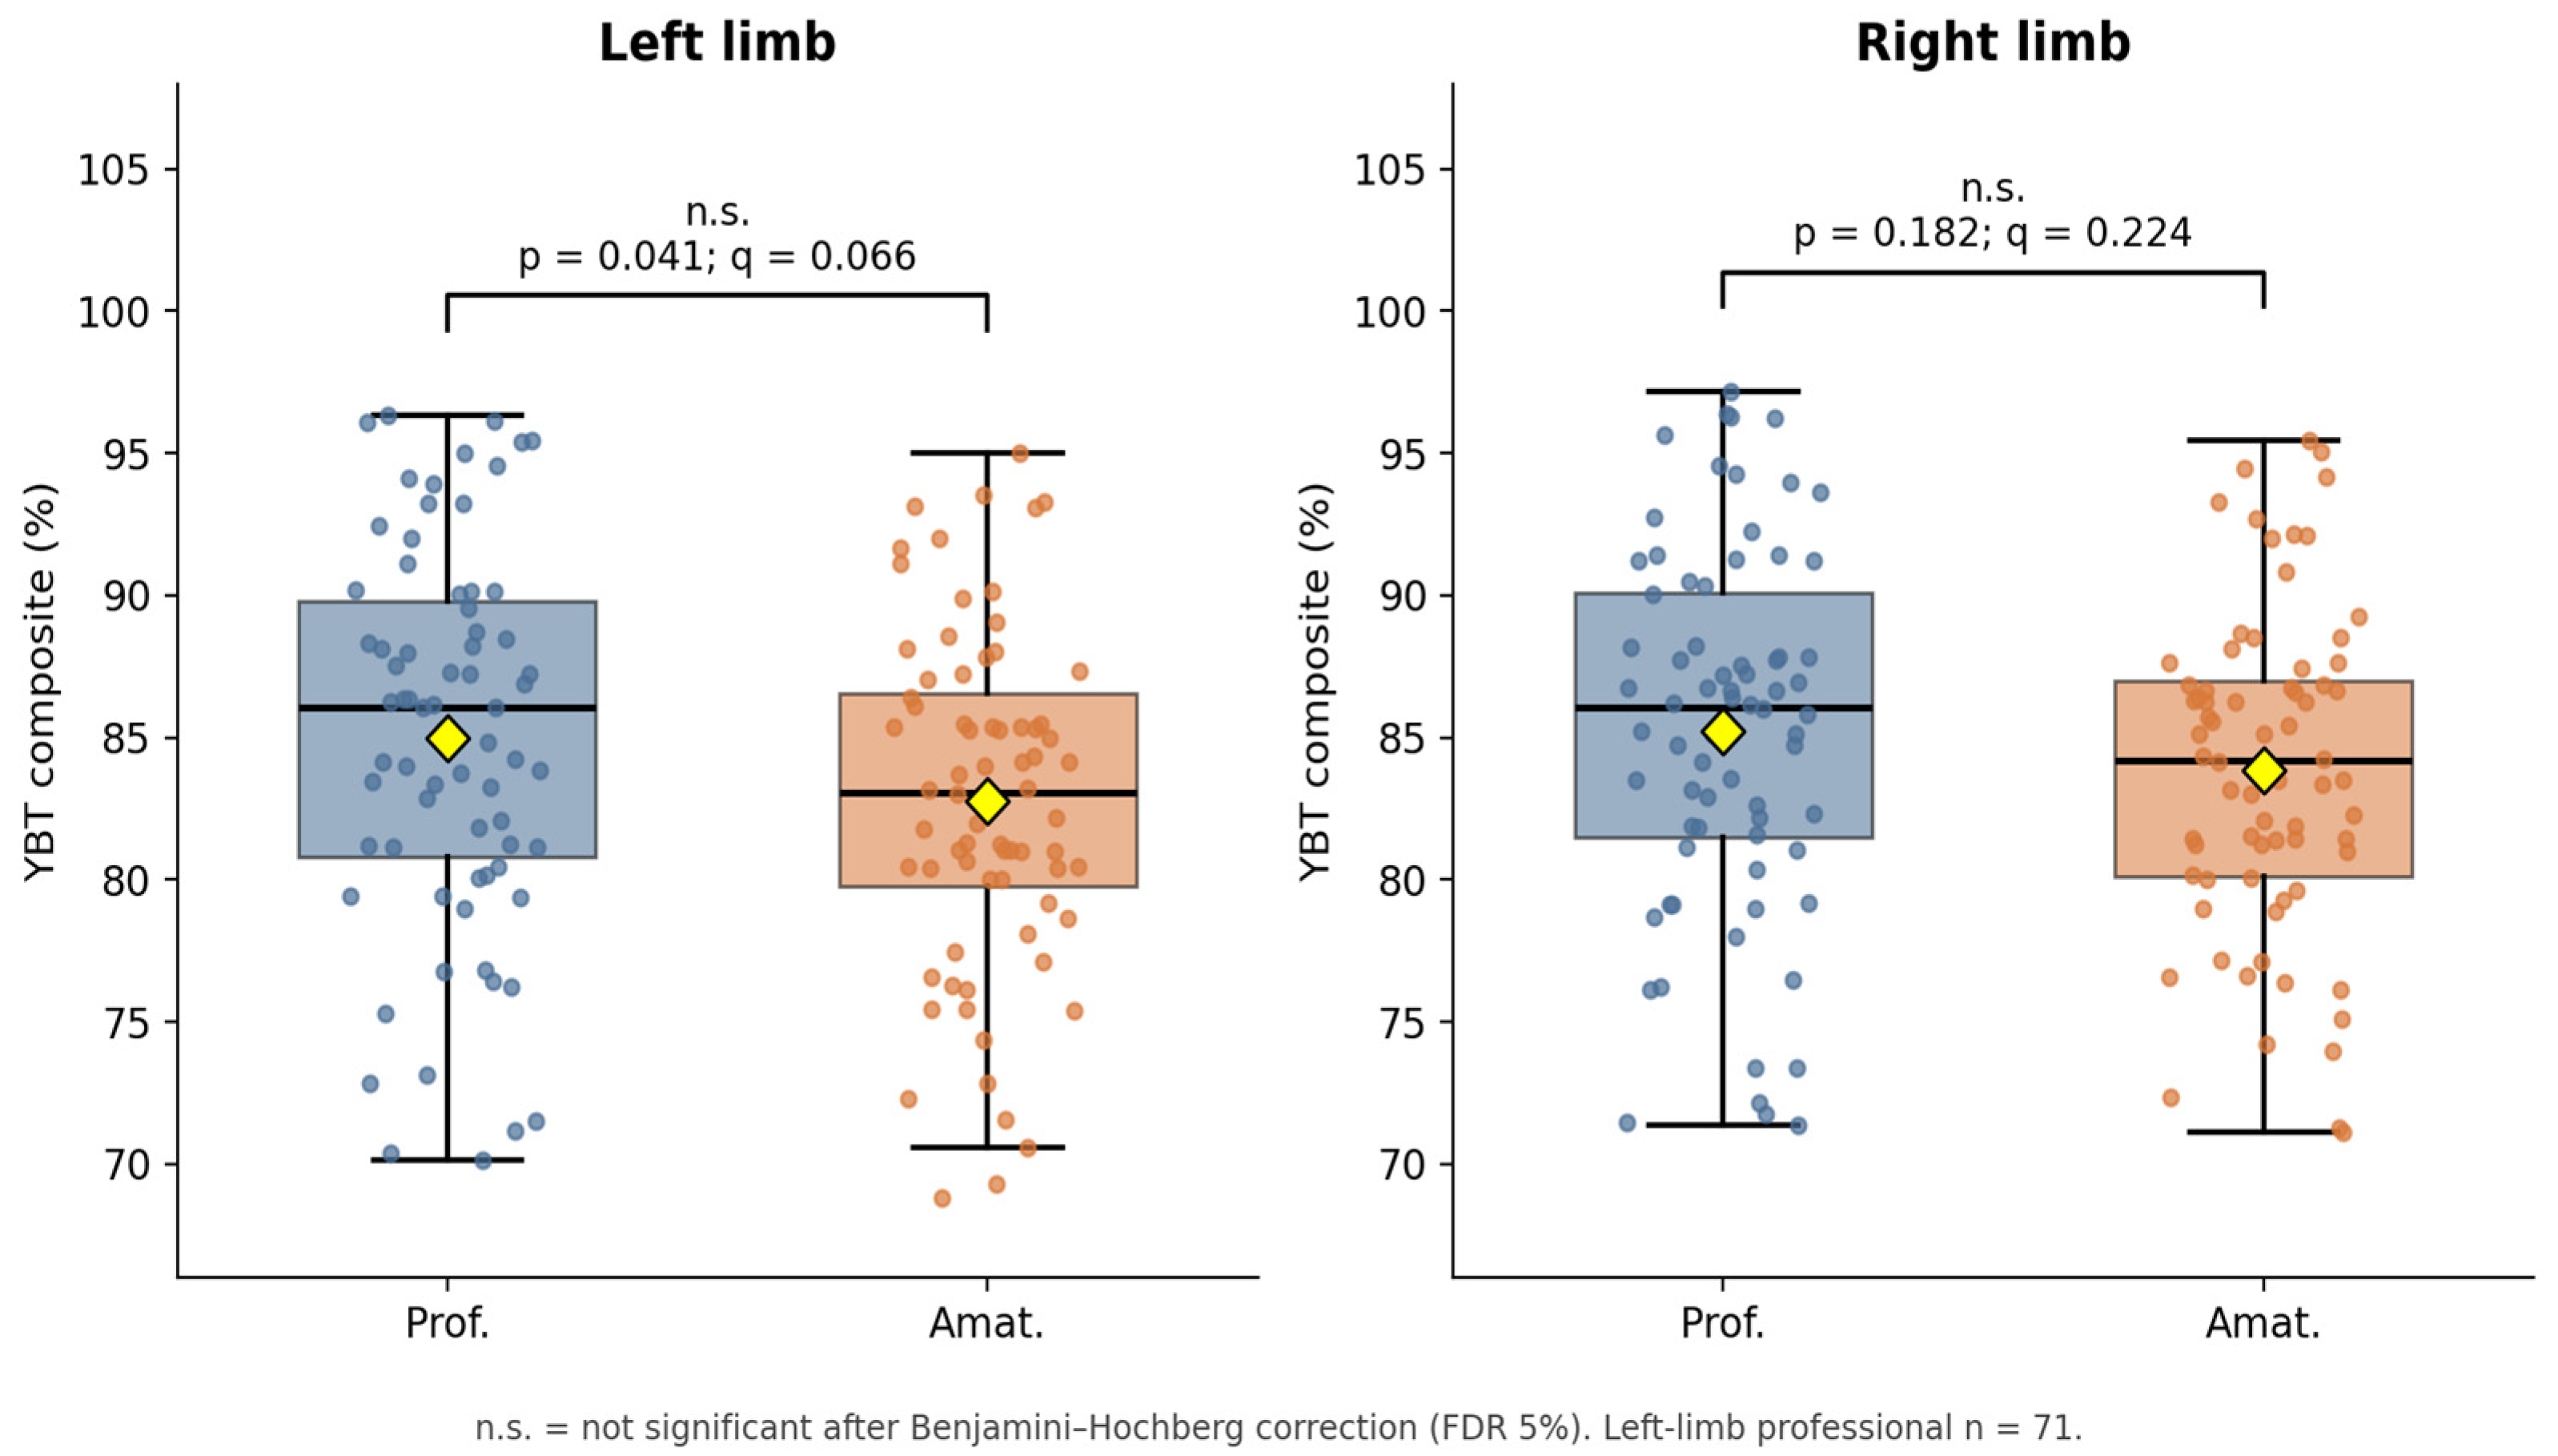
There was no robust between-group difference in dynamic balance (Figure 4). The right-limb YBT composite did not differ (85.2 ± 6.5 vs. 83.9 ± 5.8%; t(142) = 1.34, p = 0.182, d = 0.22, q = 0.224). The left-limb composite showed only a small nominal difference (85.0 ± 6.8 vs. 82.8 ± 6.1%; t(141) = 2.06, p = 0.041, d = 0.35) that did not survive FDR control (q = 0.066) and depended on the handling of a single observation (Section 3.3); it is therefore not interpreted as evidence of a level difference. Given that the left and right composite scores were near-perfectly correlated within both groups (r = 0.97), the apparent side-specificity of the nominal result is more plausibly a threshold artefact than a genuine limb effect.
Figure 4.
Y-Balance Test composite scores (left and right limbs) by competitive level. Boxes show the median and interquartile range; yellow diamonds denote the mean; points are individual scores. Neither limb differed between groups after Benjamini–Hochberg correction (left: p = 0.041, q = 0.066; right: p = 0.182, q = 0.224); n.s. = not significant after FDR control. Left-limb professional n = 71 after exclusion of the transcription error (Section 3.3).
3.8. Summary of Between-Group Comparisons
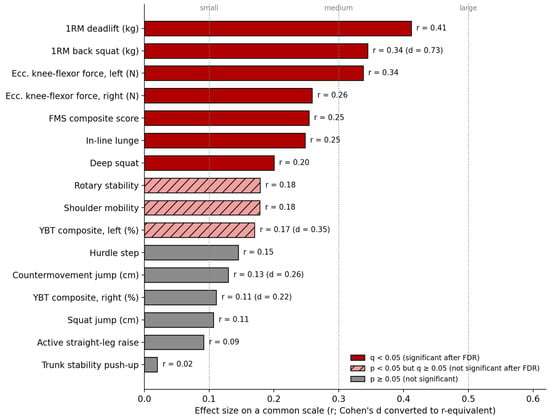
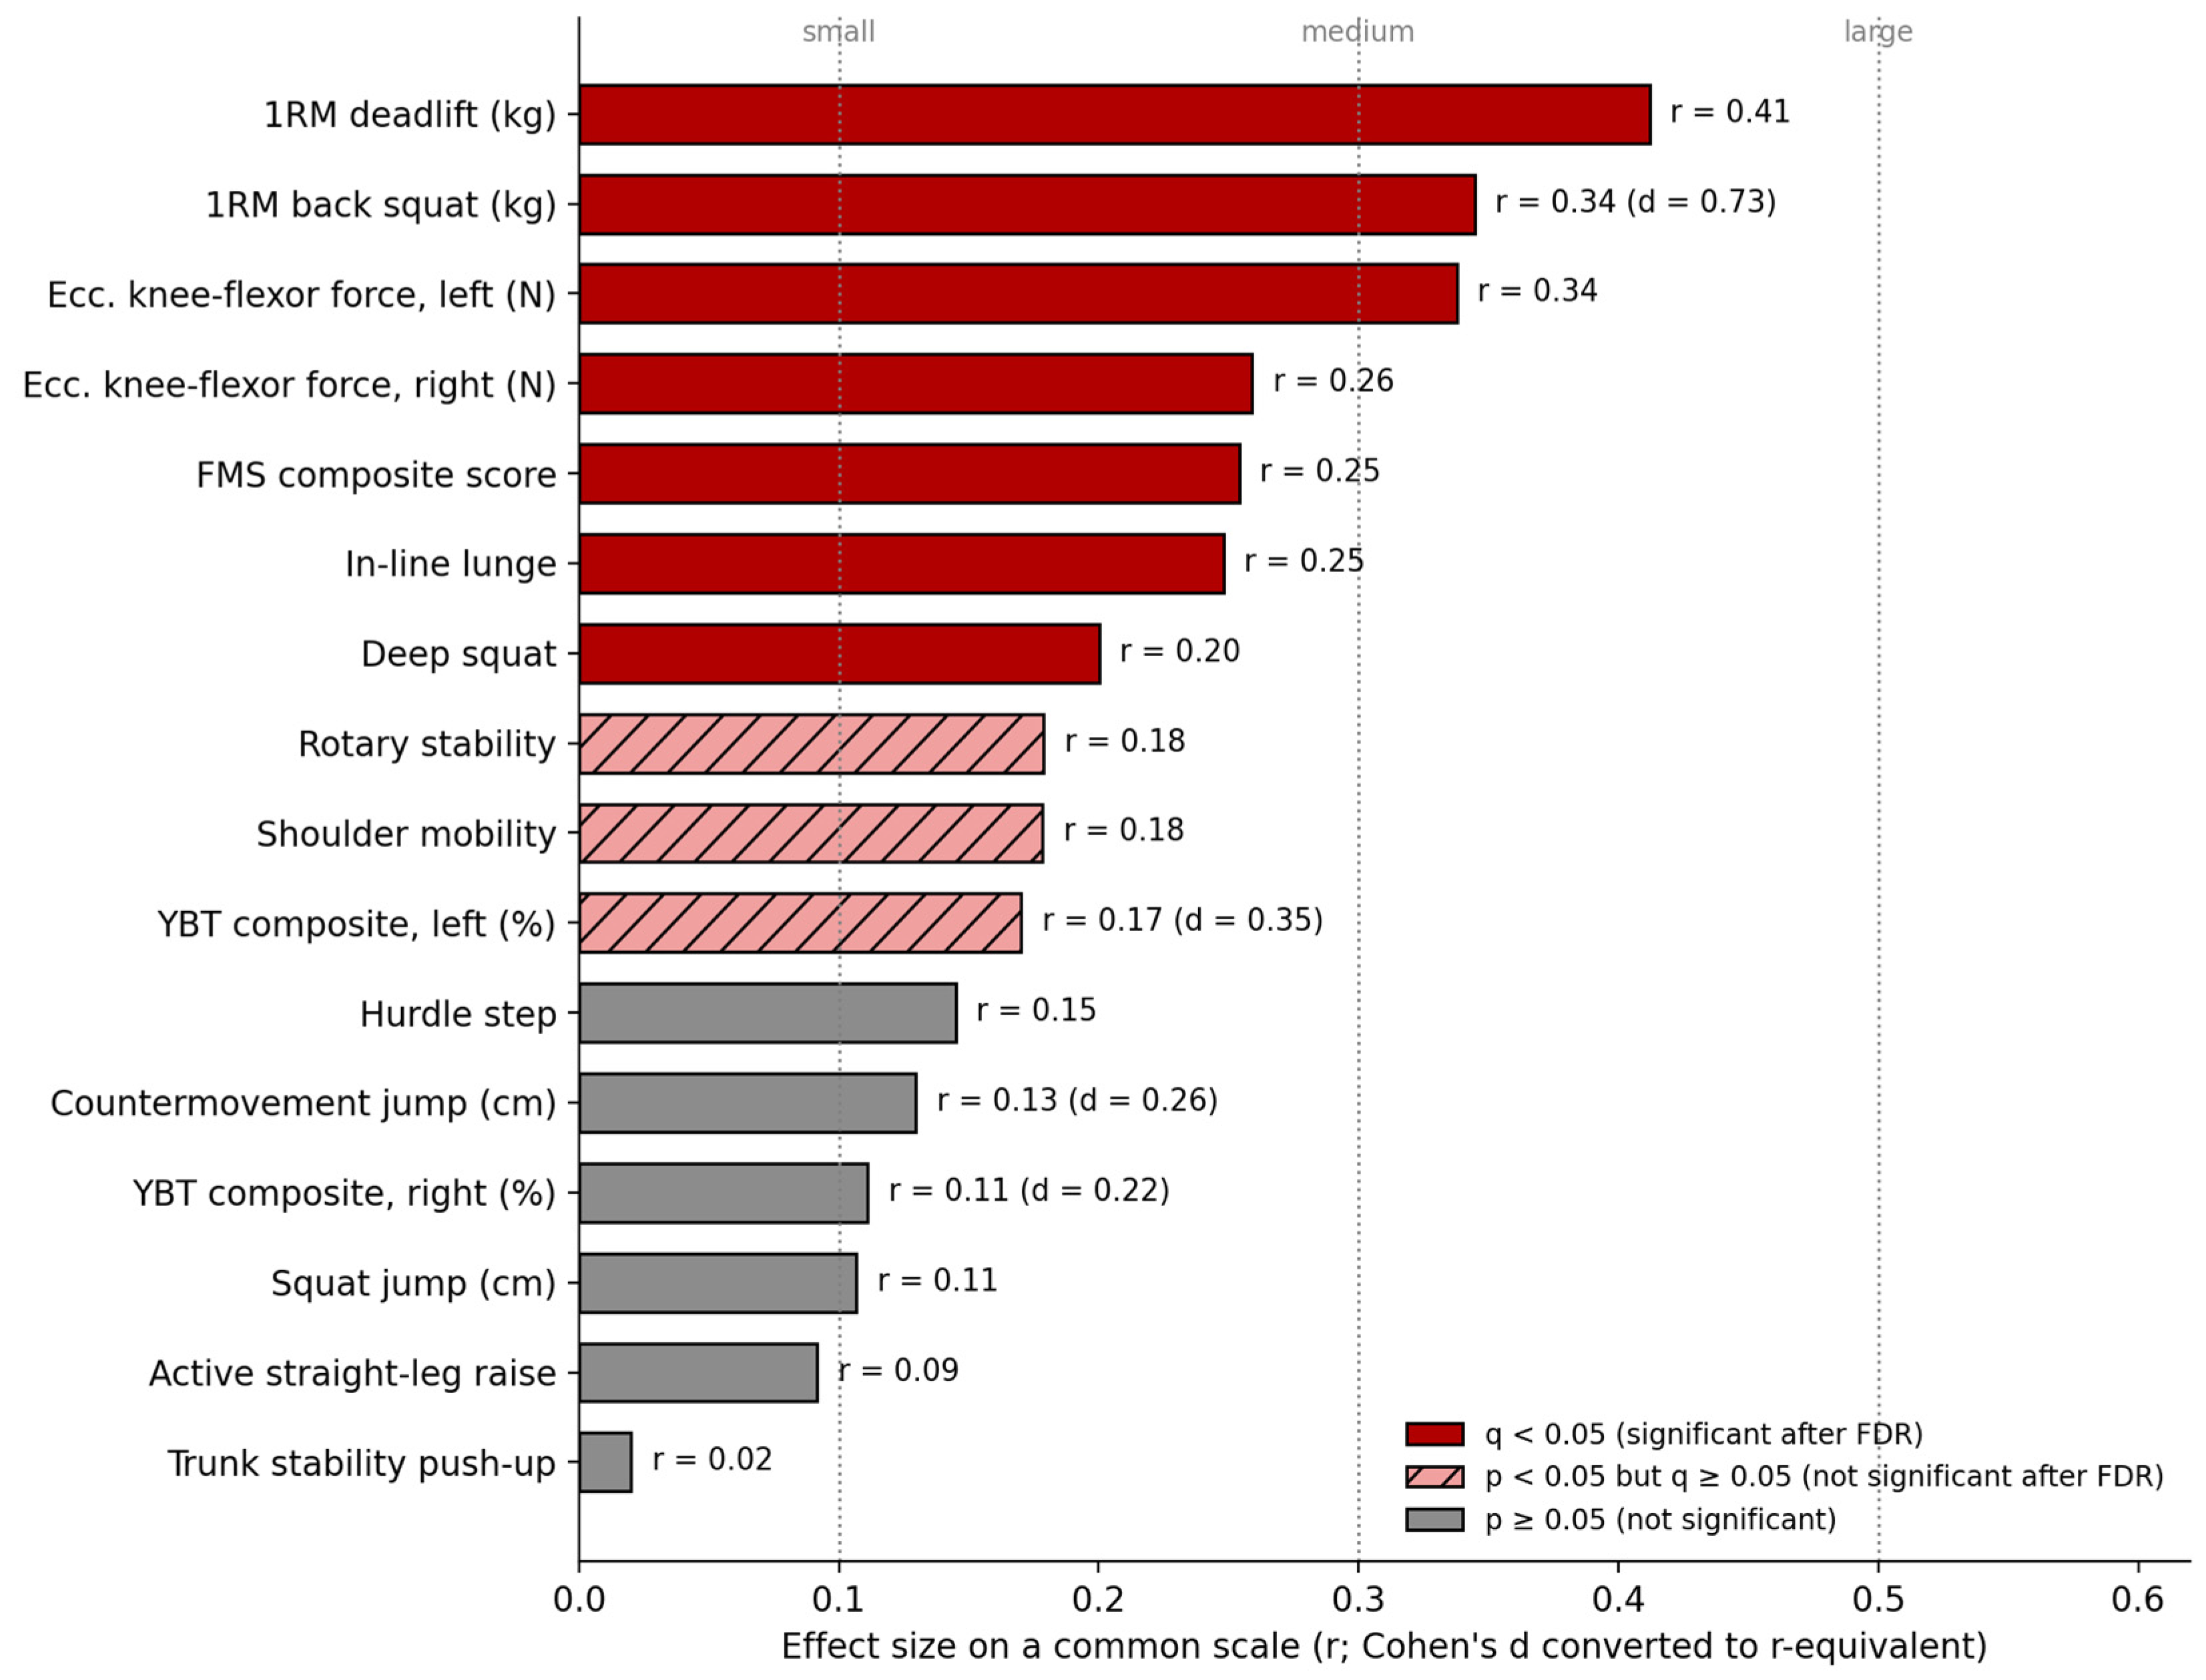
Table 4 consolidates all 16 comparisons together with the test applied, the effect size, the unadjusted p-value and the Benjamini–Hochberg adjusted q-value; Figure 5 orders the variables by effect magnitude on the common r scale (Cohen’s d converted to its r-equivalent). Seven comparisons remained significant after FDR control: the two 1RM measures, both eccentric knee-flexor variables, the FMS composite score, the in-line lunge and the deep squat. The largest effects were observed for maximal and eccentric strength (1RM deadlift r = 0.41; 1RM back squat d = 0.73, r-equivalent = 0.34; left eccentric knee-flexor force r = 0.34), intermediate effects for the FMS composite and selected movement items, and negligible effects for jump height, trunk stability and the active straight-leg raise. Three comparisons that were nominally significant at p < 0.05—shoulder mobility, rotary stability and the left-limb YBT composite—did not survive adjustment, and are therefore not interpreted as evidence of a level difference.
Table 4.
Complete summary of professional-versus-amateur comparisons.
Figure 5.
Magnitude of all between-group effects on a common scale. Cohen’s d values (t-tests) were converted to r-equivalents so that every comparison is expressed as r; variables are ordered from largest to smallest. Dark red bars: significant after Benjamini–Hochberg correction (q < 0.05); hatched light bars: nominally significant (p < 0.05) but not after correction; grey bars: not significant (p ≥ 0.05). Dotted lines mark the conventional r thresholds of 0.10, 0.30 and 0.50.
3.9. Body-Size-Normalised Strength and Inter-Limb Asymmetry
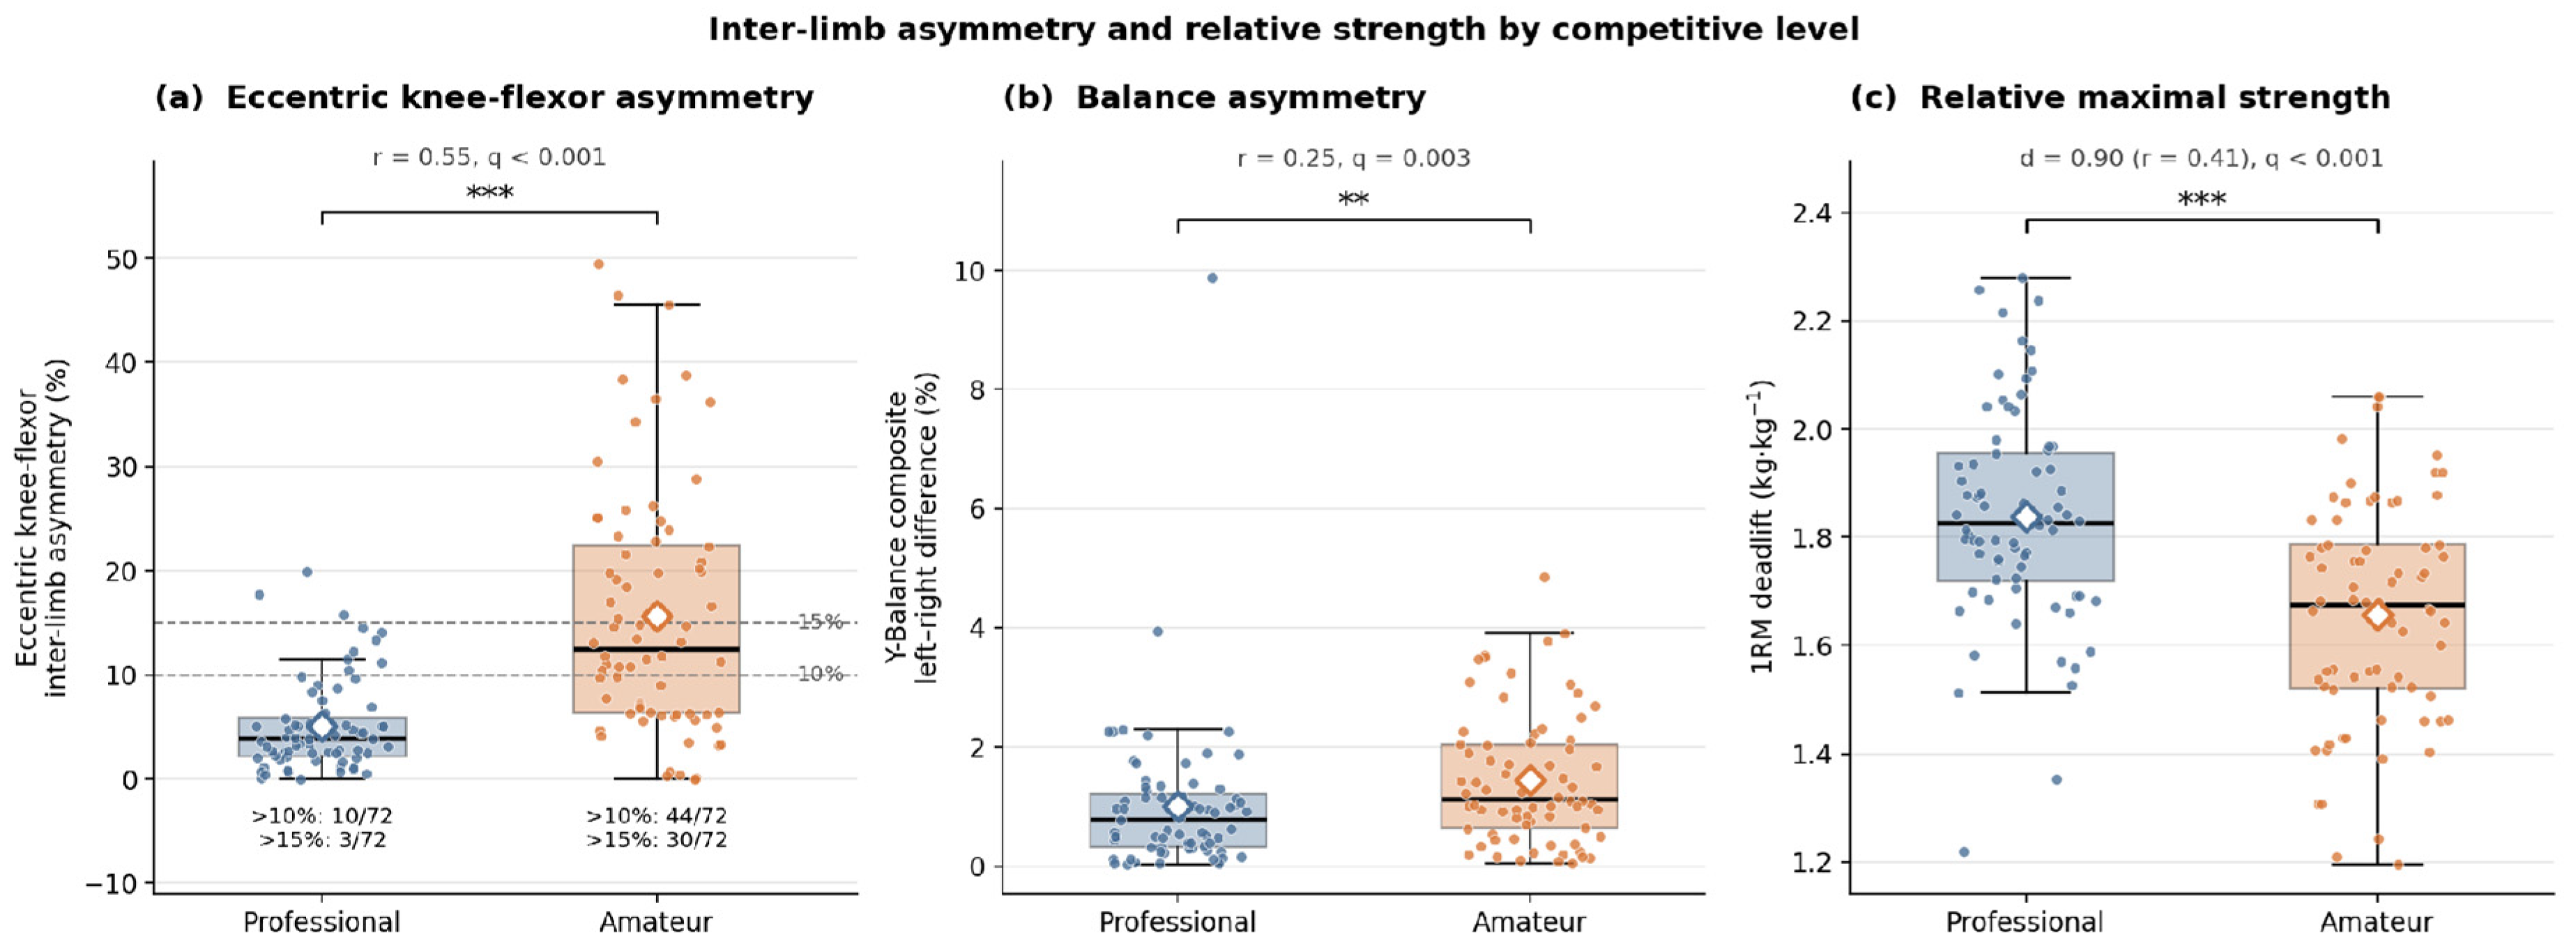
Because absolute force and absolute barbell loads scale with body size, and because inter-limb asymmetry rather than absolute reach or force is often the more informative descriptor, a pre-specified secondary family of six comparisons was examined (Table 5, Figure 6). Every comparison in this family was significant after its own Benjamini–Hochberg adjustment, and the group differences in relative strength were of similar magnitude to those in absolute strength when both are expressed on the common r scale: for example, the relative 1RM deadlift (1.84 ± 0.20 vs. 1.66 ± 0.21 kg·kg−1; t(142) = 5.39, p < 0.001, d = 0.90, r-equivalent = 0.41) showed the same effect as the absolute deadlift (r = 0.41). Because the groups were matched for body mass, this indicates that the strength advantage of professionals is not an artefact of body size.
Table 5.
Body-size-normalised strength and inter-limb asymmetry by competitive level.
Figure 6.
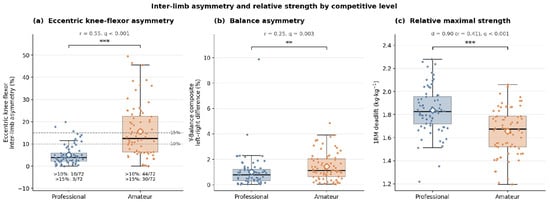
Inter-limb asymmetry and relative strength by competitive level. Boxes show the median and interquartile range, open diamonds denote the mean, and points are individual participants. ** q < 0.01, *** q < 0.001 after Benjamini–Hochberg correction within the secondary family. Professional n = 72 in panels (a) and (c) and n = 71 in panel (b). In panel (a), dashed lines mark 10% and 15% asymmetry, thresholds commonly used as screening flags [15], and the counts below each group give the number of players exceeding them. Panel (c) also gives the r-equivalent of d.
The clearest single finding of the study emerged from the asymmetry indices. Inter-limb asymmetry of eccentric knee-flexor force was more than three times greater in amateurs than in professionals (12.47% [6.38–22.41] vs. 3.84% [2.21–5.95]; U = 938, z = −6.61, p < 0.001, r = 0.55), the largest effect observed anywhere in this dataset on the common r scale and the only large effect by conventional criteria. The individual distribution is shown in Figure 6a. The difference was not driven by a few extreme amateur values: 44 of 72 amateurs (61%) versus 10 of 72 professionals (14%) exceeded 10% asymmetry, and 30 (42%) versus 3 (4%) exceeded 15% (both Fisher’s exact p < 0.001). The Hodges–Lehmann estimate of the between-group shift was 8.2 percentage points (bootstrap 95% CI 5.4 to 11.5). In sensitivity analyses the difference remained significant and at least moderate after removing the nine amateurs with asymmetry above 30% (p < 0.001, r = 0.50), after trimming the highest 10% of values in each group (p < 0.001, r = 0.60) and even after removing all 30 amateurs above 15% (p < 0.001, r = 0.32). The left–right difference in the YBT composite was likewise smaller in professionals (0.77% [0.33–1.22] vs. 1.13% [0.64–2.05]; U = 1818, z = −2.98, p = 0.003, r = 0.25). Competitive level was therefore expressed more strongly in the symmetry of the two limbs than in the absolute capacity of either.
3.10. Internal Correlation Structure of the Test Battery
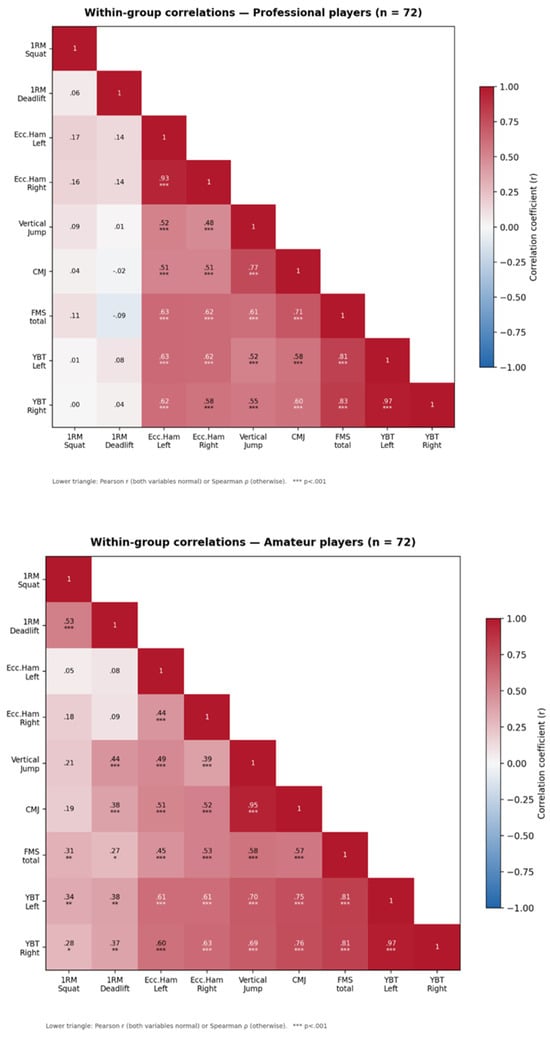
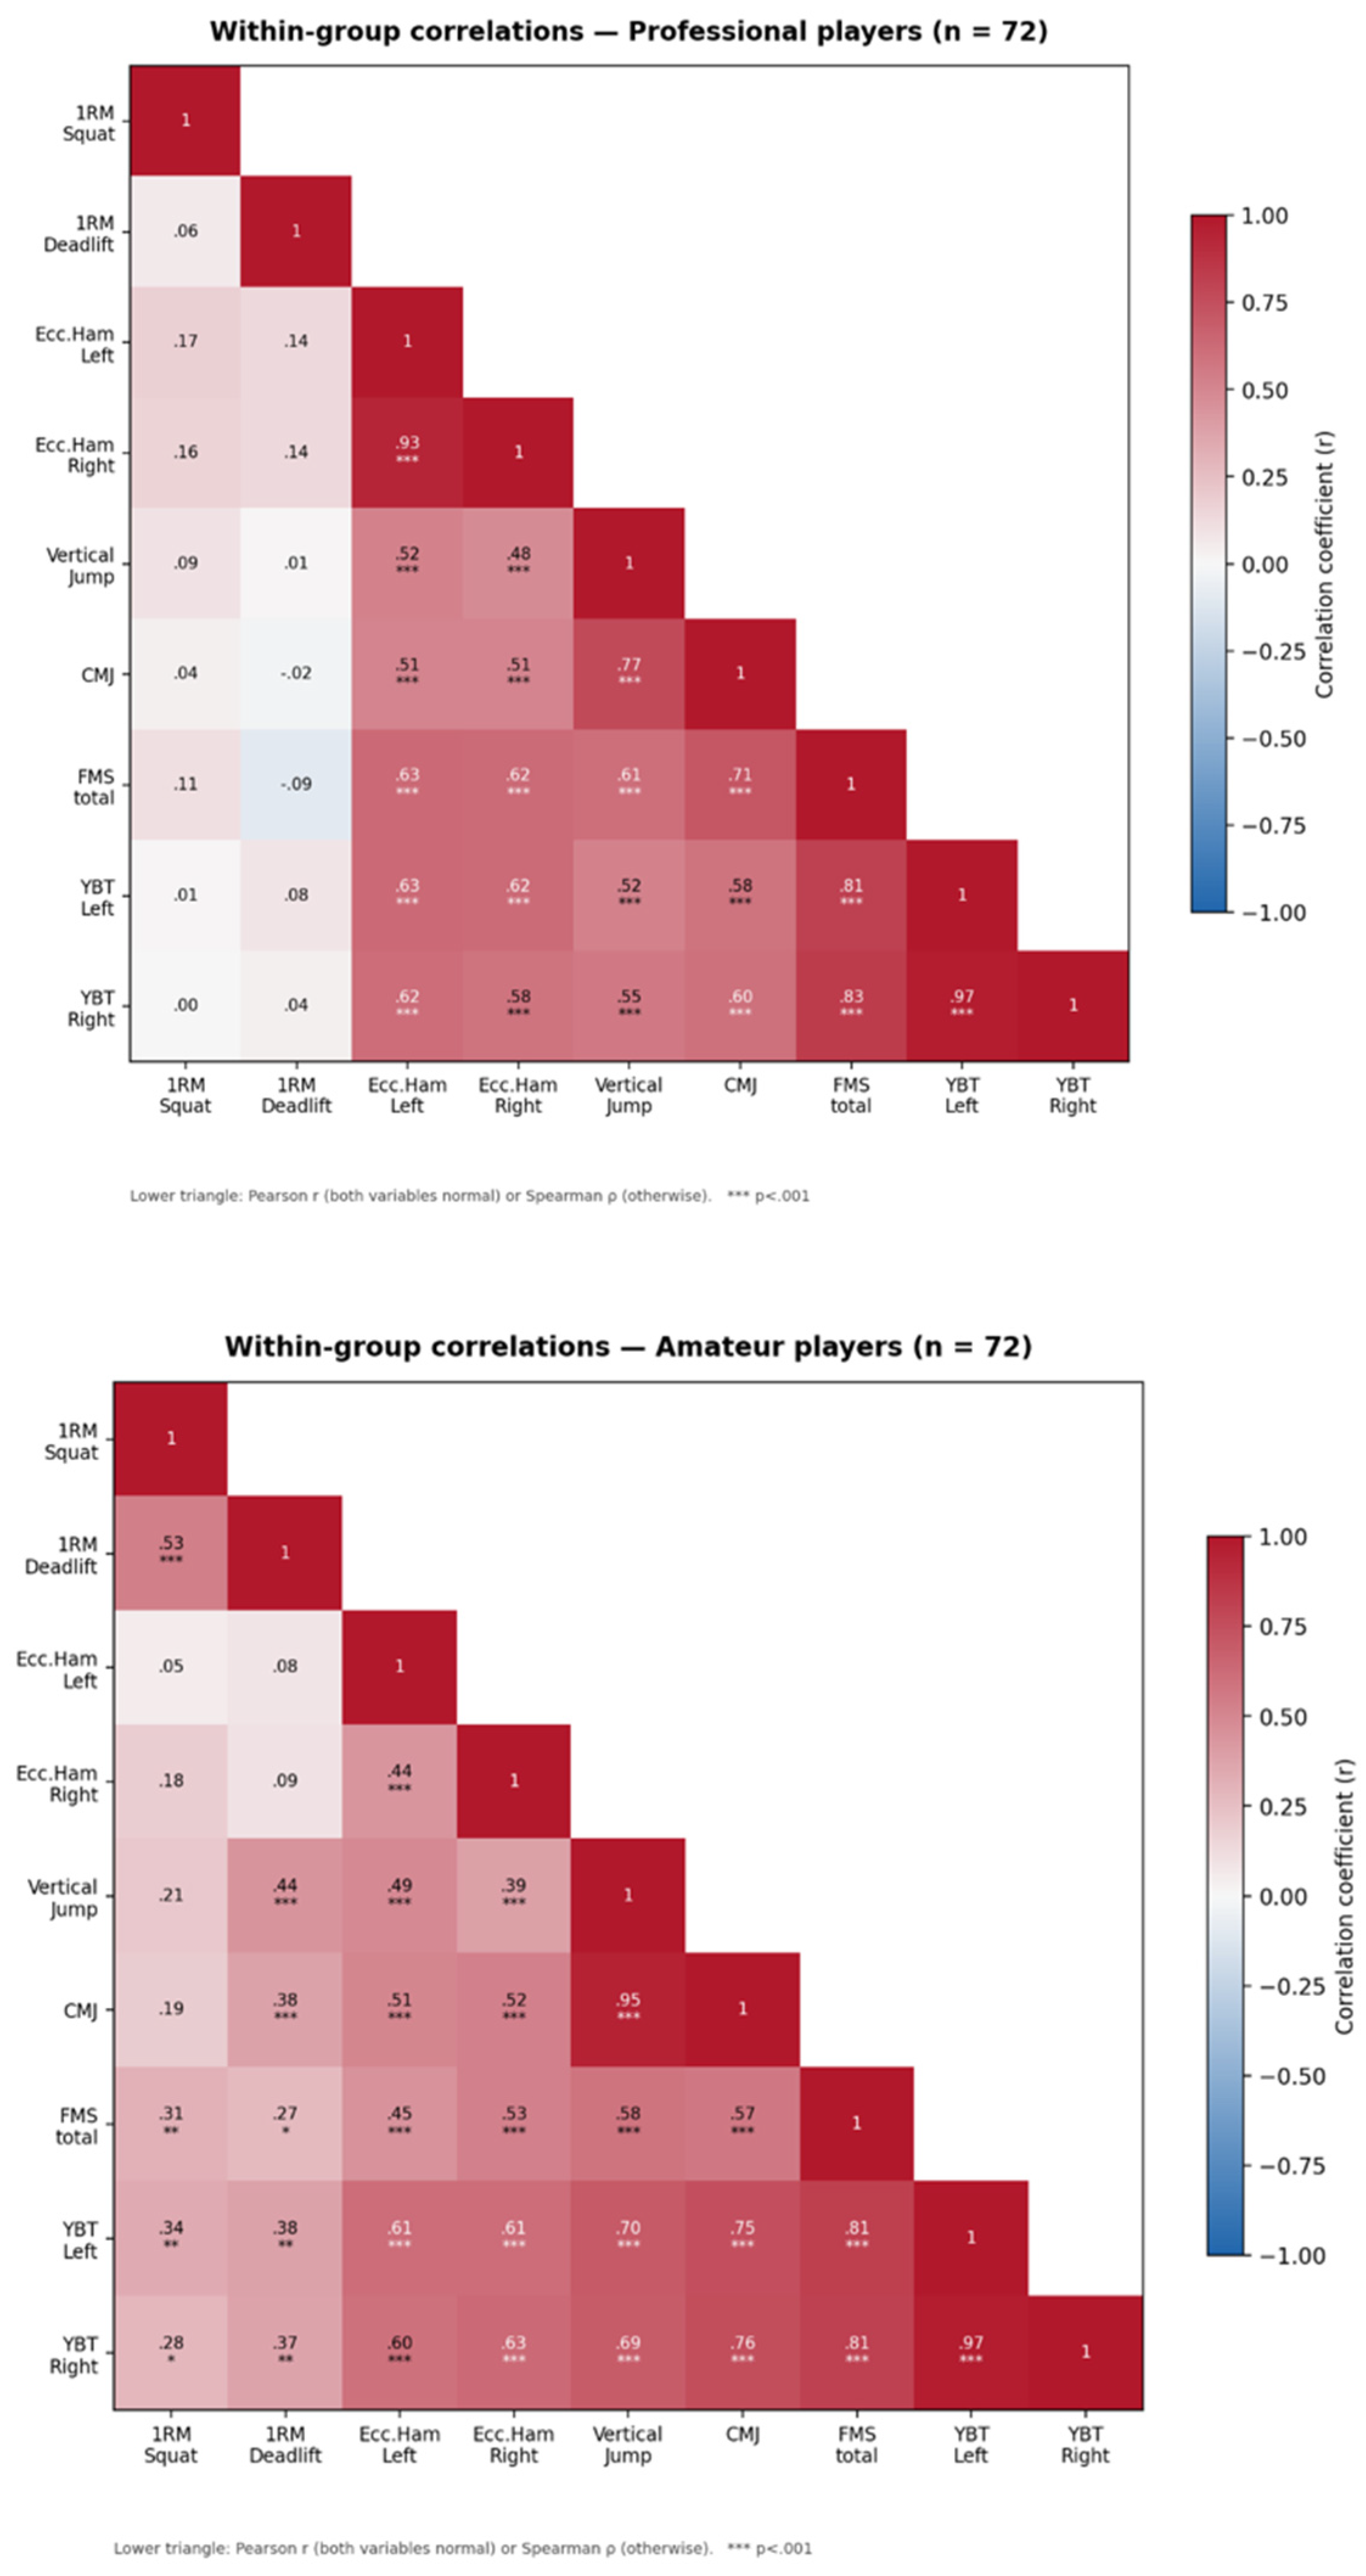
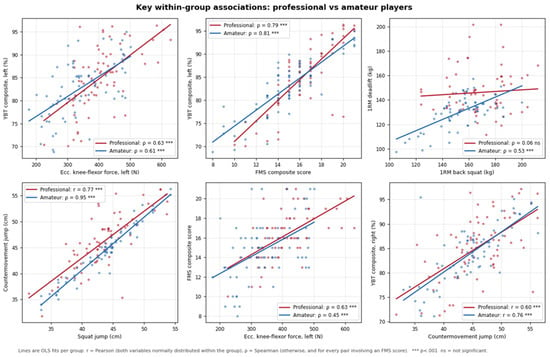
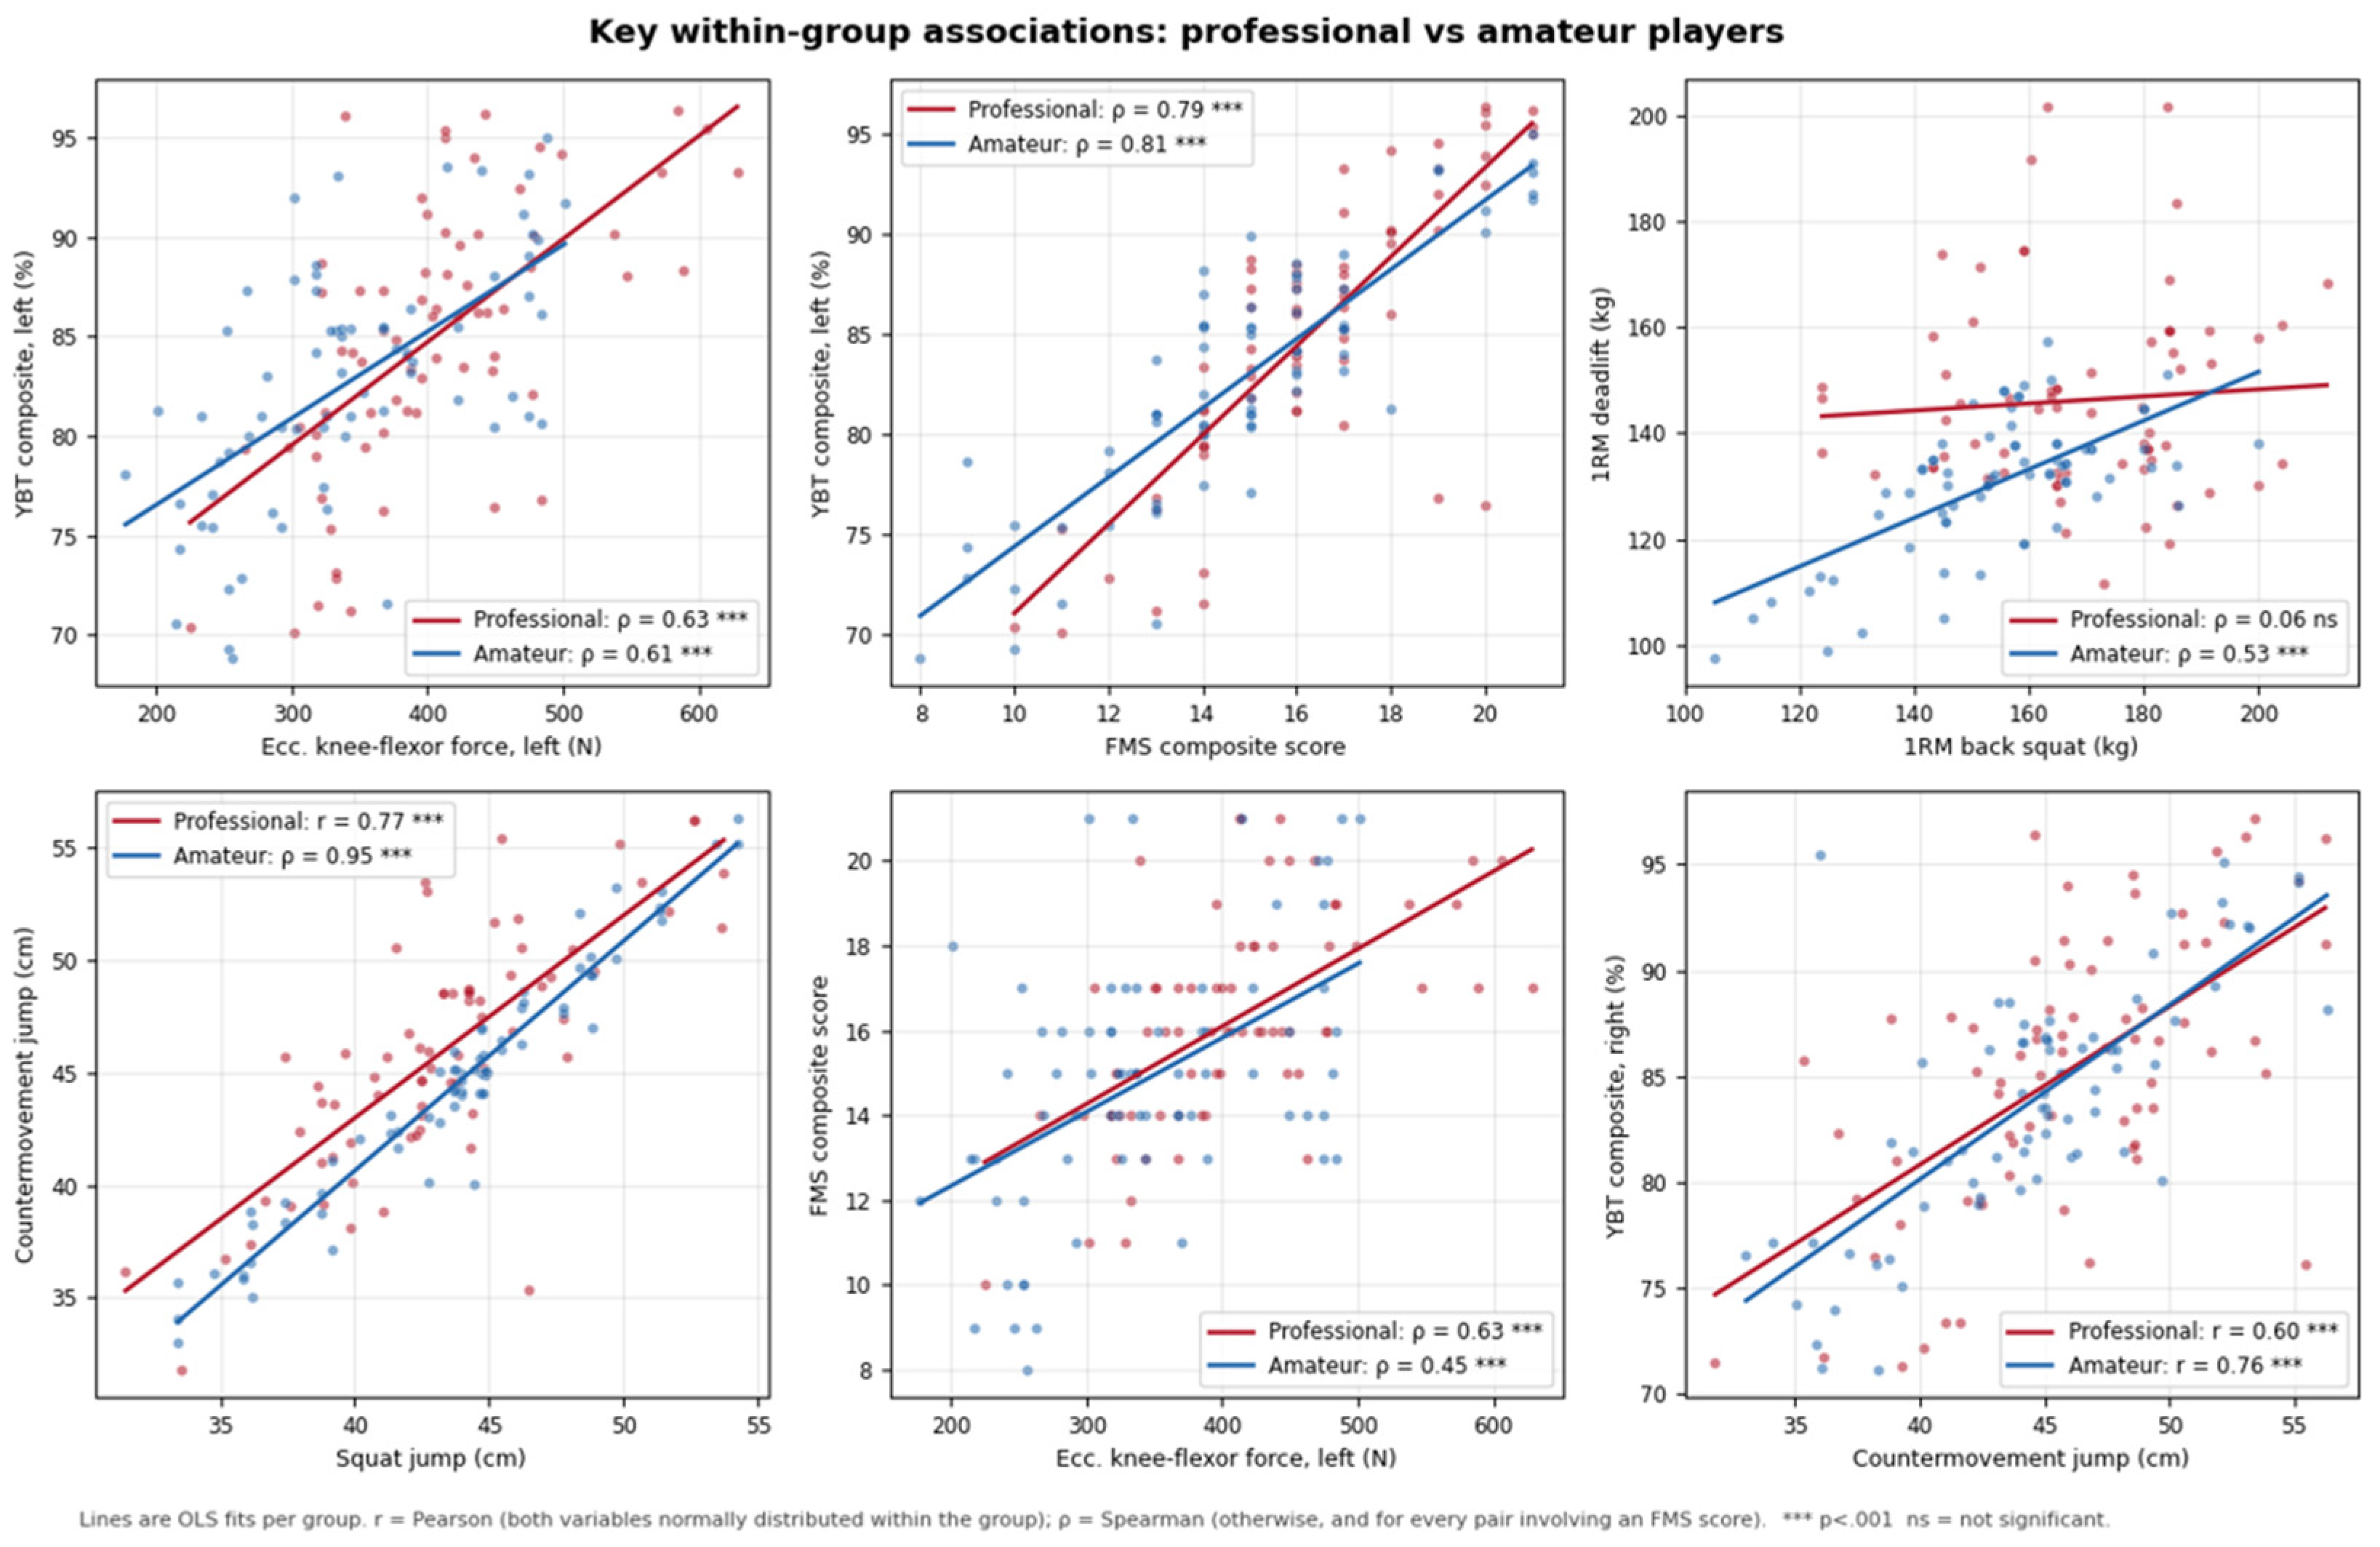
The associations among the performance, movement-quality and balance measures were then examined separately within each group in order to determine whether the two competitive levels share the same internal structure of physical qualities. Complete correlation matrices are visualised as heat maps in Figure 7, and the most informative individual relationships are shown in Figure 8. Every claim that an association differed between groups was tested formally with Fisher’s r-to-z transformation, and the results of those tests are given in Table 6.
Figure 7.
Correlation heat maps of performance, movement-quality and balance measures within the professional (top) and amateur (bottom) groups. Only the lower triangle is shown. Pearson’s r is used when both variables satisfied normality within that group and Spearman’s ρ otherwise. Coefficients are unadjusted for multiplicity and are exploratory.
Figure 8.
Key within-group associations, professionals (red) versus amateurs (blue). Lines are ordinary-least-squares fits per group. Coefficients are labelled r (Pearson) when both variables were normally distributed within that group and ρ (Spearman) otherwise, and always ρ for pairs involving an FMS score; the professional FMS composite–left YBT coefficient is therefore Spearman’s ρ = 0.79.
Table 6.
Formal comparison of within-group correlation coefficients between competitive levels (Fisher’s r-to-z test; 95% CI of the difference by Zou’s method; Benjamini–Hochberg q across the eight contrasts).
Several relationships were consistent across competitive levels. The two YBT composite scores were near-perfectly correlated in both groups (r = 0.97 in each; z = −0.01, p = 0.99 for the group difference), confirming strong inter-limb symmetry of dynamic balance and, incidentally, indicating that the two limbs do not carry independent information in this sample. Dynamic balance was closely tied to movement quality: the FMS composite correlated very largely with the left YBT composite in both groups (ρ = 0.79 vs. 0.81; z = −0.36, p = 0.72). Eccentric knee-flexor force showed large associations with dynamic balance in both groups (ρ = 0.63 vs. 0.61; z = 0.16, p = 0.88) and with the FMS composite (ρ = 0.63 vs. 0.45; z = 1.48, p = 0.14). For these relationships there is therefore no evidence of a level-dependent structure: eccentric strength, movement quality and dynamic balance form a coherent, mutually reinforcing cluster in both groups. These between-construct coefficients were re-checked against the raw data and reproduced exactly. The FMS–YBT association was not driven by a single item: each of the seven FMS items correlated positively with the left YBT composite in both groups (ρ = 0.21–0.56 in professionals and 0.32–0.67 in amateurs). Associations of this size between nominally distinct tests should nevertheless be interpreted with caution, because the FMS and YBT were administered in the same session by the same assessors and both depend on lower-limb mobility and control (Section 4.4).
Three associations did differ significantly between levels, and all three remained significant after Benjamini–Hochberg adjustment across the eight contrasts (Table 6). First, and most strikingly, the two maximal-strength measures were essentially unrelated in professionals but moderately related in amateurs (ρ = 0.06 vs. 0.53; difference −0.47, 95% CI −0.76 to −0.17; z = −3.04, p = 0.002, q = 0.006). In professionals both 1RM measures were also unrelated to every other quality (all |r| ≤ 0.17, p > 0.05), whereas in amateurs they showed small-to-moderate associations with jump performance, dynamic balance and the FMS composite (for example, deadlift with squat jump ρ = 0.44; squat with FMS composite ρ = 0.31; squat with left YBT composite r = 0.34). Second, inter-limb symmetry of eccentric knee-flexor force was substantially greater in professionals (ρ = 0.93 vs. 0.44; difference 0.49, 95% CI 0.32 to 0.71; z = 6.84, p < 0.001, q < 0.001). Third, the association between the two jump tests was stronger in amateurs (r = 0.77 vs. ρ = 0.95; difference −0.18, 95% CI −0.29 to −0.09; z = −4.64, p < 0.001, q < 0.001). The remaining contrast examined, between CMJ and the right YBT composite, did not reach significance (r = 0.60 vs. 0.76; z = −1.71, p = 0.087, q = 0.175).
It should be noted that the variance of the two 1RM measures was not smaller in professionals than in amateurs—for the back squat the coefficient of variation was 11.6% versus 11.8% and the variance ratio was not significant (F(71,71) = 1.15, p = 0.563), while for the deadlift the professional group was in fact the more variable of the two (CV 12.5% versus 9.8%; F(71,71) = 2.04, p = 0.003). A simple restriction-of-range explanation for the absent correlations in professionals is therefore not supported by these data, and alternative explanations are considered in the Discussion.
4. Discussion
This study compared five domains of physical capacity between professional and amateur male soccer players and examined whether those capacities are organised in the same way at the two competitive levels. Four findings stand out. First, once the multiplicity inherent in a 16-comparison test battery was controlled, competitive level was robustly associated with maximal and eccentric strength and, more modestly, with movement quality, but not with jump height or dynamic balance. Second, several differences that would have been reported as significant on an unadjusted analysis—shoulder mobility, rotary stability and the left-limb balance composite—did not survive adjustment, which places an important constraint on how level-based screening data should be read. Third, the largest effect in the whole dataset on a common effect-size scale was not a difference in capacity but a difference in inter-limb symmetry, which was substantially better in professionals in both the eccentric-strength and the balance domains. Fourth, and most novel, the internal structure of the test battery was not the same at the two levels: three of the eight association contrasts we tested differed significantly between groups, and all three survived FDR adjustment.
4.1. Strength Discriminates Competitive Level, but Jump Height Does Not
Professionals were substantially stronger than amateurs in both maximal lifts, with moderate effects (1RM deadlift r = 0.41; 1RM back squat d = 0.73, r-equivalent = 0.34) that were the largest in the primary family, although smaller than the eccentric-asymmetry effect in the secondary family (r = 0.55; Section 3.9), yet neither jump test distinguished the groups and amateurs were marginally higher in the squat jump. This dissociation is consistent with evidence that the strength–jump relationship is context- and sport-dependent: the correlation between deadlift 1RM and jumping performance is markedly sport-dependent and only moderate in soccer players [28], even though maximal squat strength is strongly related to jump height in elite squads with a wide strength spread [3]. Mechanistically, jump height is governed as much by the rate of force development, stretch-shortening-cycle function and inter-segmental coordination as by maximal force [1], none of which were measured here. Consistent with this, meta-analytic evidence indicates that plyometric jump training produces reliable improvements in jump and sprint performance in soccer players [29], that is, through a training stimulus targeting velocity and stretch-shortening-cycle qualities rather than maximal force alone. Our data therefore suggest that the greater maximal strength of professionals is not, by itself, expressed as superior jump output; they do not establish that adding plyometric training would close that gap, which would require an intervention design.
Absolute deadlift values were lower than back-squat values in both groups (median deadlift-to-squat ratio 0.86 in professionals and 0.85 in amateurs; deadlift below squat in 59 of 72 professionals and in all 72 amateurs). These values were re-checked against the raw data and reproduced exactly, and the consistency of the ratio across participants argues against isolated transcription errors. The pattern is nevertheless unusual, because the deadlift is generally the heavier of the two lifts in resistance-trained individuals. The most likely explanation is methodological: the deadlift was always tested after a maximal back-squat test in the same session, so residual fatigue from the squat may have reduced deadlift performance; lower technical proficiency in the conventional deadlift than in the squat, which is more commonly emphasised in soccer strength programmes, may also have contributed. Because the order was identical in both groups, this would lower the absolute deadlift values of both groups rather than bias the between-group comparison, but it may add individual variation to the deadlift that is unrelated to squat strength (Section 4.5).
4.2. Eccentric Knee-Flexor Force and Inter-Limb Symmetry
Professional players produced greater eccentric knee-flexor force than amateurs in both limbs, with moderate rank-based effects that survived FDR control. Both variables deviated from normality and were therefore analysed non-parametrically. The magnitudes observed are broadly consistent with reference ranges reported for professional soccer players assessed on the same device, in which better-trained athletes show higher and more symmetrical eccentric knee-flexor forces [15]. This is of applied interest because low eccentric knee-flexor force and large inter-limb asymmetry have been prospectively associated with hamstring-injury risk in field-sport athletes [14], although the present study collected no injury outcomes and cannot speak to risk directly.
The most consequential result of the study, however, concerns symmetry rather than magnitude. Inter-limb asymmetry of eccentric knee-flexor force was more than three times greater in amateurs than in professionals (median 12.5% versus 3.8%; r = 0.55), the only large effect in the entire battery and considerably larger than any difference in absolute force. The corresponding inter-limb correlation was near-perfect in professionals and only moderate in amateurs, and this difference was itself statistically significant (Table 6); the two analyses therefore converge, the correlation describing how consistently the limbs track one another across athletes and the asymmetry index describing the imbalance within each athlete. Professional squads in this sample were thus distinguished less by how much eccentric force they produced than by how evenly they produced it across limbs. This is of direct applied interest, because inter-limb asymmetry in eccentric knee-flexor strength has been prospectively associated with hamstring-injury risk [14] and because asymmetry thresholds of roughly 10–15% are commonly used as screening flags in professional practice [15]—a threshold that the median amateur in this sample exceeded and the median professional did not. We emphasize nonetheless that no injury outcomes were collected here, so this remains an observation about profile, not about risk. The difference was also not attributable to a small number of extreme amateur values: it persisted in every sensitivity analysis and reflected a shift of the whole amateur distribution rather than a few outliers (Section 3.9, Figure 6a).
Two further observations support this reading. First, the group differences in strength persisted, with similar magnitude, when strength was normalized to body mass (for example, relative 1RM deadlift d = 0.90, r-equivalent = 0.41, versus r = 0.41 for the absolute value), confirming that the strength advantage of professionals is not a by-product of body size. Second, the same symmetry pattern appeared, more weakly, in dynamic balance: the left–right difference in YBT composite was smaller in professionals (r = 0.25) even though neither limb’s absolute score differed reliably between groups. Across two independent measurement systems, therefore, competitive level was expressed in inter-limb consistency rather than in unilateral capacity.
4.3. Movement Quality
The FMS composite score and two individual items—the deep squat and the in-line lunge—were higher in professionals after adjustment, whereas shoulder mobility and rotary stability were significant only before adjustment, and the hurdle step, active straight-leg raise and trunk-stability push-up did not differ at all. The pattern of a few discriminating items rather than a uniform separation matches the retrospective findings of Dinç and Arslan [16] in soccer and the broader observation that FMS scores are only modestly related to competitive standard [6]. In agreement with Silva et al. [30], who reported that individual FMS item scores discriminated competitive level in young soccer players better than the total score, the deep-squat and in-line-lunge differences observed here may reflect better multiplanar control and single-limb stability, although this mechanism was not tested; whether this results from more structured training, from selection, or from both cannot be determined here, because training history was not measured.
Three cautions are important here. First, all FMS effects were small (r ≤ 0.25) and the group medians differed by at most one point on any item, so the statistical separation should not be over-read as a practically meaningful difference in movement competency. Second, the absence of a difference in the trunk-stability push-up and the active straight-leg raise is not evidence that either group has a deficit in those qualities; it indicates only that the two groups performed similarly, and the FMS provides no external criterion against which a “deficit” could be defined. This is reinforced by the evidence that FMS composite scores do not predict subsequent injury [7,8] and by the more general argument that single screening tests are poorly suited to risk prediction [9]. The FMS results here are therefore descriptive of movement competency at each level and are not a risk profile. Third, FMS inter-rater reliability among the three assessors was not established in this sample and item scoring involves subjective judgement, so differences of about one point on individual items lie within the range that could arise from scoring variability and should not be over-interpreted.
4.4. Dynamic Balance
There was no robust between-group difference in dynamic balance. The left-limb composite was only nominally higher in professionals, did not survive FDR control and was sensitive to one excluded observation, and the right-limb comparison was not significant at any stage. Because the left and right composites were near-perfectly correlated within both groups, we do not interpret this as a genuine limb-specific effect; it is more plausibly the result of two highly correlated comparisons falling on either side of an arbitrary threshold. This reading is consistent with González-Fernández et al. [13], who reported that YBT scores and inter-limb asymmetries in soccer players vary with competitive level and playing position in a non-uniform way and that asymmetry, rather than absolute reach, best characterizes balance profiles. Dynamic balance depends on the integration of proprioceptive feedback, trunk and lower-limb strength and neuromuscular control [12], and is additionally sensitive to acute fatigue state [31], so it is unsurprising that it is not cleanly stratified by playing standard. The strong association between the FMS composite and the YBT composite in both groups (ρ = 0.79 and 0.81) suggests that movement quality and dynamic balance overlap substantially in this population. Part of this shared variance may, however, be methodological, because both tests were administered in the same session by the same assessors and both depend on lower-limb mobility, so its magnitude should not be taken as evidence that the two tests measure a single construct. The similarly large association between eccentric knee-flexor force and the YBT composite (ρ ≈ 0.6 in both groups) was likewise verified against the raw data; it was not predicted a priori and warrants replication.
4.5. The Internal Structure of the Test Battery Differs by Competitive Level
The most novel observation of this study is that the same test battery is organized differently at the two competitive levels. In amateurs, maximal strength behaved as a general quality: the two lifts were moderately correlated with one another and showed small-to-moderate associations with jumping, balance and movement quality. In professionals, the two lifts were unrelated to each other and to everything else. The difference between the two squat–deadlift coefficients was itself statistically significant, which is the appropriate test of this claim [26] and which distinguishes the present analysis from the common but invalid practice of contrasting significant with non-significant coefficients.
The obvious explanation—that professionals occupy a narrow, elevated strength range in which correlations are attenuated by restriction of range—is not supported by these data. The professional group was not less variable than the amateur group in either lift, and was in fact significantly more variable in the deadlift. Several methodological explanations should be considered first. An estimation artefact can be excluded, because both lifts were measured directly. A familiarity artefact is unlikely, because the clubs’ coaching staff confirmed that both lifts formed part of the regular resistance-training programmes of both groups; however, individual exposure to each lift was not recorded, so differences in technical proficiency, particularly in the deadlift, cannot be ruled out. In addition, because the deadlift was always performed after a maximal back-squat test, individual differences in carry-over fatigue may have added variance to the deadlift that is unrelated to squat strength and thus attenuated the correlation. A correlation of 0.06 between two regularly trained barbell lifts nevertheless remains lower than their shared mechanical demands would predict, which makes this the single result of the study most in need of independent replication. Beyond these methodological possibilities, it may be speculated that physical qualities are trained more individually at higher performance levels, or that players reach professional level through different physical routes (a selection effect). Training history and selection were not measured, so these are hypotheses for future studies rather than explanations supported by the present data; we therefore present the finding as a replicable observation rather than an explained one.
The other two structural differences can likewise only be interpreted tentatively. One possible explanation for the stronger squat-jump–countermovement-jump association in amateurs is a less differentiated jump profile, in which the countermovement adds little independent variance; one possible explanation for the greater inter-limb consistency of eccentric knee-flexor force in professionals is more systematic bilateral Nordic-type loading. Neither stretch-shortening-cycle proficiency nor Nordic training exposure was measured, so both remain hypotheses; the eccentric result is, however, corroborated by the independent asymmetry index.
4.6. Practical Considerations
Three implications follow directly from the data, and all are descriptive rather than prescriptive. First, in a profiling context, maximal and eccentric strength discriminate competitive level far more clearly than jump height, dynamic balance or most FMS items; a battery intended to characterize playing standard can therefore be shortened substantially with little loss of discriminative information, and the near-perfect left–right YBT correlation suggests that bilateral balance testing adds little beyond a single limb in this population. Second, inter-limb asymmetry carried more information about competitive level than any absolute score, so a profiling battery that records only bilateral totals or single-limb maxima discards the most discriminating signal it collects; asymmetry indices cost nothing extra to compute once both limbs are measured. Third, because several nominally significant differences did not survive multiplicity control, practitioners interpreting multi-test screening batteries should expect a proportion of apparent level differences to be false positives, and should treat single-item FMS differences of one point with particular caution.
We deliberately refrain from recommending specific training content on the basis of these data. A cross-sectional comparison of two pre-existing groups cannot establish that any training strategy would change any of the measured qualities; questions such as whether combining resistance with plyometric loading improves the transfer of strength to jump performance [29], or whether movement-quality interventions alter lower-limb mechanics [32], require controlled intervention designs. The value of the present findings is in generating those hypotheses and in indicating which qualities warrant measurement.
4.7. Limitations
Several limitations constrain the interpretation of these findings. First, the design is cross-sectional and observational, so the group differences reflect the state of two pre-existing populations and cannot be attributed to training exposure, selection into the professional level or any other causal mechanism; no causal or prescriptive inference is warranted. Training history was not quantified—training age, weekly resistance-training exposure, session load and periodization content were not recorded, and the only information available was the coaching staff’s confirmation that both groups’ programmes included the back squat and deadlift—even though differential training exposure is the mechanism most often invoked to explain level differences, so the mechanisms proposed in this Discussion are plausible but untested. Limb dominance was likewise not recorded, and results are therefore reported by anatomical side rather than by dominant and non-dominant limb, which is the more informative framing in sport-science research; no inference about limb-dominance patterns can be drawn from these data. Because players were nested within clubs, the observations are not strictly independent, and since club membership was not modelled the effective sample size for between-group inference is smaller than the nominal n = 144. Club-level factors such as coaching, strength programming and selection practices may have influenced several outcomes simultaneously, so the between-group differences could partly reflect the particular clubs sampled rather than competitive level per se. Playing position was not analysed either, and as positional demands are known to influence both balance and strength profiles in soccer [2,13], residual positional imbalance between the groups cannot be excluded. No injury outcomes were collected and the eligibility criteria excluded players with recent injury, so the study cannot address injury risk or “injury resilience” and the FMS and eccentric-strength findings must not be read as risk estimates. Assessors were not blinded to group membership, a potential source of bias for the FMS, the only measure requiring subjective scoring, and FMS inter-rater reliability among the three assessors was not assessed in this sample, which matters because several FMS group differences were of about one point, and test–retest reliability was not established in this cohort; published reliability values for each instrument are cited instead and may not transfer exactly to the present testing conditions. The eight exploratory correlation comparisons in Table 6 were FDR-adjusted as a family and the three significant differences remained significant, but the correlation matrices from which they were drawn contain many more coefficients that were not adjusted; more broadly, the exploratory nature of the correlation-structure analysis means that the divergent maximal-strength result requires independent replication before it is treated as a property of higher-level athletes rather than of this particular sample. The order of the two 1RM tests was fixed (back squat before deadlift), so carry-over fatigue from the maximal squat may have lowered deadlift values and contributed to the deadlift being lower than the squat in both groups; because the order was identical in both groups, this affects the absolute deadlift values and the squat–deadlift correlation more than the between-group comparison. Although the post-match interval was identical in both groups, residual match fatigue 48 h after the match cannot be fully excluded for the first-session measures [18,19]. Body-fat percentage was estimated from skinfolds, a prediction-based method whose absolute accuracy in lean athletic populations is limited, so these values are best read as a group-matching check rather than as criterion body-composition data. Only the carried-forward score of each bilateral FMS item was recorded, so FMS asymmetry could not be quantified alongside the eccentric-strength and balance asymmetry indices; given that inter-limb symmetry proved to be the most discriminating feature of the dataset, this is a substantive omission, and side-specific FMS scoring is recommended in future work. Finally, only male outfield players from a single country were studied, so generalisation to female players, goalkeepers, youth athletes or other competitive systems is not warranted.
5. Conclusions
In this cross-sectional comparison of 144 male soccer players, competitive level was clearly associated with maximal and eccentric knee-flexor strength—with similar magnitude when strength was expressed relative to body mass—and, to a smaller degree, with overall movement quality, but not with jump height or dynamic balance once the multiplicity of a 16-comparison battery was controlled. On a common effect-size scale, the single largest difference of the study was not a measure of capacity at all but of inter-limb symmetry: eccentric knee-flexor asymmetry was more than three times greater in amateur players. Three of the nominally significant differences did not survive that control, which underlines the need for multiplicity adjustment in multi-test profiling studies. Beyond the mean differences, the internal structure of the test battery itself differed between levels: maximal strength behaved as a general quality in amateurs but was uncorrelated with every other measure in professionals, inter-limb eccentric-force consistency was greater in professionals, and the two jump tests were more redundant in amateurs. Because the design is observational, these results identify which qualities distinguish playing standard and how they are organized at each standard; they do not establish causal mechanisms and do not license specific training prescriptions. Controlled longitudinal and intervention studies that quantify training exposure, record limb dominance and playing position, and follow injury outcomes are required to determine whether the differences observed here are consequences of training or of selection.
Author Contributions
A.B.K.: Investigation, Writing—original draft, Methodology, Resources, Data curation, Writing—review and editing, Project administration. G.A.: Writing—original draft, Methodology, Data curation, Formal Analysis. E.Ö.: Writing—original draft, Writing—review and editing, Investigation. M.T.: Writing—review and editing, Methodology, Investigation, Formal Analysis. All authors have read and agreed to the published version of the manuscript.
Funding
This research received no external funding.
Institutional Review Board Statement
The study was conducted in accordance with the Declaration of Helsinki and approved on 2 May 2025 by the Ethics Committee of the Faculty of Medicine, Istanbul Gedik University (decision number E-71457743-050.04-2025.173340.20).
Informed Consent Statement
Informed consent was obtained from all subjects involved in the study.
Data Availability Statement
The de-identified data supporting the findings of this study are available from the corresponding author upon reasonable request.
Acknowledgments
The author(s) verify and take full responsibility for the use of generative artificial intelligence (AI) in the preparation of this manuscript. Generative AI tools were used solely to assist with grammar, language refinement and clarity of expression. No generative AI was used for data collection, statistical analysis, interpretation of results or generation of scientific content. All scientific decisions, analyses and conclusions are the sole responsibility of the author(s). The submission-system declaration stating that no generative AI was used was completed in error at the time of first submission; it has been corrected so that the front-matter declaration and this statement agree.
Conflicts of Interest
The authors declare no conflicts of interest.
Abbreviations
| 1RM | One-repetition maximum |
| CMJ | Countermovement jump |
| FDR | False discovery rate |
| FMS | Functional Movement Screen |
| SJ | Squat jump |
| YBT | Y-Balance Test |
References
- Suchomel, T.J.; Nimphius, S.; Stone, M.H. The importance of muscular strength in athletic performance. Sports Med. 2016, 46, 1419–1449. [Google Scholar] [CrossRef] [Scilit] [PubMed]
- Slimani, M.; Nikolaidis, P.T. Anthropometric and physiological characteristics of male soccer players according to their competitive level, playing position and age group: A systematic review. J. Sports Med. Phys. Fit. 2019, 59, 141–163. [Google Scholar] [CrossRef] [Scilit] [PubMed]
- Wisløff, U.; Castagna, C.; Helgerud, J.; Jones, R.; Hoff, J. Strong correlation of maximal squat strength with sprint performance and vertical jump height in elite soccer players. Br. J. Sports Med. 2004, 38, 285–288. [Google Scholar] [CrossRef] [Scilit] [PubMed]
- Cook, G.; Burton, L.; Hoogenboom, B.J.; Voight, M. Functional movement screening: The use of fundamental movements as an assessment of function—Part 1. Int. J. Sports Phys. Ther. 2014, 9, 396–409. [Google Scholar] [PubMed]
- Kiesel, K.; Plisky, P.J.; Voight, M.L. Can serious injury in professional football be predicted by a preseason Functional Movement Screen? N. Am. J. Sports Phys. Ther. 2007, 2, 147–158. [Google Scholar] [PubMed]
- Fitton Davies, K.; Sacko, R.S.; Lyons, M.A.; Duncan, M.J. Association between Functional Movement Screen scores and athletic performance in adolescents: A systematic review. Sports 2022, 10, 28. [Google Scholar] [CrossRef] [Scilit] [PubMed]
- Bonazza, N.A.; Smuin, D.; Onks, C.A.; Silvis, M.L.; Dhawan, A. Reliability, validity, and injury predictive value of the Functional Movement Screen: A systematic review and meta-analysis. Am. J. Sports Med. 2017, 45, 725–732. [Google Scholar] [CrossRef] [Scilit] [PubMed]
- Moran, R.W.; Schneiders, A.G.; Mason, J.; Sullivan, S.J. Do Functional Movement Screen (FMS) composite scores predict subsequent injury? A systematic review with meta-analysis. Br. J. Sports Med. 2017, 51, 1661–1669. [Google Scholar] [CrossRef] [Scilit] [PubMed]
- Bahr, R. Why screening tests to predict injury do not work—And probably never will…: A critical review. Br. J. Sports Med. 2016, 50, 776–780. [Google Scholar] [CrossRef] [Scilit] [PubMed]
- Gribble, P.A.; Hertel, J. Considerations for normalizing measures of the Star Excursion Balance Test. Meas. Phys. Educ. Exerc. Sci. 2003, 7, 89–100. [Google Scholar] [CrossRef] [Scilit] [PubMed]
- Plisky, P.J.; Gorman, P.P.; Butler, R.J.; Kiesel, K.B.; Underwood, F.B.; Elkins, B. The reliability of an instrumented device for measuring components of the Star Excursion Balance Test. N. Am. J. Sports Phys. Ther. 2009, 4, 92–99. [Google Scholar] [PubMed]
- Plisky, P.J.; Rauh, M.J.; Kaminski, T.W.; Underwood, F.B. Star Excursion Balance Test as a predictor of lower extremity injury in high school basketball players. J. Orthop. Sports Phys. Ther. 2006, 36, 911–919. [Google Scholar] [CrossRef] [Scilit] [PubMed]
- González-Fernández, F.T.; Martínez-Aranda, L.M.; Falces-Prieto, M.; Nobari, H.; Clemente, F.M. Exploring the Y-Balance-Test scores and inter-limb asymmetry in soccer players: Differences between competitive level and field positions. BMC Sports Sci. Med. Rehabil. 2022, 14, 45. [Google Scholar] [CrossRef] [Scilit] [PubMed]
- Opar, D.A.; Williams, M.D.; Timmins, R.G.; Hickey, J.; Duhig, S.J.; Shield, A.J. Eccentric hamstring strength and hamstring injury risk in Australian footballers. Med. Sci. Sports Exerc. 2015, 47, 857–865. [Google Scholar] [CrossRef] [Scilit] [PubMed]
- Bishop, C.; Manuel, J.; Drury, B.; Beato, M.; Turner, A. Assessing eccentric hamstring strength using the NordBord: Between-session reliability and interlimb asymmetries in professional soccer players. J. Strength Cond. Res. 2022, 36, 2552–2557. [Google Scholar] [CrossRef] [Scilit] [PubMed]
- Dinç, E.; Arslan, S. Effect of competition level on functional movement screening scores in soccer players: A retrospective study. Spor Hekim. Derg. 2022, 57, 123–128. [Google Scholar] [CrossRef] [Scilit]
- Faul, F.; Erdfelder, E.; Lang, A.G.; Buchner, A. G*Power 3: A flexible statistical power analysis program for the social, behavioral, and biomedical sciences. Behav. Res. Methods 2007, 39, 175–191. [Google Scholar] [CrossRef] [Scilit] [PubMed]
- Nédélec, M.; McCall, A.; Carling, C.; Legall, F.; Berthoin, S.; Dupont, G. Recovery in soccer: Part I—Post-match fatigue and time course of recovery. Sports Med. 2012, 42, 997–1015. [Google Scholar] [CrossRef] [Scilit] [PubMed]
- Silva, J.R.; Rumpf, M.C.; Hertzog, M.; Castagna, C.; Farooq, A.; Girard, O.; Hader, K. Acute and residual soccer match-related fatigue: A systematic review and meta-analysis. Sports Med. 2018, 48, 539–583. [Google Scholar] [CrossRef] [Scilit] [PubMed]
- Grgic, J.; Lazinica, B.; Schoenfeld, B.J.; Pedisic, Z. Test–retest reliability of the one-repetition maximum (1RM) strength assessment: A systematic review. Sports Med. Open 2020, 6, 31. [Google Scholar] [CrossRef] [Scilit] [PubMed]
- Pallarés, J.G.; Sánchez-Medina, L.; Pérez, C.E.; De La Cruz-Sánchez, E.; Mora-Rodriguez, R. Imposing a pause between the eccentric and concentric phases increases the reliability of isoinertial strength assessments. J. Sports Sci. 2014, 32, 1165–1175. [Google Scholar] [CrossRef] [Scilit] [PubMed]
- Cohen, J. Statistical Power Analysis for the Behavioral Sciences; Routledge: New York, NY, USA, 2013. [Google Scholar]
- Benjamini, Y.; Hochberg, Y. Controlling the false discovery rate: A practical and powerful approach to multiple testing. J. R. Stat. Soc. Ser. B Methodol. 1995, 57, 289–300. [Google Scholar] [CrossRef] [Scilit]
- Borenstein, M.; Hedges, L.V.; Higgins, J.P.T.; Rothstein, H.R. Introduction to Meta-Analysis; John Wiley & Sons: Chichester, UK, 2009. [Google Scholar] [CrossRef] [Scilit]
- Hopkins, W.G.; Marshall, S.W.; Batterham, A.M.; Hanin, J. Progressive statistics for studies in sports medicine and exercise science. Med. Sci. Sports Exerc. 2009, 41, 3–13. [Google Scholar] [CrossRef] [Scilit] [PubMed]
- Gelman, A.; Stern, H. The difference between “significant” and “not significant” is not itself statistically significant. Am. Stat. 2006, 60, 328–331. [Google Scholar] [CrossRef] [Scilit]
- Zou, G.Y. Toward using confidence intervals to compare correlations. Psychol. Methods 2007, 12, 399–413. [Google Scholar] [CrossRef] [Scilit] [PubMed]
- Schiemann, S.; Keiner, M.; Wirth, K.; Lohmann, L.H.; Wagner, C.M.; Behm, D.G.; Warneke, K. The magnitude of correlation between deadlift 1RM and jumping performance is sports dependent. Front. Sports Act. Living 2024, 6, 1345213. [Google Scholar] [CrossRef] [Scilit] [PubMed]
- Ramirez-Campillo, R.; Castillo, D.; Raya-González, J.; Moran, J.; Sáez de Villarreal, E.; Lloyd, R.S. Effects of plyometric jump training on jump and sprint performance in young male soccer players: A systematic review and meta-analysis. Sports Med. 2020, 50, 2125–2143. [Google Scholar] [CrossRef] [Scilit] [PubMed]
- Silva, B.; Clemente, F.M.; Camões, M.; Bezerra, P. Functional Movement Screen scores and physical performance among youth elite soccer players. Sports 2017, 5, 16. [Google Scholar] [CrossRef] [Scilit] [PubMed]
- Pau, M.; Ibba, G.; Attene, G. Fatigue-induced balance impairment in young soccer players. J. Athl. Train. 2014, 49, 454–461. [Google Scholar] [CrossRef] [Scilit] [PubMed]
- Dos’Santos, T.; Thomas, C.; Comfort, P.; Jones, P.A. Biomechanical effects of a 6-week change-of-direction technique modification intervention on anterior cruciate ligament injury risk. J. Strength Cond. Res. 2021, 35, 2133–2144. [Google Scholar] [CrossRef] [Scilit] [PubMed]

Disclaimer/Publisher’s Note: The statements, opinions and data contained in all publications are solely those of the individual author(s) and contributor(s) and not of MDPI and/or the editor(s). MDPI and/or the editor(s) disclaim responsibility for any injury to people or property resulting from any ideas, methods, instructions or products referred to in the content. |
© 2026 by the authors. Licensee MDPI, Basel, Switzerland. This article is an open access article distributed under the terms and conditions of the Creative Commons Attribution (CC BY) license.