


Featured Application
The proposed phosphogypsum–aeolian sand binder system is intended for the in situ stabilization of desert soils and the reconstruction of drought-tolerant planting substrates while providing a large-volume use for phosphogypsum.
Abstract
Large-scale desert ecological restoration is constrained by three coupled problems: aeolian sand aggregates poorly and cannot sustain vegetation; stockpiled phosphogypsum imposes a persistent environmental burden; and importing and ameliorating exogenous topsoil is costly. This study evaluated wet-ground modified phosphogypsum (PG-A), as-received phosphogypsum used as aggregate (PG-B), aeolian sand (AS), and phosphogypsum-based supersulfated cement (PPSC). The liquid–plastic limit, compaction, direct-shear, unconfined compressive strength (UCS), and leaching tests were performed. The plasticity index of the PG-B-AS mixtures ranged from 6.62 to 12.31, and the maximum dry density increased with the AS fraction and with the PPSC content under the tested conditions. For PG-B:AS mass ratios from 1:3 to 3:1, the leachate pH ranged from 6.79 to 7.79. When AS constituted at least 25% of the aggregate, soluble phosphorus met the Class V limit of GB 3838-2002, fluoride met the Class I limit, and the phosphorus stabilization efficiency exceeded 93.5%, reaching 96.9% for GL-16 (PG-B:AS = 25:75, 15% PPSC). Room-temperature 14- and 28-day UCS values ranged from 0.602 to 1.950 MPa and from 0.853 to 2.250 MPa, respectively. The mechanical performance improved with a higher PG-B fraction, whereas the environmental fixation improved in the opposite direction. The XRD and SEM revealed quartz, gypsum, ettringite, and C-S-H development during curing. Within the tested range, PG-B:AS = 25:75 with 12–15% PPSC provided the clearest balance between leachate compliance and retained mechanical improvement.
1. Introduction
Based on the goal of global sustainable development and ecological protection, desert ecological restoration and industrial solid waste resource utilization have become two core strategic tasks. It is difficult for the huge reserves of aeolian sand in the desert area to form an effective planting soil layer, and the massive phosphogypsum solid waste produced by the chemical industry brings prominent environmental hazards. The key to promoting green and low-carbon development is to realize the co-processing and resource utilization of the two types of materials. The combination of aeolian sand and phosphogypsum to reconstruct the artificial planting matrix can not only alleviate the dual ecological pressure of land desertification and solid waste storage, but also reduce the dependence on foreign fertile soil, and build an integrated circular development model of ‘solid waste absorption–sand improvement–vegetation restoration’. This research direction has important practical value for ecological management in arid areas. The technology of using phosphogypsum to modify barren aeolian sand to prepare available planting substrates has become a research hotspot in the field of ecological restoration.
Aeolian sand, the predominant component of desert landforms, typically exhibits particle sizes ranging from 0.074 to 0.250 mm [1], with a silica dioxide (SiO2) content exceeding 80%. This material is characterized by its loose structure, low cohesion, and high permeability [2,3,4]. It is difficult to form a planting soil layer that can be used for the stable growth of vegetation under natural conditions. There is a general lack of fertile topsoil in desert areas, and the transportation cost of transporting improved soil is high. Therefore, it is urgent to use local aeolian sand in situ [5]. With the continuous development of material modification technology, aeolian sand can be reconstructed into a stable artificial planting matrix, which can reduce the transportation cost of foreign improved soil by more than 30% [6] and help the sustainable promotion of desert ecological restoration. According to statistics, the global aeolian sand covers about 21% of the land area, and it is urgent to carry out research on its land reclamation and resource utilization [7]. At present, the modification of aeolian sand is mainly divided into two major technical routes: particle gradation optimization and gelation modification. Early studies mostly focused on the traditional cementitious material system: Khan [1] first confirmed the feasibility of Saharan aeolian sand for site stabilization; Padmakumar [8] verified that it can be used as a fine-grained medium component. Subsequent curing technology is constantly enriched: Lopez-Querol [9] and Liu [10] used Portland cement to solidify aeolian sand to meet the requirements of site stability; Zhang [11] proposed fly ash replacement technology, which improved the early strength of the system by 40% and reduced the shrinkage deformation. He [12] compared three kinds of inorganic cementitious materials, and established a quantitative control standard for improving the compactness and mechanical properties of sand. In recent years, a number of breakthroughs have been made in the curing system of composite solid waste: Jing [13] developed magnesium slag-cement modified materials, which can make aeolian sand reach qualified stable strength under a specific ratio; Zhang [14] increased the splitting strength by 217% by fiber addition. Peng [15] prepared a degradable sand-fixing material with a compressive strength of 12.4 MPa; Bai [16] used geopolymer solidification technology to achieve 32% carbon emission reduction; Qu [17] and Li [18] used microbial-induced calcium carbonate precipitation (MICP) biological cementation technology to form a cementation layer between sand particles; Maimait et al. [19] developed an all-solid waste cementitious system, which can achieve the stable modification of aeolian sand with only a 20% dosage.
The annual production of phosphogypsum and blast furnace slag in the world is more than 250 million tons and 300 million tons, respectively, which are all bulk industrial solid waste [20]. The main component of phosphogypsum is calcium sulfate dihydrate (CaSO2·2H2O), which contains impurities such as phosphorus and fluorine [21]; after modification, it can be used as the core raw material for soil improvement and cementitious material preparation [21,22,23,24]. Slag powder is rich in SiO2, CaO, and Al2O3, and has cementitious activity under alkali and sulfate excitation [20], which has a good application prospect in the field of desert soil improvement. Lin [25] developed supersulfate phosphogypsum slag cement (PPSC), which is a new type of hydraulic cementitious material made of 40~50% phosphogypsum, 40~50% slag, 0~2% steel slag, and about 4% Portland cement clinker. The core formation mechanism is that sulfate-alkali synergistically activates the slag to form a three-dimensional network structure of hydrated calcium silicate (C-S-H) gel and ettringite [26]. PPSC has micro-expansion characteristics, which can effectively inhibit the cracking of modified sandy soil [27]. Li et al. [26] prepared PPSC with a compressive strength of 32.5 MPa by using CaO/SO3 (1.8~2.0), and SiO2/Al2O3 (3.5~3.7). Wu [28] clarified the triple retarding mechanism of PPSC. Ou [29] systematically analyzed the synergistic effect of the phosphogypsum–slag cement composite system and other cementitious materials, and confirmed that it had a good interfacial compatibility with sulfoaluminate cement; Zhang [30] introduced ultra-fine iron tailings to replace 20% of the slag, resulting in a 52% increase in the 28-day strength of the system; and Liang [31] confirmed that PPSC-solidified phosphorus-containing gypsum aggregate can reach the stable qualification standard within 7 days.
The existing research shows that the PPSC binder system offers substantial economic and environmental advantages, including 30–50% lower carbon emissions and 20–40% lower comprehensive costs than comparable systems [32,33]. The physical and chemical properties of aeolian sand nevertheless differ from those of conventional aggregates, and existing stabilization methods cannot be transferred directly [34]. The mechanical and environmental optima of phosphogypsum–aeolian sand mixtures have not been reconciled, and the admissible composition window remains unclear.
This study therefore addresses three objectives: (i) quantify how PPSC dosage and the PG-B:AS ratio affect plasticity, compaction, UCS, and shear parameters; (ii) determine phosphorus and fluoride leaching behavior and the AS fraction required for environmental compliance; and (iii) identify the trade-off between mechanical performance and pollutant fixation and recommend a defensible mix-proportion window.
2. Materials and Methods
2.1. Materials
2.1.1. Aeolian Sand
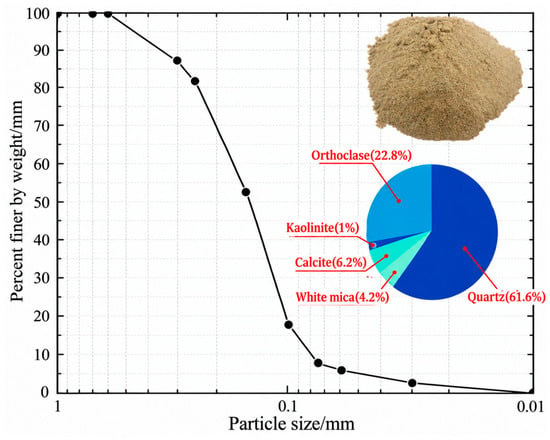
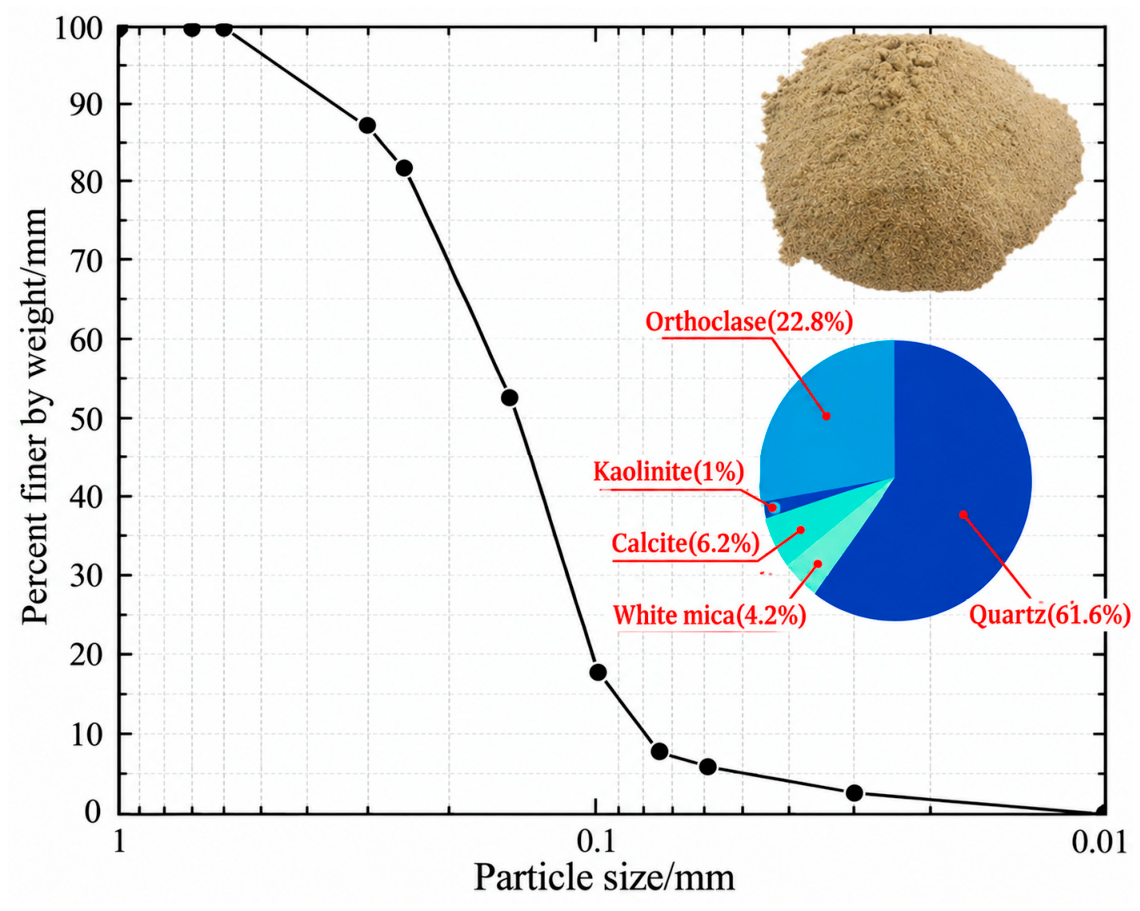
The aeolian sand (AS) used in this study was collected from the Taklamakan Desert in Xinjiang, China. Its particle-size distribution and mineral composition are shown in Figure 1. Particle-size analysis followed GB/T 50123-2019 [35], and engineering classification followed GB/T 50145-2007 [36].
Figure 1.
Grain size distribution curve of aeolian sand.
The particle sizes predominantly fall within the range of 0.08 mm to 0.80 mm. The effective grain size (D10) represents the particle size corresponding to 10% passing on the cumulative particle-size distribution curve, whereas the average grain size represents the statistical mean particle size of the aeolian sand. In this study, D10 was 0.081 mm and the average grain size was 0.146 mm. The limiting grain sizes are recorded at 0.171 mm and 0.115 mm. The coefficient of uniformity (Cu) is calculated to be 2.111(0.171/0.081 = 2.111), while the coefficient of curvature (Cc) is 0.955{0.1152/(0.081 × 0.171) = 0.955}, and the associated equations are given in Equations (1) and (2):
These gradation coefficients indicate a poorly graded material. X-ray fluorescence (XRF) results for the aeolian sand are given in Table 1.
Table 1.
Chemical components of aeolian sand.
2.1.2. Phosphogypsum
The phosphogypsum (PG) employed in this study was sourced from Yichang Zhongfu Chemical Group Co., Ltd., situated in Yichang, China. This material presents as a gray granular solid. The composition of phosphogypsum was analyzed using X-ray fluorescence (XRF) spectrometry, with the findings detailed in Table 2, indicating that the primary constituents of PG are CaO, SO3, and SiO2. Phosphogypsum that passed through a 0.08 mm standard sieve was subjected to particle size distribution analysis using a laser particle size analyzer (model: Bettersize 3000, produced by Dandong Baite Instrument Co., Ltd. in Dandong City, China), resulting in a specific surface area of 170.4 m2/kg. Mineralogical analysis was performed using JADE 6.5 software reveals that the predominant mineral components of the phosphogypsum include quicklime (approximately 9.7%), quartz (approximately 12.9%), and gypsum (approximately 76.2%). The physicochemical characterization of phosphogypsum was conducted with reference to the Chinese national standard Phosphogypsum (GB/T 23456-2025). In addition, because phosphogypsum was used as a principal constituent of the phosphogypsum-based cementitious system, the relevant requirements of By-product Gypsum Used in Cement (GB/T 21371-2019) were also considered.
Table 2.
Chemical components of phosphogypsum.
2.1.3. Ordinary Portland Cement
The ordinary Portland cement (P·O 42.5) used in this experiment was manufactured by Wuhan Huaxin Cement Company, Hubei Province, Wuhan, China, and its measured properties satisfied the requirements for P·O 42.5 cement (the standard value of the 28-day compressive strength of this cement is not less than 42.5 MPa). This cement exhibits a density of 3.077 g/cm3 and a specific surface area of 358 m2/kg. Analysis via X-ray fluorescence spectroscopy (XRF) indicated that the predominant chemical components within the cement include calcium oxide (CaO), silicon dioxide (SiO2), ferric oxide (Fe2O3), and aluminum oxide (Al2O3), as detailed in Table 3. The primary mineral components of the ordinary Portland cement consist of tricalcium silicate (3CaO·SiO2, denoted as C3S), dicalcium silicate (2CaO·SiO2, denoted as C2S), tricalcium aluminate (3CaO·Al2O3, denoted as C3A), and tetracalcium aluminoferrite (4CaO·Al2O3·Fe2O3, denoted as C4AF). The technical specifications of the cement are presented in Table 4.
Table 3.
Chemical components of P·O 42.5 (%).
Table 4.
Technical specifications of P·O 42.5.
2.1.4. Grangrized Blast Furnace Slag Powder
The granulated blast furnace slag powder (GGBS) employed in this experiment was sourced from Wuhan Iron and Steel Plant, Wuhan, China. This material demonstrates a fineness of 2.3% retained on a 0.045 mm square mesh sieve and possesses a specific surface area of 426 m2/kg. The principal components of the slag powder, as determined through XRF, include SiO2, Al2O3, and MgO, as illustrated in Table 5. According to the findings of the study [26], GGBS does not exhibit pronounced characteristic peaks indicative of crystalline phases; rather, it is predominantly composed of amorphous, glassy, non-crystalline substances. The granulated blast furnace slag powder (GGBS) was characterized with reference to the Chinese national standard Ground Granulated Blast Furnace Slag Used for Cement, Mortar and Concrete (GB/T 18046-2017).
Table 5.
Chemical components of GGBS.
2.2. Preparation Process and Mix Ratio
2.2.1. Preparation Process
To synthesize the PPSC binder, PG, GGBS, and Portland cement were mixed at a mass ratio of 45:1:2 with a water-to-binder ratio of 0.43. The mixture was wet-ground for 1 h and then aged for 24 h before drying and grinding. This treatment was designed to promote mechanical activation, particle refinement, and partial dissolution of the constituent phases, thereby enhancing their interaction and reactivity. The aging process induces partial early hydration rather than complete hydration, leaving reactive GGBS and cement phases available for subsequent reactions. During subsequent stabilization, these phases further react with Ca2+ and SO42− released from PG, promoting the formation of C–S–H and ettringite (AFt), which contribute to particle bonding and pore filling.
In the formulation of PPSC, wet-ground modified phosphogypsum (PG-A), GGBS, and P·O 42.5 were mixed at a mass ratio of 50:45:5 and stirred for 3–7 min at a total water-to-solid ratio of 0.30. The water-to-solid ratios used in this study therefore refer to different preparation stages: 0.43 for wet grinding of the raw modifier mixture and 0.30 for preparation of the final PPSC binder.
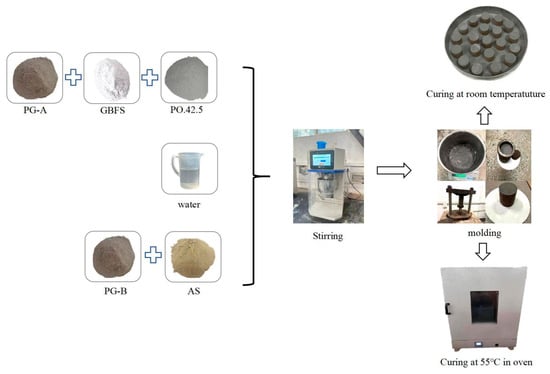
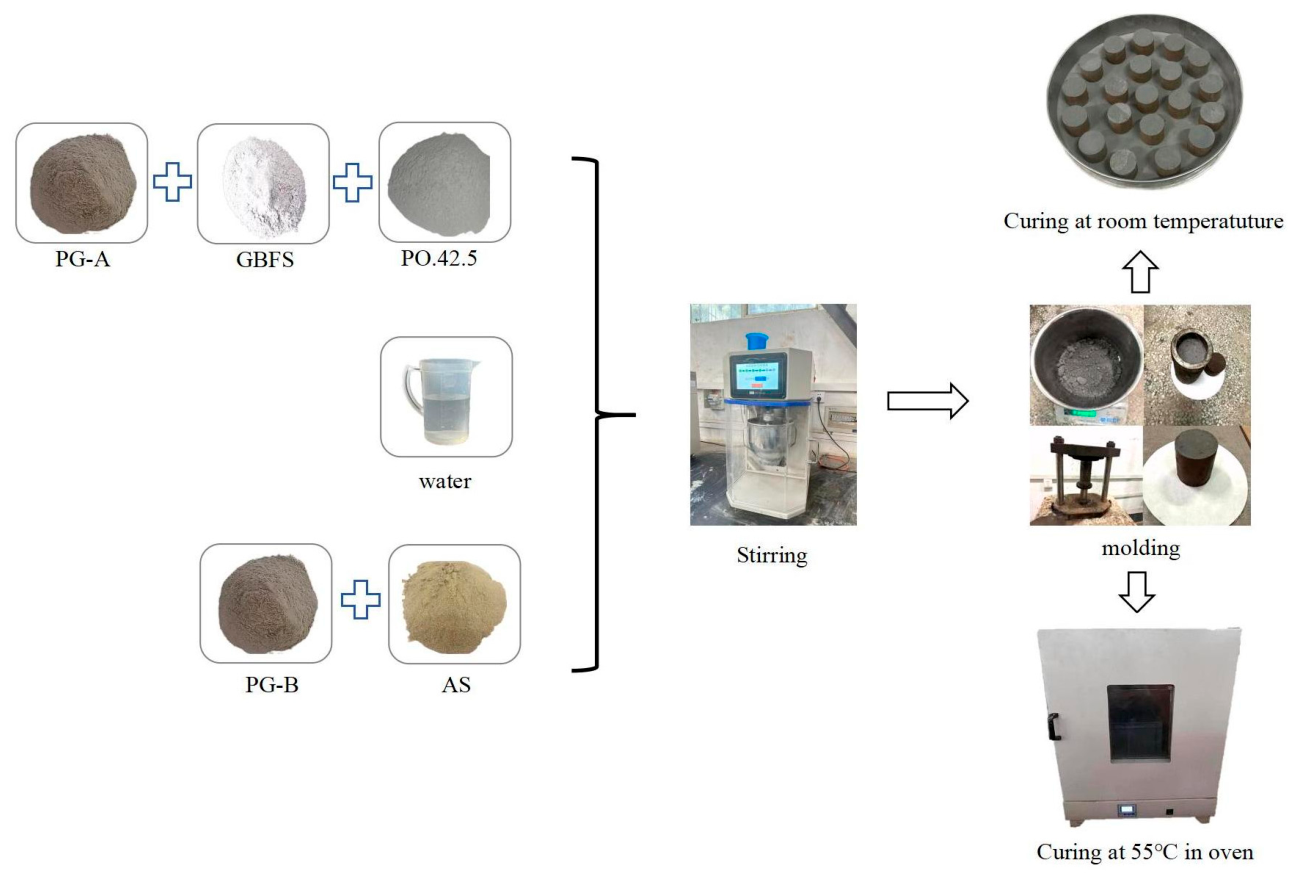
As-received, unground phosphogypsum was designated PG-B and used as the aggregate fraction. PG-B and AS were mixed for 3–7 min. PPSC and water were then added, and mixing continued for 3–10 min. The fresh mixture was compacted and molded, followed by controlled curing to produce the stabilized PG-B-AS material designated GL. The preparation procedure is shown in Figure 2.
Figure 2.
Preparation process of stabilized specimens.
2.2.2. Mix Proportion Design
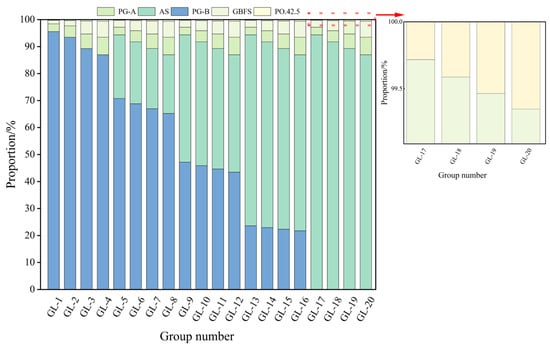
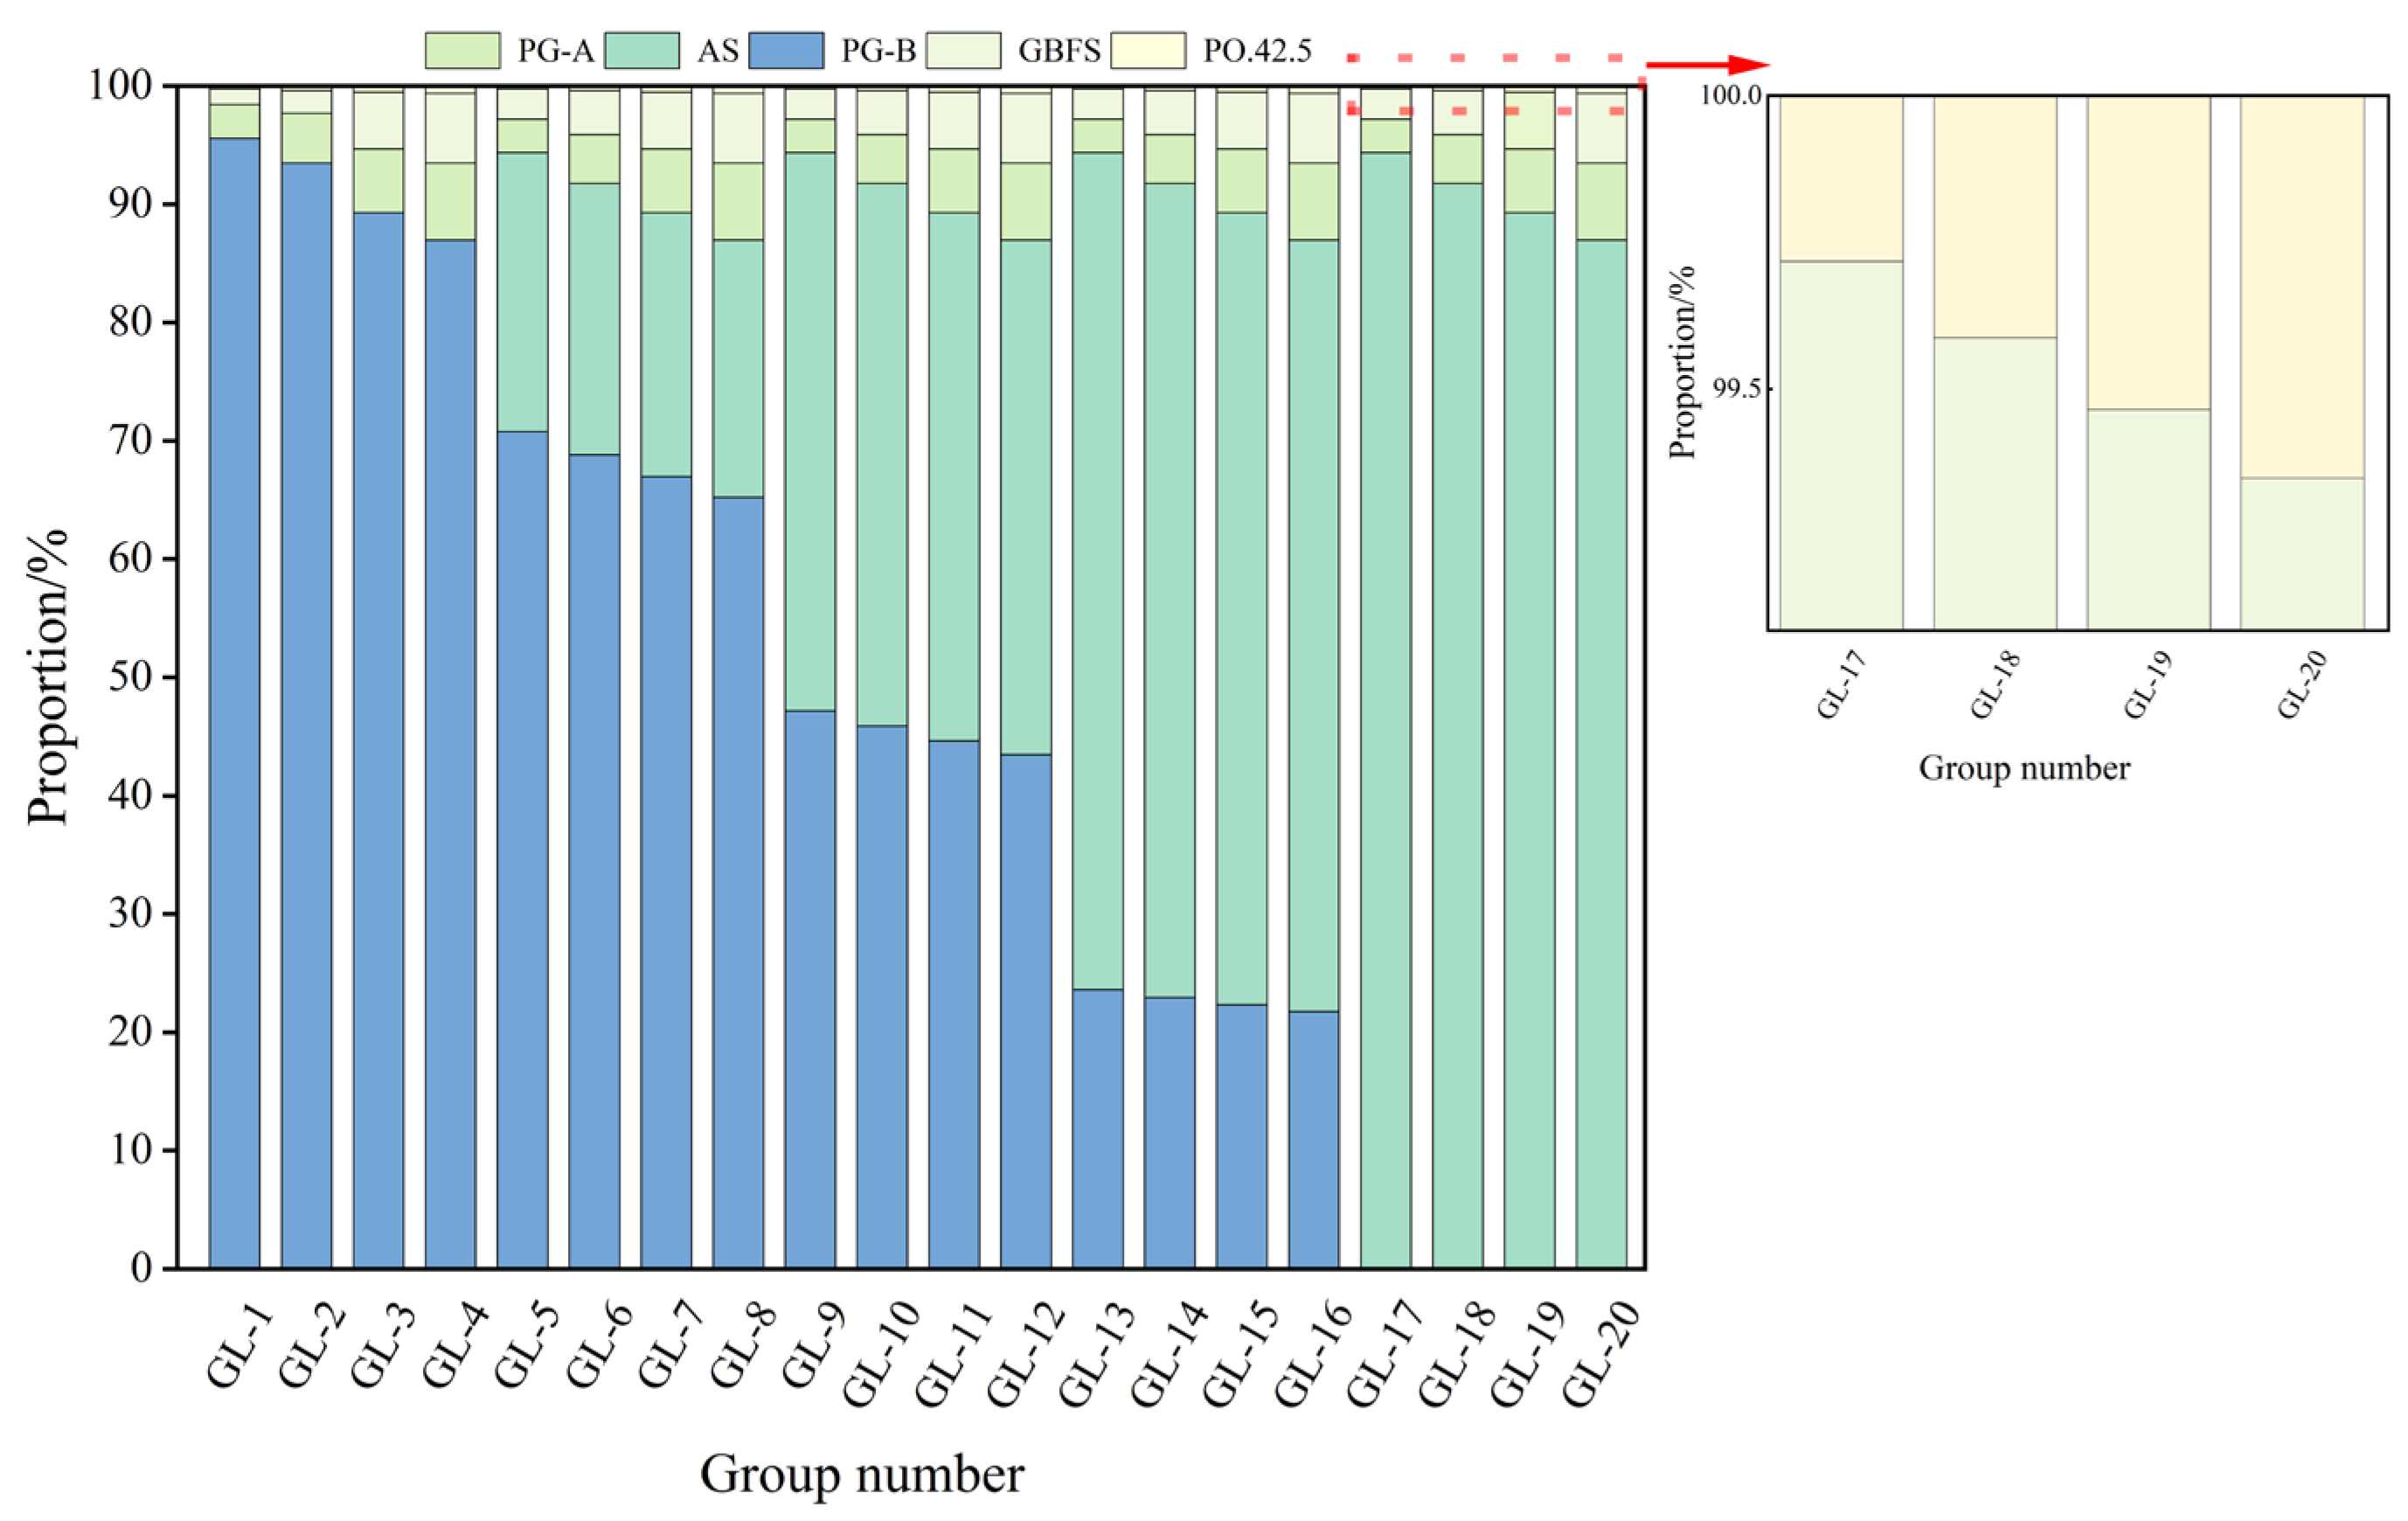
In this study, mixtures of phosphogypsum and aeolian sand were adopted as desert soil amelioration substrates, and PPSC was used as the curing binder. On the basis of pre-experimental exploration, to realize high-volume synergistic reuse of phosphogypsum and aeolian sand for sand improvement, the mixing dosage of PPSC was set within the adjustable range of 6~15%, with a gradient interval of 3%. Meanwhile, the mass proportion of aeolian sand in the mixed substrate was increased from 0 to 1 at an interval of 0.25. The specific proportions used in this study are illustrated in Figure 3.
Figure 3.
Mix proportion design of GL.
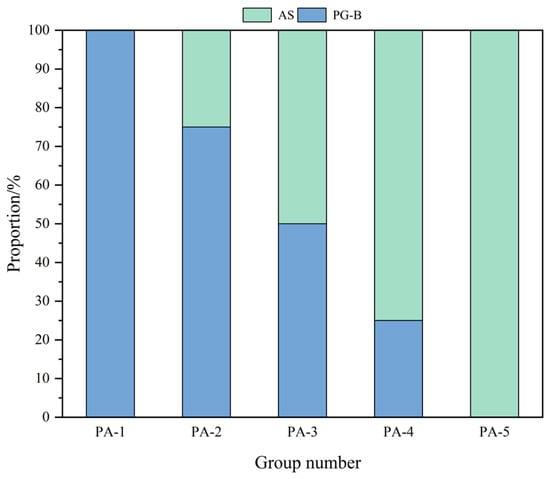
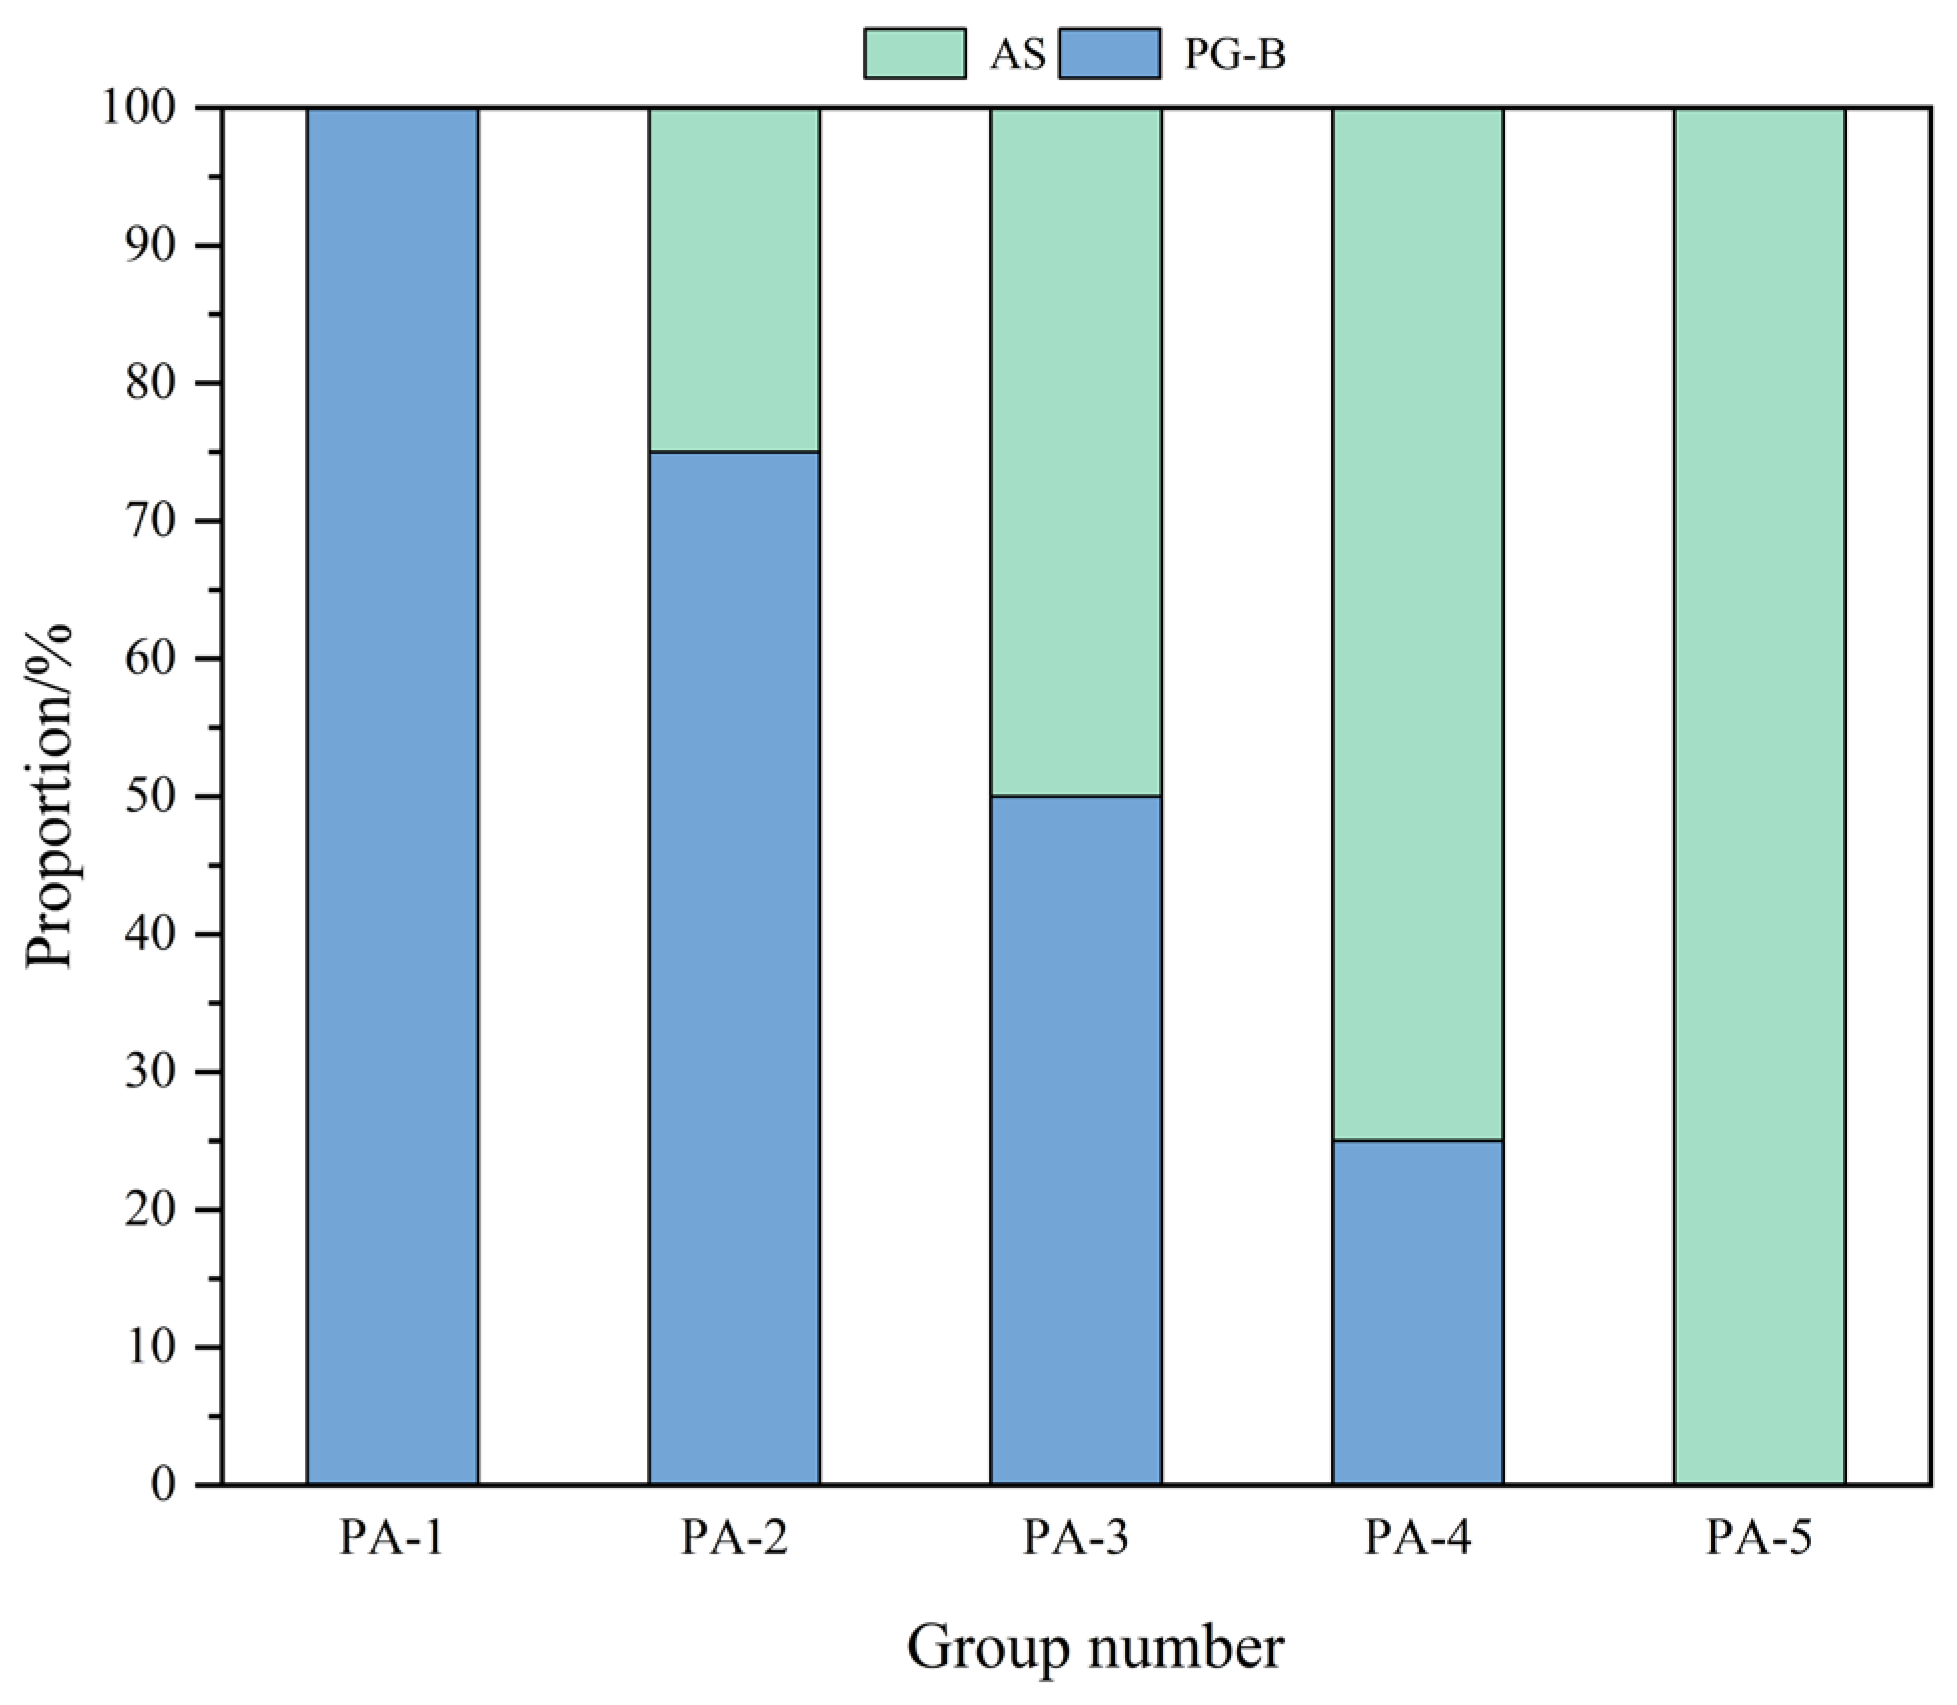
Moreover, to assess the geotechnical properties of the phosphogypsum–aeolian sand mixture and to offer a reference for the stabilization of similar soils using PPSC, five distinct mass ratios of phosphogypsum–aeolian sand mixtures (designated as PA) were designed, as depicted in Figure 4. Herein, PA refers to the untreated phosphogypsum–aeolian sand mixture without PPSC stabilization, whereas GL refers to the corresponding PPSC-stabilized and cured mixture.
Figure 4.
Mix proportion design of PA.
2.3. Experimental Methods
2.3.1. Liquid–Plastic Limit Test
The experimental procedures adhere to the “Geotechnical Test Methods Standard” (GB/T 50123-2019), employing the liquid–plastic limit test methodology. This test entails the measurement of the penetration depth of a 76 g cone into PA samples across various states corresponding to the liquid limit, plastic limit, and intermediary conditions. A curve is subsequently generated to illustrate the relationship between cone penetration depth and moisture content. The moisture content corresponding to a cone penetration depth of h = 17 mm is designated as the liquid limit (wL) of the sample, whereas the moisture content associated with a penetration depth of h = 2 mm is identified as the plastic limit (wP). The plasticity index (IP) is calculated as the difference between the liquid limit and the plastic limit (IP = wL − wP), and this index is used to classify soil types and assess their engineering properties.
2.3.2. Moisture–Density Test
In this experiment, a lightweight compaction apparatus was used for conducting moisture–density tests, in accordance with the methodology outlined for inorganic-bound stabilized materials in the “Test Procedures for Highway Engineering Inorganic-Bound Stabilized Materials” (JTG E51-2009) [37]. The testing procedure was executed in five distinct layers, with each layer subjected to 27 blows of compaction. To ascertain the optimum moisture content and maximum dry density, five to six samples with varying moisture contents—differing by increments of 0.5% to 1.5%—were prepared.
2.3.3. Unconfined Compressive Strength Test
Unconfined compressive strength tests were performed in accordance with the “Test Procedures for Highway Engineering Inorganic-Bound Stabilized Materials” (JTG E51-2009) [37]. Utilizing the optimum moisture content and maximum dry density determined from the moisture–density tests, cylindrical specimens with dimensions of 50 mm in height and 50 mm in diameter were meticulously prepared, achieving a consistent compaction degree of 98%. Following preparation, the specimens and molds were sealed and placed in a controlled curing environment maintained at a temperature of 20 ± 1 °C and a relative humidity of no less than 95%. After a curing period of one day, the specimens were demolded and subjected to two distinct environmental conditions that simulate the diurnal temperature fluctuations characteristic of desert climates. The first condition involved sealed curing at room temperature, with unconfined compressive strengths being assessed at intervals of 7, 14, and 28 days. The second condition entailed sealed curing within a constant temperature oven set at 55 °C, where strength development was monitored at intervals of 1, 3, 7, and 14 days. The strength tests were executed using a pavement material strength tester, conducting uniaxial compression tests at a loading rate of 1 mm/min.
2.3.4. Direct Shear Test
This experiment primarily aims to quantify the internal friction angle and cohesion of PA and GL. The shear strength testing methodology adheres to the “Highway Geotechnical Test Procedures” (JTG E40-2007) [38]. For each specified mix ratio, six specimens are meticulously prepared using a ring cutter with an inner diameter of 61.8 mm and a height of 20 mm. The instrument’s cutting speed is 1 mm/min. Sequential loading tests are conducted on each specimen, during which the readings from the dial gauge of the force meter are recorded until failure of the sample occurs. Subsequently, a τf–σ relationship curve is constructed, with shear strength (τf) plotted on the vertical axis and normal stress (σ) on the horizontal axis. The internal friction angle (ψ) and cohesion (c) are subsequently derived by fitting the resulting curve.
2.3.5. pH Test
In accordance with the HJ557-2010 standard, titled “Leaching Toxicity Leaching Method—Horizontal Shaking Method” [39] pH tests were systematically conducted on PA and GL. Leachates were prepared at a controlled temperature of 20 ± 0.5 °C, employing a water-to-solid ratio of 10:1. The pH values of the resulting leachates were accurately measured using a high-precision pH meter (FiveEasy Plus FE28-Standard, Mettler-Toledo Instruments (Shanghai) Co., Ltd., Shanghai, China). Data were meticulously recorded once the pH readings reached a state of stabilization.
2.3.6. Leachate Pollutant Testing
The test subjects comprise leachates derived from PA and GL. The parameters under investigation include the concentrations of soluble phosphorus and fluorine present in the leachates. Standard specimens are immersed in water, with representative solution samples collected at designated curing ages for subsequent laboratory analysis. Prior to testing, the samples are meticulously filtered through a 0.45 μm membrane filter to isolate the leachate for analytical examination.
2.3.7. X-Ray Diffraction Testing (XRD)
X-ray diffraction (XRD) is a transmission diffraction technique employed to elucidate the mineral composition of various materials. Through XRD analysis, essential information regarding phase composition diffractograms, mineral content, and crystallinity can be extracted. The testing utilizes a portable X-ray diffractometer, model XRD-Terra, configured with the following parameters: a tube voltage of 30 kV, a tube current of 300 μA, a copper target, a step width of 0.02°, a vibration frequency of 6000 Hz, and a 2θ range spanning from 5° to 55°. At designated intervals, representative small samples are immersed in alcohol to effectively halt the hydration process. During the testing phase, the samples are dried and subsequently ground into a fine powder, achieving a particle size of no less than 200 mesh, and then securely sealed in plastic bags. Following the completion of the tests, the resultant data is imported into the XPOWDER software (version 2012.01.01) for comprehensive analysis.
2.3.8. Scanning Electron Microscopy (SEM) Testing
Upon completion of the compressive strength tests at the predetermined age, the fractured fragments were meticulously refined into 1 cm-sized samples, and examined without polishing. Following this preparation, the samples were immersed in alcohol to effectively halt the hydration process, the accelerating voltage was set to 15 kV, then subjected to drying prior to scanning electron microscope (SEM) analysis. At the commencement of the experiment, a thin layer of platinum was delicately deposited onto the sample surface, enabling enhanced observation of its microstructure using a Phenom Pro desktop field emission scanning electron microscope.
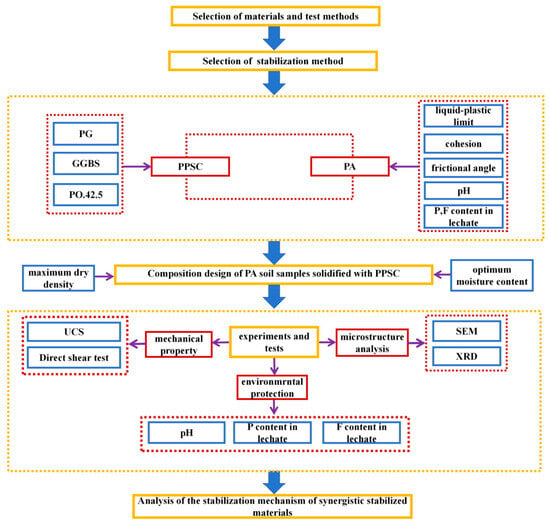
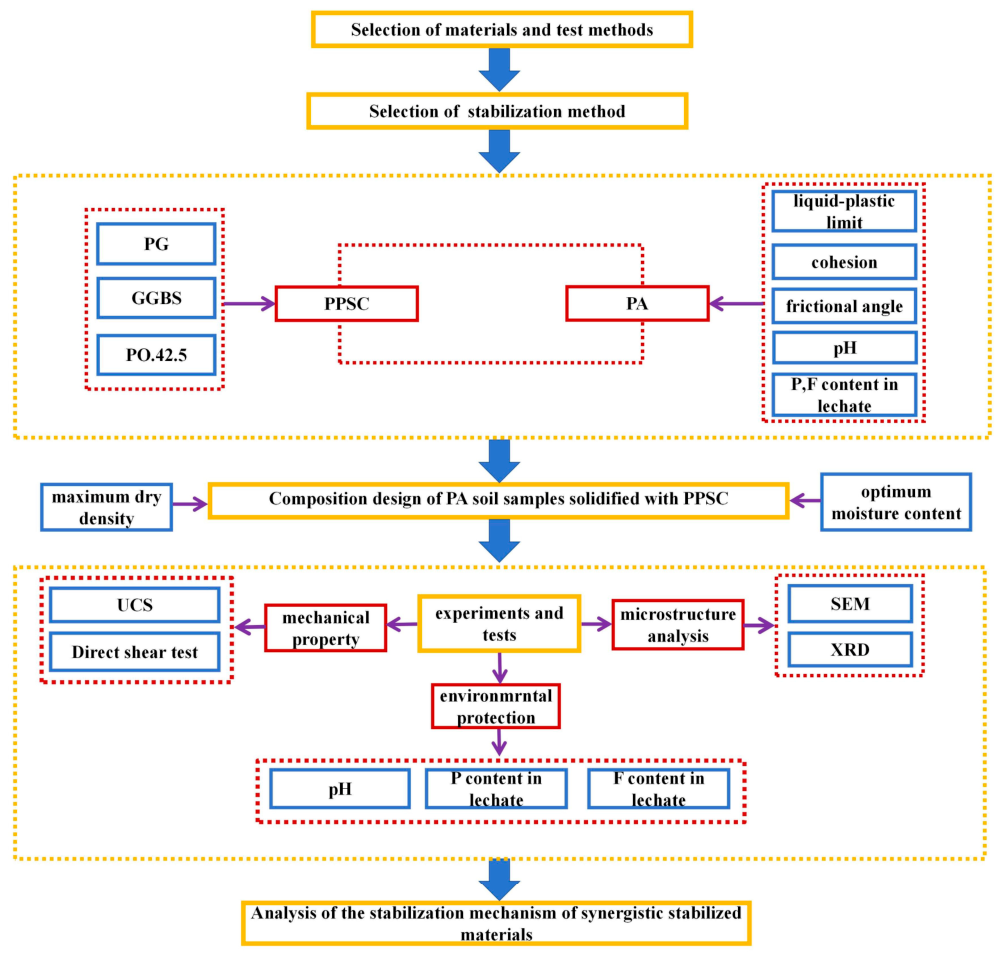
The overall testing process is illustrated in Figure 5.
Figure 5.
Overall testing process.
3. Results
No independent replicate series were available for the UCS, density, or shear tests; consequently, the error bars and statistical significance tests are not reported, and all comparisons are descriptive.
3.1. Liquid–Plastic Limit
Experiments examining the liquid–plastic limit through combined tests were conducted for various mix ratios of PA, with the results detailed in Table 6. The pure phosphogypsum aggregates exhibit a plasticity index of 14.03, indicative of favorable plasticity, whereas the pure desert sand aggregates present a considerably lower plasticity index of merely 2.06, reflecting inadequate plasticity. When phosphogypsum is blended with aeolian sand, the plasticity index of the resulting mixed soil samples varies between 6.62 and 12.31. An analysis using the Casagrande plasticity chart [40] reveals that the plasticity of the mixed soil samples is situated between that of silt and silty clay. Desert sand contains a minimal quantity of fine-grained particles and demonstrates poor gradation, predominantly comprising fine sand particles within the range of 0.075 to 0.6 mm. Conversely, phosphogypsum is characterized by a substantial presence of fine particles and micrometer-sized crystals, which possess diameters smaller than those of the desert sand particles. These finer particles serve to fill the voids among the coarser aggregates, resulting in a more continuous gradation that enhances the compaction characteristics of the mixed soil, thereby aligning it more closely with the compaction level typically associated with silt [41]. Moreover, the principal chemical component of phosphogypsum, dihydrate calcium sulfate (CaSO4·2H2O), undergoes dissolution and recrystallization upon exposure to water, yielding short columnar or needle-like crystals. This phenomenon culminates in the formation of a temporary cementitious network that significantly augments the plasticity of the mixed soil, elevating it to a silt-like consistency. The application of PPSC for the stabilization of PA may provide crucial insights for the stabilization of soils that exhibit characteristics akin to silt or silty clay.
Table 6.
Liquid–plastic limit indicators of PA.
3.2. Moisture–Density Test
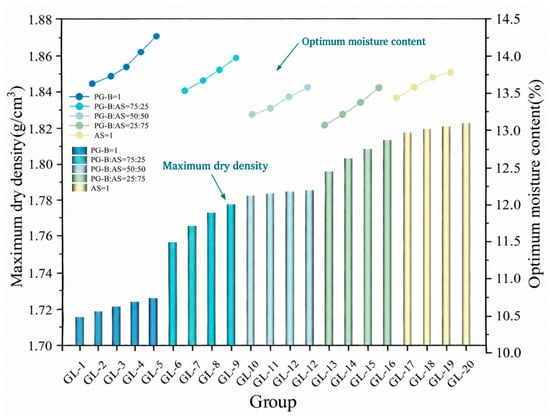
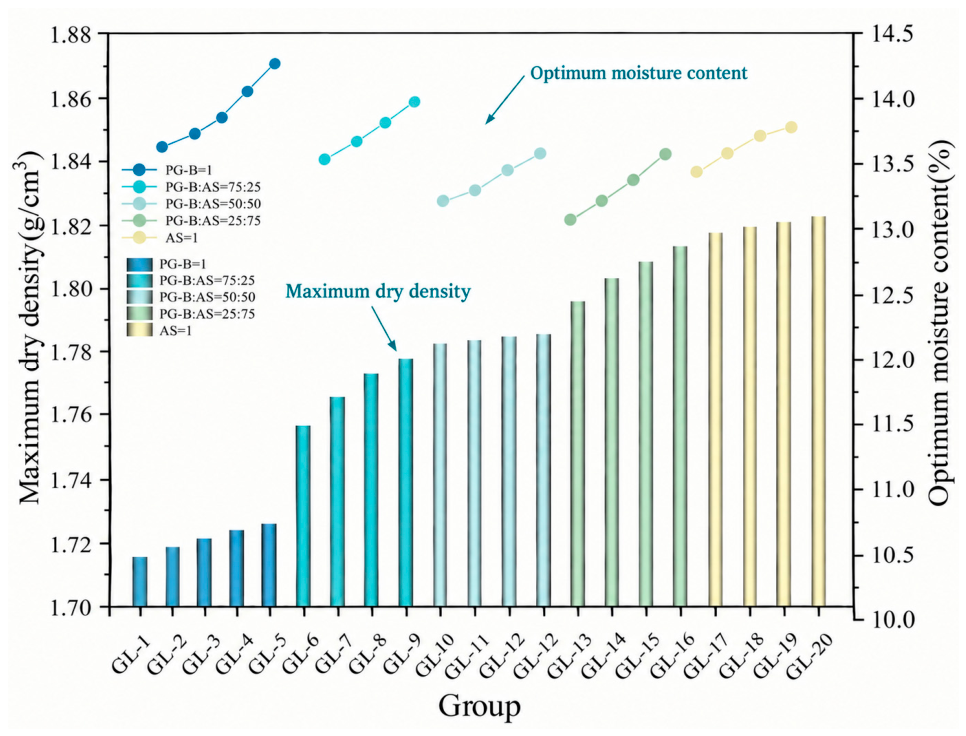
Moisture–density tests were conducted on GL, with the results illustrated in Figure 6. When the aggregate content is held constant, an increase in the PPSC leads to a rise in the maximum dry density of the specimens. Conversely, when the quantity of PPSC remains unchanged, the maximum dry density exhibits an increase as the proportion of aeolian sand escalates. This phenomenon adheres to the principle that the coarse particle framework of aeolian sand effectively supports the incorporation of the finer phosphogypsum particles into the voids. Notably, the variation in the proportion of aeolian sand within the aggregate mix exerts a more obvious influence on the maximum dry density than does the alteration of the PPSC quantity. For instance, the maximum dry density observed an increase of 1.3% from GL-5 to GL-8 and a further increase of 1.6% from GL-5 to GL-9. While enhancing the aeolian sand content contributes positively to the maximum dry density, it may concurrently impact other properties, such as strength, in an adverse manner. Consequently, in practical construction applications, it is imperative that the proportions of PPSC and aeolian sand be carefully determined, taking into account the specific requirements of the construction process and the desired performance characteristics.
Figure 6.
Optimum moisture content and maximum dry density of GL.
3.3. Unconfined Compressive Strength
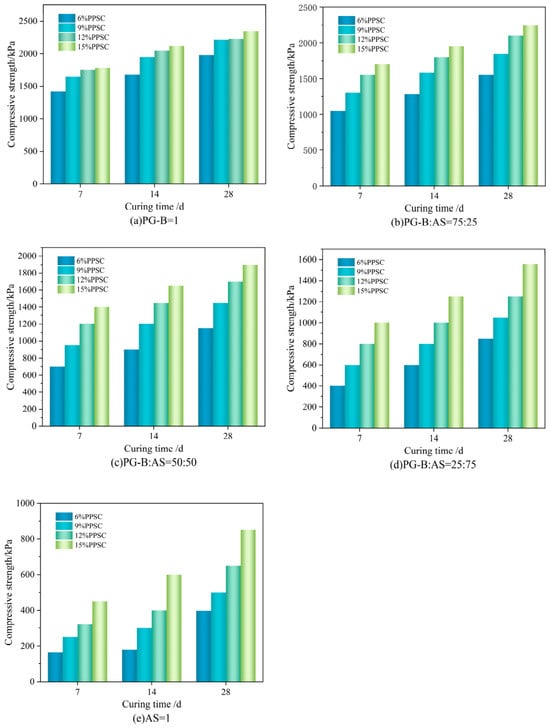
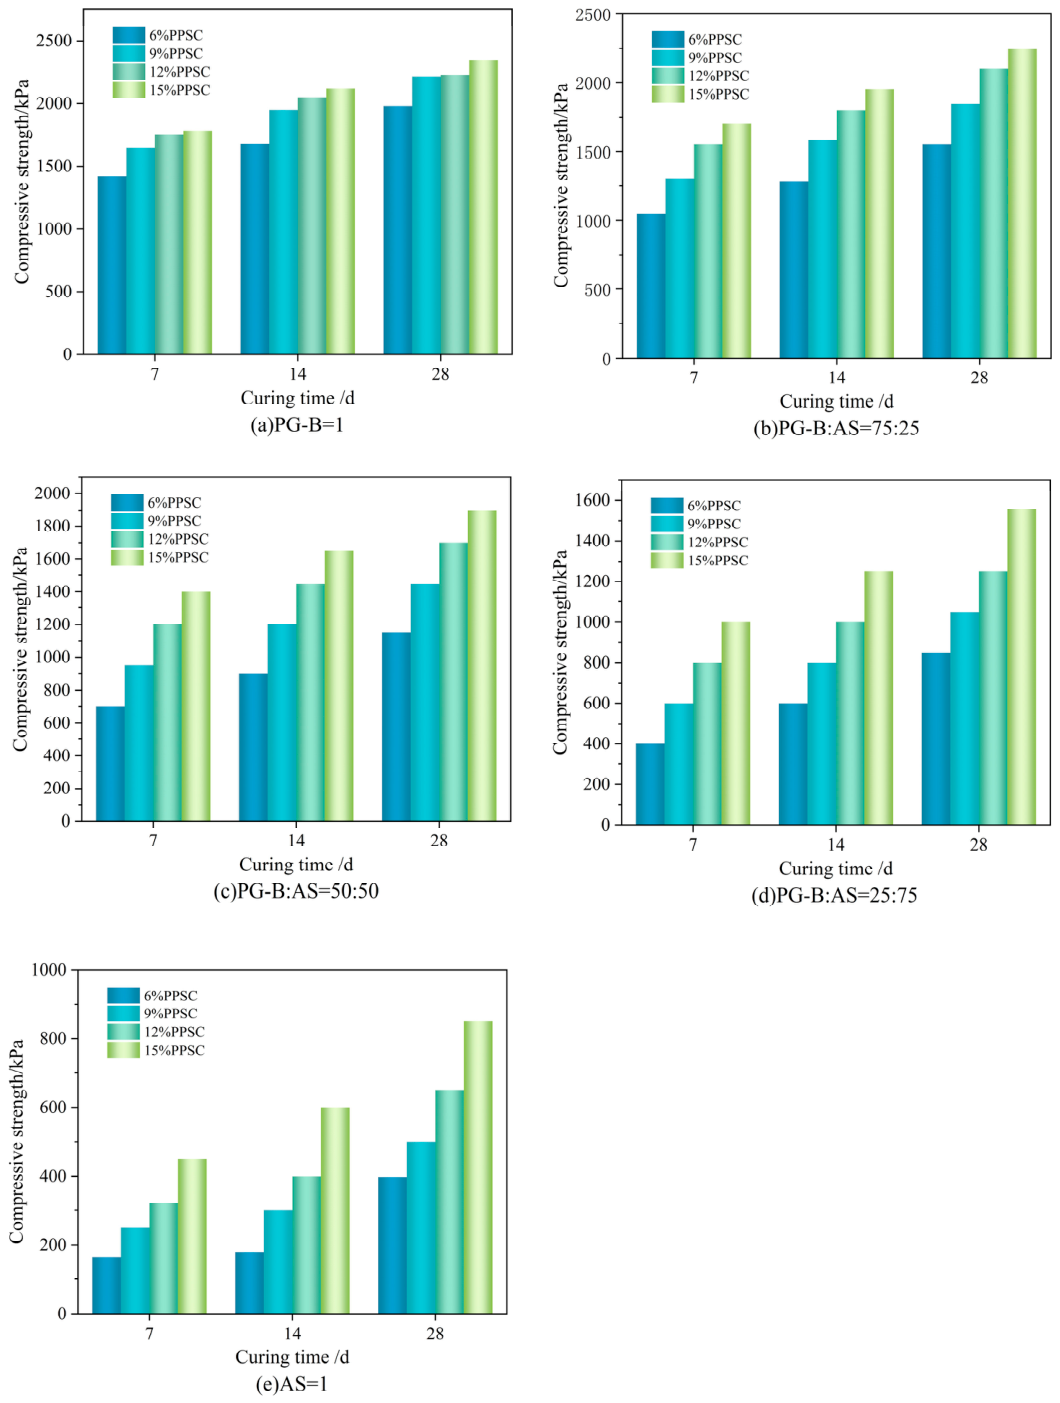
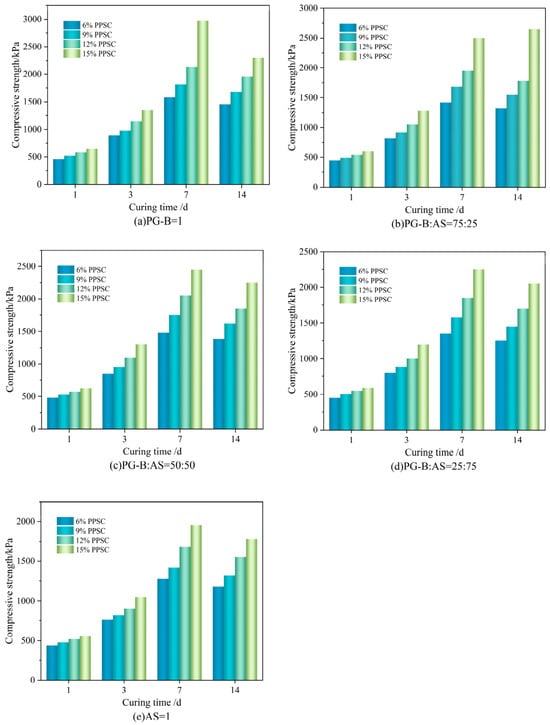
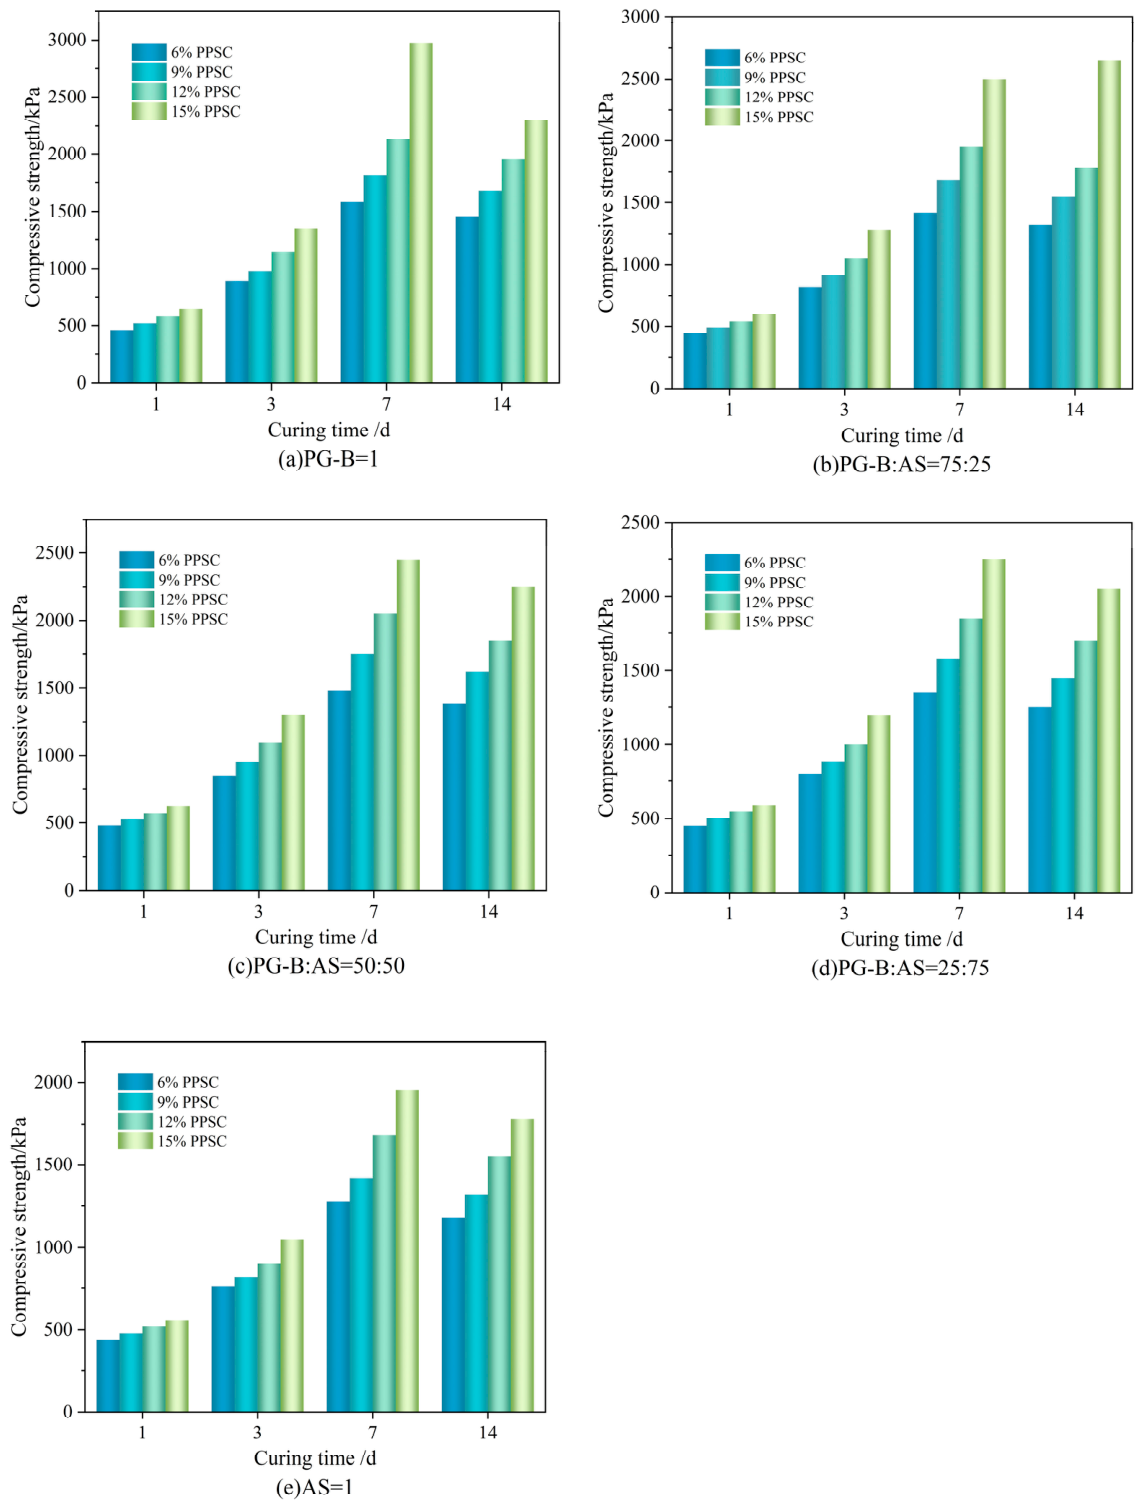
UCS testing followed the curing schedule in Section 2.3.3; the schedule is not repeated here. The room-temperature results are shown in Figure 7, and the 55 °C results are shown in Figure 8.
Figure 7.
Unconfined compressive strength of stabilized soil curing at room temperature: (a) PG-B = 1; (b) PG-B:AS = 75:25; (c) PG-B:AS = 50:50; (d) PG-B:AS = 25:75; and (e) AS = 1.
Figure 8.
Unconfined compressive strength of stabilized soil curing at 55 °C: (a) PG-B = 1; (b) PG-B:AS = 75:25; (c) PG-B:AS = 50:50; (d) PG-B:AS = 25:75; and (e) AS = 1.
As depicted in Figure 7, specimens composed solely of phosphogypsum demonstrate markedly higher strength compared to their counterparts. An increase in the proportion of aeolian sand correlates with a steady decline in strength. Conversely, an increase in the PPSC generally enhances the strength of the specimens, yielding a consistent rate of strength improvement. Throughout the testing duration, GL-4, which contains the highest concentration of PPSC alongside phosphogypsum aggregate, exhibits the pinnacle of unconfined compressive strength, peaking at 1784 kPa at the 7-day mark. In contrast, by the 14-day curing period, the specimen recording the lowest unconfined compressive strength is GL-17, which achieves merely 166 kPa, comprising only 6% PPSC and entirely aeolian sand as its aggregate. By the end of the 28-day curing period, as hydration reactions progress, the GL-4 specimen, maintaining its status as the strongest, ascends to 2351 kPa, closely followed by GL-3. Meanwhile, the GL-17 specimen, despite registering the lowest initial strength, attains a notable strength of 398 kPa, a 2.4-fold increase over its 14-day value.
Higher PPSC dosage produced more hydration products and a denser binding matrix. As the curing time extends, the extent of these reactions intensifies, resulting in the formation of additional gel materials that establish a new structural framework within the phosphogypsum–aeolian sand mixture. This ongoing process contributes to a continuous enhancement in the strength of the stabilized material, primarily composed of aeolian sand and phosphogypsum. The underlying mechanism involves GGBS, which, under the alkaline activation of P·O 42.5 cement, releases reactive Si and Al species. These species subsequently participate in hydration and pozzolanic reactions with Ca2+ and SO42− supplied by the cementitious materials and phosphogypsum, resulting in the formation of C–S–H and Al-bearing hydration products such as ettringite (AFt) [42]. The associated chemical reaction equations are delineated in Equations (3) and (4).
From Figure 7, it is evident that, as the curing period extends, the strength of the specimens generally increases, albeit at a diminishing rate in the later stages compared to the earlier phases. Specimens exhibiting various mix ratios demonstrate analogous rates of strength enhancement between 14 and 28 days of curing, indicating that the PPSC predominantly influences the strength development of the stabilized soil. This phenomenon can be attributed to the retarding properties of phosphogypsum, the prolonged nature of hydration reactions, the sequential formation of hydration products, and the ongoing optimization of the microstructure. The presence of phosphogypsum prolongs the curing time of the specimens and decelerates the hydration rate [28], resulting in a 7-day strength development that lags behind that of typical cement-stabilized soil. Soluble phosphorus reacts with constituents in cement and GGBS to form calcium phosphate and hydroxyapatite, which coat the surfaces of raw materials and hydration products, impeding rapid ion exchange and swift hydration reactions. In the initial stages, the active components within the cement hydrate to form C-S-H gel, leading to a relatively rapid reaction rate but yielding limited quantities of products. These products primarily serve to fill the larger pores between the phosphogypsum and aeolian sand particles, leaving numerous cracks and unreacted binding particles within the material [43]. As the curing age progresses, the C-S-H gel gradually infiltrates nanoscale pores and envelops the surfaces of the phosphogypsum–aeolian sand aggregates, enhancing adhesion through chemical bonds, such as Si-O-Si. This process densifies the matrix and contributes to an increase in compressive strength [21]. Initially, ettringite formed from sulfate and aluminates primarily functions to bridge pores in needle-like crystals, which gradually transition into more stable forms, such as plate-like and columnar structures, further fortifying the interfaces [44]. With the accumulation of hydration products, the larger pores within the stabilized soil diminish, while micropores proliferate, optimizing the pore size distribution. This allows micron-scale hydration products to permeate the interstices between aggregates, mitigating the stress concentration and enhancing the material density [45] ultimately resulting in an increase in compressive strength.
For specimens sealed and cured in an oven at 55 °C, as illustrated in Figure 8, it is observed that the unconfined compressive strength generally declines with an increase in the content of aeolian sand, a trend that becomes more pronounced after 7 days of curing. The incorporation of PPSC typically results in an enhancement of the unconfined compressive strength of the specimens. After one day of curing, the specimen exhibiting the lowest strength, GL-17, demonstrates a strength of 440 kPa. This specimen comprises solely aeolian sand, with a mere 6% of PPSC incorporated. In contrast, after three days of curing, GL-4, which contains 15% PPSC and 100% phosphogypsum by weight of the aggregate, emerges as the specimen with the highest strength. After seven days of curing, most PG-rich mixes exceeded 1700 kPa, with GL-4 attaining a peak strength of 2970 kPa.
From Figure 8, it becomes evident that the initial strength of specimens across different mix ratios is relatively high. Prior to the 7-day mark, the strength of all specimens exhibits a continuous upward trajectory with age. Notably, between the 3-day and 7-day curing periods, there is a remarkable acceleration in the rate of strength development, with similar rates observed across the specimens. At this juncture, the strength of the specimens cured in the oven significantly exceeds that of their counterparts cured at room temperature. However, after reaching peak strength, most specimens experience a decline in strength to varying extents between 7 and 14 days, with the exception of specimen GL-8. Despite these reductions, the strength levels remain substantially higher than those measured at the 3-day interval and generally exceed the strength of specimens cured at room temperature during the same timeframe. In the high-temperature curing environment, the accelerated hydration rate from 0 to 7 days is markedly significant. This environment facilitates the disintegration of glassy phases within the GGBS, accelerates the dissolution of active SiO2 and Al2O3, and enhances the sulfate activation effect. Consequently, the formation of ettringite occurs approximately 2 to 3 times more rapidly than under room temperature conditions [46]. Following the 7-day period, the continued exposure to elevated temperatures induces the rapid dehydration of gel products, resulting in a reduction in the water content within the C-S-H gel matrix [47]. This phenomenon can give rise to microcracks within the material, which, in turn, macroscopically impacts the compressive strength of the specimens. Furthermore, under a 55 °C environment, the conversion of CaSO4·2H2O to CaSO4·0.5H2O frequently occurs, leading to volume contraction during this phase change and diminishing interfacial cohesion, thereby contributing to a reduction in the compressive strength of the specimens [48,49]. Although the observed reduction in strength can be attributed to multiple factors, the detrimental impacts are outweighed by the beneficial effects of elevated temperatures on material strength during the initial 7 days. As a result, specimens cured in the oven consistently exhibit higher compressive strength than those cured at room temperature throughout the 0- to 14-day period.
Experimental data indicate that, when the PPSC content ranges from 6% to 15%, and the mass ratio of phosphogypsum to aeolian sand within the aggregate lies between 1:3 and 3:1, both materials achieve obvious synergistic utilization at higher dosages. Under these conditions, the compressive strength of specimens cured at room temperature for 14 and 28 days attains values ranging from 0.602 to 1.950 MPa and from 0.853 to 2.250 MPa, respectively. In contrast, under constant-temperature oven curing at 55 °C, the compressive strength after 14 days ranges from 1.251 to 2.653 MPa. These mechanical properties satisfy the technical requirements for subgrade fill materials in desert regions, as delineated in the ‘Highway Subgrade Design Code’ (JTG D30-2004) [50], thereby providing a solid foundation for optimizing the mix ratio.
3.4. Cohesion and Internal Friction Angle
Direct shear tests were performed on PA and GL at a compaction degree of 98% and a curing age of 28 days. The normal-stress sequence and displacement rate were not complete in the archived record; the results are therefore treated as descriptive shear-strength estimates.
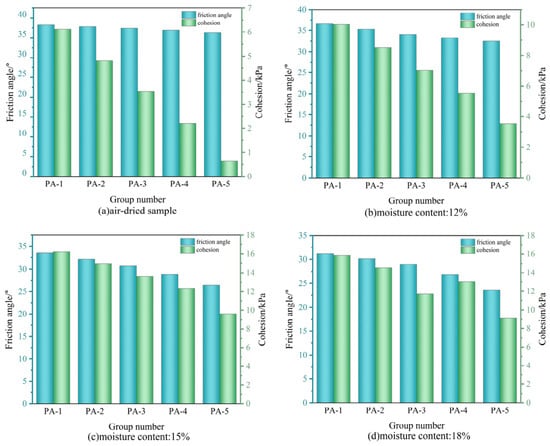
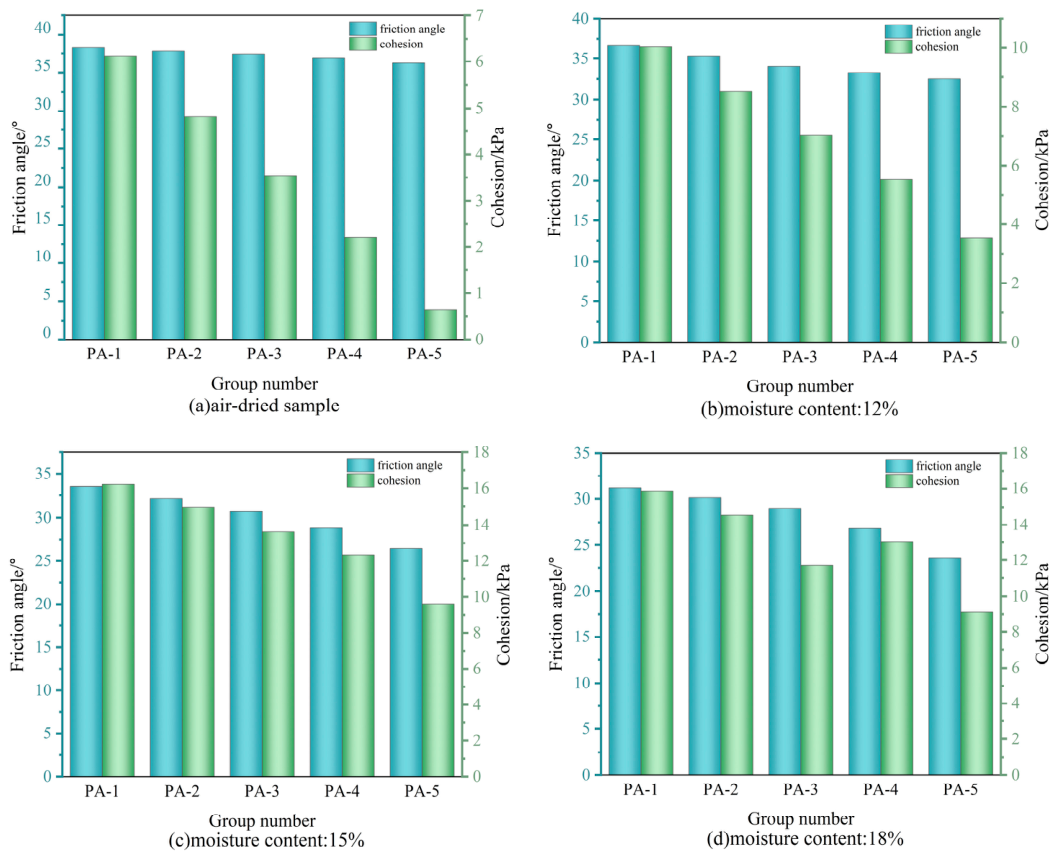
The results elucidate the internal friction angles and cohesion values of PA at varying moisture contents, as presented in Figure 9. The data reveals that the internal cohesion of the mixed soil samples is relatively low, remaining below 20 kPa; however, it is notably higher than that of pure aeolian sand. The internal friction angles consistently remain below 40° and exhibit a gradual decline with increasing aeolian sand content. This phenomenon may be attributed to the weaker bonding effect of aeolian sand in comparison to phosphogypsum, resulting in diminished particle connectivity as the proportion of aeolian sand escalates. Furthermore, the fine particles of phosphogypsum can effectively fill the interstitial spaces between sand grains, fostering a more compact structure that consequently improves cohesion. The small, uniform, and smooth nature of the aeolian sand particles further contributes to this effect; as their proportion increases, inter-particle friction diminishes, leading to a reduction in the friction angle.
Figure 9.
Internal friction angle and cohesion of PA: (a) air-dried sample; (b) 12% moisture; (c) 15% moisture; and (d) 18% moisture.
At a fixed mixture ratio, the internal friction angle decreased as the moisture content increased. Cohesion peaked near the optimum moisture content (approximately 15%) and then decreased. Near the optimum, the partial dissolution and recrystallization of CaSO4·2H2O can fill voids and bind particles. Above the optimum, excess water dilutes the binder, increases the water film between particles, and can promote the leaching of soluble salts, reducing both cohesion and frictional interlocking.
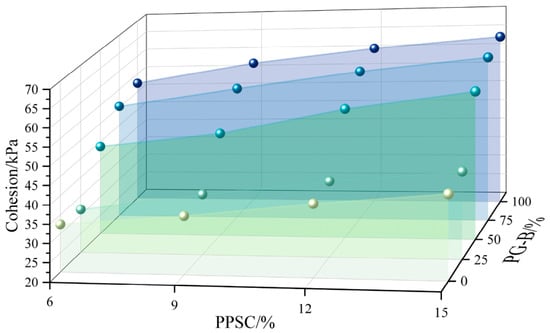
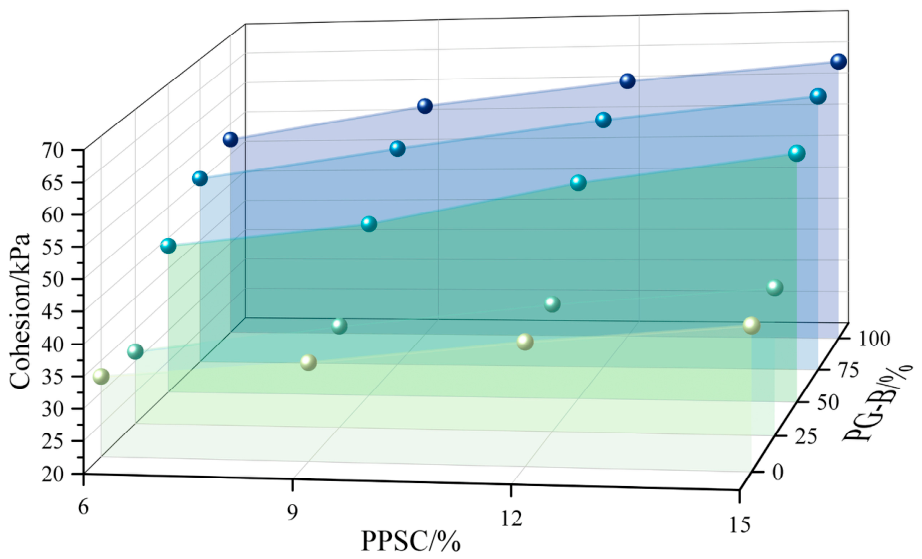
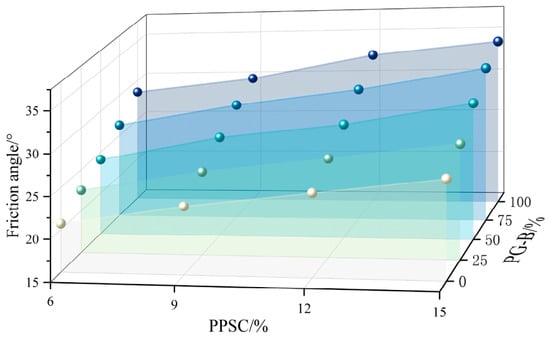
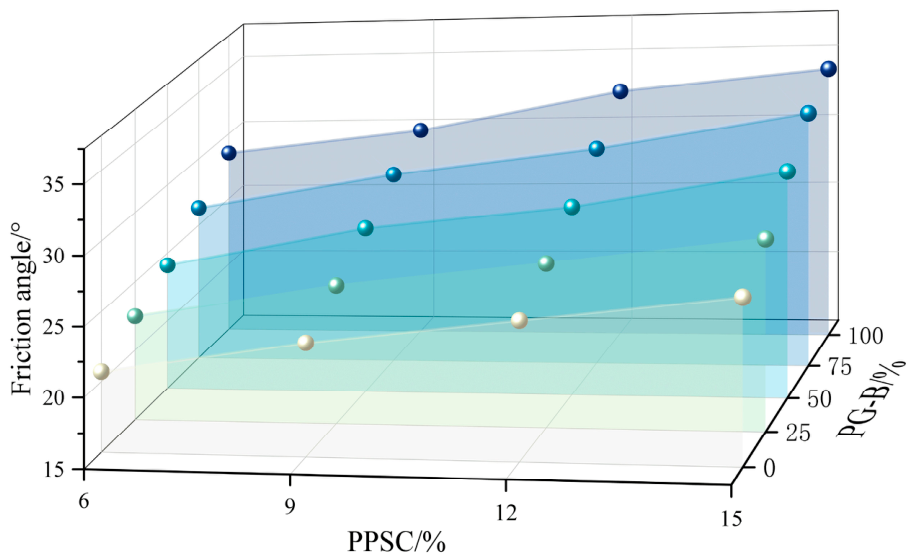
The cohesion and internal friction angle of GL are shown in Figure 10 and Figure 11. Both parameters increased with PPSC content and with the proportion of PG-B in the aggregate. GL-8 (15% PPSC; PG-B:AS = 75:25) had a cohesion of 62.4 kPa and an internal friction angle of 32.9°. The values for GL-1, GL-8, GL-11, and GL-12 exceeded 50 kPa and 18°, respectively. The trend surfaces in Figure 10 and Figure 11 are descriptive interpolations rather than statistically fitted models.
Figure 10.
Cohesion of stabilized soil.
Figure 11.
Internal friction angle of the stabilized soil.
Relative to PA, GL had substantially higher cohesion and a lower internal friction angle. Hydration products bonded the particles and shifted the shear-failure mechanism from particle sliding toward the fracture of a bonded mass. The comparison is made with the unstabilized PA mixture at the corresponding PG-B:AS ratio.
3.5. pH Value
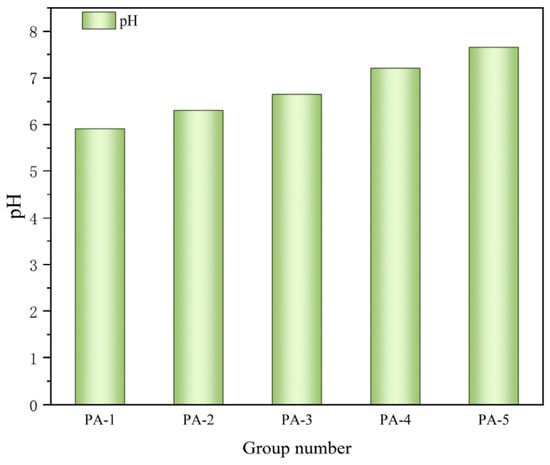
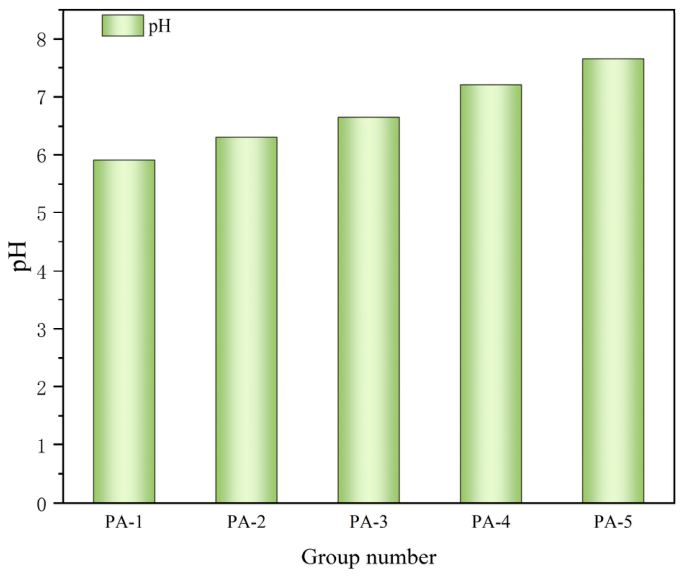
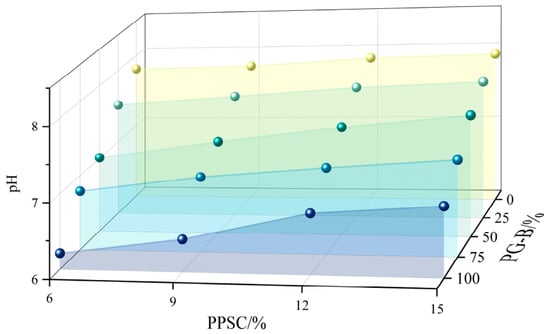
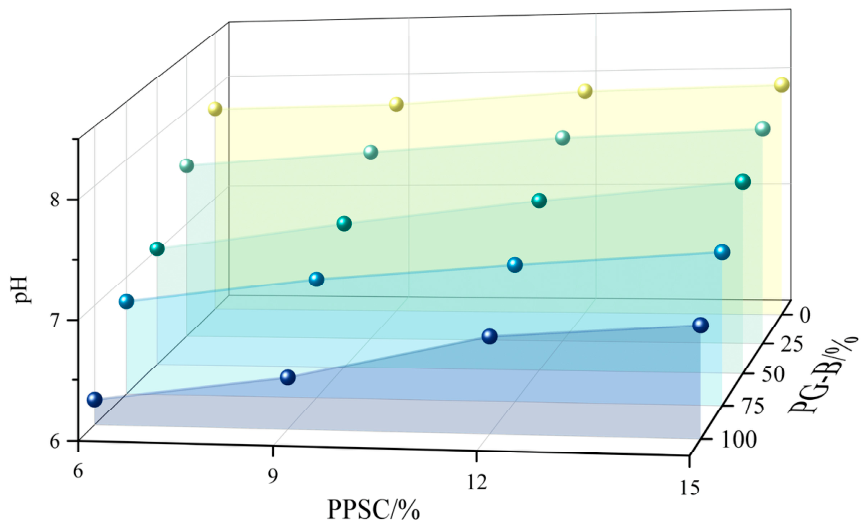
The pH of PA and GL leachates is shown in Figure 12 and Figure 13. PA-1 (100% PG-B) had a pH of 5.90, whereas PA-5 (100% AS) had a pH of 7.65. GL generally had a higher pH than the corresponding unstabilized mixture. For PG-B:AS ratios from 1:3 to 3:1 and PPSC contents from 6% to 15%, the leachate pH ranged from 6.79 to 7.79. The lowest value, 6.21, occurred for a 100:0 aggregate with 6% PPSC, and the highest, 7.95, occurred for a 0:100 aggregate with 15% PPSC. The pH results are compared with GB 3838-2002 [51] for surface water and GB/T 14848-2017 [52] for groundwater; the two standards are not used interchangeably.
Figure 12.
pH of the PA leachate.
Figure 13.
pH of the stabilized-soil leachate.
Phosphogypsum contains phosphoric acid (H3PO4), fluoride species, and residual sulfuric acid (H2SO4), which produce acidic leachates [28]. In contrast, calcite and dolomite in AS can dissolve and release CO32− and, through carbonate hydrolysis, OH−, increase the pH. The hydration of PPSC also produces Ca(OH)2 and raises the alkalinity. The resulting OH− increases the solubility of silicate and aluminate species and stabilizes C-S-H and AFt (ettringite) formation [51].
3.6. Soluble Phosphorus and Fluoride Content in Leachate
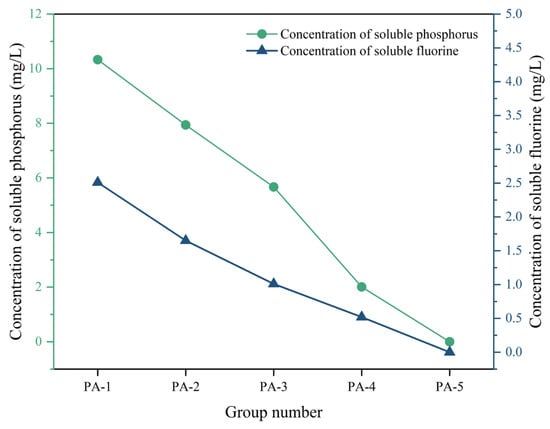
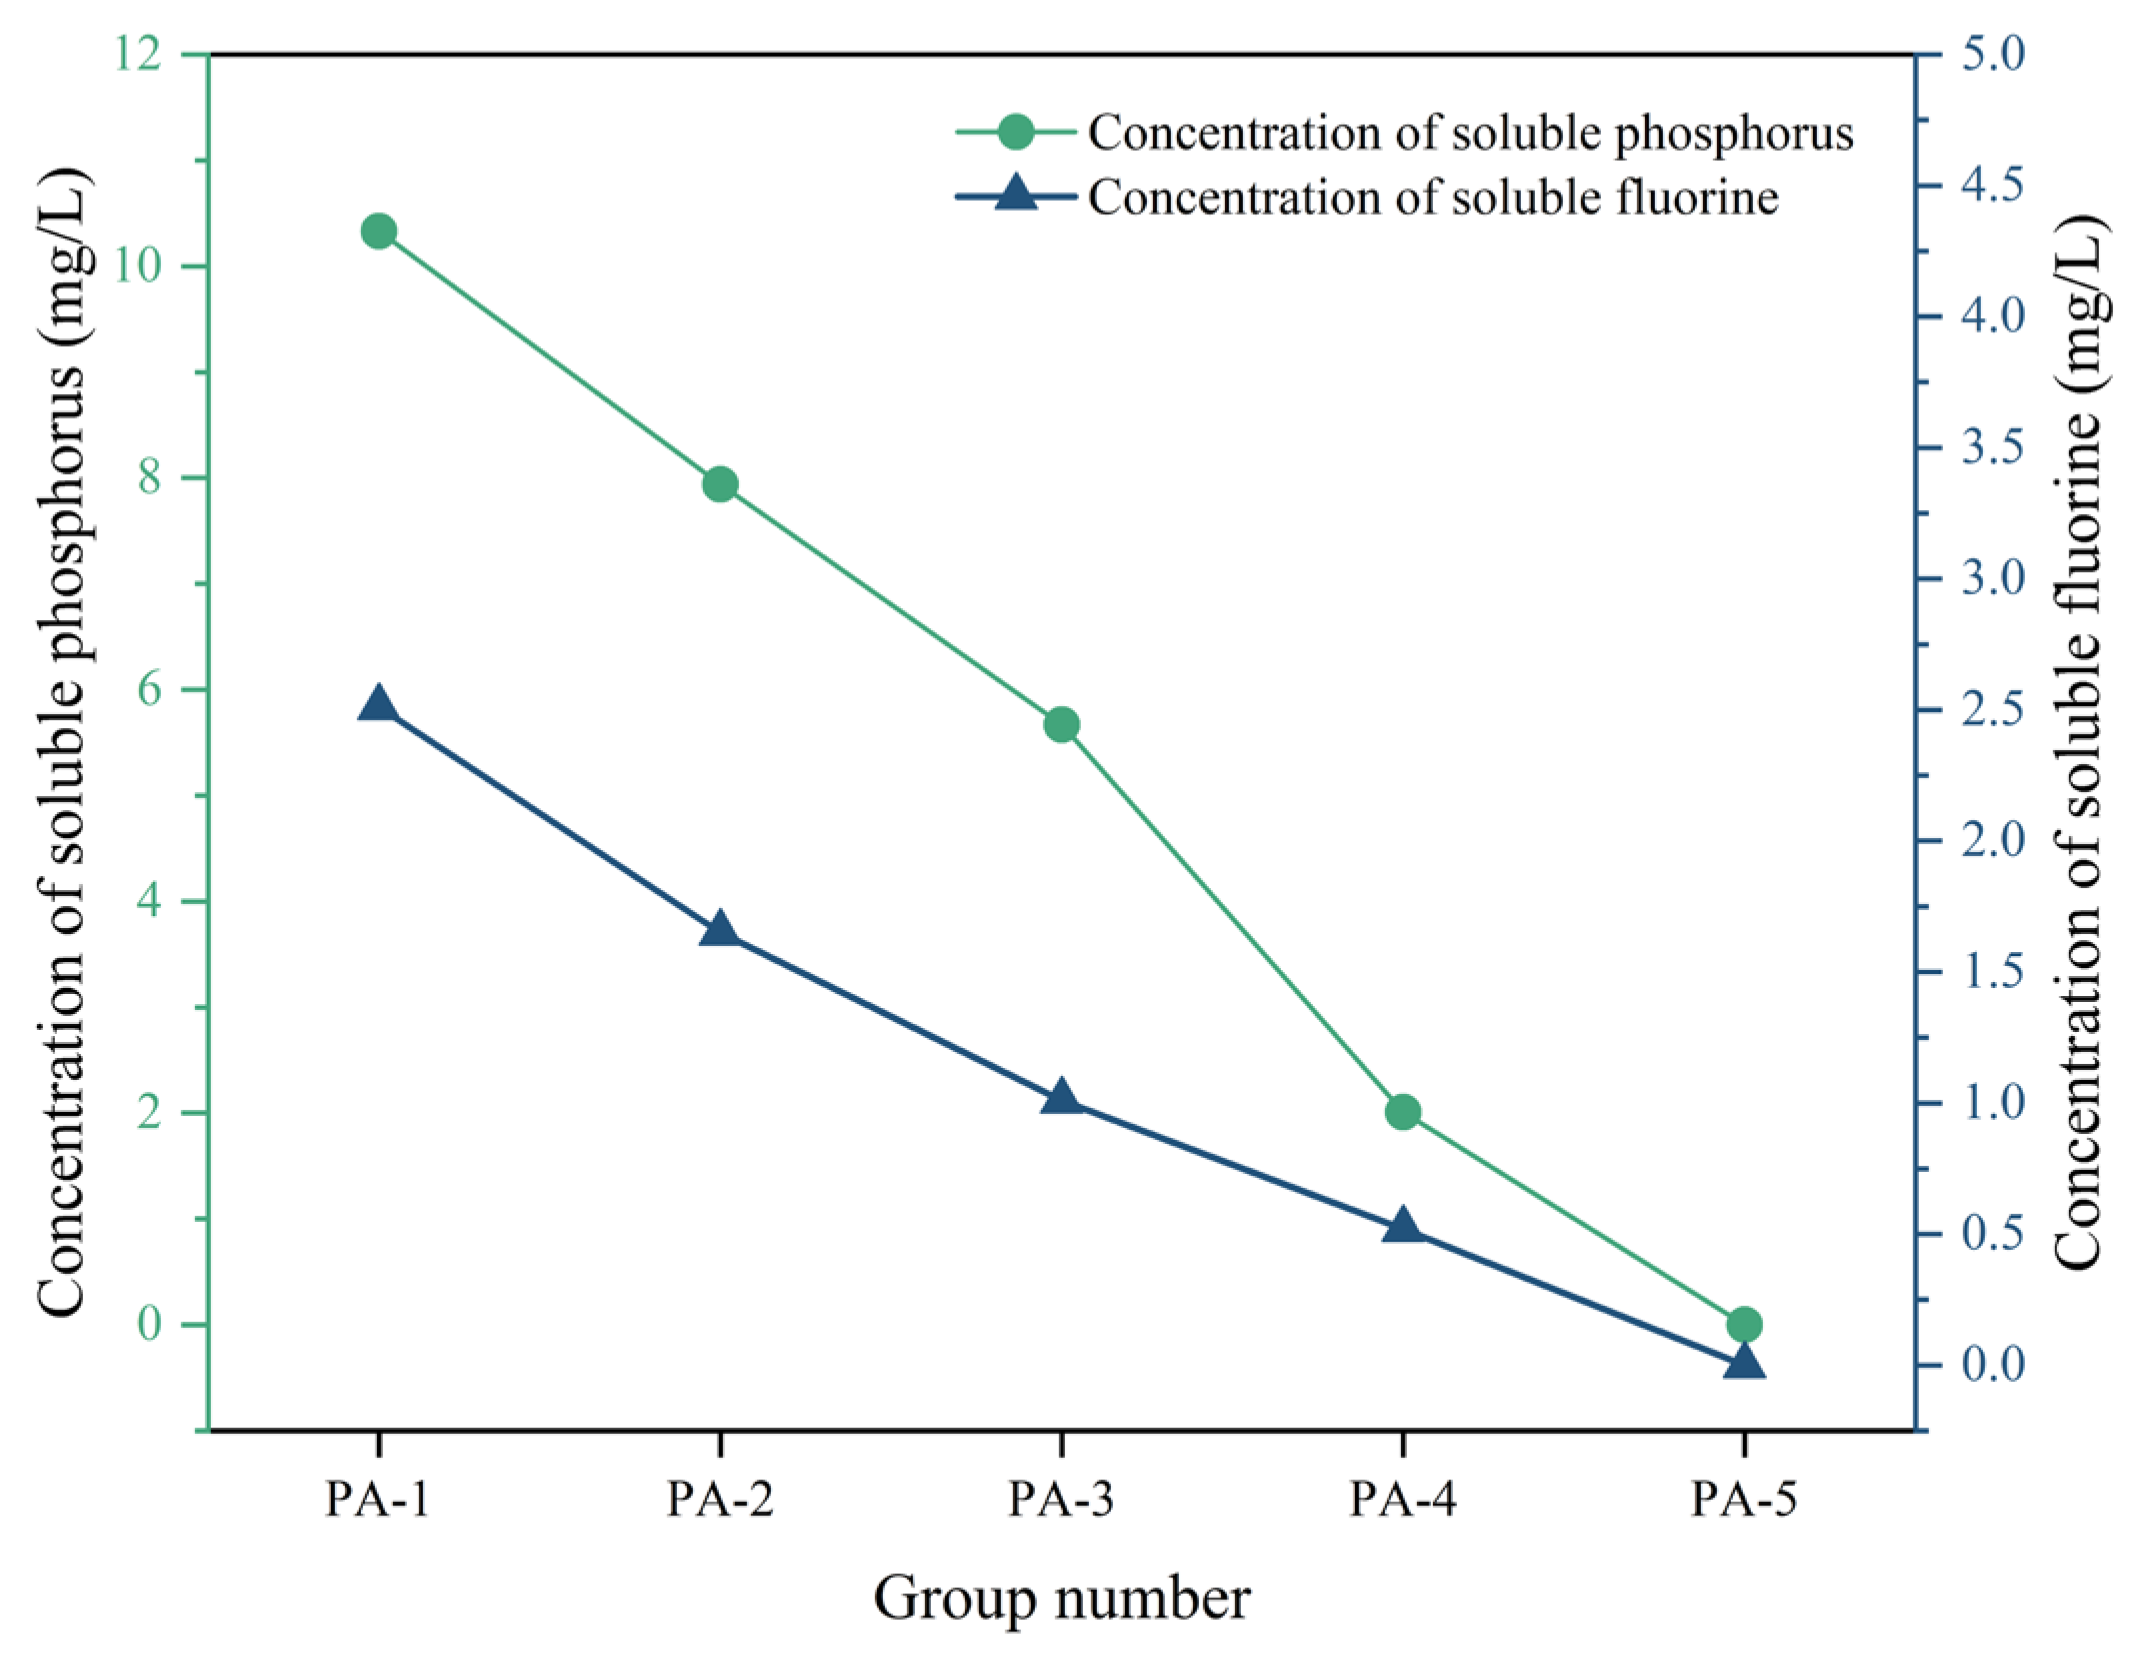
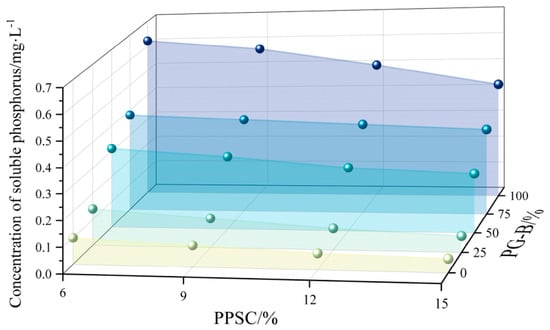
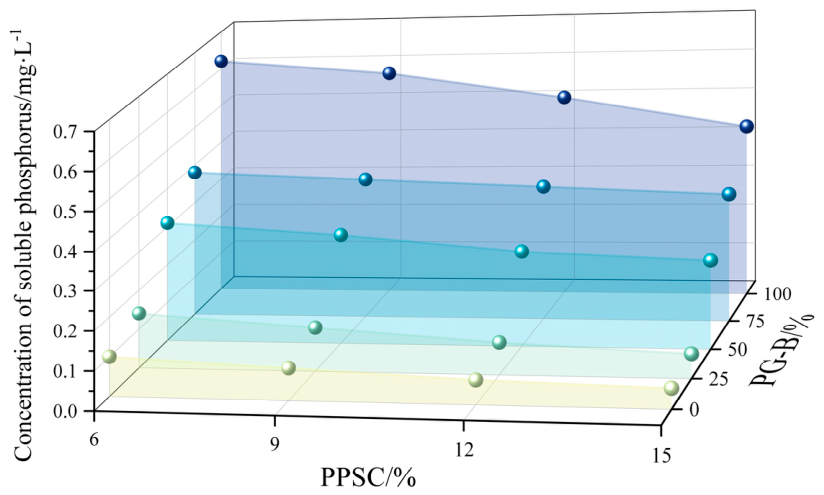
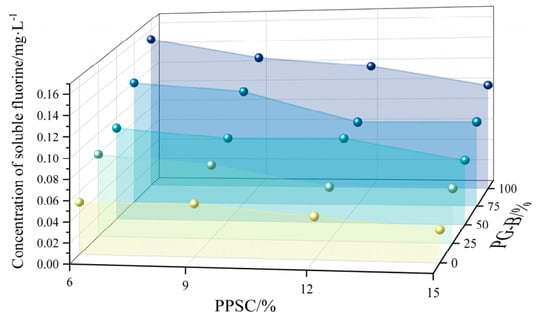
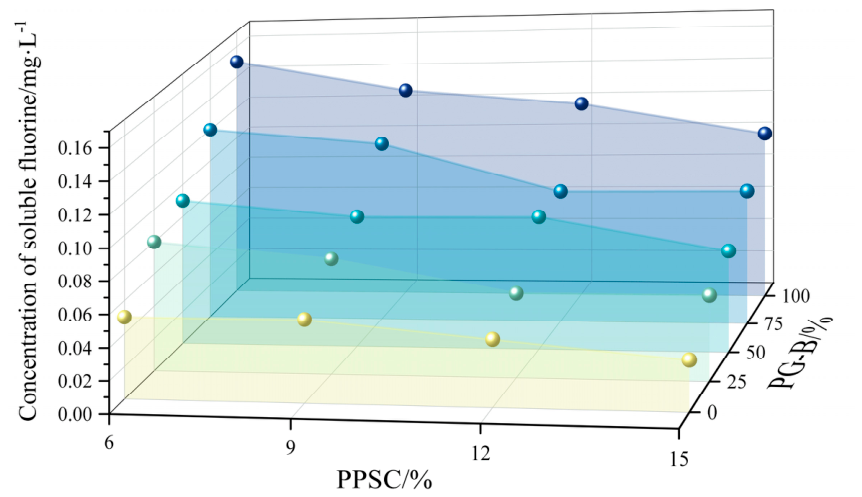
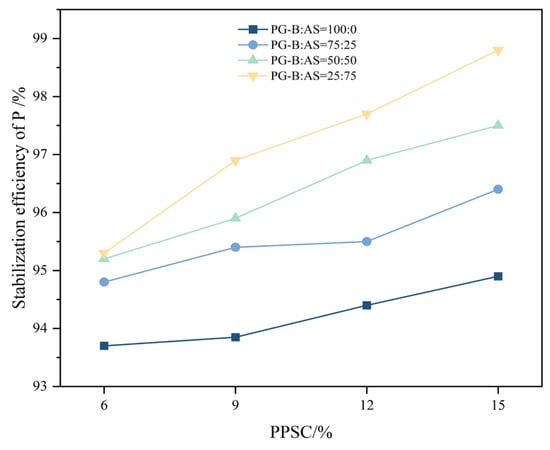
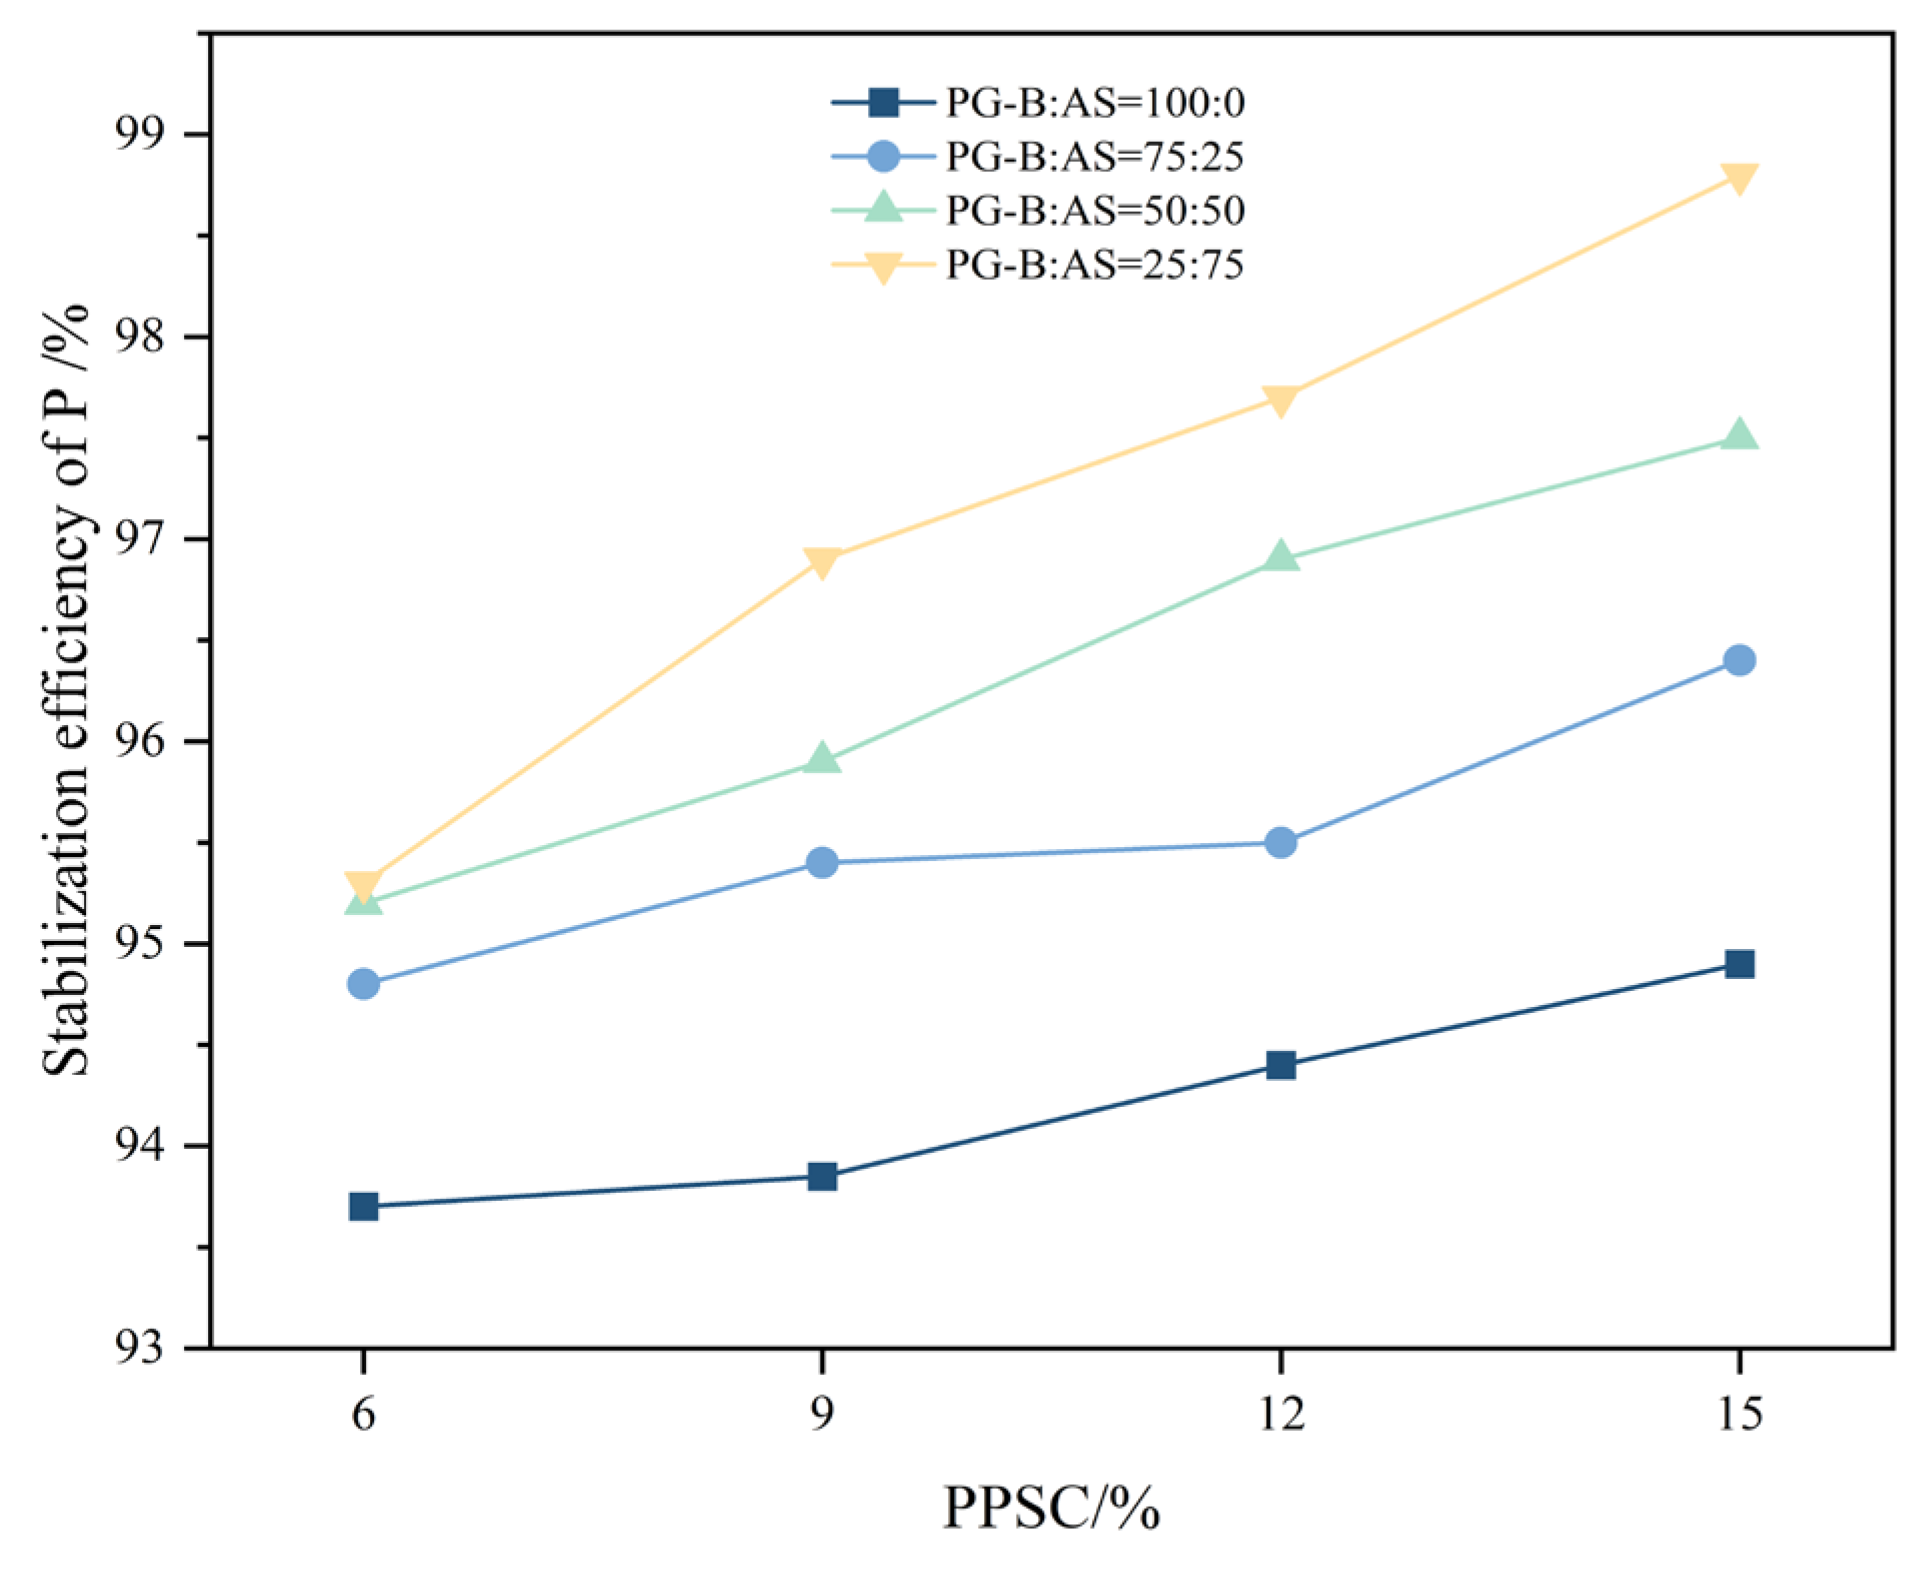
Employing the experimental methodologies previously detailed, the concentrations of phosphorus and fluoride in the leachates from both PA and GL were meticulously measured, as depicted in Figure 14, Figure 15 and Figure 16. Under consistent dosages of PPSC, it was observed that the concentrations of phosphorus and fluoride in the leachate of the stabilized soil increase concomitantly with the rise in phosphogypsum content. Similarly, with a constant phosphogypsum dosage, the concentrations of these elements in the leachate escalate as the quantity of PPSC diminishes. Notably, with the exception of groups GL-1 to GL-4, the phosphorus levels in the leachates of all other groups conform to the Class V standard limit (<0.4 mg/L) stipulated in the Surface Water Environmental Quality Standards (GB 3838-2002) [53], with the highest phosphorus concentration recorded in GL-5 at 0.38 mg/L. The fluoride concentrations across all groups meet the Class I standard limit (<1 mg/L), with the maximum value in GL-5 being a modest 0.12 mg/L. To quantitatively evaluate the phosphorus stabilization performance, the phosphorus stabilization efficiency was calculated based on the reduction in soluble phosphorus concentration in the leachate before and after stabilization, as follows: Stabilization Efficiency = (Phosphorus Content in Leachate Before Curing—Phosphorus Content in Leachate After Curing)/Phosphorus Content in Leachate Before Curing, where the P concentration before stabilization represents the soluble phosphorus concentration in the leachate of the untreated mixed soil, and the P concentration after stabilization represents the soluble phosphorus concentration in the leachate of the corresponding stabilized specimen after curing. A higher stabilization efficiency indicates a greater reduction in phosphorus release after stabilization. As shown in Figure 17, the phosphorus stabilization efficiency of the stabilized specimens was higher than 93.5%, with the maximum value reaching 96.9% for GL-16.
Figure 14.
Phosphorus and fluoride concentrations in the PA leachate.
Figure 15.
Phosphorus concentration in the stabilized−soil leachate.
Figure 16.
Fluoride concentration in the stabilized−soil leachate.
Figure 17.
Phosphorus stabilization efficiency.
PPSC reduced phosphorus and fluoride mobility through physical encapsulation and chemical precipitation [54]. C-S-H and ettringite can form a dense matrix around particles, while unreacted phosphogypsum occupies internal pores and limits exposure [55,56]. Fluoride can precipitate as CaF2, and phosphate can react with calcium to form hydroxyapatite (Ca10(PO4)6(OH)2) or other calcium phosphate phases, reducing leaching [57,58]. When the PG-B fraction becomes too large, soluble phosphorus can exceed the fixation capacity of the available binder. Studies on belite-calcium sulfoaluminate cement have also shown that soluble phosphorus in phosphogypsum can inhibit hydration and reduce compressive strength [59]. Within the tested range, at least 25% AS in the aggregate was required for environmental compliance. The strongest environmental performance was obtained at PG-B:AS = 25:75 with 12–15% PPSC, whereas the strongest mechanical performance occurred in PG-B-rich mixes. This trade-off defines the admissible design window and is analyzed explicitly in Section 4.
3.7. Mineral Phases and Microstructure
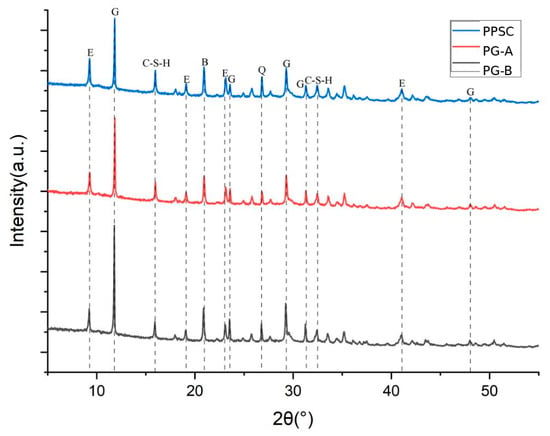
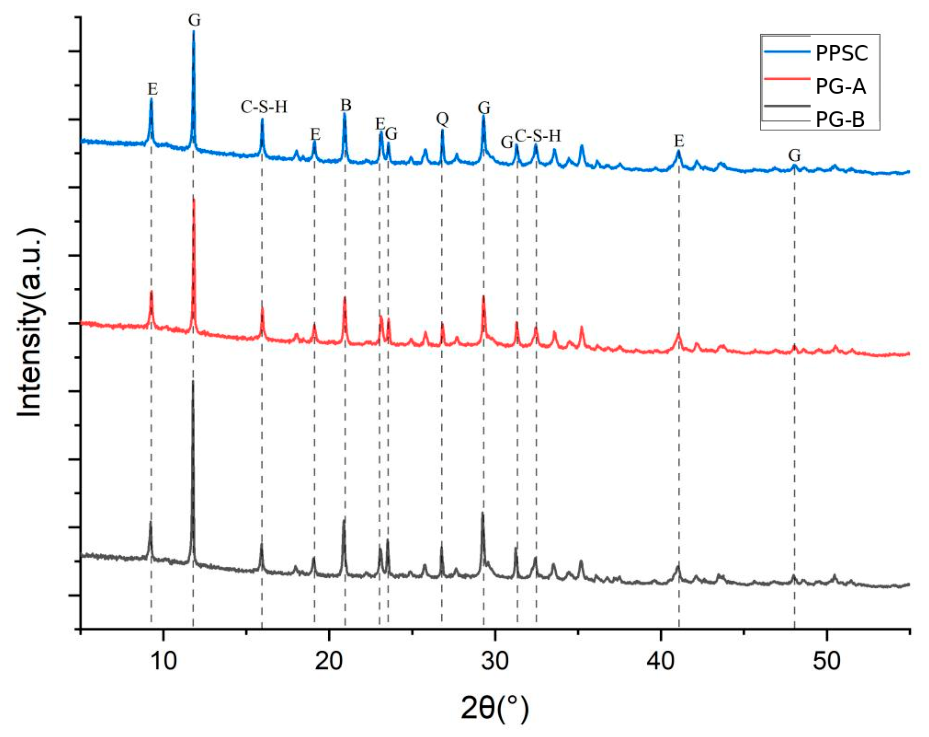
Figure 18 compares the 28-day X-ray diffraction (XRD) patterns of the PG-B, PG-A, and PPSC groups. The principal phase assignments are gypsum (G), ettringite (E), brushite (B), quartz (Q), and C-S-H. Relative to PG-B, the gypsum reflections are weaker in PG-A and are further reduced in PPSC, whereas the ettringite-related reflections become more pronounced. The changes indicate the progressively greater participation of gypsum in hydration and the increased formation of hydration products after material modification and combined processing.
Figure 18.
XRD patterns of PG-B, PG-A, and PPSC after 28 days. G, gypsum; E, ettringite; B, brushite; Q, quartz; C-S-H, calcium silicate hydrate.
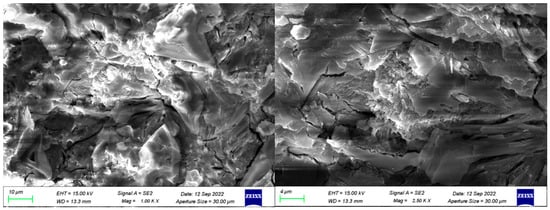
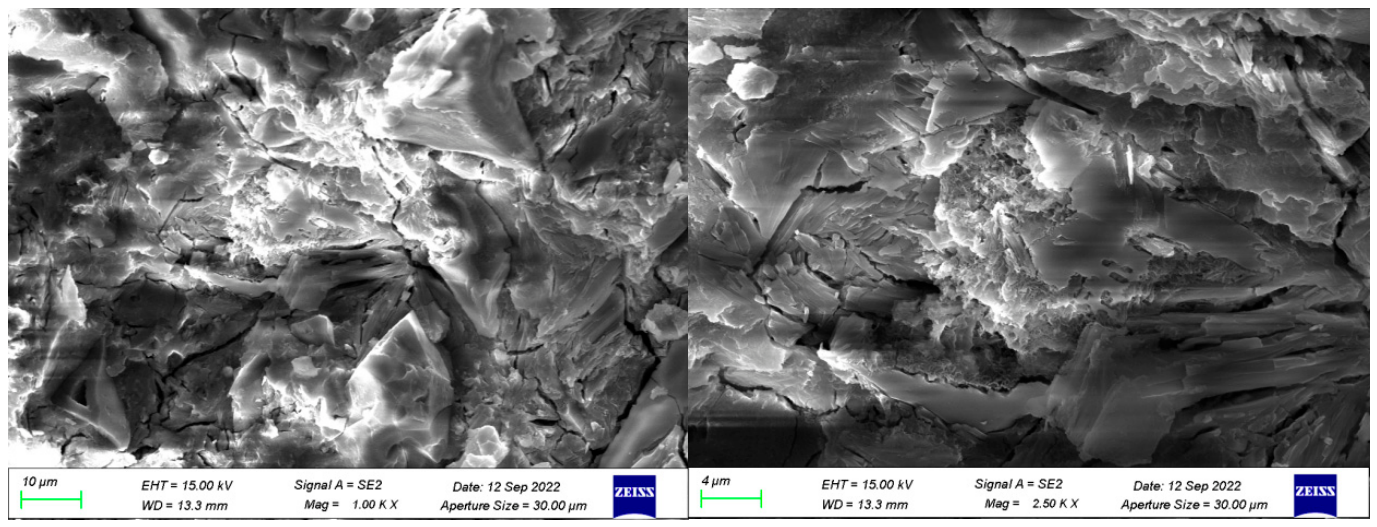
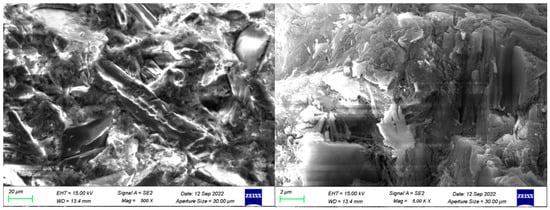
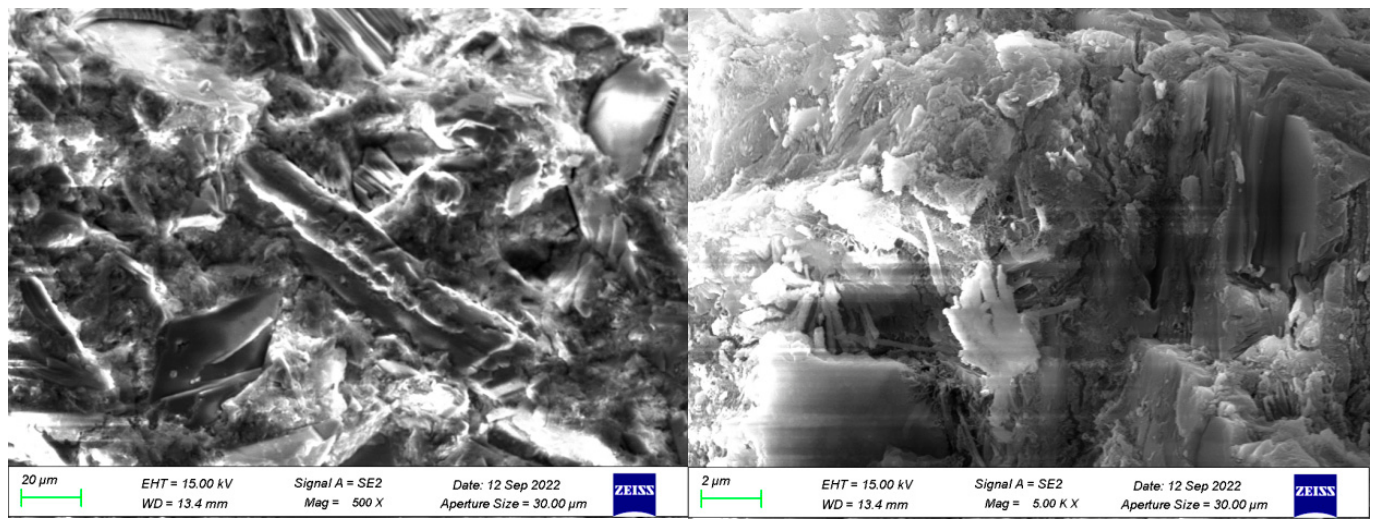
The SEM observations are consistent with the XRD results. Figure 19 shows the PG-A group after 28 days. Hydration products cover part of the phosphogypsum surface, but residual plate-like particles and distinct microcracks remain, indicating an incomplete reaction and a comparatively loose hardened structure. Figure 20 shows the PPSC group after 28 days. Compared with PG-A, the matrix is visibly denser, surface cracking is reduced, and more hydration products occupy the spaces between residual particles. Needle- or rod-like ettringite and gel-like to lamellar C-S-H can be observed in the interparticle regions, producing a more continuous bonded microstructure.
Figure 19.
SEM micrographs of the PG-A group after 28 days at 1000× and 2500× magnification.
Figure 20.
SEM micrographs of the PPSC group after 28 days at 500× and 5000× magnification.
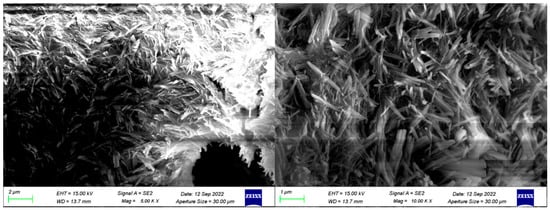
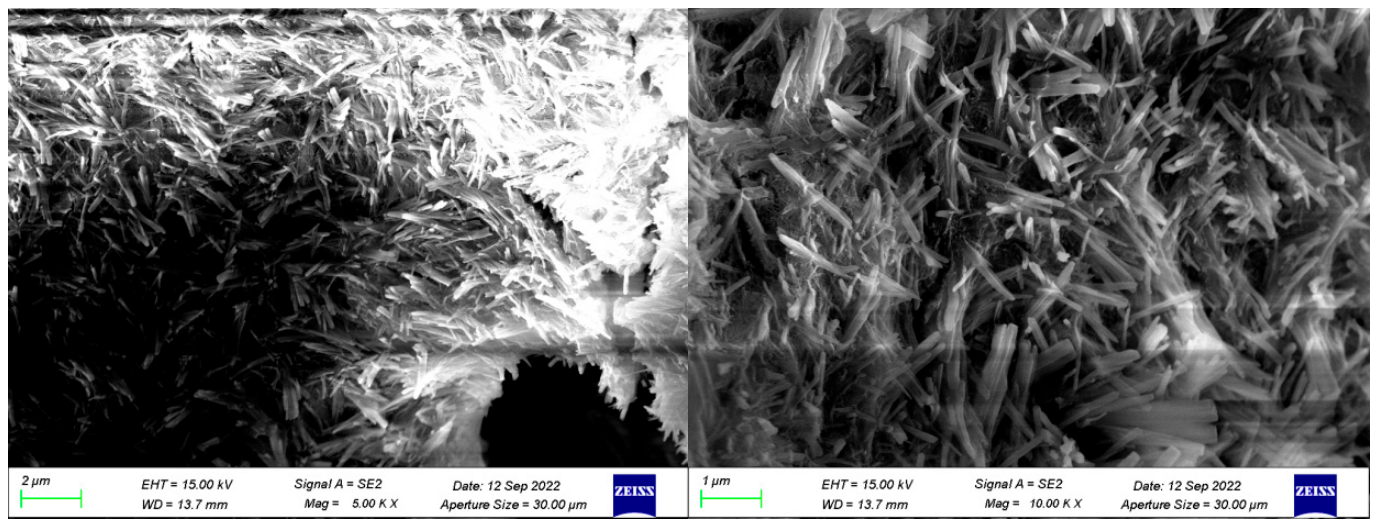
At a higher magnification (Figure 21), abundant needle- and rod-shaped ettringite crystals are attached to pore walls and occur together with hydration products around residual particles. In some pores, ettringite grows without complete gel encapsulation; such crystallization consumes reactive constituents but does not necessarily contribute efficiently to pore filling or particle bridging. Localized excessive ettringite growth may also promote expansion-induced microcracking and pore development, which can adversely affect strength.
Figure 21.
Higher-magnification SEM micrographs of the PPSC group after 28 days at 5000× and 10,000× magnification.
These binder-scale observations help explain the strength development of the stabilized PG-B-AS mixtures: a higher degree of reaction and a denser hydration-product network can improve particle bonding and pore filling. Previous research on supersulfated cement pastes has likewise linked strength development to hydration-product formation and pore-structure refinement [60]. The SEM images characterize the binder and modified-phosphogypsum systems rather than directly imaging the full GL aggregate skeleton; accordingly, they are used here as mechanistic evidence for the binder contribution rather than as direct images of aeolian-sand packing.
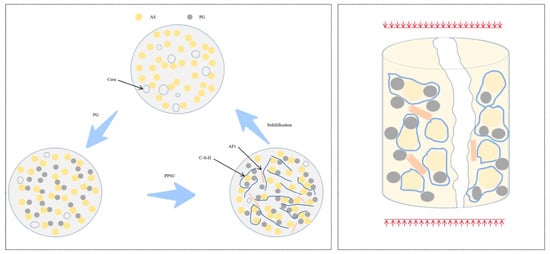
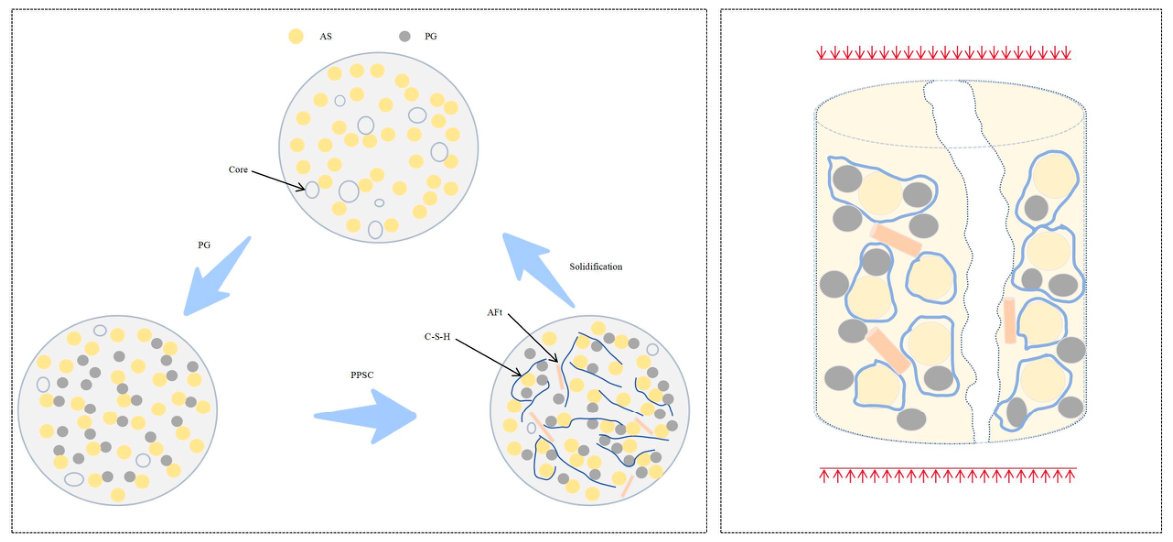
Overall, the XRD and SEM results support a hydration mechanism involving residual gypsum together with ettringite and C-S-H formation, with brushite and quartz also detected. The PPSC group exhibits a greater degree of reaction and a denser 28-day microstructure than the PG-A group, providing microstructural support for the hydration-product bonding mechanism used to interpret the macroscopic mechanical and leaching behavior. The proposed mechanism is illustrated in Figure 22.
Figure 22.
Stabilization and destruction mechanism diagram.
4. Discussion
This study presents an innovative exploration of the application of PPSC in the stabilization of a phosphogypsum–aeolian sand mixed system, thereby introducing a new sand improvement technology. The mechanical and environmental properties of the improved matrix were characterized by complete macroscopic tests, and the internal improvement mechanism was revealed by microscopic tests. The results confirmed that the use of PPSC to improve the phosphogypsum–aeolian sand mixed system has good feasibility, and has both environmental and economic advantages. Notably, the study reveals that aeolian sand exerts a significantly adverse effect on the mechanical properties of the composite material; thus, it should be incorporated in proportions that adhere to the design specifications, corroborating insights from previous research [61,62,63]. Increasing the content of PPSC can simultaneously improve the mechanical properties and environmental characteristics of the improved matrix, which is also supported by the existing literature [8,25]. The synergistic improvement of the phosphogypsum–aeolian sand system by PPSC is realized by multiple coupling effects: physical compaction, chemical activation and ion exchange, hydration gel and ettringite cementation, particle agglomeration, and pore filling. This mechanism is consistent with the conclusions reported in related literature [64,65]. In addition to the basic raw materials of phosphogypsum, aeolian sand, and slag powder used in this study, the addition of admixtures also has the potential to regulate the comprehensive performance of the improved matrix. The subsequent research on the effect of different admixtures on the performance of the PPSC-improved sandy matrix can be further carried out. This study also preliminarily explored the application potential of the phosphogypsum–aeolian sand composite system as a planting substrate for drought-tolerant plants in arid areas. The results show that, when the mass ratio of aeolian sand to phosphogypsum is 65:35~80:20, the root cohesion of the substrate is not less than 2.8 kPa. This conclusion can provide a reference for related research in the field of desert vegetation restoration.
This study has several limitations. Durability was not tested under freeze–thaw, wet–dry, water-immersion, or wind-erosion conditions, and long-term leaching and field-scale validation were not performed. In addition, the activity concentration of 226Ra and heavy-metal concentrations were not measured. Because phosphogypsum reuse can be regulated on the basis of 226Ra activity and trace-metal content, these analyses are required before large-volume open-environment deployment.
5. Conclusions
This study evaluated PPSC as a binder for phosphogypsum–aeolian sand stabilization and examined plasticity, compaction, UCS, shear strength, leaching behavior, and microstructure. The conclusions are as follows:
- The stabilized mixtures ranged from low-plasticity silt to low-plasticity clay (ML to CL) as the AS fraction increased, with plasticity indices from 6.62 to 12.31. The maximum dry density increased with the AS fraction and with the PPSC content under the tested conditions.
- Under both room-temperature sealed curing and 55 °C sealed curing, the unconfined compressive strength of the improved soil generally decreases as the aeolian sand content increases and rises as the PPSC content increases. Under room-temperature curing, when phosphogypsum and aeolian sand together account for more than 80% of the material and their mass ratio ranges from 1:3 to 3:1, the 14- and 28-day compressive strengths reach 0.602–1.950 MPa and 0.853–2.250 MPa, respectively. These values indicate that the treatment can substantially enhance the structural stability, resistance to particle migration, and erosion resistance of aeolian-sand-based soil. At 55 °C, the specimens develop considerably higher early strength than those cured at room temperature, while their later strength-growth and shrinkage trends remain similar, confirming the important role of temperature in the improvement process.
- The cohesion and internal friction angle of the stabilized soil enhance with the incorporation of PPSC and with the elevated phosphogypsum content within the aggregates, mirroring the trend observed in unconfined compressive strength. Among the various mix ratios, GL-8 demonstrates the most optimal overall performance, exhibiting a cohesion of 62.4 kPa and a friction angle of 32.9°. In comparison to non-stabilized phosphogypsum–aeolian sand mixtures, the cohesion of the stabilized mixture exhibits a remarkable increase of over sixfold, whereas the internal friction angle experiences a decline.
- The leachate pH ranged from 6.79 to 7.79 for PG-B:AS ratios from 1:3 to 3:1. When AS constituted at least 25% of the aggregate, soluble phosphorus met the Class V limit of GB 3838-2002 and fluoride met the Class I limit. The phosphorus stabilization efficiency exceeded 93.5% and reached 96.9% at GL-16.
- Within the tested range, the recommended environmental-first design is PG-B:AS = 25:75 with 12–15% PPSC. A PG-B-rich 75:25 mix at 15% PPSC is a higher-strength boundary option only when site-specific leachate testing confirms compliance. The stabilization mechanism is interpreted as physical filling, sulfate-alkali activation, hydration-product bonding, and reduced pollutant mobility. The absence of replicate statistics, durability tests, 226Ra activity data, heavy-metal measurements, and field validation remains a limitation and defines the next stage of work.
Author Contributions
Conceptualization, H.W. and R.L.; methodology, C.Z.; software, J.H.; validation, C.Z.; formal analysis, R.L.; investigation, Z.B.; resources, H.W.; data curation, R.L.; writing—original draft preparation, R.J.; writing—review and editing, J.H.; visualization, Z.B.; supervision, F.X.; project administration, F.X.; funding acquisition, R.J. All authors have read and agreed to the published version of the manuscript.
Funding
This work was supported by the research project of China Construction Institute of Advanced Technology, the Science and Technology Project of Hubei Transportation Department (2024-81-1-17).
Institutional Review Board Statement
Not applicable.
Informed Consent Statement
Not applicable.
Data Availability Statement
The data presented in this study are available upon request from the corresponding author.
Conflicts of Interest
The authors declare no conflicts of interest.
References
- Badapalli, P.K.; Kottala, R.B.; Pujari, P.S. Surface Micromorphology of Aeolian Sand Grains. In Aeolian Desertification: Disaster with Visual Impact in Semi-Arid Regions of Andhra Pradesh, South India; Springer Nature: Singapore, 2023; pp. 73–86. [Google Scholar]
- Khan, I.H. Soil studies for highway construction in arid zones. Eng. Geol. 1982, 19, 47–62. [Google Scholar] [CrossRef] [Scilit]
- Xia, H.; Zhang, J.; Cai, J.; Pan, H.; She, X. Study on the bearing capacity and engineering performance of aeolian sand. Adv. Mater. Sci. Eng. 2020, 2020, 3426280. [Google Scholar] [CrossRef] [Scilit]
- Xin, J.; Liu, L.; Xu, L.; Wang, J.; Yang, P.; Qu, H. A preliminary study of aeolian sand-cement-modified gasification slag-paste backfill: Fluidity, microstructure, and leaching risks. Sci. Total Environ. 2022, 830, 154766. [Google Scholar] [CrossRef] [Scilit]
- Wang, T.; Chen, G.; Zhao, H.; Xiao, H. Aeolian desertification status and its control in China. In Global Degradation of Soil and Water Resources: Regional Assessment and Strategies; Springer Nature: Singapore, 2022; pp. 199–220. [Google Scholar]
- Jakubovskis, R.; Jankutė, A.; Urbonavičius, J.; Gribniak, V. Analysis of mechanical performance and durability of self-healing biological concrete. Constr. Build. Mater. 2020, 260, 119822. [Google Scholar] [CrossRef] [Scilit]
- Song, Y.L.; Zhang, Y.W.; Yu, J. Study for aeolian sand characteristics by static experiment. Adv. Mater. Res. 2011, 250, 519–522. [Google Scholar] [CrossRef] [Scilit]
- Padmakumar, G.; Srinivas, K.; Uday, K.; Iyer, K.; Pathak, P.; Keshava, S.; Singh, D. Characterization of aeolian sands from Indian desert. Eng. Geol. 2012, 139–140, 38–49. [Google Scholar] [CrossRef] [Scilit]
- Lopez-Querol, S.; Arias-Trujillo, J.; Gm-Elipe, M.; Sánchez, A.M.; Cantero, B. Improvement of the bearing capacity of confined and unconfined cement-stabilized aeolian sand. Constr. Build. Mater. 2017, 153, 374–384. [Google Scholar] [CrossRef] [Scilit]
- Liu, W.; Huang, X.; Yin, W.; Liu, G. Static and dynamic characteristics of cement-treated and untreated aeolian sand from the Tengger desert hinterland: Laboratory tests and prediction models. Constr. Build. Mater. 2025, 458, 139733. [Google Scholar] [CrossRef] [Scilit]
- Zhang, X.D.; Liang, Y.; Yue, Y. Experimental Study of Fly Ash Activator in the Application of Aeolian Soil. Adv. Mater. Res. 2011, 255, 3361–3365. [Google Scholar] [CrossRef] [Scilit]
- He, Y.; Yuan, X. Experimental study on solidifying aeolian sand filled in the narrow space of distress culverts. Arab. J. Sci. Eng. 2020, 45, 3559–3568. [Google Scholar] [CrossRef] [Scilit]
- Jing, H.; Zhang, J.; Gao, M.; Liu, Q.; Wolowiec-Korecka, E. Base Performances of Cement-Stabilized Magnesium Slag-Aeolian Sand Mixture. Acta Montan. Slovaca 2021, 26, 427–443. [Google Scholar] [CrossRef] [Scilit]
- Zhang, X.; Pang, S.; Li, J.; Zhang, X.; Cai, G.; Tian, L. Interface mechanism and splitting characteristics of fiber-reinforced cement-solidified aeolian sand. Materials 2022, 15, 2860. [Google Scholar] [CrossRef] [Scilit]
- Peng, D.; Wang, Y.; Liu, X.; Tang, B.; Zhang, N. Preparation, characterization, and application of an eco-friendly sand-fixing material largely utilizing coal-based solid waste. J. Hazard. Mater. 2019, 373, 294–302. [Google Scholar] [CrossRef] [Scilit]
- Bai, L.; Yang, Z.; Wu, Y.; Anbarlouie, M.; Pan, Z. Stabilization of aeolian sand for pavement subbase applications using alkali-activated fly ash and slag. Minerals 2023, 13, 453. [Google Scholar] [CrossRef] [Scilit]
- Qu, J.; Li, G.; Ma, B.; Liu, J.; Zhang, J.; Liu, X.; Zhang, Y. Experimental study on the wind erosion resistance of Aeolian sand solidified by microbially induced calcite precipitation (MICP). Materials 2024, 17, 1270. [Google Scholar] [CrossRef] [Scilit]
- Li, G.; Liu, J.; Zhang, J.; Yang, Y.; Chen, S. Shear Strength Behaviors of Aeolian Sand Solidified by Microbially Induced Calcite Precipitation and Basalt Fiber Reinforcement. Materials 2023, 16, 5857. [Google Scholar] [CrossRef] [Scilit]
- Maimait, A.; Wang, Y.; Cheng, J.; Duan, Y.; Pan, Z. Research on the Configuration of Multi-Component Solid Waste Cementitious Materials and the Strength Characteristics of Consolidated Aeolian Sand. Buildings 2024, 14, 3059. [Google Scholar] [CrossRef] [Scilit]
- Zhou, B.; Zhu, H.; Xu, S.; Du, G.; Shi, S.; Liu, M.; Xing, F.; Ren, J. Effect of phosphogypsum on the properties of magnesium phosphate cement paste with low magnesium-to-phosphate ratio. Sci. Total Environ. 2021, 798, 149262. [Google Scholar] [CrossRef] [Scilit]
- Wu, Y.; Xu, F.; Wu, X.; Jiao, Y.; Sun, T.; Li, Z.; Yang, F.; Li, H.; Li, B.; Xu, J.; et al. Retardation mechanism of phosphogypsum in phosphogypsum-based excess-sulfate cement. Constr. Build. Mater. 2024, 428, 136293. [Google Scholar] [CrossRef] [Scilit]
- Diouri, C.; Echehbani, I.; Lahlou, K.; Omari, K.; Alaoui, A. Valorization of Moroccan phosphogypsum in road engineering: Parametric study. Mater. Today Proc. 2022, 58, 1054–1058. [Google Scholar] [CrossRef] [Scilit]
- Martin, D.F.; Dooris, P.M.; Sumpter, D. Environmental impacts of phosphogypsum vs. borrow pits in roadfill construction. J. Environ. Sci. Health Part A 2001, 36, 1975–1982. [Google Scholar] [CrossRef] [Scilit]
- DeWindt, M.A.; Weiksnar, K.D.; Laux, S.J.; Ferraro, C.C.; Townsend, T.G. A review of the suitability and performance of phosphogypsum as a material for road base and subbase construction. Resour. Conserv. Recycl. 2025, 215, 108120. [Google Scholar] [CrossRef] [Scilit]
- Huang, Y.; Lin, Z.S. Investigation on phosphogypsum–steel slag–granulated blast-furnace slag–limestone cement. Constr. Build. Mater. 2010, 24, 1296–1301. [Google Scholar] [CrossRef] [Scilit]
- Li, H.; Xu, F.; Li, B.; Sun, T.; Huang, X.; Zhu, J.; Peng, C.; Lin, J.; Chen, Z. Investigation on mechanical properties of excess-sulfate phosphogypsum slag cement: From experiments to molecular dynamics simulation. Constr. Build. Mater. 2022, 315, 125685. [Google Scholar] [CrossRef] [Scilit]
- Min, C.; Shi, Y.; Liu, Z. Properties of cemented phosphogypsum (PG) backfill in case of partially substitution of composite Portland cement by ground granulated blast furnace slag. Constr. Build. Mater. 2021, 305, 124786. [Google Scholar] [CrossRef] [Scilit]
- Chernysh, Y.; Yakhnenko, O.; Chubur, V.; Roubík, H. Phosphogypsum Recycling: A Review of Environmental Issues, Current Trends, and Prospects. Appl. Sci. 2021, 11, 1575. [Google Scholar] [CrossRef] [Scilit]
- Ouyang, G.; Sun, T.; Guo, Y.; Xu, D.; He, J.; Tang, L.; Long, S. Study on the composite compatibility and interfacial properties of excess sulfate phosphogypsum cementing system to OPC and CSA. Compos. Struct. 2024, 345, 118389. [Google Scholar] [CrossRef] [Scilit]
- Zhang, M.; Chen, B.; Zhu, W. Performance and hydration mechanisms of ultrafine iron ore tailings enhanced supersulfated cement with high phosphogypsum content. Cem. Concr. Compos. 2025, 157, 105891. [Google Scholar] [CrossRef] [Scilit]
- Liang, Y.; Guan, B.; Cao, T.; Liu, G.; Tang, P.; He, M.; Cheira, M.F.; Rashad, A.M. Study on the properties of an excess-sulphate phosphogypsum slag cement stabilized base-course mixture containing phosphogypsum-based artificial aggregate. Constr. Build. Mater. 2023, 409, 134095. [Google Scholar] [CrossRef] [Scilit]
- Wang, Z.; Shui, Z.; Sun, T.; Li, X.; Zhang, M. Recycling utilization of phosphogypsum in eco excess-sulphate cement: Synergistic effects of metakaolin and slag additives on hydration, strength and microstructure. J. Clean. Prod. 2022, 358, 131901. [Google Scholar] [CrossRef] [Scilit]
- Li, Z.; Zhong, J.; Li, S.-L.; Lang, Y.-C.; Zhu, X.; Chen, S. The effects of hydrological variations on chemical weathering: Evidences from temporal water chemistry, stable carbon and sulfur isotopes. Catena 2022, 214, 106301. [Google Scholar] [CrossRef] [Scilit]
- Li, Y.; Zhang, H.; Liu, G.; Hu, D.; Ma, X. Multi-scale study on mechanical property and strength prediction of aeolian sand concrete. Constr. Build. Mater. 2020, 247, 118538. [Google Scholar] [CrossRef] [Scilit]
- GB/T 50123-2019; Geotechnical Test Methods Standard. Ministry of Housing and Urban-Rural Development of the People’s Republic of China, China Planning Press: Beijing, China, 2019.
- GB/T 50145-2007; Standard for Engineering Classification of Soil. Ministry of Construction of the People’s Republic of China: Beijing, China, 2007.
- JTG E51-2009; Test Procedures for Highway Engineering Inorganic-Bound Stabilized Materials. Ministry of Transport of the People’s Republic of China: Beijing, China, 2009.
- JTG E40-2007; Highway Geotechnical Test Procedures. Ministry of Transport of the People’s Republic of China: Beijing, China, 2007.
- HJ 557-2010; Leaching Toxicity Leaching Method—Horizontal Shaking Method. Ministry of Transport of the People’s Republic of China: Beijing, China, 2010.
- Moreno-Maroto, J.M.; Alonso-Azcárate, J.; O’Kelly, B.C. Review and critical examination of fine-grained soil classification systems based on plasticity. Appl. Clay Sci. 2021, 200, 105955. [Google Scholar] [CrossRef] [Scilit]
- Liu, T.; Chen, M.; Zheng, S.; Yang, G.; Gu, H.; Lai, H.; Xu, H. Hydration analysis of phosphogypsum cementitious materials: Mechanisms of mechanical property changes under water resistance experiments. J. Mater. Sci. 2025, 60, 1853–1872. [Google Scholar] [CrossRef] [Scilit]
- Huang, X.; Zhao, X.; Bie, S.; Yang, C. Hardening performance of phosphogypsum-slag-based material. Procedia Environ. Sci. 2016, 31, 970–976. [Google Scholar] [CrossRef] [Scilit]
- Luz, C.A.D.; Hooton, R.D. Influence of curing temperature on the process of hydration of supersulfated cements at early age. Cem. Concr. Res. 2015, 77, 69–75. [Google Scholar] [CrossRef] [Scilit]
- Famy, C.; Taylor, H.F.W. Ettringite in hydration of Portland cement concrete and its occurrence in mature concretes. Mater. J. 2001, 98, 350–356. [Google Scholar] [CrossRef] [Scilit]
- Kumarappa, D.B.; Peethamparan, S.; Ngami, M. Autogenous shrinkage of alkali activated slag mortars: Basic mechanisms and mitigation methods. Cem. Concr. Res. 2018, 109, 1–9. [Google Scholar] [CrossRef] [Scilit]
- Xia, D.; Liu, H.; Liang, X. Effect of curing regimes on mechanical properties and microstructure of ultra-high performance concrete with full aeolian sand. Constr. Build. Mater. 2025, 472, 140812. [Google Scholar] [CrossRef] [Scilit]
- Cui, B.; Xu, J.; Shao, X.; Xu, D.; Zhang, B. Static Mechanical Properties of Aeolian Sand Improved with Silt Subjected to Varying Temperature and Pressure. Buildings 2024, 14, 3801. [Google Scholar] [CrossRef] [Scilit]
- Ruan, B.; Zheng, S.; Ding, J. Experimental Research on the Unconfined Compressive Strength of Cement Improved Aeolian Sand under High Temperature Curing Condition. J. Railw. Eng. Soc. 2021, 38, 1–6. [Google Scholar]
- Zhao, Y.; Long, S.; Bai, J.; Liu, M. Experimental Study on Mechanical Properties and Microstructure of Aeolian Sand Concrete after High Temperature. Bull. Chin. Ceram. Soc. 2024, 43, 3182–3191. [Google Scholar]
- JTG D30-2015; Highway Subgrade Design Code. Ministry of Transport of the People’s Republic of China: Beijing, China, 2015.
- GB 3838-2002; Surface Water Environmental Quality Standards. Ministry of Transport of the People’s Republic of China: Beijing, China, 2002.
- GB/T 14848-2017; National Technical Committee for Standardization of Land and Resources(SAC/TC 93). Groundwater Quality Standards. China Standards Press: Beijing, China, 2017.
- Silva, T.H.; Lara, L.F.; Silva, G.J.; Provis, J.L.; Bezerra, A.C. Alkali-activated materials produced using high-calcium, high-carbon biomass ash. Cem. Concr. Compos. 2022, 132, 104646. [Google Scholar] [CrossRef] [Scilit]
- Ban, J.; Lu, J.-X.; Ma, B.; Peng, L.; Du, H.; Fan, D.; Yao, J.; Xing, B.; Poon, C.S. Hydration and physicochemical immobilization mechanisms of pozzolanic-hazardous waste in supersulfated cement. Cem. Concr. Compos. 2025, 158, 105970. [Google Scholar] [CrossRef] [Scilit]
- Wu, Y.; Xu, F.; Wu, X.; Sun, T.; Yang, F.; Chen, B.; Zhu, Z.; Li, H.; Zhu, J. Replacing cement with GGBS to stabilize phosphogypsum-soil mixture in road materials: A comprehensive assessment of mechanical property, water stability and environmental performance. Constr. Build. Mater. 2025, 458, 139631. [Google Scholar] [CrossRef] [Scilit]
- Zhang, J.X.; Cui, K.; Yang, Y.; Chang, J. Investigation on the preparation of low carbon cement materials from industrial solid waste phosphogypsum: Clinker preparation, cement properties, and hydration mechanism. J. Clean. Prod. 2024, 452, 13. [Google Scholar] [CrossRef] [Scilit]
- Liu, S.; Chang, S.; Tu, Y.; Luo, S. Immobilisation mechanism for nuclear waste containing aluminium by supersulfated cement containing phosphogypsum. Cem. Concr. Compos. 2023, 139, 104991. [Google Scholar] [CrossRef] [Scilit]
- Peysson, S.; Péra, J.; Chabannet, M. Immobilization of heavy metals by calcium sulfoaluminate cement. Cem. Concr. Res. 2005, 35, 2261–2270. [Google Scholar] [CrossRef] [Scilit]
- Huang, Y.; Qian, J.; Kang, X.; Yu, J.; Fan, Y.; Dang, Y.; Zhang, W.; Wang, S. Belite-calcium sulfoaluminate cement prepared with phosphogypsum: Influence of P2O5 and F on the clinker formation and cement performances. Constr. Build. Mater. 2019, 203, 432–442. [Google Scholar] [CrossRef] [Scilit]
- Liu, S.; Wang, L. Investigation on strength and pore structure of supersulfated cement paste. Mater. Sci. 2018, 24, 319–326. [Google Scholar] [CrossRef] [Scilit]
- Luo, F.J.; He, L.; Pan, Z.; Duan, W.H.; Zhao, X.L.; Collins, F. Effect of very fine particles on workability and strength of concrete made with dune sand. Constr. Build. Mater. 2013, 47, 131–137. [Google Scholar] [CrossRef] [Scilit]
- Cui, Q.; Liu, G.; Zhang, Z.; Fang, Y.; Gu, X. Experimental investigation on the strength and microscopic properties of cement-stabilized aeolian sand. Buildings 2023, 13, 395. [Google Scholar] [CrossRef] [Scilit]
- Chen, Y.; Maimait, A.; Cheng, J.; Duan, Y.; Yin, D.; Dong, H.; Li, Y. Properties of saline soil stabilized with fly ash and modified aeolian sand. Case Stud. Constr. Mater. 2024, 21, e03503. [Google Scholar] [CrossRef] [Scilit]
- Sun, T.; Li, Z.; Wang, Z.; Liu, Y.; Tang, P.; Deng, Y. Optimization on hydration efficiency of an all-solid waste binder: Carbide slag activated excess-sulphate phosphogypsum slag cement. J. Build. Eng. 2024, 86, 108851. [Google Scholar] [CrossRef] [Scilit]
- Liao, Y.; Yao, J.; Deng, F.; Li, H.; Wang, K.; Tang, S. Hydration behavior and strength development of supersulfated cement prepared by calcined phosphogypsum and slaked lime. J. Build. Eng. 2023, 80, 108075. [Google Scholar] [CrossRef] [Scilit]

Disclaimer/Publisher’s Note: The statements, opinions and data contained in all publications are solely those of the individual author(s) and contributor(s) and not of MDPI and/or the editor(s). MDPI and/or the editor(s) disclaim responsibility for any injury to people or property resulting from any ideas, methods, instructions or products referred to in the content. |
© 2026 by the authors. Licensee MDPI, Basel, Switzerland. This article is an open access article distributed under the terms and conditions of the Creative Commons Attribution (CC BY) license.