


Abstract
Antioxidants are used in food products to limit oxidative deterioration, but their prevalence and formulation profiles may vary across product categories. This study characterized label-declared antioxidants and their co-occurrence with other functional formulation categories in 121 commercial products from three retail chains in Warsaw, Poland, comprising 53 meat, 36 cereal, and 32 fruit and vegetable products. Ingredient lists were analyzed using contingency-based association tests, functional-category richness analysis, pairwise co-occurrence analysis, and principal coordinates analysis based on Jaccard distances. Antioxidants were declared in 98.1% of meat, 88.9% of cereal, and 100% of fruit and vegetable products. However, marked category-specific differences were observed in accompanying formulation profiles. Meat products showed the highest functional-category richness and were particularly characterized by preservatives, stabilizers, and flavor enhancers. The most frequently recorded antioxidant substances were sodium ascorbate and sodium erythorbate in meat products, mixed tocopherols in cereal products, and ascorbic acid in fruit and vegetable products. Co-occurrence and multivariate analyses further demonstrated category-related formulation patterns. Overall, the findings indicate that despite the high prevalence of antioxidant declarations across the examined food categories, antioxidant-related profiles and patterns of co-occurrence with other formulation categories differed among product categories.
1. Introduction
Food additives are widely used in food processing to fulfill technological functions such as extending shelf life, maintaining product quality, improving sensory characteristics, and supporting food stability and safety. In the European Union, their use is regulated by Regulation (EC) No 1333/2008, which sets the conditions for authorizing and using food additives [1]. Regulation (EU) No 1169/2011 on the provision of food information to consumers requires food additives to be identified in the ingredient list by the name of their functional class followed by their specific name or E-number [2]. Consequently, ingredient lists are a valuable source of information for evaluating the declared presence and diversity of food additives in commercially available foods.
Among the functional classes of food additives, antioxidants are particularly important because oxidative processes can adversely affect food quality, including lipid stability, nutritional value, color, flavor, and shelf life [3]. Antioxidants are therefore incorporated into food formulations to prevent oxidative deterioration, and their effectiveness may, in some cases, be enhanced by compounds that act as antioxidant synergists [4]. Such substances may support antioxidant activity through complementary mechanisms, including the complexation of pro-oxidant metal ions. Importantly, antioxidants may co-occur with other functional classes of food additives, including preservatives, acidity regulators, stabilizers, emulsifiers, and flavor enhancers, depending on the characteristics and technological requirements of a given product [5].
Market-based analyses of ingredient lists have shown that the occurrence and combinations of food additives vary substantially across food categories. In a large survey of more than 126,000 products marketed in France, Chazelas et al. [6] identified marked differences in additive occurrence across food groups and distinct clusters of frequently co-occurring additives. Similarly, an analysis of 9856 products available in Brazilian supermarkets demonstrated category-specific patterns of additive use and showed that combinations of functional additive classes were common across packaged foods [7]. More recently, a label-based assessment of 2149 packaged foods marketed in Türkiye found that thickeners/stabilizers, acidity regulators, preservatives, and antioxidants were among the most prevalent functional classes, with clear differences across food categories [8].
Evidence from the Polish market also indicates that food formulations are associated with distinct additive profiles. A recent survey of 1278 products found differences in the number and types of declared additives by product formulation, with acidity regulators and antioxidants among the most frequently identified functional classes [9]. Studies of Polish processed meat products have also demonstrated the frequent occurrence of antioxidant-related compounds such as erythorbic acid and sodium erythorbate [10]. Thus, category-related differences in food additive use are already well documented, and the present study was not intended to establish their presence at the national market level. The three product categories were selected to provide contrasting formulation contexts, including preservation and curing in meat products, emulsification and nutrient enrichment in cereal products, and acidity control, oxidative protection, and textural modification in fruit and vegetable products.
Instead, the present study offers a focused exploratory comparison of antioxidant-related profiles and their relationships to broader formulation categories across three contrasting food groups. By integrating the distribution of individual antioxidant-related substances, functional-category richness, pairwise co-occurrence analysis, and exploratory multivariate visualization at the product level, the study examines how antioxidant-related declarations are embedded within broader formulation profiles in the surveyed products.
Therefore, the aim of the present study was to characterize and compare the label-declared presence of antioxidants and antioxidant-related substances, and to assess their co-occurrence with other functional formulation categories in selected meat, cereal, and fruit and vegetable products surveyed in Warsaw, Poland. Particular attention was given to differences in functional formulation diversity, category-specific antioxidant profiles, and co-occurrence patterns across formulation categories. In addition, overall similarities and differences in formulation profiles among product categories were examined using multivariate analysis.
2. Materials and Methods
2.1. Study Design and Product Sample
A cross-sectional, label-based exploratory survey was conducted from January to March 2025 at three retail outlets in Warsaw, Poland: one Biedronka discount store, one Lidl discount store, and one Carrefour hypermarket. The outlets were purposively selected to include two discount-store formats and one hypermarket. The survey was local and exploratory and was not designed to provide a representative estimate of the Polish food market.
Products were eligible for inclusion if they were commercially available, had factory-packaged food items on the shelves during the survey visits, fell into one of three predefined product categories, and had a clear and complete ingredient list in Polish. For the purposes of the present study, products were grouped by product type and label information into meat products, including processed or cured meats, sausages, canned meat, and ready-to-eat meat-based products; cereal products, including bread and bakery products, breakfast cereals, muesli and granola, cereal bars, and biscuits; and fruit and vegetable products, including fruit preserves and other processed fruit products, canned or processed vegetables, pickled products, and legume-based products. Fruit and vegetable beverages and sauces were not included.
Unpackaged or bulk products, as well as those with incomplete or illegible ingredient information, were excluded. Both manufacturer-branded and retailer private-label products were included. All eligible products in the predefined categories that were on the shelves during the survey visits were recorded; no subset was selected based on the declared presence or absence of antioxidants or other additives.
Products with the same producer, commercial name, and declared ingredient composition that appeared in more than one retail chain or that were available in multiple package sizes were treated as a single product identity and included only once. No a priori sample-size target or category quotas were established. The final category sizes therefore reflected the distinct eligible product identities recorded across the three surveyed outlets and comprised 53 meat products, 36 cereal products, and 32 fruit and vegetable products (n = 121).
Only information declared by the manufacturer on the product label was included in the analysis. The complete product-level dataset, including product names, manufacturers, antioxidant-related substances, and co-occurring formulation categories, is presented in Tables S1–S3.
2.2. Extraction and Classification of Label Information
Ingredient list information was extracted by one person and subsequently verified by a second member of the research team against the source label information. Because the data were not independently extracted by two reviewers, formal inter-rater reliability was not calculated. For each product, individual antioxidant-related substances and the presence of other functional formulation categories were recorded. The functional classes of food additives analyzed included antioxidants, acidity regulators, preservatives, gelling and thickening agents, flavor enhancers, stabilizers, emulsifiers, humectants, glazing agents, and raising agents. Flavorings were recorded as a separate ingredient category. In addition, enrichment substances, including added vitamins and minerals, were recorded as a separate formulation category because they were declared in the context of nutrient enrichment. This category was retained in the primary comparative analysis to characterize the products’ broader formulation profile but was not treated as a food-additive functional class for regulatory purposes.
Food additive terminology was standardized for the present analysis, and obvious typographical variants in the original dataset were harmonized without altering the underlying information. Classification was based on the functional category under which each substance had been recorded in the source dataset from the product label and was not reassigned retrospectively based on the known chemical properties of the substance. Consequently, multifunctional substances could be recorded under different functional categories across products. For example, when citric acid or ascorbic acid was recorded as an acidity regulator, it remained coded as an acidity regulator and was not additionally classified as an antioxidant.
For the binary antioxidant formulation category, a product was coded as positive if at least one substance was recorded in the antioxidant category of the source dataset. Individual substances within this category were retained as separate variables to compare antioxidant profiles across food categories. These included ascorbic acid, sodium ascorbate, sodium erythorbate, mixed tocopherols, rosemary extracts, citric acid, sulfur dioxide, sodium metabisulfite, and erythorbic acid. Calcium disodium EDTA was retained separately as an antioxidant synergist rather than treated as a primary antioxidant.
The analysis was based exclusively on declared ingredient information. No analytical determination of additive concentrations or antioxidant activity was conducted. Accordingly, the results describe the declared presence of the recorded substances and formulation categories rather than their quantitative content in the products.
2.3. Data Coding and Derived Variables
For statistical analysis, each functional formulation category was coded as a binary variable, with 1 indicating that the category was recorded as present in a given product and 0 indicating that it was not recorded as present in the source dataset. The complete binary coding matrix is presented in Table S4.
For each product, functional-category richness was calculated as the total number of distinct functional formulation categories recorded. This variable served as an indicator of functional formulation diversity and was compared across the three food categories. Co-occurrence patterns were also evaluated to determine which functional categories tended to appear together within individual products.
2.4. Statistical Analysis
Categorical data were expressed as counts and percentages. Associations between food product category and the recorded presence of individual functional formulation categories were assessed using contingency tables and Pearson’s chi-square test. The adequacy of the chi-square approximation was evaluated based on expected cell frequencies. When the assumptions of the chi-square test were not satisfied, pairwise comparisons between product categories were performed using two-sided Fisher’s exact tests. For the three pairwise comparisons, a Bonferroni-adjusted significance level of p < 0.0167 was applied. Cramér’s V was calculated as a measure of the strength of association between product category and the occurrence of each formulation category.
The distributions of the major substances recorded as antioxidants, including sodium ascorbate, sodium erythorbate, ascorbic acid, and mixed tocopherols, were compared across product categories using the Fisher–Freeman–Halton exact test for 2 × 3 contingency tables because several tables contained zero observed frequencies. Cramér’s V, computed from the corresponding contingency tables, was retained as a descriptive measure of association strength.
Functional-category richness was defined as the total number of distinct functional formulation categories recorded for each product. Differences in functional-category richness among meat, cereal, and fruit and vegetable products were evaluated using the Kruskal–Wallis analysis of variance by ranks. When the overall test was significant, pairwise post-hoc multiple comparisons of mean ranks were conducted using z-tests as implemented in STATISTICA 13.3 (TIBCO Software Inc., Palo Alto, CA, USA). To account for the three pairwise comparisons, the resulting p-values were adjusted using the Bonferroni procedure. Data were summarized using medians and interquartile ranges. Epsilon-squared (ε2) was calculated as a measure of effect size for the Kruskal–Wallis test.
Because the primary functional-category richness metric included flavorings and enrichment substances as broader formulation categories, a sensitivity analysis was also performed after excluding these two categories. The sensitivity metric therefore comprised the 10 food-additive functional classes recorded in the dataset. Differences among product categories were evaluated using the same Kruskal–Wallis and Bonferroni-adjusted post-hoc procedures.
Within each food category, exploratory pairwise co-occurrence analysis was performed for all functional formulation categories showing sufficient variation to form informative 2 × 2 contingency tables. Associations were assessed using two-sided Fisher’s exact tests, and the strength of co-occurrence was expressed using the phi coefficient (φ). To account for multiple comparisons, p-values were adjusted separately within each food category using the Benjamini–Hochberg false discovery rate (FDR) procedure. Associations with an FDR-adjusted q-value < 0.05 were considered statistically significant.
To more directly examine antioxidant-related formulation patterns, an additional antioxidant-specific co-occurrence analysis was conducted within each food category. Individual major substances recorded as antioxidants that exhibited sufficient within-category variation were evaluated against other functional formulation categories that also varied within that product group. Associations were assessed using two-sided Fisher’s exact tests and reported using the phi coefficient (φ). To account for multiple testing, p-values were adjusted separately within each food category using the Benjamini–Hochberg false discovery rate procedure, with q < 0.05 considered statistically significant.
To explore overall similarities and differences in formulation profiles, principal coordinates analysis (PCoA) was performed using the complete 121 × 12 binary presence/absence matrix of functional formulation categories provided in Table S4. Pairwise Jaccard distances were calculated directly from the binary matrix without prior standardization or transformation, and PCoA was performed on the resulting distance matrix. Product category was used only for graphical grouping and was not included in the calculation of Jaccard distances. The first two principal coordinates were used for the two-dimensional visualization. PCoA was treated as an exploratory multivariate visualization and was not interpreted as an independent inferential test of differences among product categories.
Data organization, preliminary calculations, and preparation of selected graphical outputs were performed using Microsoft Excel for Microsoft 365 (Microsoft Corporation, Redmond, WA, USA). Statistical analyses were conducted using STATISTICA version 13.3 (TIBCO Software Inc., Palo Alto, CA, USA). Heatmap visualizations and principal coordinates analysis were performed using the ChiPlot online platform [11]. Unless otherwise specified, statistical significance was established at p < 0.05.
3. Results
3.1. Distribution of Functional Formulation Categories
The prevalence of functional formulation categories varied markedly across the three product categories (Table 1). The strongest category-related associations were observed for preservatives (Cramér’s V = 0.887), stabilizers (V = 0.756), emulsifiers (V = 0.631), enrichment substances (V = 0.556), and flavor enhancers (V = 0.504).
Table 1.
Prevalence of functional formulation categories according to product category.
Preservatives were declared in 86.8% of meat products but were not recorded in cereal or fruit and vegetable products. Stabilizers also showed a strong association with meat products, occurring in 77.4% of this group compared with 9.4% of fruit and vegetable products and none of the cereal products. Flavor enhancers were likewise restricted to meat products, where they were declared in 37.7% of products. In contrast, emulsifiers were particularly characteristic of cereal products, occurring in 58.3% of this category compared with 5.7% of meat products and none of the fruit and vegetable products. Enrichment substances were likewise recorded exclusively in cereal products, with a prevalence of 38.9%.
More moderate category-related differences were observed for acidity regulators and gelling/thickening agents. Acidity regulators were most frequent in fruit and vegetable products (62.5%), followed by cereal (50.0%) and meat products (26.4%). Gelling/thickening agents were declared in 37.7% of meat products, 34.4% of fruit and vegetable products, and 11.1% of cereal products. Raising agents (27.8%) and humectants (16.7%) were recorded only in cereal products. Flavorings occurred predominantly in meat products (26.4%), whereas glazing agents were rare and showed no significant pairwise differences across categories.
Antioxidants were highly prevalent across all three groups, appearing in 98.1% of meat products, 88.9% of cereal products, and 100% of fruit and vegetable products. Pairwise Fisher’s exact tests showed no significant differences in overall antioxidant prevalence across product categories. Thus, despite the high prevalence of antioxidants across all three product categories, marked differences were observed in the profiles of other declared formulation categories.
3.2. Functional-Category Richness
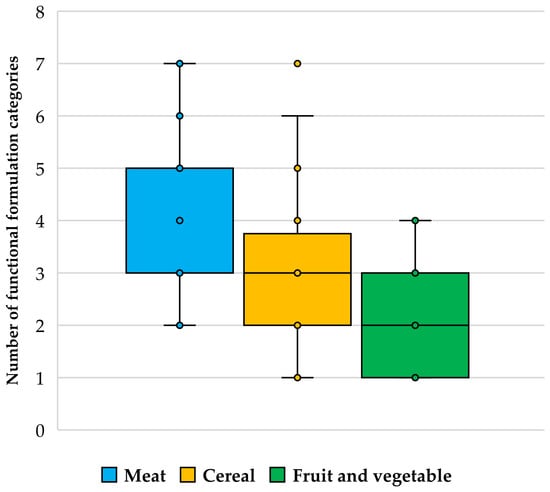
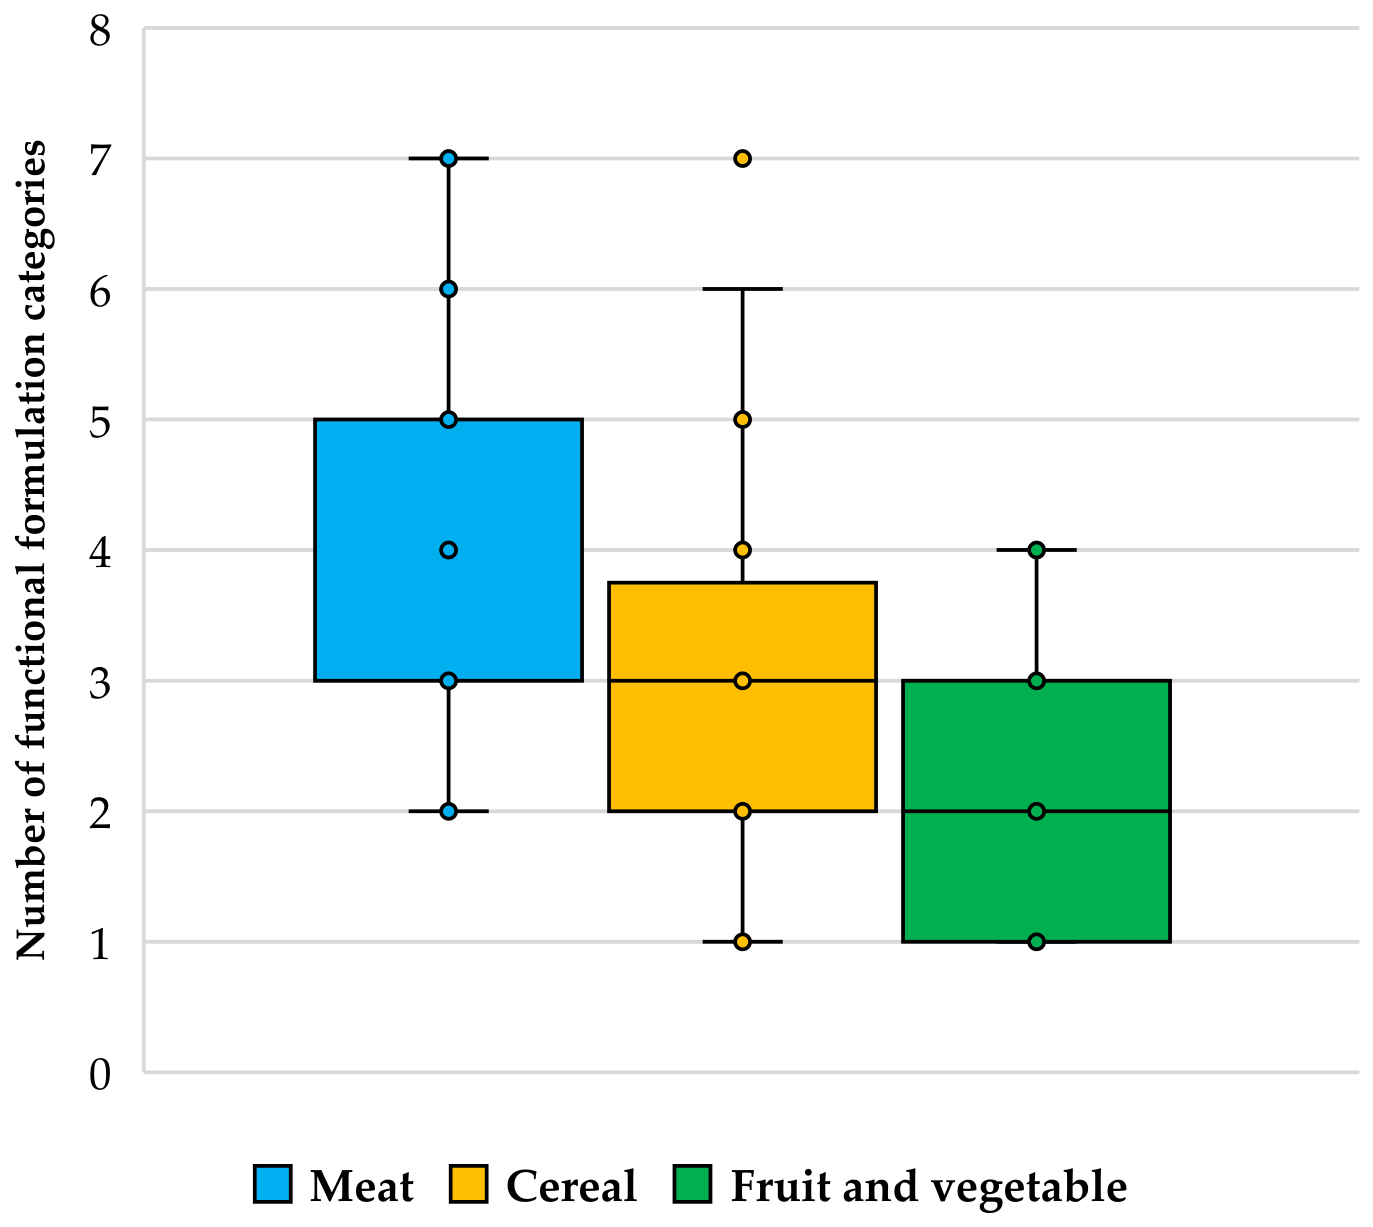
Functional-category richness differed significantly across product categories (Kruskal–Wallis H(2, N = 121) = 31.71, p < 0.001, ε2 = 0.252) (Figure 1). Meat products had the highest mean rank (78.72), followed by cereal products (56.89) and fruit and vegetable products (36.28). Bonferroni-adjusted post-hoc multiple comparisons of mean ranks showed significant differences between meat and cereal products (p = 0.0119), meat and fruit and vegetable products (p < 0.001), and cereal and fruit and vegetable products (p = 0.0468).
Figure 1.
Functional-category richness across product categories. Boxes represent the interquartile range (25th–75th percentiles); horizontal lines indicate medians; whiskers extend to the most extreme non-outlying observations; and outliers are shown as individual points.
The median (Q1–Q3) functional-category richness was 3 (3–5) for meat products, 3 (2–3.75) for cereal products, and 2 (1–3) for fruit and vegetable products. The corresponding observed ranges were 2–7, 1–7, and 1–4, respectively. A sensitivity analysis excluding flavorings and enrichment substances yielded a similar overall pattern. Functional-category richness based solely on the 10 food-additive functional classes differed significantly across product categories (Kruskal–Wallis H(2, N = 121) = 32.51, p < 0.001, ε2 = 0.259). The median (Q1–Q3) values were 3 (3–5) for meat products, 2 (2–3) for cereal products, and 2 (1–3) for fruit and vegetable products. Bonferroni-adjusted post-hoc comparisons showed significant differences between meat and cereal products (p < 0.001) and between meat and fruit and vegetable products (p < 0.001), whereas cereal and fruit and vegetable products did not differ significantly (p = 0.433). These results indicate that the greater functional-category richness observed in meat products was not driven by the inclusion of flavorings or enrichment substances.
3.3. Category-Specific Antioxidant Profiles
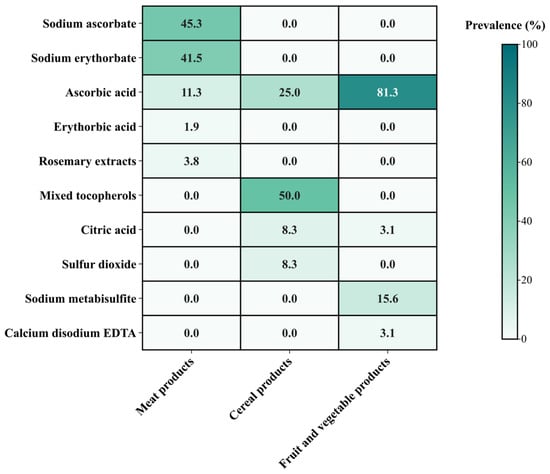
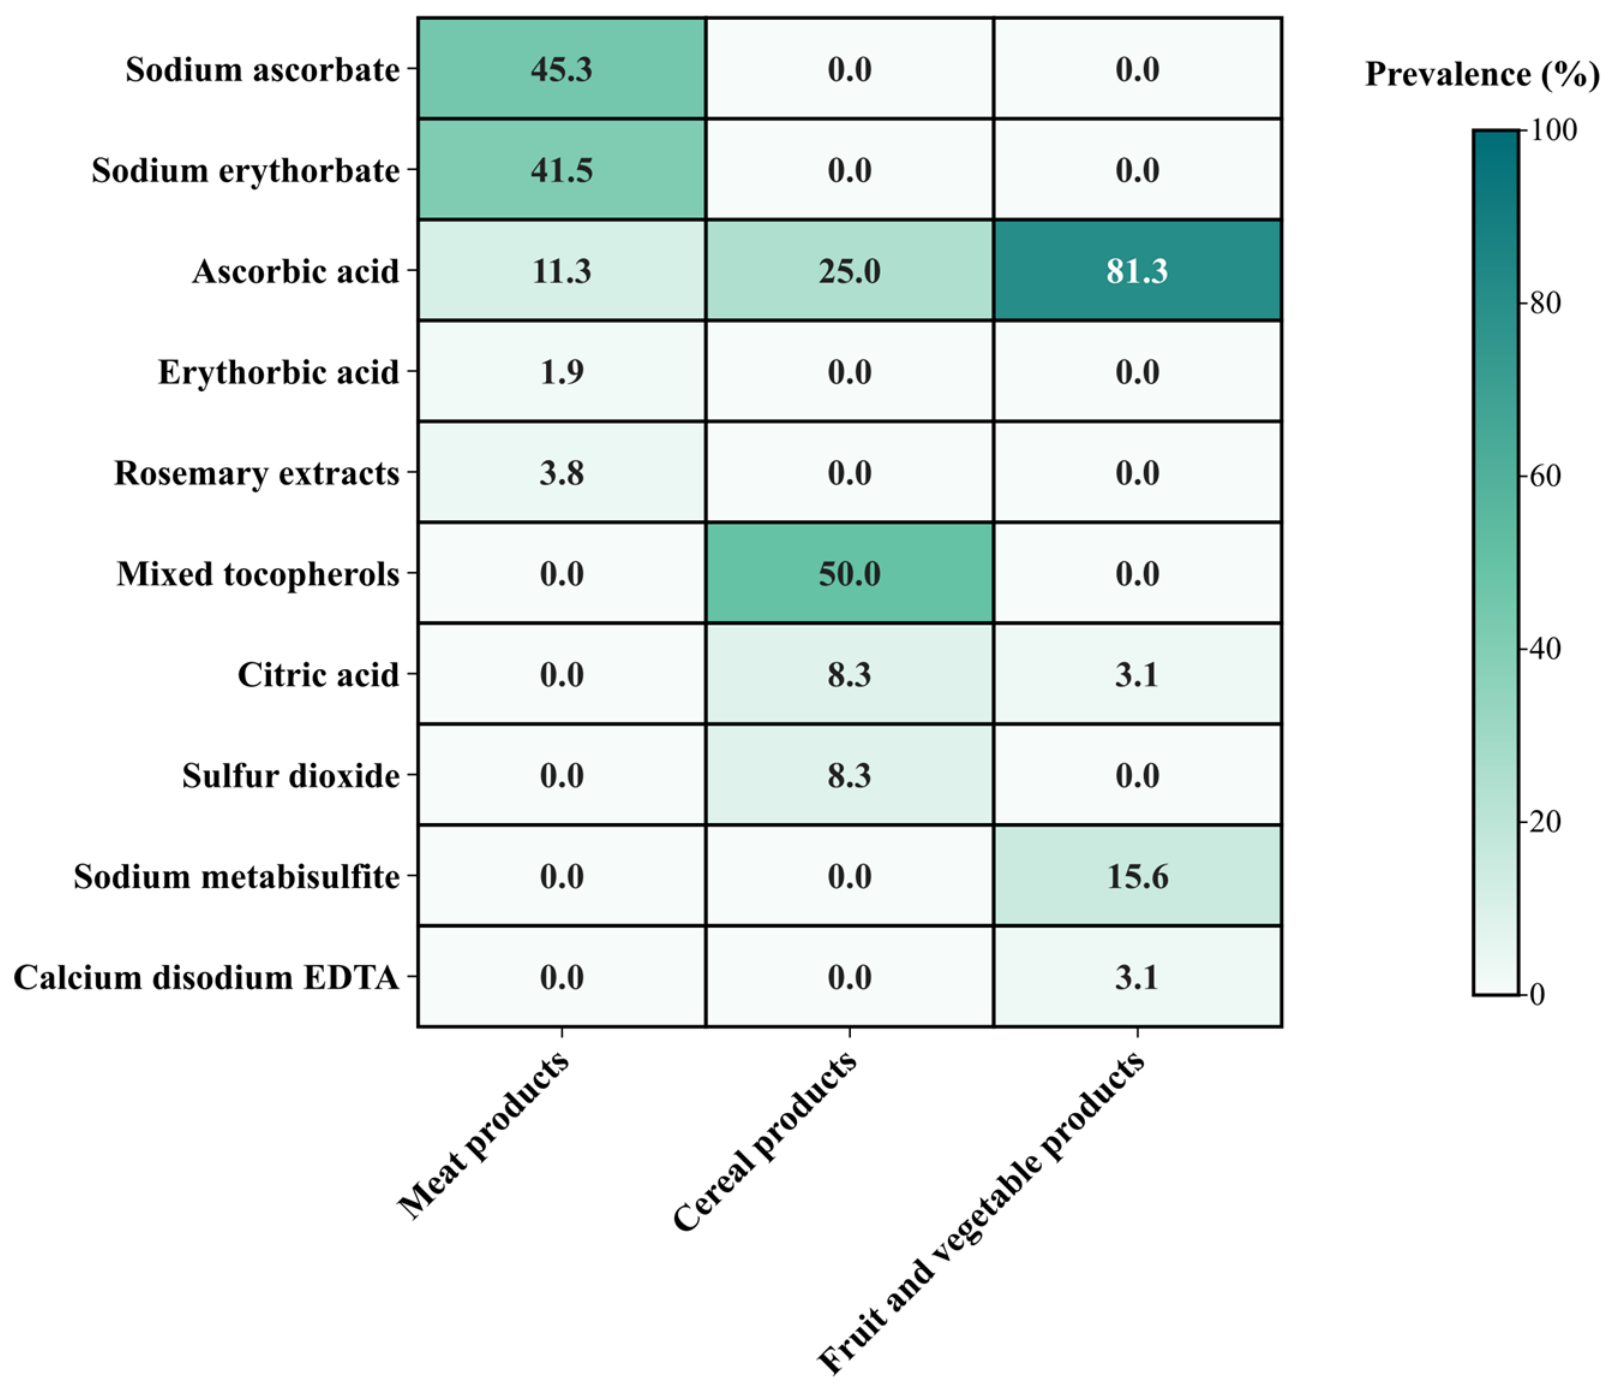
Marked differences were observed in the profiles of individual substances recorded as antioxidants across food categories (Table 2). Sodium ascorbate and sodium erythorbate were characteristic of meat products, declared in 45.3% and 41.5% of products, respectively, whereas neither compound was recorded in cereal or fruit and vegetable products. In contrast, ascorbic acid was particularly prevalent in fruit and vegetable products (81.3%), compared with 25.0% of cereal products and 11.3% of meat products. Mixed tocopherols showed an opposite category-specific pattern and were recorded exclusively in cereal products, where they occurred in 50.0% of products. All four major antioxidants showed significant associations with product category (p < 0.001). The strongest associations were observed for mixed tocopherols (Cramér’s V = 0.642) and ascorbic acid (V = 0.612), followed by sodium ascorbate (V = 0.563) and sodium erythorbate (V = 0.534).
Table 2.
Distribution of the major substances recorded as antioxidants across product categories.
The broader antioxidant profile shown in Figure 2 further highlighted category-specific patterns. Rosemary extracts and erythorbic acid were recorded in 2/53 (3.8%) and 1/53 (1.9%) meat products, respectively. Citric acid and sulfur dioxide were each recorded in 3/36 (8.3%) cereal products. In fruit and vegetable products, sodium metabisulfite was recorded in 5/32 (15.6%) products, whereas citric acid and calcium disodium EDTA were each recorded in 1/32 (3.1%) products. Citric acid was therefore the only minor antioxidant-related compound recorded in more than one product category, while most of the remaining compounds were confined to a single category. Calcium disodium EDTA was recorded as an antioxidant synergist rather than as a primary antioxidant.
Figure 2.
Heatmap showing the prevalence of antioxidant-related substances recorded in the antioxidant category of the source dataset across food product categories. Percentages were calculated within each product category (meat, n = 53; cereal, n = 36; fruit and vegetable, n = 32). Calcium disodium EDTA was treated as an antioxidant synergist rather than as a primary antioxidant.
3.4. Co-Occurrence of Functional Categories
Exploratory co-occurrence analysis identified two associations that remained significant after Benjamini–Hochberg correction for multiple testing. Within meat products, acidity regulators were positively associated with flavor enhancers (φ = 0.505, Fisher’s exact p = 0.00075, q = 0.021). Flavor enhancers were declared in 78.6% of meat products containing acidity regulators, compared with 23.1% of products without acidity regulators.
Within fruit and vegetable products, acidity regulators were positively associated with gelling/thickening agents (φ = 0.561, Fisher’s exact p = 0.00164, q = 0.0098). Gelling/thickening agents were declared in 55.0% of products containing acidity regulators, whereas none of the products without acidity regulators contained these additives. No pairwise co-occurrence association remained significant after FDR correction in cereal products.
The additional antioxidant-specific co-occurrence analysis identified one association that remained significant after FDR correction. Among cereal products, enrichment substances were present in 72.2% (13/18) of products containing mixed tocopherols, compared with 5.6% (1/18) of products without mixed tocopherols (φ = 0.684, Fisher’s exact p < 0.001, q = 0.0012). No antioxidant-specific association remained significant after FDR correction in meat or fruit and vegetable products.
3.5. Multivariate Patterns of Formulation Profiles
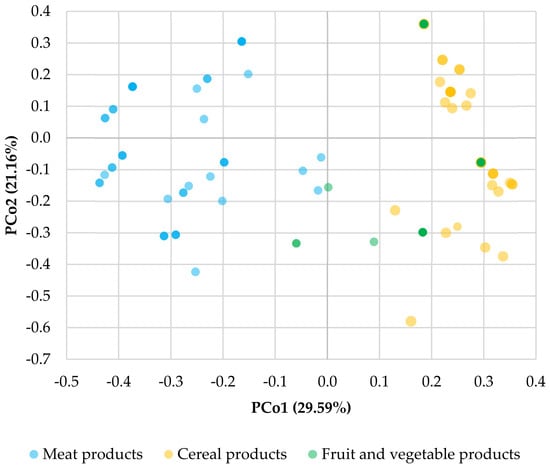
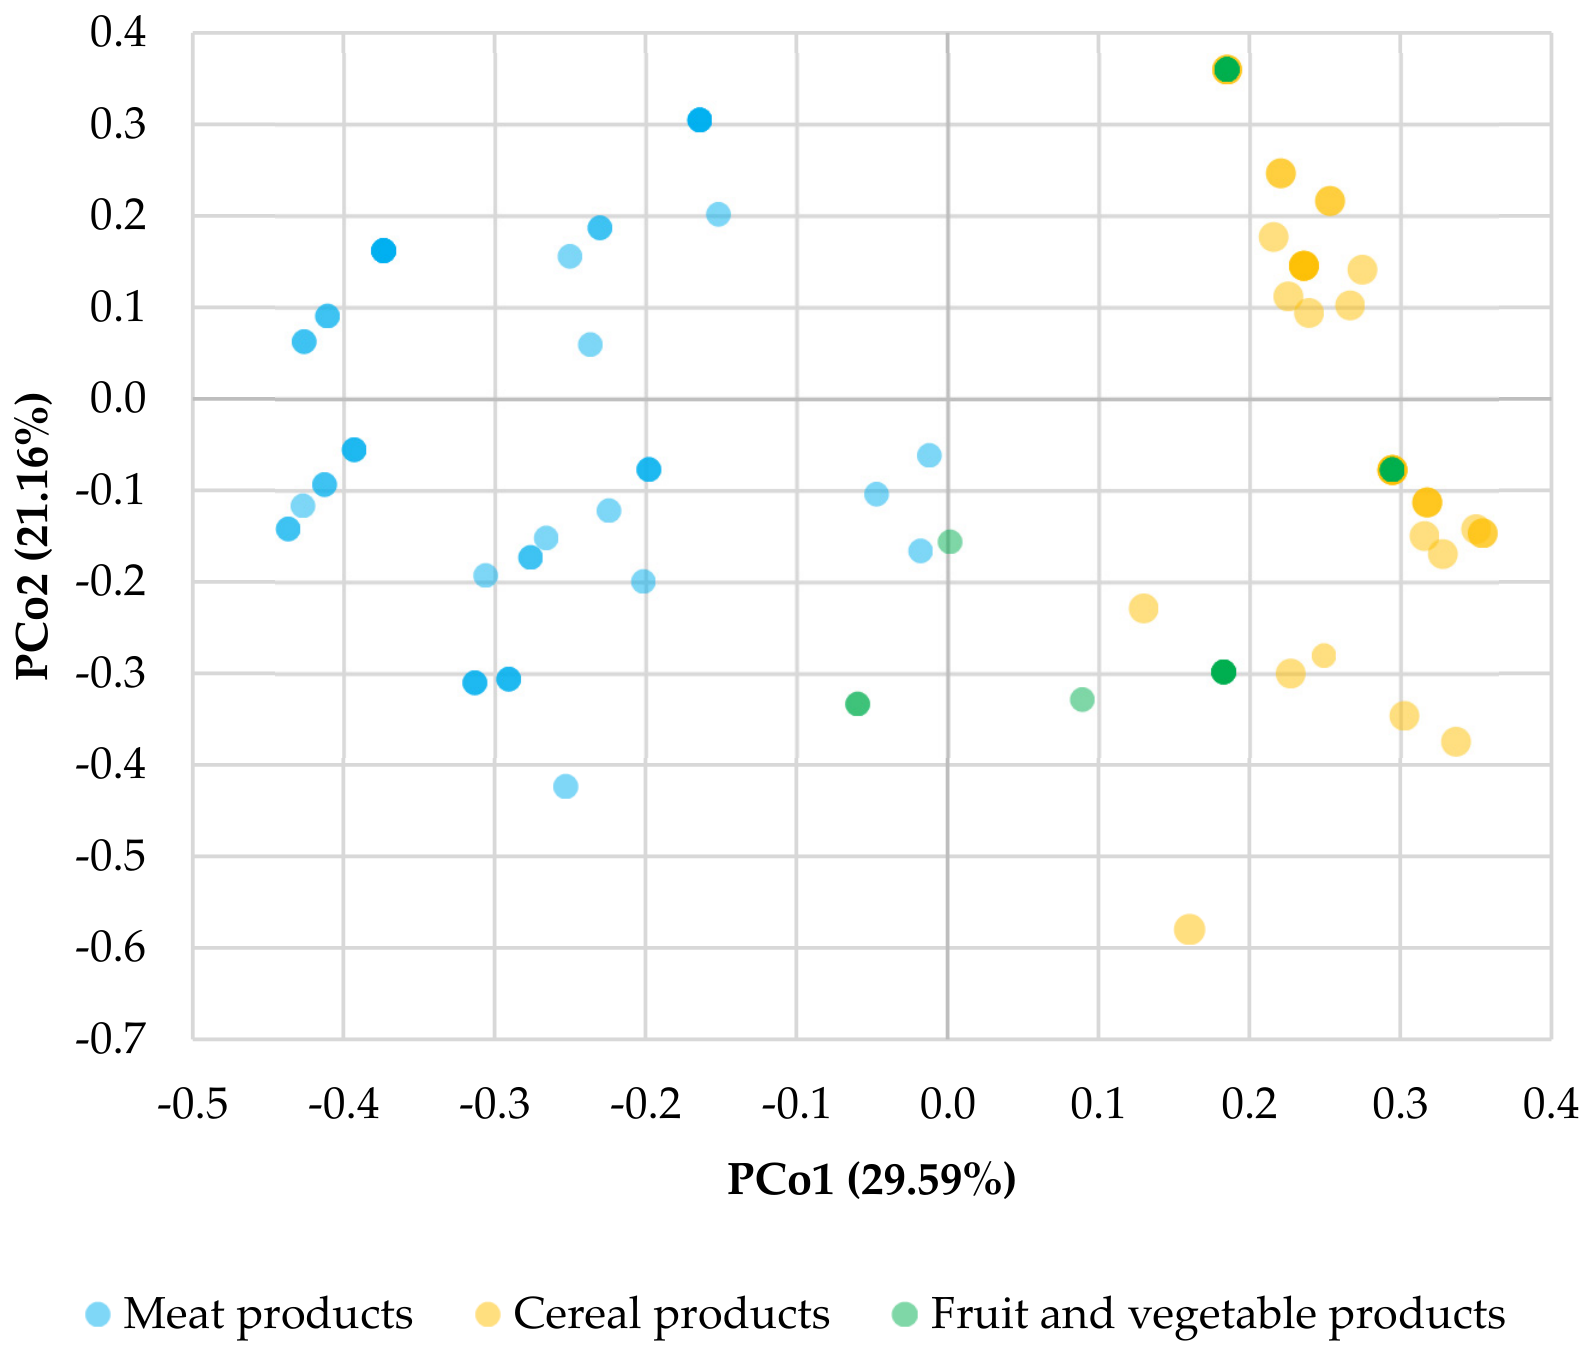
Principal coordinates analysis based on Jaccard distances further revealed category-related patterns in the overall formulation profiles (Figure 3). The first two coordinates accounted for 50.75% of the variation, with PCo1 and PCo2 explaining 29.59% and 21.16%, respectively. Meat products were predominantly distributed towards negative PCo1 values, whereas cereal products were mainly located on the positive side of PCo1. Fruit and vegetable products occupied intermediate and partially overlapping regions of the ordination space. Overall, the PCoA was interpreted as an exploratory visualization of similarities and differences in formulation profiles.
Figure 3.
Principal coordinates analysis (PCoA) of formulation profiles based on Jaccard distances calculated from the binary presence/absence matrix of functional formulation categories. PCo1 and PCo2 accounted for 29.59% and 21.16% of the variation, respectively. Some observations overlap because products with identical binary formulation profiles have identical coordinates. Partially transparent markers were used to improve the visualization of overlapping observations. The ordination is presented as an exploratory visualization of formulation-profile similarity and does not constitute a formal statistical test of differences among product categories.
4. Discussion
4.1. Category-Specific Patterns of Food Additive Use
The present study demonstrated clear category-specific differences in the recorded formulation profiles. Although antioxidants were highly prevalent across all three product groups, the accompanying functional formulation categories differed substantially. Preservatives, stabilizers, and flavor enhancers were particularly characteristic of meat products, whereas emulsifiers, raising agents, humectants, and fortifying ingredients were more strongly associated with cereal products. Fruit and vegetable products were distinguished primarily by a high prevalence of acidity regulators and gelling/thickening agents. These findings indicate that differences among food categories were driven less by the overall occurrence of antioxidants than by the broader combinations of technological functions represented in their formulations.
This interpretation aligns with large-scale label-based surveys conducted in other markets. Chazelas et al. [6] found food additives in 53.8% of more than 126,000 products available in the French market and identified distinct clusters of additives associated with specific food categories. Similarly, Montera et al. [7] reported that only 20.6% of 9856 Brazilian products contained no additives, whereas almost one-quarter contained six or more. Importantly, specific combinations of additive classes were associated with particular food groups. More recent evidence from Türkiye also showed marked differences in the distribution of functional classes across product categories, with thickeners/stabilizers and acidity regulators particularly common overall and preservatives especially prominent in meat products [8].
The higher functional-category richness observed in meat products in the present study may reflect differences in technological requirements across food categories. Recent surveys present a similar overall picture. In a study of animal-based products marketed in Brazil, Souza et al. [12] identified 20 functional additive classes, with flavorings, stabilizers, and preservatives among the most prevalent, and within the meat and egg group, antioxidants were the most prominent class. Macheka et al. [13] likewise reported relatively high additive diversity in processed meat products and identified preservatives and flavor enhancers as characteristic of this category. However, direct numerical comparisons should be made cautiously because several previous studies counted individual additive substances, whereas functional-category richness in the present study reflects the number of distinct functional formulation categories recorded for each product. A recent Polish market survey also showed that product formulation can strongly influence both the types and the number of additives declared on food labels. Kołodziejczyk and Nowak [9] found marked differences in additive profiles between products with and without added sugar, with average additive counts of 3.8 and 1.6 per product, respectively. Taken together, these observations suggest that the observed additive profiles may reflect differences in technological and formulation requirements across food matrices. However, the present label-based study cannot determine the specific formulation decisions or technological intent of manufacturers.
4.2. Preservatives and Antioxidant Profiles in Meat Products
Meat products exhibited the most distinctive preservative and antioxidant pattern. Preservatives were declared in 86.8% of the analyzed meat products, and the original product-level dataset indicated that sodium nitrite was the preservative responsible for this prevalence. Sodium ascorbate and sodium erythorbate were also strongly associated with meat products, occurring in 45.3% and 41.5% of products, respectively. This latter result is particularly noteworthy because it closely aligns with a much larger Polish study by Czech-Załubska et al. [10], in which nitrites were recorded in more than 83.4% of processed meat products and erythorbic acid and/or sodium erythorbate was recorded in approximately 39.8%. The similarity between these independently collected datasets suggests that the prominent presence of nitrite and erythorbate in the present sample is consistent with previously reported formulation patterns in processed meat products. However, the present label-based data do not establish the reasons for their inclusion in specific products.
The technological basis for this pattern is well established. Nitrites contribute to microbial safety, cured color development, flavor, and oxidative stability, while sodium ascorbate can accelerate curing reactions by promoting the conversion of nitrite to nitric oxide and supporting the formation and stability of cured meat pigments. Sodium erythorbate performs similar functions and is commonly used as an alternative curing adjunct. Molina et al. [14] emphasized the multifunctional role of these compounds in the quality, safety, color, and shelf-life characteristics of cured meat products. The strong associations observed in the present study for sodium ascorbate and sodium erythorbate are therefore consistent with the specific technological requirements of processed meat products.
The original dataset also showed that none of the analyzed meat products declared BHA, BHT, TBHQ, or gallates, whereas rosemary extract was present in only two products, representing 3.8% of the meat samples. This low prevalence, however, should not be interpreted as evidence that rosemary is unsuitable for thermally processed meat. More recent research demonstrates that plant-derived antioxidants, including rosemary constituents, can reduce oxidative deterioration in meat systems. A 2023 review concluded that plant bioactive compounds may reduce auto-oxidation and microbial deterioration and contribute to improved shelf life when applied under suitable conditions [15]. Importantly, a 2024 study found that rosemary extract added to meat patties retained its antioxidant activity after microwave cooking and reduced oxidative changes during subsequent in vitro digestion [16]. Thus, the limited declaration of rosemary extract in the present sample may reflect product-specific formulation choices, sensory considerations, cost, regulatory conditions, or market positioning. A label-based survey cannot determine why manufacturers make these choices.
The dataset’s historical context should also be considered when interpreting the very high prevalence of nitrite-containing products. The European Union revised the permitted levels of nitrites and nitrates in meat products under Commission Regulation (EU) 2023/2108 [17], introducing lower maximum permitted levels for several meat product categories from 9 October 2025. The prevalence values observed in the present dataset should be regarded as a description of the surveyed products rather than an estimate of current nitrite use in the Polish market.
4.3. Cereal Products
Cereal products displayed a markedly different antioxidant profile, with mixed tocopherols declared in 50.0% of products and occurring exclusively in this category within the present dataset. This association is technologically plausible. Lipid oxidation can impair food quality even when the total lipid fraction is relatively modest, and adding antioxidants remains one of the major approaches to delay the oxidative deterioration of food lipids [18]. Cereal grains are important sources of tocols, and recent evidence shows that tocopherols and tocotrienols are particularly concentrated in the germ fraction [19]. Processing, ingredient composition, and the presence of lipid-rich components can therefore provide a technological rationale for using additional tocopherols in cereal-based formulations.
Cereal products were also characterized by a high prevalence of emulsifiers and the presence of raising agents, humectants, and nutrient-enrichment ingredients. In the original dataset, fortifying ingredients were recorded in 38.9% of cereal products, especially in breakfast cereals, whereas vitamins and iron were each declared in 36.1% of this group. The use of cereal products as vehicles for micronutrient fortification is well established. Garg et al. [20] reviewed the widespread use of vitamin fortification in cereal foods and highlighted the importance of enrichment strategies to compensate for nutrient losses associated with processing and to increase micronutrient supply. In the present dataset, added vitamins and minerals were treated as fortifying ingredients because their declared role was nutrient enrichment; however, their regulatory classification may depend on the intended use [1,21].
4.4. Fruit and Vegetable Products
Fruit and vegetable products showed yet another profile. Ascorbic acid was declared in 81.3% of these products, substantially more often than in cereal or meat products, while acidity regulators were present in 62.5%. The predominance of ascorbic acid is consistent with its technological usefulness in fruit- and vegetable-based matrices, where oxidative and enzymatic browning can strongly affect appearance and consumer acceptance. Polyphenol oxidase is a major enzyme responsible for enzymatic browning in fresh produce, and reducing agents can interfere with the formation or persistence of colored oxidation products. Recent experimental work has confirmed ascorbic acid as an effective anti-browning treatment. For example, Li et al. [22] showed reduced browning in fresh-cut potato after ascorbic acid treatment and attributed its action primarily to reducing quinones back to phenolic compounds. Recent reviews likewise identify controlling PPO-mediated browning as a major challenge in maintaining the quality of fruit and vegetable products [23].
The relatively high prevalence of acidity regulators in fruit and vegetable products is also consistent with their technological roles in controlling acidity, flavor, gel formation, and product stability. However, the overall functional-category richness of fruit and vegetable products remained lower than that of meat products. The simultaneous presence of near-universal antioxidant declarations and lower functional-category richness illustrates that a high prevalence of one technological function does not necessarily correspond to a generally more diverse additive profile. Instead, the formulation needs of fruit and vegetable products appear to be concentrated around a narrower set of functions, particularly oxidative protection, acidity adjustment, and textural modification.
4.5. Co-Occurrence Patterns, Multivariate Structure, and Study Limitations
The co-occurrence analysis provided additional evidence that functional formulation categories co-occurred in recurring combinations rather than independently. After correction for multiple testing, acidity regulators were associated with flavor enhancers in meat products, whereas acidity regulators were associated with gelling/thickening agents in fruit and vegetable products. These associations should not be interpreted as evidence of direct chemical interactions between the respective classes, but rather, they indicate that particular technological functions tend to be combined within certain product formulations. Accordingly, statistical co-occurrence in the present dataset should not be interpreted as evidence of antioxidant synergism. The association between mixed tocopherols and enrichment substances in cereal products should likewise be interpreted as a pattern of co-occurrence rather than as evidence of a direct functional or chemical interaction between these formulation components.
This interpretation aligns with previous large-scale studies of additive co-occurrence. Chazelas et al. [6] identified six clusters of frequently co-occurring additives in foods marketed in France, several of which were strongly associated with specific product sectors, including processed meats, biscuits and cakes, and sweetened products. Montera et al. [7] similarly identified recurring patterns in functional additive categories and showed that individual patterns were positively associated with specific groups of foods and beverages. These findings support the usefulness of analyzing additive combinations rather than limiting market surveys to the prevalence of individual substances.
The PCoA further illustrated the category-dependent structure of the formulation profiles. Meat products were predominantly positioned toward negative PCo1 values; cereal products were concentrated mainly on the positive side of PCo1; and fruit and vegetable products occupied a more intermediate region. Together, the first two coordinates explained 50.75% of the variation. This pattern is consistent with the univariate analyses, which showed substantial differences in functional-category prevalence across food categories. The PCoA was used for exploratory purposes. Therefore, the observed separation illustrates differences in formulation-profile similarity but does not constitute a formal statistical test of between-category differences.
Several limitations should be considered. First, the analysis was based solely on manufacturer-declared ingredient lists and therefore provides information on the presence rather than the concentration of food additives. Consequently, the data cannot be used to estimate actual dietary exposure or to determine quantitative differences in additive levels between products. Second, food formulations and regulatory requirements may change over time, so comparisons with more recent market data should account for this. Finally, the functional-category approach does not capture differences in additive concentration, processing conditions, or the possibility that the same substance may perform more than one technological function. The study also did not assess antioxidant activity, oxidative stability, technological performance, dietary exposure, or manufacturer intent. Therefore, the observed declaration patterns cannot be used to infer the effectiveness or purpose of individual formulation choices.
The sampling frame was limited to three retail outlets in Warsaw and three broad product categories. In addition, some manufacturers or brands contributed multiple products, which may introduce clustering due to shared formulation practices. Because the analyses were conducted at the product level and did not account for manufacturer- or brand-level clustering, the findings should be interpreted as descriptive of the surveyed products rather than as estimates of national prevalence. Furthermore, the three principal product categories were also internally heterogeneous, encompassing products with diverse processing and formulation characteristics. Because the original sampling design was not stratified by product subtype and several retrospective subgroups would have been small, subgroup-level inferential analyses were not conducted. Consequently, some of the observed category-level patterns may partly reflect the specific composition of product subtypes in the surveyed sample.
Despite these limitations, the study offers a complementary perspective by integrating functional-category prevalence, functional-category richness, individual antioxidant profiles, co-occurrence analysis, and multivariate exploration in the same product-level dataset. Overall, the findings indicate that the widespread declaration of antioxidants across meat, cereal, and fruit and vegetable products masks markedly different formulation strategies. Meat products were characterized predominantly by preservative, stabilizing, flavor-related, and curing functions; cereal products by tocopherols, emulsification, fortification, moisture control, and leavening functions; and fruit and vegetable products by ascorbic acid, acidity regulation, and textural modification. These differences may reflect variations in the technological and formulation requirements of the respective food matrices, although this label-based study cannot establish the reasons behind individual formulation choices.
5. Conclusions
The present label-based survey demonstrated that meat, cereals, and fruit and vegetable products differed in their declared antioxidant profiles and accompanying formulation profiles. Although antioxidants were highly prevalent across all three categories, the most frequently declared compounds differed: sodium ascorbate and sodium erythorbate in meat products, mixed tocopherols in cereal products, and ascorbic acid in fruit and vegetable products. Meat products also showed the greatest functional-category richness, particularly due to the frequent occurrence of preservatives, stabilizers, and flavor enhancers. Co-occurrence analysis and PCoA further indicated recurring category-related patterns in the recorded formulation profiles. These findings highlight the value of considering individual antioxidants alongside other declared formulation categories when characterizing commercially available foods.
The specific contribution of this exploratory dataset lies in combining antioxidant-related substance profiles with broader formulation-category richness, co-occurrence analysis, and multivariate visualization at the product level. Rather than providing a representative estimate of additive prevalence in Poland, the findings describe how antioxidant-related declarations were embedded within the formulation profiles of the surveyed products. From a practical perspective, label-based formulation profiling may offer an accessible approach to monitoring changes in ingredient-declaration patterns over time, comparing reformulation trends across product categories, and identifying product groups where changes in antioxidant-related ingredient use warrant more detailed analytical investigation. Such monitoring should be regarded as complementary to, rather than a substitute for, quantitative assessment of additive concentrations, technological performance, or dietary exposure.
Supplementary Materials
The following supporting information can be downloaded at https://www.mdpi.com/article/10.3390/app162111046/s1. Table S1: Declared antioxidants and co-occurring formulation categories in meat products (n = 53); Table S2: Declared antioxidants and co-occurring formulation categories in cereal products (n = 36); Table S3: Declared antioxidants and co-occurring formulation categories in fruit and vegetable products (n = 32); Table S4: Binary coding matrix of functional formulation categories used in the statistical analysis (n = 121).
Author Contributions
Conceptualization, M.K.; methodology, M.K., K.T. and H.K.; formal analysis, B.Z. and Ş.U.; investigation, M.K.; data curation, M.K. and B.Z.; writing—original draft preparation, B.Z. and M.K.; writing—review and editing, M.K., K.T., Ş.U. and H.K.; visualization, B.Z. and Ş.U.; supervision, M.K.; project administration, M.K. All authors have read and agreed to the published version of the manuscript.
Funding
This research received no external funding.
Institutional Review Board Statement
Not applicable.
Informed Consent Statement
Not applicable.
Data Availability Statement
The original contributions presented in this study are included in the article and Supplementary Materials. Further inquiries can be directed to the corresponding authors.
Acknowledgments
The authors would like to thank P.P. for her assistance with the collection and organization of product label data. Her support contributed to the successful completion of this study.
Conflicts of Interest
The authors declare no conflicts of interest.
Abbreviations
The following abbreviations are used in this manuscript:
| BHA | butylated hydroxyanisole |
| BHT | butylated hydroxytoluene |
| EDTA | ethylenediaminetetraacetic acid |
| FDR | false discovery rate |
| IQR | interquartile range |
| PCoA | principal coordinates analysis |
| PPO | polyphenol oxidase |
| TBHQ | tert-Butylhydroquinone |
References
- European Parliament and Council. Regulation (EC) No 1333/2008 of the European Parliament and of the Council of 16 December 2008 on Food Additives. Available online: http://data.europa.eu/eli/reg/2008/1333/oj (accessed on 2 October 2026).
- European Parliament and Council. Regulation (EU) No 1169/2011 of the European Parliament and of the Council of 25 October 2011 on the Provision of Food Information to Consumers. Available online: http://data.europa.eu/eli/reg/2011/1169/oj (accessed on 2 October 2026).
- Gulcin, İ. Antioxidants: A Comprehensive Review. Arch. Toxicol. 2025, 99, 1893–1997. [Google Scholar] [CrossRef] [Scilit] [PubMed]
- Chaib, N.; Elouardi, M.; Azdem, D.; Mabrouki, J.; Boutakiout, A.; Rouas, S.; Chafai, Y.; Wissal, J.; Alaoui El Belghiti, M. Synergistic Interactions of Antioxidants in Lipid Peroxidation: Mechanistic Insights and Applications. Euro-Mediterr. J. Environ. Integr. 2026, 11, 164. [Google Scholar] [CrossRef] [Scilit]
- Bensid, A.; El Abed, N.; Houicher, A.; Regenstein, J.M.; Özogul, F. Antioxidant and Antimicrobial Preservatives: Properties, Mechanism of Action and Applications in Food—A Review. Crit. Rev. Food Sci. Nutr. 2022, 62, 2985–3001. [Google Scholar] [CrossRef] [Scilit] [PubMed]
- Chazelas, E.; Deschasaux, M.; Srour, B.; Kesse-Guyot, E.; Julia, C.; Alles, B.; Druesne-Pecollo, N.; Galan, P.; Hercberg, S.; Latino-Martel, P.; et al. Food Additives: Distribution and Co-Occurrence in 126,000 Food Products of the French Market. Sci. Rep. 2020, 10, 3980. [Google Scholar] [CrossRef] [Scilit] [PubMed]
- Montera, V.D.S.P.; Martins, A.P.B.; Borges, C.A.; Canella, D.S. Distribution and Patterns of Use of Food Additives in Foods and Beverages Available in Brazilian Supermarkets. Food Funct. 2021, 12, 7699–7708. [Google Scholar] [CrossRef] [Scilit] [PubMed]
- Kulaksiz Gunaydi, Z.E.; Cakmak Kafadar, G. Prevalence, Functional Classification, and Distribution of Food Additives in Packaged Foods Marketed in Türkiye: A Label-Based Assessment. Food Addit. Contam. Part A Chem. Anal. Control Expo. Risk Assess. 2026, 1–16. [Google Scholar] [CrossRef] [Scilit] [PubMed]
- Kołodziejczyk, A.; Nowak, J. Comparative Analysis of Food Additives in Products with and without Added Sugar on the Polish Market. Foods 2026, 15, 1046. [Google Scholar] [CrossRef] [Scilit] [PubMed]
- Czech-Załubska, K.; Klich, D.; Jackowska-Tracz, A.; Didkowska, A.; Zarzyńska, J.; Anusz, K. Assessment of Dietary Exposure to Food Additives Used in Polish Processed Meat Products. Food Addit. Contam. Part A Chem. Anal. Control Expo. Risk Assess. 2023, 40, 1389–1411. [Google Scholar] [CrossRef] [Scilit] [PubMed]
- Visualization Gallery. Available online: https://www.chiplot.online/ (accessed on 2 October 2026).
- Souza, C.; Kraemer, M.V.D.S.; Proença, R.P.d.C.; Kliemann, N.; Scapin, T.; Bernardo, G.L.; Uggioni, P.L.; Fernandes, A.C. Flavor over Preservation: A Label Analysis Examining the Use of Food Additives in Animal-Based Foods Marketed in Brazil. Food Addit. Contam. Part A Chem. Anal. Control Expo. Risk Assess. 2025, 42, 1321–1329. [Google Scholar] [CrossRef] [Scilit] [PubMed]
- Macheka, L.; Manditsera, F.; Chopera, P.; Matsungo, T.M.; Mungwari, M.; Madimutsa, O.; Dumba, T.; Ndondo, J.; Musidzaramba, T.J.; Borerwe, J.; et al. Food Additive Use in Packaged Foods in Zimbabwe: A Market-Based Survey to Inform Risk-Based Food Safety Control. J. Food Prot. 2026, 89, 100841. [Google Scholar] [CrossRef] [Scilit] [PubMed]
- Molina, J.R.G.; Frías-Celayeta, J.M.; Bolton, D.J.; Botinestean, C. A Comprehensive Review of Cured Meat Products in the Irish Market: Opportunities for Reformulation and Processing. Foods 2024, 13, 746. [Google Scholar] [CrossRef] [Scilit] [PubMed]
- Olvera-Aguirre, G.; Piñeiro-Vázquez, Á.T.; Sanginés-García, J.R.; Sánchez Zárate, A.; Ochoa-Flores, A.A.; Segura-Campos, M.R.; Vargas-Bello-Pérez, E.; Chay-Canul, A.J. Using Plant-Based Compounds as Preservatives for Meat Products: A Review. Heliyon 2023, 9, e17071. [Google Scholar] [CrossRef] [Scilit] [PubMed]
- Ansorena, D.; Astiasaran, I. Natural Antioxidants (Rosemary and Parsley) in Microwaved Ground Meat Patties: Effects of in Vitro Digestion. J. Sci. Food Agric. 2024, 104, 4465–4472. [Google Scholar] [CrossRef] [Scilit] [PubMed]
- European Commission. Commission Regulation (EU) 2023/2108 of 6 October 2023 amending Annex II to Regulation (EC) No 1333/2008 of the European Parliament and of the Council and the Annex to Commission Regulation (EU) No 231/2012 as Regards Food Additives Nitrites (E 249–250) and Nitrates (E 251–252). Available online: http://data.europa.eu/eli/reg/2023/2108/oj (accessed on 2 October 2026).
- Wang, D.; Xiao, H.; Lyu, X.; Chen, H.; Wei, F. Lipid Oxidation in Food Science and Nutritional Health: A Comprehensive Review. Oil Crop Sci. 2023, 8, 35–44. [Google Scholar] [CrossRef] [Scilit]
- Nguyen, S.N.; Drawbridge, P.; Beta, T. Distribution of Cereal Phytochemicals and Micronutrients in Whole Grains: A Review of Nutraceutical, Industrial, and Agricultural Implications. Cereal Chem. 2024, 101, 903–925. [Google Scholar] [CrossRef] [Scilit]
- Garg, M.; Sharma, A.; Vats, S.; Tiwari, V.; Kumari, A.; Mishra, V.; Krishania, M. Vitamins in Cereals: A Critical Review of Content, Health Effects, Processing Losses, Bioaccessibility, Fortification, and Biofortification Strategies for Their Improvement. Front. Nutr. 2021, 8, 586815. [Google Scholar] [CrossRef] [Scilit] [PubMed]
- European Parliament and Council. Regulation (EC) No 1925/2006 of the European Parliament and of the Council of 20 December 2006 on the Addition of Vitamins and Minerals and of Certain Other Substances to Foods. Available online: http://data.europa.eu/eli/reg/2006/1925/2025-11-26 (accessed on 2 October 2026).
- Li, G.; Wang, X.; Zhu, H.; Li, G.; Du, J.; Song, X. Erihemu Use of Different Food Additives to Control Browning in Fresh-Cut Potatoes. Food Sci. Nutr. 2023, 11, 7967–7973. [Google Scholar] [CrossRef] [Scilit] [PubMed]
- Sui, X.; Meng, Z.; Dong, T.; Fan, X.; Wang, Q. Enzymatic Browning and Polyphenol Oxidase Control Strategies. Curr. Opin. Biotechnol. 2023, 81, 102921. [Google Scholar] [CrossRef] [Scilit] [PubMed]

Disclaimer/Publisher’s Note: The statements, opinions and data contained in all publications are solely those of the individual author(s) and contributor(s) and not of MDPI and/or the editor(s). MDPI and/or the editor(s) disclaim responsibility for any injury to people or property resulting from any ideas, methods, instructions or products referred to in the content. |
© 2026 by the authors. Licensee MDPI, Basel, Switzerland. This article is an open access article distributed under the terms and conditions of the Creative Commons Attribution (CC BY) license.