


Abstract
In electrified vehicles, reduced powertrain noise relative to internal combustion engine vehicles increases the relative prominence of heating, ventilation, and air conditioning (HVAC) sound, thereby increasing the importance of sound-quality improvement beyond noise reduction. HVAC sound design should therefore consider both Pleasantness and Coolness. This study investigated frequency-specific sound pressure level (SPL) changes associated with these perceptual attributes and developed a silencer and an active sound design (ASD) signal based on the listening-test results. Listening tests were conducted using modified HVAC recordings in which selected frequency regions were amplified or attenuated. The listening tests showed trends toward higher Pleasantness ratings with attenuation at 1420–2840 Hz and 2840–5680 Hz, whereas trends toward higher Coolness ratings were observed with amplification at 710–1420 Hz and 1420–2840 Hz. These findings guided the design of the silencer and ASD signal; HVAC rig tests showed the intended attenuation and an increase in the ASD target-band SPL under the combined application condition. In the final listening test, Pleasantness ratings were higher under the silencer-only condition than under the straight-pipe reference condition, while Coolness ratings were higher under the silencer+ASD condition than under the silencer-only reference condition. These findings support a frequency-selective HVAC sound-quality control approach combining passive attenuation and ASD-based target-band enhancement.
1. Introduction
Electrified vehicles differ from internal combustion engine vehicles (ICEVs) in their propulsion systems and in the characteristics of noise generated by their powertrains [1,2]. During electric driving, engine noise in electrified vehicles is reduced or eliminated, making tire–road noise, wind noise, and noise from onboard systems that were previously masked by engine noise relatively more prominent in the cabin acoustic environment [2,3]. Among these onboard systems, the heating, ventilation, and air conditioning (HVAC) system regulates cabin temperature, and its operating noise constitutes a non-powertrain noise source that contributes to the in-cabin acoustic environment perceived by occupants. Accordingly, HVAC noise is an important consideration when improving the in-cabin acoustic environment.
Various studies have investigated the acoustic and perceptual characteristics of HVAC sound and explored approaches to improving the in-cabin acoustic environment. Approaches to reducing HVAC noise can be classified into source control and transmission-path control. Studies on source control have reported analyses and improvements of the noise, vibration, and harshness (NVH) characteristics of blower motors [4], optimization of blower fan and scroll geometries [5,6], and prediction of blower flow noise together with associated structural modifications [7,8,9] and reduction in humming noise caused by HVAC pipe vibration [10]. Transmission-path control approaches include the development of silencers for noise reduction in HVAC ducts [11,12,13], the application of sound-absorbing materials [14,15,16], and active noise control (ANC) using antiphase sound waves [17,18]. Although these studies have primarily focused on reducing noise generated by HVAC systems, occupants’ subjective assessments of HVAC sound are not determined by noise level alone, and sounds with similar noise levels may evoke different perceptual responses depending on their acoustic composition. Therefore, improving HVAC sound quality requires consideration of not only noise reduction but also the relationship between acoustic characteristics and the perceptual attributes experienced by occupants.
Previous studies evaluating automotive HVAC sound quality have examined the relationships between various perceptual attributes and acoustic characteristics. First, listening tests using HVAC sounds with deliberately modified frequency-band sound pressure levels or spectra have been conducted to identify acoustic characteristics influencing subjective perceptions of loudness, sharpness, and thermal impression [19,20,21]. Other studies have examined perceptual attributes associated with the heating and cooling impressions of HVAC systems, such as refreshing, cool, and warm, by analyzing their relationships with psychoacoustic metrics, including loudness and sharpness, as well as differences in listening ratings according to the relative contributions of low- and high-frequency components [20,21,22,23,24]. Furthermore, studies have investigated the relationships between perceptual attributes reflecting overall HVAC and airflow-related sound quality, such as annoyance, quality, pleasantness, and preference, and various acoustic and psychoacoustic characteristics, including loudness, sharpness, roughness, and tonality, as well as autocorrelation function (ACF)-based metrics [25,26,27,28,29,30,31,32,33,34]. Although these studies characterized the relationships between perceptual and acoustic properties of HVAC and airflow-related sound, most did not extend these findings to the design, implementation, and experimental validation of acoustic control strategies.
Among studies that have applied the relationships between perceptual attributes and acoustic characteristics to automotive HVAC sound control, Back et al. [35] developed the Pleasant Index (PLI) and Cool Index (CLI) to predict pleasantness and coolness, respectively, and used these indices to design a target HVAC sound. Although attenuation of specific frequency bands intended to improve pleasantness was not implemented because it required modifications to the HVAC hardware, an Active Electric Control System (AECS) was applied to amplify the sound pressure level of frequency components associated with coolness, resulting in an increase in CLI within the vehicle cabin. However, attenuation intended to improve pleasantness and amplification intended to improve coolness were not applied together, and no separate subjective listening test was conducted for the final controlled sound; thus, the effects of combined acoustic control addressing both perceptual attributes remained unverified.
This study investigated the effects of frequency-specific amplification and attenuation on the Pleasantness and Coolness of automotive HVAC sound and proposed a sound quality control approach using a silencer and ASD to address Pleasantness and Coolness, respectively. First, listening-test stimuli were prepared by independently amplifying or attenuating the sound pressure level (SPL) of selected frequency regions in an original HVAC recording, and listening tests were conducted. The results were used to identify the frequency regions and SPL-change directions associated with higher Pleasantness and Coolness ratings. Based on these findings, a silencer was designed to attenuate frequency components for which SPL reduction was associated with higher Pleasantness ratings, and an active sound design (ASD) signal was developed to amplify frequency components associated with higher Coolness ratings; HVAC rig tests were then performed to analyze the frequency-dependent SPL changes resulting from silencer installation and ASD signal playback. Finally, listening tests of the acoustically controlled HVAC sounds were conducted to evaluate changes in Pleasantness following silencer installation and changes in Coolness following ASD signal playback.
2. Materials and Methods
2.1. Perceptual Attributes of HVAC Sound
To improve automotive HVAC sound quality, Pleasantness, which reflects a positive perception of overall sound quality, and Coolness, which reflects the auditory impression of coolness evoked by HVAC sound rather than a thermal sensation resulting from actual temperature or airflow, were selected as the perceptual attributes to be evaluated in this study. Previous studies have reported different acoustic characteristics associated with perceptual attributes depending on the sound sources and evaluation methods employed. Therefore, both perceptual attributes were evaluated using the same original HVAC recording and identical frequency-modification conditions, enabling direct comparison of their rating trends under a common reference. Listening tests were conducted using HVAC sounds with amplified or attenuated SPLs in selected frequency regions to identify the frequency ranges and directions of SPL change associated with higher ratings for each attribute. The resulting frequency-specific rating trends were then used to define the target regions and directions of SPL change for subsequent acoustic control.
2.1.1. Original HVAC Recording and Selection of Evaluation Frequency Regions
To compare perceptual attributes under a common reference when modifying SPLs in different frequency regions, a single automotive HVAC recording was used as the original sound in this study. A fixed vehicle and HVAC operating condition was used to maintain a consistent acoustic baseline for evaluating the perceptual effects of frequency-specific SPL amplification and attenuation. During the measurement of the original HVAC sound, the vehicle remained stationary with the ignition on, while the HVAC temperature was set to 22 °C, the airflow mode to Vent, the air intake mode to Fresh air, and the blower speed to an intermediate level. After the HVAC operating condition had stabilized, a 5-s acoustic signal was recorded using a headset microphone positioned at the driver’s location, with a sampling frequency of 44,100 Hz. The recorded HVAC sound was subsequently used as the reference sound for comparing perceptual attributes under frequency-specific SPL amplification and attenuation conditions.
Figure 1 illustrates the frequency regions used in the first and second listening tests, which were defined based on 1-octave bands. To compare Pleasantness and Coolness rating trends in response to frequency-specific SPL amplification and attenuation, 1-octave bands, which divide the frequency range at a constant ratio, were adopted as the basic unit for defining the evaluation regions. Six consecutive 1-octave bands with center frequencies ranging from 250 to 8000 Hz were selected, and their frequency boundaries defined an overall evaluation range of 177–11,360 Hz.
Figure 1.
Configuration of frequency regions for frequency-modified HVAC sounds.
In the first listening test, two adjacent 1-octave bands were combined into a single region to examine overall Pleasantness and Coolness rating trends in response to SPL changes across broad frequency ranges while limiting the number of listening stimuli and the potential participant burden and fatigue that could result from evaluating all individual 1-octave bands in a single test. Accordingly, the overall evaluation range was divided into three frequency regions: Region 1 (177–710 Hz), Region 2 (710–2840 Hz), and Region 3 (2840–11,360 Hz). Listening-test stimuli were then prepared by independently amplifying or attenuating the SPL in each region to compare Pleasantness and Coolness rating trends.
In the second listening test, based on the rating trends observed in the first listening test, Regions 2 and 3 were selected for further examination and subdivided into individual 1-octave bands to identify the frequency ranges associated with the two perceptual attributes in greater detail. Region 2 was divided into Region 2-1 (710–1420 Hz) and Region 2-2 (1420–2840 Hz), while Region 3 was divided into Region 3-1 (2840–5680 Hz) and Region 3-2 (5680–11,360 Hz). By comparing Pleasantness and Coolness rating trends using stimuli with independently amplified or attenuated SPLs in each subregion, the frequency ranges and directions of SPL change associated with the two perceptual attributes were further specified.
2.1.2. Preparation of Frequency-Modified HVAC Sounds and Verification of Their Acoustic Characteristics
To compare Pleasantness and Coolness in response to frequency-specific SPL changes, listening-test stimuli were prepared by amplifying or attenuating the SPL in each of the previously defined frequency regions of the original HVAC sound. To enable participants to perceive differences in acoustic characteristics resulting from frequency-specific SPL changes and evaluate the corresponding perceptual attributes, modification levels of +6 dB and −6 dB relative to the original sound were selected, corresponding to sound pressure amplitude ratios of approximately 2 and 0.5, respectively. A previous study evaluating the subjective sound quality of automotive HVAC sound under SPL modifications also applied ±6 dB changes relative to the original cooling sound [23]. In the present study, the same amplification and attenuation conditions were applied to each frequency region to compare Pleasantness and Coolness rating trends according to the direction of SPL change. The preparation process for the frequency-modified HVAC sounds is illustrated in Figure 2.
Figure 2.
Preparation process for frequency-modified HVAC sounds.
Figure 2 illustrates an example of applying an amplification profile to the frequency characteristics of the original sound. The frequency-modified stimuli were prepared by applying the specified amplification or attenuation conditions to the target frequency regions, while the SPLs in non-target regions, excluding the transition regions, were maintained at their original levels. Transition regions were introduced at the boundaries between the target and adjacent frequency regions to prevent abrupt SPL changes, with the magnitude of the SPL modification gradually decreasing outward from the boundaries of the target region. This approach was intended to mitigate abrupt SPL changes between frequency regions and reduce unnatural changes in timbre that could arise during amplification and attenuation. To examine the extent to which the frequency-specific modifications affected the overall sound level, the A-weighted overall sound pressure level (OSPL) was also calculated for the original and modified stimuli. The OSPL of the original HVAC sound was 48.32 dBA, while the changes in OSPL for the modified stimuli ranged from −1.355 to +2.215 dBA relative to the original sound, with some modified stimuli showing changes of less than 1 dBA. Thus, the overall-level changes remained within 3 dB across the modified stimuli.
To verify whether the frequency-modified HVAC sounds used in the listening tests exhibited the intended SPL changes within the specified frequency ranges, the time–frequency distributions of A-weighted SPL were analyzed for the original, amplified, and attenuated sounds. Figure 3 presents the acoustic characteristics of the sounds modified in Region 2 as a representative example. In Figure 3, the horizontal and vertical axes represent time and frequency, respectively, while the color indicates the A-weighted SPL at each time–frequency point. Higher SPLs are represented by shades of red and lower SPLs by shades of blue, with the same color scale applied to all three sounds. Compared with the original sound in Figure 3a, the SPL in Region 2 was higher in Figure 3b, where a +6 dB modification was applied, and lower in Figure 3c, where a −6 dB modification was applied. The same amplification and attenuation procedures were applied to the remaining frequency regions, and the resulting stimuli were used to evaluate Pleasantness and Coolness in response to frequency-specific SPL changes.
Figure 3.
Acoustic characteristics of the original HVAC sound and sounds modified in Region 2 (710–2840 Hz): (a) original sound; (b) amplified sound; (c) attenuated sound. The black rectangular frames highlight the frequency range for visual comparison of the spectrograms.
2.1.3. Listening Test Setup and Procedures
The listening tests in this study were conducted using automotive HVAC sounds, with detailed conditions, including the rating scale, listening environment, and evaluation procedures, established with reference to automotive sound quality listening test guidelines [36]. Although the listening-test stimuli and comparison conditions differed across the research stages, the same listening environment and rating scale were used to compare Pleasantness and Coolness rating trends under consistent evaluation conditions. The composition of the listening-test stimuli and their presentation conditions were determined according to the purpose of each test, and the basic listening test setup and an example of the rating scale are illustrated in Figure 4.
Figure 4.
Listening test method: (a) experimental setup; (b) example of the rating questionnaire.
As shown in Figure 4a, the listening tests were conducted by having participants listen to the test stimuli through headphones and then rate the perceptual attributes using an evaluation device. Each participant completed the listening test individually in a quiet indoor environment to minimize the influence of external noise, and headphone-based listening was employed to reduce the effects of room acoustics and listening position. An AUDINST HUD-mini headphone amplifier and Sennheiser HD620S headphones were used for sound reproduction. Prior to the listening tests, the sound pressure level reproduced through the headphone playback system was measured to establish a consistent presentation condition. The reference sound was reproduced using the same playback system employed in the listening tests, and the resulting presentation level was measured as 48.0 dBA, which was comparable to the OSPL of 48.32 dBA for the original HVAC sound. To ensure reproducibility of the listening conditions, the headphone playback level was checked prior to the listening tests, and the same headphones, headphone amplifier, and output settings were maintained throughout all evaluations.
Before the listening tests, the evaluation procedure was explained to the participants, and dictionary definitions of Pleasantness and Coolness were provided to facilitate their understanding of the rating criteria for each attribute. For the Coolness evaluation, participants were specifically instructed to rate the auditory impression of coolness evoked by the HVAC sound rather than a thermal sensation resulting from actual temperature or airflow. Because the stimuli were reproduced through headphones in a quiet indoor environment, no airflow or temperature change was presented during the evaluation. A 9-point scale based on the semantic differential method (SDM) was used to evaluate Pleasantness and Coolness. The semantic differential method quantifies subjective perceptions by placing opposing adjectives at the two ends of a rating scale. In this study, the bipolar adjective pairs were defined as “unpleasant–pleasant” for Pleasantness and “warm–cool” for Coolness. Figure 4b presents an example of the rating scale for Pleasantness, and the same 9-point scale format was applied to Coolness, with scores ranging from 1 to 9 such that higher scores indicated greater perceived Pleasantness or Coolness, respectively.
Each listening-test stimulus was approximately 5 s long, and the presentation order of the test stimuli was randomized to reduce the influence of presentation order on the ratings. Participants were not informed which frequency regions had been amplified or attenuated, nor were they told that the frequency regions evaluated in the second listening test were subdivisions of those examined in the first listening test. Each stimulus was therefore evaluated without prior information regarding the applied frequency modification. The first and second listening tests were conducted as separate evaluation sessions rather than consecutively within a single session, thereby reducing the possibility of an immediate carryover effect between the two evaluation stages. In the listening tests of frequency-modified HVAC sounds, the original sound without SPL modification was used as the reference sound and was presented before each evaluation. Participants then rated the Pleasantness and Coolness of the amplified or attenuated sound in comparison with the reference sound. In addition, the number of stimuli in each listening test was determined by considering participant burden and fatigue associated with prolonged listening.
Evaluation 1-1 included 51 participants, whereas Evaluations 1-2, 2-1, and 2-2 each included 30 participants. The demographic characteristics of the participants in each evaluation are summarized in Table 1. Participants were recruited primarily from engineering-related groups within the university, resulting in relatively high proportions of male participants and participants aged 19–29 years. Before each evaluation, participants were asked whether they had any hearing problems or other conditions that could affect listening, and all reported no hearing difficulties. Some participants took part in more than one listening evaluation; however, the participant groups were not identical across all evaluation stages. Accordingly, each evaluation stage was analyzed separately.
Table 1.
Demographic characteristics of participants in each listening evaluation.
2.1.4. Analysis of Perceptual Attributes Across Frequency Regions in the First Listening Test
In the first listening test, the distributions of Pleasantness and Coolness ratings were compared under SPL amplification and attenuation conditions in Regions 1, 2, and 3, and the results are presented as boxplots in Figure 5. The lower and upper edges of each box represent the first quartile (Q1) and third quartile (Q3), respectively, while the line inside the box indicates the median and the × symbol represents the mean. The interquartile range (IQR) was defined as the difference between Q3 and Q1, and ratings below Q1 − 1.5 × IQR or above Q3 + 1.5 × IQR were classified as outliers. The rating distributions, mean, median, and IQR were used to describe the overall perceptual trends. No inferential statistical tests were performed; therefore, the observed differences were interpreted as perceptual trends rather than statistically significant effects.
Figure 5.
Perceptual ratings in response to SPL changes across frequency regions in the first listening test: (a) Pleasantness; (b) Coolness.
In Figure 5a, both the mean and median Pleasantness ratings were higher under the attenuation condition (orange) than under the amplification condition (blue) in all three frequency regions, although the rating distributions for the two conditions partially overlapped. Although the rating distributions varied across frequency regions, a consistent trend toward higher Pleasantness ratings under attenuation was observed. In Figure 5b, the median Coolness ratings differed between the amplification and attenuation conditions in Region 1, whereas the mean ratings were similar and the rating distributions for the two conditions overlapped substantially. In contrast, in Regions 2 and 3, both the mean and median Coolness ratings were higher under the amplification condition than under the attenuation condition, showing a trend toward higher Coolness ratings with SPL amplification in these higher-frequency regions. Overall, Pleasantness showed a consistent tendency to increase under attenuation across all evaluated frequency regions, whereas the relationship between Coolness and the direction of SPL change varied among regions. Based on these observed trends, Regions 2 and 3 were selected for further subdivision in the second listening test.
To examine whether the rating trends observed in Figure 5 were also evident across the first-stage listening evaluations, the directional trends associated with SPL amplification and attenuation in each frequency region were compared and summarized in Table 2. Although the stimulus-presentation procedure was refined between the evaluations, the same frequency regions and SPL-modification levels were maintained. Pleasantness ratings tended to be higher under the attenuation condition than under the amplification condition in all three regions, whereas Coolness ratings tended to be higher under the amplification condition in Regions 2 and 3. Because both perceptual attributes exhibited consistent directional rating trends in Regions 2 and 3, these regions were subdivided into individual 1-octave bands for the second listening test to identify the specific frequency ranges associated with Pleasantness and Coolness in greater detail.
Table 2.
Summary of Pleasantness and Coolness rating trends across frequency regions in the first-stage listening evaluations.
2.1.5. Analysis of Perceptual Attributes Across Subregions in the Second Listening Test
To examine how Pleasantness and Coolness ratings varied across the constituent frequency bands of Regions 2 and 3, both of which showed directional rating trends according to SPL change in the first listening test, a second listening test was conducted. For this purpose, the two regions were subdivided into individual 1-octave bands, and Pleasantness and Coolness ratings were compared using stimuli prepared by separately amplifying or attenuating the SPL in each of the four subregions (Regions 2-1, 2-2, 3-1, and 3-2). The listening test results for the subregions are presented in Figure 6.
In Figure 6a, Region 2-1 showed similar mean and median Pleasantness ratings under the amplification and attenuation conditions, while the interquartile range was wider under the attenuation condition. In contrast, in Region 2-2, both the mean and median Pleasantness ratings were higher under the attenuation condition than under the amplification condition, with a relatively narrow interquartile range located at higher rating values, showing a trend toward higher Pleasantness ratings under SPL attenuation. In Region 3-1, the attenuation condition also showed a slightly higher mean rating and a narrower interquartile range, although the difference in median ratings was small. In Region 3-2, the highest-frequency subregion, the mean and median ratings were similar between the two conditions, and their interquartile ranges overlapped substantially. These results indicate a tendency for higher Pleasantness ratings under SPL attenuation in Regions 2-2 and 3-1, whereas the differences in ratings between the amplification and attenuation conditions were relatively small in the other two subregions.
Figure 6.
Perceptual ratings in response to SPL changes across frequency subregions in the second listening test: (a) Pleasantness; (b) Coolness.
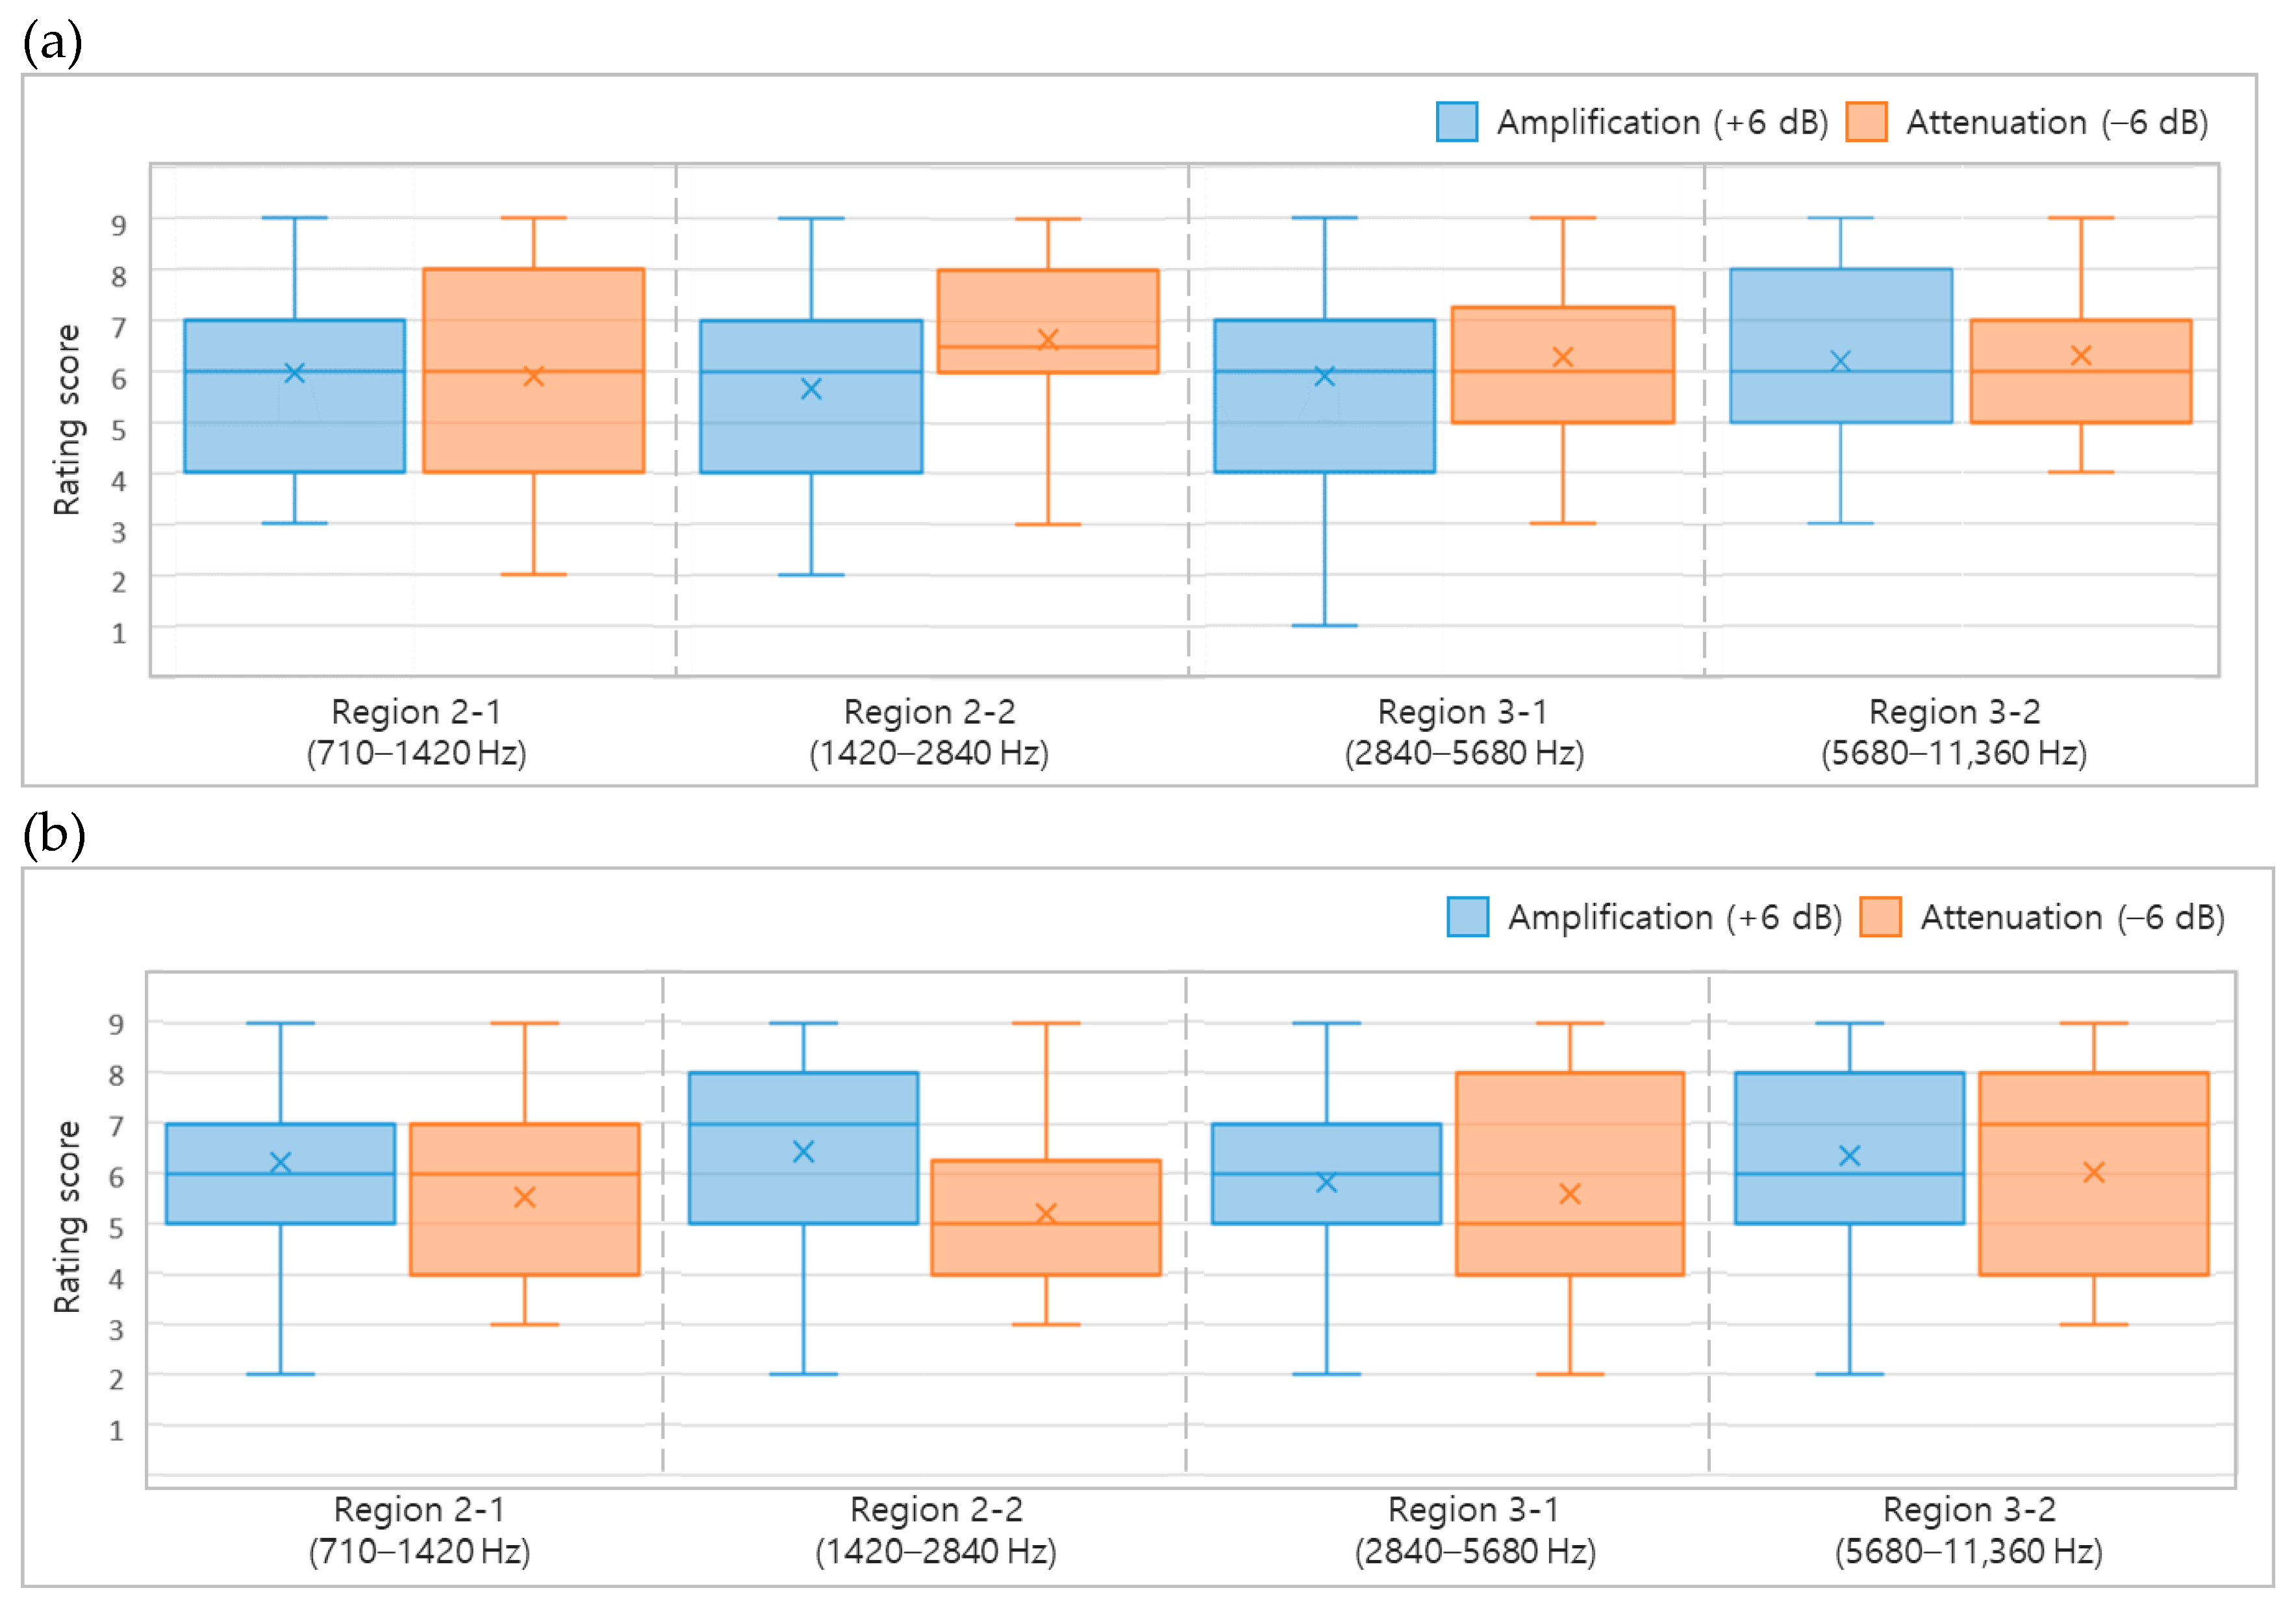
In Figure 6b, Region 2-1 showed a higher mean Coolness rating under the amplification condition than under the attenuation condition, although the median ratings were similar and the interquartile range under attenuation was relatively wide and extended toward lower ratings. In Region 2-2, both the mean and median Coolness ratings were higher under the amplification condition than under the attenuation condition, showing a trend toward higher Coolness ratings under SPL amplification. In contrast, in Regions 3-1 and 3-2, the mean Coolness ratings were slightly higher under the amplification condition than under the attenuation condition, but the interquartile ranges for the two conditions overlapped substantially. In particular, the difference in median ratings was also small in Region 3-2, the highest-frequency subregion. Accordingly, Coolness ratings tended to be higher under the amplification condition in Regions 2-1 and 2-2, whereas the substantial overlap in rating distributions in Regions 3-1 and 3-2 made it difficult to identify a consistent trend associated with the direction of SPL change.
To examine whether the rating trends observed across the frequency subregions in Figure 6 were also evident across the second-stage listening evaluations, the directional trends associated with SPL amplification and attenuation in each subregion were compared and summarized in Table 3. The listening test results showed higher Pleasantness ratings under SPL attenuation in Regions 2-2 and 3-1, whereas higher Coolness ratings were observed under SPL amplification in Regions 2-1 and 2-2. Notably, higher Coolness ratings were observed when the SPL was amplified across the entire Region 3 in the first listening test, whereas neither of its two constituent 1-octave bands showed a consistent rating trend in the second listening test, indicating a difference in the results obtained for the combined frequency region and its subregions. This difference may reflect the combined spectral contribution of the broader Region 3, whereas subdivision into narrower bands altered the spectral energy distribution and band boundaries evaluated in each stimulus. Accordingly, the frequency ranges and directions of SPL change to be incorporated into the subsequent acoustic control design were determined based on the rating trends identified in the second listening test. On this basis, Regions 2-2 and 3-1 were designated as the attenuation regions for Pleasantness, while Region 2-1 was designated as the amplification region for Coolness. The rationale for selecting the target frequencies for each acoustic control method is described in Section 2.2.
Table 3.
Summary of Pleasantness and Coolness rating trends across frequency subregions in the second-stage listening evaluations.
2.2. Design of Acoustic Control Methods
2.2.1. Selection of Target Frequencies for the Silencer
The structural target frequencies for the silencer were selected by considering the perceptual characteristics identified through the listening tests together with the acoustic modal characteristics of the HVAC duct. Sound propagation within the duct is frequency dependent, and above the corresponding cutoff frequencies, higher-order acoustic modes characterized by transverse pressure variations in the width and height directions can propagate along the duct. These modes alter the sound pressure distribution across the duct cross-section and can therefore affect the frequency-dependent attenuation performance of the silencer. Accordingly, the cutoff frequencies and acoustic modal characteristics of the duct were analyzed based on its cross-sectional geometry to determine appropriate target frequencies within the perceptually relevant attenuation regions.
Figure 7 illustrates the plane-wave mode and the first-order acoustic modes in the horizontal and vertical directions of a rectangular duct cross-section. In the plane-wave mode, the sound pressure distribution is uniform across the duct cross-section, with no variation in the transverse directions. In contrast, in the first-order horizontal mode, the sound pressure distribution varies across the width of the duct, with a pressure node at the center of the cross-section where the sound pressure is zero and the sound pressures on opposite sides of the node are in opposite phase. Similarly, in the first-order vertical mode, the sound pressure distribution varies along the height of the duct, with the sound pressures above and below the central pressure node in opposite phase. Because these first-order horizontal and vertical modes can propagate along the duct above their respective cutoff frequencies, Equation (1) was used to calculate the cutoff frequencies of the rectangular duct.
Here, is the cutoff frequency, is the speed of sound, and are the width and height of the rectangular duct cross-section, respectively, and and are the acoustic mode orders in the corresponding directions. The cutoff frequencies were calculated by substituting the mode orders corresponding to the first-order horizontal and vertical modes into Equation (1), and the frequencies and sound pressure distributions of the acoustic modes within the duct were identified using the modal acoustics analysis in ANSYS Workbench 2024 R2. For the numerical modal analysis, the internal air domain of the main duct was modeled using the default Air properties in ANSYS. No external acoustic excitation or damping was applied, and the acoustic domain was discretized using a 3 mm mesh. Eigenmodes were calculated up to 5000 Hz, and the resulting modal frequencies and sound pressure distributions were compared with the theoretical cutoff frequencies calculated from the rectangular duct geometry. The results of these analyses and the target frequencies selected for the silencer based on them are summarized in Table 4.
Figure 7.
Plane-wave and first-order acoustic mode shapes in a rectangular duct.
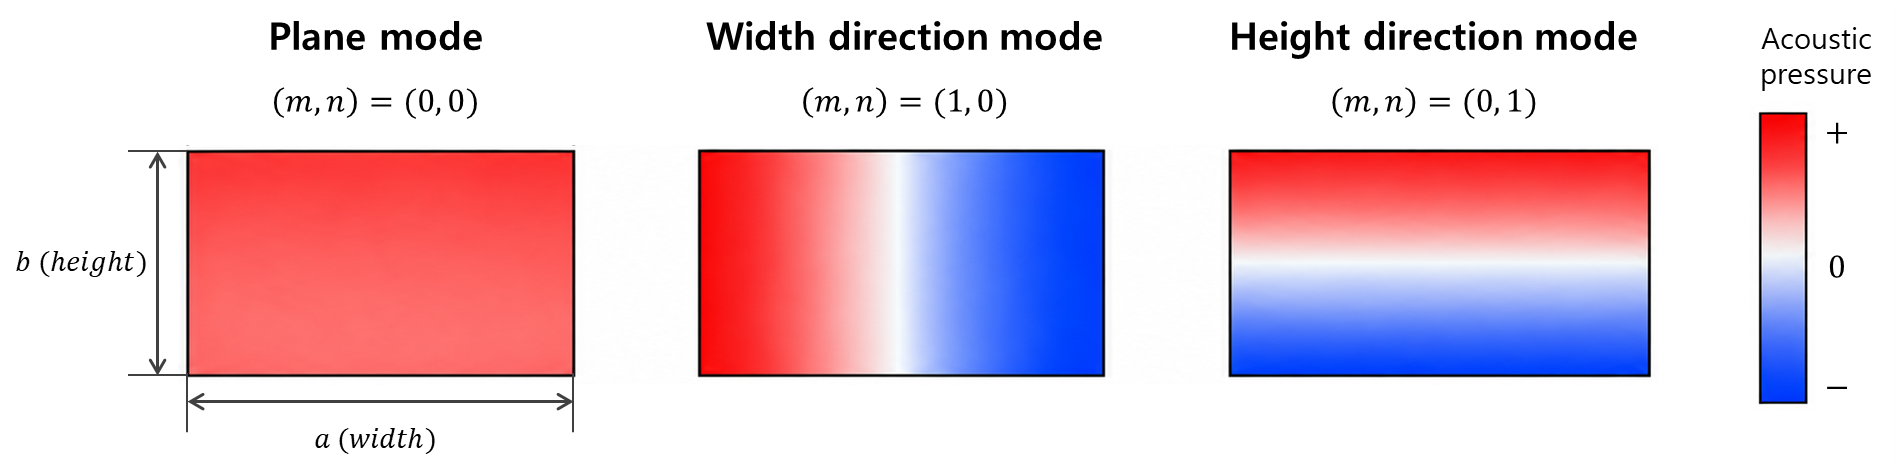
Table 4.
Acoustic modal characteristics of the HVAC duct and selected target frequencies for the silencer.
As shown in Table 4, the theoretical cutoff frequencies for the width and height directions of the rectangular duct cross-section were calculated as 1905 Hz and 2858 Hz, respectively, while the corresponding first-order acoustic mode frequencies identified by the Modal Acoustics analysis were 2100 Hz and 3010 Hz. Although the theoretical cutoff frequencies and numerical modal frequencies were not identical, both results indicated similar frequency ranges associated with the transition from plane-wave propagation to higher-order acoustic modes in the corresponding directions. Above these cutoff frequencies, higher-order modes can produce transverse variations in the sound-pressure distribution within the duct, which may influence the frequency-dependent attenuation characteristics of the silencer. Therefore, the acoustic modal characteristics of the duct were considered together with the frequency ranges associated with Pleasantness when determining the target frequencies.
The multi-cell silencer was designed with reference to previous studies [11,37], in which unit cells with different acoustic path characteristics were combined to address multiple target frequencies within a single structure. Based on this design concept, 1500 Hz and 2500 Hz were selected as the structural target frequencies by considering both the perceptually relevant attenuation region and the acoustic modal characteristics of the HVAC duct. Specifically, both frequencies were located within Region 2-2 (1420–2840 Hz), where SPL attenuation was associated with higher Pleasantness ratings, while remaining below the cutoff frequencies in the width and height directions, respectively. Thus, the selected target frequencies simultaneously reflected the perceptual characteristics identified through the listening tests and the modal characteristics of the duct. In addition, Region 3-1 (2840–5680 Hz), where SPL attenuation was also associated with higher Pleasantness ratings, was also identified as a perceptually relevant attenuation region. The attenuation characteristics observed in this region for the final silencer configuration are presented and discussed in Section 3.1.
2.2.2. Development of the Multi-Cell Silencer
To attenuate sound transmitted through the duct at the previously selected target frequencies, a multi-cell silencer was designed with reference to the labyrinth-type acoustic structures reported in previous studies [11,37]. Different acoustic path lengths were assigned to the unit cells corresponding to the target frequencies of 1500 Hz and 2500 Hz, and the required path lengths were accommodated within the limited installation space through the unit-cell geometry. The unit cells corresponding to the two target frequencies were then integrated into a single multi-cell silencer. The overall configuration of the multi-cell silencer and the geometry of the unit cells are illustrated in Figure 8.
Figure 8.
Schematic of the multi-cell silencer and geometry of a labyrinthine unit cell. The blue arrows indicate the flow direction, while the orange dashed arrow indicates the unit cell length.
As shown in Figure 8, the silencer consists of multiple unit cells arranged along the sound transmission path of the duct, and the acoustic path length of each unit cell was determined by considering the phase delay characteristics required at the target frequencies. To this end, the sound pressure and particle velocity for unit cells with different acoustic path lengths were calculated using the finite element method (FEM) and subsequently used in the transfer matrix method (TMM) to derive the phase delay characteristics of each unit cell. Based on the resulting phase delay characteristics, the acoustic path lengths of the unit cells were determined for the corresponding target frequencies. The spacing between the unit cells was then determined using generalized Snell’s law, considering the incidence angle, reflection angle, wavelength at the target frequency, and phase-delay difference between adjacent unit cells to control the propagation direction of sound waves at the target frequencies. In addition, a curved inlet geometry was applied to reduce abrupt changes in the direction of the incoming airflow at the unit-cell inlets, and the multi-cell structure was configured based on the determined acoustic path lengths, unit-cell spacing, and inlet geometry. The configuration of the silencer designed for the target frequencies and the corresponding acoustic analysis results are presented in Figure 9.
Figure 9.
Configuration and acoustic analysis results of the multi-cell silencer: (a) unit-cell arrangement for the target frequencies; (b) transmission loss.
As shown in Figure 9a, the left and right unit cells were designed to provide the phase delay characteristics required at 1500 Hz, while the upper and lower unit cells were designed for those required at 2500 Hz. For each target frequency, a six-cell labyrinthine structure was designed. The basic unit-cell dimensions were 16 × 17 mm for the 1500 Hz structure and 8 × 21 mm for the 2500 Hz structure. For both structures, the inlet width was 3 mm, the internal passage thickness was 1 mm, and a radius of 2 mm was applied to the curved sections. The acoustic path lengths of the six unit cells were 8.75, 9.7, 10.0, 10.3, 10.8, and 13.0 mm for the 1500 Hz structure, and 9.9, 10.3, 10.35, 10.4, 10.5, and 11.0 mm for the 2500 Hz structure. A phase difference of 30° was assigned between adjacent unit cells, resulting in unit-cell spacings of 19.06 mm and 11.43 mm for the 1500 Hz and 2500 Hz structures, respectively.
To analyze the acoustic attenuation characteristics of the multi-cell structure itself, ANSYS Harmonic Acoustics analysis was performed before the addition of sound-absorbing material and breathable fabric mesh. The internal air domain of the duct and silencer was modeled using the default Air properties in ANSYS. The analysis was performed from 0 to 4000 Hz at 5 Hz intervals. A normal surface velocity of 1 m/s was applied at the inlet as a reference acoustic excitation, and Ports were defined at the inlet and outlet to evaluate the acoustic transmission characteristics. Radiation boundary conditions were applied to reduce undesired acoustic reflections. The acoustic domain was discretized using a 2 mm mesh in the multi-cell region and a 3 mm mesh in the main duct. Transmission loss (TL), which expresses the ratio of the acoustic power incident at the silencer inlet to the acoustic power transmitted through the outlet on a logarithmic scale, was calculated from the inlet and outlet Port responses [38]. Thus, the TL results represent the attenuation characteristics of the multi-cell structure alone. As shown in Figure 9b, the unit cells designed for each target frequency exhibited increased TL near their respective target frequencies, while the combined multi-cell structure exhibited acoustic attenuation near both 1500 Hz and 2500 Hz.
Based on the multi-cell structure used in the acoustic analysis, the silencer was fabricated from acrylonitrile butadiene styrene (ABS) using 3D printing. The labyrinthine multi-cell structure served as the primary acoustic-control structure, whereas the sound-absorbing material and breathable fabric mesh were incorporated as auxiliary elements for operation under HVAC airflow conditions. This configuration was adopted to account for flow-related acoustic effects that may arise as airflow passes through and around the silencer structure. Previous studies have shown that sound-absorbing, porous, and permeable materials under airflow conditions can influence material behavior, flow structures, and sound–flow interactions, including turbulence-related noise, vortex shedding, acoustic amplification, and whistling [11,39,40,41,42]. Based on these considerations, a small amount of sound-absorbing material composed of 100% polyester was placed inside the unit cells, and a breathable blended-fiber mesh composed of 80% nylon and 20% polyurethane was installed over the unit-cell inlets. These auxiliary elements were incorporated to account for the acoustic environment associated with HVAC airflow rather than as independently tuned elements for attenuation within a specific additional frequency region.
2.2.3. Development of the ASD Signal
Based on the frequency characteristics associated with Coolness identified in the listening tests, an ASD signal was developed to add acoustic components to a specific frequency range of the HVAC sound. In the second listening test, higher Coolness ratings were associated with SPL amplification in Regions 2-1 (710–1420 Hz) and 2-2 (1420–2840 Hz), whereas higher Pleasantness ratings were also associated with SPL attenuation in Region 2-2, indicating that the two perceptual attributes were associated with opposite directions of SPL change in this subregion. Accordingly, Region 2-1 was selected as the target frequency range for the ASD signal because it showed a trend toward higher Coolness ratings under SPL amplification without overlapping the frequency regions designated for silencer attenuation to improve Pleasantness. The ASD approach was implemented as additive sound enhancement in the target frequency range rather than as antiphase noise cancellation, and phase was not treated as an independent control variable.
Pink noise, which has equal acoustic energy in each octave band, was used as the source signal, and frequency filtering was applied to concentrate the acoustic components within the target frequency range. The filter passband was set to Region 2-1, while components in adjacent frequency regions were attenuated. The frequency-domain design process for the pink-noise-based ASD signal is illustrated in Figure 10. Based on the frequency characteristics of pink noise, the filter frequency response was configured to retain acoustic components in Region 2-1 while attenuating components outside this region. To prevent abrupt changes in the frequency response at the boundaries between the target frequency range and adjacent regions, transition regions were introduced at both boundaries. Within these transition regions, the normalized magnitude response of the filter was configured to decrease gradually outward from the boundaries of the target frequency range. Finally, the resulting filter was applied to pink noise to generate an ASD signal with acoustic components concentrated primarily in Region 2-1.
Figure 10.
Frequency-domain design process for the ASD signal.
2.3. Experimental Setup for Acoustic Performance Evaluation
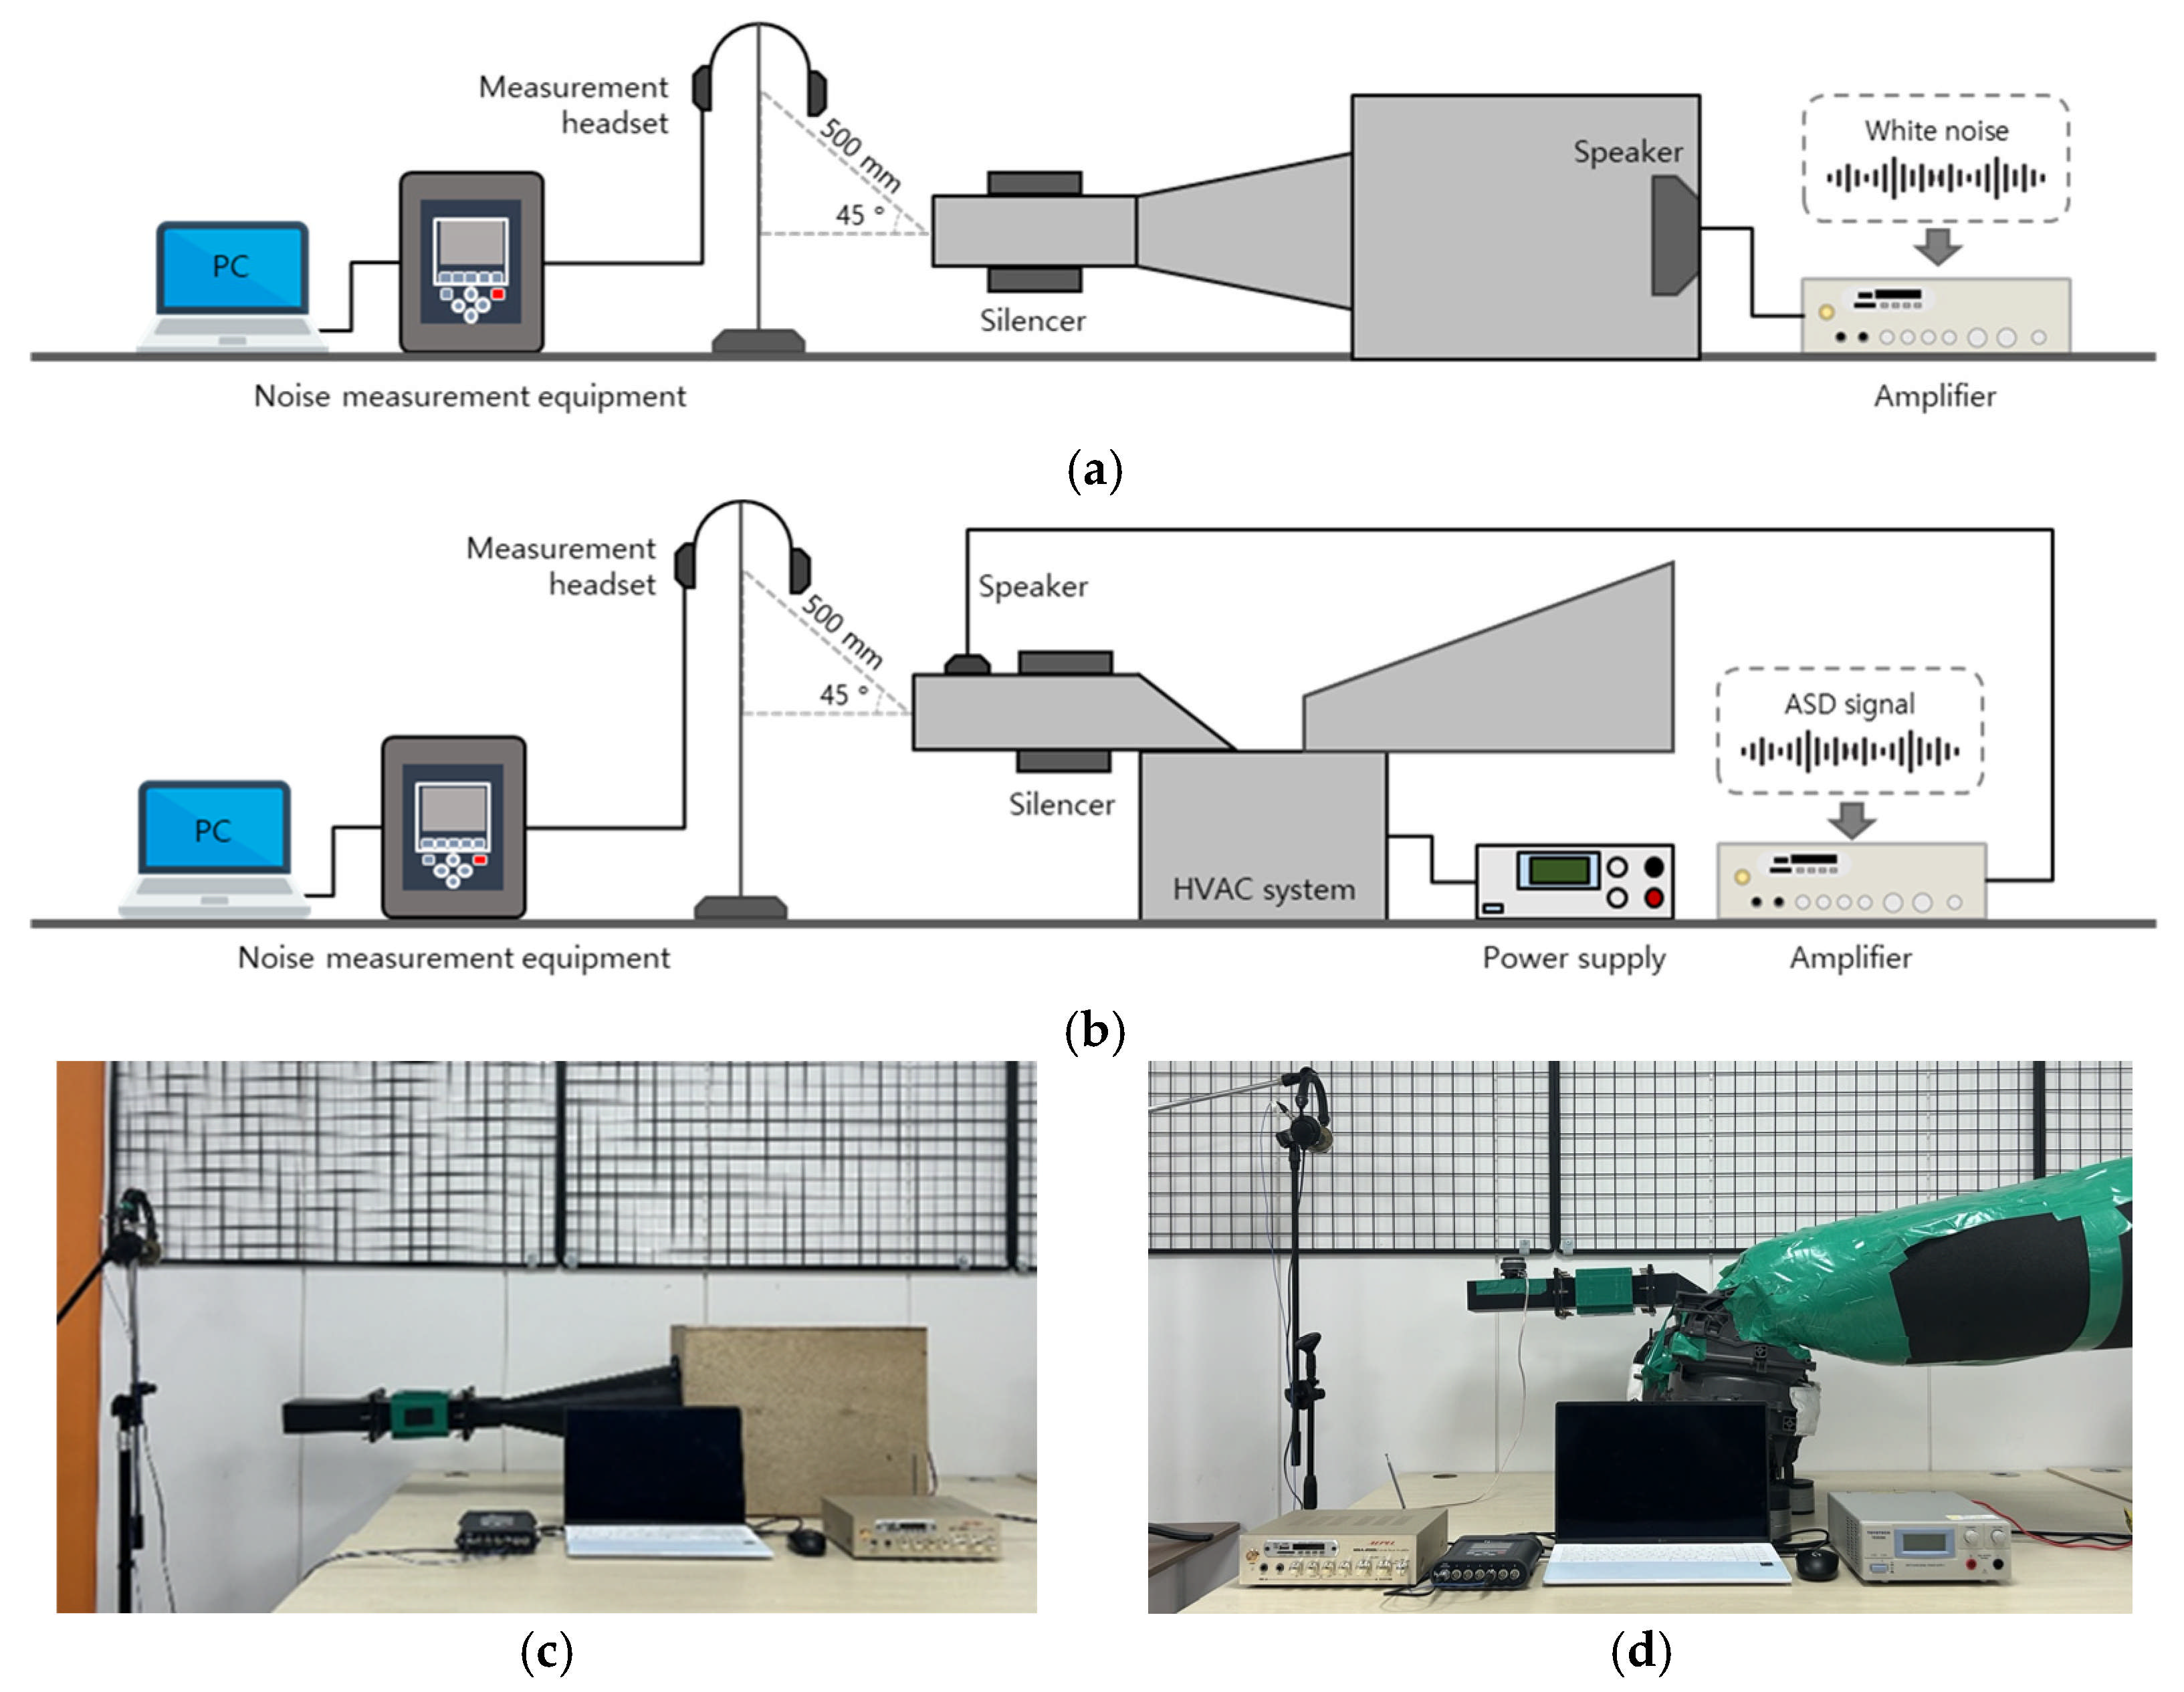
Two experimental setups, a speaker test and an HVAC rig test, were established to evaluate the acoustic characteristics associated with silencer installation and ASD signal playback. The speaker test was conducted to evaluate the frequency-dependent acoustic attenuation characteristics of the silencer without the influence of HVAC operation or airflow, whereas the HVAC rig test was configured to evaluate the acoustic characteristics of the silencer and ASD signal under individual and combined application conditions with the HVAC system operating. The schematic diagrams and physical configurations of the two experimental setups are presented in Figure 11.
As shown in Figure 11a,c, the speaker test was configured to reproduce a test signal through a speaker and compare the acoustic signals measured with and without the silencer installed in the duct connecting the speaker to the outlet. A speaker (MARSHALL SOUND, K-8010WS, Anyang, Republic of Korea) and an audio amplifier (AEPEL, MSA-200U, Paju, Republic of Korea) were used for the test, with white noise serving as the test signal to evaluate the acoustic attenuation characteristics of the silencer over a broad frequency range. The acoustic signals were measured using a HEAD acoustics SQuadriga II acoustic measurement system and a BHS II measurement headset. The measurement headset was positioned 500 mm from the center of the outlet at an angle of 45° relative to the outlet centerline, and acoustic signals were measured three times under each test condition to examine measurement repeatability.
As shown in Figure 11b,d, the HVAC rig test was configured using an HVAC system and a simplified rectangular outlet duct with cross-sectional dimensions of 60 mm × 90 mm. The duct was fabricated from ABS using 3D printing and configured so that the straight pipe and silencer could be installed interchangeably at the same mounting position. An additional duct section was installed downstream of the silencer to reduce the influence of discharge-flow turbulence on the acoustic attenuation evaluation. For ASD signal playback, the signal was amplified using the same audio amplifier as in the speaker test and reproduced through a 3-inch full-range speaker (SOTAMIA, 4 Ω, 25 W), which was flush-mounted with its radiating surface aligned with the inner wall of the duct to minimize its influence on airflow within the duct. The ASD speaker was installed 10 cm from the HVAC outlet. A single fixed amplifier output setting was used throughout the ASD measurements to maintain a consistent playback condition, and the applied ASD condition was characterized by the acoustic response measured under the same measurement conditions.
Figure 11.
Experimental setups for acoustic performance evaluation: (a) schematic of the speaker test; (b) schematic of the HVAC rig test; (c) speaker test setup; (d) HVAC rig test setup.
The tests comprised comparisons with and without the silencer, ASD signal playback alone, and the combined application of the two acoustic control methods. For the comparison with and without the silencer, acoustic signals were measured while the HVAC system was operating, whereas the acoustic characteristics of the ASD signal alone were evaluated by playing the ASD signal with the HVAC system turned off. Under the combined application condition, the silencer was installed and the ASD signal was played back while the HVAC system was operating. For tests conducted with the HVAC system operating, the blower speed was set to a medium level to compare the acoustic changes associated with the application of the acoustic control methods under consistent operating conditions. To examine the airflow condition associated with silencer installation, airflow velocity was measured at the same location and under the same blower operating condition for the straight-pipe and silencer-installed configurations. The silencer was designed to maintain an effective main-flow cross-sectional area equivalent to that of the straight duct, and the blower-motor voltage and current were also checked under both configurations. Acoustic signals were measured three times under each test condition to examine measurement repeatability.
The measured airflow velocities were 5.2 m/s for the straight-pipe condition and 5.3 m/s for the silencer-installed condition. Because the effective main-flow cross-sectional area was maintained at 60 mm × 90 mm (0.0054 m2) for both configurations, the corresponding volumetric flow rates were estimated using , where , , and denote the volumetric flow rate, flow cross-sectional area, and measured airflow velocity, respectively. The estimated volumetric flow rates were approximately 0.0281 m3/s for the straight-pipe condition and 0.0286 m3/s for the silencer-installed condition, indicating comparable airflow delivery under the tested medium-blower condition. Because the airflow velocity was measured at a single location rather than through a full outlet velocity traverse, these values were interpreted as comparative estimates rather than direct measurements of the total volumetric flow rate. The blower-motor voltage and current also remained at similar levels between the two configurations. Taken together, the measured airflow velocities, estimated volumetric flow rates, and blower-motor electrical operating conditions indicate that the airflow delivery remained comparable following silencer installation under the tested medium-blower condition.
3. Results
3.1. Acoustic Characteristics of the Silencer
To evaluate the acoustic attenuation characteristics of the fabricated silencer, the frequency-dependent SPLs measured under the straight-pipe and silencer-installed conditions were compared in both the speaker test and HVAC rig test, and the results are presented in Figure 12. The straight pipe was installed at the same mounting position as the silencer to maintain the duct connection and served as the reference condition without acoustic treatment. Insertion loss (IL) was calculated by subtracting the SPL measured under the silencer-installed condition from that measured under the straight-pipe condition. In this study, the term SPL difference refers to the frequency-dependent change in measured SPL between the compared acoustic configurations. For the speaker test, the same test signal and measurement conditions were maintained between the two configurations, whereas for the HVAC rig test, the same HVAC operating and measurement conditions were maintained. Higher IL values indicate greater SPL attenuation resulting from silencer installation [43].
Figure 12.
Results of the acoustic performance evaluation of the silencer: (a) speaker test; (b) HVAC rig test.
As shown in Figure 12a, the speaker test results showed lower SPLs under the silencer-installed condition than under the straight-pipe condition in frequency ranges including the target frequencies of 1500 Hz and 2500 Hz. Because the speaker test was conducted before the addition of the sound-absorbing material and breathable fabric mesh, the attenuation observed near the target frequencies was attributed primarily to the acoustic effect of the multi-cell structure. This result showed a frequency-dependent attenuation trend consistent with the increase in transmission loss (TL) observed near both target frequencies in the Harmonic Acoustics analysis presented in Section 2.2.2. Because the TL and experimental SPL/IL results were obtained using different definitions and test conditions, they were not treated as directly equivalent quantitative values; instead, their frequency-dependent attenuation characteristics were compared.
In the HVAC rig test shown in Figure 12b, SPLs decreased overall at frequencies above approximately 750 Hz following silencer installation, with attenuation observed in frequency ranges including Regions 2-2 (1420–2840 Hz) and 3-1 (2840–5680 Hz), where the listening tests showed a trend toward higher Pleasantness ratings under SPL attenuation. Compared with the speaker test, in which attenuation was observed primarily around the two structural target frequencies, the HVAC rig test showed broader SPL attenuation extending into Region 3-1. As described in Section 2.2.2, the HVAC rig test was conducted using the final silencer configuration, which included the multi-cell structure together with the added polyester sound-absorbing material and breathable blended-fiber mesh under HVAC airflow conditions. Therefore, the broader attenuation observed in the HVAC rig test was interpreted as the overall acoustic performance of the final silencer configuration under HVAC operating conditions rather than as the isolated contribution of any individual component. In addition, the attenuation extended partially into Region 2-1 (710–1420 Hz), which was associated with higher Coolness ratings under SPL amplification in the listening tests.
3.2. Acoustic Characteristics of the ASD Signal
To evaluate the acoustic characteristics of the ASD signal developed to target Region 2-1 (710–1420 Hz), the frequency-dependent SPLs and time–frequency SPL distributions were compared under conditions without and with ASD signal playback (ASD OFF and ASD ON, respectively). This evaluation was conducted with the HVAC system turned off to characterize the spectrum of the ASD signal itself. This comparison was performed to determine whether ASD signal playback increased SPL primarily within the target frequency range, and the results are presented in Figure 13.
Figure 13.
Acoustic characteristics of the ASD signal: (a) frequency-dependent SPL; (b) time–frequency SPL distribution without ASD signal playback; (c) time–frequency SPL distribution with ASD signal playback.
As shown in Figure 13a, SPLs in Region 2-1 were higher under the ASD ON condition than under the ASD OFF condition, showing that the SPL increase produced by the ASD signal was concentrated primarily within the target frequency range. The time–frequency SPL distributions in Figure 13b,c also showed higher SPLs concentrated in Region 2-1 under the ASD ON condition than under the ASD OFF condition, with the increase occurring within a similar frequency range throughout the measurement period. These results showed that the ASD signal generated by applying the target-frequency filter to pink noise produced the intended frequency-selective SPL increase primarily in Region 2-1.
3.3. Acoustic Characteristics of the Combined Application of the Silencer and ASD Signal
After evaluating the individual acoustic characteristics of the silencer and ASD signal, the two acoustic control methods were applied together under HVAC operating conditions to examine the frequency-dependent SPL changes resulting from their combined application. The acoustic attenuation characteristics of the silencer were evaluated by comparing the straight-pipe and silencer-only conditions, whereas the changes resulting from additional ASD signal playback were analyzed by comparing the silencer-only condition with the silencer+ASD condition. The time–frequency SPL distributions of the HVAC sounds measured under each condition are presented in Figure 14.
Figure 14.
Time–frequency SPL distributions of HVAC sound under different acoustic control conditions: (a) straight pipe; (b) silencer; (c) silencer + ASD signal.
A comparison of the straight-pipe and silencer-only conditions in Figure 14a,b showed that silencer installation reduced SPLs over frequency ranges including Region 2-2 (1420–2840 Hz) and Region 3-1 (2840–5680 Hz). This attenuation also extended into Region 2-1 (710–1420 Hz), where SPL amplification was associated with higher Coolness ratings in the listening tests. When the ASD signal was applied together with the silencer, a comparison of Figure 14b,c showed that SPLs in Region 2-1 increased under the combined application condition relative to the silencer-only condition. The OSPL in Region 2-1 increased from 45.11 dBA under the silencer-only condition to 48.51 dBA under the silencer+ASD condition, corresponding to an increase of approximately 3.40 dBA in the target frequency region. In contrast, the reduced SPL distributions resulting from silencer installation were generally maintained in Regions 2-2 and 3-1, showing that the attenuation characteristics in the frequency ranges associated with Pleasantness were generally retained while the target-band SPL in the frequency range associated with Coolness was increased under the combined application condition.
3.4. Listening Test Results for HVAC Sounds Under Acoustic Control Conditions
To evaluate changes in Pleasantness and Coolness under the proposed acoustic-control conditions and to determine whether the trends observed in the frequency-band listening tests were also present after acoustic control, a final listening test was conducted. A total of 30 participants took part in the final listening test, comprising 25 males (83.3%) and 5 females (16.7%). Of these participants, 27 (90.0%) were aged 19–29 years and 3 (10.0%) were aged 30–39 years. The evaluation used HVAC sounds recorded during the HVAC rig test under three conditions: straight pipe, silencer only, and silencer with ASD signal playback. An ASD-only condition was not included because the ASD evaluation focused on its intended effect on Coolness under the silencer-applied condition. Pleasantness was evaluated by comparing the silencer-only condition with the straight-pipe condition to assess the perceptual effect of the silencer, whereas Coolness was evaluated by comparing the silencer+ASD condition with the silencer-only condition to assess the perceptual effect of ASD. The silencer-only condition was used as the reference for the Coolness evaluation so that the perceptual change associated with the addition of ASD could be assessed while maintaining the same silencer-installed HVAC configuration. The reference sound was assigned a rating of 5 in each evaluation, corresponding to the midpoint of the 9-point scale, so that the test sound could be rated relative to the corresponding reference condition. Because different reference sounds were used for the two perceptual attributes, the fixed rating of 5 served only as a relative reference within each evaluation and should not be interpreted as representing the same absolute perceptual level across the two evaluations. Accordingly, the final listening test was designed to evaluate the intended perceptual effect of each acoustic-control method rather than to provide a direct common-reference comparison of Pleasantness and Coolness across all acoustic-control conditions. The rating distributions for the acoustic-control conditions relative to the reference rating are presented in Figure 15.
Figure 15.
Listening test results for HVAC sounds under acoustic control conditions: (a) Pleasantness; (b) Coolness.
As shown in Figure 15a, the mean and median Pleasantness ratings under the silencer-only condition were higher than the reference rating of 5 assigned to the straight-pipe sound, and the interquartile range also lay above the reference rating. Similarly, in Figure 15b, the mean and median Coolness ratings under the combined condition were higher than the reference rating of 5 assigned to the silencer-only sound, with the interquartile range also lying above the reference rating. These results showed a descriptive trend toward higher Pleasantness ratings following silencer installation relative to the straight-pipe reference condition and higher Coolness ratings following the addition of ASD signal playback relative to the silencer-only reference condition. Because the two perceptual attributes were evaluated using different reference conditions, these results represent the respective perceptual changes associated with the silencer and ASD rather than a direct common-reference comparison demonstrating simultaneous improvement in both attributes.
4. Discussion
The frequency characteristics identified through the listening tests were reflected in the design of the silencer and ASD by assigning different target regions according to Pleasantness and Coolness. The silencer was developed as an acoustic-control method for improving Pleasantness, whereas the ASD signal was independently developed as an acoustic-control method for improving Coolness. Based on the frequency-dependent perceptual characteristics identified through the listening tests, the silencer was designed to attenuate the frequency components associated with higher Pleasantness ratings, while the ASD signal was designed to amplify the target frequency region associated with higher Coolness ratings. The HVAC rig results confirmed that the intended attenuation in the frequency regions associated with Pleasantness and the amplification in the target region associated with Coolness were maintained when the proposed acoustic-control methods were applied. These results show that the perceptual characteristics identified through the listening tests could be translated into frequency-specific acoustic control under the tested HVAC condition.
The HVAC rig test showed that the attenuation produced by the final silencer configuration extended beyond the two structural target frequencies and into Region 3-1 (2840–5680 Hz), where SPL attenuation was associated with higher Pleasantness ratings in the listening tests. This broader attenuation was observed after the multi-cell structure was combined with the sound-absorbing material and breathable fabric mesh and evaluated under HVAC airflow conditions. Previous studies have similarly shown that the incorporation of sound-absorbing or permeable elements under airflow conditions can modify the frequency-dependent acoustic response and provide additional acoustic attenuation or losses [11,42]. Accordingly, the attenuation observed in Region 3-1 in the present study is interpreted as part of the overall acoustic response of the final silencer configuration under HVAC operating conditions, rather than as the result of independently tuning the sound-absorbing material or mesh to this frequency region. Importantly, the extension of attenuation into Region 3-1 also corresponded to a perceptually relevant frequency region identified through the listening tests, indicating that the broader acoustic response of the final silencer was consistent with the direction of SPL change associated with higher Pleasantness ratings.
The HVAC rig results also showed that the attenuation produced by the final silencer configuration extended partially into Region 2-1 (710–1420 Hz), although this region was not selected as a structural target frequency range for the silencer. Region 2-1 was independently identified through the listening tests as a frequency range associated with higher Coolness ratings under SPL amplification and was therefore selected as the target range for the ASD signal. Thus, the selection of Region 2-1 for ASD was based on the perceptual characteristics identified through the listening tests rather than on the attenuation produced by the silencer. Nevertheless, because the final silencer configuration also produced partial attenuation within Region 2-1, this spectral overlap should be considered when interpreting the acoustic responses of the silencer and ASD under the same HVAC operating condition. In this respect, the acoustic responses observed under the silencer-only and silencer+ASD conditions reflect the application of two independently designed acoustic-control methods within a partially overlapping spectral range rather than an ASD signal originally designed to compensate for the attenuation produced by the silencer.
The final listening test was conducted to evaluate the respective perceptual effects of the two acoustic-control methods after their application to the HVAC system. The effect of the silencer was assessed in terms of Pleasantness by comparing the straight-pipe and silencer-installed conditions, whereas the effect of ASD was assessed in terms of Coolness by comparing the silencer-only and silencer+ASD conditions. Accordingly, the final listening test examined whether the perceptual trends identified through the frequency-band listening tests were also reflected after application of the corresponding acoustic-control method. Because the two perceptual attributes were evaluated using different reference conditions, the results represent the perceptual change associated with each acoustic-control method within its corresponding evaluation framework rather than a direct common-reference comparison of Pleasantness and Coolness across all acoustic-control conditions. Within this framework, the final listening-test results showed higher Pleasantness ratings following silencer installation and higher Coolness ratings following ASD signal playback, consistent with the respective perceptual objectives used in the development of the two methods.
The listening tests in this study provided a basis for examining frequency-dependent perceptual tendencies associated with Pleasantness and Coolness. In the present study, these tendencies were examined primarily through descriptive statistics; in future studies, the additional use of inferential statistics could provide further insight into the observed perceptual responses. In particular, analyses considering repeated ratings and the ordinal characteristics of the evaluation scale, together with effect sizes and confidence intervals, could provide additional information on the magnitude and consistency of the perceptual changes. Future studies involving larger sample sizes and more systematically controlled participant overlap across evaluation stages would also enable more comprehensive inferential analyses, including analyses of variance where appropriate. In addition, the frequency regions used in the present listening tests were defined based on commonly used one-octave-band divisions, and a single modification magnitude of ±6 dB was applied. Therefore, the identified regions should be interpreted as showing perceptual tendencies under the tested frequency definitions and modification conditions rather than as fixed boundaries independent of modification magnitude, bandwidth, or spectral context. The different Coolness trends observed for the entire Region 3 and its subdivided regions further suggest that perceptual responses may depend on frequency boundaries and interactions among adjacent spectral components. Future studies could therefore examine multiple modification levels, alternative frequency boundaries, and adjacent-region interactions to further evaluate the robustness of the identified perceptual tendencies.
In this study, the silencer and ASD were developed based on the perceptual characteristics identified through the listening tests, and their acoustic and perceptual effects were evaluated under controlled HVAC conditions. Accordingly, the findings of the present study provide a basis for applying perception-based frequency-selective acoustic control to HVAC sound under the tested operating condition. If the proposed approach is extended to practical vehicle applications, evaluations could consider various vehicle and HVAC characteristics, blower operating conditions, cabin listening positions, cabin acoustic characteristics, road and wind noise, interactions with other vehicle sounds, and broader listener populations. Such evaluations could provide a broader basis for applying the proposed perception-based acoustic-control approach under diverse vehicle operating and acoustic conditions.
5. Conclusions
In this study, the frequency regions and directions of SPL change associated with Pleasantness and Coolness in automotive HVAC sound were analyzed through listening tests, and a multi-cell silencer and ASD signal were developed based on the results. The frequency-dependent acoustic characteristics associated with the individual and combined application of the two acoustic control methods were examined, together with the perceptual changes associated with the silencer and ASD in the final listening test. The main findings are summarized as follows.
- (1)
- The frequency-band listening tests showed a trend toward higher Pleasantness ratings under SPL attenuation in Regions 2-2 (1420–2840 Hz) and 3-1 (2840–5680 Hz), whereas Coolness ratings showed a trend toward higher values under SPL amplification in Regions 2-1 (710–1420 Hz) and 2-2 (1420–2840 Hz).
- (2)
- A multi-cell silencer targeting 1500 Hz and 2500 Hz was developed to attenuate SPLs in the frequency ranges associated with Pleasantness, and the acoustic analysis showed increased TL near both target frequencies. The speaker test using the fabricated silencer also showed SPL attenuation in frequency ranges including both target frequencies, while the HVAC rig test showed broader attenuation extending across Regions 2-2 and 3-1. This broader attenuation represents the acoustic performance of the final silencer configuration under HVAC operating conditions, which included the multi-cell structure together with the added polyester sound-absorbing material and breathable blended-fiber mesh.
- (3)
- The ASD signal was developed to target Region 2-1, which was associated with Coolness and did not overlap the designated attenuation targets for Pleasantness, and ASD signal playback showed an SPL increase primarily within this target region. Under the combined application condition, the measured band SPL in Region 2-1 increased from 45.11 dBA under the silencer-only condition to 48.51 dBA under the silencer+ASD condition, corresponding to an increase of approximately 3.40 dBA, whereas the reduced SPL distributions resulting from silencer installation were generally maintained in Regions 2-2 and 3-1.
- (4)
- In the final listening test, Pleasantness was rated higher under the silencer-only condition than under the straight-pipe reference condition, while Coolness was rated higher under the combined application condition than under the silencer-only reference sound. These changes were consistent with the rating trends observed in the frequency-band listening tests, in which higher Pleasantness ratings were associated with SPL attenuation in the corresponding frequency regions and higher Coolness ratings were associated with SPL amplification. Because different reference conditions were used for the two perceptual attributes, these results represent the respective perceptual changes associated with the silencer and ASD rather than a direct common-reference comparison demonstrating simultaneous improvement in both attributes.
Author Contributions
Conceptualization, Y.K. and H.K.; methodology, Y.K.; investigation, Y.K.; formal analysis, Y.K.; writing—original draft preparation, Y.K.; writing—review and editing, H.K.; supervision, H.K.; project administration, H.K. All authors have read and agreed to the published version of the manuscript.
Funding
This work was supported by the Institute of Information & Communications Technology Planning & Evaluation (IITP)-Innovative Human Resource Development for Local Intellectualization program grant funded by the Korean government (MSIT) (IITP-2026-RS-2020-II201791).
Data Availability Statement
The original contributions presented in this study are included in the article. Further inquiries can be directed to the corresponding author.
Conflicts of Interest
The authors declare no conflicts of interest.
Abbreviations
The following abbreviations are used in this manuscript:
| HVAC | Heating, Ventilation, and Air Conditioning |
| ASD | Active Sound Design |
| SPL | Sound Pressure Level |
| IQR | Interquartile Range |
| SDM | Semantic Differential Method |
| FEM | Finite Element Method |
| TMM | Transfer Matrix Method |
| ABS | Acrylonitrile Butadiene Styrene |
| TL | Transmission Loss |
| IL | Insertion Loss |
References
- Mosquera-Sánchez, J.A.; Sarrazin, M.; Janssens, K.; de Oliveira, L.P.R.; Desmet, W. Multiple target sound quality balance for hybrid electric powertrain noise. Mech. Syst. Signal Process. 2018, 99, 478–503. [Google Scholar] [CrossRef] [Scilit]
- Swart, D.J.; Bekker, A.; Bienert, J. The comparison and analysis of standard production electric vehicle drive-train noise. Int. J. Veh. Noise Vib. 2016, 12, 260–276. [Google Scholar] [CrossRef] [Scilit]
- Münder, M.; Carbon, C.-C. A literature review [2000–2022] on vehicle acoustics: Investigations on perceptual parameters of interior soundscapes in electrified vehicles. Front. Mech. Eng. 2022, 8, 974464. [Google Scholar] [CrossRef] [Scilit]
- Bennouna, S. NVH investigation of automotive HVAC brushless motors. In Proceedings of the INTER-NOISE 2022, Glasgow, UK, 21–24 August 2022; pp. 1751–1760. [Google Scholar]
- Kamada, M.; Shimoyama, K.; Sato, F.; Washiashi, J.; Konishi, Y. Multi-objective design optimization of a high efficiency and low noise blower unit of a car air-conditioner. Proc. Inst. Mech. Eng. Part D. J. Automob. Eng. 2019, 233, 3493–3503. [Google Scholar] [CrossRef] [Scilit]
- Qian, C.; Wang, D.; Wang, H.; Tang, F.; Lin, M.; Xu, J. Low noise optimization of automotive air conditioning based on response surface methodology. Arch. Acoust. 2026, 51, 495–506. [Google Scholar] [CrossRef]
- Black, J.P.; Thawani, P.T.; Hayashi, H.; Sinadinos, S. Automotive HVAC induced blade passing frequency (BPF) tone and its suppression. In Proceedings of the SAE 2013 Noise and Vibration Conference and Exhibition, Grand Rapids, MI, USA, 20–23 May 2013; Available online: https://saemobilus.sae.org/papers/automotive-hvac-induced-blade-passing-frequency-bpf-tone-suppression-2013-01-1915? (accessed on 4 November 2026). [CrossRef] [Scilit]
- Ravineala, T.; Kurniawan, D.; Marshall, S.; Barnebee, C.; Bennouna, S. Automotive HVAC blower blade pass noise sensitivity—A case study. In Proceedings of the NOISE-CON 2025, Stowe, VT, USA, 9–11 June 2025; Institute of Noise Control Engineering: Wakefield, MA, USA, 2025; Volume 271, pp. 950–960. [Google Scholar]
- Lee, J.; Jang, W.; Lee, Y.; Chung, J. Reduction of the cavitation noise in an automotive heater core. Appl. Sci. 2025, 15, 5737. [Google Scholar] [CrossRef] [Scilit]
- Aziz, M.S.A.; Mazlan, A.Z.A.; Satar, M.H.A.; Paiman, M.A.R.; Ghapar, M.Z.A. Attenuation of humming-type noise and vibration in vehicle HVAC system using a tuneable dynamic vibration absorber. Arch. Acoust. 2022, 47, 331–342. [Google Scholar] [CrossRef] [Scilit]
- Kim, H.; Kwon, Y.; Lee, S.; Kim, J.; Park, D. Development of a metasilencer considering flow in HVAC systems. Appl. Sci. 2022, 12, 11322. [Google Scholar] [CrossRef] [Scilit]
- Huang, Y.; Fan, Q.; Wang, X.; Liu, Z.; Shi, Y.; Liu, C. Study on acoustic metamaterial unit cells: Acoustic absorption characteristics of novel tortuously perforated Helmholtz resonator with consideration of elongated acoustic propagation paths. Materials 2025, 18, 3930. [Google Scholar] [CrossRef] [Scilit]
- Huang, Y.; Yan, B.; Zhang, H.; Wang, C.; Wang, J.; Zhang, Z.; Huang, Q.; Zhan, X. Transmission loss characteristics of dual cavity impedance composite mufflers for non-planar wave cavity resonance. Appl. Sci. 2024, 14, 6879. [Google Scholar] [CrossRef] [Scilit]
- Singh, S.; Mohanty, A.R. HVAC noise control using natural materials to improve vehicle interior sound quality. Appl. Acoust. 2018, 140, 100–109. [Google Scholar] [CrossRef] [Scilit]
- Bennouna, S.; Matharan, T.; Cheriaux, O. Automotive HVAC noise reduction. In Proceedings of the 10th International Styrian Noise, Vibration & Harshness Congress: The European Automotive Noise Conference, Graz, Austria, 20–22 June 2018. [Google Scholar] [CrossRef] [Scilit]
- Yamin, L.M.S.; Zulkarnain, M.; Darmawan, S.; Ariyanti, S.; Veza, I.; Bakri, M.B. Reducing vehicle heating, ventilation and air conditioning noise using low-cost and biodegradable natural materials from coconut fiber absorber. Int. J. Technol. 2024, 15, 1380–1397. [Google Scholar] [CrossRef] [Scilit]
- Silva, Y.A.R.; He, J.; Song, J.; Kniaz, O. Application of local active control for HVAC system noise in an electric vehicle. In Proceedings of the INTER-NOISE 2020, Seoul, Republic of Korea, 23–26 August 2020. [Google Scholar]
- Kusano, T.; Shige, K.; Inoue, T.; Oba, Y.; Takeda, N.; Terashima, O.; Yamada, S. Active noise control for noise generated by electric vehicle HVAC systems using virtual sensing. Int. J. Automot. Eng. 2025, 16, 27–32. [Google Scholar] [CrossRef] [Scilit]
- Park, S.-G.; Sim, H.-J.; Yoon, J.-H.; Jeong, J.-E.; Choi, B.-J.; Oh, J.-E. Analysis of the HVAC system’s sound quality using the design of experiments. J. Mech. Sci. Technol. 2009, 23, 2801–2806. [Google Scholar] [CrossRef] [Scilit]
- Nakasaki, R.; Ogata, T.; Hasegawa, H.; Ozeki, Y.; Onda, M.; Kasuga, M. Sound quality evaluation of air-conditioning sounds in a vehicle using psychoacoustic parameters. In Proceedings of the Acoustics’08 Paris, Paris, France, 29 June–4 July 2008; pp. 6557–6562. [Google Scholar]
- Nakagawa, S.; Hotehama, T.; Kamiya, M. Assessment of auditory impression of the coolness and warmness of automotive HVAC noise. In Proceedings of the 39th Annual International Conference of the IEEE Engineering in Medicine and Biology Society (EMBC), Jeju, Republic of Korea, 11–15 July 2017; pp. 4171–4174. [Google Scholar] [CrossRef] [Scilit]
- Nakasaki, R.; Hasegawa, H.; Kasuga, M. Evaluation of air-conditioning sounds in a vehicle to determine thermal feelings using psychoacoustic parameters. Acoust. Sci. Technol. 2013, 34, 159–165. [Google Scholar] [CrossRef] [Scilit]
- Nakasaki, R.; Hasegawa, H.; Kasuga, M. Subjective evaluation of sound images of air-conditioning system in a vehicle. Acoust. Sci. Technol. 2011, 32, 137–142. [Google Scholar] [CrossRef] [Scilit][Green Version]
- Yano, H.; Takiguchi, T.; Nakagawa, S. Magnetic cortical oscillations associated with subjective auditory coolness during paired comparison of time-varying HVAC sounds. NeuroReport 2024, 35, 1–8. [Google Scholar] [CrossRef] [Scilit]
- Yano, H.; Takiguchi, T.; Nakagawa, S. Estimation of HVAC sound preferences from cortical magnetic patterns during paired-comparison tasks. Appl. Sci. 2025, 15, 12009. [Google Scholar] [CrossRef] [Scilit]
- Leite, R.P.; Paul, S.; Gerges, S.N.Y. Investigation of the perceived sound quality of an automotive HVAC system. In Proceedings of the 2006 SAE Brasil Congress and Exhibit, Sao Paulo, Brazil, 21–23 November 2006. [Google Scholar] [CrossRef] [Scilit]
- Leite, R.P.; Paul, S.; Gerges, S.N.Y. A sound quality-based investigation of the HVAC system noise of an automobile model. Appl. Acoust. 2009, 70, 636–645. [Google Scholar] [CrossRef] [Scilit]
- Yoon, J.-H.; Yang, I.-H.; Jeong, J.-E.; Park, S.-G.; Oh, J.-E. Reliability improvement of a sound quality index for a vehicle HVAC system using a regression and neural network model. Appl. Acoust. 2012, 73, 1099–1103. [Google Scholar] [CrossRef] [Scilit]
- Wagner, V.; Enigk, H.; Beitz, T.; Kallus, K.W. Subjective and objective evaluation of the air conditioning sound. J. Ergon. 2014, 4, 131. [Google Scholar] [CrossRef]
- Soeta, Y.; Nakagawa, S.; Kamiya, Y.; Kamiya, M. Subjective preference for air-conditioner sounds inside a car in summer and winter. J. Ergon. 2016, 6, 170. [Google Scholar] [CrossRef]
- Minard, A.; Lambourg, C.; Boussard, P. Perceptual evaluation of the sound quality of car HVAC systems. In Proceedings of the INTER-NOISE 2016, Hamburg, Germany, 21–24 August 2016; pp. 4467–4474. [Google Scholar]
- Bennouna, S.; Muhr, S.; Dutta, S.; Liu, L.; Kurniawan, D. Noise metrics and subjective assessment of automotive HVAC systems. In Proceedings of the Noise and Vibration Conference & Exhibition, Grand Rapids, MI, USA, 15–18 May 2023. [Google Scholar] [CrossRef] [Scilit]
- Masullo, M.; Yamauchi, K.; Dan, M.; Cioffi, F.; Maffei, L. Intercultural differences in the perception of HVAC sound quality in car cabins: From conventional to electric vehicles. Appl. Sci. 2021, 11, 11431. [Google Scholar] [CrossRef] [Scilit]
- Masullo, M.; Yamauchi, K.; Dan, M.; Cioffi, F.; Maffei, L. Influence of infotainment-system audio cues on the sound quality perception onboard electric vehicles in the presence of air-conditioning noise. Acoustics 2025, 7, 1. [Google Scholar] [CrossRef] [Scilit]
- Back, J.; Lee, S.-K.; Lee, S.M.; An, K.; Kwon, D.-H.; Park, D.-C. Design and implementation of comfort-quality HVAC sound inside a vehicle cabin. Appl. Acoust. 2021, 177, 107940. [Google Scholar] [CrossRef] [Scilit]
- Otto, N.; Amman, S.; Eaton, C.; Lake, S. Guidelines for jury evaluations of automotive sounds. Sound Vib. 2001, 35, 24–47. [Google Scholar]
- Kim, H.; Kwon, Y.; Lee, S. Acoustic metamaterial design by phase delay derivation using transfer matrix. Symmetry 2023, 15, 689. [Google Scholar] [CrossRef] [Scilit]
- Munjal, M.L. A simple numerical method for three-dimensional analysis of simple expansion chamber mufflers of rectangular as well as circular cross-section with a stationary medium. J. Sound Vib. 1987, 116, 71–88. [Google Scholar] [CrossRef] [Scilit]
- Lee, I. Acoustic Characteristics of Perforated Dissipative and Hybrid Silencers. Ph.D. Dissertation, The Ohio State University, Columbus, OH, USA, 2005. [Google Scholar]
- Showkat Ali, S.A.; Azarpeyvand, M.; Ilário da Silva, C.R. Trailing-edge flow and noise control using porous treatments. J. Fluid Mech. 2018, 850, 83–119. [Google Scholar] [CrossRef] [Scilit]
- Showkat Ali, S.A.; Azarpeyvand, M.; Ilário da Silva, C.R. Trailing edge bluntness noise reduction using porous treatments. J. Sound Vib. 2020, 474, 115257. [Google Scholar] [CrossRef] [Scilit]
- D’Elia, M.E.; Humbert, T.; Aurégan, Y. Effect of flow on an array of Helmholtz resonators: Is Kevlar a “magic layer”? J. Acoust. Soc. Am. 2020, 148, 3392–3396. [Google Scholar] [CrossRef] [Scilit]
- Selamet, A.; Kothamasu, V.; Novak, J.M. Insertion loss of a Helmholtz resonator in the intake system of internal combustion engines: An experimental and computational investigation. Appl. Acoust. 2001, 62, 381–409. [Google Scholar] [CrossRef] [Scilit]
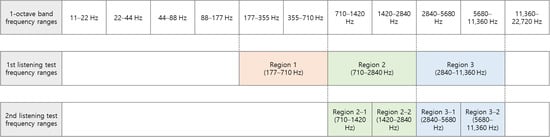
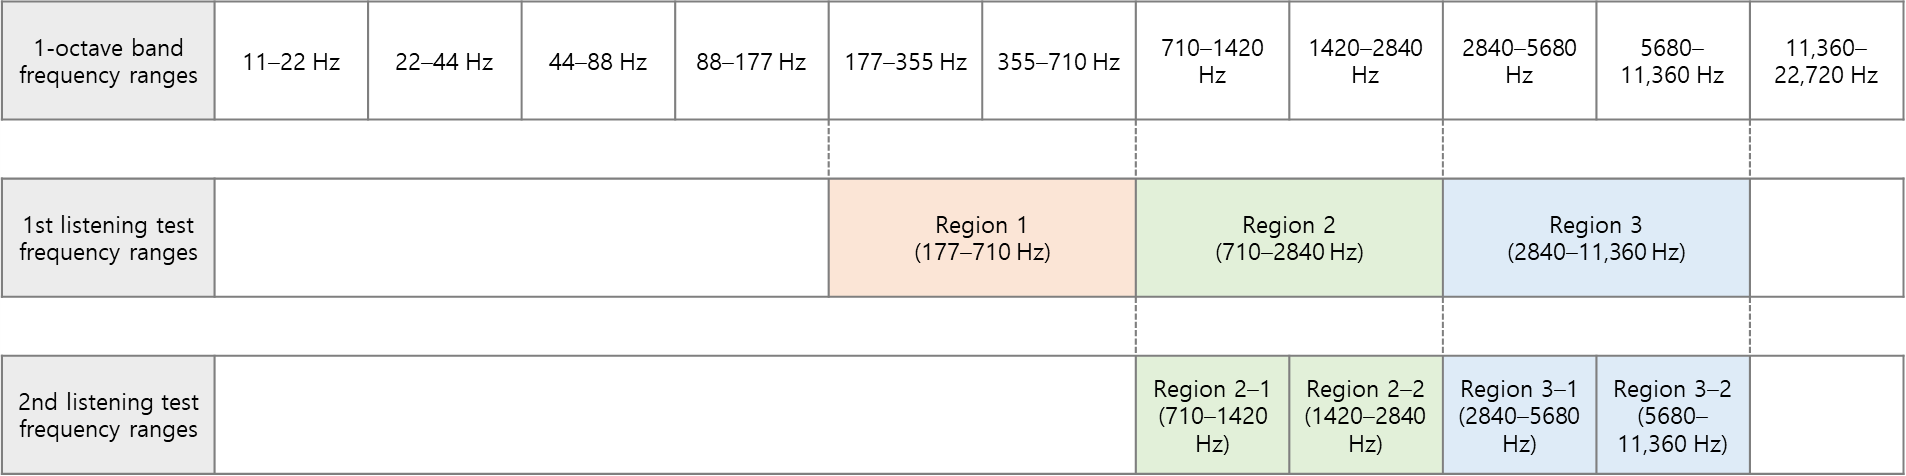


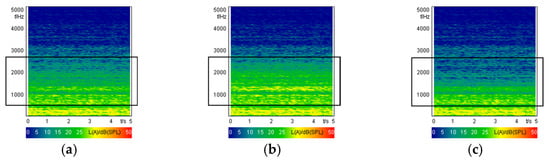
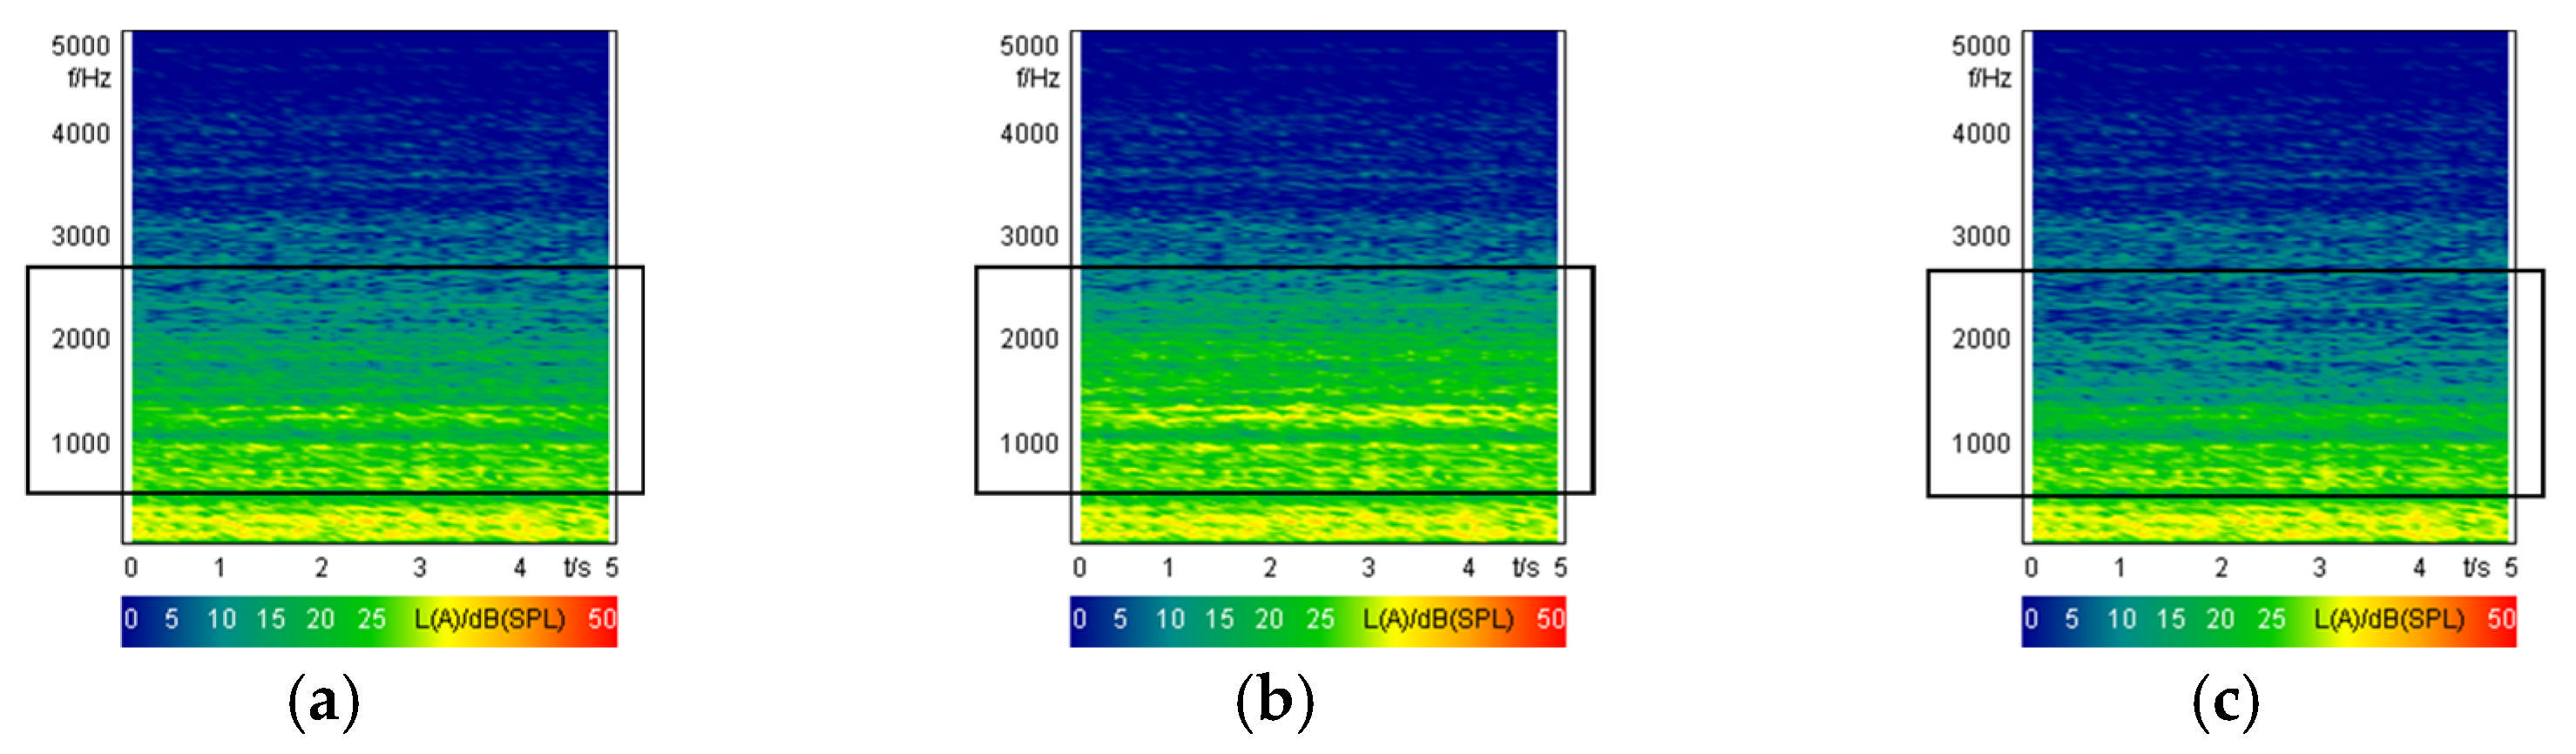
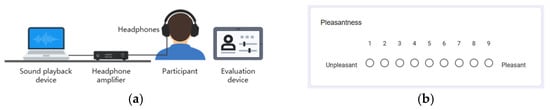
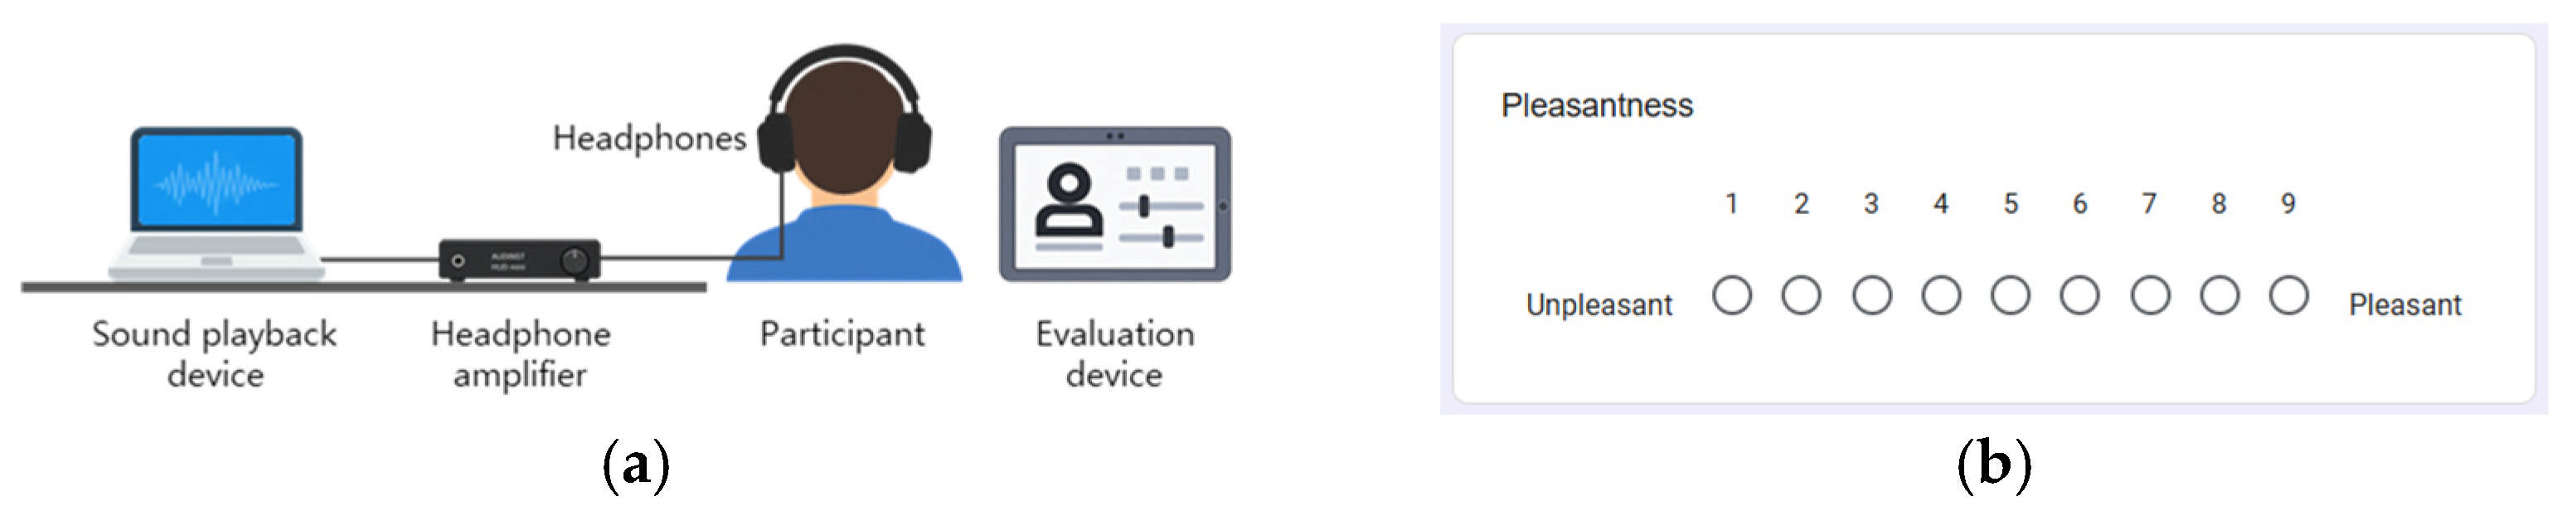
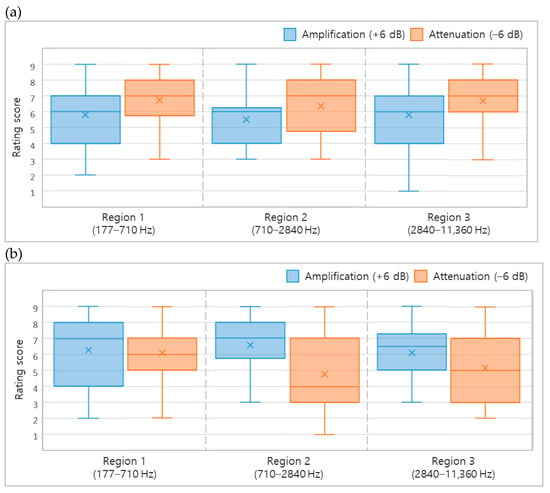
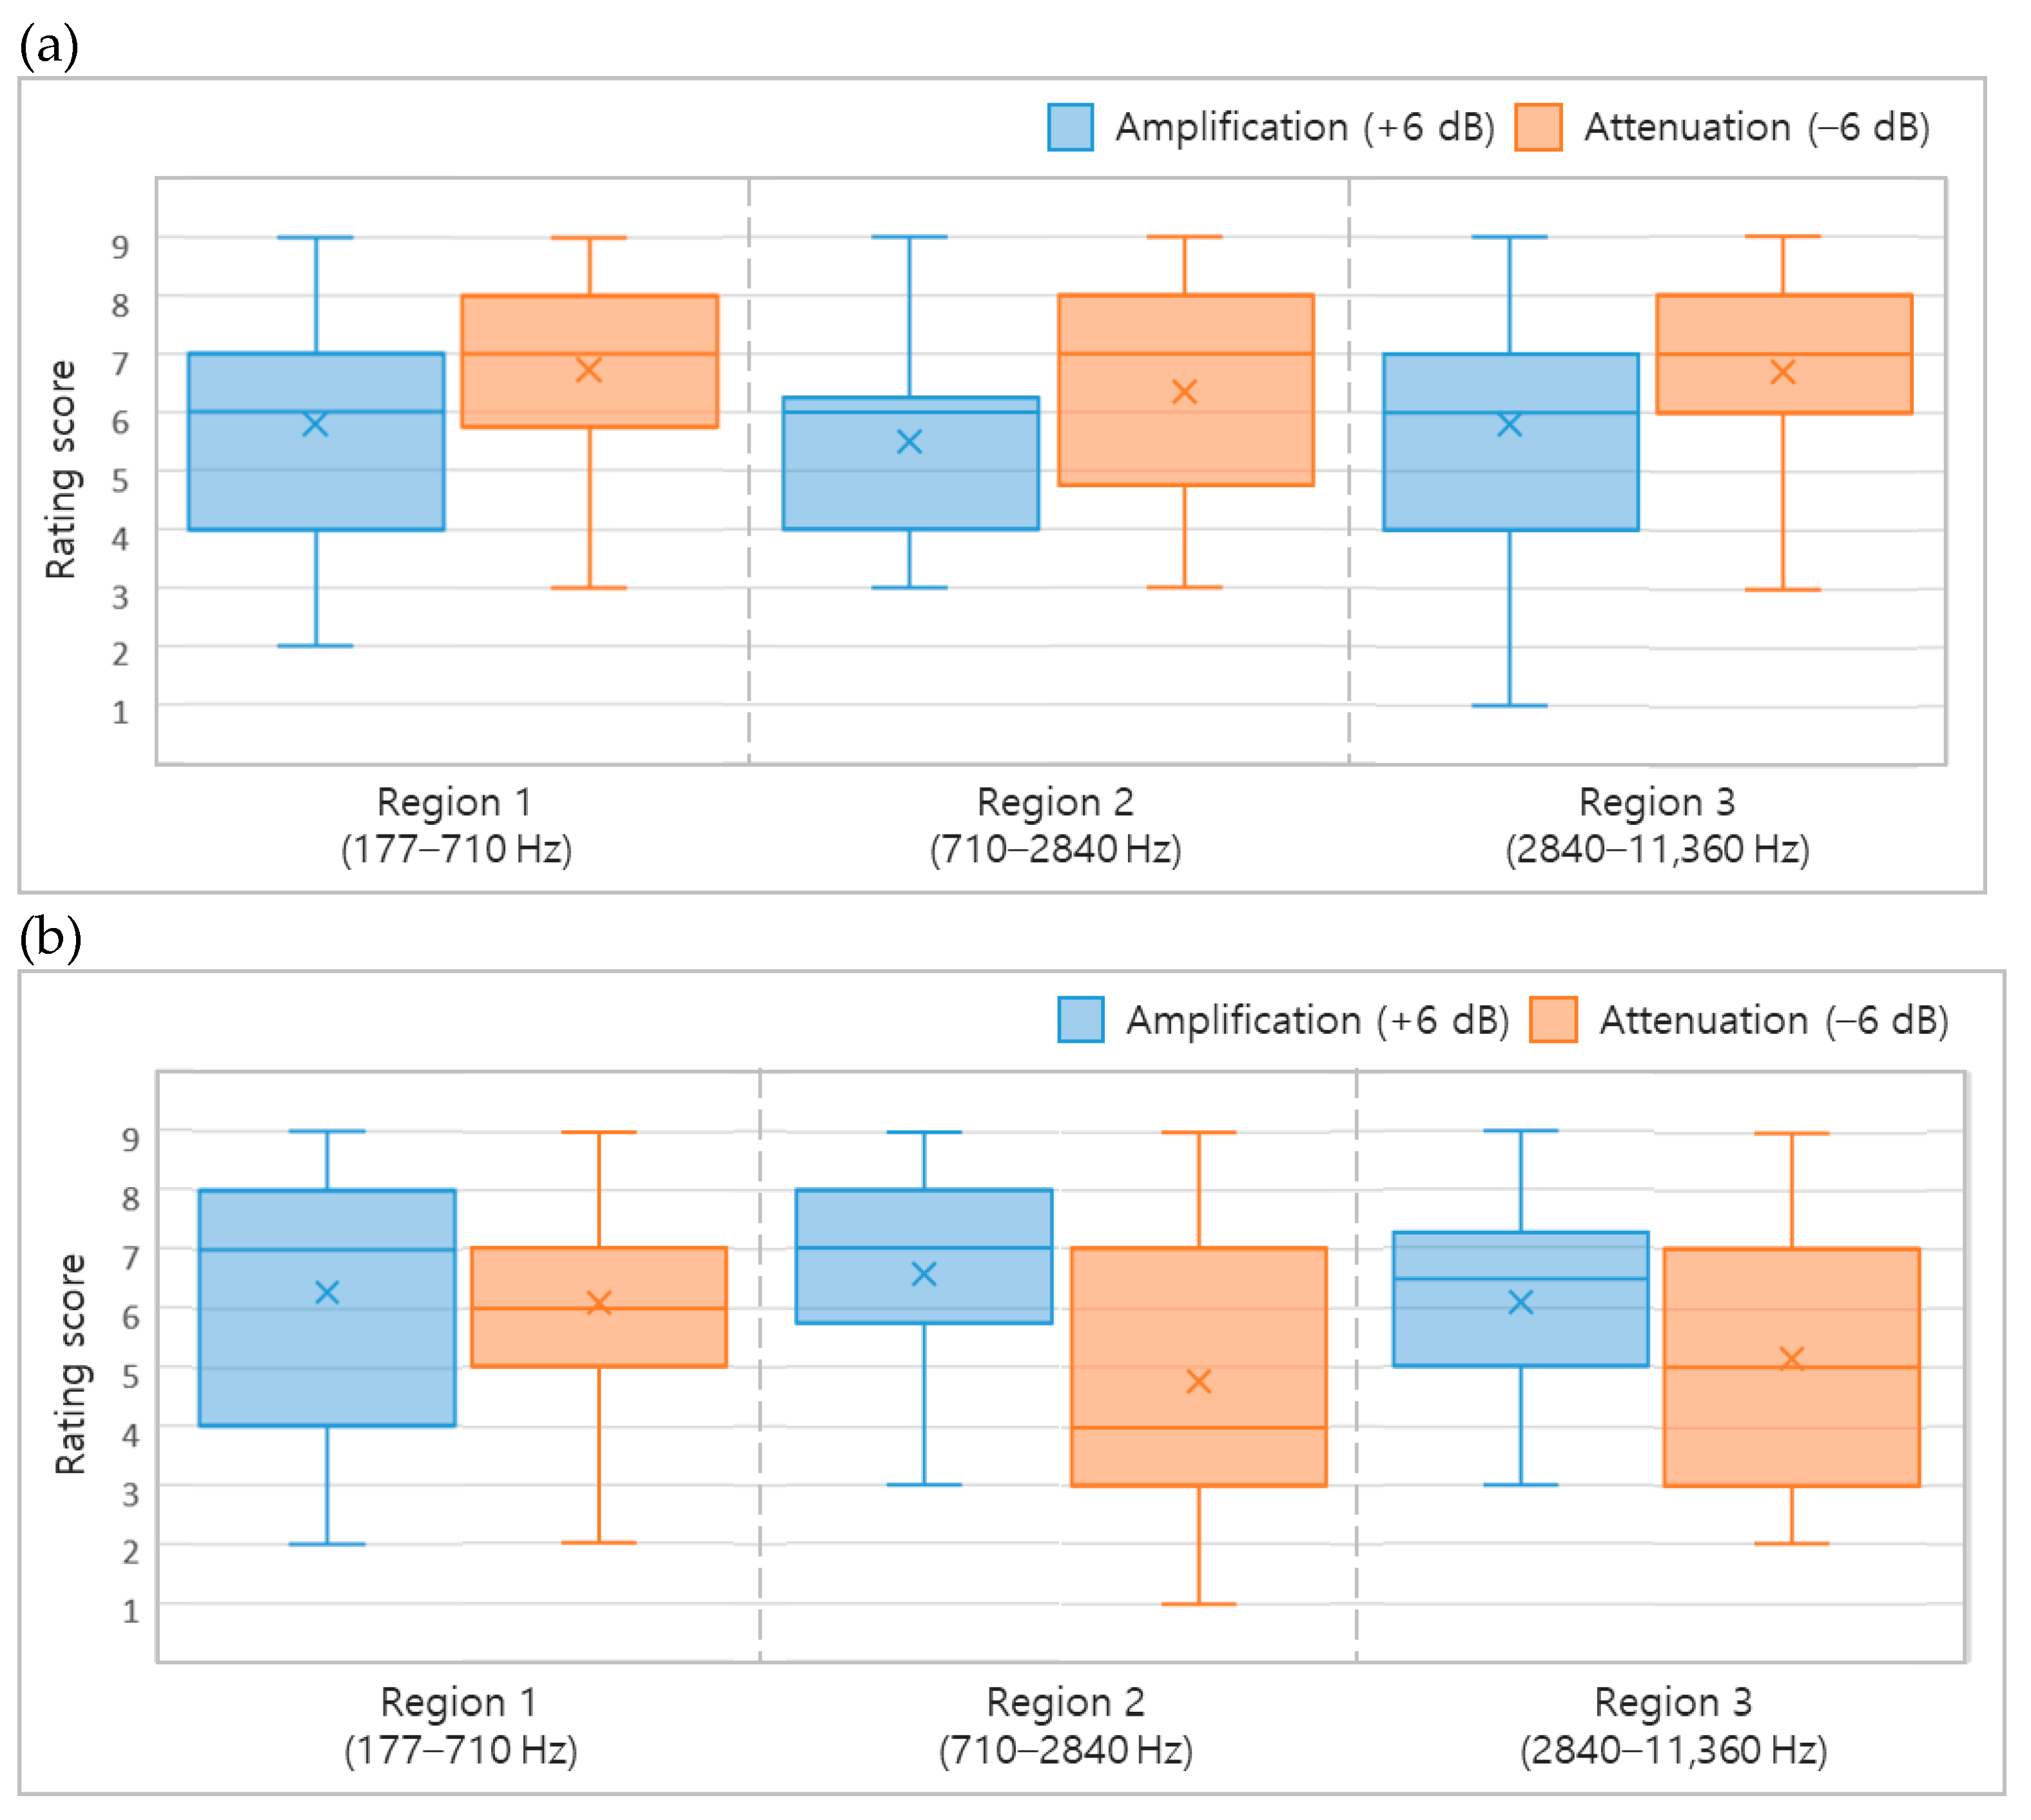
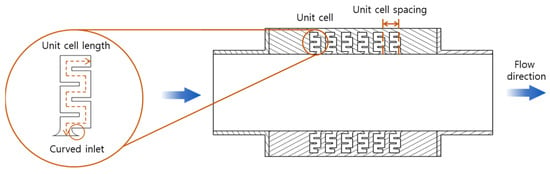
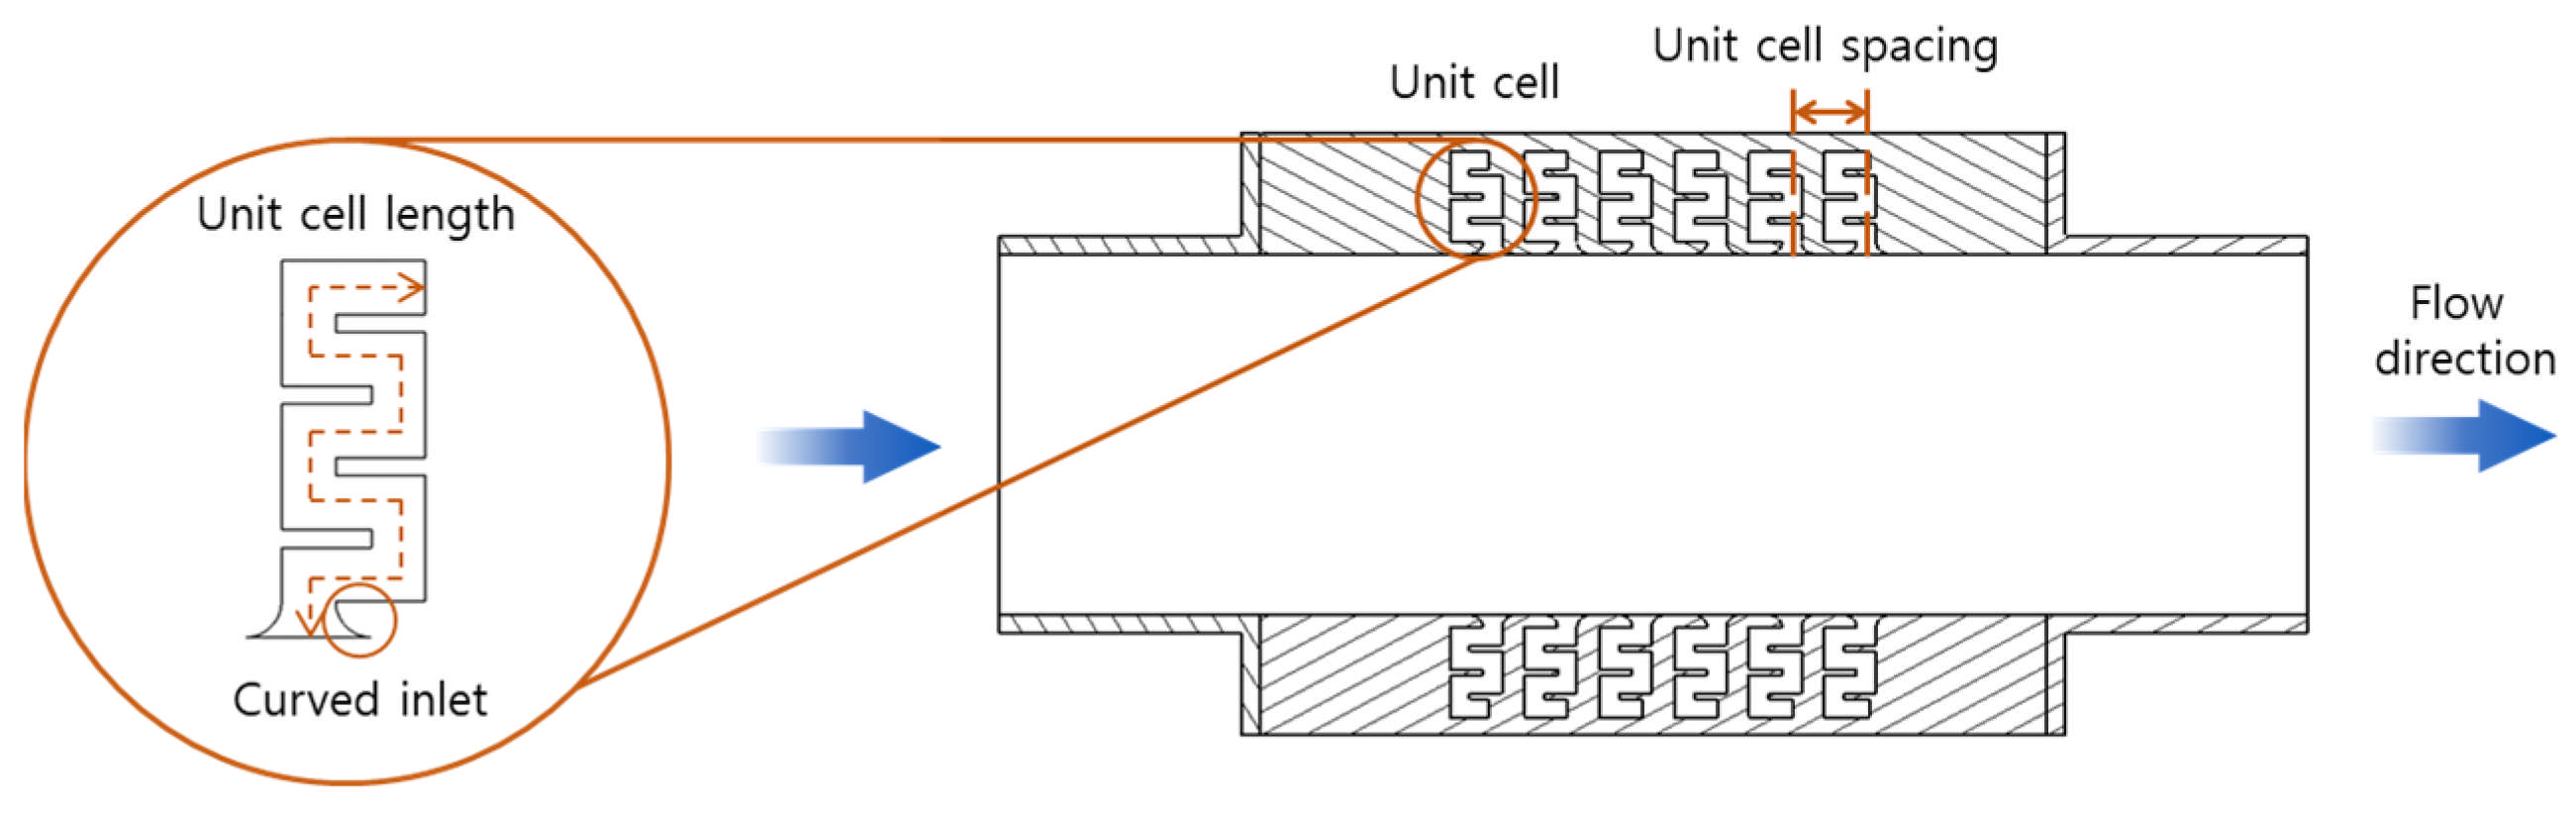
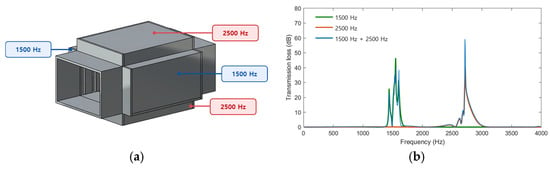
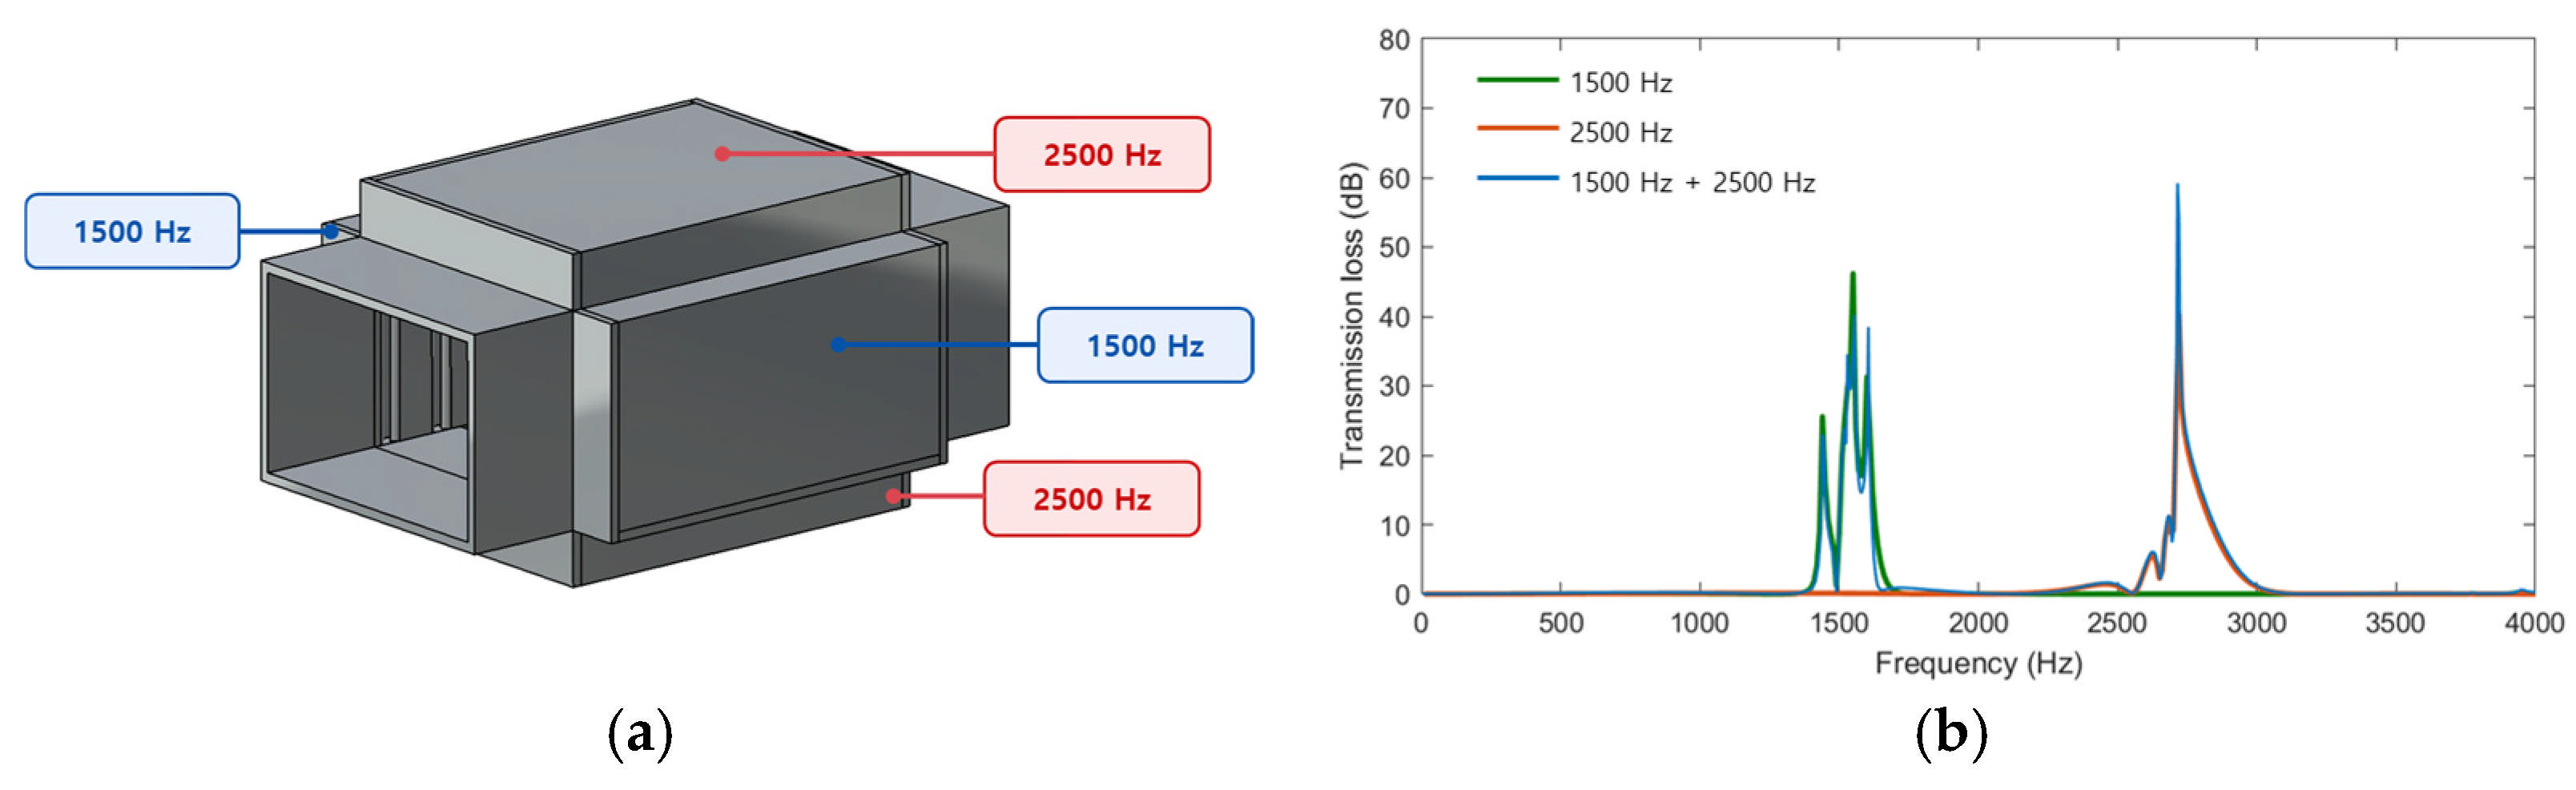
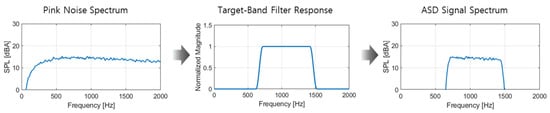
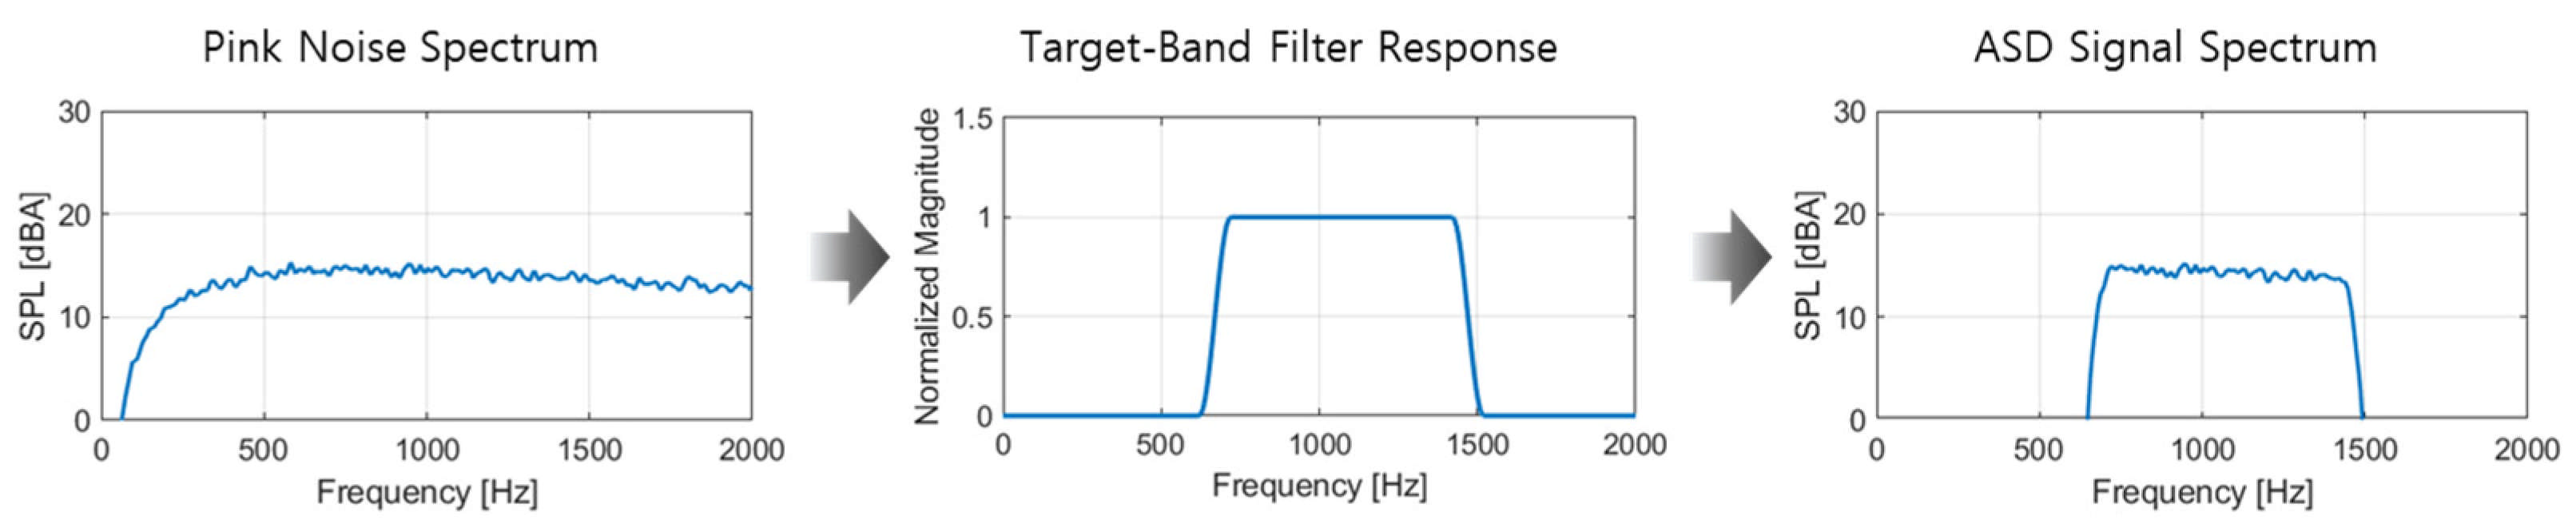
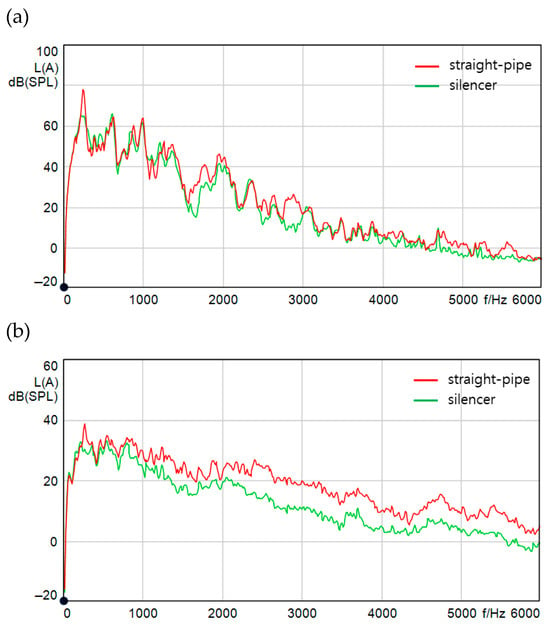
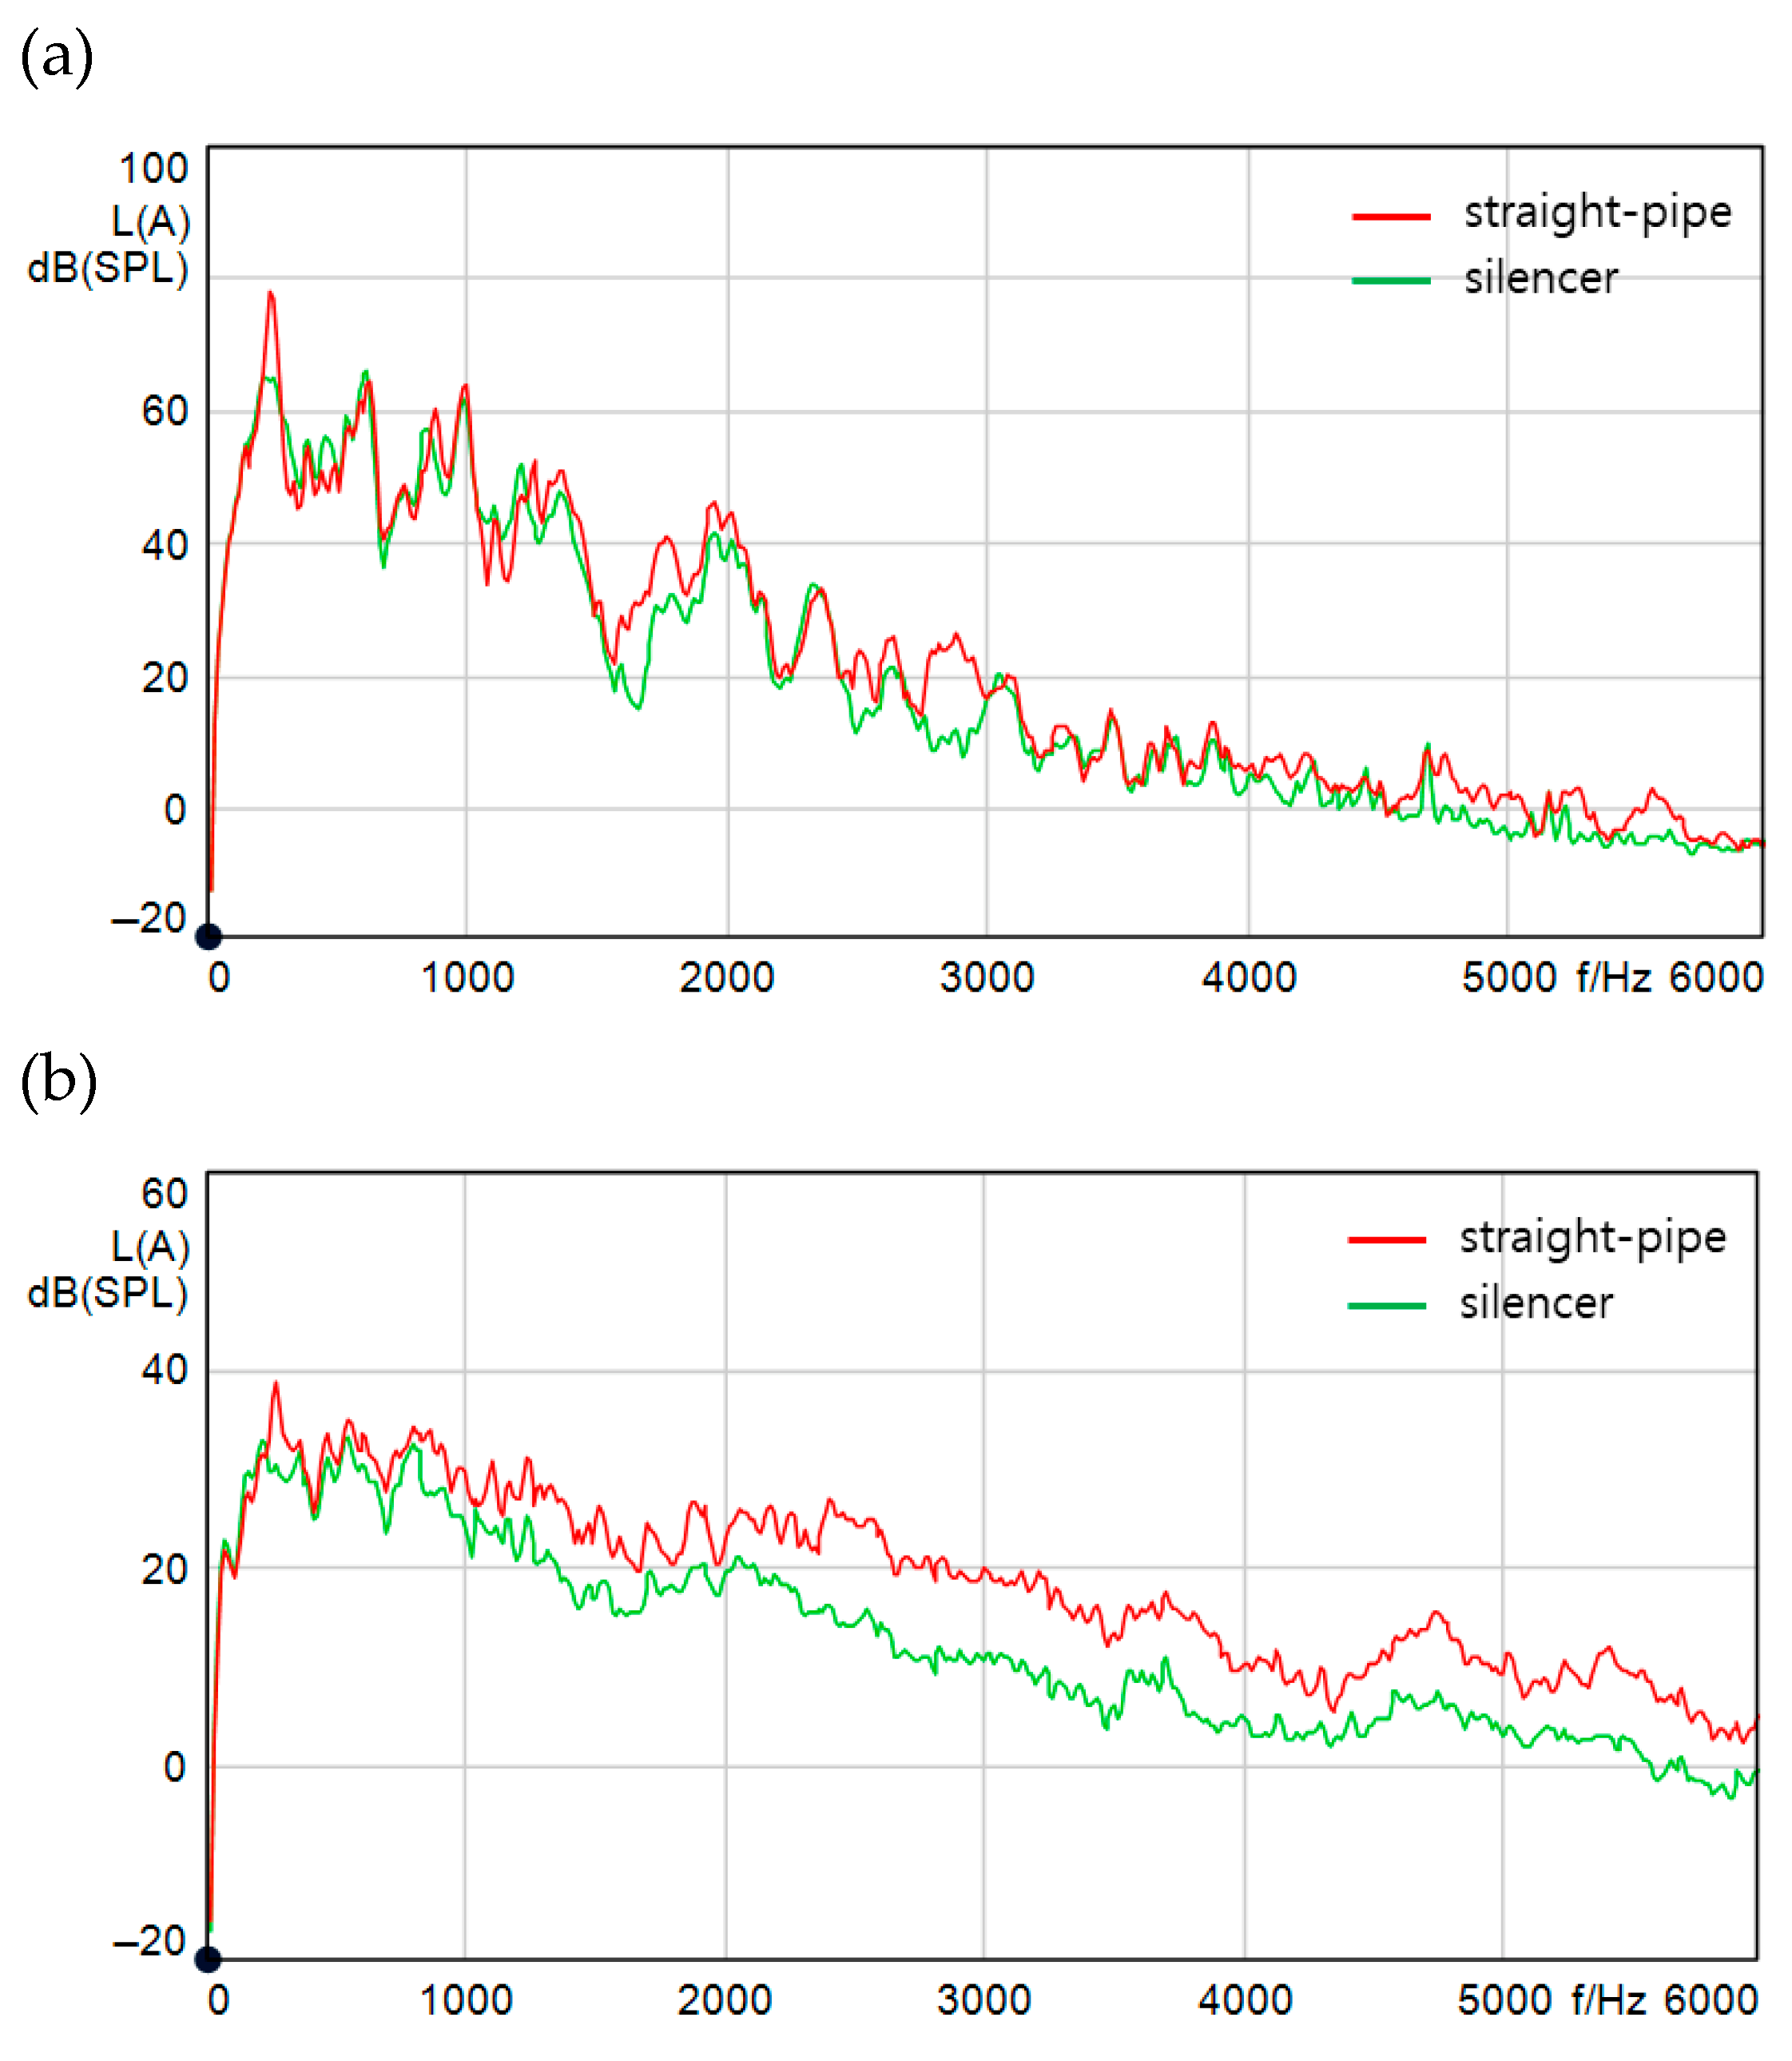
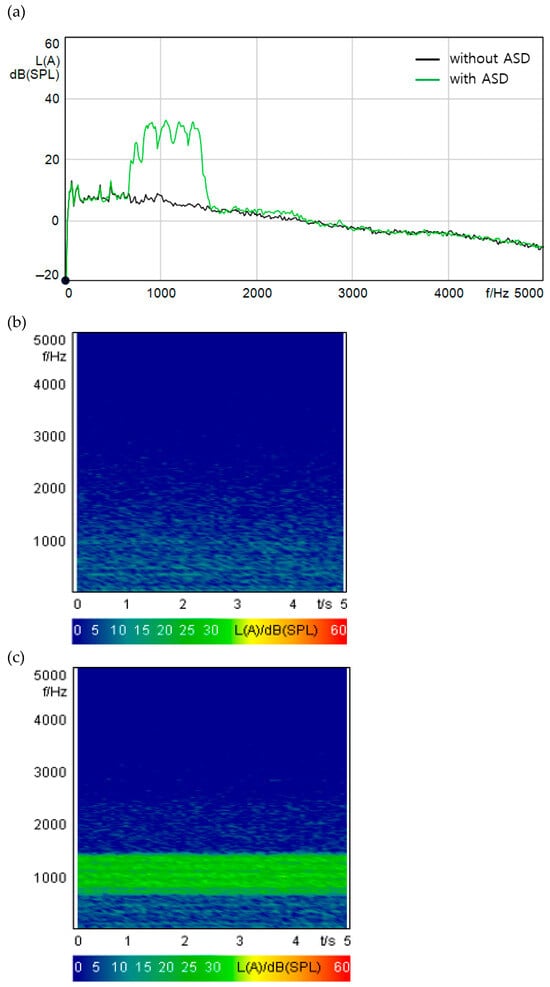
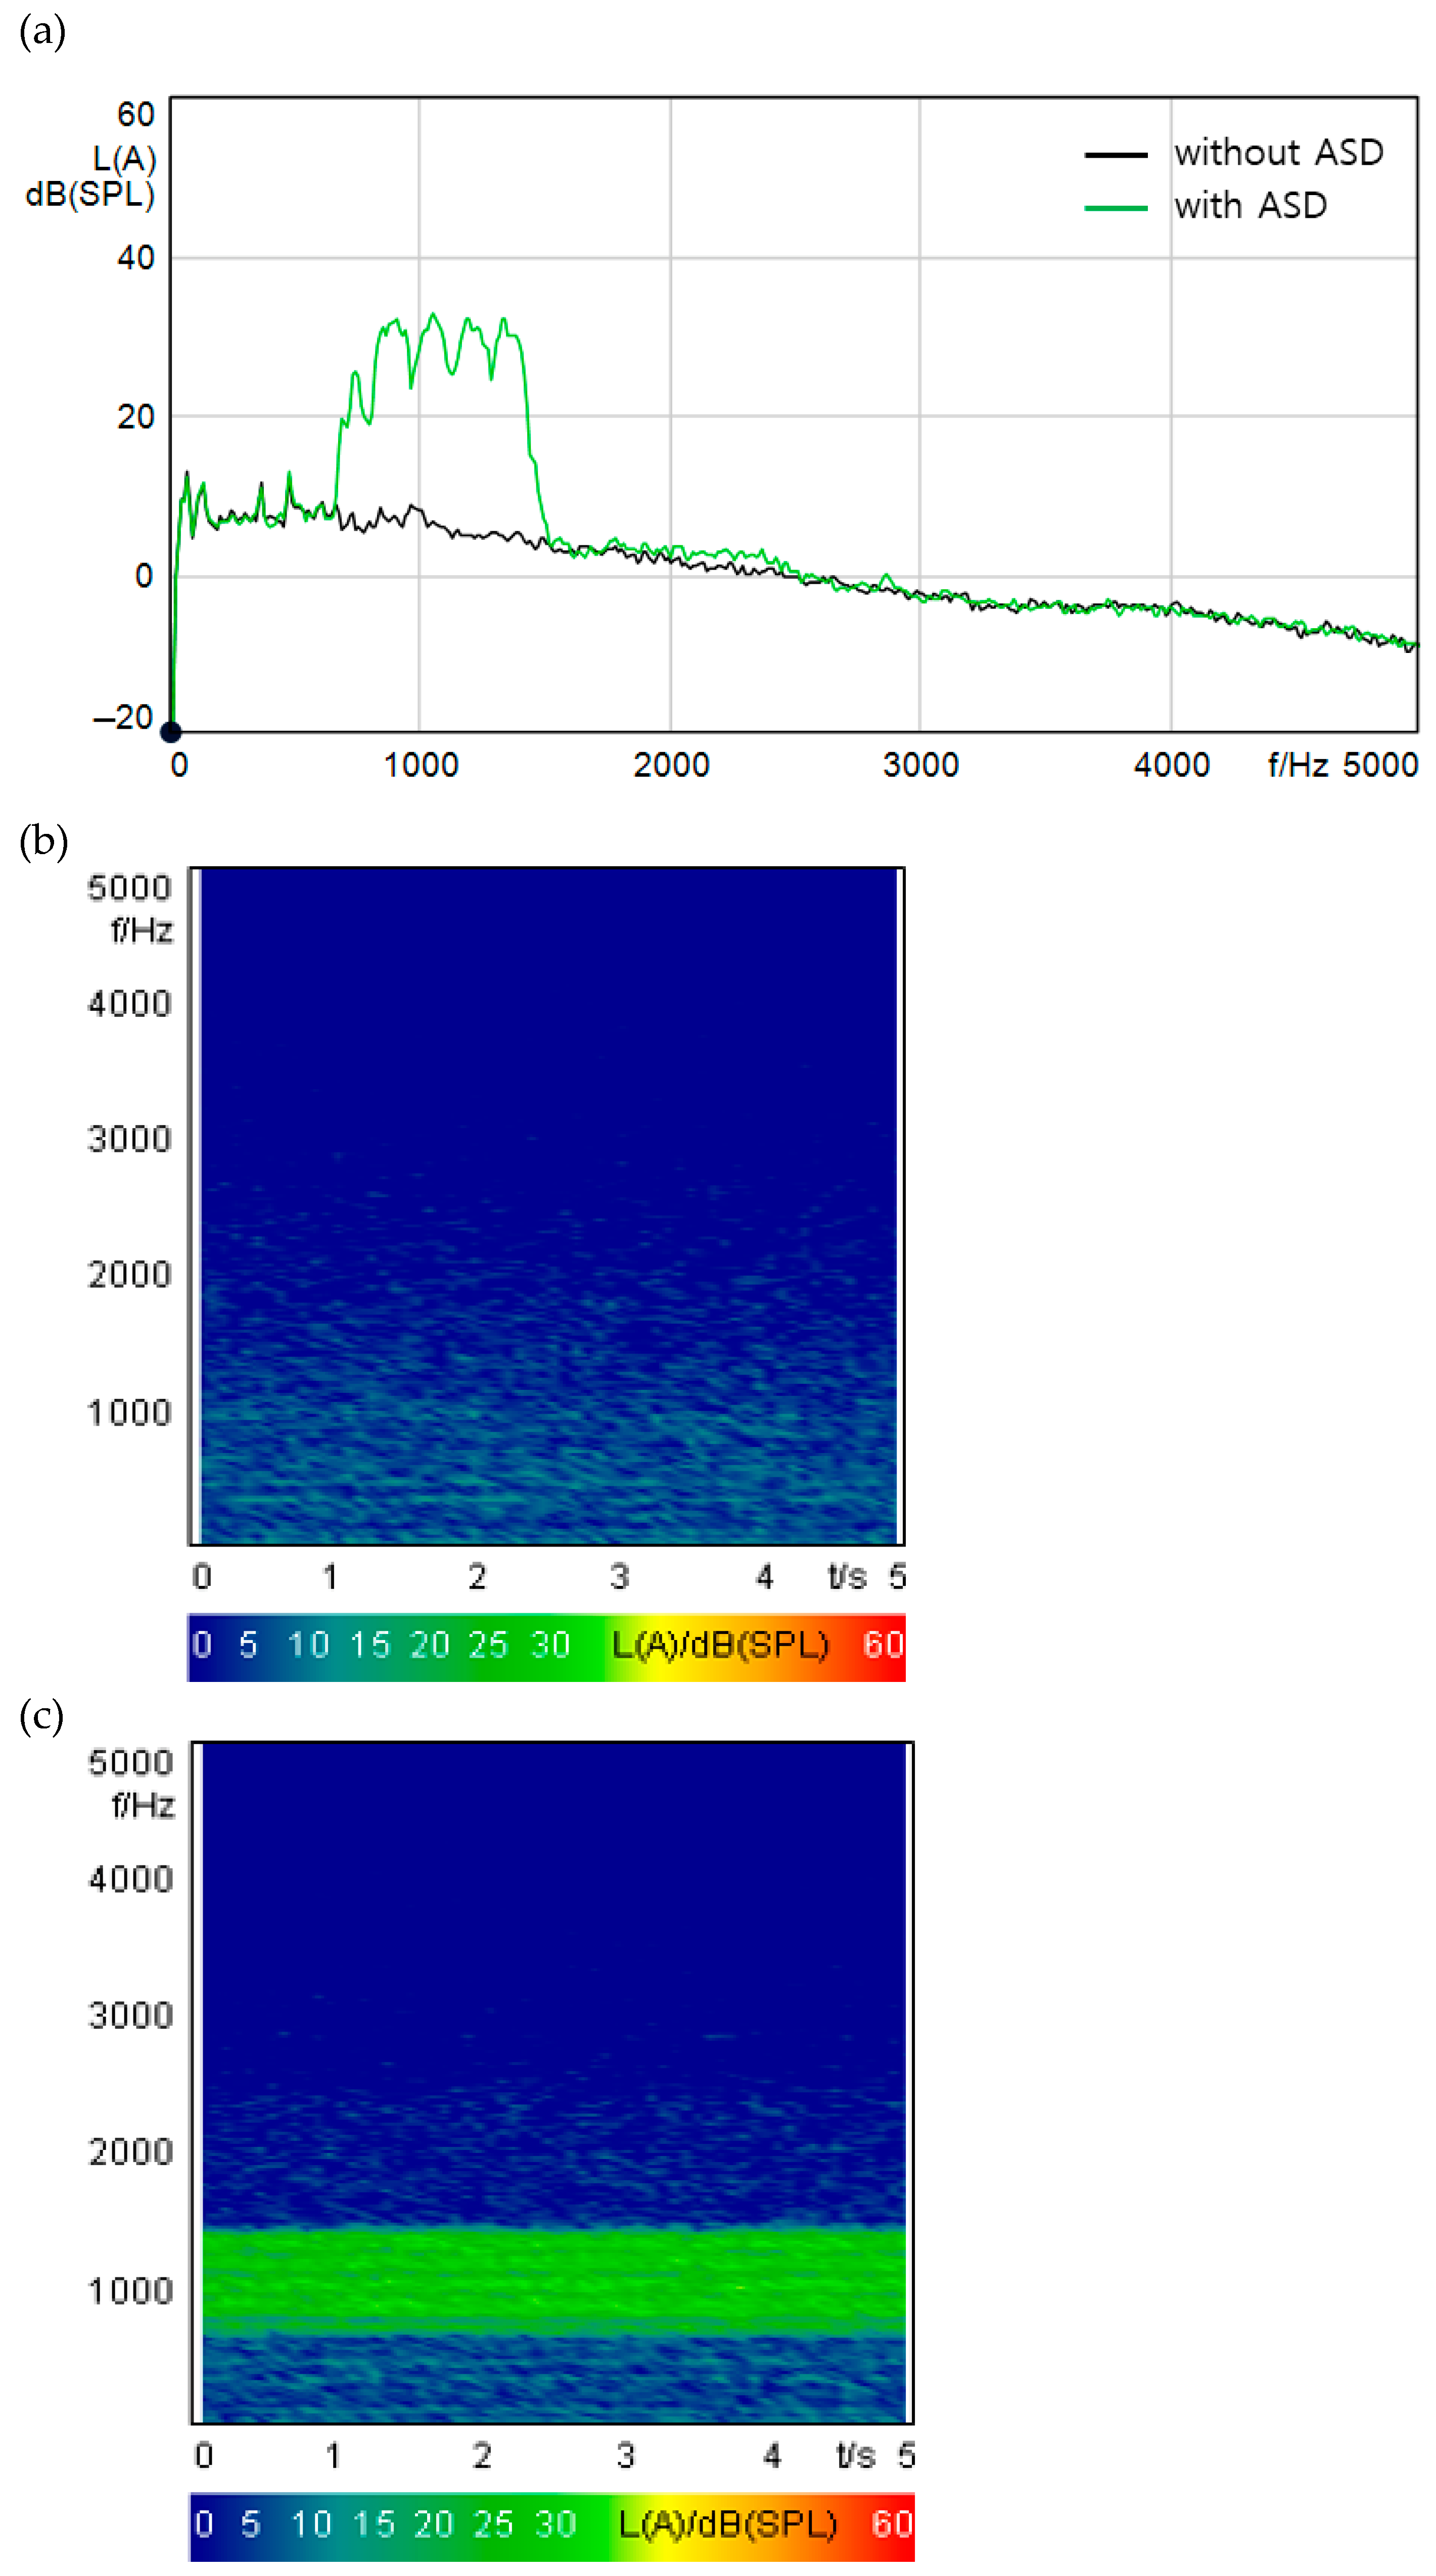
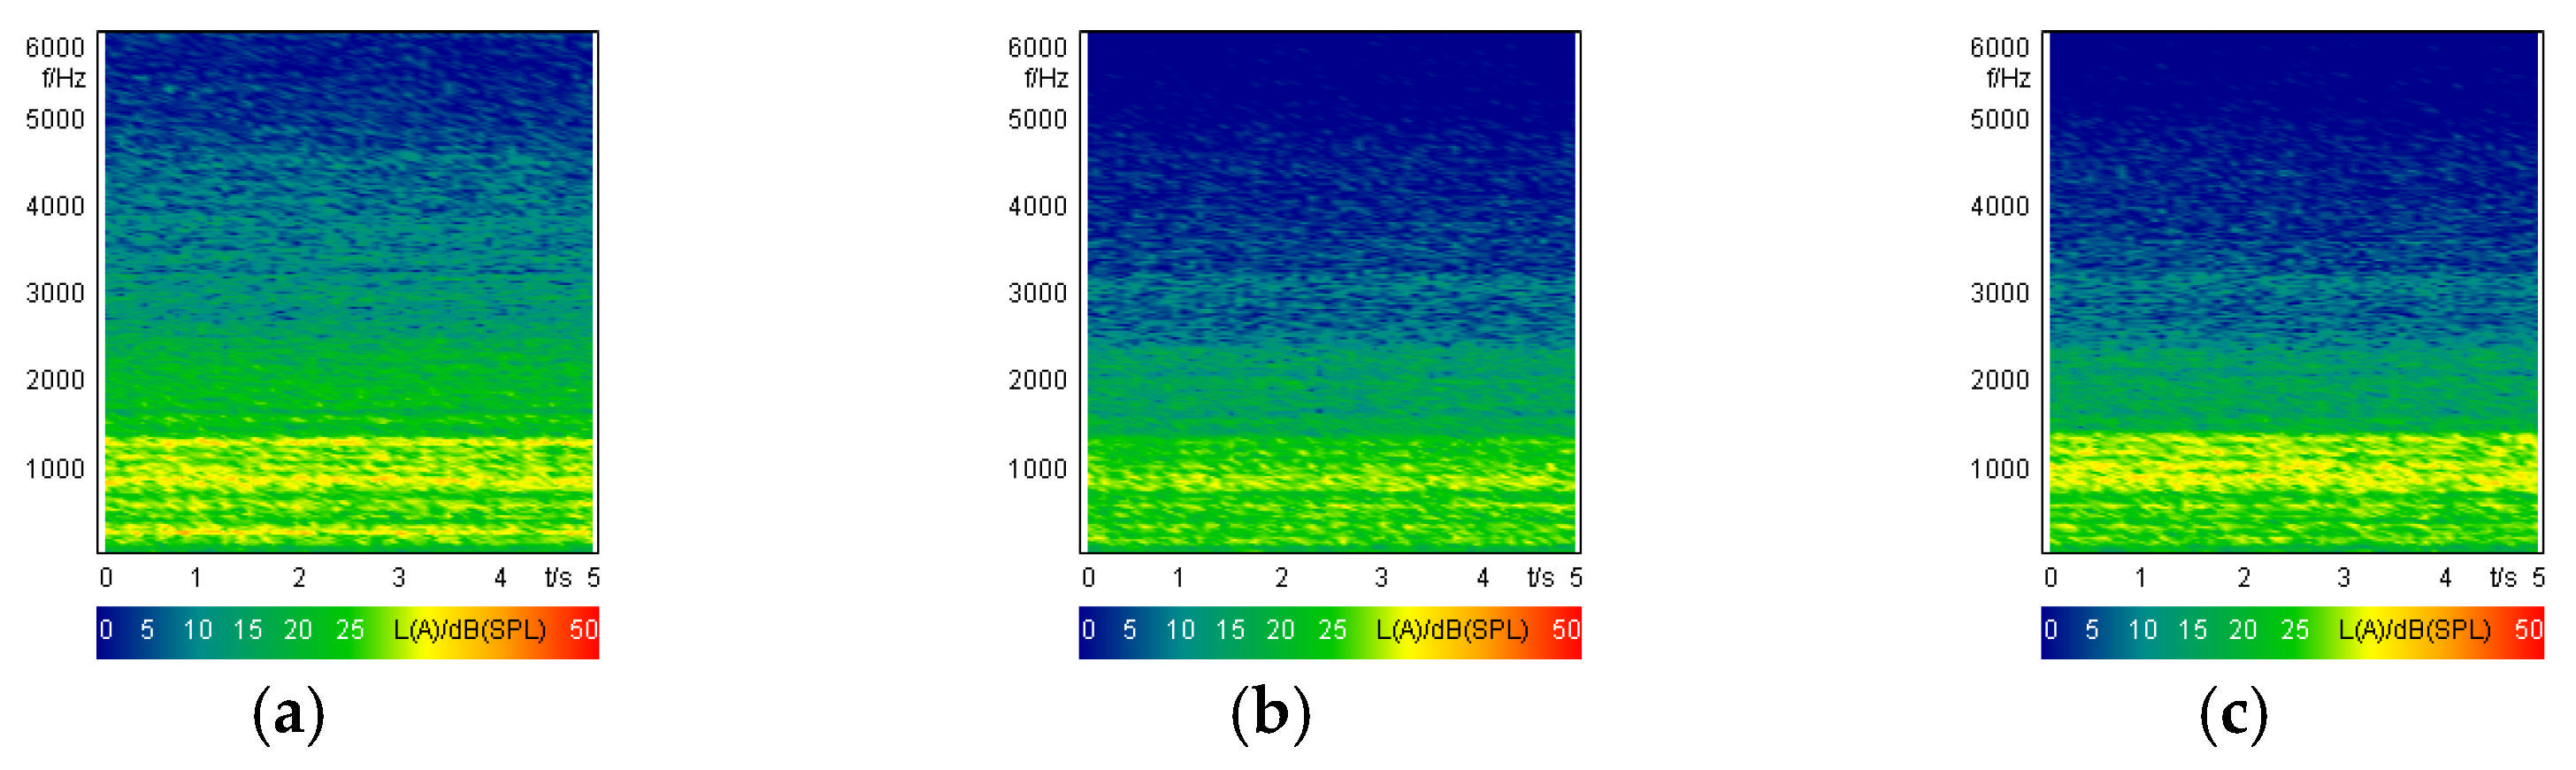
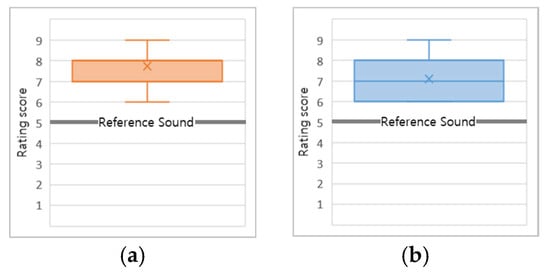
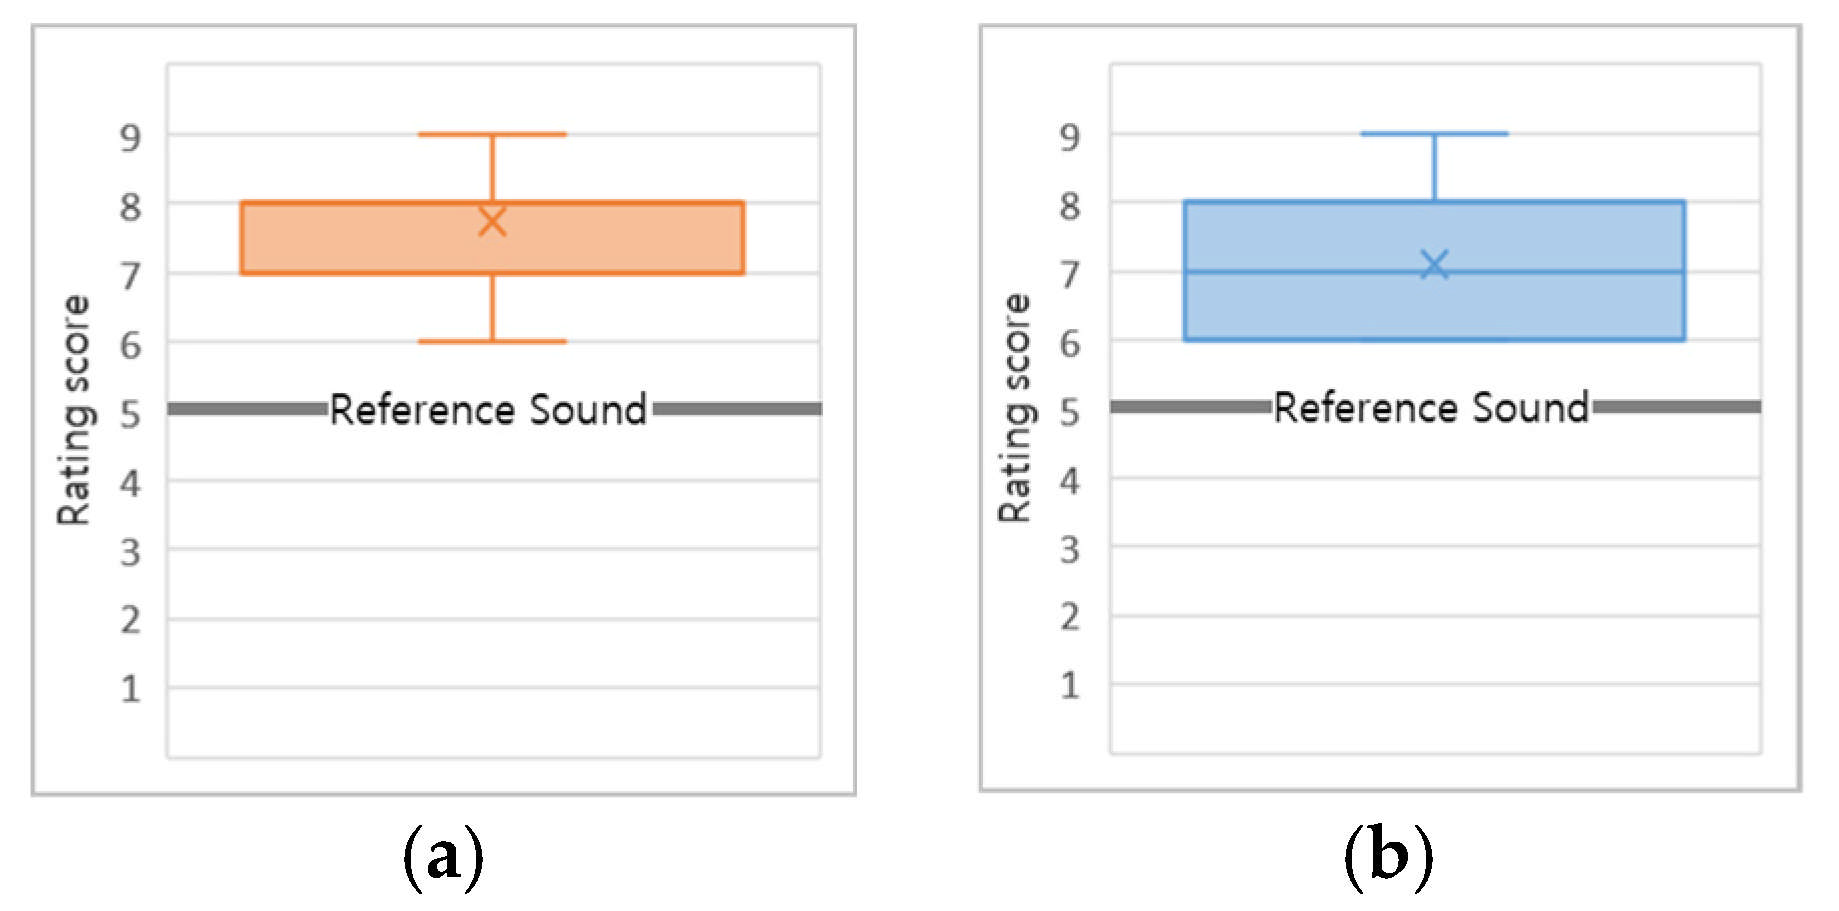

Disclaimer/Publisher’s Note: The statements, opinions and data contained in all publications are solely those of the individual author(s) and contributor(s) and not of MDPI and/or the editor(s). MDPI and/or the editor(s) disclaim responsibility for any injury to people or property resulting from any ideas, methods, instructions or products referred to in the content. |
© 2026 by the authors. Licensee MDPI, Basel, Switzerland. This article is an open access article distributed under the terms and conditions of the Creative Commons Attribution (CC BY) license.