


Abstract
Water scarcity and uneven spatial distribution of water resources pose challenges for regional sustainable development, particularly in complex river basins with increasing water infrastructure connectivity. Existing water allocation studies mainly focus on optimization outcomes, while the differentiated allocation responses of heterogeneous water users under alternative water network development scenarios remain insufficiently explored. This study develops a multi-agent water resources allocation framework under the complex adaptive systems perspective, integrating water supply agents, water demand agents, and government-level decision-making. A case study was conducted in the Poyang Lake Basin, China, using four scenarios combining two inflow frequencies (50% and 95%) with current and planned water network development. The planned development scenario also incorporates associated infrastructure changes, including reservoir development and changes in water supply capacity. The results show that this scenario is associated with lower modeled water deficits and higher economic benefits per unit of allocated water. Under the 50% inflow-frequency scenario, the total water deficit decreased from 3.48 to 3.00 × 10⁸ m3. Under the 95% inflow-frequency scenario, the total water deficit decreased from 35.73 to 17.43 × 10⁸ m3. The corresponding economic benefits per unit of allocated water increase by 1.05% and 1.98%, respectively. Allocation responses also differ across water sources and user sectors, with changes in supply concentrated in surface water and agricultural deficits remaining the main source of modeled shortages. These findings demonstrate the value of linking heterogeneous agent-level allocation responses with aggregate multi-objective optimization outcomes. The framework provides decision-support insights for evaluating regional water allocation under alternative hydrological and infrastructure development conditions.
1. Introduction
Water resources provide fundamental support for socioeconomic development and ecosystem sustainability. However, rapid urbanization, economic growth, and climate change have intensified the imbalance between water availability and demand, leading to increasing challenges in regional water security management. In many regions, water scarcity is not only associated with insufficient total water availability but also with the uneven spatial and temporal distribution of water resources. Therefore, improving the capacity of water resource allocation systems to coordinate multiple water sources, diverse water users, and competing management objectives has become a critical issue in sustainable water management [1,2,3].
Water resource allocation has evolved from traditional single-basin regulation toward integrated management involving multiple regions, water sources, and sectors [4,5]. Classical optimization approaches, including linear programming, dynamic programming, and multi-objective optimization, have provided effective tools for identifying optimal allocation strategies under predefined conditions [6,7,8,9]. These methods have been widely applied to reservoir operation, inter-basin water transfer, and regional water planning. However, conventional optimization models generally treat water demand, supply capacity, and management strategies as relatively fixed system parameters, while the adaptive responses and interactions among different stakeholders are often simplified or neglected. As water resource systems become increasingly interconnected and influenced by human activities, representing the dynamic interactions between natural and socioeconomic components has become essential for improving allocation decision-making [10,11,12].
In recent years, water network connectivity has emerged as an important strategy for addressing regional water imbalance. By integrating rivers, reservoirs, water diversion projects, and distribution infrastructures, water networks enhance the transferability of water resources across connected regions and regulation capacity of water resources, enabling water transfers from relatively water-abundant regions to water-deficient areas. Existing studies have demonstrated that inter-basin water transfers and water network development can improve regional water supply reliability, alleviate water shortages, and optimize spatial allocation patterns [13,14,15]. Nevertheless, water network connectivity does not simply represent an expansion of water supply capacity. The improvement of water accessibility may also reshape the behavior of water-related stakeholders. Enhanced water availability can influence agricultural irrigation strategies, industrial development patterns, urban water consumption, and government regulation priorities [16,17,18]. Therefore, water network connectivity may alter the decision environment of supply agents, demand agents, and management authorities by changing water accessibility and redistribution pathways. However, existing studies have mainly focused on evaluating the engineering effects of water network construction, such as increased water supply capacity and reduced water shortage, while the heterogeneous responses of different stakeholders to these changes remain insufficiently represented.
Complex adaptive systems (CAS) theory provides a useful perspective for understanding water resource systems characterized by multiple interacting components, feedback mechanisms, and differentiated responses [19]. From this perspective, water allocation systems are not merely physical infrastructure networks but coupled human–water systems in which different agents interact and make decisions under changing water availability and management conditions. MAS, as an effective computational approach for representing heterogeneous decision-making entities and their interactions, have been increasingly applied in water resource management. Previous studies have demonstrated that MAS can capture stakeholder conflicts, policy impacts, and cooperative decision-making processes that are difficult to represent using traditional optimization methods. For example, agent-based models have been applied to urban water demand regulation, and multi-stakeholder watershed allocation providing new insights into multi-stake holder water management [10,11,20].
Previous studies have significantly advanced water allocation optimization by improving mathematical formulations and considering multiple objectives. However, most existing approaches treat water users as aggregated demand sectors and focus primarily on optimal allocation outcomes. The interactions among heterogeneous stakeholders and their differentiated responses under changing water availability and infrastructure connectivity remain insufficiently represented. To address these gaps, this study develops a multi-agent water resource allocation model under water network connectivity conditions inspired by the complex adaptive systems perspective. The proposed framework represents three categories of agents, including government agents, supply agents, and demand agents. Supply agents represent different water sources, including surface water, groundwater, and unconventional water, while demand agents include agricultural, industrial, domestic, and ecological water users. By establishing decision rules and interaction relationships among different agents, the model aims to characterize how water network connectivity influences allocation outcomes through differentiated responses among stakeholders.
The Poyang Lake Basin in China is selected as a case study because it exhibits typical characteristics of spatially uneven water availability, diverse water demands, and increasing requirements for integrated water management under regional water network development. Multiple scenarios considering different water network connectivity conditions and hydrological conditions are designed to evaluate the impacts of connectivity on water supply security, shortage mitigation, spatial allocation equity, and water use efficiency.
Therefore, this study aims to develop a multi-agent-based framework to examine heterogeneous allocation responses under alternative hydrological and water network development scenarios. Specifically, it aims to: (1) develop a multi-agent framework linking water supply agents, water demand agents, and government-level multi-objective decision-making; (2) quantify differentiated allocation responses across water sources and user sectors under different inflow-frequency and water network development scenarios; and (3) evaluate the associated changes in regional water deficits, economic benefits per unit of allocated water, and spatial allocation patterns in the Poyang Lake Basin.
The contributions of this study are threefold. First, it links heterogeneous water supply and demand agents with government-level multi-objective optimization, extending the analysis of regional water allocation beyond aggregate optimization outcomes to differentiated source-specific and sector-specific allocation responses. Second, it provides a comparative assessment of how these responses vary across hydrological conditions and alternative water network development scenarios, revealing the contrasting allocation patterns that may be obscured by aggregate performance indicators. Third, the Poyang Lake Basin case study quantifies the changes in water deficits, economic benefits per unit of allocated water, and spatial allocation patterns associated with planned water network development.
2. Methods
This study develops a MAS to characterize differentiated water allocation responses under water network connectivity. The framework integrates three types of agents, including government agents, water supply agents, and water demand agents. These agents interact within a water allocation system characterized by network connectivity and make allocation decisions according to water availability, connectivity conditions, and regulatory constraints. The agents in this framework are rule-based decision units. Their responses are determined by predefined objectives, constraints, and decision rules under different hydrological and connectivity conditions.
2.1. MAS Framework for Water Resource Allocation
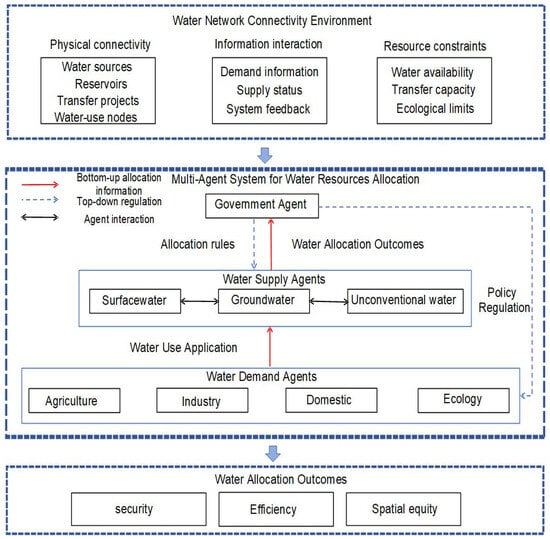
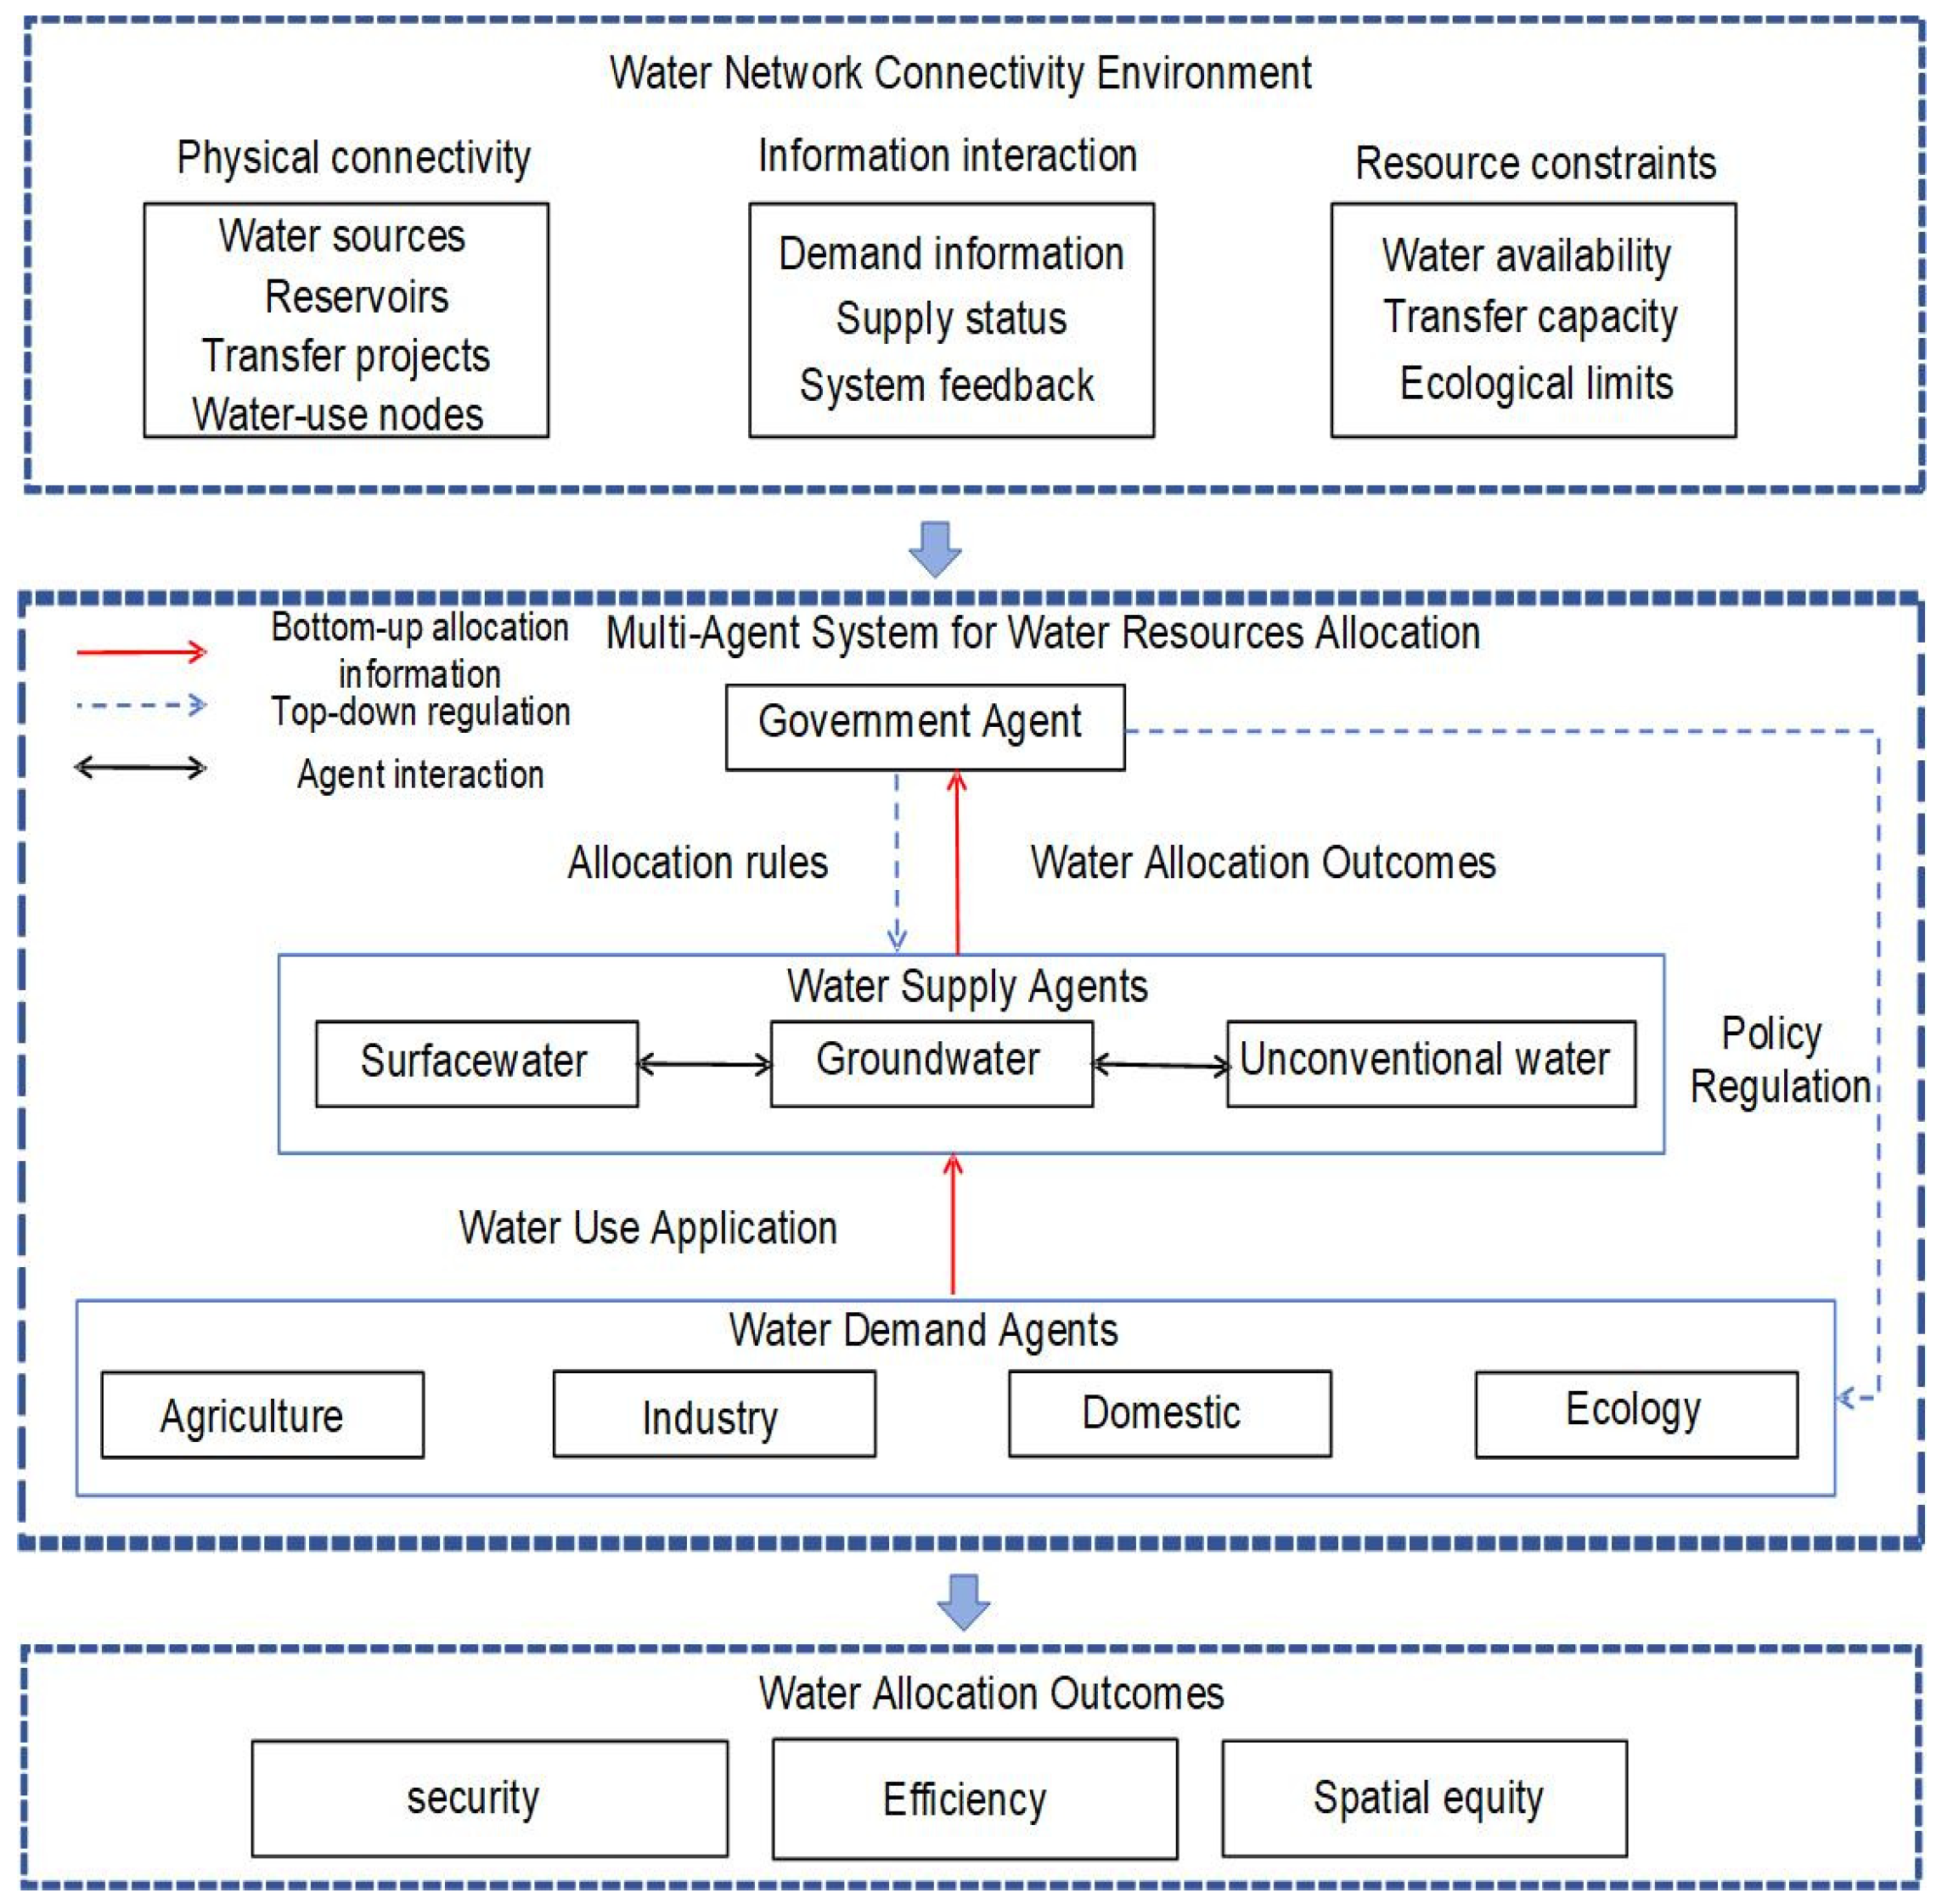
The water resource allocation system is conceptualized as an interactive system consisting of government, water supply, and water demand agents (Figure 1). The government agent represents regional water management authorities and is responsible for defining management objectives, setting allocation constraints, and regulating the behavior of other agents. Water supply agents represent surface water, groundwater, and unconventional water sources, while water demand agents represent agricultural, industrial, domestic, and ecological water users.
Figure 1.
MAS Framework for Water Resource Allocation.
Water network connectivity is represented as a structural feature of the water allocation system that defines the available transfer pathways among water sources, reservoirs, irrigation districts, water conveyance and distribution projects, and water consumption nodes. Connectivity does not constitute an independent agent; instead, it modifies water accessibility and redistribution pathways among supply and demand agents. Under connected network conditions, water resources can be transferred between connected regions when local shortages occur, thereby expanding the feasible allocation space of water supply agents.
The MAS operates through a feedback process. Demand agents generate water-use applications according to their sectoral requirements, while supply agents determine feasible allocation according to available water resources and network connectivity. The resulting allocation and shortage conditions are aggregated and fed back to the government agent. The government then adjusts relevant regulatory constraints, which in turn affect subsequent decisions of supply and demand agents. This process allows the model to represent interactive feedback among water availability, agent decisions, and government regulation.
2.2. Agent Interactions and Allocation Response Rules
The interactions among agents are represented through bottom-up and top-down processes. In the bottom-up process, agricultural, industrial, domestic, and ecological demand agents generate sector-specific water requirements according to predefined demand characteristics and transmit allocation requirements to corresponding supply agents. Supply agents then formulate allocation decisions subject to available water resources and government constraints. When a local water source cannot satisfy demand, a shortage signal is generated, and connected supply agents provide supplementary allocation according to their available capacity and connectivity constraints. The allocation results from individual supply agents are subsequently aggregated into system-level indicators, such as total water deficit, and reported to the government agent.
In the top-down process, the government agent regulates the allocation system by imposing constraints such as total water-use control, allowable groundwater withdrawal, and minimum ecological instream flow. Supply agents incorporate these regulatory conditions into their feasible decision ranges. Meanwhile, demand agents are represented through sector-specific allocation requirements and efficiency parameters, which vary according to scenario conditions and management constraints.
The decision process of supply agents follows a hierarchical allocation structure. Within the allocation procedure, a rigid sectoral water-use priority is implemented: domestic water receives the highest priority, followed by ecological water, industrial water, and agricultural water with the lowest priority. Surface water is allocated first according to sectoral priorities and network connectivity. Groundwater and unconventional water resources are treated as supplementary water sources subject to prescribed supply constraints. When surface water is insufficient, groundwater provides supplementary supply within its allowable extraction limit, followed by unconventional water within its treatment or production capacity. Agricultural shortages are recorded after higher-priority demands have been allocated, subject to available supplies and source-specific constraints.
Demand agents are represented as heterogeneous sectoral units with different allocation requirements and response rules (Table 1).
Table 1.
Response Rules of Water Demand Agents.
Agricultural reference water demand was determined by the prescribed irrigation requirement and irrigation efficiency. Where a higher irrigation efficiency was assumed in the planned-network scenarios, less water withdrawal was required to meet the same net irrigation requirement.
where Wa = agricultural water demand (m3); M = comprehensive net irrigation quota per unit area (m3/km2); η = irrigation water utilization coefficient; Sa = irrigated area of the farmland (km2).
Domestic reference demand was calculated using the population and per capita domestic water-use quota specified for each scenario.
where Wd = domestic water demand (m3); p = the total population (person); α = urbanization rate of the permanent resident population; qu = per capita daily domestic water quota for urban residents (L/(person·d)); qr = per capita daily domestic water quota for rural residents (L/(person·d)).
Industrial agents represent sector-specific water demands and economic benefits associated with water allocation.
where Wi = industrial water demand (m3); Q = industrial value added (104 CNY); γ = industrial water quota (m3/104 CNY).
Ecological agents represent minimum ecological water requirements.
where We = the ecological water demand (m3); Wtar = the target ecological water demand (m3).
2.3. Water Resource Allocation Model
The government agent represents regional water management authorities and undertakes macro regulatory functions. Its core responsibilities include defining management objectives, setting water allocation constraints, and dynamically adjusting regulatory strategies based on system feedback. The government agent faces multi-faceted policy objectives in water resources allocation, with divergent priorities across different regions and development stages. In this study, three dimensions—water supply security, economic benefit, and social equity—are incorporated into the objective functions to construct a multi-objective optimization problem.
Objective 1: Minimization of regional integrated water deficit. The total water deficit of all water demand agents throughout the entire simulation period is adopted as the optimization objective, which directly reflects the balance between water supply and demand [21]:
where t = time period (month);T = total number of months in the simulation period (year); Vu = set of all water demand agents; l = index of water demand agent, l ∈ Vu; = water demand of agent l in period t, 108 m3; = actual allocated water volume of agent l in period t, 108 m3; The deficit term takes only positive values to ensure only water shortages are counted.
Objective 2: Maximization of economic benefit per unit water volume. This objective quantifies water use efficiency and guides water allocation toward sectors with higher economic output [22]:
where Vind = set of all industrial water demand agents; Vagr = set of all agricultural water demand agents; GDPl,ind(t) = economic value added generated by industrial agent l during period t, 10,000 CNY; GDPl,agr(t) = economic value added generated by agricultural agent l during period t, 10,000 CNY; = actual allocated water volume of agent l in period t, 108 m3.
Objective 3: Improvement of spatial allocation equity. A lower value indicates a more balanced spatial allocation pattern. For multi-administrative districts, the standard deviation of water supply reliability across districts is used to measure spatial allocation equity [23]:
where m denotes the index of an administrative district, m = 1, …, M, and M is the total number of administrative districts; SRm = water supply reliability of administrative district m; = average water supply reliability of all administrative districts; M = total number of administrative districts.
Water supply agents represent heterogeneous water sources, including surface water, groundwater, and unconventional water resources (Table 2). Each supply agent determines feasible allocation according to available resources, network connectivity conditions, and governmental constraints. In this framework, connectivity is represented as a constraint on feasible water transfer pathways rather than an independent decision-making agent. The water network is characterized by connected nodes and transfer links. Under connected conditions, surface water agents can access additional transfer pathways when local shortages occur, thereby expanding the feasible allocation space. Groundwater and unconventional water agents provide supplementary allocation within extraction and production constraints.
Table 2.
Decision-Making Process of Water Supply Agents.
2.4. Scenario Framework and Model Implementation
To quantitatively assess the impacts of water network connectivity construction on the water resources allocation pattern of the Poyang Lake Basin, this study establishes a comparative scenario framework from two dimensions: water network connectivity status and inflow frequency.
Two types of scenarios are designed for water network connectivity status: (1) Current water network connectivity scenario: Only existing completed hydraulic projects and water conveyance channels are activated, without incorporating planned new, reconstructed or expanded projects. (2) Planned water network development scenario: Based on the existing water network, planned new, reconstructed and expanded reservoirs, irrigation districts and associated water-transfer infrastructure are incorporated into the scenario. This scenario represents the combined effects of network development and changes in water storage, supply capacity and service coverage. Therefore, the comparison between current and planned scenarios evaluates the integrated effect of water network development rather than the isolated effect of connectivity alone.
The planned water network scenario was developed based on the Jiangxi Provincial Water Network Construction Plan. In addition to existing reservoirs and irrigation districts, the scenario incorporated Grade A planned projects involving the construction, reconstruction, or expansion of large and medium-sized reservoirs and large irrigation districts. Grade A projects were prioritized because their implementation schedules and project scales were relatively well defined, making them more suitable for inclusion in the planning model. Irrigation projects classified as Grade B or below were not listed separately because their implementation schedules remained uncertain. The selected projects included seven large reservoirs, seven medium-sized reservoirs, two new large irrigation districts, and five large irrigation districts undergoing continued construction, supporting works, or modernization (Table 3). These projects were included in the planned water network scenarios (S2 and S4), whereas the current-network scenarios (S1 and S3) considered existing infrastructure only.
Table 3.
Projects to Be Newly Built, Reconstructed and Expanded.
Two hydrological scenarios are set according to inflow frequency: (1) The 50% inflow frequency serves as the baseline hydrological scenario to analyze the water resources allocation pattern under normal supply-demand conditions. (2) The 95% inflow frequency represents the extreme hydrological scenario, which is adopted to analyze the decision-making behaviors and allocation outcomes of all agents under severe water shortage, and evaluate the risk resistance capacity of the connected water network against extreme hydrological events. The inflow frequencies represent the exceedance probabilities of basin inflow conditions derived from historical hydrological records. The 50% inflow frequency represents a normal hydrological condition, whereas the 95% inflow frequency represents an extreme low-inflow condition. In this study, the 95% scenario represents a basin-scale severe water shortage condition used to evaluate the allocation responses under extreme hydrological stress (Table 4).
Table 4.
Scenario Settings.
Historical monthly streamflow records from 1956 to 2021 were used to characterize hydrological conditions for scenario construction. For each gauging station, annual mean discharge was calculated using years with complete records for all 12 months. The annual mean discharge values were ranked in descending order, and empirical exceedance probabilities were calculated using (8). A Pearson type III distribution was fitted to the annual mean discharge series by estimating the coefficient of variation and coefficient of skewness while keeping the mean fixed.
where P = empirical exceedance probability; m = rank of the annual mean discharge (descending order); n = number of valid years with complete monthly records.
where xi = annual mean discharge of the i-th year; = sample mean of annual mean discharge series; n = number of valid years (sample size); Cv = coefficient of variation; Cs = coefficient of skewness.
For scenario construction, streamflow data from selected control stations were aggregated to obtain regional inflow series (Table 5). Representative hydrological years were then identified based on the exceedance frequency of the regional inflow series, and the observed monthly discharge sequence for the selected year was used to construct the corresponding inflow scenario. Two inflow-frequency conditions were considered: 50% and 95%. The 50% scenario represents a median-flow condition, whereas the 95% scenario represents a low-flow condition. A common historical year was adopted for the eleven prefecture-level cities in the 95% scenario to provide a consistent basis for basin-wide allocation comparison.
Table 5.
Main Parameters of the Controlling Hydrological Stations of Poyang Lake.
The model was implemented in Python 3.10 to determine the water allocation scheme for the planning year 2030, using 2023 as the base year. NSGA-II was employed to optimize the three objectives defined by the government agent: minimizing the regional integrated water deficit, maximizing economic benefit per unit of allocated water, and minimizing spatial disparities in water supply reliability. The algorithm was configured with a population size of 100, a maximum of 100 generations, a crossover probability of 0.90, and a mutation probability of (1/n), where (n) denotes the number of decision variables. The decision variables represent three government policy parameters: the water transfer ratio, groundwater limit factor, ecological protection factor. The model therefore contains three independent decision variables, each subject to predefined bounds. These parameters regulate the allocation and demand-response processes of the supply and demand agents. Water availability is determined by the supply agents, while the demand agents calculate sectoral water requirements and update their state variables according to the resulting allocation and water supply reliability. The allocation outcomes are then aggregated to calculate the three objective values.
The government-agent feedback mechanism operates on a monthly basis rather than through a separate iterative convergence loop. At the beginning of each month, the government agent determines policy parameters using the water supply reliability indicators obtained from the preceding month. The supply and demand agents then calculate water availability and sectoral demands, respectively, and water is allocated according to the prescribed sectoral priorities and source-specific allocation rules. At the end of each month, the government agent updates its summary of regional and sectoral water supply reliability, which informs its policy decisions for the following month. The simulation proceeds for 12 months and terminates when the predefined simulation horizon is completed; no additional feedback-convergence threshold is specified in the code. Thus, the model performs 12 monthly policy updates and 11 within-year transitions in which the preceding month’s outcomes inform the next month’s policy decision. This monthly feedback process is distinct from the 100 evolutionary generations of NSGA-II, which iteratively improve the candidate policy solutions.
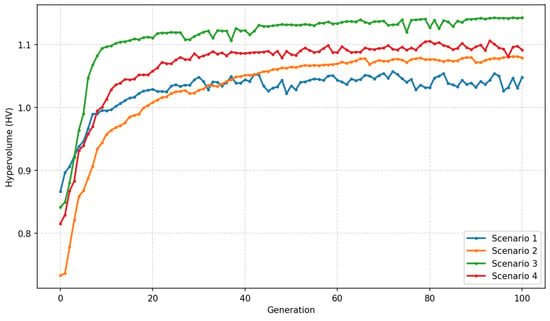
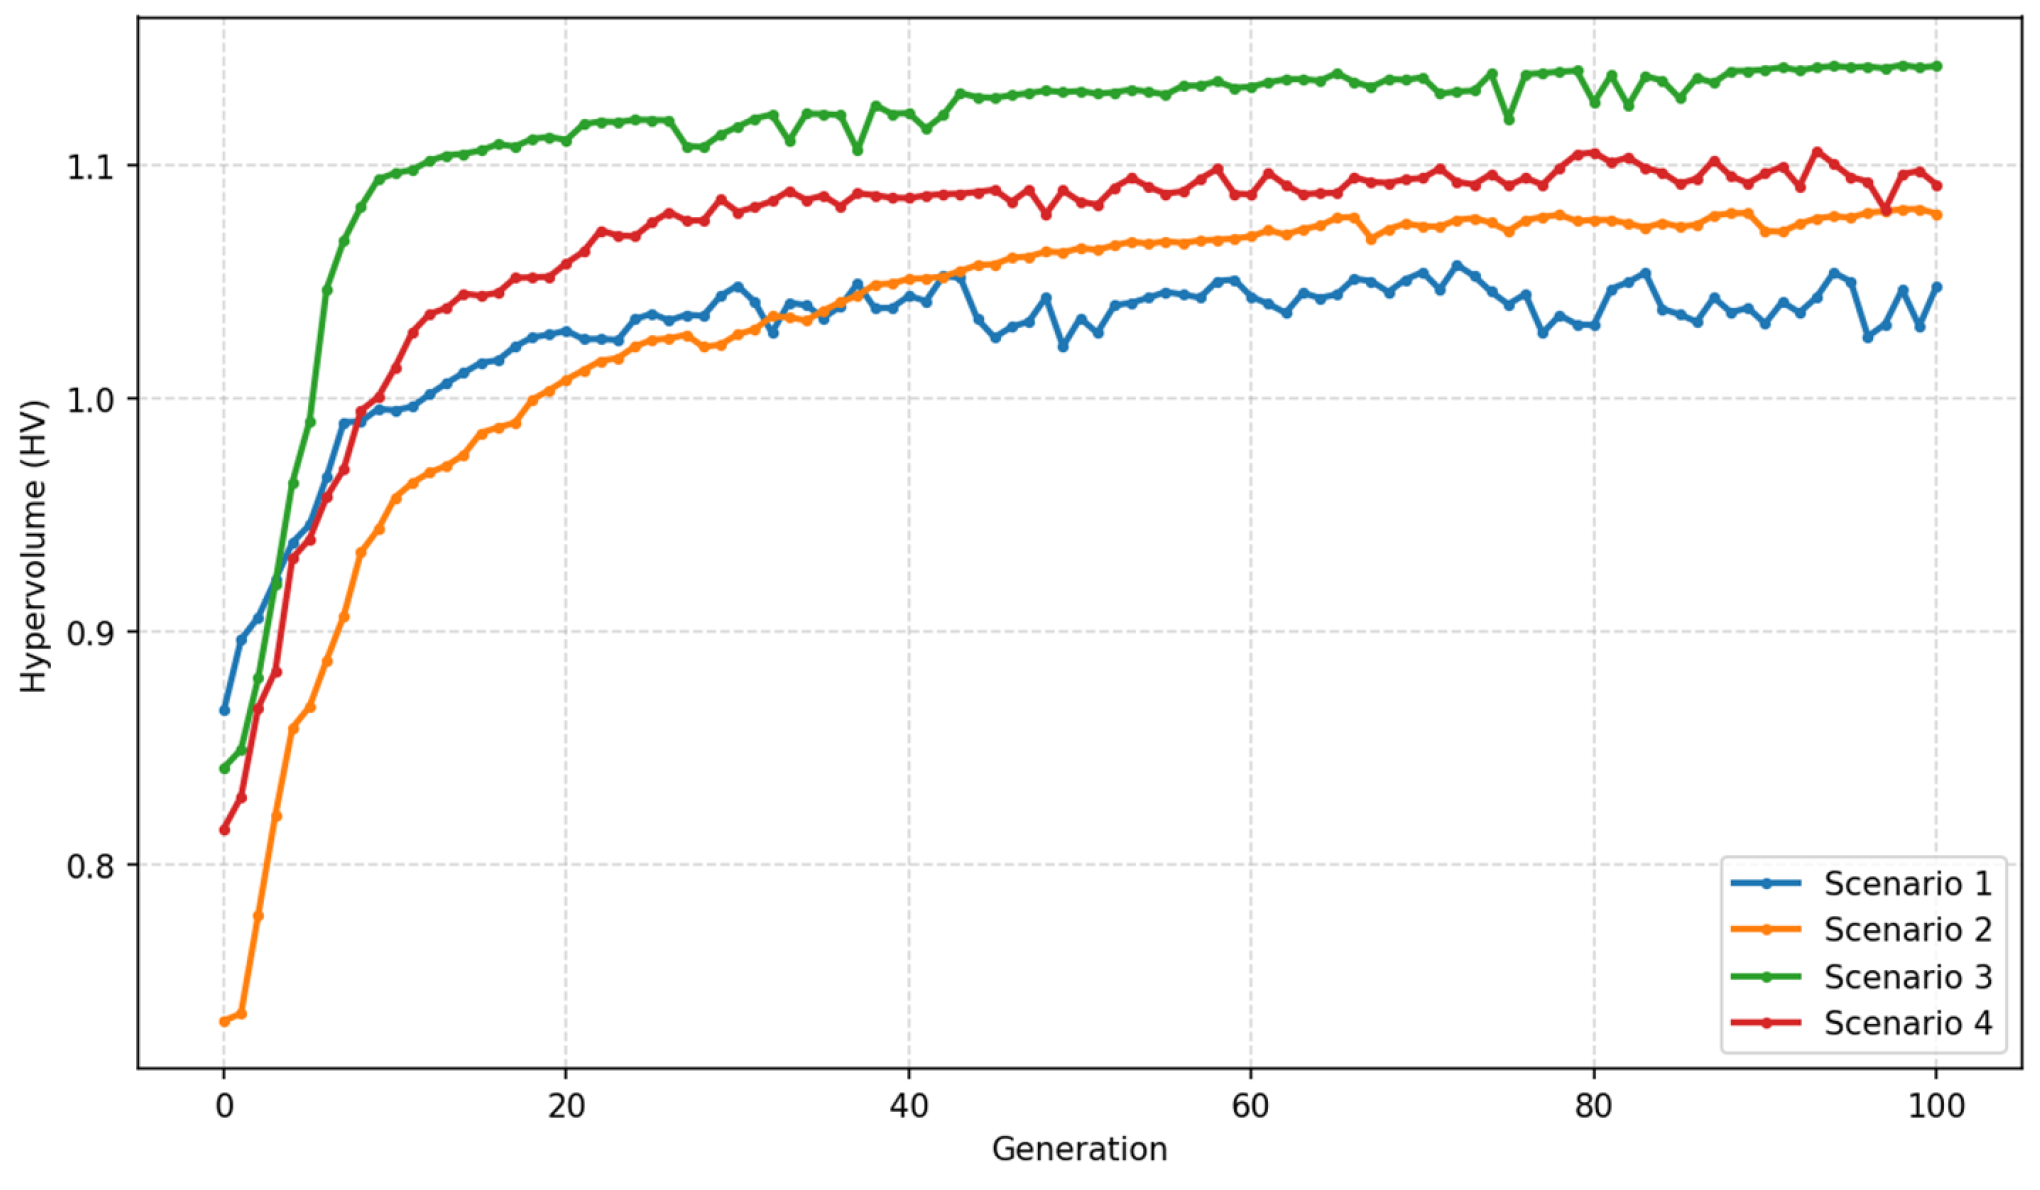
For each scenario, the non-dominated solutions obtained from the optimization process were used to characterize the trade-offs among the three objectives. The final allocation scheme was selected using the compromise solution principle, defined as the solution with the minimum overall deviation from the ideal objective vector. Algorithm convergence was examined using the hypervolume indicator calculated across successive generations, together with changes in the objective values of the non-dominated solutions. The hypervolume indicator showed a tendency to stabilize in the later generations, suggesting that the improvement in the non-dominated solution set became limited (Figure 2).
Figure 2.
Hypervolume converge of NSGA-II.
Historical data from 2019 to 2023 were used to evaluate the model under the current water infrastructure conditions. For each year, simulated and observed water consumption was compared across the 11 administrative districts of the Poyang Lake Basin. The basin-wide simulated and observed values reported in Table 6 are the aggregated values across the 11 districts. The model consistently underestimated observed water consumption during 2019–2023, with an overall percent bias of approximately −1.97%. Although the overall percent bias was relatively small (−1.97%), the district-level MAE provides a complementary measure of model accuracy. To evaluate the magnitude of the error relative to the scale of water use in individual districts, the MAE was normalized by the mean observed water consumption per district, calculated as the basin-wide observed consumption divided by the 11 administrative districts. The normalized MAE ranged from 7.08% to 11.42% during 2019–2023, indicating that the average absolute error was equivalent to approximately 7–11% of the mean district water consumption. The relatively larger discrepancy in 2022 coincided with the severe drought that occurred in the Poyang Lake Basin, indicating that the predefined allocation rules may not fully reproduce rapid responses under exceptional hydrological conditions. The validation therefore evaluates the model’s ability to reproduce historical water-use patterns at the aggregate and district levels. The validated model was subsequently used for comparative scenario analysis under different water network and hydrological conditions.
Table 6.
Comparison of simulated and observed annual water consumption (108 m3).
In the planned-network scenarios, the demand-side parameters were specified to reflect the assumptions adopted for planned infrastructure development (Table 7). In particular, agricultural irrigation efficiency was adjusted where supported by the scenario parameter settings, while a higher per capita domestic water-use quota was assumed to represent projected improvements in living standards. These assumptions affect the reference demands used in the allocation model and are distinguished from changes in actual water allocation resulting from water availability and network conditions.
Table 7.
Parameters and Sources of Demand agents.
A one-at-a-time sensitivity analysis was conducted to examine the effects of key input parameters on the model outcomes (Table 8). Four parameters were selected: irrigation water utilization coefficient, industrial value added, per capita daily domestic water quota for urban residents, and target ecological water demand. Each parameter was independently varied by ±10% relative to its baseline value, while the other input parameters, scenario settings, and government allocation policy were held constant. The results indicate that irrigation efficiency had the strongest influence on total water shortage. A 10% decrease irrigation water utilization coefficient increased total shortage by 20.51–25.32% across the four scenarios, whereas a 10% increase reduced it by 15.31–19.39%. By comparison, changes in industrial value added resulted in changes of approximately 1.17–1.62% in total shortage. Changes in the per capita daily domestic water quota for urban residents and target ecological water demand produced comparatively small changes in the three objective indicators. This analysis evaluates parameter sensitivity under a fixed government allocation policy. It does not represent the response of re-optimized solutions to parameter uncertainty (Table 9).
Table 8.
Sensitivity of model objectives to ±10% changes in key input parameters.
Table 9.
Prefecture-level City Socioeconomic and Water-demand Parameters for 2030.
3. Case Study
The Poyang Lake Basin was selected as the study area for three main reasons. First, Jiangxi Province is among the earlier provinces in China to implement the national water-network development strategy, making the basin a representative case for examining water allocation under ongoing water-network development. Second, the basin is a typical water-abundant region in southern China, but its water resources are unevenly distributed in time and space, resulting in seasonal shortages and regional mismatches between water supply and demand. This makes it suitable for investigating water allocation responses under different connectivity conditions and provides potential reference for other water-abundant basins facing similar challenges. Third, the basin boundary largely overlaps with the administrative boundary of Jiangxi Province, with approximately 96.62% of the basin area located within Jiangxi Province. This relatively consistent spatial boundary facilitates the correspondence between water-management policies and the agents represented in the model.
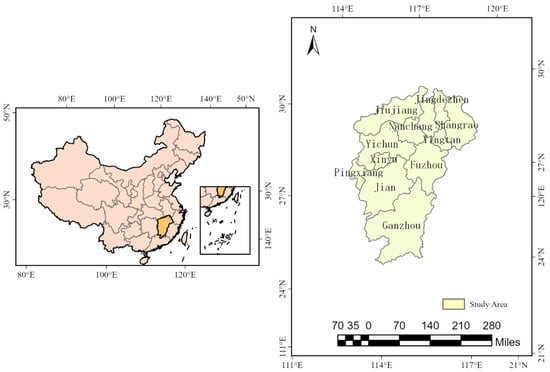
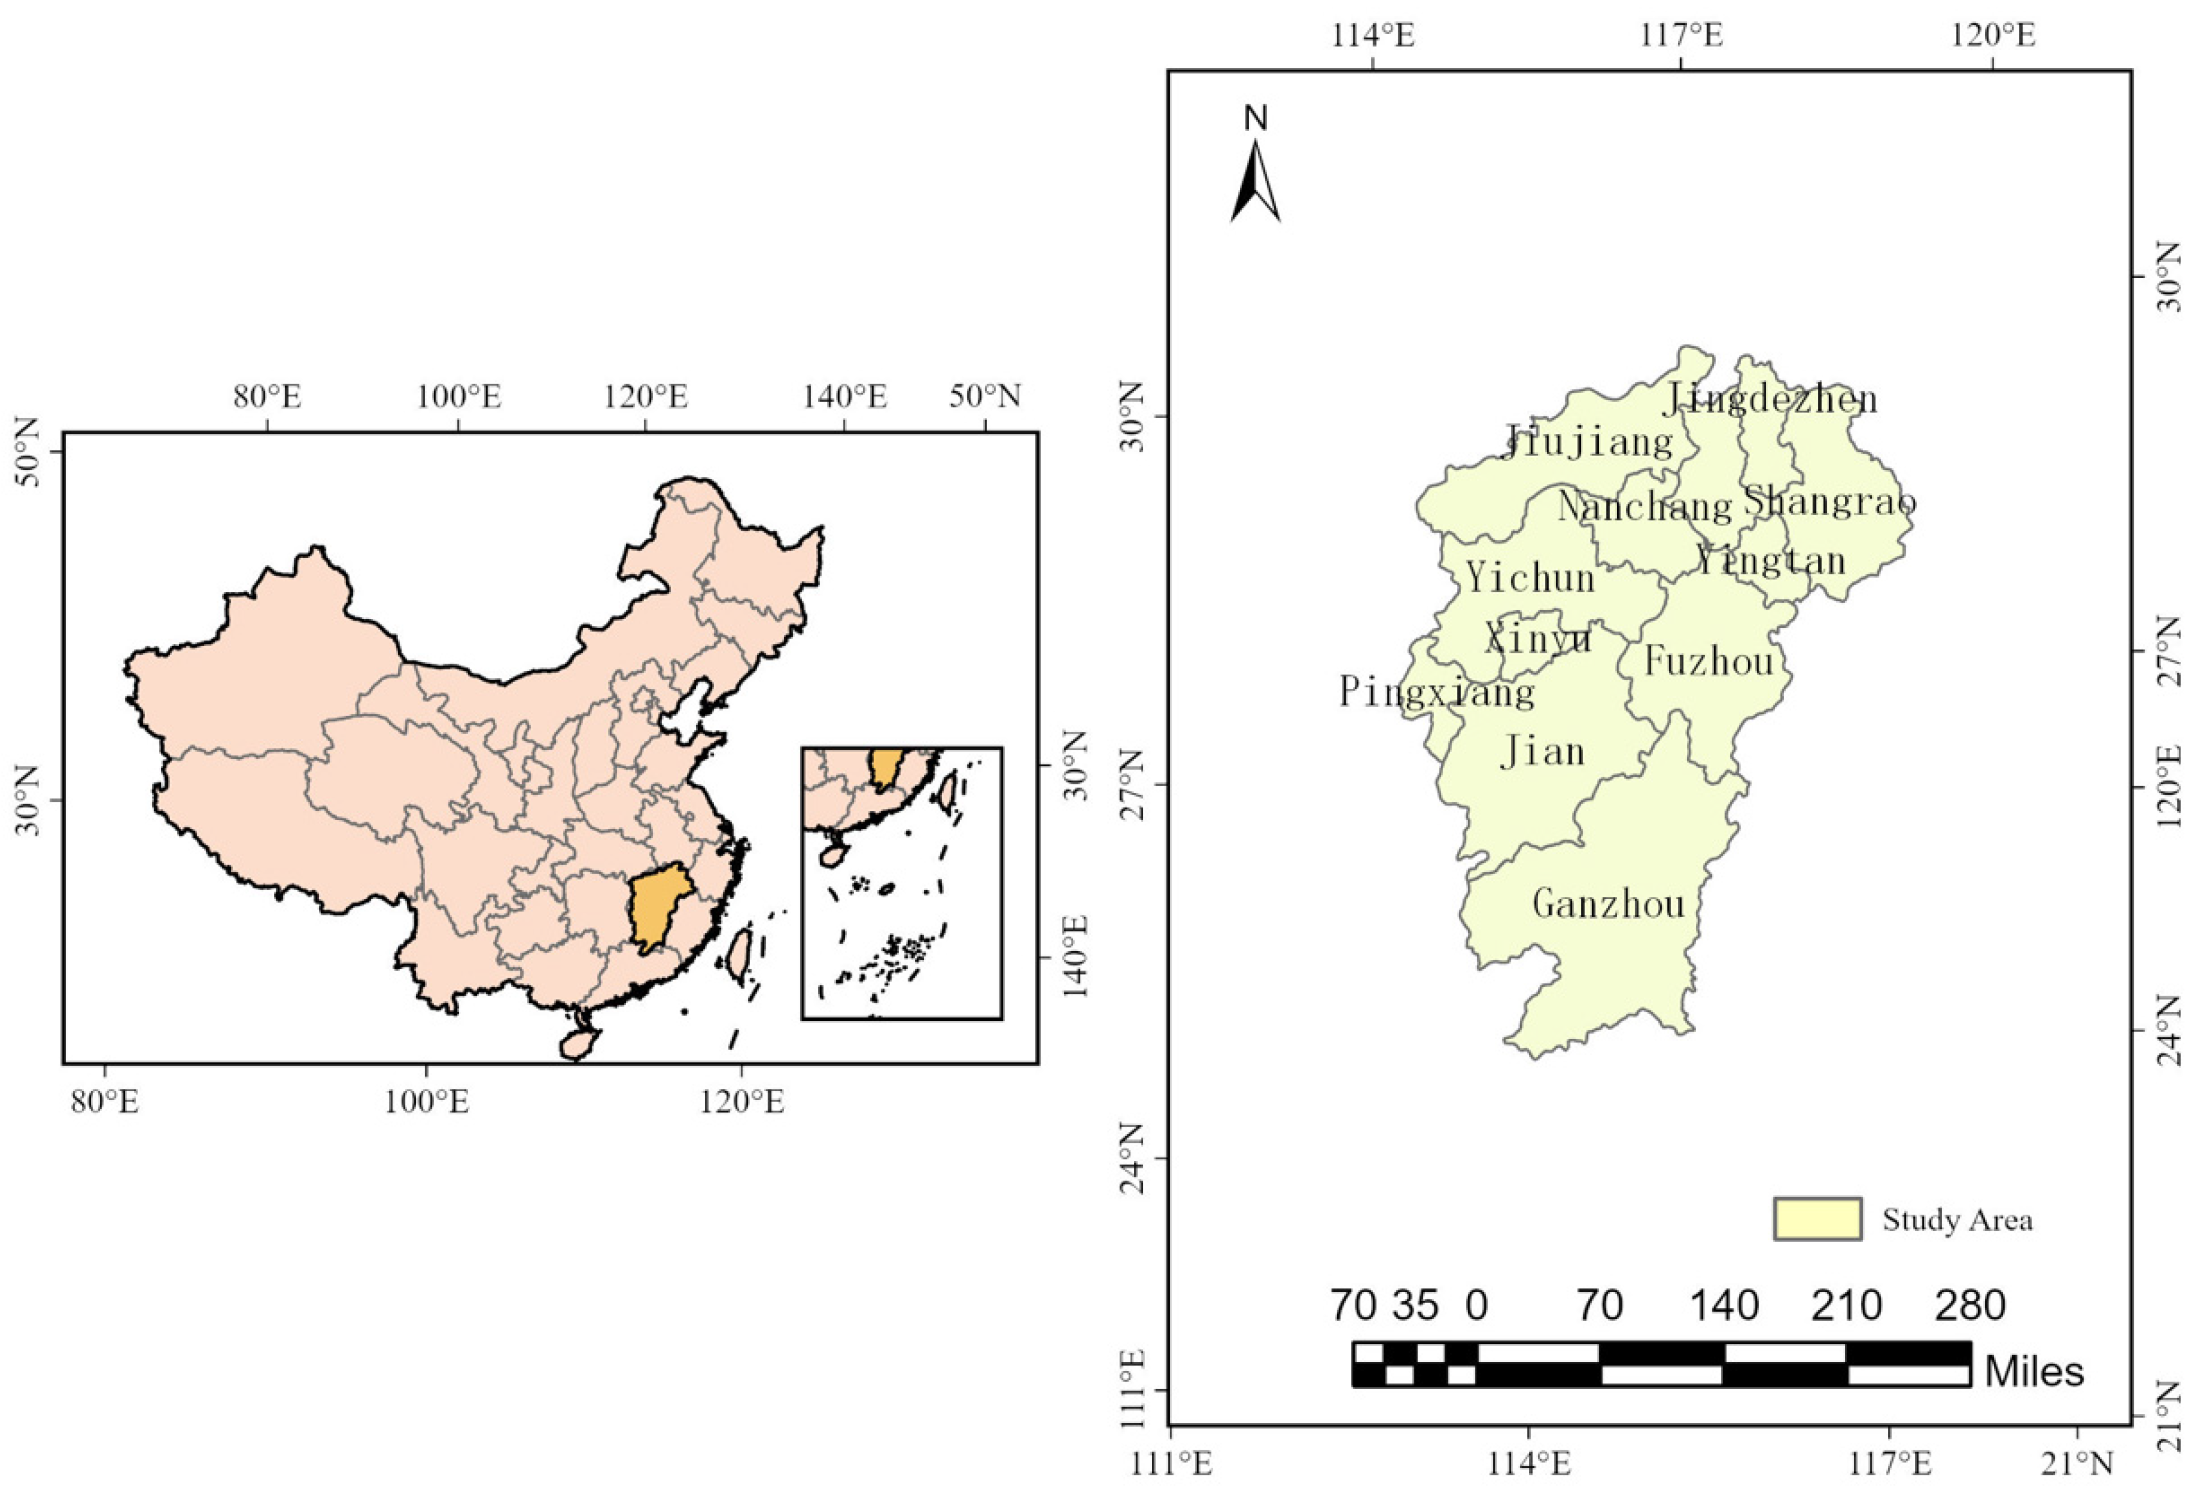
The Poyang Lake Basin covers a drainage area of 162,225 km2, accounting for approximately 9% of the Yangtze River Basin’s total area. Of this total, 156,743 km2 lie within Jiangxi Province, equivalent to 96.62% of the entire basin area. Although approximately 96.62% of the Poyang Lake Basin lies within Jiangxi Province, the remaining 3.38% extends beyond the provincial boundary. The watershed boundary is largely consistent with the administrative boundary of Jiangxi Province. The allocation model is administratively represented by the 11 prefecture-level cities in Jiangxi Province. Therefore, the portion outside Jiangxi Province is not represented as a separate administrative unit or demand agent in the model (Figure 3). According to official statistical data of Jiangxi Province, the permanent resident population of the Poyang Lake Basin reached 45.15 million by the end of 2023. Nanchang and Ganzhou recorded the highest regional GDP, at 721.29 billion yuan and 460.62 billion yuan respectively. Jiangxi Province’s total water consumption in 2023 stood at 240.65 × 10⁸ m3, with the provincial comprehensive per capita water consumption reaching 533 m3. In terms of water use structure, agricultural water consumption remains dominant, reaching 169.16 × 10⁸ m3 and making up 70.3% of total water use. Agricultural water demand is mainly concentrated in major grain-producing regions of central and southern Jiangxi, with paddy field irrigation as the primary water-consuming activity. Industrial water use totaled 37.92 × 10⁸ m3, accounting for 15.8% of the provincial total. High water-consuming industries include thermal power, iron and steel, petrochemicals, and lithium battery manufacturing, whose water demands are primarily distributed in Jiujiang, Xinyu, Yichun and other cities. Domestic water consumption amounted to 29.52 × 10⁸ m3 (12.3% of total use), showing a steady upward trend alongside urbanization progress. Ecological environmental water use was 4.05 × 10⁸ m3, representing 1.7% of overall water withdrawal.
Figure 3.
Prefecture-level cities in the Poyang Lake basin, Jiangxi Province.
4. Results
4.1. System-Level and Spatial Allocation Performance Under Different Scenarios
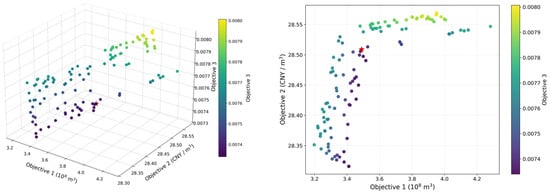
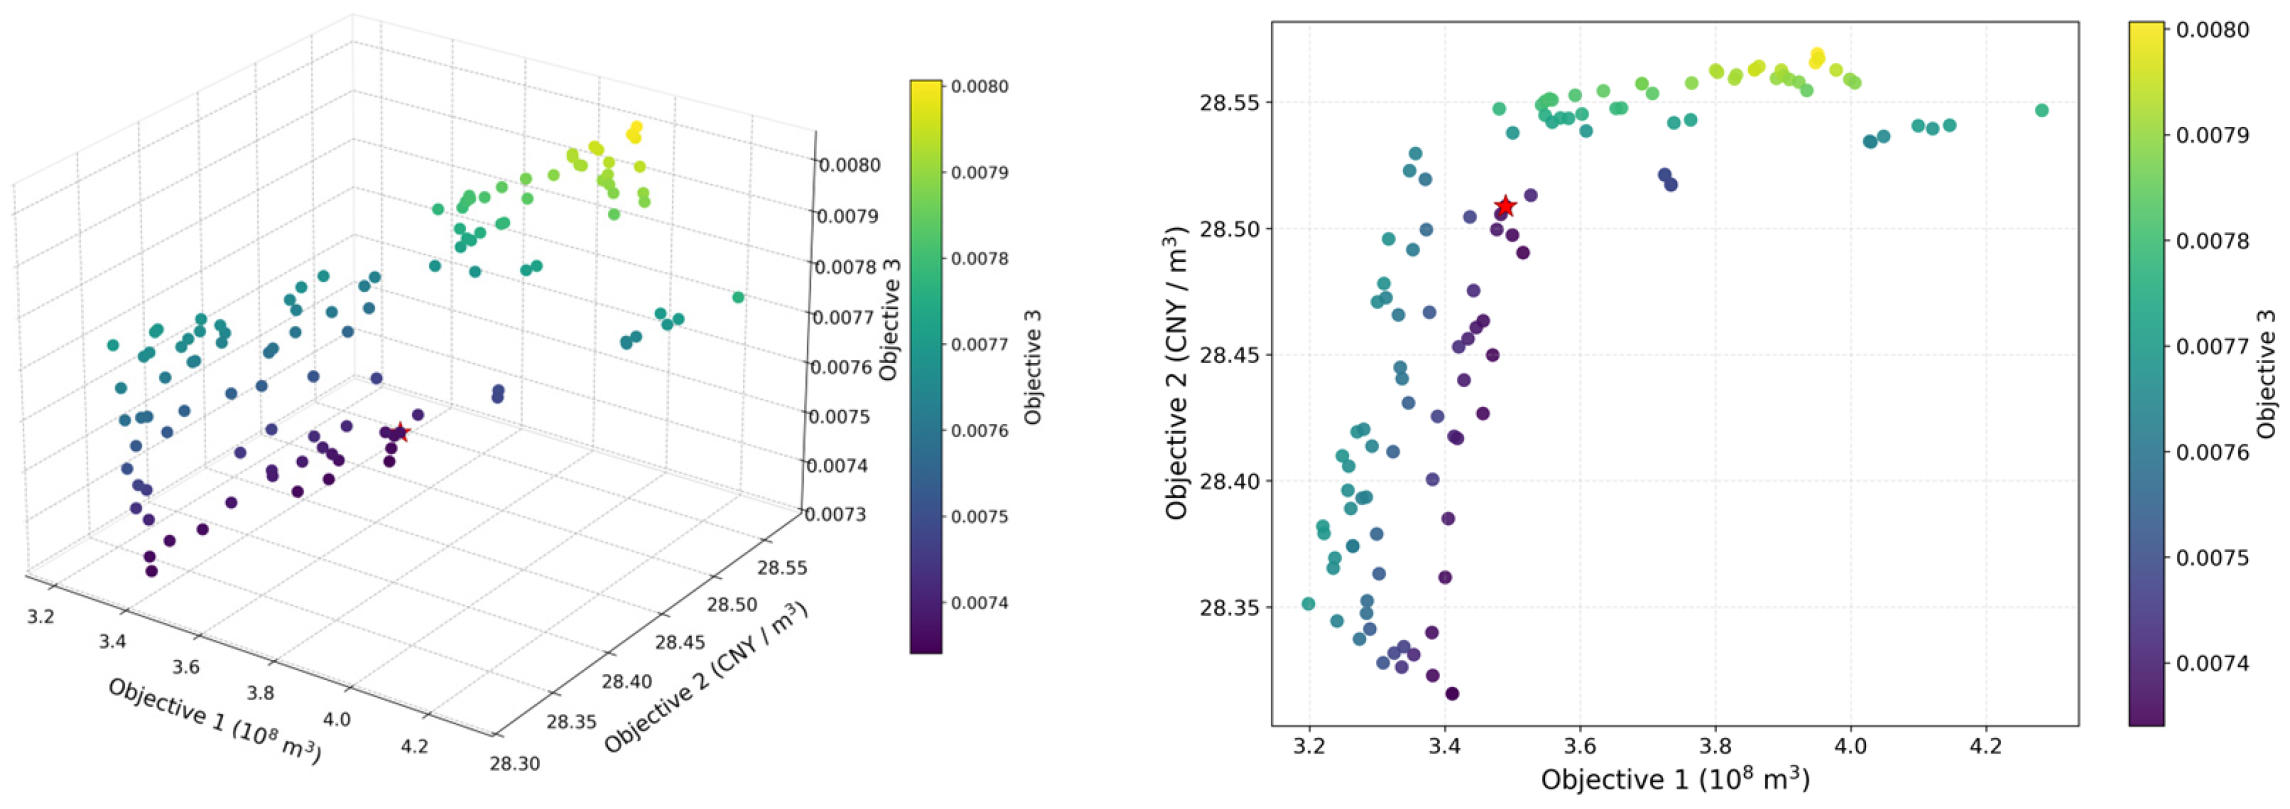
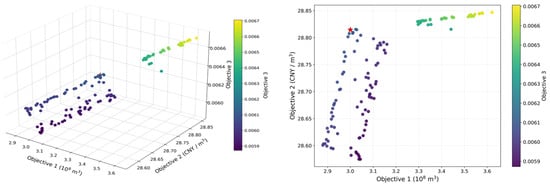
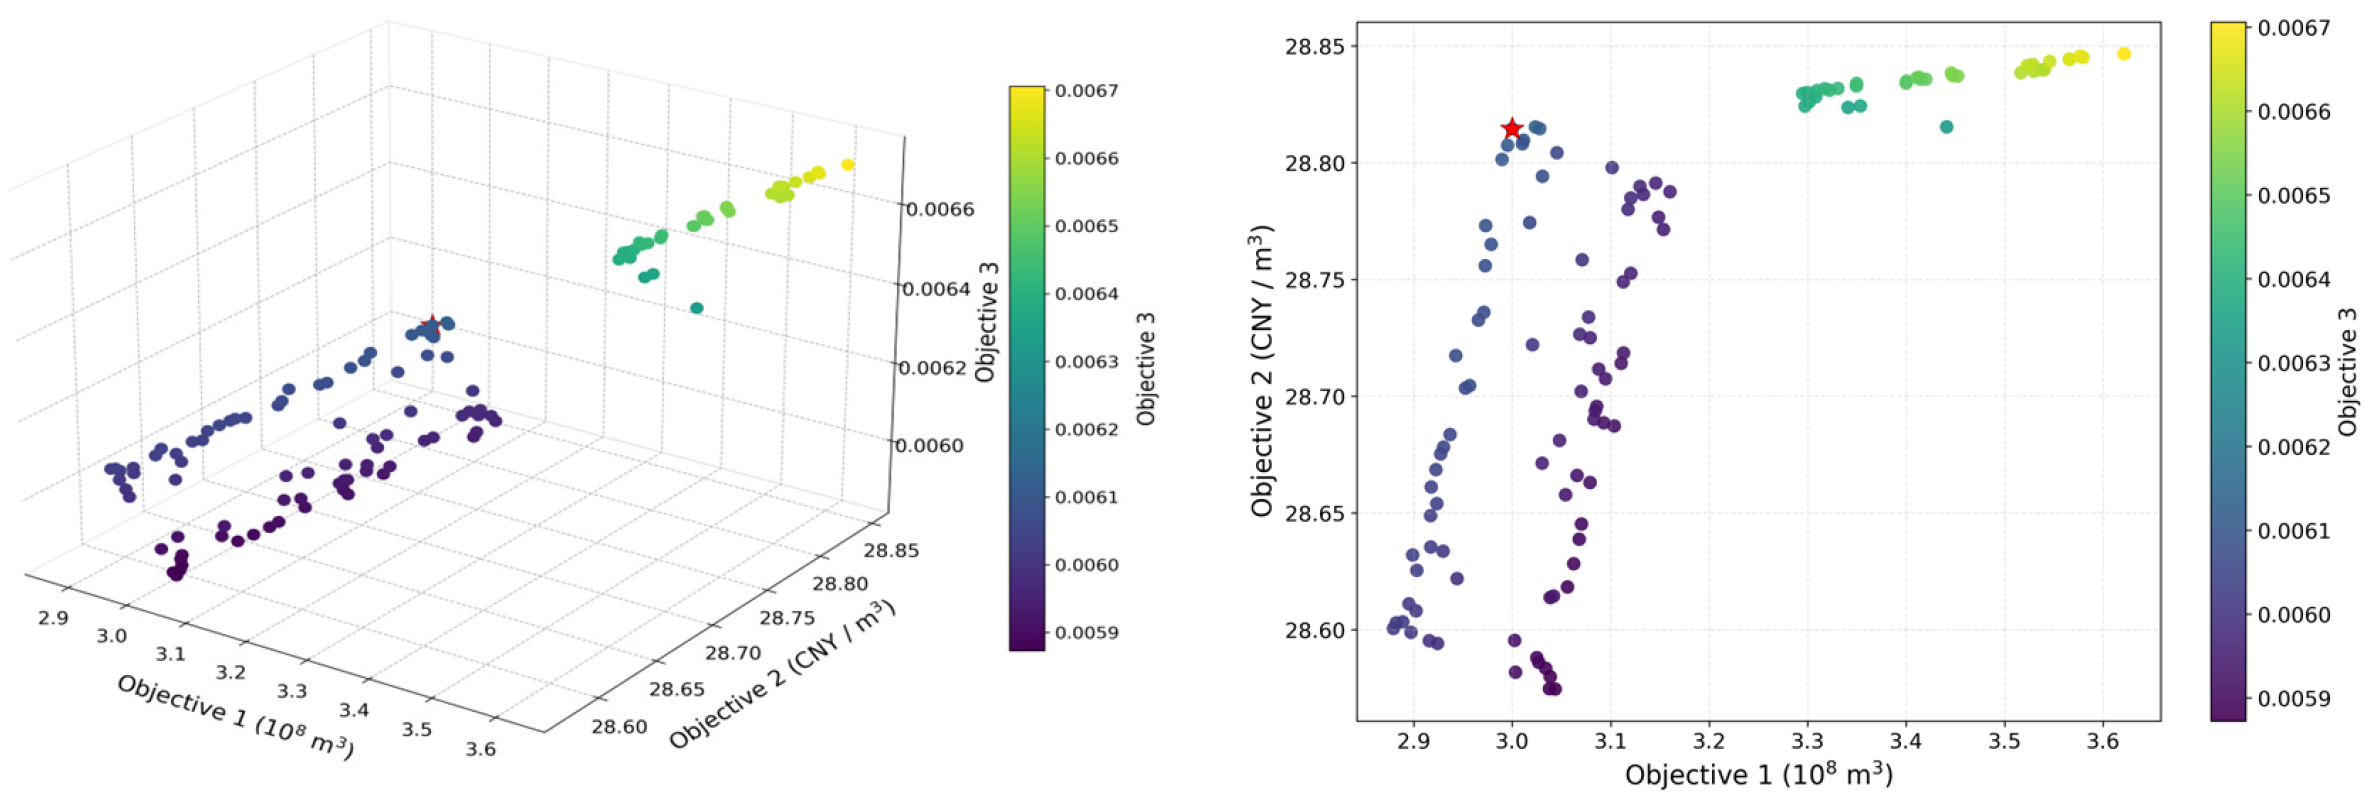
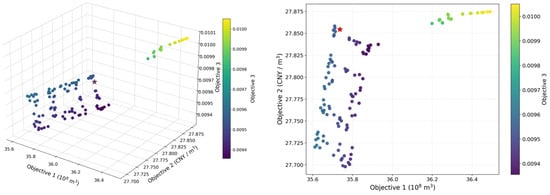
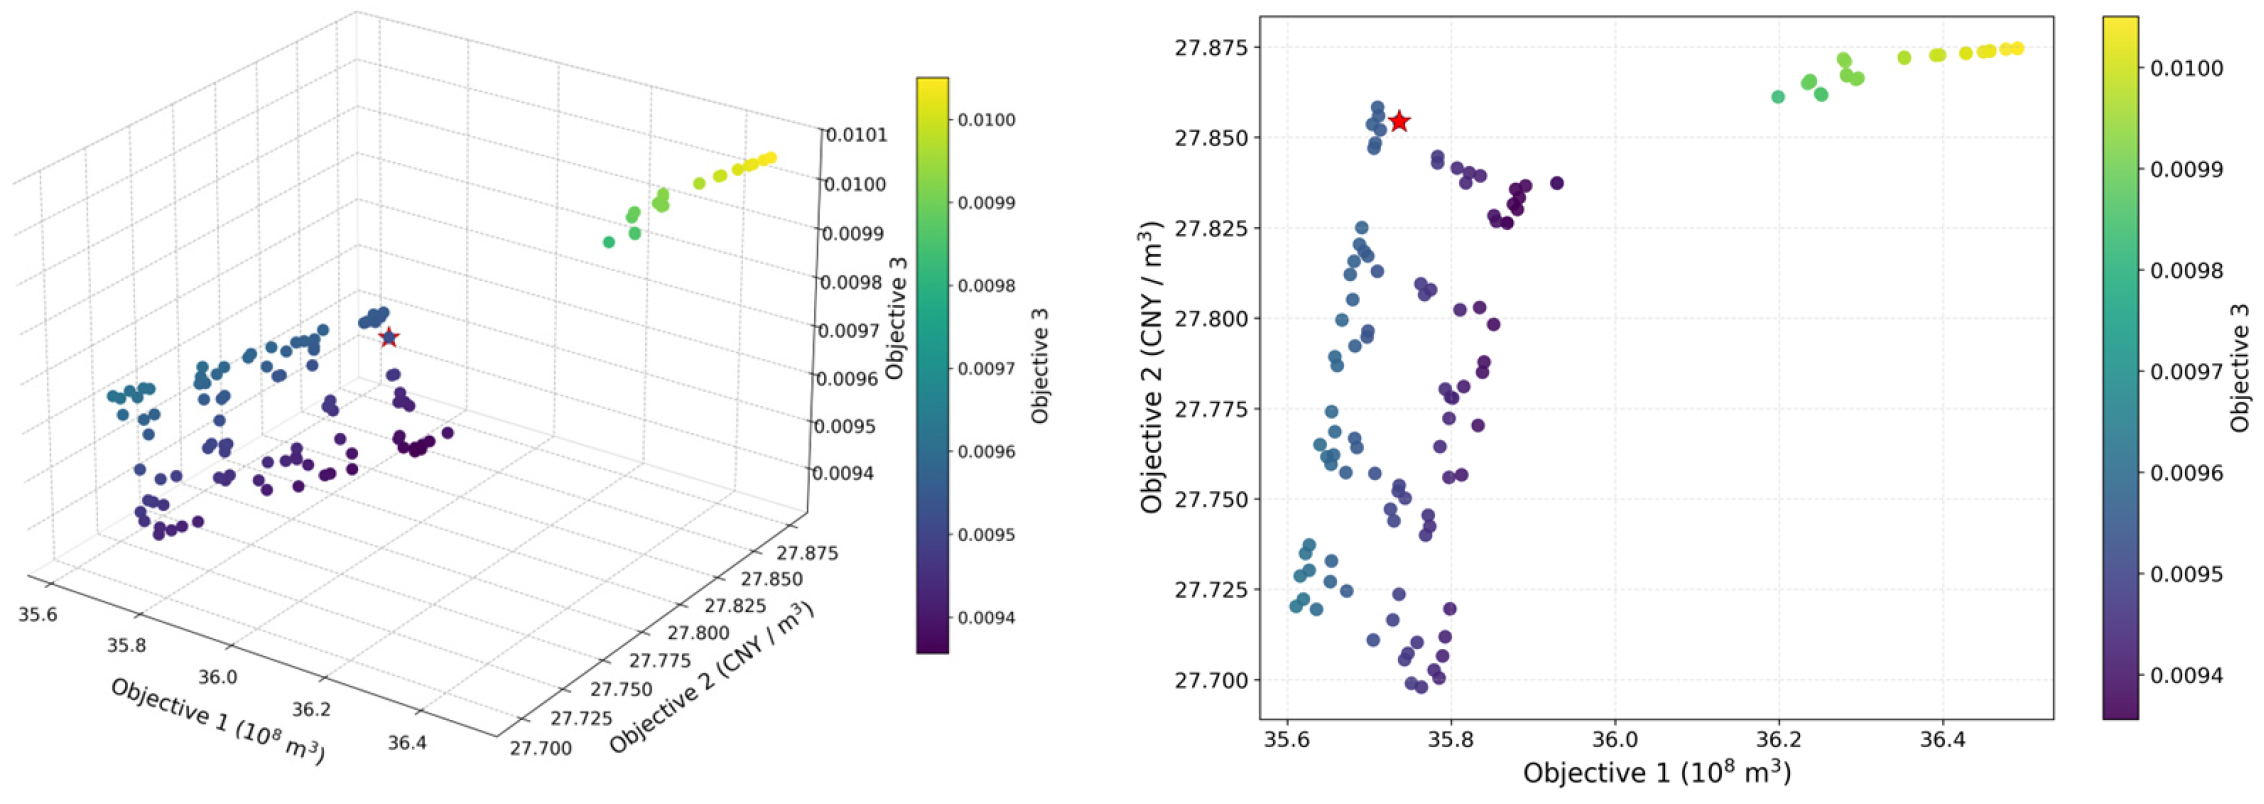
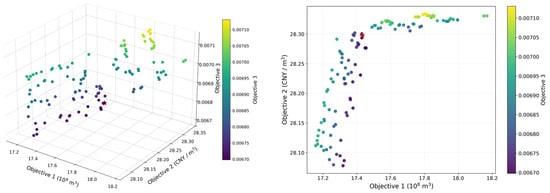
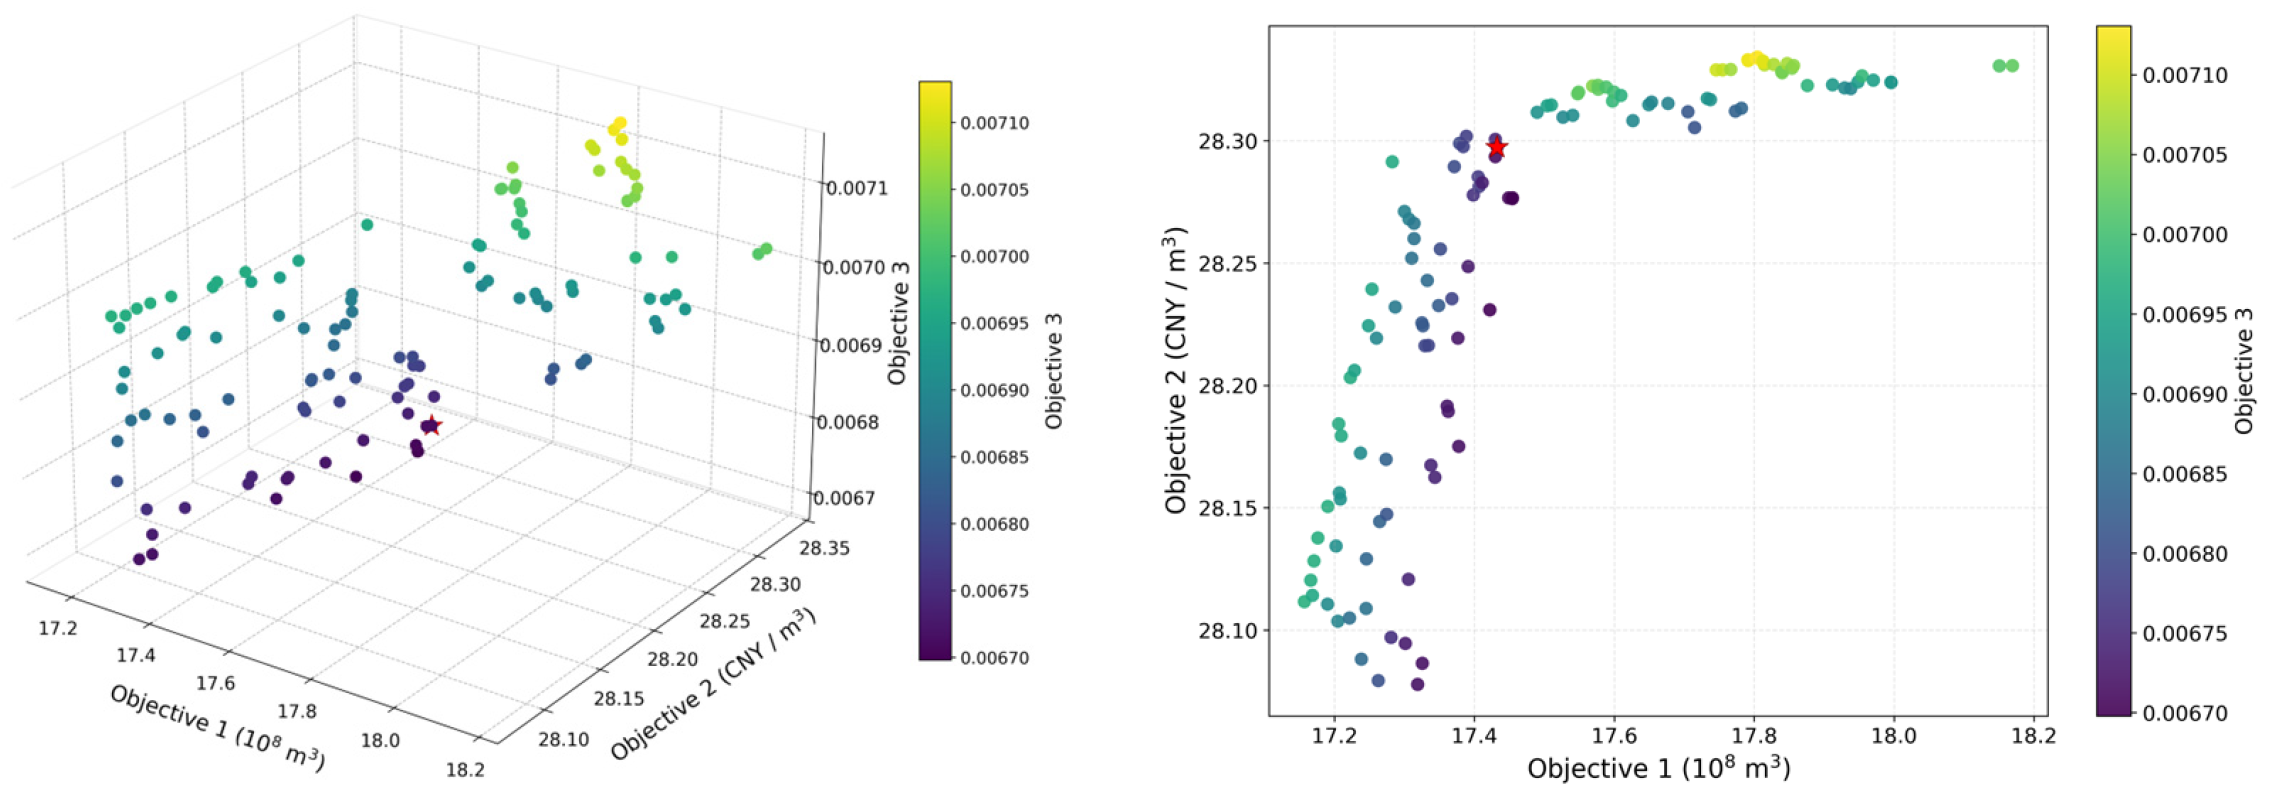
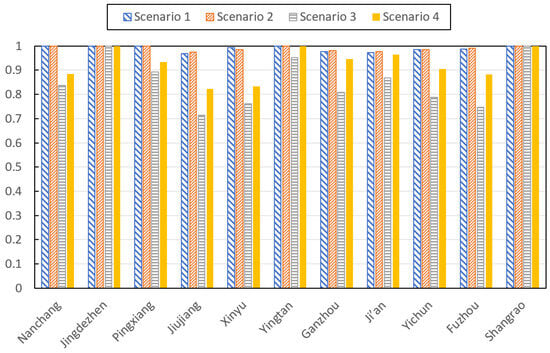
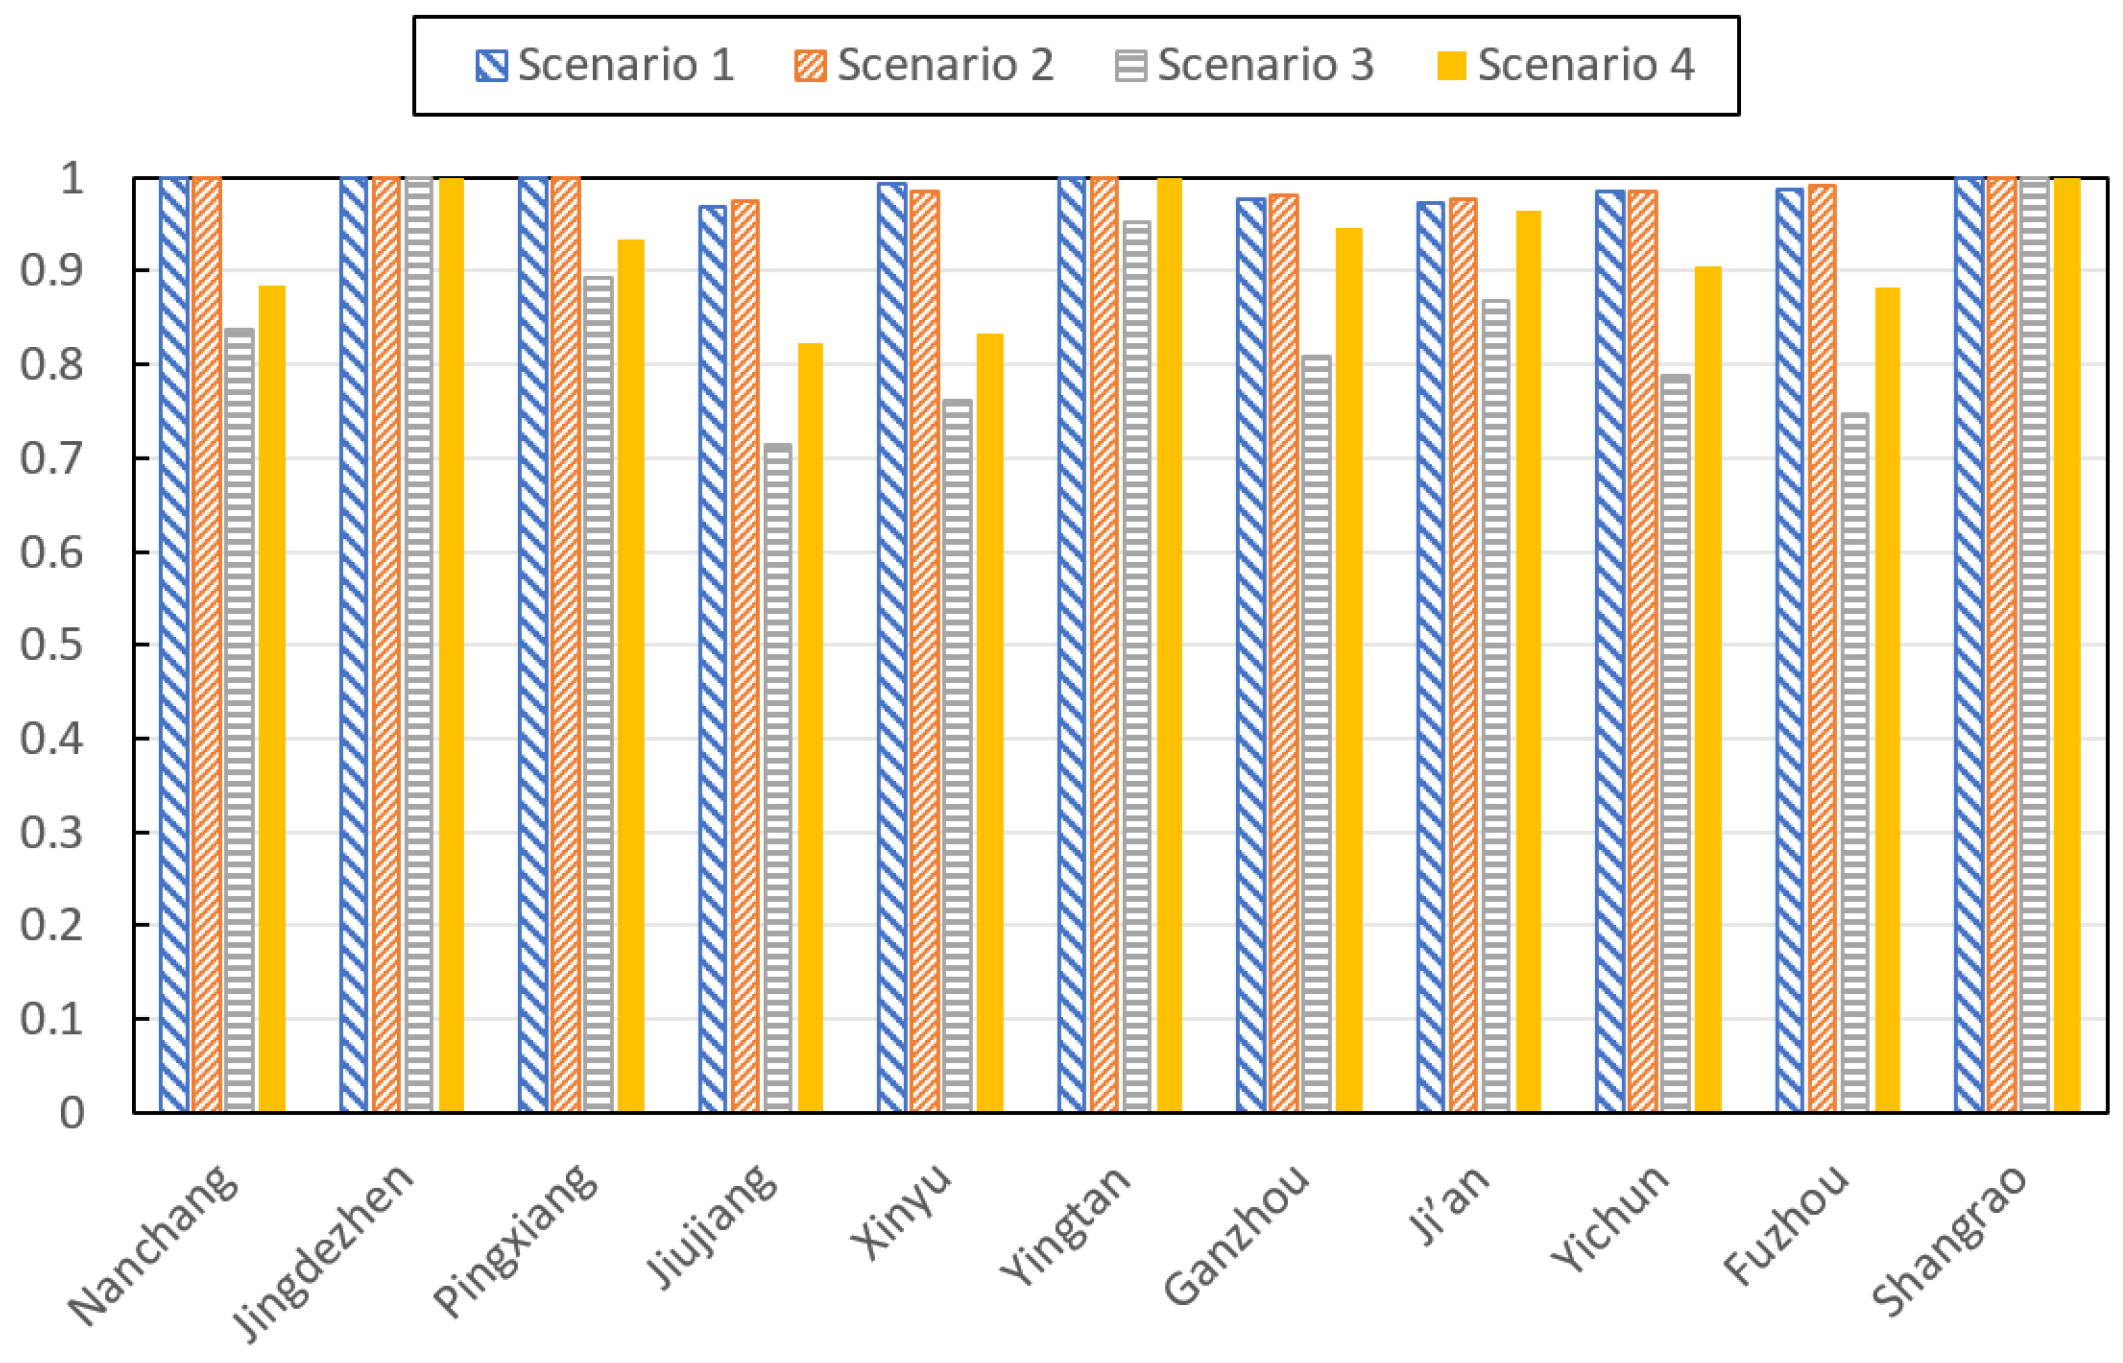
A satisfactory solution refers to a set of decision alternatives on the Pareto frontier that achieve an "acceptable" level for each objective after a comprehensive trade-off among the three objectives. Table 10 presents the recommended water allocation solutions for various cities and the final values of the three objective functions. Figure 4, Figure 5, Figure 6 and Figure 7 illustrate the selection of satisfactory solutions for each scenario. Figure 8 shows the reliability of each prefecture-levelcity under scenarios S1–S4. The results indicate that the planned water network development scenario is associated with lower modeled water deficits, with a more pronounced reduction under severe water scarcity. Under the 50% inflow-frequency scenario, the reported deficit decreases from 3.48 × 10⁸ m3 in S1 to 3.00 × 10⁸ m3 in S2, a reduction of approximately 13.8%. Under the 95% inflow-frequency scenario, it decreases from 35.73 × 10⁸ m3 in S3 to 17.43 × 10⁸ m3 in S4, a reduction of approximately 51.2%. These results indicate that the combined effects of planned water network development and associated infrastructure changes are more pronounced under low-inflow conditions.
Table 10.
Recommended Solutions under Multi-objective Conditions (108 m3).
Figure 4.
Pareto fronts for S1.
Figure 5.
Pareto fronts for S2.
Figure 6.
Pareto fronts for S3.
Figure 7.
Pareto fronts for S4.
Figure 8.
The Reliability of All 11 Prefecture-level Cities under S1–S4.
Economic benefit per unit of allocated water also increases in the planned development scenarios. The indicator rises from 28.51 CNY/m3 in S1 to 28.81 CNY/m3 in S2, and from 27.75 CNY/m3 in S3 to 28.30 CNY/m3 in S4, corresponding to increases of approximately 1.05% and 1.98%, respectively. Although the relative improvement is greater under the 95% inflow-frequency scenario, the absolute indicator remains lower than under the 50% inflow-frequency scenario. This suggests that the economic performance of the allocation solution remains constrained by hydrological conditions, even when planned infrastructure development improves the modeled allocation outcome.
The spatial results show that allocation changes vary across prefecture-level cities. Under the 50% inflow-frequency scenario, the changes are relatively modest. Under the 95% inflow-frequency scenario, allocations increase from 26.15 to 29.73 × 10⁸ m3 in Ganzhou, from 21.35 to 24.83 × 10⁸ m3 in Ji’an, from 24.05 to 27.88 × 10⁸ m3 in Yichun, and from 17.57 to 20.42 × 10⁸ m3 in Fuzhou. In contrast, Jingdezhen’s allocation decreases slightly from 6.74 to 6.64 × 10⁸ m3, while Shangrao experiences a smaller increase. These differences indicate that the benefits of the planned development scenario are spatially heterogeneous. Because the scenario also incorporates planned infrastructure and changes in supply capacity and service coverage, these differences cannot be attributed to network connectivity alone.
The spatial allocation equity indicator remained at 0.01 across the four scenarios at the precision. The spatial distribution of water supply reliability further reveals the heterogeneous effects of water network connectivity across prefecture-level cities (Figure 7). Jingdezhen and Shangrao maintain a reliability of 100% under all four scenarios, whereas relatively lower reliability is observed in Yichun and Jiujiang. Under the planned-connectivity scenarios, the reliability of several water-scarce cities, including Ganzhou, Ji’an, and Fuzhou, improves compared with the corresponding existing-connectivity scenarios. These differences indicate that the effects of connectivity are spatially heterogeneous rather than uniform across the basin. The aggregate indicator should therefore be considered together with regional integrated water deficit and economic benefit per unit water volume results when evaluating spatial equity.
Overall, the planned water network development scenario is associated with reduced modeled deficits and improved economic benefit per unit of allocated water, particularly under the 95% inflow-frequency scenario. However, the magnitude of these improvements needs to be interpreted alongside changes in sectoral demand, infrastructure capacity, and spatial allocation.
4.2. Responses of Water Supply Agents
The results show that planned water network development primarily changes the allocation of surface water (Table 11). Under the 50% inflow-frequency scenario, surface water allocation increases from 237.39 × 10⁸ m3 in S1 to 240.68 × 10⁸ m3 in S2. Under the 95% inflow-frequency scenario, it increases from 172.81 × 10⁸ m3 in S3 to 193.83 × 10⁸ m3 in S4. The larger increase under low-inflow conditions suggests that the planned development scenario provides additional opportunities to redistribute surface water when water availability is more constrained.
Table 11.
Water Allocation Results in the Poyang Lake Basin for 2030 (108 m3).
Groundwater allocation reached the allowable extraction limit in all four scenarios, with values of 7.69 × 10⁸ m3 under the existing-network scenarios (S1 and S3) and 7.48 × 10⁸ m3 under the planned-network scenarios (S2 and S4). The lower groundwater allocation in S4 than in S3 is therefore attributable to the lower extraction limit prescribed for the planned-network configuration, rather than a direct response to the hydrological condition. Although an agricultural deficit of 17.43 × 10⁸ m3 remains in S4, groundwater extraction cannot increase further because the allowable limit has already been reached. Similarly, unconventional water allocation remains constant at 3.70 × 10⁸ m3 in all scenarios, as it reaches the prescribed treatment capacity. Thus, the observed changes in water supply are concentrated in surface water, whereas groundwater and unconventional water show little or no variation. Subject to these constraints, the results suggest that planned water network development changes the supply structure mainly through increased surface-water allocation rather than through increased use of all available water sources.
4.3. Responses of Water Demand Agents
Agricultural allocation and water deficits varied across the four scenarios (Table 12). Under the 50% inflow-frequency scenarios, agricultural allocation decreased from 156.17 × 10⁸ m3 in S1 to 150.32 × 10⁸ m3 in S2, while the deficit decreased from 3.48 × 10⁸ m3 to 3.00 × 10⁸ m3. The lower reference demand in S2 is associated with the higher irrigation efficiency assumed for the planned-network scenario, which reduces the gross water withdrawal required to meet the prescribed net irrigation requirement. Under the 95% inflow-frequency scenarios, agricultural allocation increased from 98.39 × 10⁸ m3 in S3 to 109.73 × 10⁸ m3 in S4, while the deficit decreased from 35.73 × 10⁸ m3 to 17.43 × 10⁸ m3. The substantially larger deficit under the 95% inflow-frequency scenarios reflects the more severe water-availability constraints, despite the reduced agricultural demand prescribed for these scenarios. These comparisons reflect the combined effects of water availability, irrigation-efficiency assumptions, and planned infrastructure development, rather than the isolated effect of network connectivity.
Table 12.
Water Allocation Results by Water User in the Poyang Lake Basin for 2030.
Industrial allocation increased by 6.23 × 10⁸ m3 from S1 to S2, whereas agricultural allocation decreased by 5.85 × 10⁸ m3. This contrasting pattern indicates a change in the sectoral allocation structure under a relatively small increase in total allocated water. It is consistent with the influence of Objective 2, which maximizes economic benefit per unit of allocated water, although the shift cannot be attributed to this objective alone because water availability, demand settings, and the other optimization objectives also affect the allocation outcome.
Domestic water allocation was 29.85 × 10⁸ m3 in S1 and S3, and 32.27 × 10⁸ m3 in S2 and S4. In the planned-network scenarios, a higher per capita domestic water-use quota was assumed to represent projected improvements in living standards, resulting in a higher reference domestic demand. The difference in domestic allocation therefore needs to be interpreted in conjunction with the corresponding reference demand and the model’s allocation constraints.
Ecological allocation increases from 3.38 × 10⁸ m3 in S1 to 3.67 × 10⁸ m3 in S2, but increases from 2.52 × 10⁸ m3 in S3 to 2.65 × 10⁸ m3 in S4. Limited by model precision, although the simulation shows no ecological water deficit for each scenario, it cannot confirm that minimum ecological flow requirements are satisfied at every location and each time step, nor that ecosystem recovery is attained.
Overall, the results show that the planned development scenario produces differentiated allocation changes across agricultural, industrial, domestic and ecological uses. These changes reflect the combined effects of water availability, sector-specific demand and efficiency assumptions, allocation priorities, and the economic and equity objectives of the model. The results therefore demonstrate differences in the simulated allocation responses, while the extent to which these differences represent actual behavioral adaptation depends on the assumptions and decision rules specified for each agent.
5. Discussion
The results indicate that the allocation benefits associated with planned water network development vary with hydrological conditions. The total water deficit decreased from 3.48 × 10⁸ m3 to 3.00 × 10⁸ m3 under the 50% inflow-frequency scenario, and from 35.73 × 10⁸ m3 to 17.43 × 10⁸ m3 under the 95% inflow-frequency scenario. The larger reduction under extreme low-inflow conditions suggests that expanding water-transfer pathways and associated infrastructure may provide greater opportunities to redistribute available water when local shortages become more severe. This finding is consistent with Sun [17], who demonstrated that water-transfer infrastructure can buffer water-scarcity risks, and with Liu, who found that the impacts of inter-basin water transfer vary substantially across sub-basins and include both benefits and potential costs [24]. Research on the joint operation of transferred and local water supplies has also highlighted the importance of coordinating water diversion, supply, and allocation under different hydrological conditions [25]. Rollason emphasized that water transfer schemes should be evaluated not only in terms of additional water supply but also in relation to their wider social and environmental implications [15]. Building on these studies, the present analysis examines how the allocation outcomes of planned network development vary between normal and extreme low-inflow scenarios. Nevertheless, because the planned scenario incorporates new or expanded reservoirs, irrigation districts, and associated transfer infrastructure, the observed reductions represent the combined effects of network development and changes in storage capacity, supply capacity, and service coverage, rather than the isolated effect of connectivity alone.
The supply-side results help explain how these allocation outcomes arise within the model. Changes in total water supply were primarily associated with surface water, which increased from 237.39 × 10⁸ m3 to 240.68 × 10⁸ m3 under the 50% inflow-frequency scenario and from 172.81 × 10⁸ m3 to 193.83 × 10⁸ m3 under the 95% inflow-frequency scenario. By comparison, groundwater allocation changed only slightly, while unconventional water remained constant across the four scenarios. This pattern suggests that, under the prescribed extraction and production constraints, the modeled response to planned network development occurs mainly through the redistribution and increased allocation of surface water rather than through a uniform increase in all water sources. The result is consistent with the emphasis in multisource water-allocation research on coordinating transferred water with local supplies to improve the use of available resources [25]. It also illustrates the value of distinguishing between the availability of different water sources and their actual allocation to users. In the present model, network development changes the feasible allocation conditions, but the resulting supply structure remains bounded by source-specific capacities and regulatory constraints.
The demand-side results reveal an important interaction between additional water availability and changes in sectoral allocation. Under the 50% inflow-frequency scenario, total water supply increased by 3.09 × 10⁸ m3 from S1 to S2, whereas the total water deficit decreased by only 0.48 × 10⁸ m3. Meanwhile, total reference water demand increased from 252.26 × 10⁸ m3 to 254.87 × 10⁸ m3. This comparison indicates that the increase in reference demand partially offset the potential reduction in water deficit associated with the additional supply. However, this percentage represents an accounting relationship between changes in modeled supply and reference demand, rather than a direct measurement of induced water consumption or a causal estimate of the rebound effect. Similar supply–demand cycles have been reported in studies of reservoir development and water transfer, where increased water availability can stimulate additional demand and gradually offset the initial benefits of supply expansion [26,27]. Di Baldassarre et al. [26] further highlighted the reservoir effect, whereby increasing reliance on reservoir storage may increase vulnerability to subsequent droughts. These findings suggest that infrastructure development should be evaluated together with the demand responses and long-term management arrangements that accompany additional water availability.
The irrigation-efficiency assumption also requires consideration in relation to the irrigation-efficiency paradox. In the present model, higher irrigation efficiency in the planned-network scenarios reduces the gross agricultural water requirement for a prescribed net irrigation requirement. Accordingly, agricultural reference demand decreases from 159.65 × 10⁸ m3 in S1 to 153.32 × 10⁸ m3 in S2. This represents a modeled reduction in irrigation withdrawals under the specified demand assumptions. However, previous studies have shown that improvements in irrigation efficiency do not necessarily result in basin-wide water conservation, because farmers may expand irrigated areas, change crop patterns, or increase water consumption, while reductions in return flows may also affect water availability for downstream users [27,28]. Therefore, the reduction in agricultural reference demand should not be interpreted as evidence that the irrigation-efficiency paradox is absent. Rather, it reflects the prescribed efficiency assumptions, and the potential rebound effects of irrigation modernization remain an important issue for future investigation.
The consequences of planned network development differ among sectors and hydrological conditions. Under the 50% inflow-frequency scenario, industrial allocation increased by 6.23 × 10⁸ m3, while agricultural allocation decreased by 5.85 × 10⁸ m3, despite a relatively small increase in total allocated water. Under the 95% inflow-frequency scenario, both industrial and agricultural allocations increased, and the agricultural deficit decreased from 35.73 × 10⁸ m3 to 17.43 × 10⁸ m3. These contrasting outcomes suggest that changes in water availability do not translate into uniform allocation gains across sectors. Instead, the resulting distribution reflects the interaction of hydrological conditions, sector-specific demand assumptions, allocation priorities, and the government’s economic-efficiency and water-security objectives. This interpretation is consistent with research showing that water use in different sectors responds differently to drought and other hydroclimatic extremes [29]. It also relates to Gohari, who demonstrated that water-transfer interventions can have unintended consequences when changes in supply interact with socioeconomic demand and resource-management processes [30]. The results identify differentiated, rule-based allocation responses and show why sectoral allocation patterns need to be considered alongside aggregate water-shortage indicators. Although the spatial equity objective remained unchanged at the reported precision, this does not negate the observed changes in sectoral and city-level allocation; it indicates that these changes were not reflected in a measurable improvement in the aggregate equity indicator used in this study.
The main methodological contribution is to connect heterogeneous water supply and demand agents with government-level multi-objective optimization under alternative water availability and network development scenarios. Rather than focusing only on an optimal aggregate allocation, the framework makes it possible to examine how changes in water availability and feasible transfer pathways are reflected in the allocation outcomes of different sectors and water sources. This perspective complements previous multi-agent and multi-objective water-allocation studies, which have demonstrated the value of representing interactions among government and water-user agents when analyzing competing allocation objectives [31].
6. Conclusions
This study developed a multi-agent water resource allocation framework under the complex adaptive systems perspective, linking heterogeneous water supply and demand agents with government-level multi-objective optimization. The framework enables the examination of how alternative water network development scenarios and hydrological conditions are reflected in aggregate allocation performance and sector-specific allocation outcomes. The main conclusions are as follows.
In the Poyang Lake Basin simulations, the planned water network development scenario was associated with lower total water deficits and higher economic benefits per unit of allocated water. Under the 50% inflow-frequency scenario, the modeled deficit decreased by 13.8%, while under the 95% inflow-frequency scenario, it decreased by 51.2%. Economic benefits per unit of allocated water increased by 1.05% and 1.98%, respectively. These results indicate that the modeled benefits of planned water network development were more pronounced under extreme low-inflow conditions. However, because the planned scenario also incorporates changes in infrastructure and supply capacity, these improvements cannot be attributed to connectivity alone.
The simulations revealed differentiated allocation responses across water sources and user sectors. On the supply side, changes under the planned development scenario were concentrated in surface water allocation, while groundwater allocation changed only slightly and unconventional water allocation remained constant under the prescribed model constraints. On the demand side, agricultural allocation and deficits varied substantially across hydrological scenarios, while industrial, domestic, and ecological allocations followed different patterns. These results demonstrate the value of examining source-specific and sector-specific allocation outcomes alongside aggregate performance indicators. However, the simulated differences reflect the model’s specified demand assumptions, allocation rules, and optimization objectives, rather than direct evidence of autonomous behavioral adaptation in the real water management system.
From a management perspective, water network planning should be coordinated with hydrological risk assessment, reservoir operation, and sector-specific allocation priorities. Under severe low-inflow conditions, particular attention should be given to agricultural water deficits and the coordination of available surface water across regions. Economic efficiency should also be considered alongside regional allocation equity, as the aggregate equity indicator showed no change at the reported precision in this study. These implications provide decision-support insights for water allocation planning.
This study has two main limitations. The hydrological scenarios and temporal resolution impose additional limitations on the interpretation of the results. The inflow scenarios were derived from historical streamflow records for 1956–2021 and therefore reflect historical flow-frequency characteristics rather than explicit projections of future climate change or hydrological non-stationarity. Although the 95% inflow-frequency scenario represents a severe low-flow condition in the frequency analysis, it should not be interpreted as a complete representation of future drought risk under a changing climate. In addition, the same representative historical year was used to construct the 95% regional inflow scenario for the eleven prefecture-level cities. This assumption facilitates consistent basin-wide comparison but may not capture the spatial heterogeneity of droughts, in which different sub-basins experience different magnitudes and timing of low flows.
The allocation model operates at an annual time step and does not explicitly resolve seasonal allocation dynamics. Consequently, it cannot fully represent the timing of seasonal agricultural water demand or the intra-annual evolution of drought conditions, including the summer–autumn low-flow conditions observed in 2022. Moreover, the model does not explicitly simulate the hydrodynamic exchange between Poyang Lake and the Yangtze River, including backwater effects, river–lake interactions, and associated lake-level fluctuations. These processes may influence water availability and ecological conditions but are not resolved by the present allocation framework. Future work should incorporate non-stationary hydrological scenarios, spatially differentiated drought conditions, finer temporal resolution, and a more explicit representation of river–lake interactions to improve the assessment of water allocation reliability under extreme hydrological conditions.
Author Contributions
Writing—Original Draft, M.M., Data curation, M.M. and K.Y.; Writing—review and editing, J.C. (Junying Chu) and Z.Z.; Funding acquisition, J.N. and J.C. (Jingqing Cheng). All authors have read and agreed to the published version of the manuscript.
Funding
This research was funded by the Key Research and Development Program of Jiangxi Province (S20251933), the Science and Technology Project of the Jiangxi Provincial Department of Water Resources (202426ZDKT04), and the CAE S&T Strategic Consulting Project (2026-DFZD-40).
Institutional Review Board Statement
Not applicable.
Informed Consent Statement
Not applicable.
Data Availability Statement
The original contributions presented in the study are included in the article, further inquiries can be directed to the corresponding author.
Conflicts of Interest
Author Mingyue Ma was employed by the company Jilin Province Water Resource and Hydropower Consultative Company. The remaining authors declare that the research was conducted in the absence of any commercial or financial relationships that could be construed as a potential conflict of interest.
References
- Gupta, J.; van der Zaag, P. Interbasin water transfers and integrated water resources management: Where engineering, science and politics interlock. Phys. Chem. Earth Parts A/B/C 2008, 33, 28–40. [Google Scholar] [CrossRef] [Scilit]
- Loucks, D.P.; Van Beek, E. Water Resource Systems Planning and Management: An Introduction to Methods, Models, and Applications; Springer: Cham, Switzerland, 2017. [Google Scholar]
- Jamshid Mousavi, S.; Anzab, N.R.; Asl-Rousta, B.; Kim, J.H. Multi-objective optimization-simulation for reliability-based inter-basin water allocation. Water Resour. Manag. 2017, 31, 3445–3464. [Google Scholar] [CrossRef] [Scilit]
- Siddik, M.A.B.; Dickson, K.E.; Rising, J.; Ruddell, B.L.; Marston, L.T. Interbasin water transfers in the United States and Canada. Sci. Data 2023, 10, 27. [Google Scholar] [CrossRef] [Scilit] [PubMed]
- Dobbs, G.R.; Liu, N.; Caldwell, P.V.; Miniat, C.F.; Sun, G.; Duan, K.; Bolstad, P.V. Inter-basin surface water transfers database for public water supplies in conterminous United States, 1986–2015. Sci. Data 2023, 10, 255. [Google Scholar] [CrossRef] [Scilit] [PubMed]
- Cohon, J.L.; Marks, D.H. A review and evaluation of multiobjective programing techniques. Water Resour. Res. 1975, 11, 208–220. [Google Scholar] [CrossRef] [Scilit]
- Stedinger, J.R.; Sule, B.F.; Loucks, D.P. Stochastic dynamic programming models for reservoir operation optimization. Water Resour. Res. 1984, 20, 1499–1505. [Google Scholar] [CrossRef] [Scilit]
- Buras, N. Conjunctive operation of dams and aquifers. J. Hydraul. Div. 1963, 89, 111–131. [Google Scholar] [CrossRef] [Scilit]
- Labadie, J.W. Optimal operation of multireservoir systems: State-of-the-art review. J. Water Resour. Plan. Manag. 2004, 130, 93–111. [Google Scholar] [CrossRef] [Scilit]
- Kanta, L.; Zechman, E. Complex adaptive systems framework to assess supply-side and demand-side management for urban water resources. J. Water Resour. Plan. Manag. 2014, 140, 75–85. [Google Scholar] [CrossRef] [Scilit]
- Giuliani, M.; Castelletti, A.; Amigoni, F.; Cai, X. Multiagent systems and distributed constraint reasoning for regulatory mechanism design in water management. J. Water Resour. Plan. Manag. 2015, 141, 04014068. [Google Scholar] [CrossRef] [Scilit]
- Sinha, P.; Rollason, E.; Bracken, L.J.; Wainwright, J.; Reaney, S.M. A new framework for integrated, holistic, and transparent evaluation of inter-basin water transfer schemes. Sci. Total Environ. 2020, 721, 137646. [Google Scholar] [CrossRef] [Scilit] [PubMed]
- Zeng, C.; Ma, J.; Cao, M.; Xu, C.; Qi, W.; Wang, L. Modeling water allocation under extreme drought of south-to-north water diversion project in Jiangsu Province, Eastern China. Front. Earth Sci. 2020, 8, 541664. [Google Scholar] [CrossRef] [Scilit]
- Ma, Y.; Chang, J.; Guo, A.; Wu, L.; Yang, J.; Chen, L. Optimizing Inter-basin water transfers from multiple sources among interconnected River basins. J. Hydrol. 2020, 590, 125461. [Google Scholar] [CrossRef] [Scilit]
- Rollason, E.; Sinha, P.; Bracken, L.J. Interbasin water transfer in a changing world: A new conceptual model. Prog. Phys. Geogr. Earth Environ. 2022, 46, 371–397. [Google Scholar] [CrossRef] [Scilit]
- Xiao, X. The Role of Lining in Water Use Efficiency of Irrigation Canals. J. Irrig. Drain. 2018, 37, 56–61. [Google Scholar]
- Sun, S.; Tang, Q.; Konar, M.; Fang, C.; Liu, H.; Liu, X.; Fu, G. Water transfer infrastructure buffers water scarcity risks to supply chains. Water Res. 2023, 229, 119442. [Google Scholar] [CrossRef] [Scilit] [PubMed]
- He, G.; Wang, J.; Zhao, Y.; Yao, Y.; He, F.; Zhu, H.; Qin, C. Key scientific issues and research directions for economic and social water demand forecasting under the background of water network construction. Adv. Water Sci. 2025, 36, 717–727. [Google Scholar]
- Holland, J.H. Hidden order. Bus. Week-Domest. Ed. 1995, 21, 93–136. [Google Scholar] [CrossRef] [Scilit]
- Chu, J.; Wang, C.; Chen, J.; Wang, H. Agent-Based Residential Water Use Behavior Simulation and Policy Implications: A Case-Study in Beijing City. Water Resour. Manag. 2009, 23, 3267–3295. [Google Scholar] [CrossRef] [Scilit]
- Zhang, J.; Dong, Z.; Chen, T. Multi-objective optimal allocation of water resources based on the NSGA-2 algorithm while considering intergenerational equity: A case study of the middle and upper reaches of Huaihe River Basin, China. Int. J. Environ. Res. Public Health 2020, 17, 9289. [Google Scholar] [CrossRef] [Scilit] [PubMed]
- Deng, L.; Guo, S.; Yin, J.; Zeng, Y.; Chen, K. Multi-objective optimization of water resources allocation in Han River basin (China) integrating efficiency, equity and sustainability. Sci. Rep. 2022, 12, 798. [Google Scholar] [CrossRef] [Scilit] [PubMed]
- Zhang, S.; Fang, G.; Zhang, D.; Ju, M.; Zhong, H. Water resources optimal allocation model for coordinating regional multi-level water resources managers’ interests. Front. Environ. Sci. 2023, 11, 1152296. [Google Scholar] [CrossRef] [Scilit]
- Liu, Y.; Xin, Z.; Sun, S.; Zhang, C.; Fu, G. Assessing environmental, economic, and social impacts of inter-basin water transfer in China. J. Hydrol. 2023, 625, 130008. [Google Scholar] [CrossRef] [Scilit]
- Ma, Y.; Chang, J.; Guo, A.; Chen, L.; Wang, X. Conjunctive operation of interbasin transferred water and local water in a multisource diversion-supply-allocation system. J. Water Resour. Plan. Manag. 2021, 147, 05021018. [Google Scholar] [CrossRef] [Scilit]
- Di Baldassarre, G.; Wanders, N.; AghaKouchak, A.; Kuil, L.; Rangecroft, S.; Veldkamp, T.I.E.; Garcia, M.; van Oel, P.R.; Breinl, K.; Van Loon, A.F. Water shortages worsened by reservoir effects. Nat. Sustain. 2018, 1, 617–622. [Google Scholar] [CrossRef] [Scilit]
- Grafton, R.Q.; Williams, J.; Perry, C.J.; Molle, F.; Ringler, C.; Steduto, P.; Udall, B.; Wheeler, S.A.; Wang, Y.; Garrick, D.; et al. The paradox of irrigation efficiency. Science 2018, 361, 748–750. [Google Scholar] [CrossRef] [Scilit] [PubMed]
- Pérez-Blanco, C.D.; Hrast-Essenfelder, A.; Perry, C. Irrigation technology and water conservation: A review of the theory and evidence. Rev. Environ. Econ. Policy 2020, 14, 216–239. [Google Scholar] [CrossRef] [Scilit]
- Cárdenas Belleza, G.A.; Bierkens, M.F.; Van Vliet, M.T. Sectoral water use responses to droughts and heatwaves: Analyses from local to global scales for 1990–2019. Environ. Res. Lett. 2023, 18, 104008. [Google Scholar] [CrossRef] [Scilit]
- Gohari, A.; Eslamian, S.; Mirchi, A.; Abedi-Koupaei, J.; Bavani, A.M.; Madani, K. Water transfer as a solution to water shortage: A fix that can backfire. J. Hydrol. 2013, 491, 23–39. [Google Scholar] [CrossRef] [Scilit]
- Han, Q.; Tan, G.; Fu, X.; Mei, Y.; Yang, Z. Water resource optimal allocation based on multi-agent game theory of HanJiang river basin. Water 2018, 10, 1184. [Google Scholar] [CrossRef] [Scilit]

Disclaimer/Publisher’s Note: The statements, opinions and data contained in all publications are solely those of the individual author(s) and contributor(s) and not of MDPI and/or the editor(s). MDPI and/or the editor(s) disclaim responsibility for any injury to people or property resulting from any ideas, methods, instructions or products referred to in the content. |
© 2026 by the authors. Licensee MDPI, Basel, Switzerland. This article is an open access article distributed under the terms and conditions of the Creative Commons Attribution (CC BY) license.