


Featured Application
The proposed multimodal collaborative framework provides a practical solution for automated water-level monitoring in urban riverine environments. It can be integrated into existing video surveillance systems for urban flood warning, reservoir scheduling, and smart water management, reducing reliance on manual observation.
Abstract
Automatic water-level recognition from water gauge images is fundamentally hindered by limited adaptability to dynamic environments and the susceptibility of E-shaped characters to false detection in complex scenes. To address these challenges, this study proposes a multimodal collaborative framework that integrates VT-BM3D denoising, an improved YOLO26 detector, and Qwen3-VL-driven semantic reasoning for robust water-level recognition. The VT-BM3D algorithm was employed to suppress water-surface reflections and background noise while preserving the edge features of scale markings. The YOLO26 baseline was improved with the CBAM attention mechanism and a P2 small-object detection head. Two recognition modes were then established: the YOLO two-stage mode and the YOLO-Qwen3 joint mode. Experimental results demonstrated that the improved YOLO26 achieved an mAP50 of 86.1% and an mAP50:95 of 67.4% in the second-stage detection of E-characters and the waterline, surpassing the baseline by 8.6 and 8.5 percentage points, respectively. In the evaluated field scenarios, both modes delivered absolute errors below 2 cm, maintaining reading stability and strong anti-interference capability under water-surface reflections, tilted views, and complex backgrounds. These results collectively validate the accuracy, robustness, and practical applicability of the proposed framework for water-level recognition.
1. Introduction
Water-level monitoring is a fundamental task in hydrological observation, flood warning, and water resource scheduling. The accuracy and timeliness of the acquired data directly affect the operational safety and decision-making of water conservancy projects. Traditional manual observation relies on on-site readings by trained personnel, but it suffers from inherent limitations such as low efficiency, strong subjectivity, and difficulty in sustaining continuous round-the-clock operation. With the rapid development of computer vision and deep learning, image-based automatic water-level recognition has become an important direction in hydrological monitoring. This is largely due to its advantages of non-contact measurement, flexible deployment, and support for remote monitoring and data traceability. Such methods acquire on-site images containing water gauges, apply algorithms to locate the gauge, extract scale features, and identify the water–gauge boundary, and then automatically convert the results into actual water-level readings. Benefiting from convenient installation, low maintenance costs, and inexpensive operation, these approaches have gradually replaced traditional manual observation and gained extensive engineering applications [1,2,3,4,5,6].
However, practical hydrological monitoring scenarios are subject to dynamic factors such as drastic illumination changes, water-surface fluctuations and reflections, adverse weather such as rain and fog, and complex background interference. These factors render existing algorithms insufficiently adaptive and robust during automatic waterline tracking [7,8]. Meanwhile, the E-shaped characters and the waterline on the water gauge surface are prone to textural confusion during imaging. The low resolution of small targets further exacerbates false detection and missed detection, seriously compromising the accuracy and stability of water-level readings. Moreover, cameras in dynamic scenes often exhibit limited adaptability, resulting in captured images with non-uniform target distribution, blurred features, tilted angles, varying distances, and image distortion. All these factors impose higher demands on the robustness and generalization capability of existing algorithms.
Although existing methods have made progress in image preprocessing, object detection, and multimodal fusion (as detailed in Section 2), they still struggle to simultaneously achieve high real-time efficiency and robust semantic reasoning in complex scenarios. In light of the above, this study proposes a water-level recognition method for water gauges. This method integrates VT-BM3D image denoising, an improved YOLO26 detection model, and Qwen3-VL-driven semantic reasoning, achieving robust water-level recognition in complex scenes through the synergistic optimization of preprocessing and recognition modules. The objectives of this study are to:
- (1)
- integrate a VT-BM3D-based adaptive denoising strategy to mitigate quality degradation of water gauge images under complex interferences such as water-surface reflections, background noise, and complex textures;
- (2)
- improve the YOLO26 baseline model to enhance the detection of fine-grained E-characters and the waterline;
- (3)
- establish two reading modes: the YOLO two-stage mode and the YOLO-Qwen3-VL joint mode. Both modes share the same VT-BM3D denoising and first-stage localization, while differing in the second stage. The two modes can be flexibly selected according to actual scene requirements.
2. Related Work
2.1. Image Preprocessing
In terms of image preprocessing, the BM3D (Block-Matching and 3D Filtering) algorithm has attracted considerable research interest owing to its superior denoising performance and structure-preserving capability [9,10]. Through block-matching and collaborative filtering, BM3D effectively separates noise from signals in the transform domain, preserving sharp edges and textural details while removing noise. Various improvements have been made on this basis [11]. For example, BM3D can be integrated with median filtering, guided filtering, or bilateral filtering to exploit the complementary properties of different filters for mixed noise. Adaptive parameter adjustment strategies have also been introduced to dynamically optimize filtering intensity and block-matching thresholds according to local image characteristics. These enhancements improve generalization capability in complex scenes and provide high-quality input images for subsequent water gauge detection and water-level estimation.
2.2. Object Detection for Water Gauges
In the field of water-level recognition from water gauge images, early research primarily relied on traditional image processing [12,13] and machine learning, which exhibit poor robustness under outdoor complexities. With the progress of deep learning, convolutional neural network-based methods have become mainstream. In object detection, the YOLO series has been extensively adopted due to its end-to-end architecture and real-time advantages [14,15]. Numerous studies have focused on improving YOLO for small-object detection challenges, such as E-characters in water gauge scenes. These improvements include multi-level feature fusion and the introduction of attention mechanisms [16,17,18]. Specifically, adding small-object detection heads integrates shallow high-resolution information into deep feature maps. Embedding channel and spatial attention modules enables the network to concentrate on critical features while suppressing background noise.
2.3. Multimodal Large Models for Water-Level Recognition
In recent years, researchers have begun exploring the combination of large language models with multimodal technologies to achieve stronger generalization and higher accuracy [19,20,21,22,23,24]. Some studies [25,26] have proposed hybrid frameworks integrating vision-based waterline detection with large multimodal language models such as GPT-4o and Gemini 2.0 Flash for automatic river gauge reading. In addition, some researchers [27] have introduced a multi-path recognition algorithm that integrates YOLO-based detection, semantic segmentation, and traditional edge extraction methods.
2.4. Summary of Limitations
Overall, water gauge image-based water-level recognition is rapidly evolving from traditional handcrafted feature-dependent methods toward deep learning-based and large-model-integrated approaches. However, existing methods still face challenges in complex environmental interference, small-target detection, and adverse weather/extreme conditions. Traditional methods lack robustness, pure YOLO methods lack semantic reasoning capabilities for complex scenes, and purely relying on large models suffers from high computational costs and inaccurate pixel-level localization. To bridge these gaps, this study proposes a collaborative dual-mode framework.
3. Materials and Methods
3.1. Data Acquisition and Preprocessing
To ensure broad representativeness, the image dataset used in this study was captured with digital cameras at different times and under various scenarios. Factors such as shooting angles, and background variations were comprehensively considered. To guarantee the clarity and legibility of the water gauge scale markings, the shooting distance was kept relatively short. After acquisition, the original images underwent quality screening to remove severely degraded ones. To address tilted angles, the Hough transform was applied to detect the edges of the water gauge, followed by affine transformation to correct the images to a frontal view. The VT-BM3D algorithm was then employed for denoising, supplemented by histogram equalization to enhance contrast. Finally, all images were uniformly resized, and pixel values were normalized to provide standardized inputs for model training.
Given the two-stage recognition pipeline of the YOLO algorithm, image annotation was also carried out in two stages. In the first stage, the water gauge region was designated as the annotation target. In the second stage, three categories were annotated: E-full, E-half, and the waterline position.
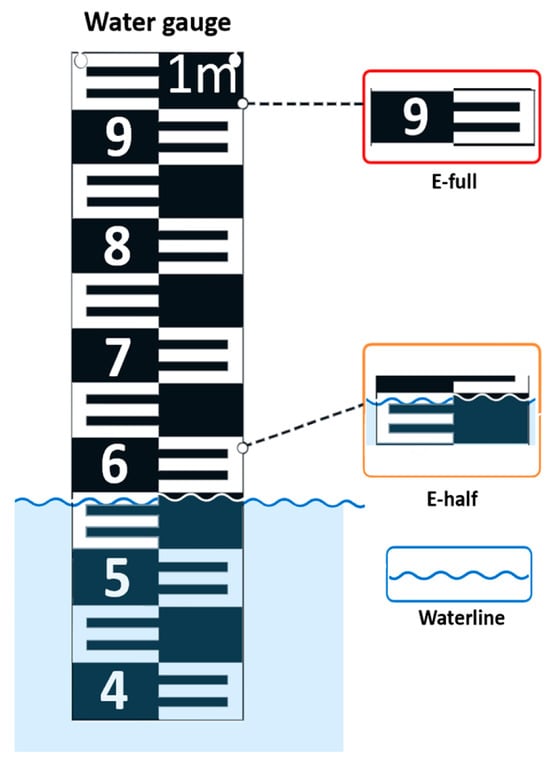
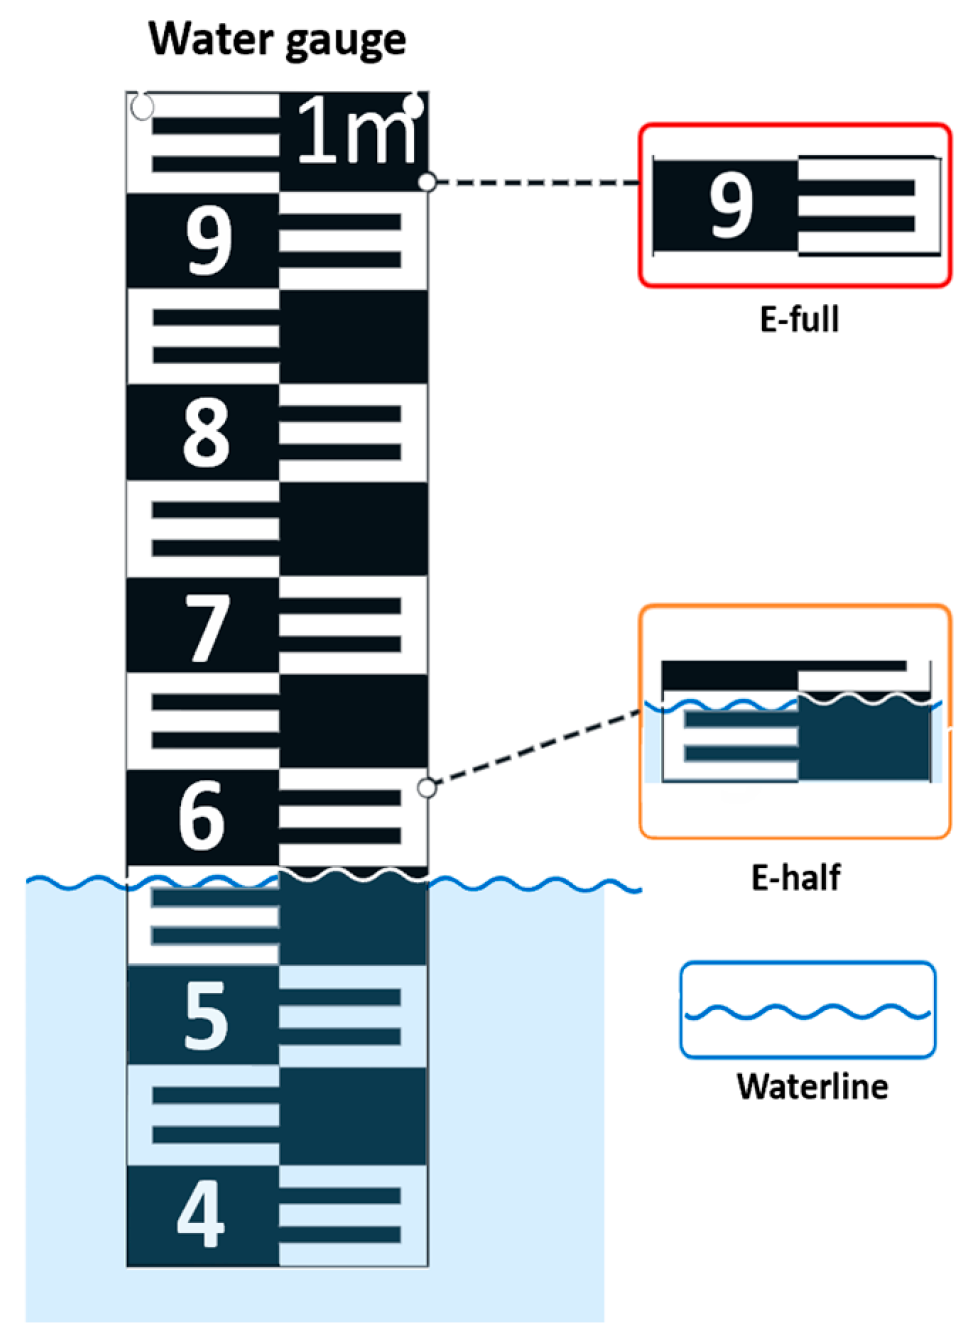
As illustrated in Figure 1, E-full denotes a complete E-shaped character fully exposed above the water surface; E-half denotes the partially submerged E-shaped character truncated by the waterline; and the waterline is the physical boundary between the water surface and the gauge. The actual physical height corresponding to each complete E-shaped character (set to 5 cm in this study) was recorded to serve as the baseline reference for subsequent water-level conversion. Manual annotation of the preprocessed images was performed using the Labelme annotation tool (version 5.8.1), and the results were saved in JSON format.
Figure 1.
Illustration of the water gauge scale features. The numbers on the gauge (e.g., 9, 8, 7) indicate the water level in decimeters (i.e., a 10 cm interval between adjacent digits), and "1m" indicates one meter.
The dataset was collected from urban river sections in the central urban area of Shanghai, where the standard E-shaped staff gauge is the most commonly deployed type. The dataset exhibits considerable diversity in real-world conditions, including different water submersion depths (yielding diverse E-full and E-half samples) and diverse shooting angles (vertical and tilted). Only the standard E-shaped staff gauge was evaluated in this study, and the images were primarily captured under sunny conditions; other gauge types and adverse weather conditions will be considered in future work. After screening and annotation, a total of 1500 valid original images were obtained. No augmented images were included in this count. These images were strictly divided into a training set (1200 images), a validation set (150 images), and an independent test set (150 images) at a ratio of 8:1:1. To prevent data leakage, the split was conducted at the scenario level: all images originating from the same video sequence, the same physical water gauge, or the same continuous capture period were assigned exclusively to one of the three sets. During the training phase, data augmentation strategies such as random scaling were applied only to the training set. The validation and test sets contained strictly unaugmented original images. The test set was completely held out until the final evaluation to ensure an unbiased assessment of the model.
The YOLO-Qwen3 joint mode shares the preprocessed and perspective-corrected image data from the YOLO two-stage mode. It does not require additional annotated data, and its reading inference is achieved through structured prompt engineering.
3.2. Model Network Architecture
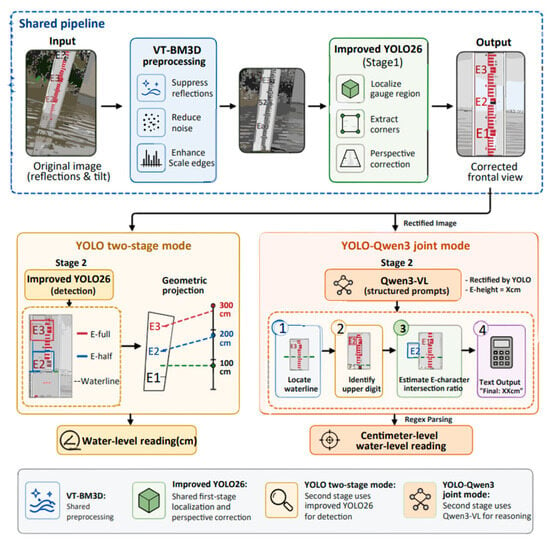
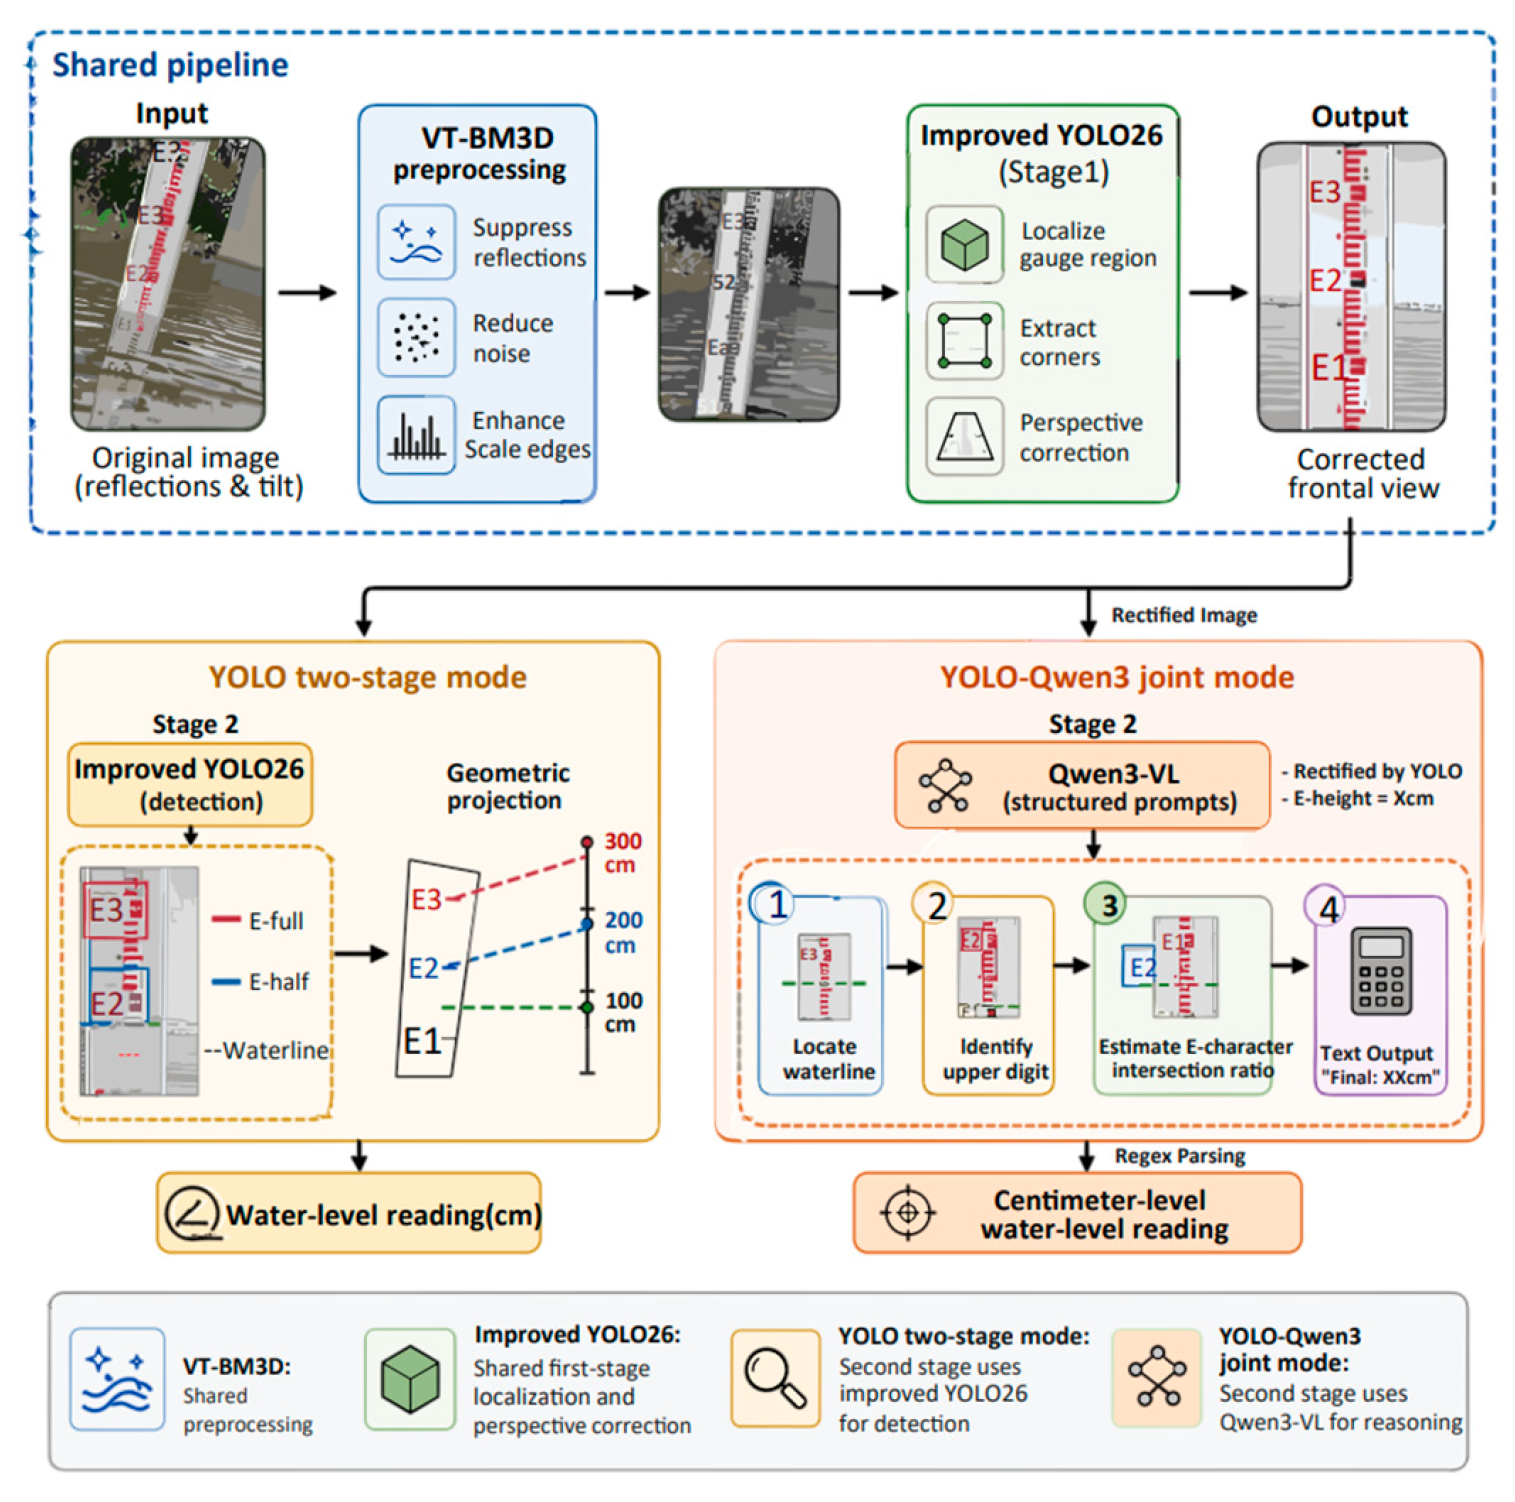
As summarized in Section 2.4, pure YOLO-based detection is lightweight but lacks semantic reasoning in complex scenes, whereas relying purely on large VLMs suffers from high computational cost and inaccurate pixel-level grounding. To address this trade-off, two complementary recognition modes are established on top of the same improved YOLO26 front-end: a lightweight YOLO two-stage mode for edge deployment and a YOLO-Qwen3 joint mode for cloud-based semantic reasoning. Both modes share VT-BM3D denoising and the same improved YOLO26 for first-stage water gauge localization. The overall workflows of the two modes are illustrated in Figure 2.
Figure 2.
Overall workflows of the YOLO two-stage mode and the YOLO-Qwen3 joint mode. The dashed boxes delineate the shared pipeline, the YOLO two-stage mode, and the YOLO-Qwen3 joint mode, respectively. Different colors in the blocks indicate distinct processing modules (e.g., blue for preprocessing, green for YOLO detection, and orange for Qwen3-VL reasoning).
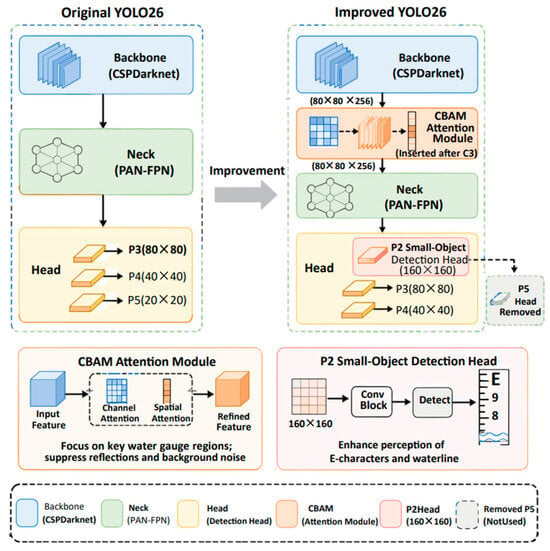
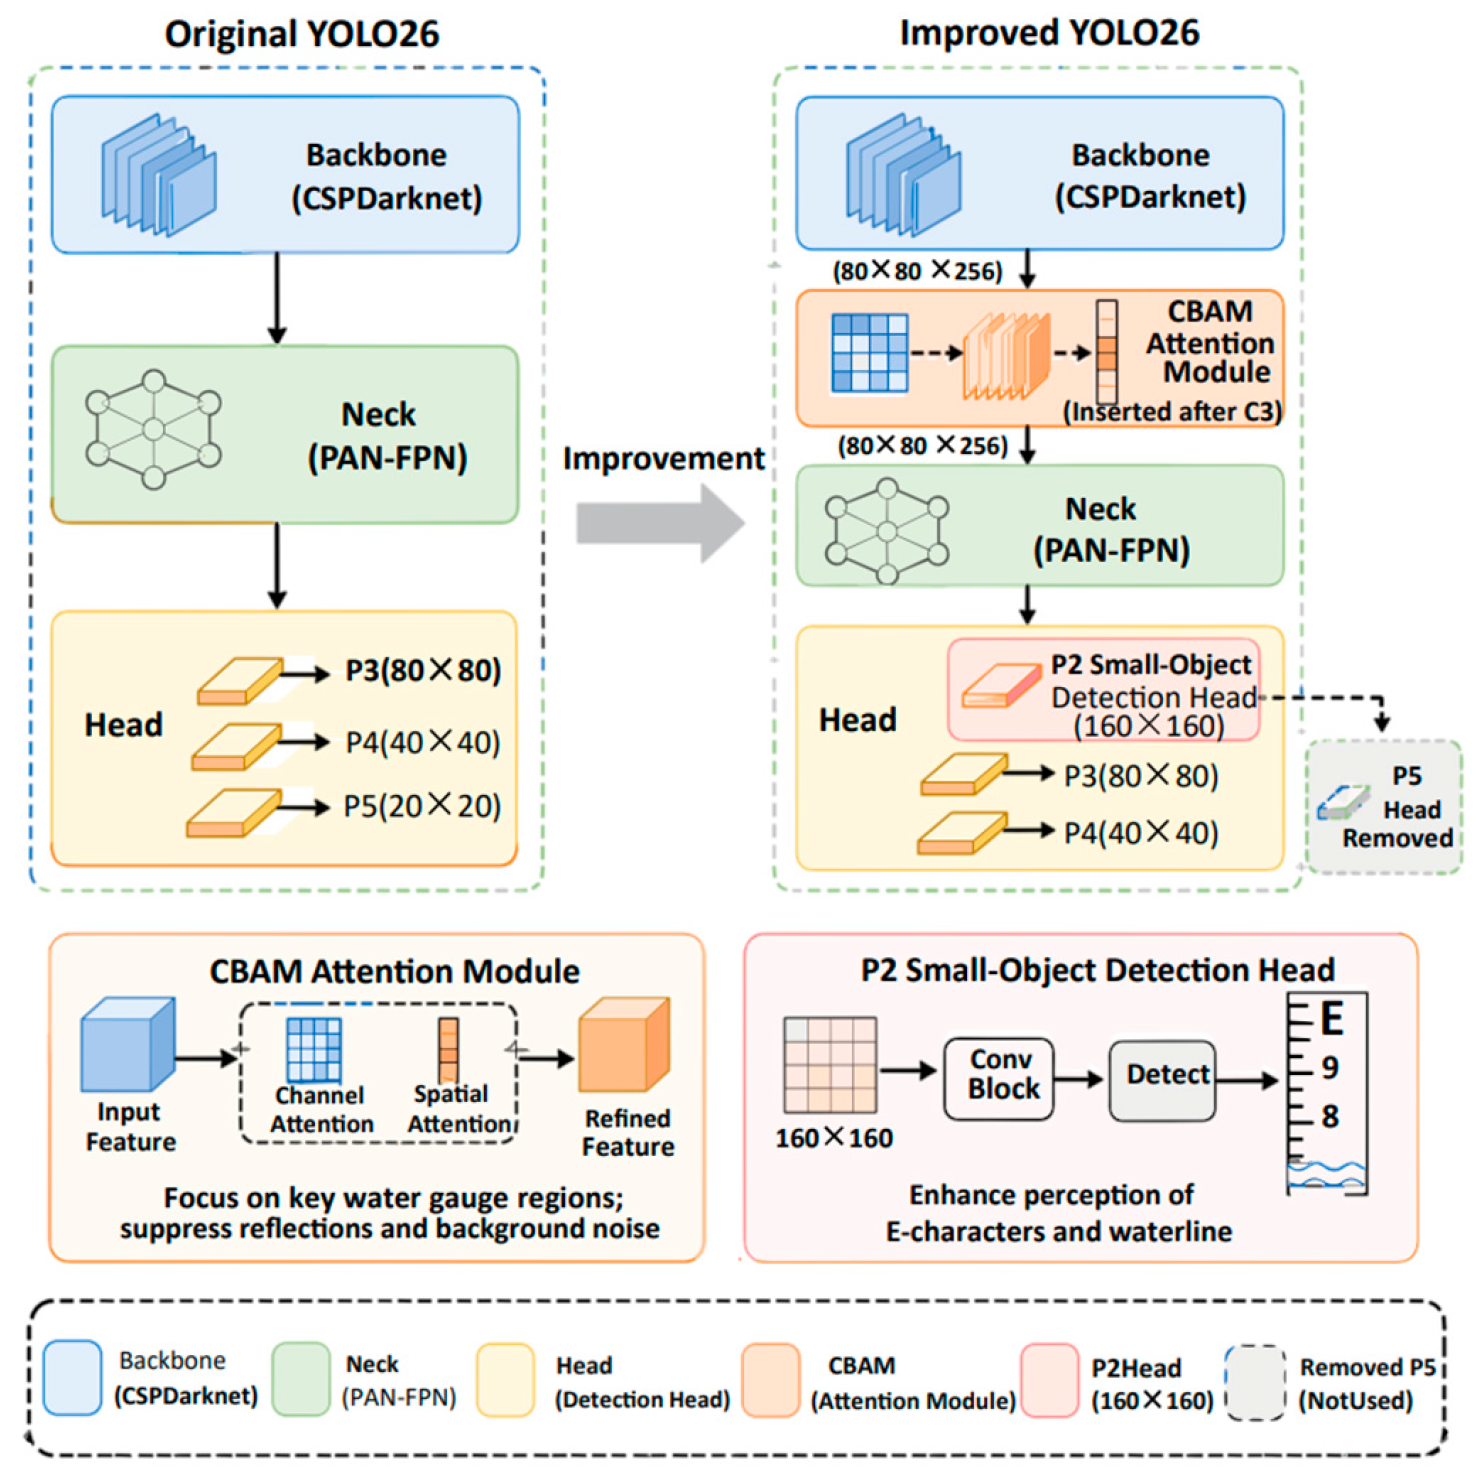
This study adopts YOLO26 as the baseline detection framework. The improved YOLO26 incorporates two targeted strategies to address the challenges of water gauge detection. First, to enhance the perception of extremely small targets, a P2 detection head with a feature size of 160 × 160 is introduced to preserve fine edges, while the redundant P5 head is removed for edge deployment. Second, to suppress complex environmental interference, the CBAM attention mechanism is embedded. Specifically, the CBAM module is inserted immediately after the C3 stage of the Backbone, taking the intermediate feature map of size 80 × 80 × 256 as input and outputting a refined map of the exact same dimensions. The overall architecture of the improved YOLO26 is illustrated in Figure 3.
Figure 3.
Overall architecture of the improved YOLO26. CBAM is inserted after the C3 stage, with 80 × 80 × 256 input and output.
While these modules are established components in the Ultralytics ecosystem, our architectural contribution lies in this task-specific reconfiguration: (1) it explicitly couples CBAM at the C3 stage with a high-resolution P2 head to prevent feature dilution for extremely small-objects; (2) it removes the P5 head to achieve a resource-aware trade-off for edge deployment; and, as a result, (3) it provides precise geometric priors (bounding boxes and waterline coordinates) that serve as the foundation for the subsequent Qwen3-VL multimodal reasoning.
In the YOLO two-stage mode, the improved YOLO26 is applied to both stages to detect E-full, E-half, and the waterline for geometric projection. In the YOLO-Qwen3 joint mode, the first stage uses YOLO to localize the gauge and perform perspective correction. The rectified image from YOLO Stage 1, along with a structured prompt, is then fed into the Qwen3-VL-8B vision-language model (VLM) (Qwen Team, Alibaba Group, Hangzhou, China). This design decouples visual grounding from semantic reasoning: YOLO provides a well-aligned gauge image and geometric priors, while Qwen3-VL focuses on reading the waterline and performing arithmetic reasoning without needing to handle background clutter or perspective distortion. To establish a truly collaborative pipeline, the structured prompt explicitly informs Qwen3-VL that the image has already been rectified by YOLO, instructing the model to ignore background clutter. Furthermore, the prompts define the physical parameters (gauge length: 100 cm, E-character height: 5 cm, digit interval: 10 cm) and decompose the reading task into a four-step reasoning chain: (1) locating the waterline, (2) identifying the nearest digit above it, (3) estimating the intersection ratio of the E-character, and (4) computing the water-level value using the predefined formula, as expressed in Equation (1).
where N is the nearest digit above the waterline and p is the intersection ratio (0–100%) of the E-character between the waterline and that digit. The model outputs a stepwise reasoning text in a fixed format (e.g., “Water Level: XX.X cm”), from which the final numerical reading is extracted via a regular expression (Regex) parser.
Water Level = N × 10 − (p/100) × 5
It is worth noting that the two modes are designed for different computational environments. The YOLO two-stage mode is highly lightweight, requiring minimal computational resources (e.g., <1 GB VRAM), making it highly suitable for deployment on edge devices for continuous real-time monitoring. In contrast, the YOLO-Qwen3 joint mode, which incorporates the Qwen3-VL large model, demands significantly higher computational resources (e.g., >15 GB VRAM) and is intended for cloud-based processing to handle highly complex or degraded scenes. In practical applications, the system can seamlessly switch between the two modes based on available hardware constraints and real-time accuracy requirements. Routine monitoring can run locally in the lightweight mode, while difficult frames can be uploaded to the cloud for joint-mode verification.
3.3. Model Hyperparameter Configuration and Development Environment
The experiments were conducted on a GPU-based computing platform equipped with an Intel Xeon Platinum CPU (Intel Corporation, Santa Clara, CA, USA) and an NVIDIA GeForce RTX 4080 SUPER (32 GB VRAM) (NVIDIA Corporation, Santa Clara, CA, USA), running the Ubuntu 22.04 LTS 64-bit operating system (Canonical Ltd., London, UK). The software environment consisted of Python 3.12.3, PyTorch 2.7.0, and CUDA 12.8. The model training parameters were configured as follows: an initial learning rate of 0.001, 200 training epochs, a momentum of 0.937, a weight decay of 0.0005, a batch size of 4, and an input image size uniformly resized to 640 × 640 pixels. An early stopping strategy (patience = 30) was adopted during training to prevent overfitting, and the SGD optimizer was used.
For the YOLO-based two-stage visual recognition mode, both stages were trained with the same hyperparameter configuration to ensure consistency in the detection backbone. In the YOLO-Qwen3 multimodal joint reasoning mode, the Qwen3-VL model was loaded with pretrained weights and directly applied for zero-shot inference. It did not participate in gradient updates. Its inference followed the structured prompts and the four-step reasoning procedure described in Section 3.2. The output was formatted as fixed-format text for automatic parsing. This unified environmental configuration, together with the mode-specific hyperparameter settings, ensured the comparability of training and inference for both recognition modes under identical hardware conditions.
3.4. Evaluation Metrics
To systematically evaluate the effectiveness of the proposed method, the experiments were conducted from three perspectives: image preprocessing quality, object detection accuracy, and actual water-level reading error. In the image preprocessing stage, the peak signal-to-noise ratio (PSNR) and structural similarity index (SSIM) were employed to measure pixel-level accuracy and structural fidelity, respectively. To quantify image sharpness, we employed the Tenengrad focus measure, a well-established metric in computer vision for evaluating image clarity based on spatial gradient distribution. The procedure relies on applying the Sobel operator to compute the horizontal and vertical first-order spatial derivatives at each pixel, yielding the local gradient magnitudes. The overall sharpness is calculated as the aggregate sum of these squared gradient magnitudes, as shown in Equation (2).
where Gx and Gy are the horizontal and vertical first-order gradients obtained by the Sobel operator. Physically, a higher Tenengrad value indicates a stronger presence of high-frequency components, which directly corresponds to sharper edge transitions and clearer textural boundaries. In the context of this study, it effectively reflects the visual clarity of the E-character contours and scale markings after VT-BM3D denoising, ensuring that the edge information is well-preserved without introducing over-smoothing artifacts. In the YOLO-based two-stage object detection stage, the mean average precision at IoU = 0.5 (mAP50) and the mean average precision averaged over IoU thresholds from 0.5 to 0.95 with a step size of 0.05 (mAP50:95) were employed as the core evaluation metrics. Specifically, mAP50 reflects the detection accuracy at an IoU threshold of 0.5. In contrast, mAP50:95 provides a more rigorous measure of the model’s detection stability and consistency across varying localization accuracy requirements by averaging the precision over multiple IoU thresholds. This enables a comprehensive assessment of the model’s capability in localizing and classifying multi-scale targets. In addition, a confusion matrix was introduced to perform a fine-grained analysis of the recognition results for the three target categories: E-full, E-half, and waterline. By statistically analyzing the matching relationships between predicted and ground-truth categories, the confusion matrix intuitively reflects the classification accuracy and misclassification patterns. This provides a more holistic evaluation of the model’s recognition reliability under complex scenarios.
In the actual water-level reading verification stage, the water-level values automatically identified by the YOLO-based two-stage model and the YOLO-Qwen3 joint mode were compared with manual measurements. The absolute error was adopted as the evaluation metric to quantitatively assess the reading accuracy of both modes in real-world river scenarios. This comprehensively evaluated the feasibility and reliability of the proposed method for engineering applications.
4. Results
4.1. VT-BM3D Preprocessing Results
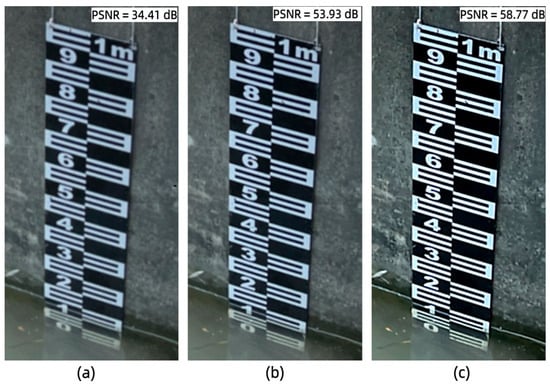
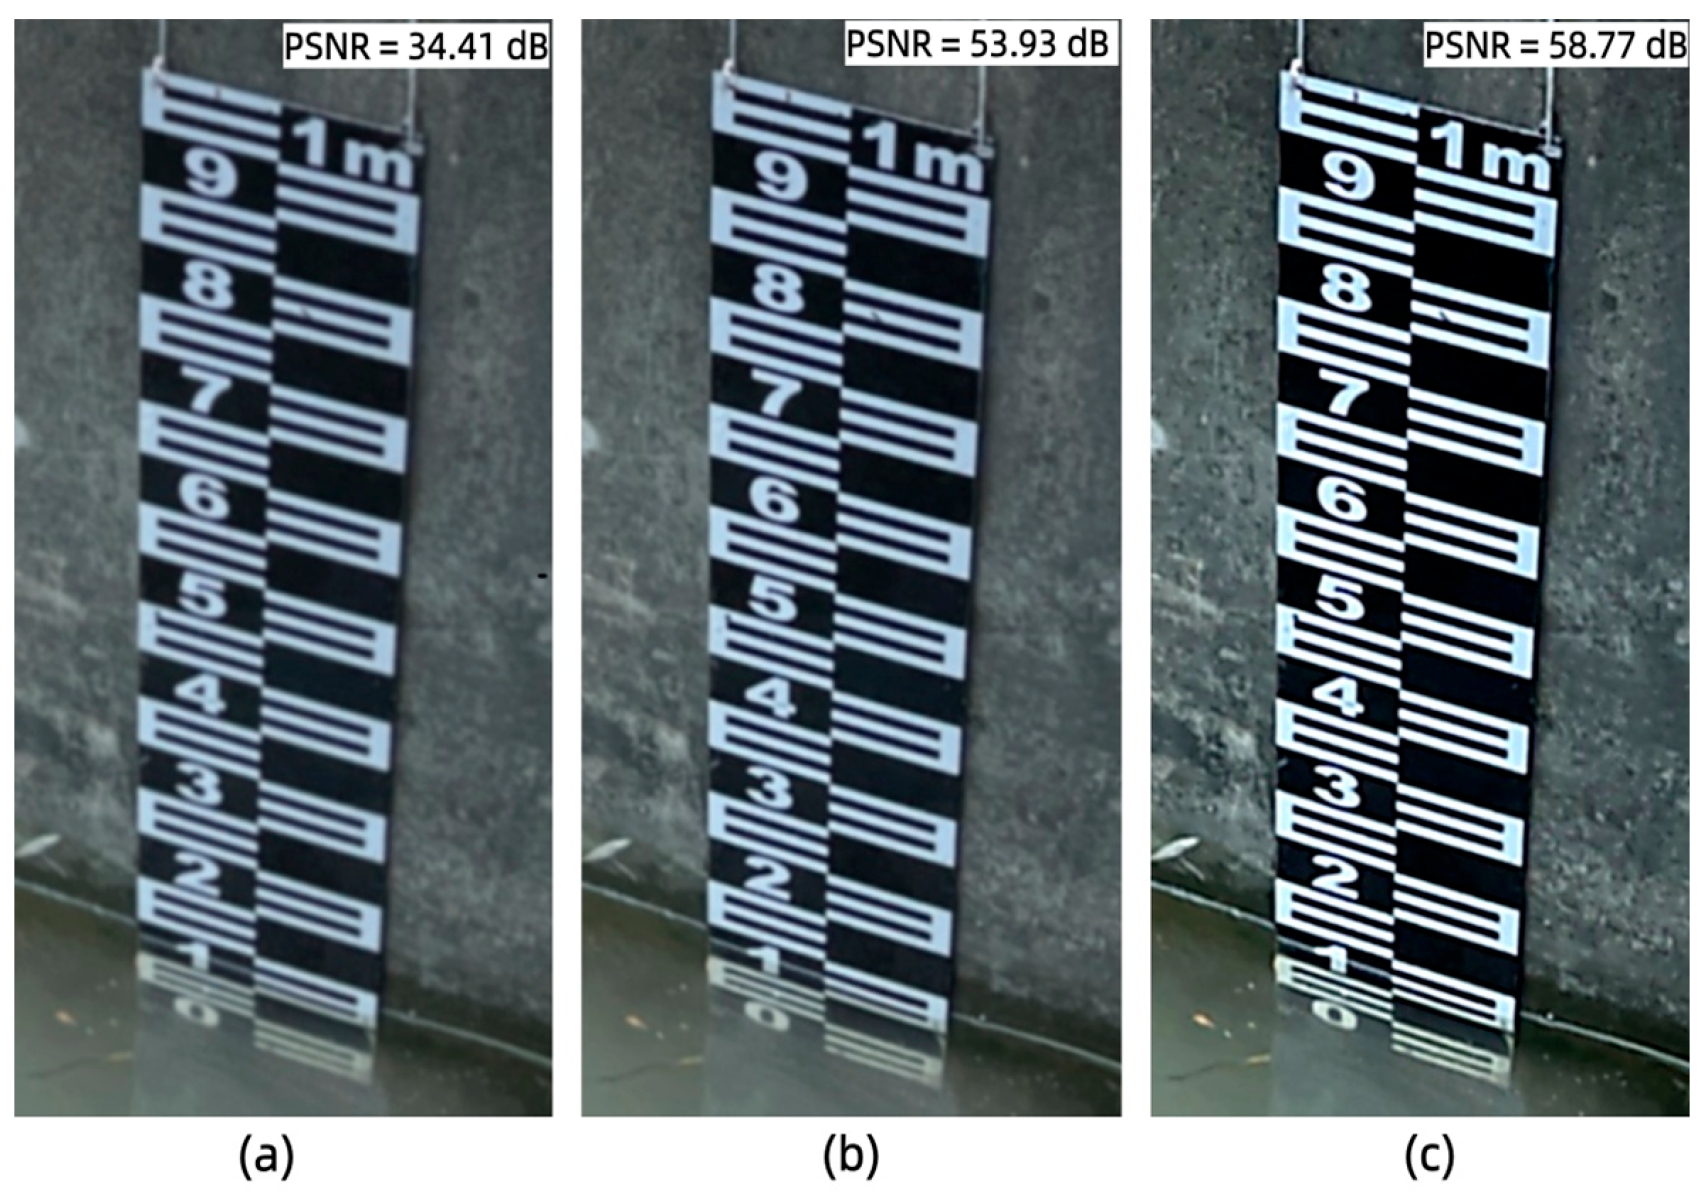
To verify the effectiveness of the VT-BM3D preprocessing method, comparative experiments were conducted using unfiltered images, classical BM3D filtering, and VT-BM3D filtering. The denoising results are presented in Figure 4. As can be observed, the unfiltered images exhibited significant water-surface reflections and background noise. The edges of the E-shaped characters were severely submerged by noise, rendering the scale details difficult to discern and substantially interfering with subsequent water gauge localization and character recognition. In contrast, VT-BM3D filtering demonstrated superior performance in preserving image details and structural integrity. Through its structure-aware adaptive mechanism, the algorithm applied stronger denoising parameters in flat regions to effectively suppress water-surface reflections and background noise. Meanwhile, it automatically reduced the filtering intensity at the edges and textured regions of the water gauge scale markings. Consequently, the algorithm removed redundant information while preserving the sharp edges and clear contours of the E-shaped characters. This provides high-quality input images for subsequent recognition tasks.
Figure 4.
Denoising results of different filtering methods with PSNR values annotated: (a) unfiltered; (b) Classical BM3D; (c) VT-BM3D.
The quantitative evaluation results of the different filtering methods are presented in Table 1. The unfiltered images exhibited relatively low values across all three metrics, indicating that the original images were significantly degraded by noise. After classical BM3D filtering, the PSNR increased from 34.41 dB to 53.93 dB, the SSIM improved from 0.9967 to 0.9980, and the sharpness rose from 154.2 to 312.5. This demonstrates that BM3D can effectively remove noise and restore image structures. VT-BM3D filtering further improved the PSNR to 58.77 dB, the SSIM to 0.9992, and the sharpness to 328.7, achieving the optimal performance across all three metrics. These results validate the effectiveness of the structure-aware adaptive strategy. This strategy dynamically adjusts the filtering intensity according to local image features. It applies stronger denoising in flat regions to suppress water-surface reflections and background noise. Meanwhile, it automatically reduces the filtering strength at the edges and textured regions of the water gauge scale markings to preserve the sharp edges of the E-shaped characters. In this way, it achieves a dynamic balance between noise removal and detail preservation. This adaptive mechanism effectively eliminates complex noise interferences such as water-surface reflections and background interference, while maximally preserving the structural information of the water gauge scale markings. This provides higher-quality input images for subsequent water-level reading recognition.
Table 1.
Comparison of quantitative metrics and noise suppression performance of the different filtering methods.
To further investigate the impact of the preprocessing module on the downstream detection task, we evaluated the full pipeline using raw images without VT-BM3D. Using the final improved YOLO26 model (detailed in Section 3.2), the results showed that the detection performance dropped significantly, with mAP50 decreasing from 86.1% to 81.5%. This confirms that the suppression of reflections and noise by VT-BM3D is essential for the detector to accurately capture the fine edges of E-characters.
4.2. YOLO Two-Stage Detection Results
The YOLO two-stage mode follows the pipeline described in Section 3.2 and Figure 2. Since the final reading accuracy depends primarily on the second-stage detection of E-full, E-half, and the waterline, this section focuses on evaluating the second-stage recognition performance.
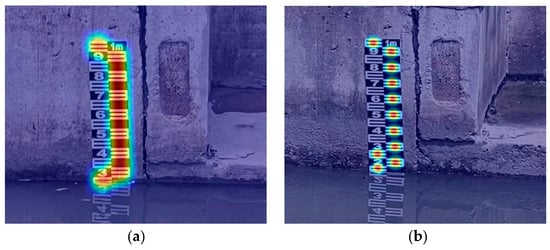
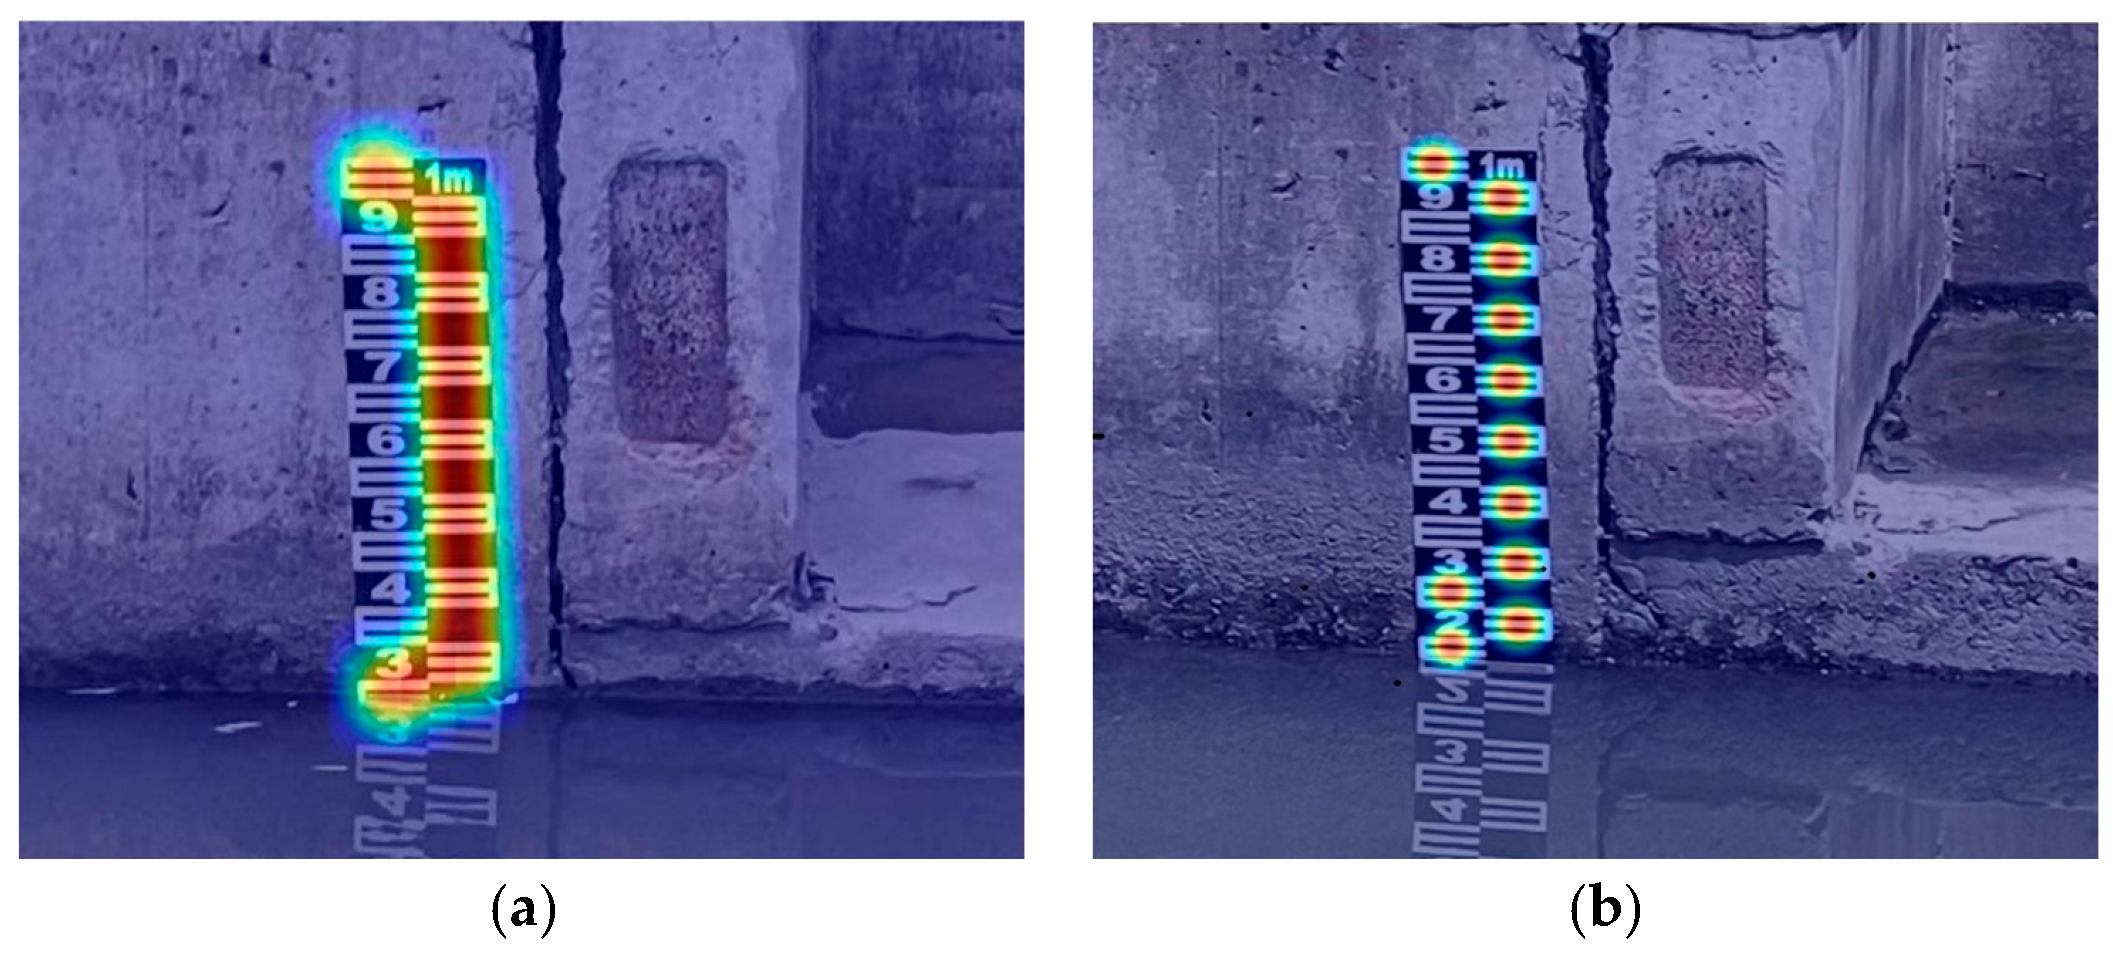
The detection heatmaps of the model before and after improvement are compared in Figure 5 on a test set covering various complex scenarios. As can be observed, compared with the original YOLO26 model, the heatmap responses of the improved model were more concentrated on the water gauge scale regions [28,29]. In the second-stage E-character recognition, the distribution pattern of the heatmap underwent a notable change. It shifted from the original “overall band-like distribution” to “localized independent focusing,” where each E-character position forms an independent cluster of strong responses. This change indicates that the improved model is capable of both global perception of the water gauge region and precise localization of individual E-characters at the local level. It thereby effectively enhances the model’s feature extraction and recognition capability for small targets. Meanwhile, the response intensity in background regions was significantly reduced. This demonstrates that the introduction of the attention mechanisms and the P2 detection head effectively suppresses interference from water-surface reflections and background textures. These results collectively validate the effectiveness and robustness of the proposed improvement strategy for water gauge reading recognition tasks in riverine environments.
Figure 5.
Heatmap comparison of detection results: (a) Original model; (b) improved model. The warmer colors (e.g., red and yellow) indicate regions of higher model activation and attention, while cooler colors (e.g., blue) represent areas of lower response.
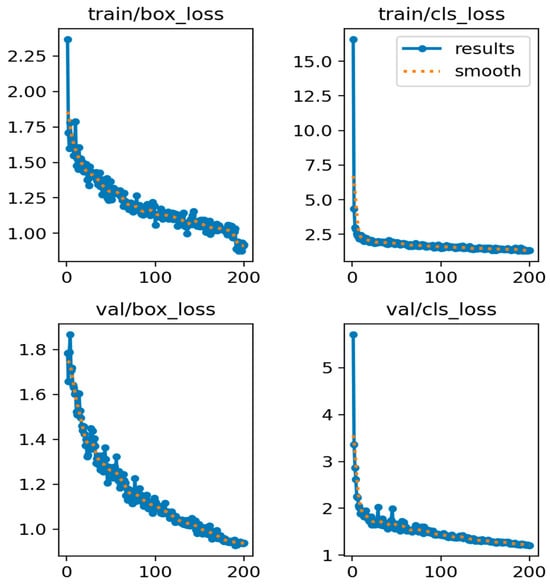
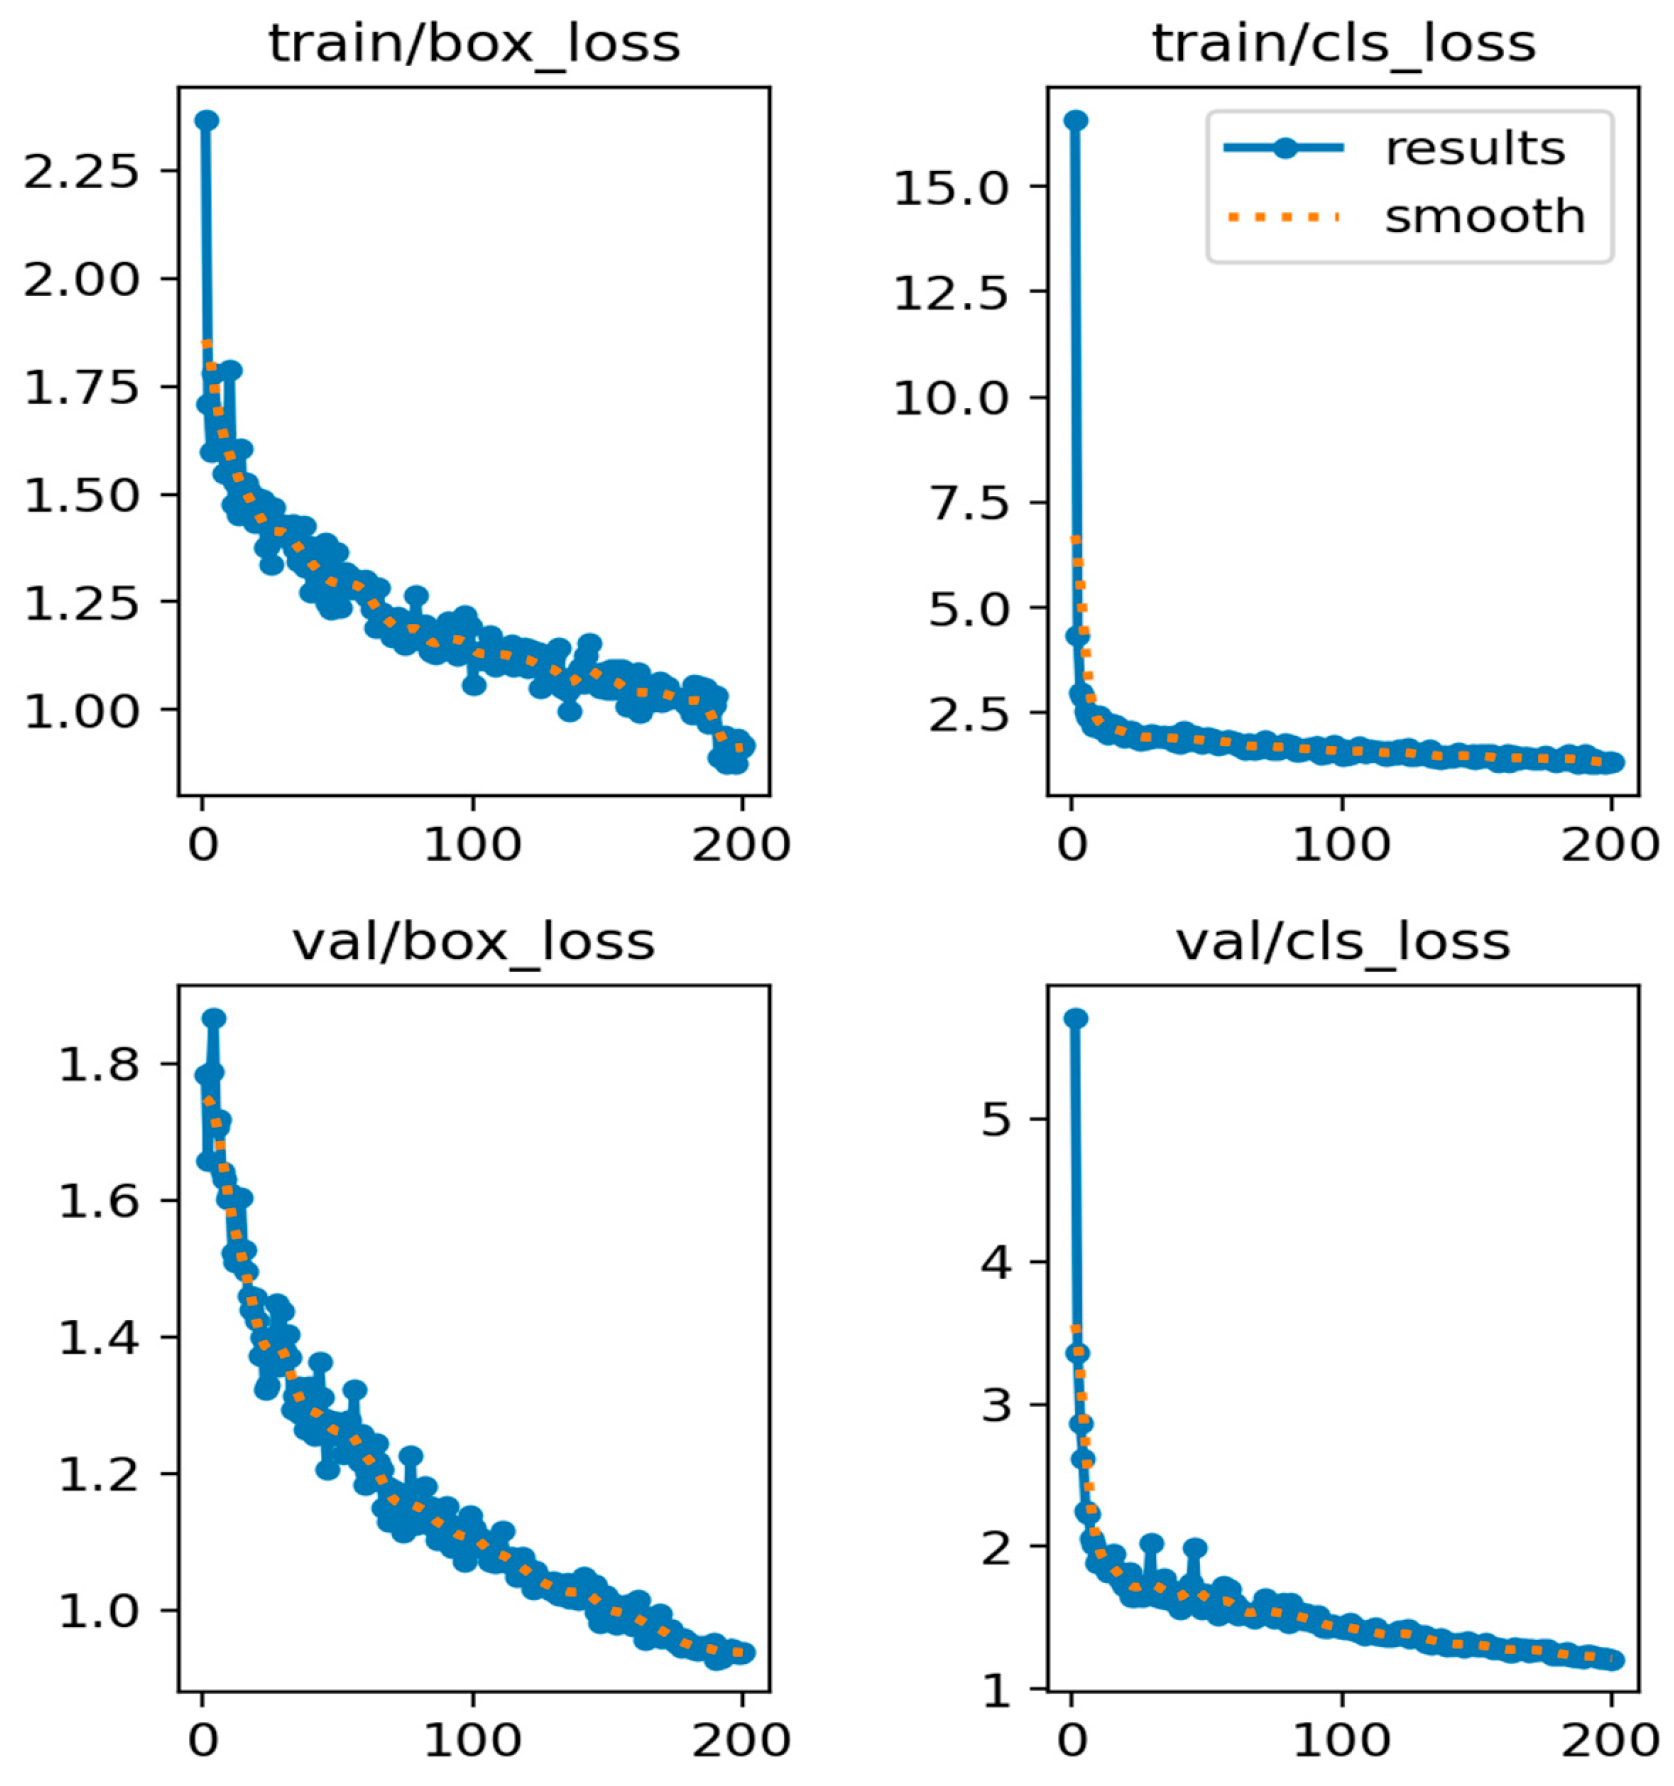
The training and validation loss curves of the second-stage recognition task are presented in Figure 6, including box loss and classification loss for both the training and validation sets. All four loss components decreased rapidly within the first 50 epochs, indicating that the model quickly fitted the target features. Thereafter, the decline rate gradually slowed down, and the losses stabilized after approximately 100 epochs, eventually converging to low values. Throughout the entire training process, the validation losses did not exhibit any upward trend, while the training losses continued to decrease steadily. The absence of divergence between the training and validation curves indicates that no significant overfitting occurred. Notably, the classification loss converged faster than the bounding box regression loss, suggesting that while the model could readily distinguish target categories, precise localization of small targets such as E-characters remained more challenging. These results demonstrate that the improved YOLO26 model achieves stable convergence and favorable generalization capability for water gauge detection.
Figure 6.
Loss curves for training and validation sets.
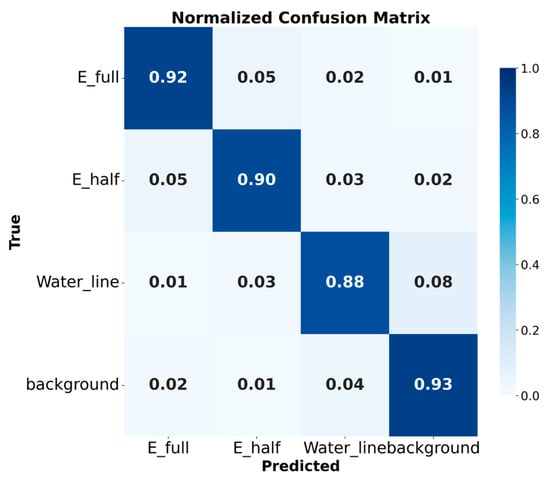
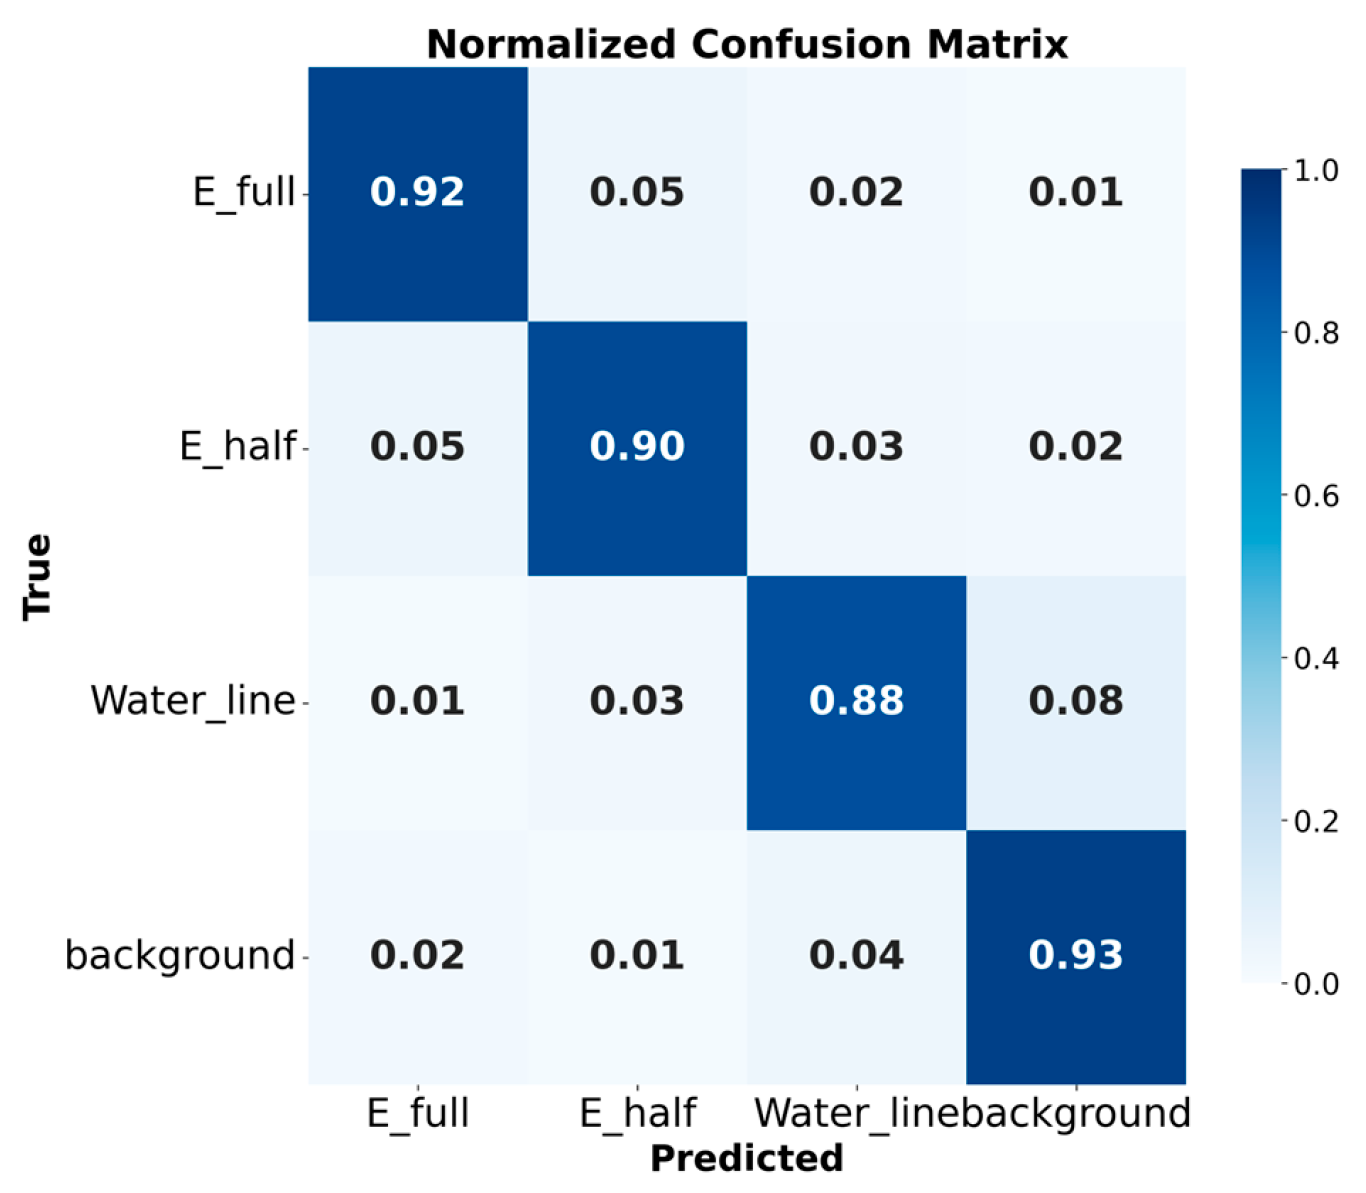
Figure 7 presents the confusion matrix of the improved model for the three target categories—E-full, E-half, and waterline—in the second-stage recognition task. The results demonstrate that the model achieved high classification accuracy for all three categories [30,31,32]. Among them, E-full achieved the highest recognition accuracy, indicating that complete E-characters have clear features and are easy to distinguish. The false positive rate for E-half was slightly higher. This is primarily due to its partial visual similarity to E-full and the feature incompleteness caused by water-surface occlusion. The recognition performance for waterline was relatively lower than that for the other categories. This suggests that there remains room for improvement in the model’s localization accuracy for waterline targets, which constitutes a key direction for future optimization. Overall, the false detection and missed detection rates for the three categories were relatively low. This demonstrates that the improved model possesses favorable discriminative ability and generalization performance in the second-stage recognition task. It can also provide reliable E-character and waterline detection results for water-level estimation.
Figure 7.
Normalized confusion matrix of the improved model E-full, E-half, and water line in the second-stage recognition task.
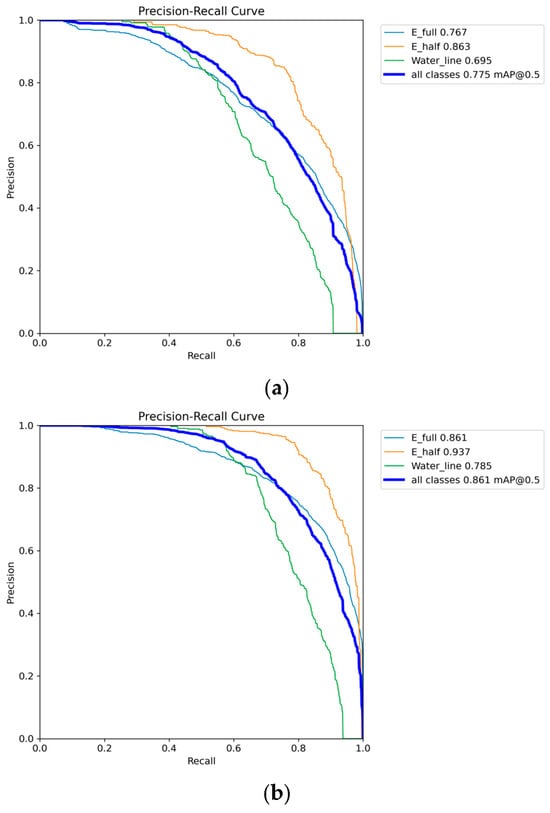
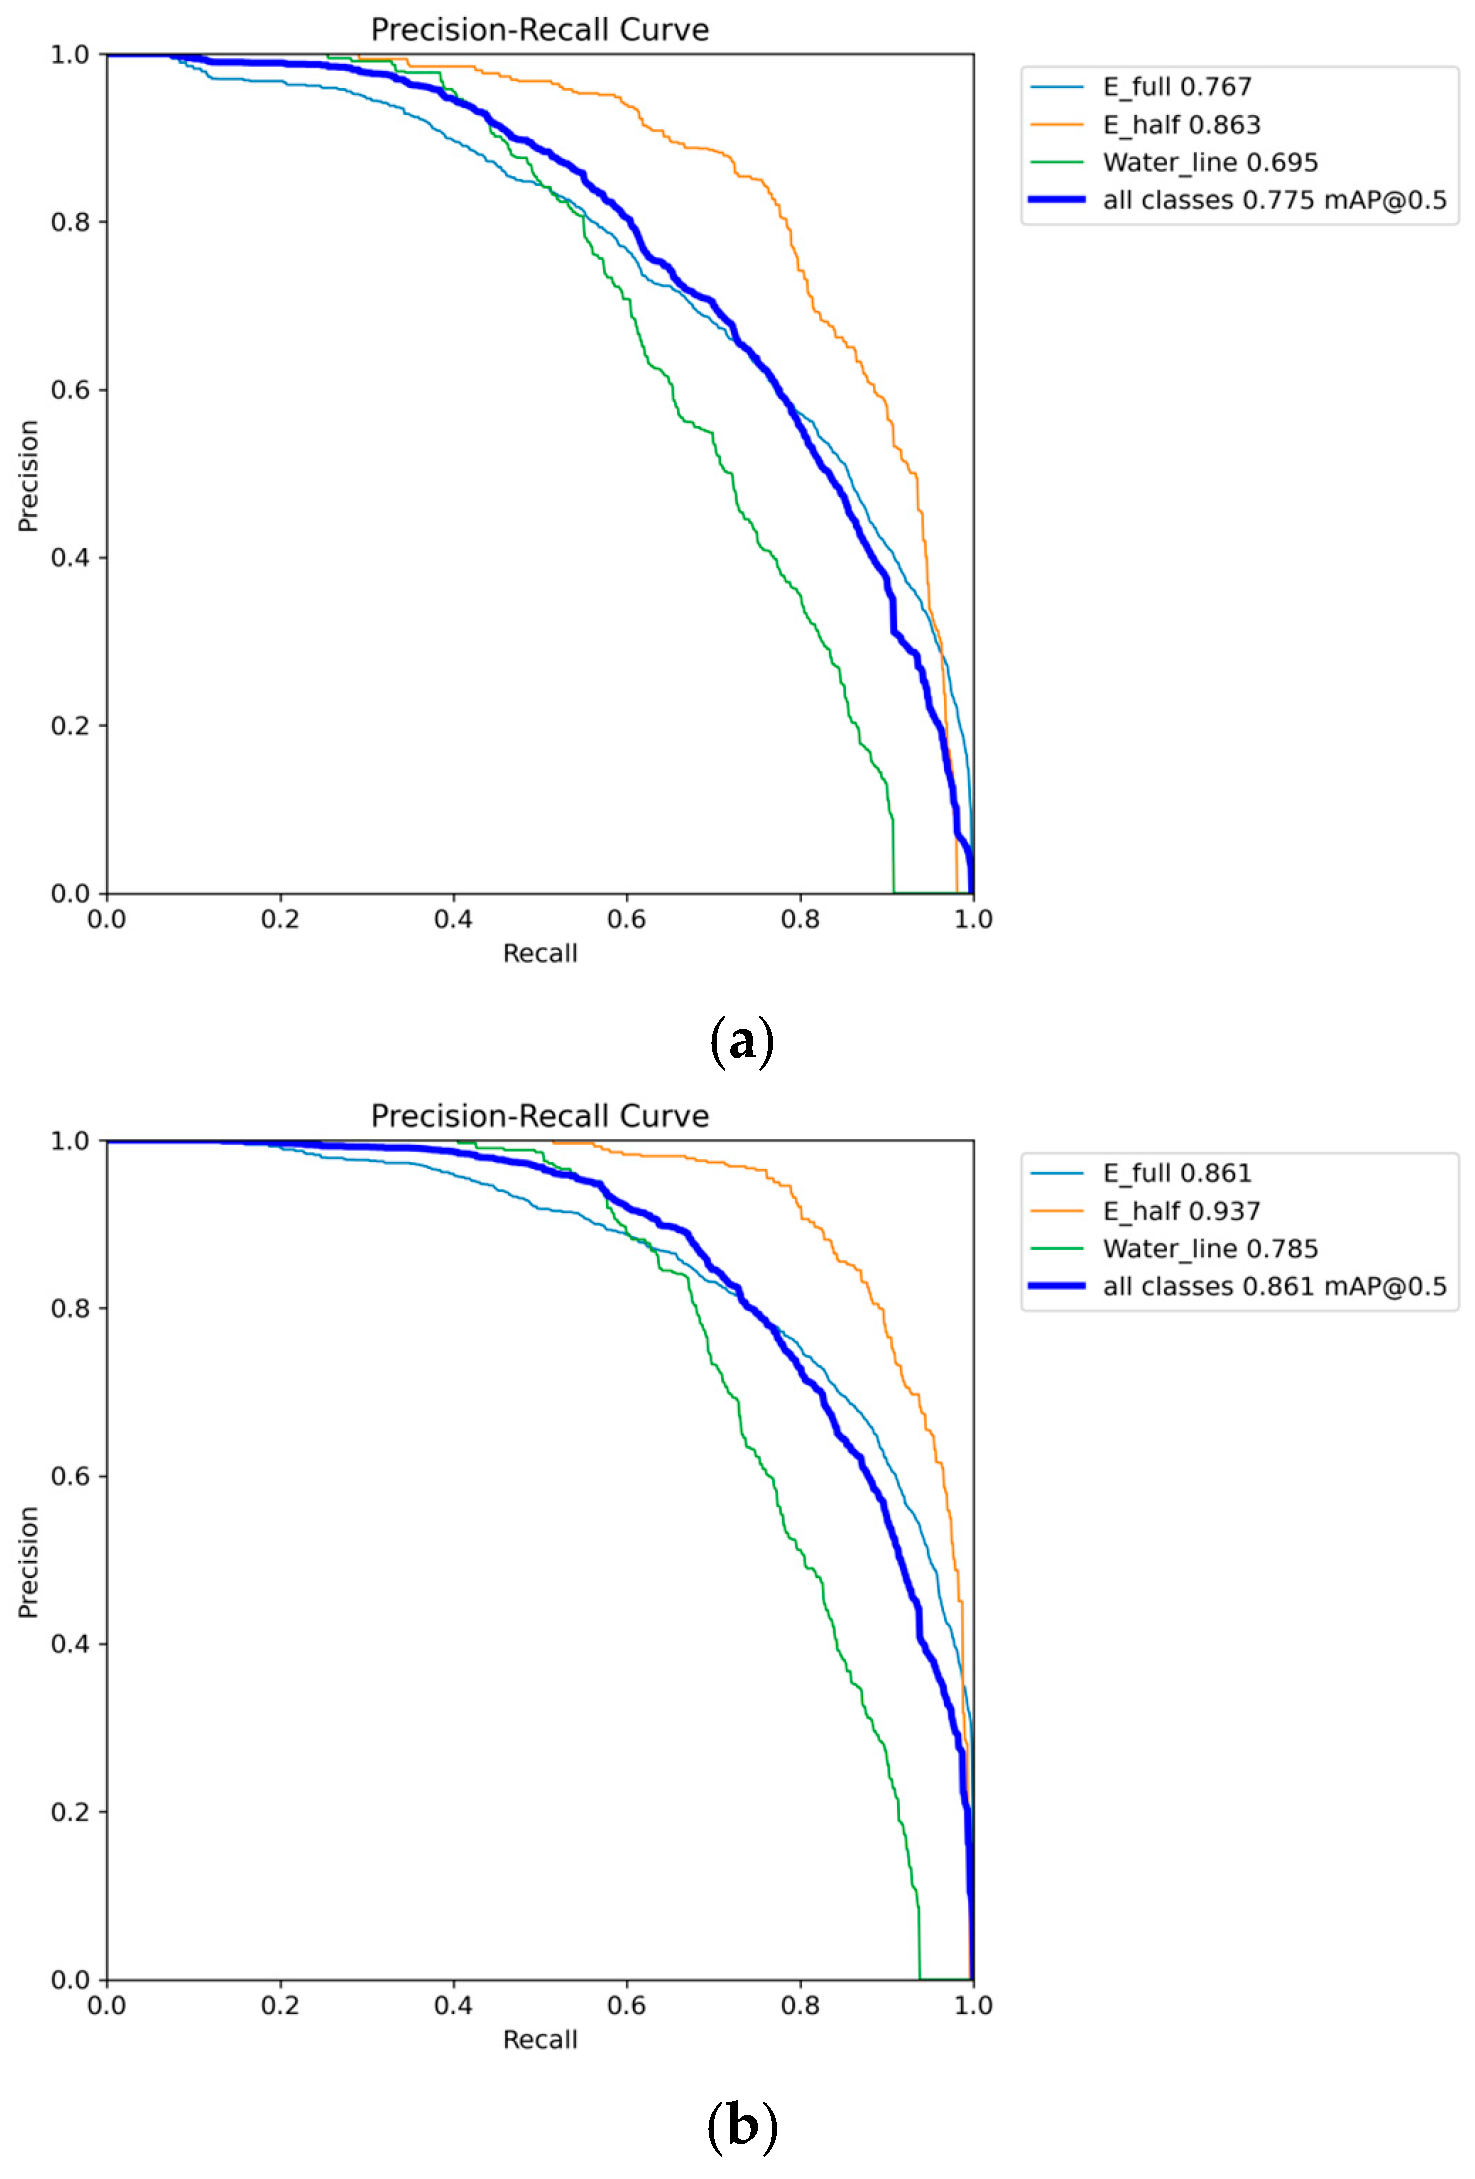
Figure 8 presents a comparison of the Precision–Recall (PR) curves before and after improvement. As can be observed, the precision of the original model exhibited a notable decline after the recall exceeded 0.6. This indicates that the model incurs a certain degree of false positives in pursuit of higher recall. In contrast, the PR curve of the improved model maintained a relatively high and stable precision level across the entire recall range, with a substantially flattened downward trend. This demonstrates that the improved model effectively suppresses false positives while maintaining high recall. These changes indicate that the introduction of the P2 small-target detection head and the CBAM attention mechanism significantly enhances the detection stability and reliability of the model for E-characters on water gauges. It also enables the model to maintain high detection quality even under more stringent recall conditions. The enlargement of the area under the PR curve further validates the effectiveness of the improvement strategies in enhancing water gauge scale recognition performance.
Figure 8.
Precision-Recall curves of the baseline and improved models: (a) Original model; (b) Improved model.
The ablation experimental results are presented in Table 2. As can be observed, all the improvement methods proposed in this study effectively enhance the detection performance of E-characters on water gauges [33,34,35]. The baseline model YOLO26 achieved mAP50 and mAP50:95 of 77.5% and 58.9%, respectively. After separately optimizing the Head network (introducing the P2 small-target detection head and removing the redundant large-target detection head), the mAP50 and mAP50:95 increased to 83.2% and 64.3%, respectively. This indicates that the small-object detection head effectively improves the localization accuracy of E-characters by preserving spatial details in high-resolution feature maps. After separately incorporating the CBAM attention module, the mAP50 and mAP50:95 increased to 82.6% and 62.8%, respectively. This demonstrates that the attention mechanism can effectively enhance the model’s ability to capture edge and texture features of E-characters. When both were introduced simultaneously, the mAP50 and mAP50:95 were further improved to 86.1% and 67.4%, representing increases of 8.6 and 8.5 percentage points over the baseline model, respectively. This indicates that the CBAM attention module and the Head network optimization method can synergistically enhance detection performance. These results validate the effectiveness of the proposed improvement strategies in improving water gauge scale recognition accuracy.
Table 2.
Performance comparison of different improvement modules. (“√” indicates the module is included, and “×” indicates it is not included.)
4.3. Water-Level Reading Results and Analysis
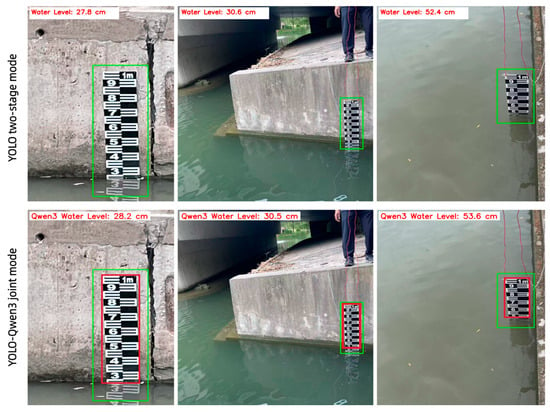
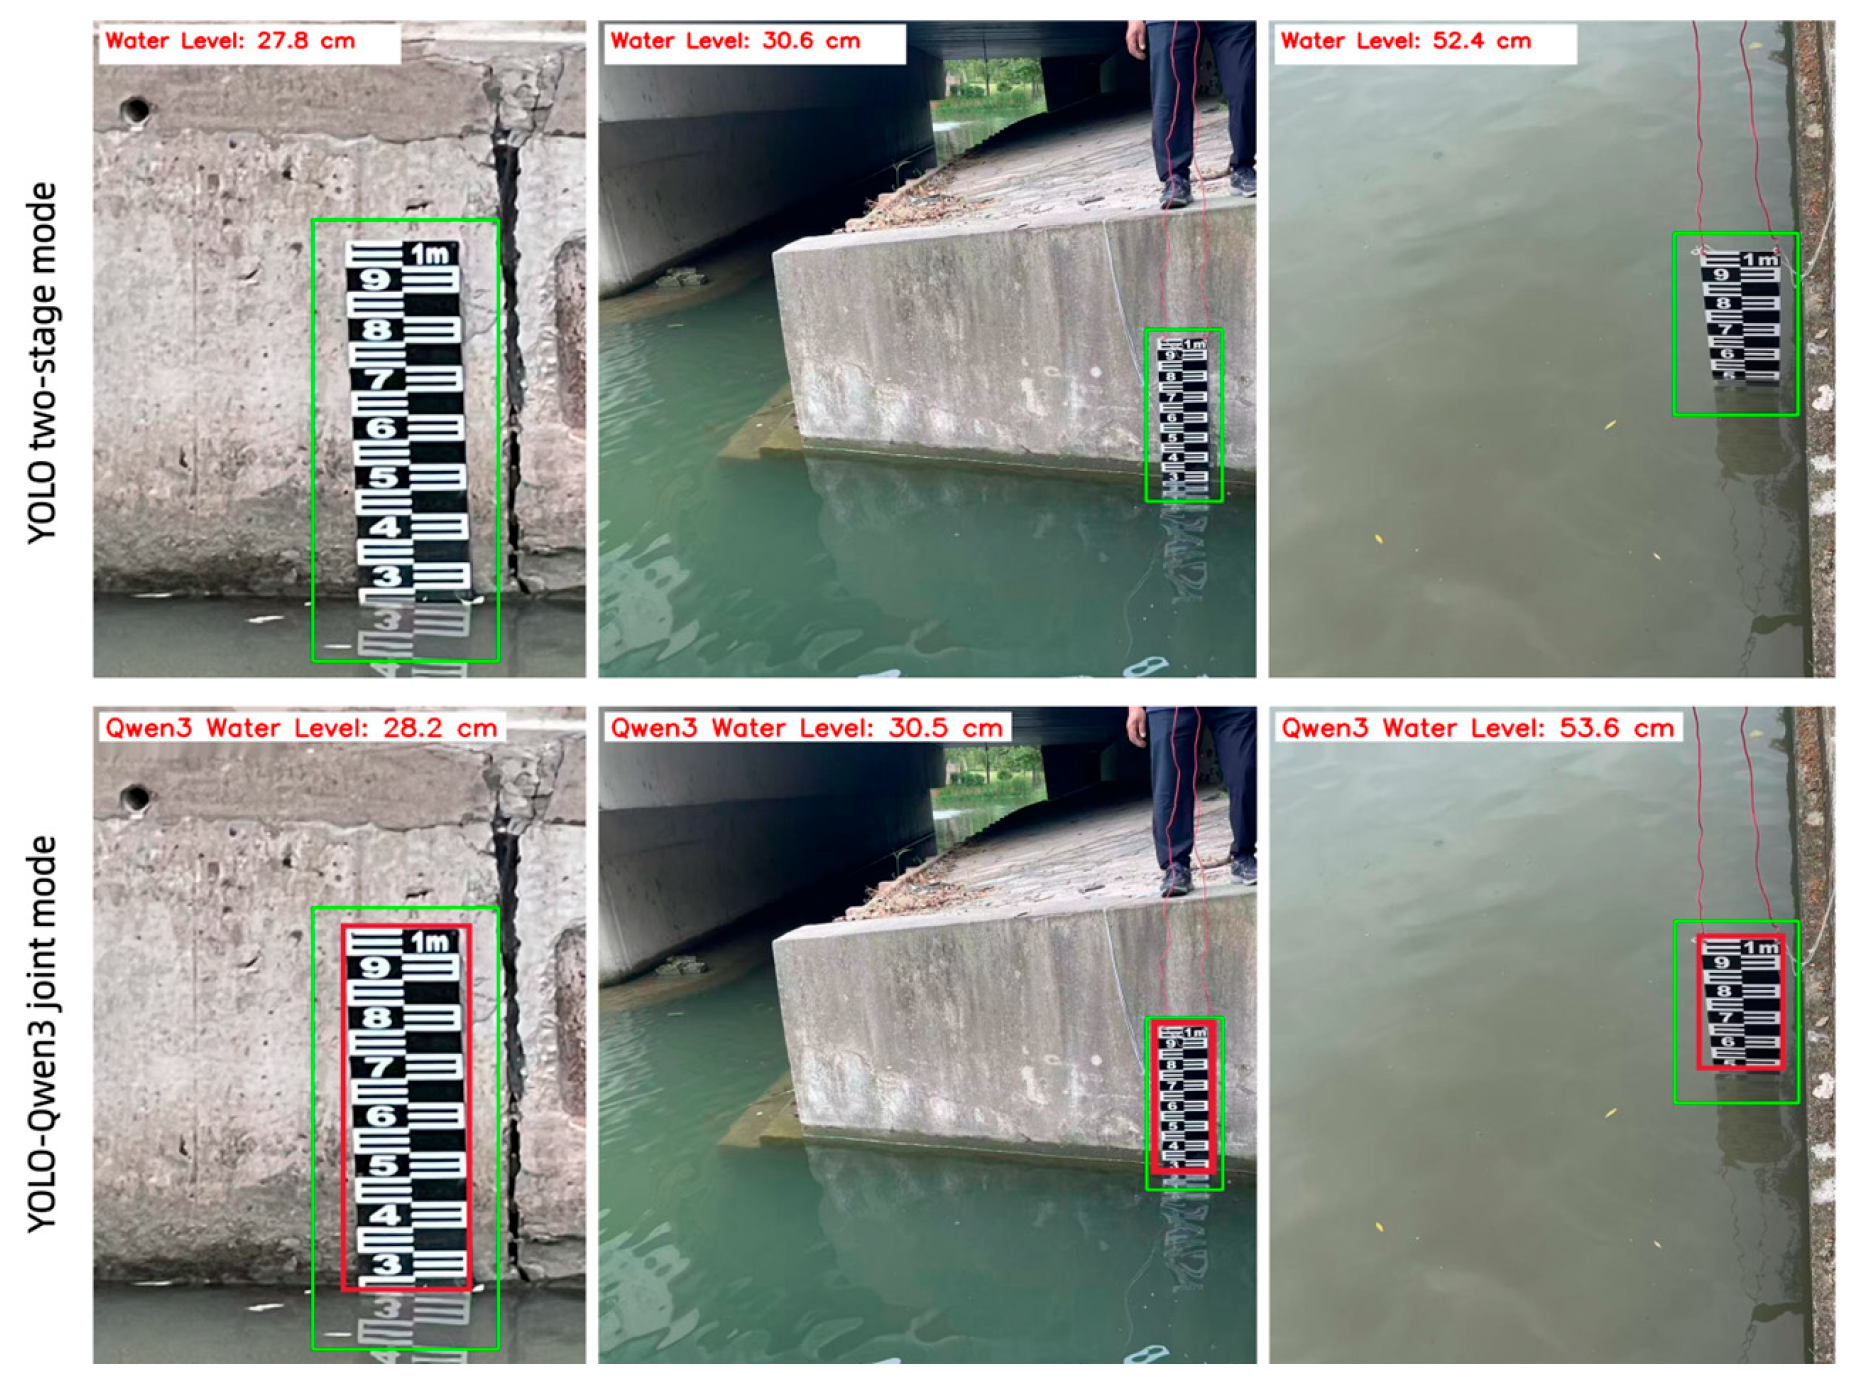
To validate the accuracy of the proposed method, water-level images captured from river sections were selected for testing, and the recognition results were compared with manually measured water levels. Two recognition modes were evaluated: the YOLO two-stage mode, which applies the improved YOLO26 to both stages, and the YOLO-Qwen3 joint mode, which uses the improved YOLO26 for first-stage water gauge localization and perspective correction and then replaces the second stage with Qwen3-VL reasoning.
Typical recognition results are illustrated in Figure 9. Both modes effectively localize the water gauge regions and accurately identify E-character features, with only minor deviations from the manually measured values. This indicates that both modes possess favorable detection capability and reading stability under complex background conditions, demonstrating strong robustness.
Figure 9.
Comparison of water-level reading results between the YOLO two-stage mode and the YOLO-Qwen3 mode. The green boxes indicate the localized water gauge regions detected by the model.
A quantitative comparison between the water-level values automatically identified by the two modes and the manual readings is presented in Table 3. Across the three representative field scenarios, the absolute errors for both modes were all below 2 cm, meeting the practical accuracy requirements for river water-level monitoring. These results verify the feasibility and reliability of the proposed method in engineering applications.
Table 3.
Water-level detection results and comparison of absolute errors. The three scenarios correspond to the representative field images in Figure 9.
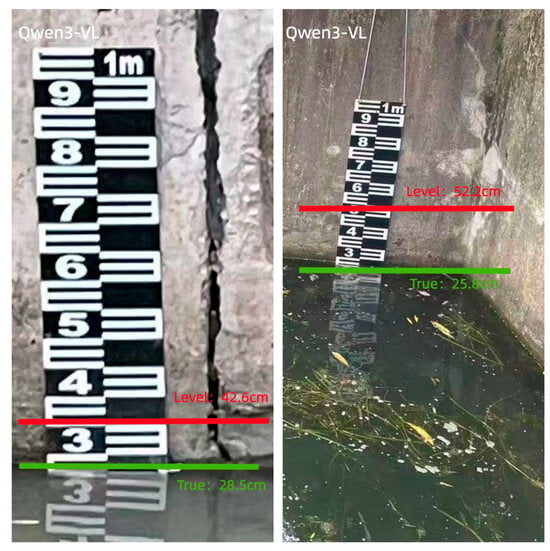
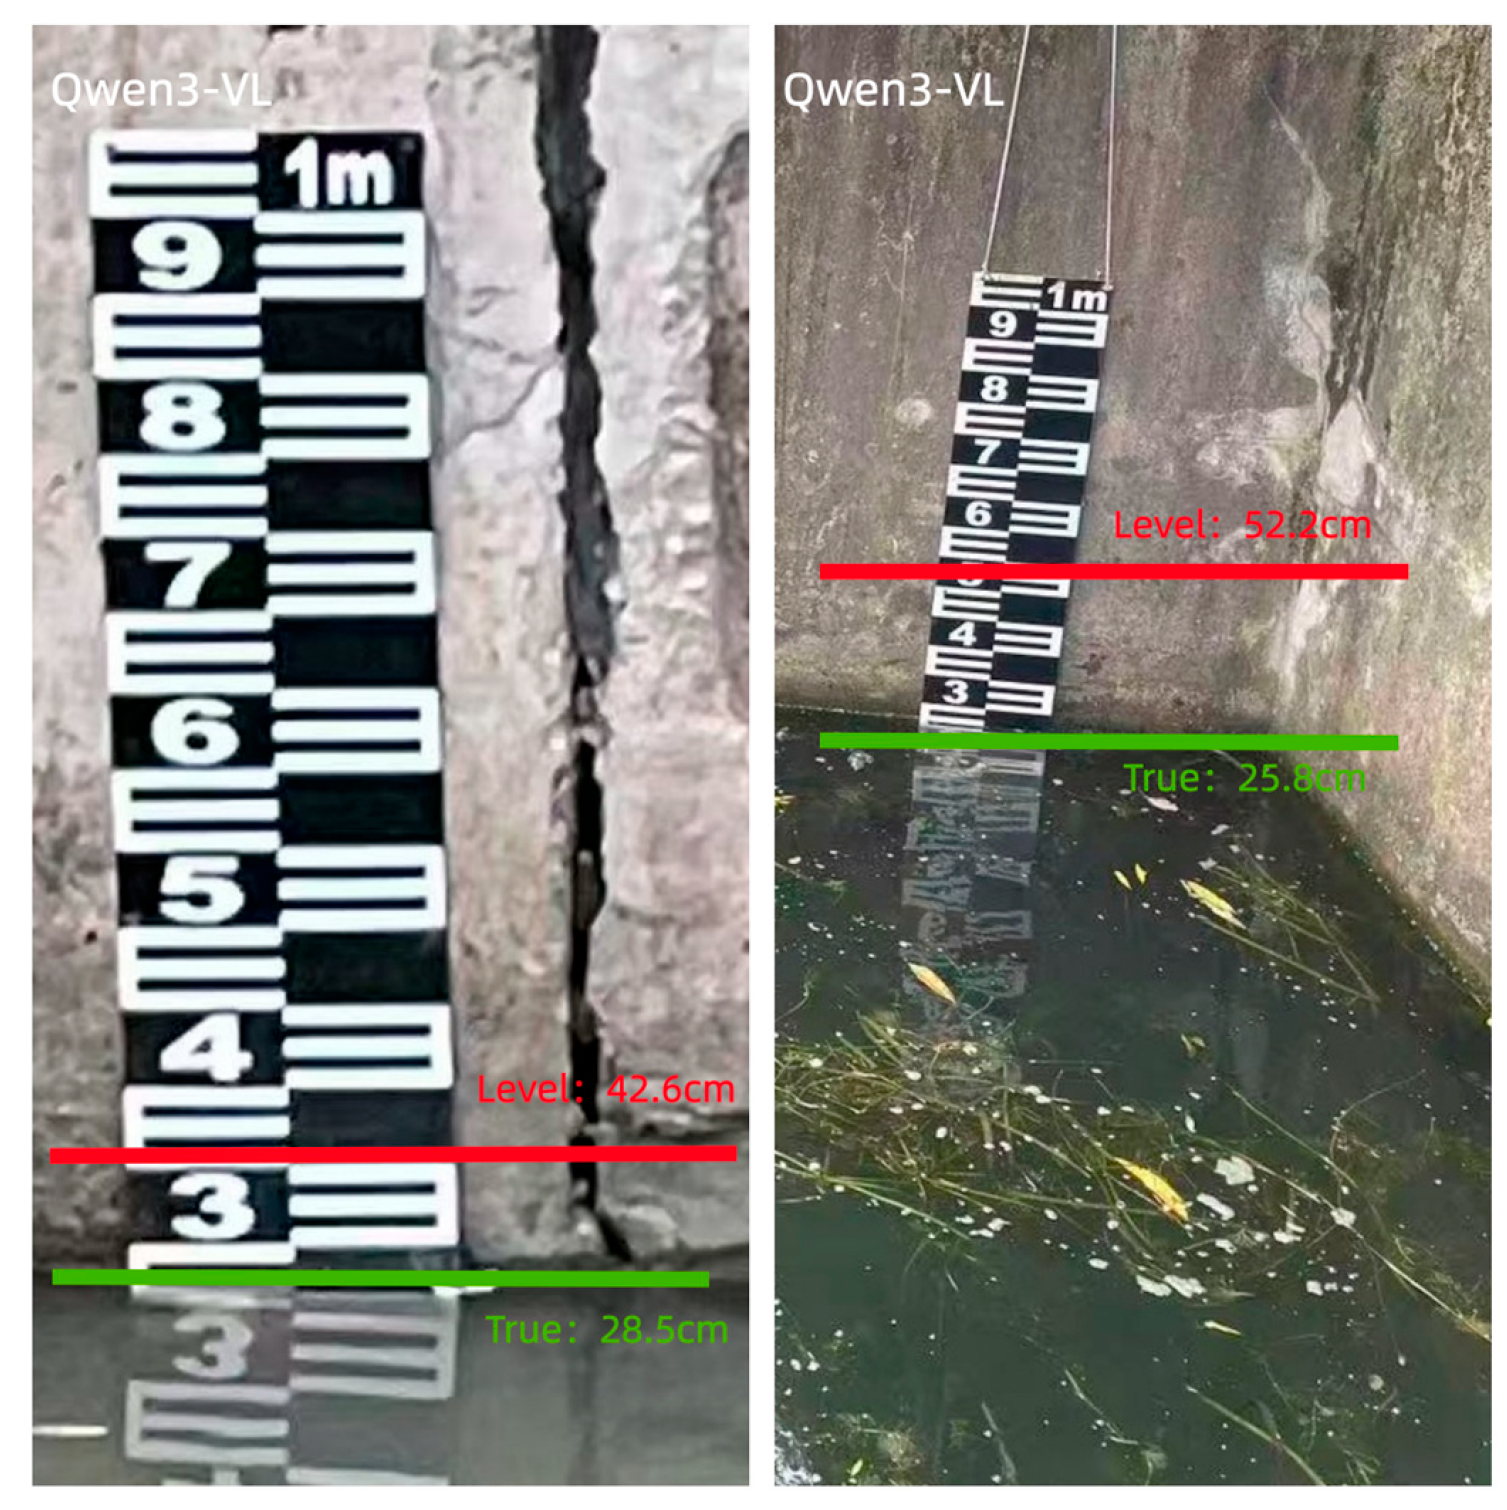
In contrast to the accurate joint-mode results in Table 3, to further demonstrate the necessity of our two-stage architecture, we conducted a direct zero-shot inference test using the base Qwen3-VL model on raw, unrectified images. We provided the model with a direct prompt: “Read the water level from this image in cm.” Figure 10 illustrates two representative failure cases. In the first case, despite the actual water level being near the bottom of the gauge (green line), the model hallucinated a completely misaligned reading in the middle (red line), yielding a massive error (42.6 cm vs. True 28.2 cm). In the second case, the model misidentified the reflection boundary as the water level, resulting in a significant deviation from the true waterline (52.2 cm vs. True 25.8 cm).
Figure 10.
Representative failure cases of direct zero-shot inference using the base Qwen3-VL model on raw, unrectified images. Red lines indicate model predictions and green lines indicate true water levels.
These representative cases indicate that relying directly on a base VLM is insufficient for engineering-grade precision. The base model lacks the pixel-level grounding capability to locate the fine-grained waterline in cluttered backgrounds. This validates the core design philosophy of our framework: Task Decoupling. The improved YOLO26 acts as a dedicated visual-grounding front-end, allowing Qwen3-VL to focus purely on its strength—controlled arithmetic reasoning.
5. Conclusions
This study addressed the challenging task of water-level recognition from water gauge images in complex riverine scenarios. A collaborative framework integrating VT-BM3D denoising, an improved YOLO26 detection model, and YOLO-Qwen3 multimodal joint reasoning was proposed. The main contributions are summarized as follows:
- (1)
- A VT-BM3D-based denoising strategy was integrated into the pipeline. By combining variance-stabilizing transformation with BM3D collaborative filtering, the proposed strategy effectively suppresses water-surface reflections and background noise while preserving the edge structures of water gauge scale markings, thereby providing high-quality inputs for subsequent detection and recognition.
- (2)
- An attention-enhanced small-object detection scheme was developed. The integration of the CBAM attention mechanism and a P2 small-object detection head enables the model to focus on key water gauge regions and fine-grained E-characters. Experiments confirmed that the two modules act synergistically to improve the detection of E-characters and the waterline through task-specific coupling of CBAM and the P2 head, rather than by inventing new modules.
- (3)
- A dual-mode reading architecture was constructed, comprising the YOLO two-stage mode and the YOLO-Qwen3 joint mode. Both modes share the same VT-BM3D denoising and improved YOLO26 detection backbone. The YOLO-Qwen3 joint mode replaces the second stage with Qwen3-VL reasoning to produce the final reading, while the YOLO two-stage mode applies the improved YOLO26 to both stages.
The experimental results demonstrated that the improved YOLO26 achieved an mAP50 of 86.1% and an mAP50:95 of 67.4% in the second-stage detection of E-characters and the waterline, surpassing the baseline by 8.6 and 8.5 percentage points, respectively. On real-world water gauge images, both modes delivered absolute errors below 2 cm in the evaluated field scenarios. These results collectively validate the accuracy, robustness, and practical applicability of the proposed framework for water-level recognition.
From an engineering perspective, the lightweight two-stage mode is suitable for edge deployment in real-time river gauge reading, while the multimodal reasoning mode provides higher-level semantic interpretation for complex scenes. The framework can be integrated into existing video surveillance systems for urban flood warning, reservoir scheduling, and smart water management, reducing reliance on manual observation and improving the temporal resolution of water-level data.
However, it should be noted that the current visual model is specifically optimized for standard shore-fixed E-pattern staff gauges under specific imaging conditions. Preliminary supplementary tests on openly available images indicate a significant domain gap when applying the model to mid-channel gauges or highly diverse public datasets, due to mismatches in gauge types, installation modes, and camera angles.
Future work will focus on expanding the dataset to cover diverse gauge types and adverse weather conditions such as rain and fog, exploring domain adaptation techniques to bridge the cross-domain gap, investigating parameter-efficient fine-tuning for the multimodal model, developing lightweight deployment strategies, and conducting long-term field validation under continuous operation.
Author Contributions
Data curation, Z.J.; software, Z.J.; writing—original draft preparation, Z.J.; writing—review and editing, G.H. All authors have read and agreed to the published version of the manuscript.
Funding
This research received no external funding.
Institutional Review Board Statement
Not applicable.
Informed Consent Statement
Not applicable.
Data Availability Statement
The raw data are not publicly available due to local security regulations regarding geographic information of river sections and hydraulic infrastructure. Representative sample images are provided in Figure 1 of this manuscript. Data may be available from the corresponding author upon reasonable request and with institutional permission.
Acknowledgments
The authors thank the staff at the Shanghai Hongkou District Environmental Monitoring Station for their assistance with field data collection.
Conflicts of Interest
The authors declare no conflicts of interest.
Abbreviations
The following abbreviations are used in this manuscript:
| BM3D | Block-Matching and 3D Filtering |
| CBAM | Convolutional Block Attention Module |
| CNN | Convolutional Neural Network |
| E-full | Complete E-shaped character |
| E-half | Half E-shaped character |
| IoU | Intersection over Union |
| LLM | Large Language Model |
| mAP | Mean Average Precision |
| MAE | Mean Absolute Error |
| NMS | Non-Maximum Suppression |
| PSNR | Peak Signal-to-Noise Ratio |
| SSIM | Structural Similarity Index |
| STAL | Small Target Aware Label Assignment |
| VLM | Vision-Language Model |
| YOLO | You Only Look Once |
| VT-BM3D | BM3D with Variance-stabilizing Transformation |
References
- Lin, Y.; Lu, C.; Li, Y.; Zhou, R. A new approach for identifying dominant cloud types and relationships between cloud types and precipitation vertical structure in tropical regions. Atmos. Ocean. Sci. Lett. 2025, 18, 100606. [Google Scholar] [CrossRef] [Scilit]
- Zhao, Z.; Lu, B.; Zhang, S.; Wang, D.; Wan, J.; Liu, R.; Li, H.; Wang, Z. Evaluating the performance of automatic detection for urban flood levels using different deep learning approaches. Water Resour. Manag. 2026, 40, 280. [Google Scholar] [CrossRef] [Scilit]
- Wang, X.; Li, Z.; Zhang, Y.; An, G. Water level recognition based on deep learning and character interpolation strategy for stained water gauge. River 2023, 2, 506–517. [Google Scholar] [CrossRef] [Scilit]
- Zheng, Y.; Li, J.; Zhang, T.; Rong, Y.; Feng, P. Exploring the application of flood scaling property in hydrological model calibration. J. Hydrometeorol. 2021, 22, 3255–3274. [Google Scholar] [CrossRef] [Scilit]
- Qiao, G.; Yang, M.; Wang, H. A water level measurement approach based on YOLOv5s. Sensors 2022, 22, 3714. [Google Scholar] [CrossRef] [Scilit]
- Notarangelo, N.M.; Wirion, C.; van Winsen, F. STURM-Flood Depth: A deep learning pipeline for mapping urban flood depth using street-level and oblique aerial imagery. Geomatica 2025, 77, 100061. [Google Scholar] [CrossRef] [Scilit]
- Chen, C.; Fu, R.; Ai, X.; Huang, C.; Cong, L.; Li, X.; Jiang, J.; Pei, Q. An integrated method for river water level recognition from surveillance images using convolution neural networks. Remote Sens. 2022, 14, 6023. [Google Scholar] [CrossRef] [Scilit]
- An, S.; Oh, T.J.; Kim, S.W.; Jung, J.J. Self-clustered GAN for precipitation nowcasting. Sci. Rep. 2024, 14, 9755. [Google Scholar] [CrossRef] [Scilit]
- Peng, P.; Zhang, X.; Cheng, Y.; Wu, Z. VT-BM3D: A collaborative filtering framework with joint optimization of structure awarness and noise characteristics. Signal Process. 2026, 243, 110417. [Google Scholar] [CrossRef] [Scilit]
- Thakral, G.; Kumar, U.; Gambhir, S. Hybrid CNN-transformer model with BM3D and YOLOv8 for early detection of lung cancer in low-dose CT scans. Sci. Rep. 2026, 16, 13597. [Google Scholar] [CrossRef] [Scilit]
- Wu, G.L.; Yu, X.Z.; Zhu, S.H.; Tian, Y.Y.; Kuang, Y.J.; Zhao, H.Q.; Qiu, S.; Jin, W.Q.; Wang, X. Preprocessing method for underwater time-gated SPAD-array-based images utilizing Retinex and BM3D. Appl. Opt. 2025, 64, 3842–3855. [Google Scholar] [CrossRef] [Scilit]
- Yukawa, C.; Oda, T.; Sato, T.; Hirota, M.; Katayama, K.; Barolli, L. An intelligent water level estimation system considering water level device gauge image recognition and wireless sensor networks. J. Sens. Actuator Netw. 2025, 14, 13. [Google Scholar] [CrossRef] [Scilit]
- Santos, C.A.G.; Ghorbani, M.A.; Abdi, E.; Patel, U.; Sadeddin, S. Estimating water levels through smartphone-imaged gauges: A comparative analysis of ANN, DL, and CNN models. Water Resour. Manag. 2024, 39, 1639–1654. [Google Scholar] [CrossRef] [Scilit]
- Zhu, B.; Tian, K.; Xu, Q.; Wang, Y.; Wu, D.; Liu, T. A lightweight YOLO26 pavement defect detection method for complex pavement environments. J. Big Data Comput. 2026, 4, 219. [Google Scholar] [CrossRef] [Scilit]
- Hao, Y.; Wang, K.; Zhang, L.; Yuan, Z. ASCA-YOLO: Adaptive sparse and context-aware YOLO algorithm for forest wildfire detection. Sensors 2026, 26, 3444. [Google Scholar] [CrossRef] [Scilit]
- Cruz-Moran, A.D.L.; Lizarbe-Alarcon, H.; Moncada, W.; Bellido-Aedo, V.; Carrasco-Badajoz, C.; Rayme-Chalco, C.; Aldana, C.; Saavedra, Y.; Saavedra, E.; Pereda, A. QHAWAY: An instance segmentation and monocular distance estimation ADAS for vulnerable road users in informal Andean urban corridors. Sensors 2026, 26, 2569. [Google Scholar] [CrossRef] [Scilit]
- Wu, Q.; Liu, H.; Zhu, H.; Wang, C.; Wang, H.; Han, Z.; Zhao, L.; Liu, F. YOLOSSP: An auto-algorithm to detect mature soybean stem nodes based on key point detection. Agronomy 2025, 15, 1128. [Google Scholar] [CrossRef] [Scilit]
- Yavuz, B.Ç. Scale-dependent performance analysis of YOLO26 and YOLOv11 for PPE detection. Electronics 2026, 15, 1146. [Google Scholar] [CrossRef] [Scilit]
- Guo, S.; Huang, J.; Yan, Y.; Zhang, P.; Wang, B.; Shen, H.; Yuan, Z. Secure indoor water level monitoring with temporal super resolution and enhanced YOLOv5. Sensors 2025, 25, 2835. [Google Scholar] [CrossRef] [Scilit]
- Chen, Y.; Dong, Y.; Sun, Y.; He, C. Typical lake area is accurately predicted and assessed based on deep learning algorithms and associated physical mechanisms. Earth Sci. Inform. 2024, 17, 2317–2330. [Google Scholar] [CrossRef] [Scilit]
- Jia, R.; Ma, S.; Wei, S.; Ma, Z.; Ji, S.; Zhang, D. Integrating numerical simulation and machine learning for groundwater level prediction: A case study of Eastern Beijing, China. Water 2026, 18, 1486. [Google Scholar] [CrossRef] [Scilit]
- Chau, M.T.H.; Ngan, T.T.; Giang, L.N.; Son, N.N. HOG-GRU: A novel multi-modal water level forecasting model integrating satellite imagery and reservoir operation data. Data Technol. Appl. 2026, 60, 297–329. [Google Scholar] [CrossRef] [Scilit]
- He, Z.; Guo, J.; Cao, Z.; Wang, Y.; Wang, C.; Qin, H. Rolling predictive optimal scheduling of reservoirs for flood control and power generation under prediction uncertainty. Sci. Rep. 2026, 16, 14851. [Google Scholar] [CrossRef] [Scilit]
- Hoseini, M.S.; Soltanpour, M.; Zolfaghari, R.M. Climate change impacts on temperature and precipitation over the Caspian Sea. Int. J. Water Resour. Dev. 2025, 41, 31–56. [Google Scholar] [CrossRef] [Scilit]
- Liu, W.C.; Huang, W.C. Evaluation of deep learning computer vision for water level measurements in rivers. Heliyon 2024, 10, e25989. [Google Scholar] [CrossRef] [Scilit]
- Atangana Njock, P.G.; Yin, Z.Y.; Xu, H.R.; Zhang, N. Structural failure risk assessment of shield tunnel using large language model. Tunn. Undergr. Space Technol. 2025, 165, 106882. [Google Scholar] [CrossRef] [Scilit]
- Kadiyala, L.A.; Mermer, O.; Samuel, D.J.; Sermet, Y.; Demir, I. The implementation of multimodal large language models for hydrological applications: A comparative study of GPT-4 Vision, Gemini, LLaVa, and Multimodal-GPT. Hydrology 2024, 11, 148. [Google Scholar] [CrossRef] [Scilit]
- Ariyametkul, A.; Paing, P.M. Analyzing explainability of YOLO-based breast cancer detection using heat map visualizations. Quant. Imaging Med. Surg. 2025, 15, 6252–6271. [Google Scholar] [CrossRef] [Scilit]
- Maji, A.; Ghosh, I. Evaluating the accuracy of vehicle tracking data from unmanned aerial vehicle videos and identifying traffic conflict points to develop a conflict frequency predictive model for roundabout safety assessment under mixed traffic. Trans. Portation. Res. Rec. 2025, 2679, 673–690. [Google Scholar] [CrossRef] [Scilit]
- Hashemi-Beni, L.; Puthenparampil, M.; Jamali, A. A low-cost IoT-based deep learning method of water gauge measurement for flood monitoring. Geomat. Nat. Hazards Risk 2024, 15, 2364777. [Google Scholar] [CrossRef] [Scilit]
- Zamboni, P.; Krüger, R.; Bertalan, L.; Blanch, X.; Hindorf, P.; Eltner, A. Low-cost stereo vision and deep learning for river water level measurement. Int. Arch. Photogramm. Remote Sens. Spat. Inf. Sci. 2026, 49, 321–328. [Google Scholar] [CrossRef] [Scilit]
- Yücetürk, B.; Güner, Z. Deep learning approach for tooth numbering and restoration detection on pediatric periapical radio graphs in mixed dentition. Clin. Oral Investig. 2025, 29, 495. [Google Scholar] [CrossRef] [Scilit]
- Matos, S.N.; Rocha, A.L.M.; Domingues Filho, G.M.; Ranieri, C.M.; Garcia, R.D.; Faria, A.C.O.; Medina, M.M.G.; Ueyama, J. Ensuring reliable water level measurement for flooding: A redundancy-based approach with pressure transducer and computer vision. Trans. Inst. Meas. Control 2026, 48, 1180. [Google Scholar] [CrossRef] [Scilit]
- Zheng, B.; Yang, Y. AE-YOLO: Research and application of the YOLOv11-based lightweight improved model in photovoltaic panel surface intelligent defect detection. Materials 2025, 18, 5404. [Google Scholar] [CrossRef] [Scilit]
- Noto, S.; Grimaldi, S.; Apollonio, C.; Durighetto, N.; Mosquera, G.M.; Petroselli, A.; Tauro, F. Edge-computing stream water level through the Stage Cam Box: Software and preliminary test. Hydrol. Sci. J. 2026, 71, 1876. [Google Scholar] [CrossRef] [Scilit]

Disclaimer/Publisher’s Note: The statements, opinions and data contained in all publications are solely those of the individual author(s) and contributor(s) and not of MDPI and/or the editor(s). MDPI and/or the editor(s) disclaim responsibility for any injury to people or property resulting from any ideas, methods, instructions or products referred to in the content. |
© 2026 by the authors. Licensee MDPI, Basel, Switzerland. This article is an open access article distributed under the terms and conditions of the Creative Commons Attribution (CC BY) license.