


Abstract
Deploying deep-learning detectors for printed circuit board (PCB) inspection on embedded hardware requires balancing detection performance against computational and memory constraints. This study evaluates a You Only Look Once version 8 medium (YOLOv8m) detector deployed on the AMD Kria KV260 (Advanced Micro Devices, Inc., Santa Clara, CA, USA) field-programmable gate array (FPGA) platform using the Vitis AI toolchain and a single DPUCZDX8G B4096 deep-learning processing unit (DPU) core at 275 MHz. The experimental subset comprised 1194 DeepPCB images covering all 11 board groups and six defect classes, including 959 training/internal-validation and 235 test images. The 32-bit floating-point (FP32) model achieved 93.5% mean average precision at an intersection-over-union threshold of 0.5 (mAP@50). Following 8-bit integer (INT8) post-training quantization, the model achieved 93.2% mAP@50 during on-board execution on the same images, while reducing nominal weight storage approximately fourfold. The measured end-to-end throughput was 0.87 frames per second (FPS). Stage-level profiling yielded 333.2 ms preprocessing, 206.8 ms DPU inference, and 609.0 ms postprocessing per frame, indicating that host-side processing, particularly postprocessing, dominated end-to-end latency. An exploratory throughput-only comparison on the same platform yielded 3.92 FPS for YOLOX-Nano and 1.72 FPS for YOLOX-Tiny. These results establish a documented deployment baseline for a medium-scale YOLO detector on a low-cost FPGA platform and highlight the importance of host-side processing in determining end-to-end inference throughput.
1. Introduction
The quality of printed circuit boards (PCBs) directly influences the reliability and operational stability of electronic systems. Conventional visual inspection is labor-intensive, time-consuming, and subject to operator-dependent variability. Automated optical inspection (AOI) methods based on template matching, thresholding, or pixel-level comparison can reduce manual effort, but their performance may deteriorate under changes in illumination, surface appearance, and manufacturing conditions [1,2]. Deep-learning-based object detection provides an alternative approach by learning discriminative visual representations directly from data and has therefore attracted increasing attention for automated PCB inspection [3].
Recent studies on defect detection and related You Only Look Once (YOLO)-based vision tasks have employed graphics processing unit (GPU)-based and embedded system-on-chip platforms [3,4,5,6,7,8,9,10,11,12] and resource-constrained field-programmable gate arrays (FPGA)-based systems [13,14,15]. GPU-based approaches generally provide high throughput and detection performance; for example, YOLO-RRL, a lightweight YOLO-based detector, reported 95.4% mean average precision (mAP) for PCB surface defects [3], while other PCB-oriented approaches have reported mAP values of 99% or higher on high-performance GPU platforms [9,10]. Lightweight detector designs have also been investigated to reduce computational complexity and improve suitability for embedded inference [8,9]. Systematic benchmarking studies further indicate that no single YOLO variant is universally optimal for PCB inspection: a dual-cycle comparison of YOLOv8–YOLOv13 on the PKU-Market-PCB dataset reported mAP@50 values of up to 94.6% for YOLOv10 under full training [16], while architectural modifications combining spatial-channel reconstruction convolution, multi-scale attention, and an auxiliary-box regression loss raised YOLOv11n to 95.9% mAP@50 with a compact 13.3 MB model size [17]. These studies report accuracy under GPU execution, and embedded deployment and quantization effects remain outside their scope.
FPGAs are attractive for edge inference because they combine reconfigurable hardware with dedicated arithmetic and on-chip memory resources, and recent surveys document a broad range of FPGA-based YOLO accelerators and deep-learning inference engines [18,19]. In the PCB domain, previous studies have explored FPGA-based implementations of different YOLO architectures, including YOLOv3 on an AXU5EVB-P (ALINX Electronic Technology Co., Ltd., Shanghai, China)board [13], RepYOLOv2 on a ZCU102 (Advanced Micro Devices, Inc., Santa Clara, CA, USA) board (2.12 FPS) [14], and YOLOX-Plus on a PYNQ-Z2 (TUL Corporation, New Taipei City, Taiwan) board (72.6 FPS) [15].
These implementations primarily target customized network or accelerator designs, with performance results obtained using different datasets and evaluation settings. In contrast, the deployment of a contemporary medium-scale detector on a low-cost FPGA platform using a vendor-supported 8-bit integer (INT8) toolchain, together with a systematic accuracy assessment comparing floating-point results with on-board measurements, remains less extensively documented.
Recent studies using the Kria KV260 (Advanced Micro Devices, Inc., Santa Clara, CA, USA) highlight the importance of evaluating inference performance at the system level. Laganier et al. [20] investigated FPGA-based vessel detection in synthetic aperture radar (SAR) images using YOLOv8n and distinguished full-application throughput from throughput measured on the deep-learning processing unit (DPU) alone, demonstrating that reported performance depends on the measurement boundary and execution concurrency. Ji et al. [21] investigated function-preserving graph rewriting of YOLOv8 C2f (cross-stage partial bottleneck with two convolutions) blocks to reduce runtime split overhead on FPGA-based DPUs. Although these studies consider different application domains and model or graph configurations from the YOLOv8m-based PCB defect detector investigated in this work, they underscore the need to characterize the complete inference pipeline by explicitly reporting preprocessing, DPU execution, and postprocessing costs. Such system-level profiling provides a more representative assessment of end-to-end throughput than DPU-only measurements and enables a clearer identification of performance bottlenecks.
Table 1 summarizes representative studies grouped by application and execution platform. The entries are reported as published; because datasets, input image sizes, network architectures, and hardware differ across rows, the table provides context rather than a direct performance ranking. Platform-specific measurements of the proposed model are reported separately in Section 3.4.
Table 1.
Defect- and object-detection studies available in the literature, grouped according to application and execution platform.
Our previous studies investigated deep-learning-based approaches for PCB defect detection [22,23]. Building on this earlier work, the proposed study focuses on the hardware-oriented evaluation and FPGA deployment of a YOLOv8m-based PCB defect detector on the AMD Kria KV260 platform. To ensure compatibility with the DPU, the default sigmoid linear unit (SiLU) activation was replaced with the leaky rectified linear unit (LeakyReLU) before training. The resulting model was first evaluated in 32-bit floating-point (FP32) precision on the designated test set, after which the same trained weights were used for INT8 post-training quantization and on-board inference. Beyond detection performance, the proposed study characterizes memory requirements and system-level throughput, providing a hardware-oriented assessment of the detector on the target embedded platform.
The main contributions of this study are as follows: (i) documenting the complete host-to-FPGA deployment workflow; (ii) reporting floating-point and on-board INT8 detection results on the same test set; (iii) quantifying the nominal weight-storage reduction associated with INT8 representation; (iv) examining measured end-to-end throughput in relation to the nominal compute capacity of the selected DPU; (v) providing an exploratory throughput-only comparison with two YOLOX variants on the same KV260 platform; and (vi) reporting a supplementary FP32 sensitivity analysis under synthetic image noise and illumination variations.
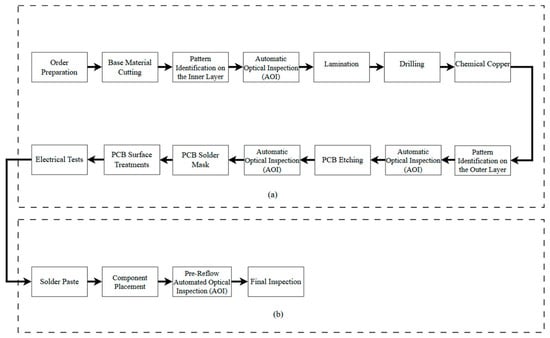
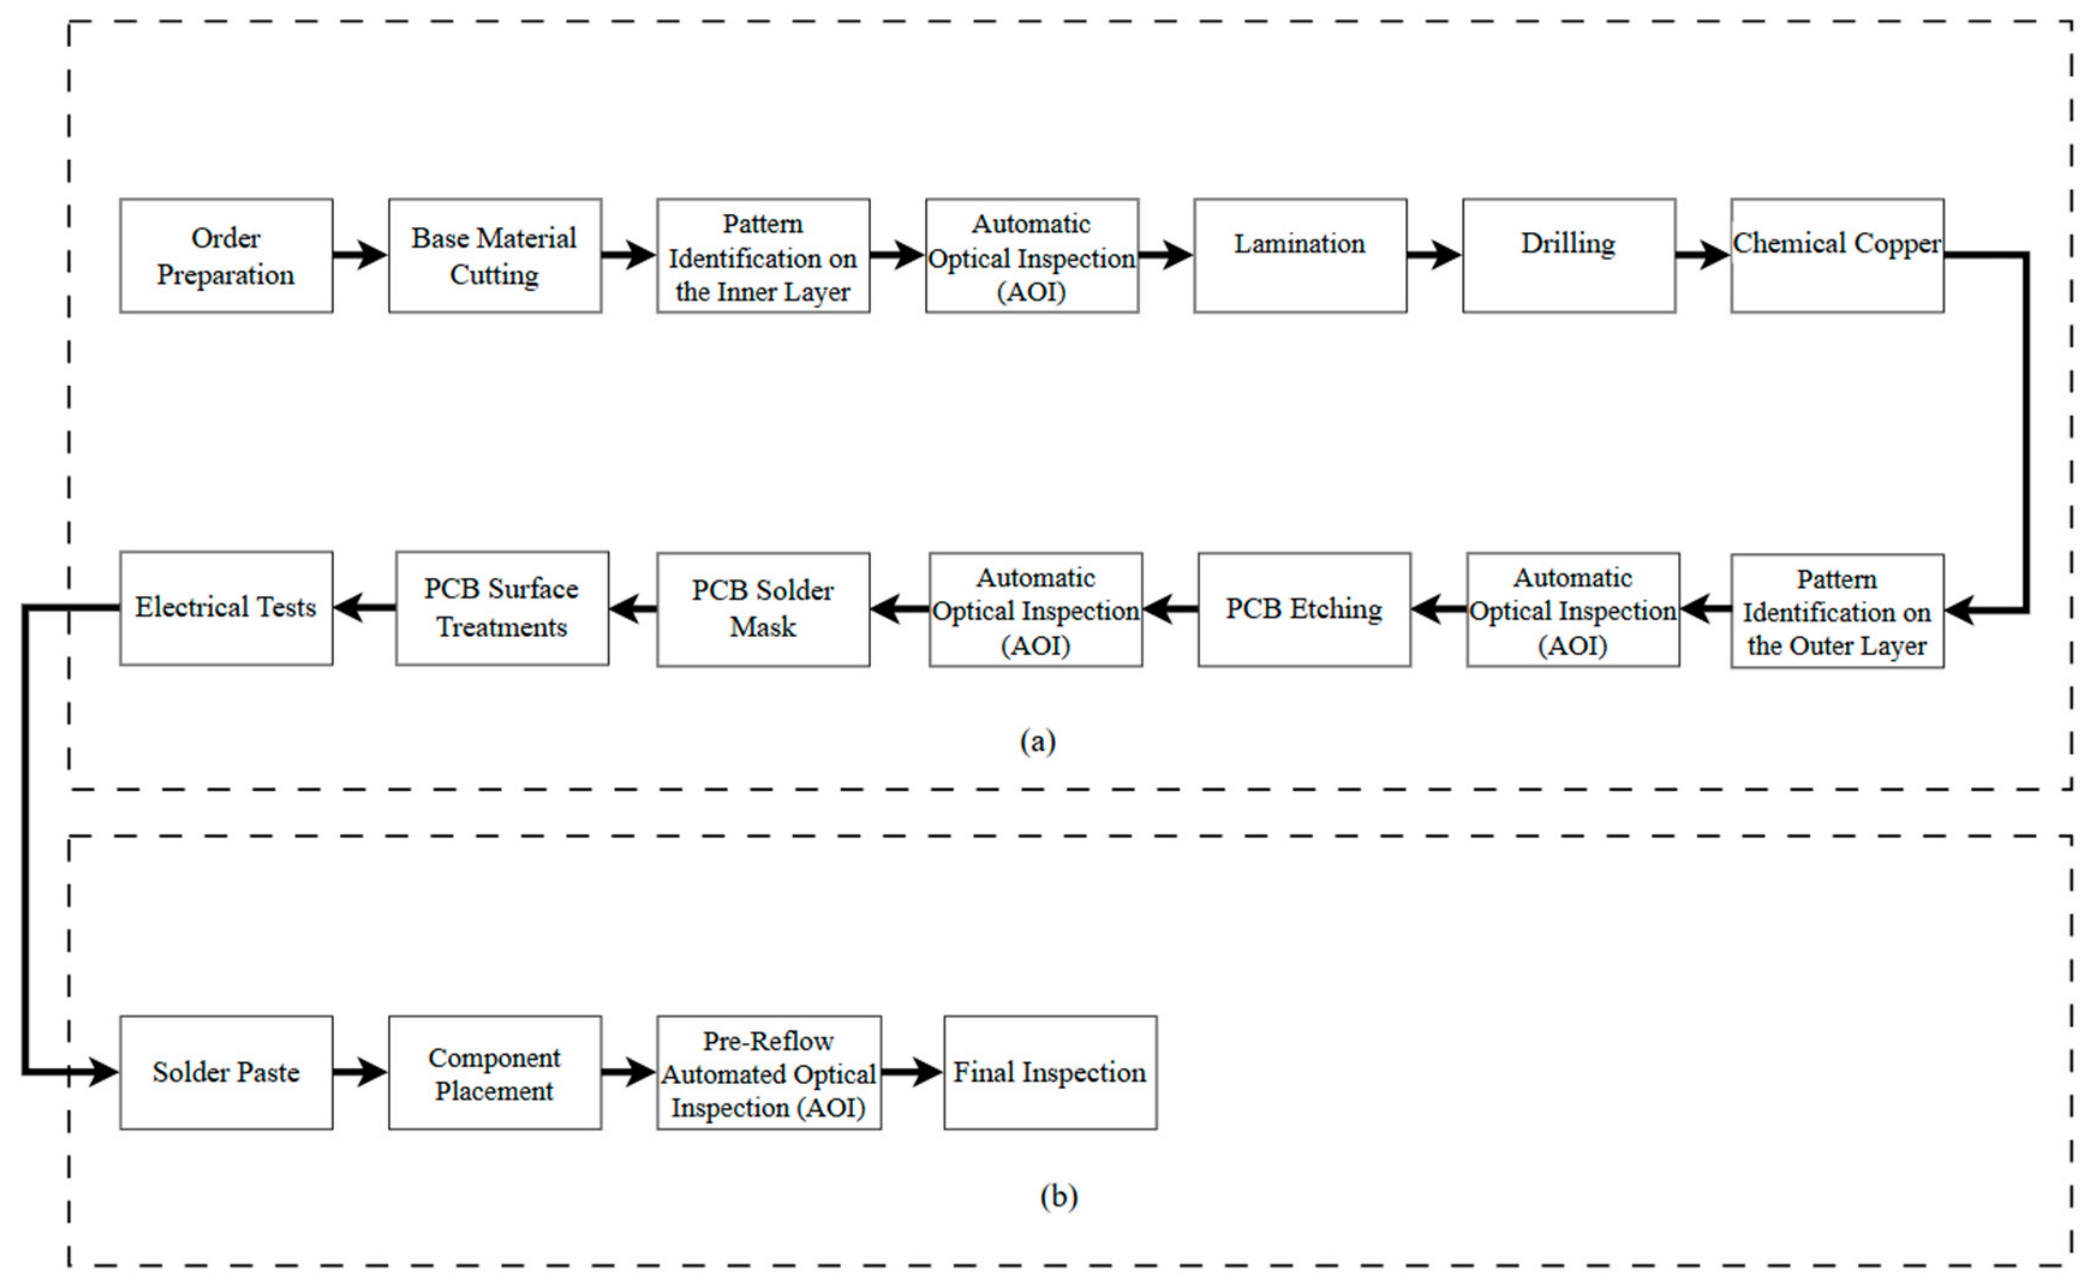
Figure 1 illustrates the PCB manufacturing process, with the board-fabrication stage providing the context for the defects investigated in the proposed study.
Figure 1.
Stages followed in PCB manufacturing process: (a) board fabrication; (b) assembly (mounting).
2. Materials and Methods
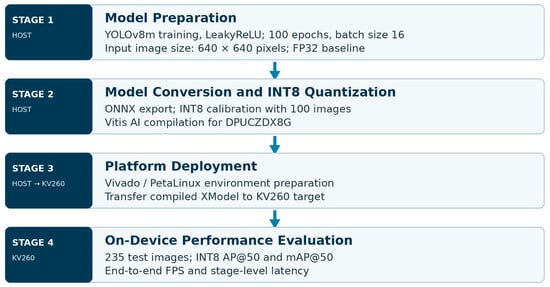
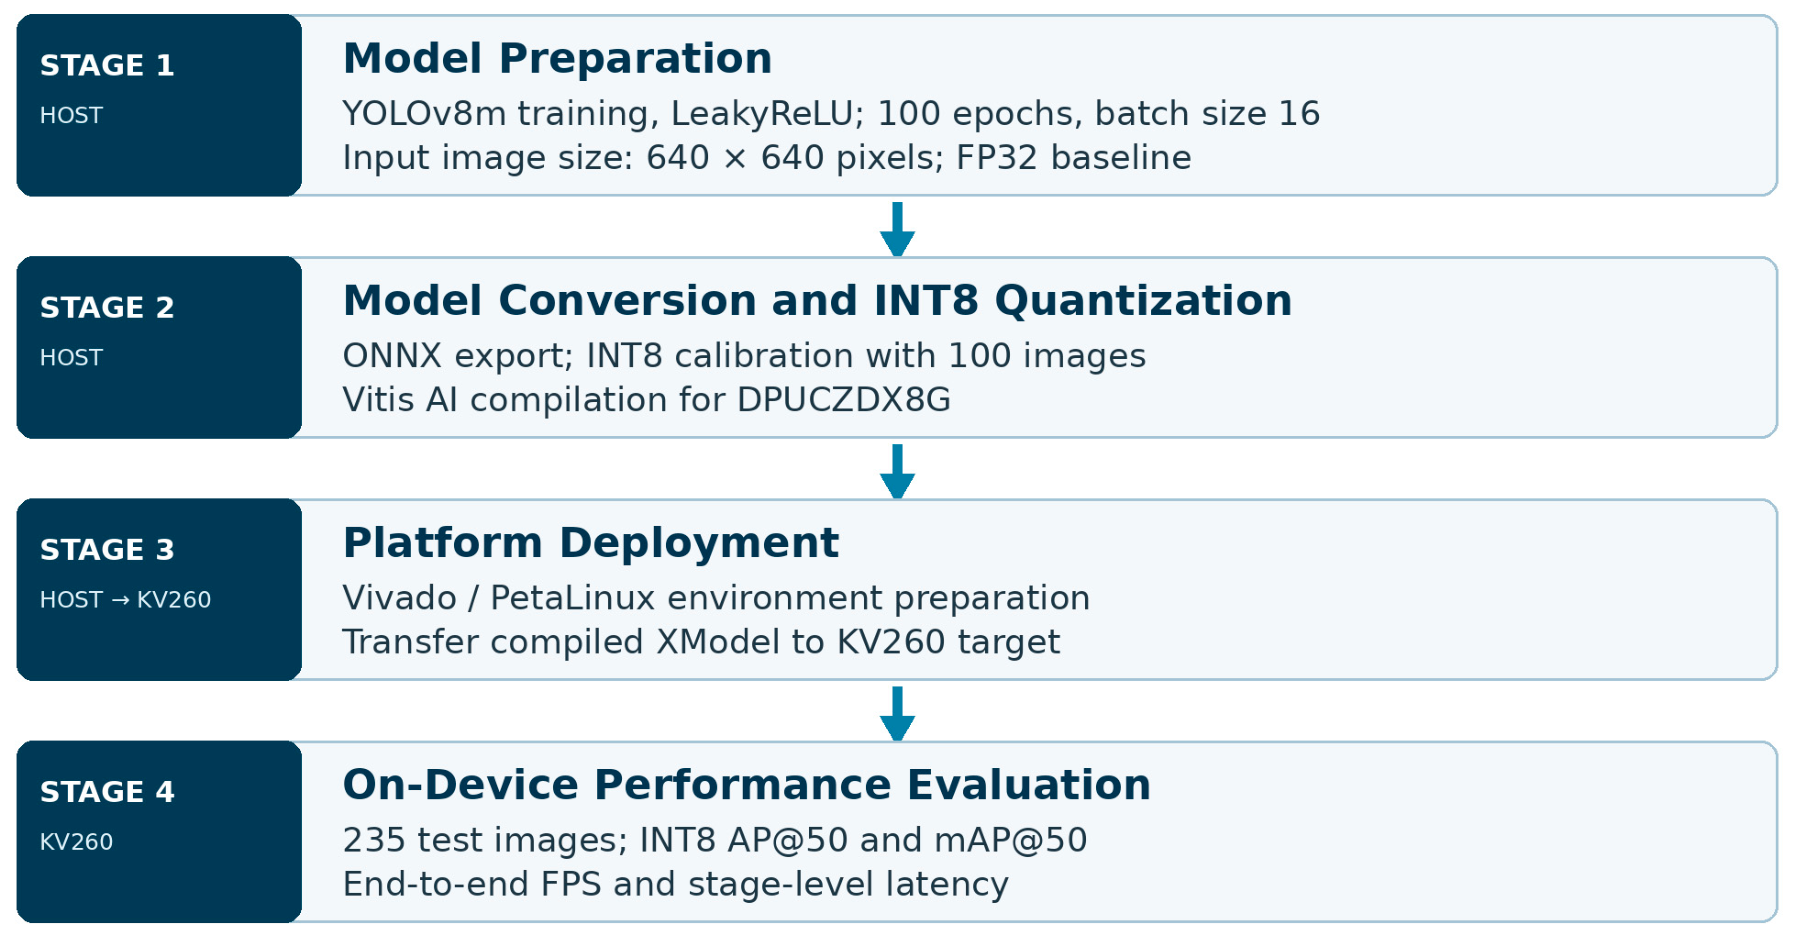
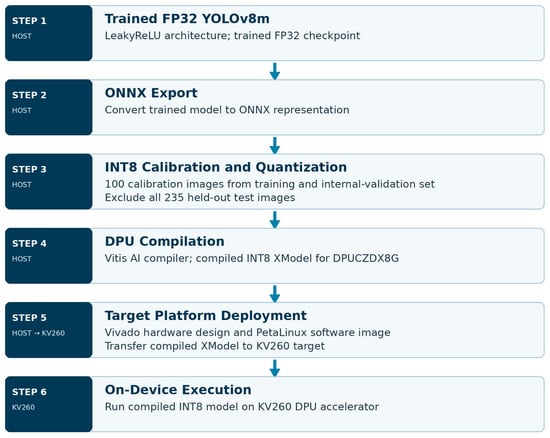
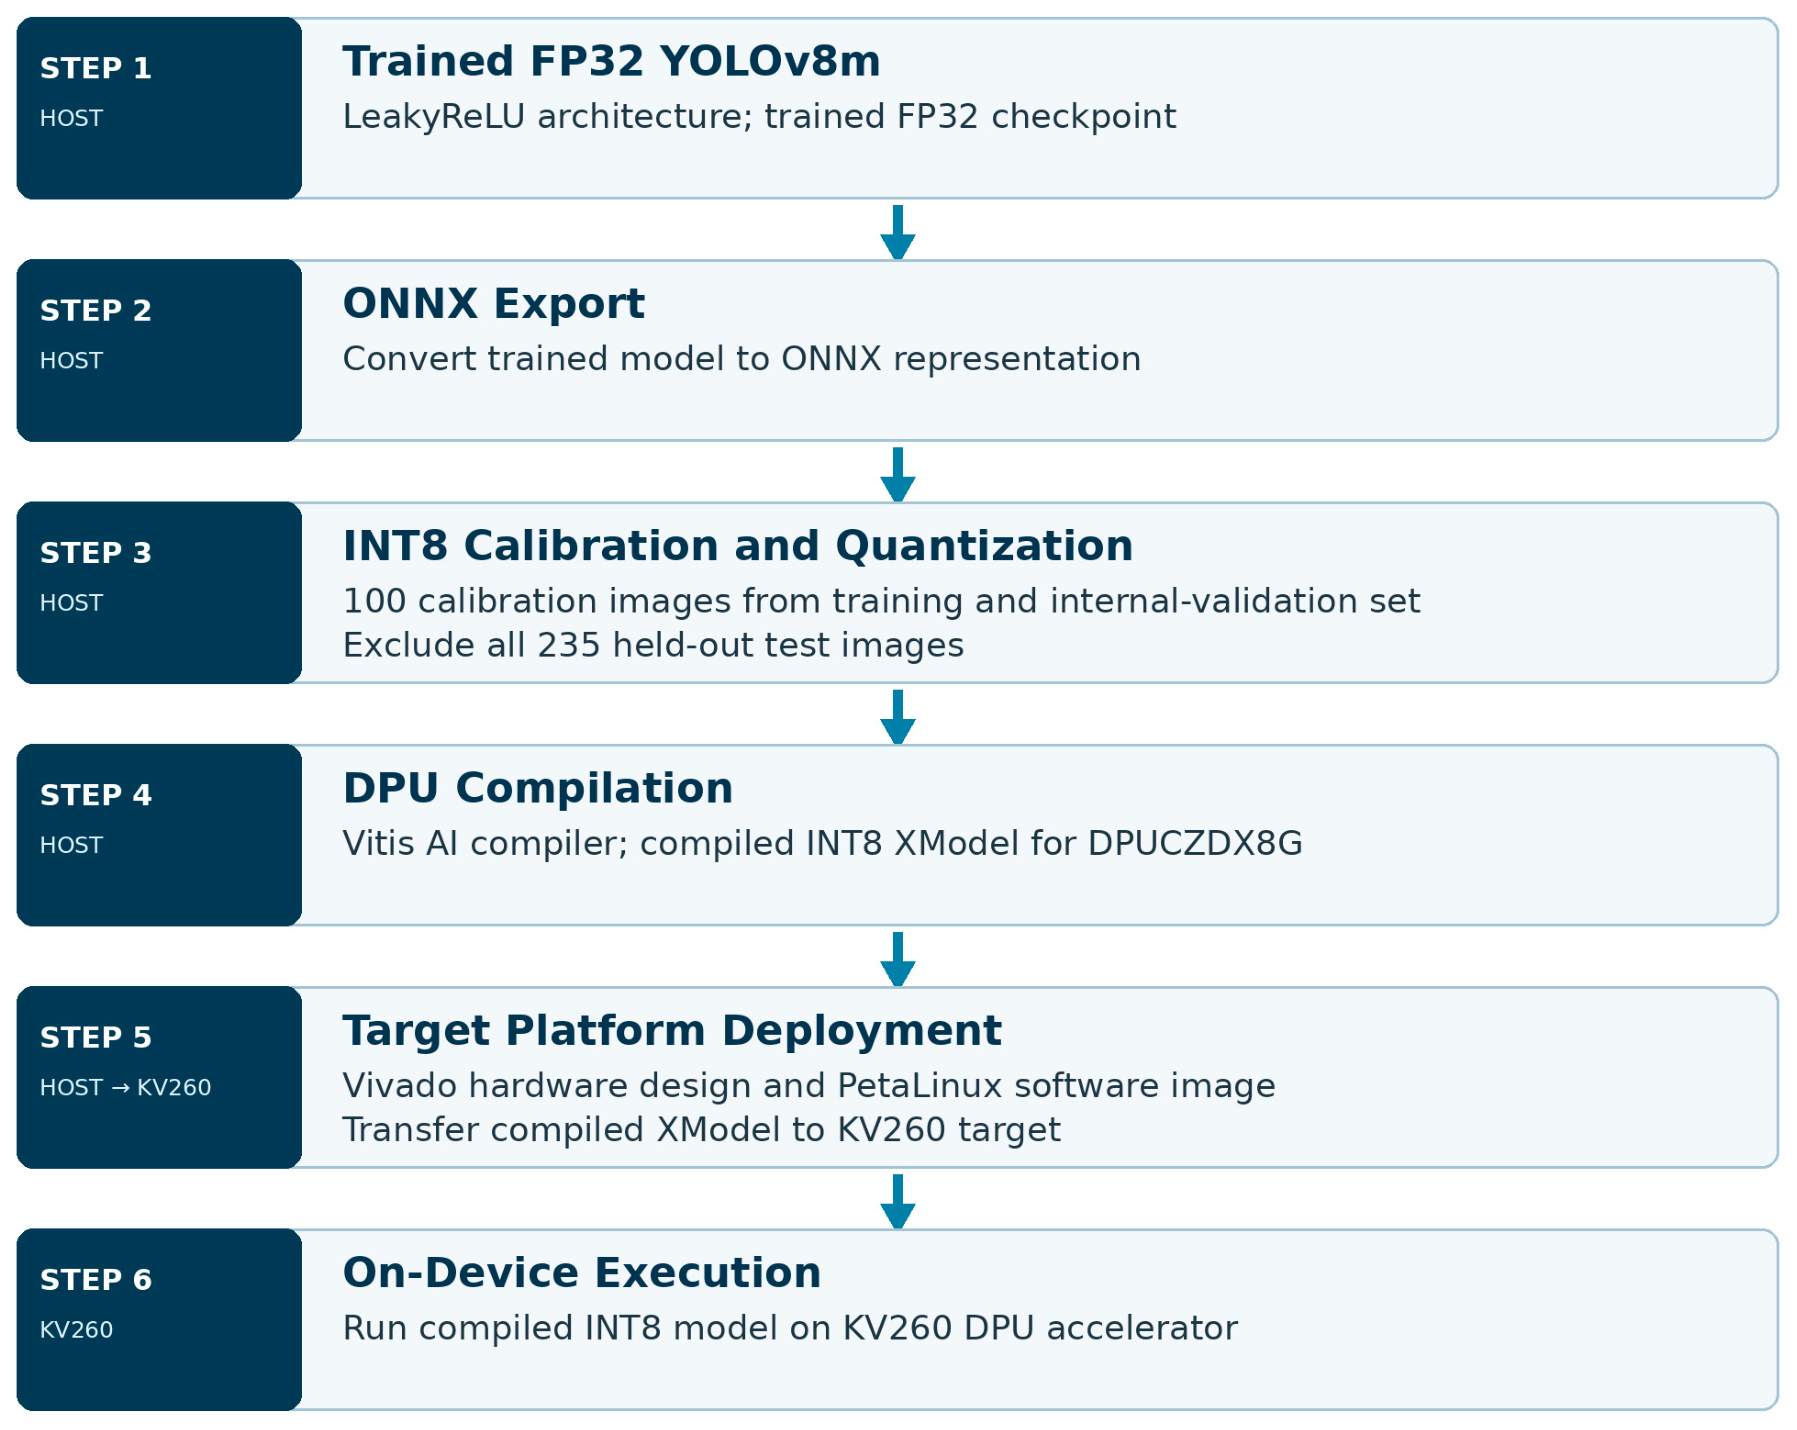
The experimental workflow comprises four main stages, as illustrated in Figure 2: (1) model preparation, (2) model conversion and INT8 quantization, (3) platform deployment, and (4) on-device performance evaluation. Stages 1 and 2 are performed on the host workstation. Stage 3 encompasses host-side hardware and software preparation and the transfer of the compiled model to the AMD Kria KV260 target. Stage 4 focuses on the evaluation of the deployed INT8 model on the KV260, with detection accuracy compared against the FP32 baseline obtained on the host workstation. Figure 2 summarizes the experimental sequence and distinguishes host-side processing from target-side execution.
Figure 2.
End-to-end experimental workflow showing host-side model preparation and INT8 quantization, platform deployment on the AMD Kria KV260, and on-device performance evaluation.
Stage 1—Model Preparation: The YOLOv8m model was trained in PyTorch (version 2.1.0) using the Ultralytics framework for 100 epochs with a batch size of 16 and an input image size of 640 × 640 pixels. The default SiLU activation functions were replaced with LeakyReLU activations before training to ensure compatibility with the DPUCZDX8G accelerator (Section 2.5). Internal validation was performed during model development. The trained FP32 model was also evaluated on the designated test set to establish a baseline for subsequent comparison with the deployed INT8 model.
Stage 2—Model Conversion and INT8 Quantization: The trained FP32 checkpoint was exported to the Open Neural Network Exchange (ONNX, version 1.15.0) format. Post-training INT8 quantization was performed using 100 representative calibration images from the training and internal-validation set. The quantized model was then compiled using the Vitis AI (version 3.0) toolchain to generate a DPU-targeted XModel for deployment on the KV260.
Stage 3—Platform Deployment: The target hardware design was prepared using Vivado on the host workstation, while the PetaLinux-based software environment was configured for the KV260. The compiled XModel was transferred from the host workstation to the KV260 target and deployed for execution on its integrated DPUCZDX8G accelerator. Because LeakyReLU had been incorporated before training, no additional activation-function substitution was required during deployment.
Stage 4—On-Device Performance Evaluation: The deployed INT8 model was evaluated using the same 235-image test set employed for the host-side FP32 baseline. Detection performance was assessed using class-wise average precision at an intersection-over-union (IoU) threshold of 0.5 (AP@50) and mean average precision across the six defect classes (mAP@50). End-to-end inference throughput was measured in frames per second (FPS), with the measurement methodology and related performance metrics detailed in Section 2.3. Preprocessing, DPU execution, and postprocessing latencies were also examined to characterize system-level performance.
2.1. Dataset and Data Partitioning
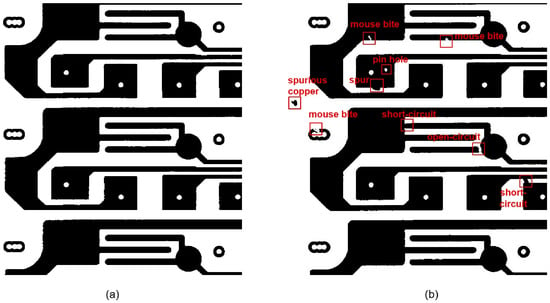
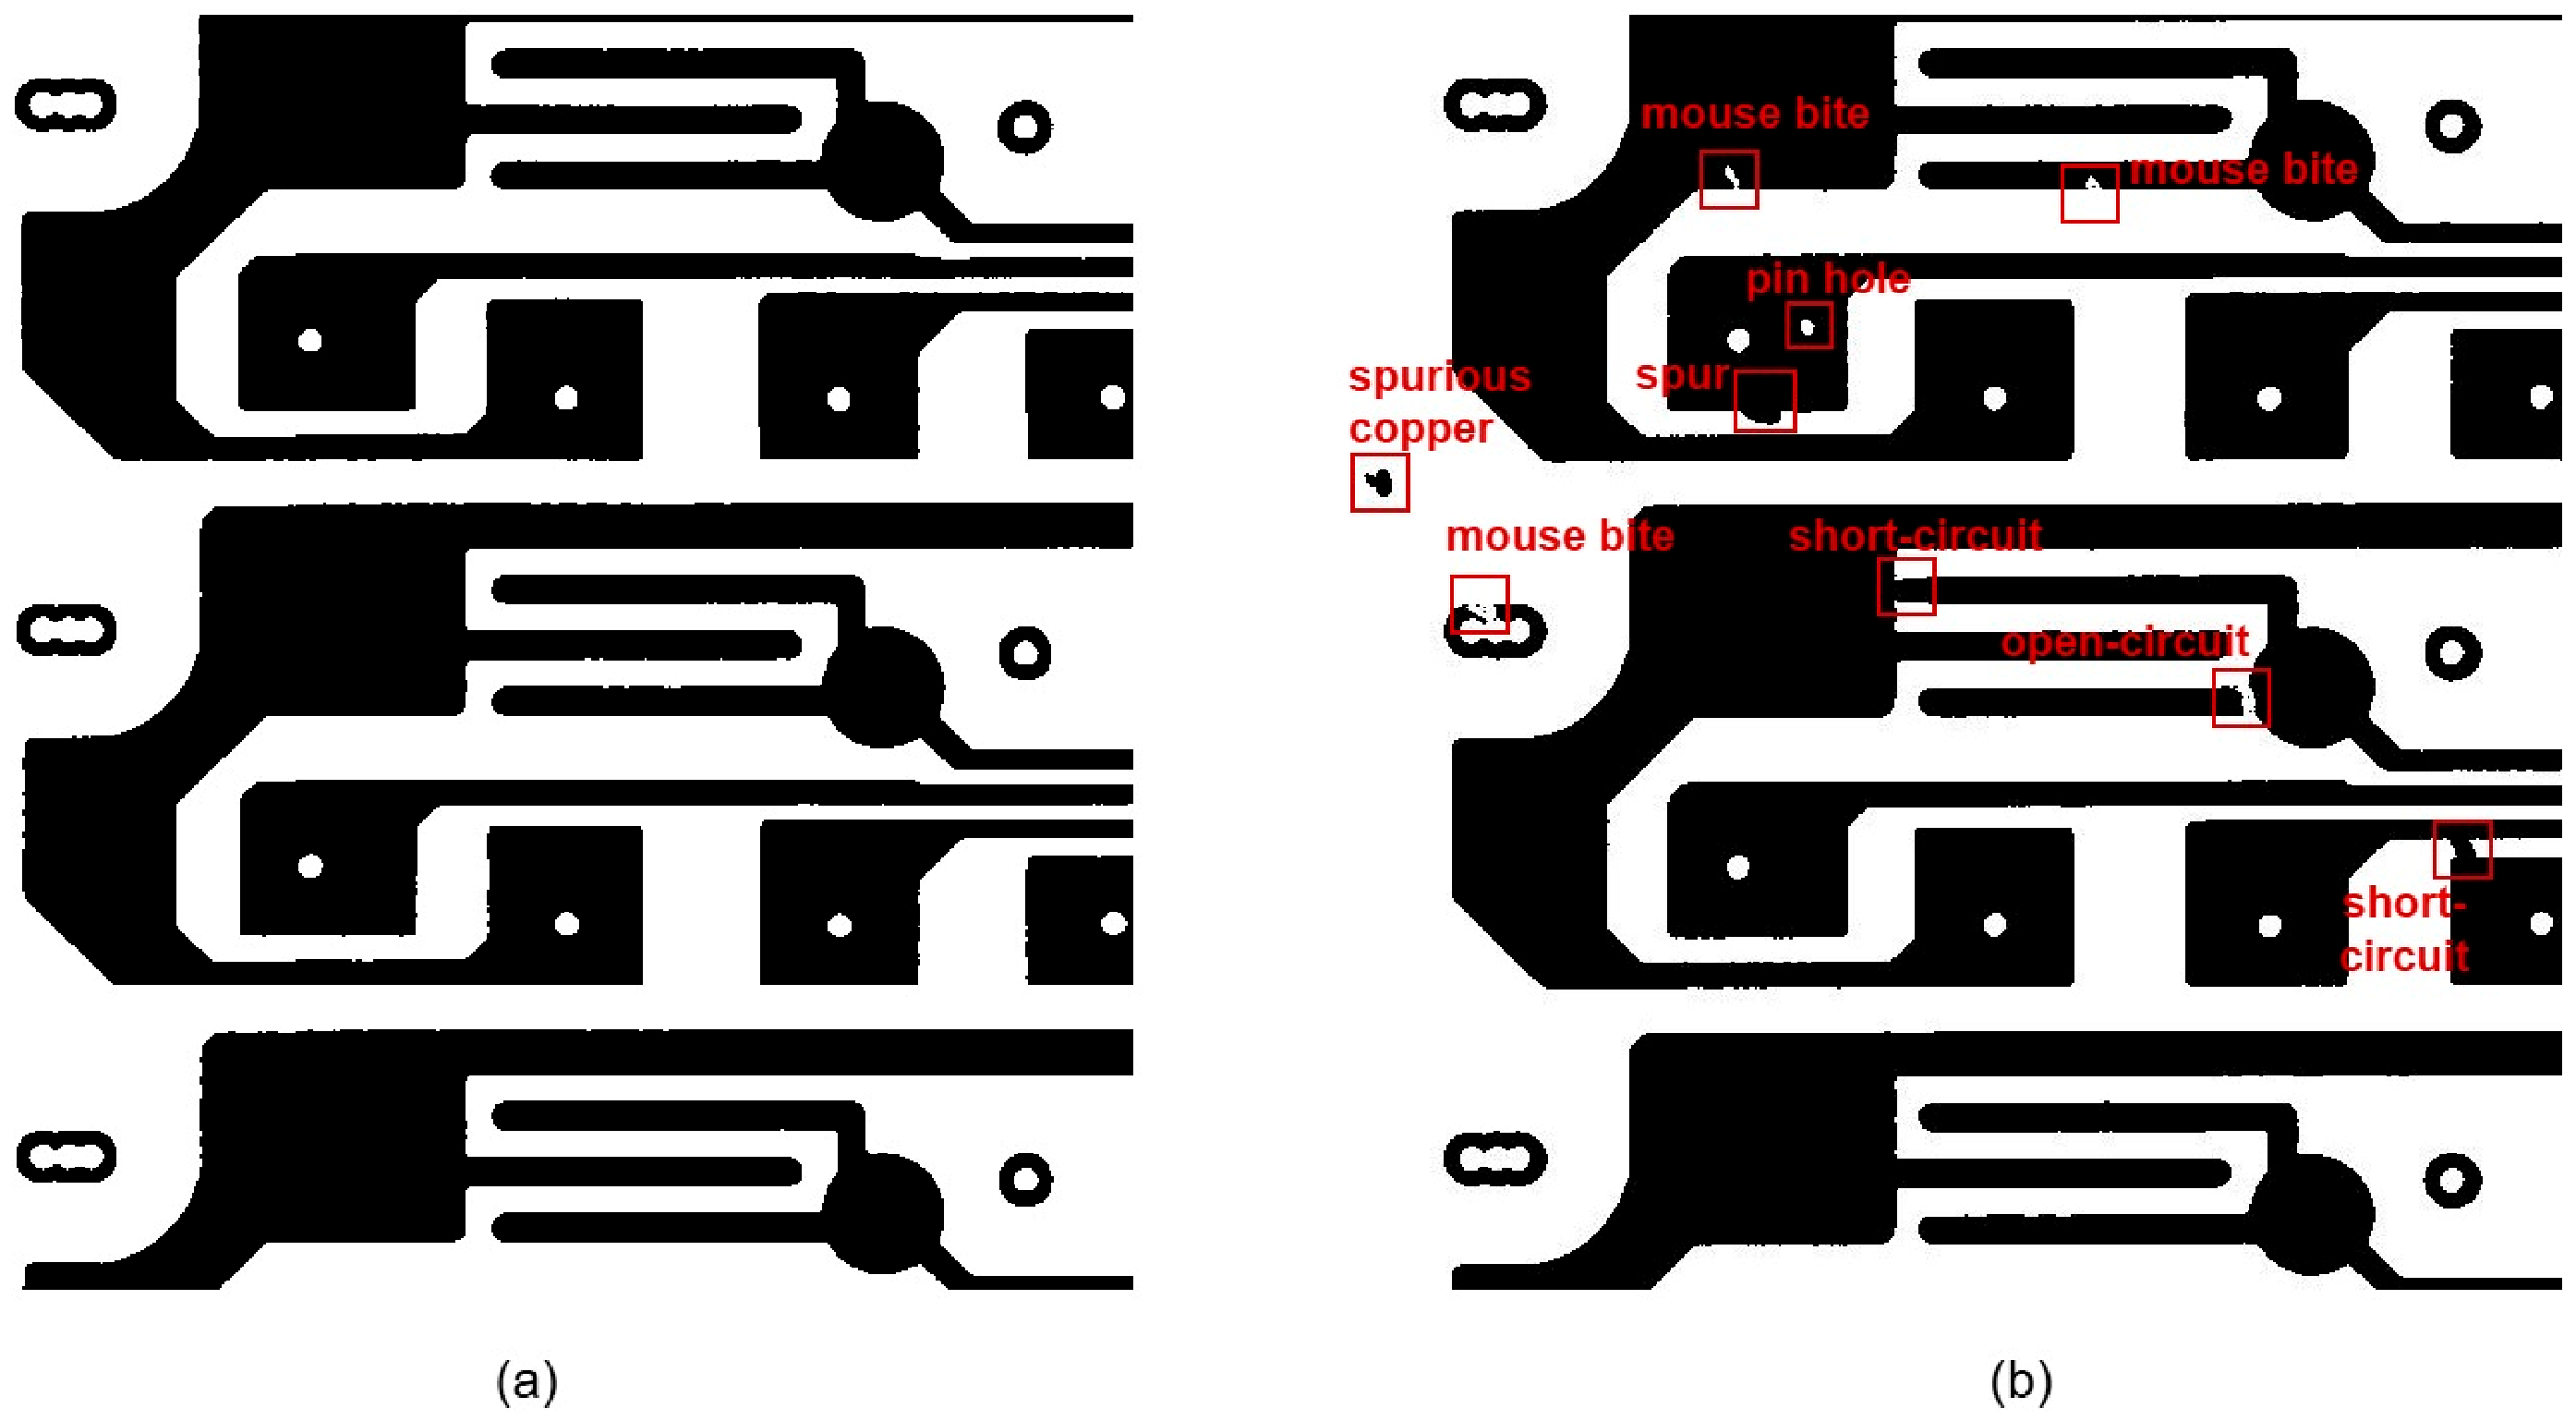
The publicly available DeepPCB source dataset comprises 1500 reference–defect image pairs from 11 PCB groups [24]. From this source dataset, 1194 defective images with an input image size of 640 × 640 pixels were selected to represent all 11 groups and six defect categories. Within the experimental subset, 959 images were assigned to the training and internal-validation set, while the remaining 235 images were reserved as a held-out test set. Figure 3 shows representative reference and defective PCB images.
Figure 3.
Representative example from the dataset: (a) reference PCB image; (b) defective PCB image with labeled defects.
The training and internal-validation set and test set contain distinct images, and all eleven annotated PCB groups are represented in both subsets. The same 235 test images and 1512 ground-truth defect instances were used for FP32 and INT8 performance assessment. Image similarity within each group was additionally examined by comparing 128 × 128 grayscale representations using mean absolute difference; among the 235 test images, three had a nearest training-set neighbor with a distance below 0.02.
Post-training INT8 calibration employed 100 images selected exclusively from the 959-image training and internal-validation set. Internal validation was performed within this set during model development. The separate 235-image test set was reserved for final FP32 and INT8 performance assessment and was excluded from parameter training, checkpoint selection, and calibration.
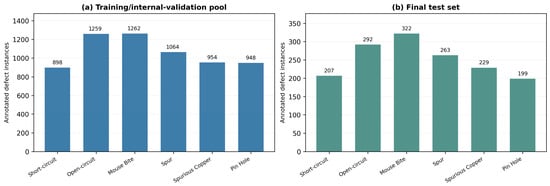
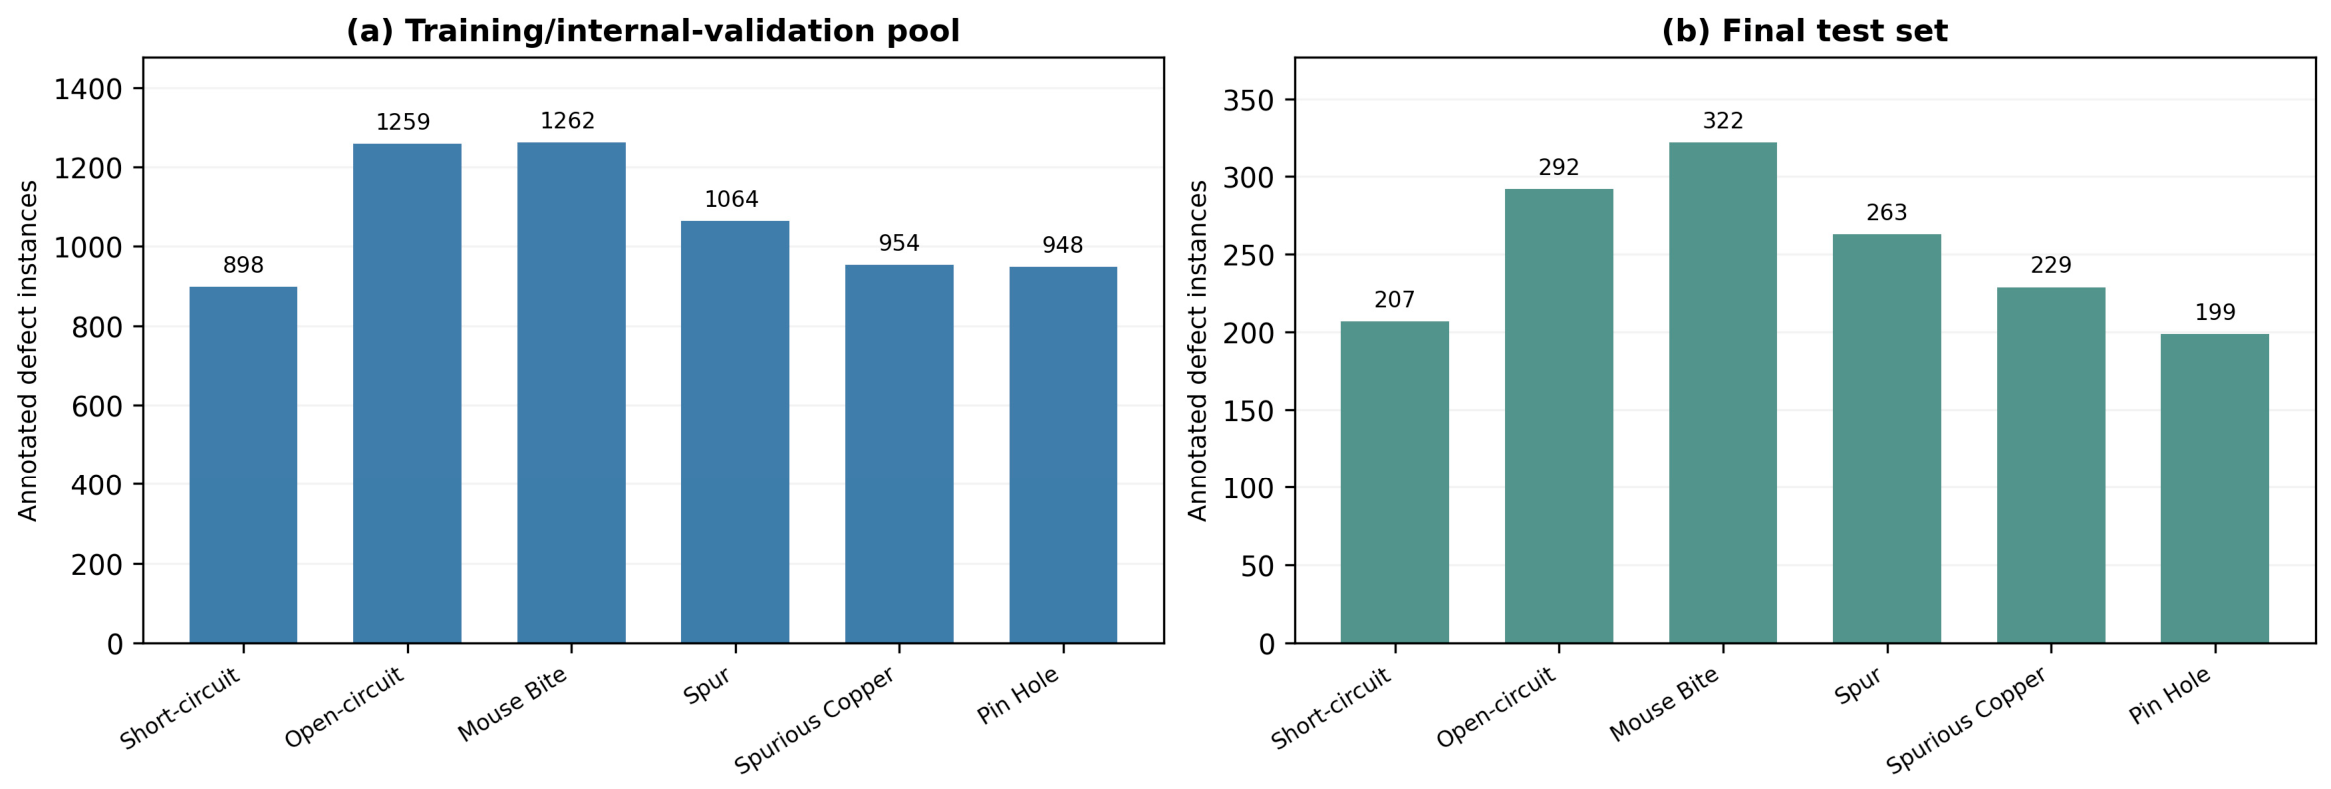
Across the experimental subset of 1194 images, a total of 7897 defect instances were annotated. Of these, 6385 instances belong to the training and internal-validation set (959 images), whereas the remaining 1512 instances belong to the test set (235 images). Figure 4 presents the class-wise distributions separately for the training and internal-validation set (Figure 4a) and the test set (Figure 4b). In the test set, the annotated defect instances comprise 207 Short-circuit, 292 Open-circuit, 322 Mouse Bite, 263 Spur, 229 Spurious Copper, and 199 Pin Hole instances.
Figure 4.
Class-wise distribution of annotated defect instances: (a) 6385 instances from 959 training and internal-validation images; (b) 1512 instances from 235 test images.
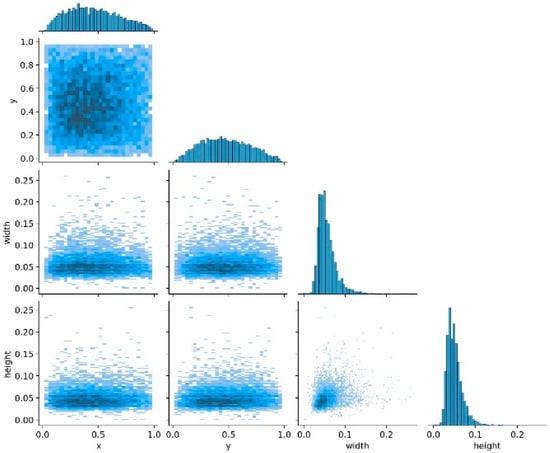
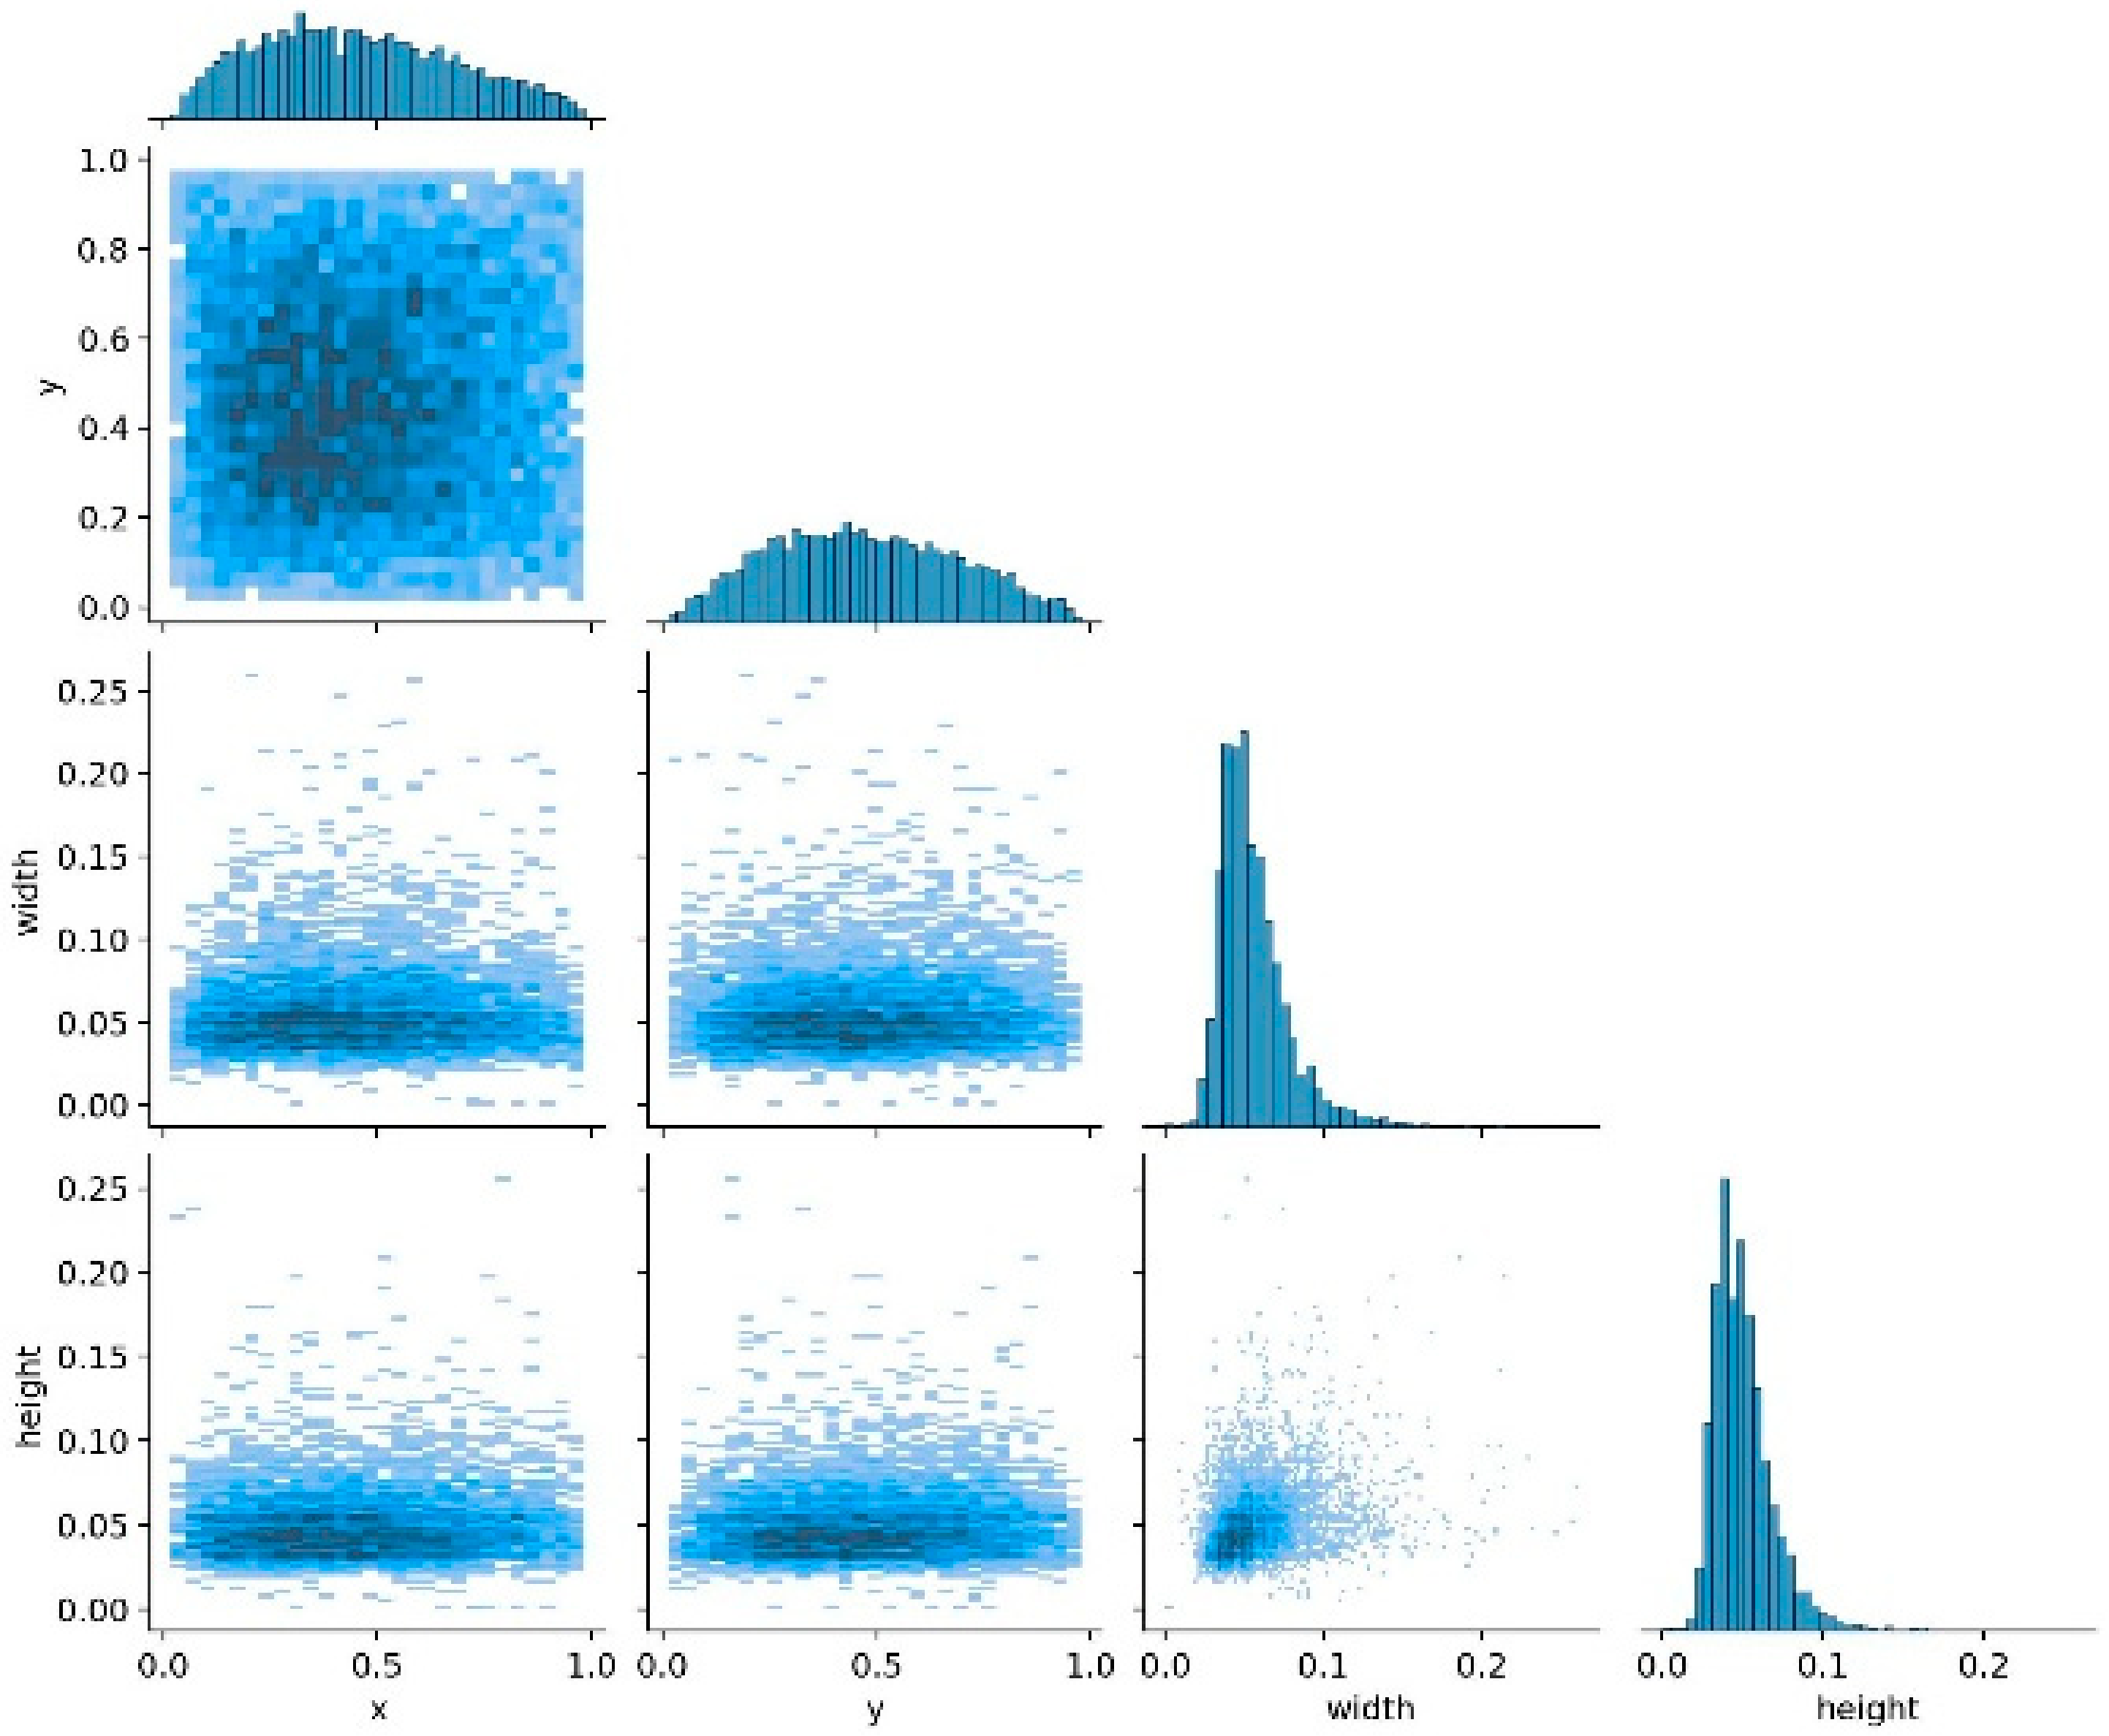
Figure 5 summarizes the distributions of normalized bounding-box parameters used to annotate the defect instances. These parameters represent the bounding-box center coordinates, widths, and heights, normalized relative to the image dimensions. The defect centers are distributed across the image area, while most bounding-box widths and heights fall approximately within the 0.05–0.15 range. This indicates that a substantial proportion of the defects occupy relatively small image regions, emphasizing the importance of preserving spatial detail during detection.
Figure 5.
Correlogram of the annotated bounding boxes: pairwise distributions of the normalized box-center coordinates (x, y) and box dimensions (width, height), expressed relative to the image size.
2.2. Model Selection
YOLOv8 is released in five scales (n, s, m, l, and x) that share the same architectural design but differ in depth and width multipliers [25]. Table 2 lists the published complexity and accuracy of these scales. From the n to the m scale, the parameter count increases approximately eightfold and the computational cost approximately ninefold, accompanied by a gain of 12.9 percentage points in Common Objects in Context (COCO) mAP@50–95; from the m to the x scale, the computational cost increases by a further factor of approximately 3.3 for a gain of only 3.7 percentage points. YOLOv8m therefore lies close to the point beyond which additional complexity yields diminishing accuracy returns, while its parameter count remains compatible with INT8 storage in the 4 GB DDR4 memory of the K26 system-on-module of the KV260.
Table 2.
Published complexity and COCO accuracy of the YOLOv8 scales at 640 × 640 pixels input [25].
This consideration is relevant to the present dataset because a substantial proportion of the defects occupy small image regions (Figure 5), for which reduced feature capacity may limit discrimination. Recent PCB benchmarking further shows that increasing YOLO model generation or scale does not by itself guarantee higher detection accuracy across datasets and training settings [16,17]. YOLOv8m is therefore treated as a representative medium-scale operating point, and its deployment behavior is analyzed in detail.
2.3. Evaluation Criteria
Detection performance was assessed using precision, recall, F1-score, and mAP@50. Precision and recall quantify false-positive and false-negative behavior, respectively, while the F1-score summarizes their balance [26]. Because the task is object detection, mAP@50 is used as the primary performance metric. Recall, precision, and F1-score are defined in Equations (1)–(3), and mAP@50 is defined in Equation (4).
At an IoU threshold of 0.5, detection performance was evaluated using class-wise average precision (AP@50) and its mean across the six defect classes (mAP@50). The FP32 model achieved 93.5% mAP@50 using the Ultralytics evaluation procedure [25]. For the additional object-scale analysis, the same FP32 model was evaluated on the same 235-image test set using COCOeval [27], yielding 93.0% AP@50. The small difference between these results reflects differences in the evaluation procedures rather than a change in model precision. Both values refer to the FP32 model; the effect of INT8 quantization is evaluated separately.
Inference efficiency was expressed as frames per second (FPS). As defined in Equation (5), FPS was calculated from the number of processed images divided by the total elapsed processing time, including preprocessing, network inference, and postprocessing.
where TP, FP, and FN denote true positives, false positives, and false negatives; n is the number of defect classes; Pi(R) is the precision–recall curve of class i; and t1, t2, and t3 denote the cumulative preprocessing, network inference, and postprocessing times over all processed images.
Stage-level profiling was organized into preprocessing, DPU inference, and postprocessing (including non-maximum suppression, NMS). The measured stage times were 333.21, 206.80, and 608.99 ms per image, respectively. Their sum is 1149.00 ms, corresponding to approximately 0.87 frames/s for the sequential end-to-end pipeline. Data movement is encompassed by the reported timing boundary rather than presented as a separately measured stage.
To examine the sensitivity of PCB defect detection to image acquisition conditions, an additional FP32 robustness evaluation was performed on the same 235-image test set without retraining. For each test image, synthetic zero-mean Gaussian noise with standard deviations of 10 and 20 (on the 0–255 pixel-intensity scale) was applied. Intensity reduction was simulated by multiplying pixel intensities by 0.60 (reduced illumination) or by applying a left-to-right intensity gradient with a multiplicative factor ranging from 0.45 to 1.00 (spatially non-uniform illumination). Values were clipped to the 0–255 range; the geometric content and ground-truth bounding boxes remained unchanged. Because the DeepPCB images are binarized after alignment [24], the two intensity-scaling conditions primarily rescale bright (non-zero) pixels; they probe sensitivity to controlled pixel-intensity changes rather than realistic illumination effects such as reflections or shadows. The perturbed test images were evaluated using the Ultralytics FP32 validation procedure at an input size of 640 × 640 pixels, with precision, recall, mAP@50, and mAP@50–95 reported. Gaussian noise was sampled independently for each pixel and color channel using a fixed per-image random seed (base seed 42), and the perturbed images were stored in lossless PNG format. Evaluation used Ultralytics 8.4.192 with a confidence threshold of 0.001, an NMS IoU threshold of 0.7, rectangular batching, and a batch size of 8. These are software-based tests of synthetic perturbations; they are neither images physically acquired under controlled illumination nor measurements of the INT8 model on the KV260.
2.4. Model Architecture
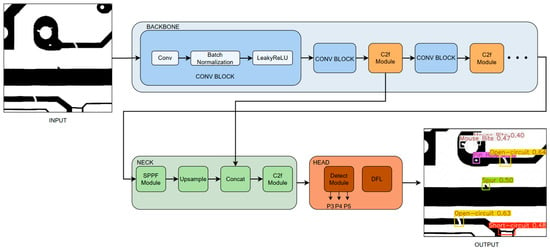
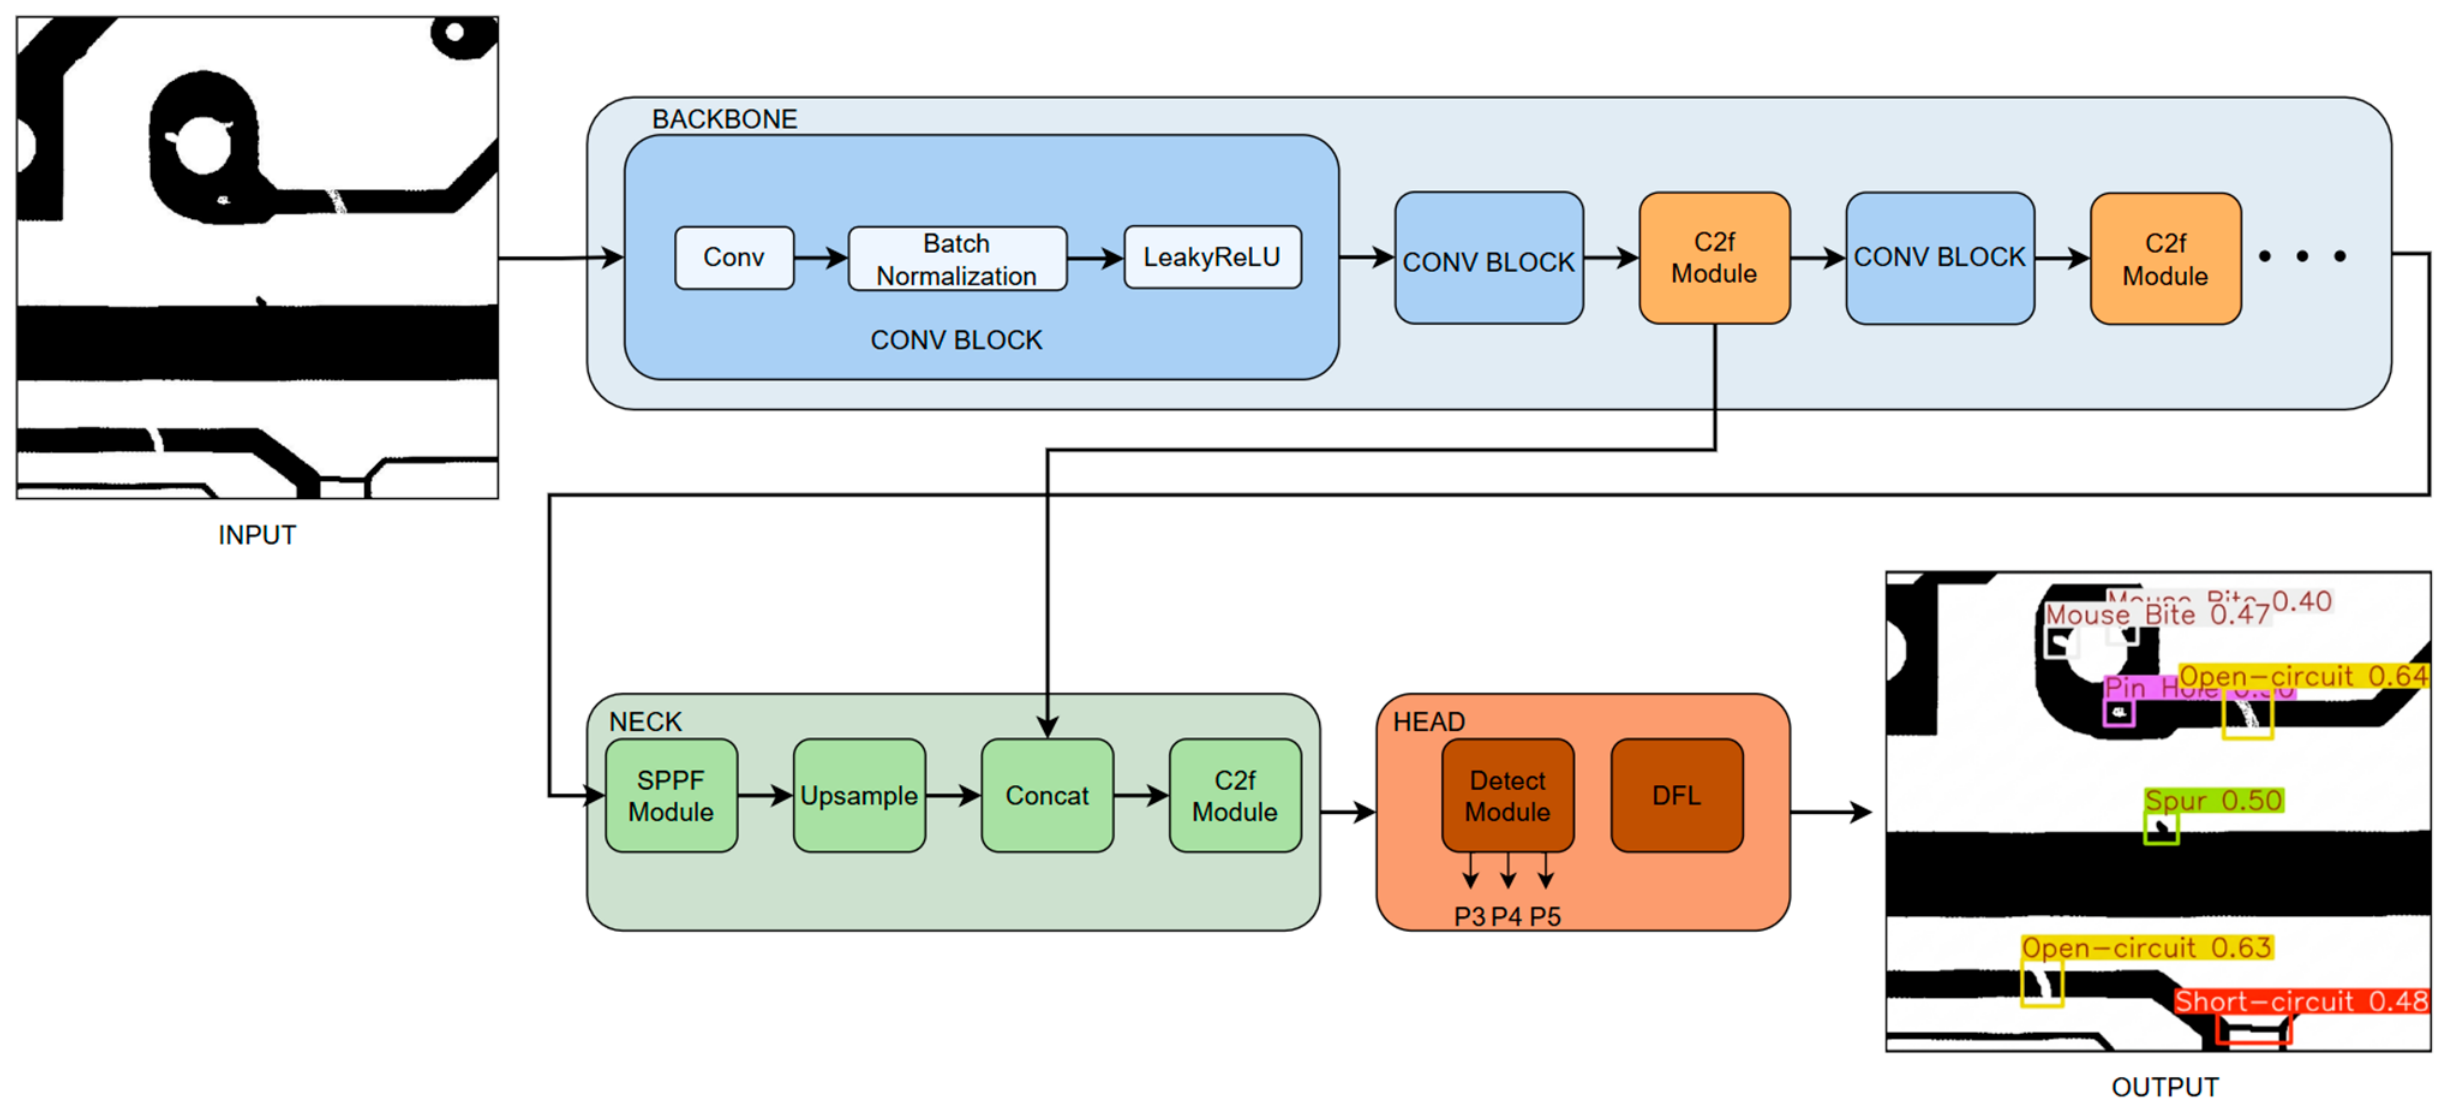
The YOLOv8m architecture used for deployment on the AMD Kria KV260 is illustrated in Figure 6. The network employs a cross-stage partial (CSP)-based feature-extraction backbone with C2f modules, multi-scale feature fusion through feature pyramid network/path aggregation network (FPN/PAN) structures, and an anchor-free detection head with separate classification and bounding-box regression branches [3,28,29]. These characteristics support multi-scale detection but also introduce computational and memory demands relevant to embedded deployment.
Figure 6.
The YOLOv8m architecture used for deployment in the proposed study.
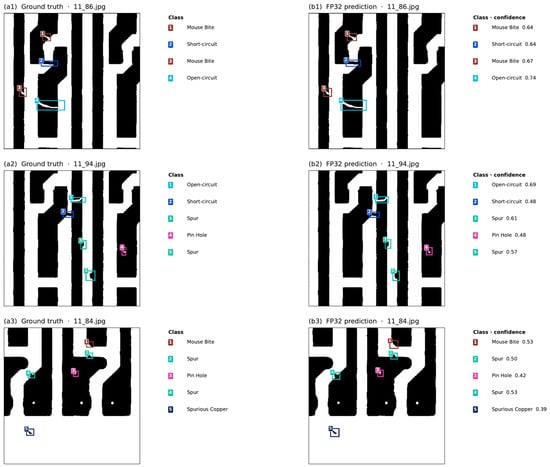
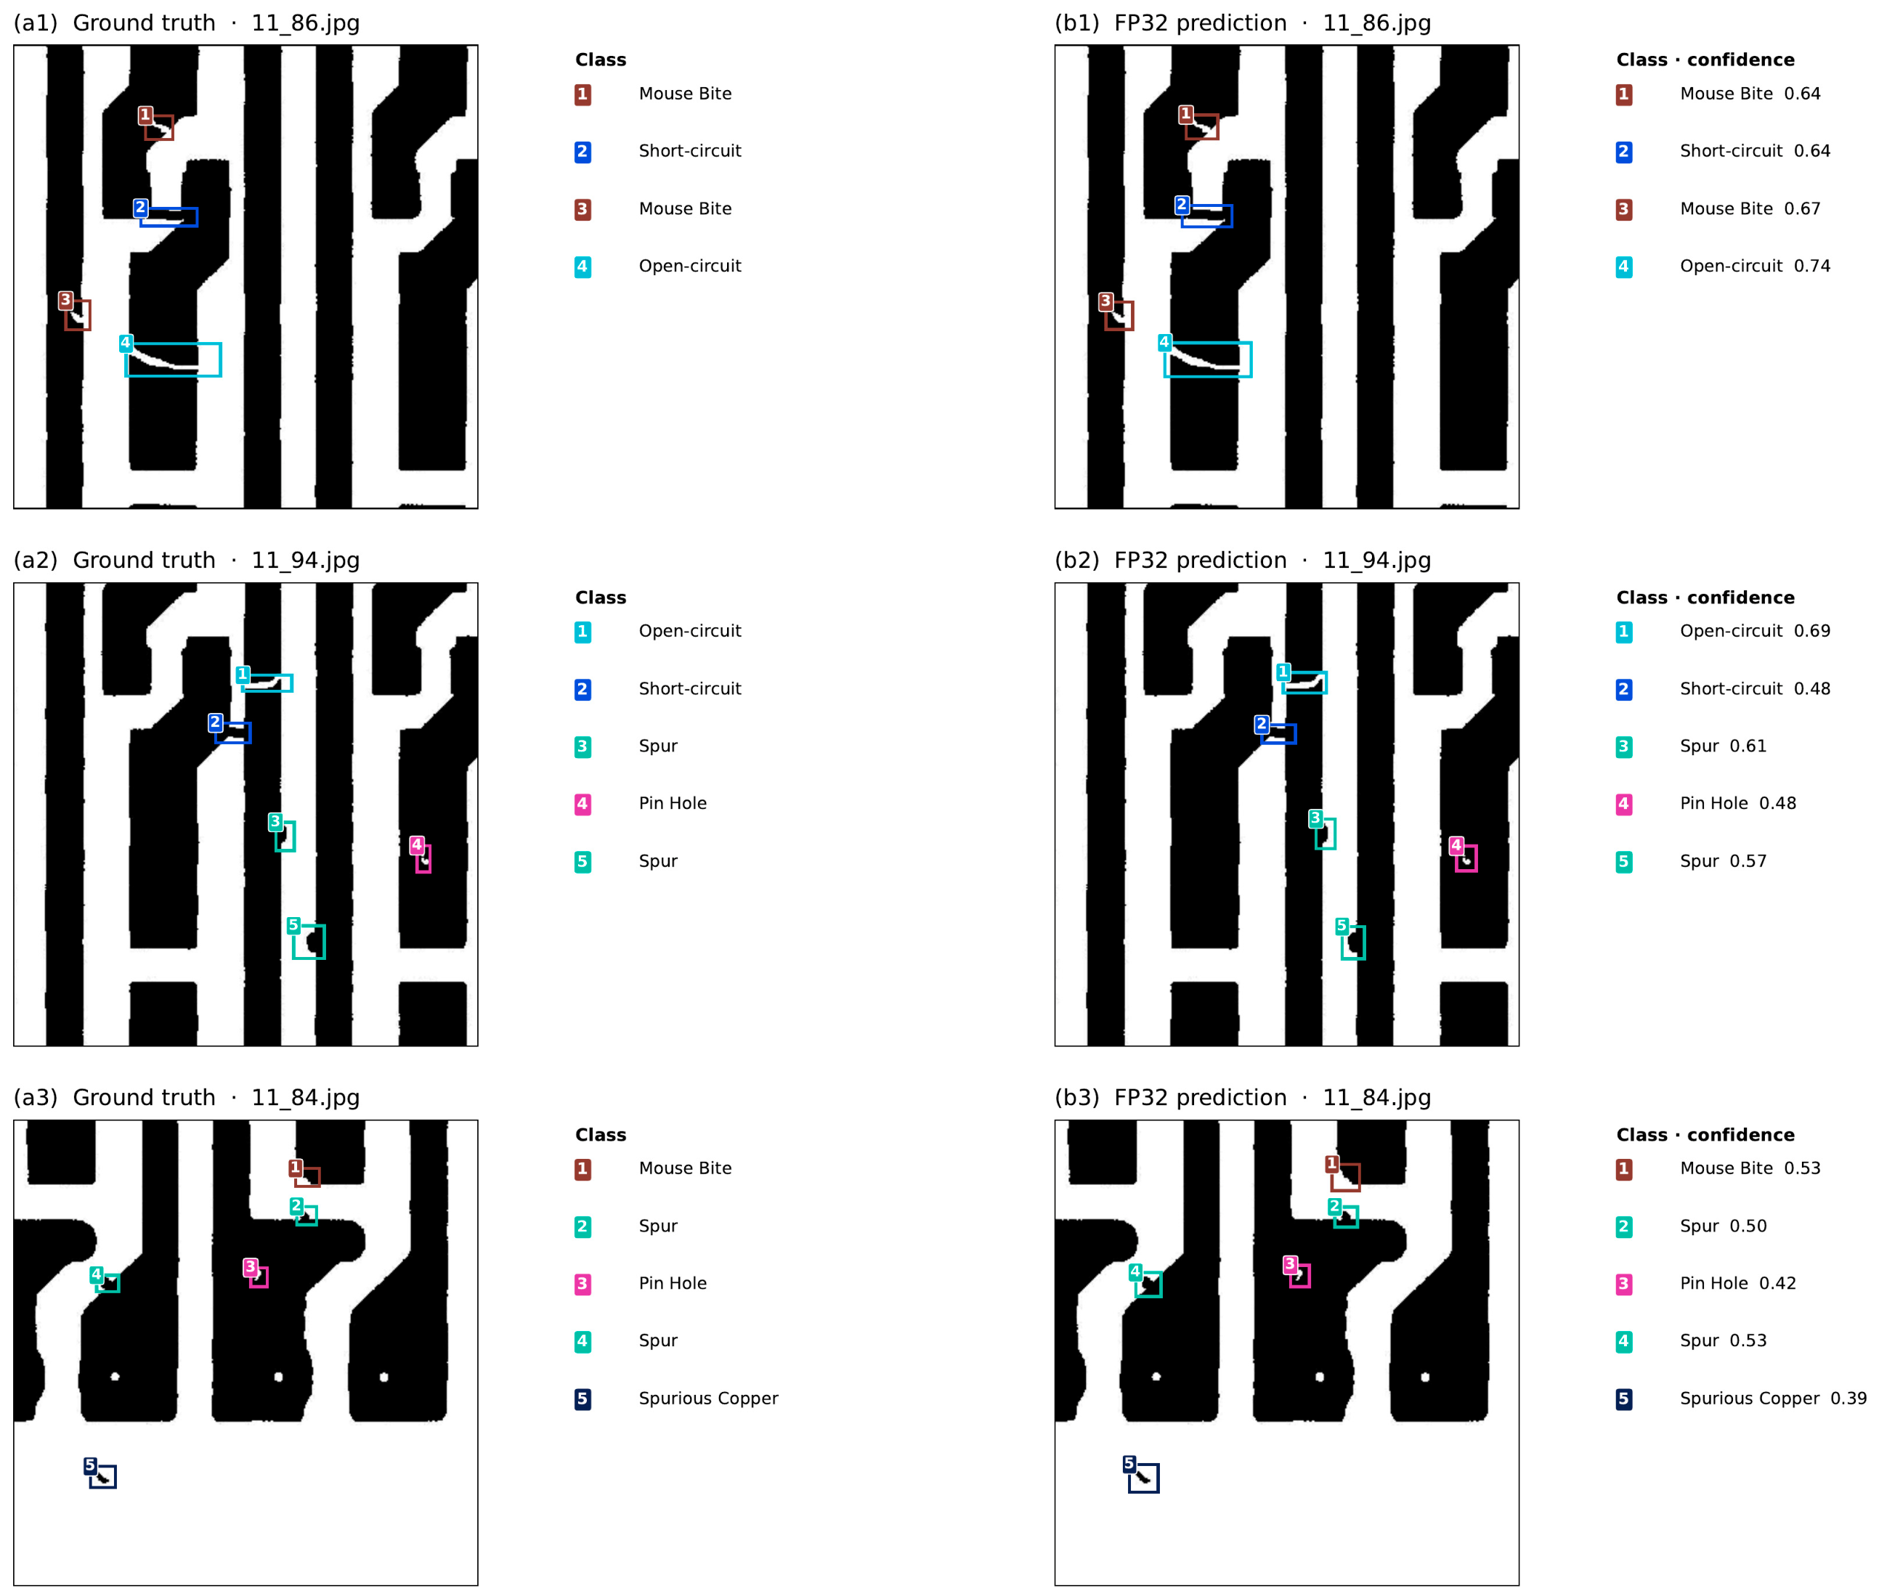
Figure 7 illustrates representative PCB images with annotated ground-truth defects and paired detection overlays, providing qualitative examples of defect localization and class labeling.
Figure 7.
Representative PCB defect detection examples obtained with the FP32 YOLOv8m model: (a1–a3) ground-truth annotations and (b1–b3) the corresponding model predictions.
2.5. Embedded System Deployment
The AMD Kria KV260 Vision AI Starter Kit was selected as the embedded target because it integrates a Zynq UltraScale+ MPSoC (Advanced Micro Devices, Inc., Santa Clara, CA, USA)with programmable logic and supports DPU-based deep-learning acceleration [30,31,32]. Model preparation and compilation were performed on a host system, after which the compiled network was transferred to the target platform for embedded inference.
The trained PyTorch network was converted to ONNX and quantized to INT8 using the Vitis AI toolchain. For post-training calibration, 100 images were selected from the training and internal-validation set, ensuring that none of the 235 test images were used for calibration.
The quantized network was compiled for the target DPU architecture [33]. INT8 weights nominally require one byte per parameter, compared with four bytes for FP32, corresponding to approximately fourfold lower nominal weight storage at an unchanged parameter count. Figure 8 illustrates the detailed model conversion, INT8 quantization, DPU compilation, and deployment procedure for the AMD Kria KV260 platform. The hardware platform and PetaLinux image were generated using Vivado 2023.1 and PetaLinux 2023.1, respectively. The DPU configuration follows the DPUCZDX8G v4.1 intellectual property (IP) core [34,35].
Figure 8.
Model conversion, INT8 quantization, DPU compilation, and deployment procedure for YOLOv8m on the AMD Kria KV260 platform.
During compilation, the Vitis AI compiler maps supported operators of the quantized graph to the DPU, while unsupported or non-offloaded operations may be executed by the Arm Cortex-A53 application processing unit (APU) of the Zynq UltraScale+ MPSoC [34,35]. For YOLOv8, potential sources of host-side processing include operations associated with the anchor-free detection pipeline, tensor reshaping, image preprocessing, and NMS postprocessing [28,34,35]. The exact partitioning depends on the graph produced by model conversion and compiler mapping. Accordingly, the end-to-end throughput reported in Section 3 reflects the complete deployed pipeline rather than DPU execution alone.
Because the network was trained with LeakyReLU activations (Stage 1 in Section 2), no activation substitution was required at deployment. The deployment analysis distinguishes DPU execution from the host-side preprocessing and postprocessing stages, and the measured stage-level breakdown (Section 3.3) is used to interpret end-to-end latency at the resolution of these three stages.
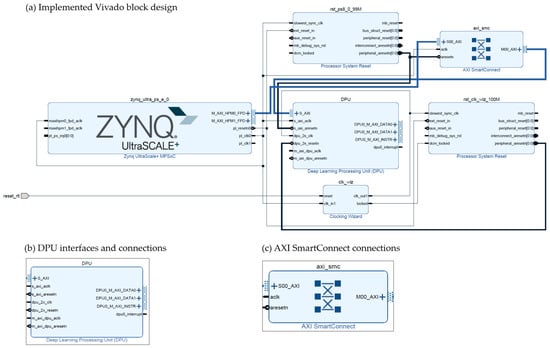
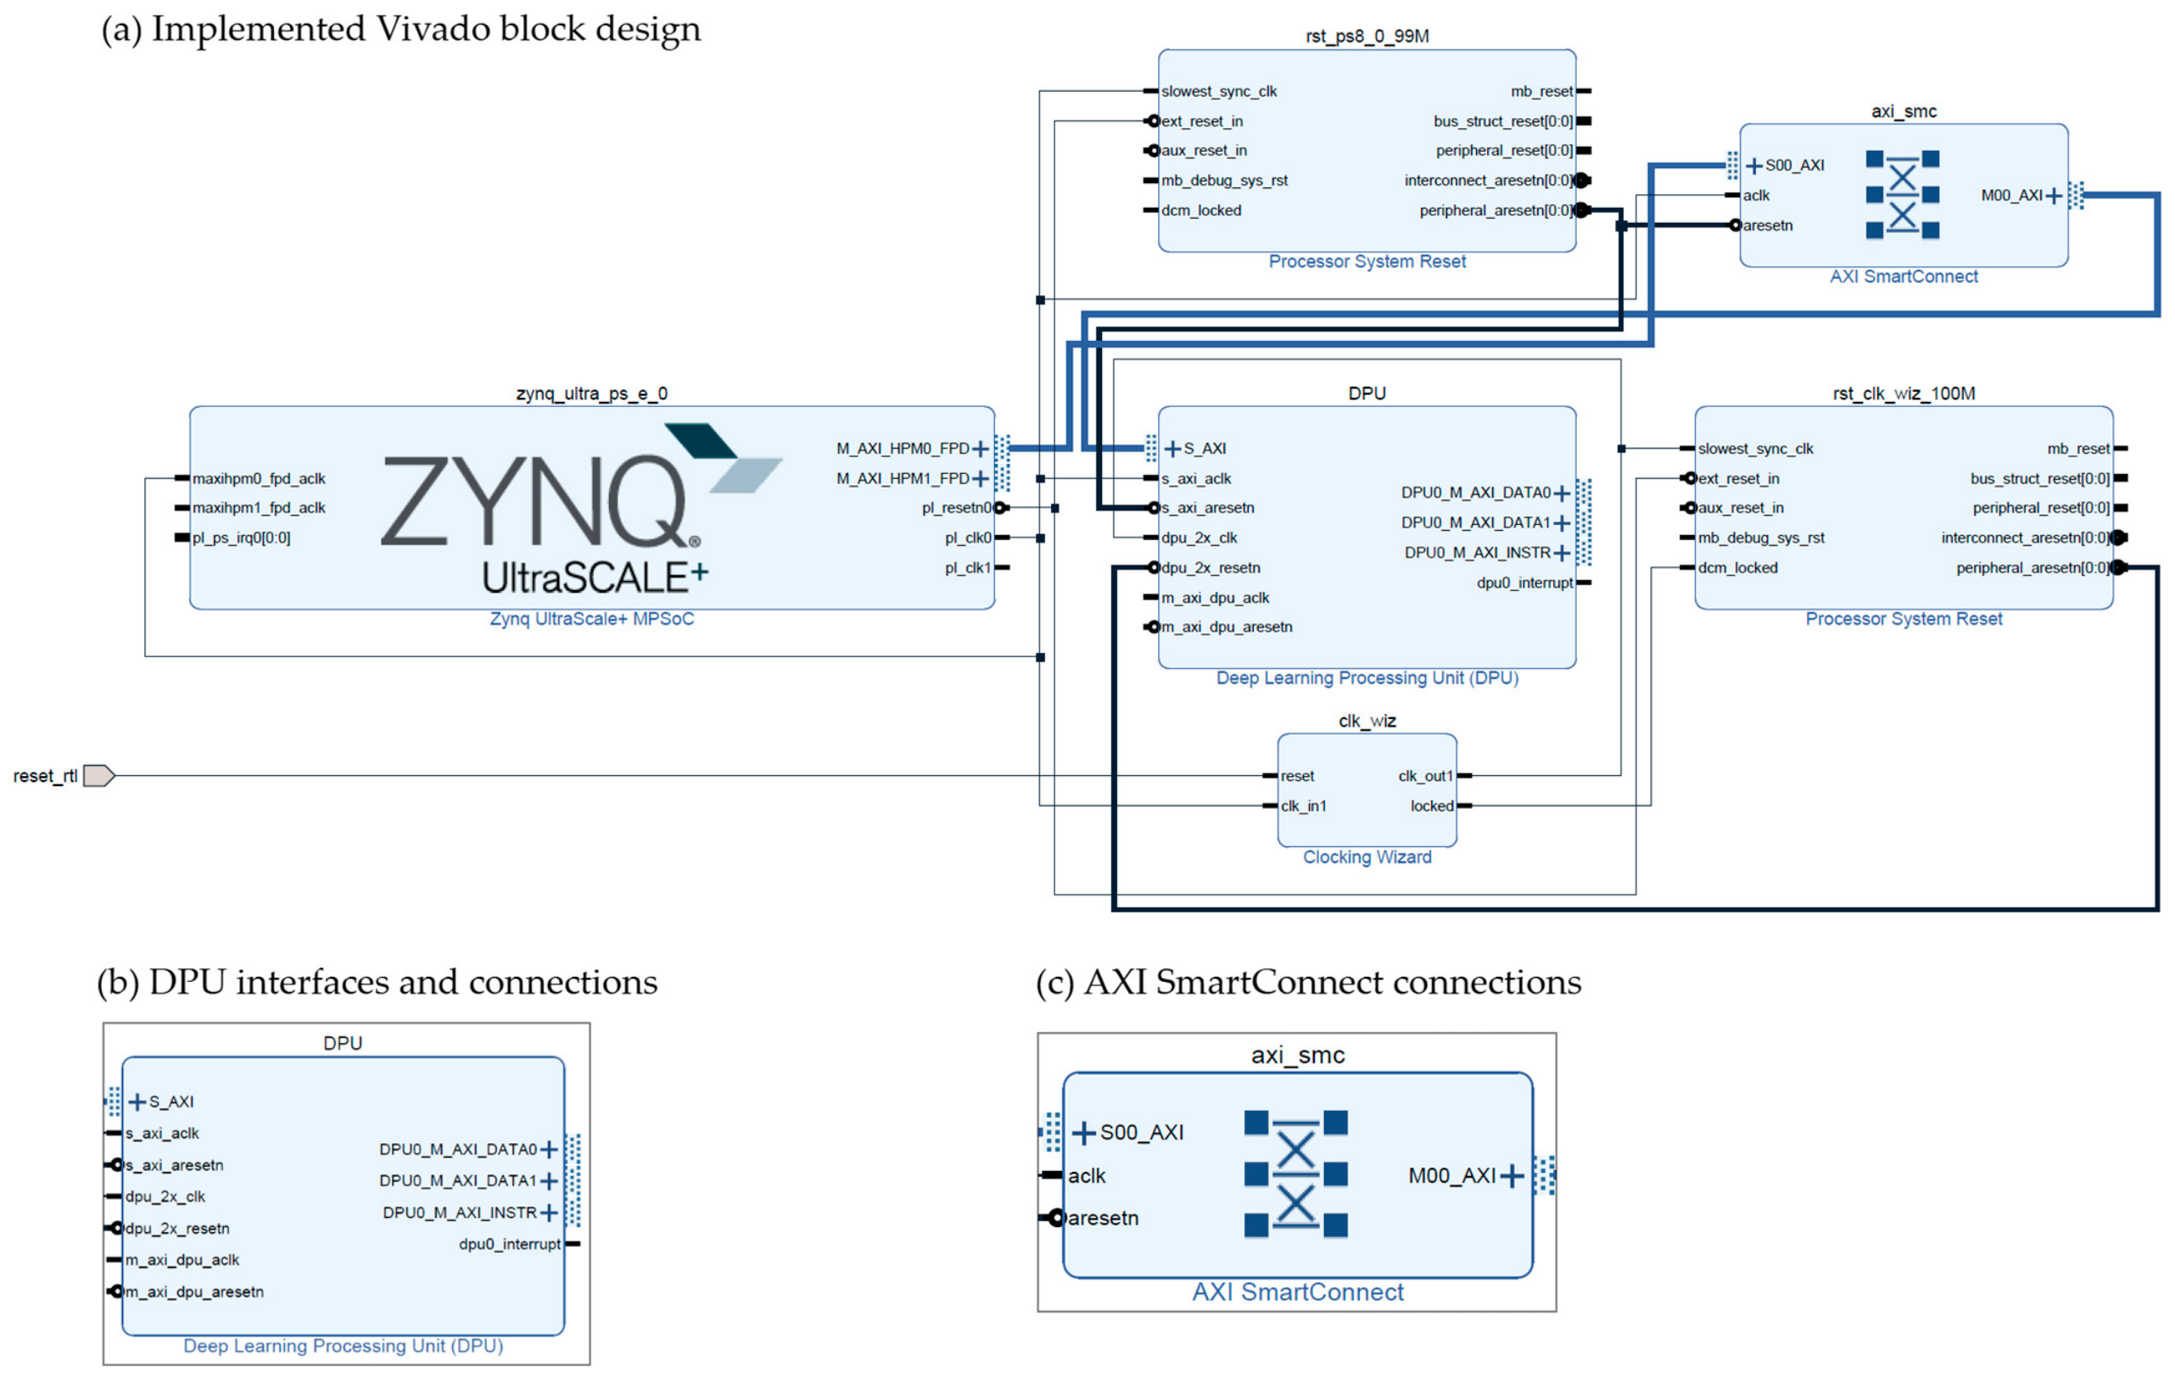
Figure 9 illustrates the FPGA hardware design implemented using Vivado 2023.1, integrating the Zynq UltraScale+ processing system, the DPU accelerator, and the required peripheral components. A single DPUCZDX8G core with the B4096 architecture was operated at 275 MHz. The principal configuration parameters are summarized in Table 3 [34,35,36].
Figure 9.
Vivado block design of the implemented KV260 hardware platform: (a) overall Zynq UltraScale+ MPSoC, DPU, clock/reset and Advanced eXtensible Interface (AXI) SmartConnect interconnections; (b) enlarged DPU interfaces; (c) enlarged AXI SmartConnect connections.
Table 3.
DPU configuration of the implemented hardware design on the Kria KV260.
The DPUCZDX8G IP is available in eight architectures—B512, B800, B1024, B1152, B1600, B2304, B3136, and B4096—where the numeral denotes the peak number of operations per clock cycle [34,35]. At the 275 MHz clock used here, these correspond to nominal peak compute capacities between approximately 0.14 and 1.13 tera-operations per second (TOPS) (Table 4). Because the nominal peak scales linearly with the architecture size and YOLOv8m requires approximately 78.9 G operations per 640 × 640 frame (Table 2), B4096 provides the highest available compute ceiling for this workload, whereas smaller architectures would reduce this ceiling proportionally. B4096 is also the configuration used in the KV260 reference-design workflow and fits within the programmable-logic resources of the device [34,35,37].
Table 4.
Nominal peak compute capacity of the DPUCZDX8G architectures at 275 MHz, derived from the peak number of operations per clock cycle [34,35].
3. Results
3.1. Detection Performance and Effect of INT8 Quantization
Table 5 reports the class-wise precision, recall, F1-score, and AP@50 of the FP32 model on the 235-image test set.
Table 5.
Class-wise detection performance of the FP32 model on the 235-image test set.
On the 235-image test set containing 1512 annotated defect instances, the YOLOv8m FP32 model achieved an mAP@50 of 93.5% using the Ultralytics evaluation procedure. As shown in Table 6, the INT8-quantized model achieved an mAP@50 of 93.2% on the same test set, representing a decrease of only 0.3 percentage points.
Table 6.
Class-wise AP@50 (%) of the FP32 and INT8 models on the same 235-image test set.
Across defect classes, the largest observed AP@50 difference was for Open-circuit (90.5% FP32 versus 88.9% INT8); the remaining class-wise changes were negligible. These class-wise differences are reported as observed values; isolating their cause would require layer-wise quantization analysis.
INT8 quantization also provides direct deployment benefits. Reducing the nominal storage per parameter from four bytes to one byte lowers the nominal weight storage of the approximately 25.9 M parameters of YOLOv8m [25] from about 104 MB to about 26 MB, which reduces the volume of weight data transferred from external DDR memory during inference. In addition, INT8 representation is a prerequisite for execution on the DPU, whose processing elements perform 8-bit integer multiply–accumulate operations on the digital signal processing (DSP) resources of the programmable logic [35].
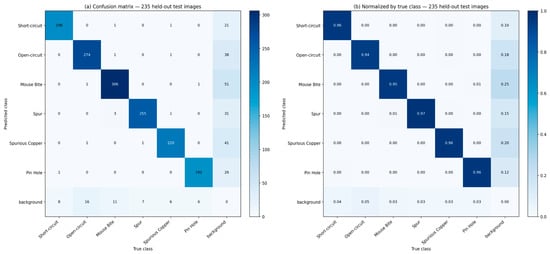
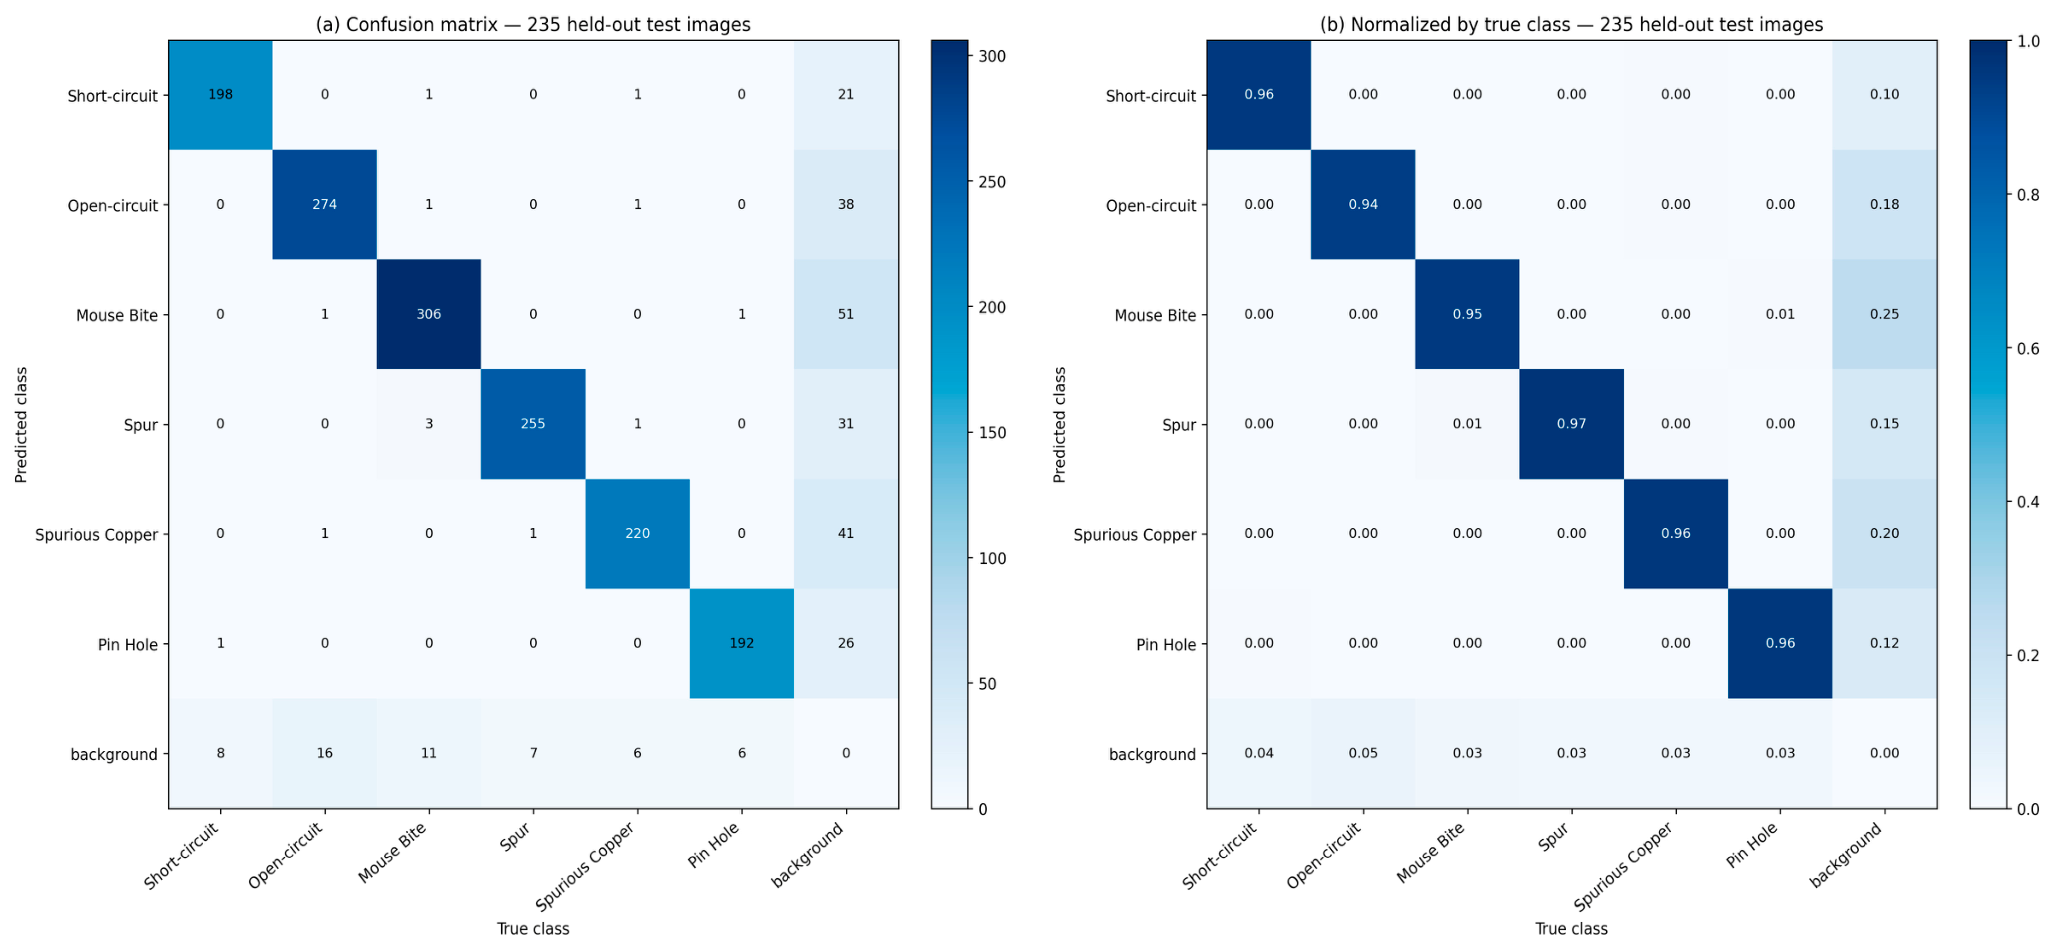
Figure 10 presents the FP32 YOLOv8m confusion matrices for the 235-image test set containing 1512 annotated defect instances. The ground-truth defect counts are 207 for Short-circuit, 292 for Open-circuit, 322 for Mouse Bite, 263 for Spur, 229 for Spurious Copper, and 199 for Pin Hole. Figure 10a presents the confusion matrix as absolute counts, where diagonal entries indicate correctly classified detections, off-diagonal entries represent class confusions, the background row indicates missed annotated defects, and the background column represents unmatched predictions. Figure 10b presents the same confusion matrix normalized by ground-truth class, with values expressed as proportions between 0 and 1.
Figure 10.
FP32 YOLOv8m confusion matrices for the 235-image test set (1512 annotated defects): (a) absolute counts; (b) normalized values for each true class.
3.2. Size-Stratified Performance Comparison Between FP32 and INT8
A size-stratified detection performance analysis was conducted on the 235-image test set using COCOeval, with defect instances categorized according to their bounding-box areas in pixels. The FP32 model achieved AP@50 values of 89.3% for small objects (area < 322 pixels; n = 723), 95.0% for medium objects (322–962 pixels; n = 787), and 100.0% for large objects (area ≥ 962 pixels; n = 2). Because the large-object category contains only two instances, its AP@50 of 100.0% is not statistically representative and should be interpreted as a descriptive observation rather than evidence of generalizable detection performance.
The overall FP32 AP@50 obtained using COCOeval was 93.0%, compared with the 93.5% mAP@50 obtained using the Ultralytics evaluation procedure. These values were calculated using different evaluation implementations [25,27] and should not be interpreted as an effect of quantization.
For the INT8 model, the corresponding size-stratified AP@50 values were 88.7%, 94.8%, and 100.0% for small, medium, and large objects, respectively. Compared with the FP32 results obtained using the same COCOeval procedure, these values represent differences of −0.6, −0.2, and 0.0 percentage points. The largest observed decrease occurred for small defects, suggesting that small-object detection may be more sensitive to INT8 quantization. However, the result for large defects remains descriptive because of the limited number of instances.
3.3. Measured Stage-Level Latency on the KV260
The INT8 YOLOv8m pipeline was profiled on the Kria KV260 to quantify the contribution of individual processing stages to end-to-end inference latency. Preprocessing took 333.2 ms (29.0%), DPU inference took 206.8 ms (18.0%), and postprocessing, including NMS, took 609.0 ms (53.0%). The resulting end-to-end latency was 1149.0 ms, corresponding to approximately 0.87 FPS. Postprocessing was the dominant latency component, accounting for more than half of the total, while DPU inference accounted for less than one fifth. These results indicate that, under the evaluated configuration, end-to-end throughput was constrained primarily by host-side processing, particularly postprocessing, rather than by DPU inference alone. Data-transfer latency and any operators executed on the host processor are included within the reported stage timings, as detailed in Table 7.
Table 7.
Measured per-frame stage latency of the INT8 YOLOv8m pipeline on the Kria KV260.
3.4. Cross-Platform Throughput Comparison
To evaluate the end-to-end inference performance of the proposed YOLOv8m-based PCB defect detection system, experiments were conducted on three computing platforms: an NVIDIA Tesla T4 GPU (NVIDIA Corporation, Santa Clara, CA, USA), an Intel Core i7-6700K (Intel Corporation, Santa Clara, CA, USA) central processing unit (CPU), and an AMD Kria KV260 FPGA-based embedded platform. As shown in Table 8, the measured end-to-end throughput was 44.08 FPS on the GPU, 1.37 FPS on the CPU, and 0.87 FPS on the KV260. These FPS values represent the complete inference pipeline, including preprocessing, network inference, and postprocessing, rather than accelerator-only execution.
Table 8.
Platform-specific detection accuracy (mAP@50) and measured end-to-end inference throughput (FPS) for YOLOv8m under FP32 and INT8 execution configurations.
The GPU and CPU experiments used the FP32 model, whereas the KV260 executed the INT8-quantized model. Therefore, the reported throughput values reflect different hardware platforms, numerical formats, and execution environments. They should be interpreted as platform-specific measurements rather than a controlled, like-for-like comparison of hardware acceleration. The corresponding detection accuracy and throughput measurements are summarized in Table 8. The throughput of other detector architectures on the KV260 is examined separately in Section 3.5.
3.5. Exploratory End-to-End Throughput Comparison of Different YOLO Models
A comparison of end-to-end inference throughput was conducted for YOLOX-Nano, YOLOX-Tiny, and the proposed INT8 YOLOv8m model on the AMD Kria KV260 platform. The models were evaluated using the same PCB image set and an input image size of 640 × 640 pixels. End-to-end throughput measurements included preprocessing, model inference, and postprocessing. As shown in Table 9, YOLOX-Nano and YOLOX-Tiny achieved 3.92 and 1.72 FPS, respectively, whereas the proposed INT8 YOLOv8m model achieved 0.87 FPS. The YOLOX models were assessed for runtime performance rather than six-class PCB defect detection accuracy. Therefore, this comparison provides an exploratory assessment of processing throughput and does not establish a cross-model accuracy–throughput ranking.
Table 9.
Exploratory comparison of end-to-end inference throughput for selected YOLO models on the AMD Kria KV260 platform.
3.6. Robustness Under Synthetic Noise and Illumination Variations
Table 10 presents a supplementary robustness analysis of the FP32 detector under four synthetic noise and intensity-scaling conditions using the same 235-image test set. Such corruption-based evaluation follows established practice for assessing the robustness of deep vision models [38]. Each synthetic condition was evaluated against the unchanged ground-truth annotations. The perturbations were applied only to the input images, and no model fine-tuning or additional training was performed.
Table 10.
FP32 detection performance under simulated noise and illumination variations on the same 235-image test set.
Under mild Gaussian noise (σ = 10), the detector achieved an mAP@50 of 93.0%, whereas stronger Gaussian noise (σ = 20) resulted in a substantially lower mAP@50 of 74.8%. The detector maintained mAP@50 values of 93.2% and 93.1% under reduced and non-uniform illumination, respectively. These findings indicate limited sensitivity to the tested intensity-reduction transformations on binarized images but substantially reduced robustness under stronger Gaussian noise. This supplementary software-based FP32 analysis is distinct from the study’s main contribution—INT8 YOLOv8m deployment and system-level performance evaluation on the AMD Kria KV260—and does not constitute an additional measurement of on-device INT8 accuracy or inference latency.
4. Discussion
4.1. Throughput Relative to Nominal DPU Capacity
To place the FPGA result in context, the measured throughput can be related to the nominal compute capacity of the DPU. YOLOv8m requires approximately 78.9 G operations per 640 × 640 pixels (Table 2), and the B4096 architecture provides a nominal peak of 1.13 TOPS at 275 MHz (Table 4). Under the idealized assumption of full DPU utilization without overhead, the network computation alone would therefore require approximately 70 ms per frame, corresponding to an upper bound of roughly 14 FPS. The measured end-to-end processing time of approximately 1.15 s per frame lies more than an order of magnitude above this idealized bound. The stage-level measurements (Section 3.3) show that host-side preprocessing and postprocessing account for 82.0% of the per-frame latency. The measured DPU stage (206.8 ms) also exceeds the idealized 70 ms bound, which is consistent with compiler-dependent graph partitioning, external-memory traffic, and data movement within that stage; these components were not instrumented separately.
The same consideration explains why the desktop CPU, which executes the FP32 model on x86 cores operating at 4.0 GHz, attains a higher end-to-end frame rate than the embedded platform: on the KV260, the stages that are not offloaded to the DPU are executed on processor cores with substantially lower clock frequency and memory bandwidth. Previously reported FPGA-based PCB detection throughputs of 2.12 FPS [14] and 72.6 FPS [15] were obtained using different detector architectures, hardware platforms, and evaluation procedures. Accordingly, these values are provided solely as contextual references and should not be interpreted as directly comparable end-to-end performance benchmarks.
Published KV260 results obtained using other networks and applications provide context for these measurements. Laganier et al. [20] reported, for a baseline YOLOv8n SAR vessel detector, 6.9 FPS for a single-threaded full application, 21.6 FPS for an eight-threaded full application, and 24.7 FPS for single-threaded DPU-only execution. Ji et al. [21] reported a 95.2-fold increase in whole-XModel graph-execution throughput after rewriting YOLOv8 C2f blocks, under a measurement boundary that excludes image input/output, preprocessing, decoding, and NMS. These values are not directly comparable with the measured 0.87 FPS of the proposed YOLOv8m-based PCB defect detection pipeline because the application domains, network architectures, host execution paths, concurrency settings, and measurement boundaries differ across these studies. Nevertheless, the reported findings highlight multithreaded execution and graph-level optimization as potential directions for improving the throughput of the proposed pipeline.
4.2. Power Consumption and Practical Deployment
During inference on the physical AMD Kria KV260, software-based power monitoring indicated a board-level operating power of 8.1 W. Separately, Vivado reported a design-stage power estimate of 2.717 W for the implemented hardware. These two values represent different scopes—board-level operating power monitoring and hardware-design power estimation—and are therefore reported separately.
At 0.87 FPS, the current implementation is suited to sampling-based, batch-oriented, or offline PCB inspection rather than high-speed inline AOI. In production AOI lines, camera acquisition and board handling may introduce additional system latency beyond the measured inference pipeline. Furthermore, illumination variability, sensor noise, and changes in board appearance beyond the static DeepPCB images may affect detection performance, limiting the direct generalizability of the present results to inline deployment. The difference between the nominal compute ceiling and the measured end-to-end throughput also highlights system-level optimization opportunities, particularly in postprocessing, preprocessing, and data movement.
4.3. Limitations and Future Directions
The proposed experimental setting evaluates images from the 11 different PCB groups represented during model development; transfer to previously unseen board designs remains an important direction for further study. The YOLOX measurements characterize throughput only and should not be interpreted as direct comparisons of detection accuracy. The three-stage latency profile identifies preprocessing, DPU execution, and postprocessing costs, but it does not distinguish individual postprocessing operations or data-transfer subcomponents. A controlled optimization study with repeated timing measurements would provide a more detailed account of runtime variability and achievable throughput improvements. The software-monitored board power and the Vivado design estimate represent different measurement scopes and are not direct per-inference energy measurements.
The supplementary FP32 robustness experiments used synthetic Gaussian noise and pixel-intensity reductions applied to the existing binarized DeepPCB test images. Although they quantify sensitivity to controlled input perturbations, they do not establish generalization to real sensor noise, reflections, shadows, or different industrial lighting systems. Furthermore, these software-based experiments should not be interpreted as additional INT8/KV260 robustness measurements. Future work should include acquisition-based evaluation under controlled real illumination settings and hardware-based testing of the quantized detector.
Further work could compare lightweight detector architectures trained for the same six PCB classes under a common accuracy and timing protocol. Additional profiling of processor-side decoding, NMS, preprocessing, and data transfer, followed by controlled optimization and repeated latency measurements, would provide a basis for improving the observed 609.0 ms postprocessing cost. Structured pruning, quantization-aware training, and workload-specific energy measurements are additional potential research directions.
5. Conclusions
This hardware-oriented case study evaluated a YOLOv8m PCB defect detector deployed on the AMD Kria KV260 FPGA platform through the Vitis AI toolchain. The floating-point model achieved 93.5% mAP@50 and the deployed INT8 model 93.2% mAP@50 on the same test set, while INT8 representation reduced nominal weight storage by approximately a factor of four. The implementation achieved an end-to-end throughput of 0.87 FPS. Comparison with the nominal 1.13 TOPS compute capacity of the B4096 DPU shows that peak arithmetic capacity alone is insufficient to characterize the observed end-to-end frame rate, emphasizing the importance of system-level deployment overheads such as data movement and processor-side processing. Measured stage-level timing further localized the largest share of end-to-end latency to postprocessing (609.0 ms, 53.0%), followed by preprocessing (333.2 ms, 29.0%) and DPU inference (206.8 ms, 18.0%). These measurements identify software-side pipeline optimization, particularly of postprocessing, as the most direct route to higher throughput.
The proposed study establishes an embedded deployment baseline for a medium-scale YOLOv8m PCB defect detector, combining quantitative assessment of detection accuracy and resource use with stage-level latency analysis. The supplementary size-stratified analysis indicated a modest AP@50 reduction for small defects following INT8 quantization. Same-board YOLOX experiments demonstrated different end-to-end throughput operating points without providing corresponding PCB-detection AP values. The measured runtime remains most suitable for batch, sampling-based, and offline inspection, and the substantial software-side processing time motivates future pipeline optimization. Supplementary FP32 experiments on the same 235-image test set yielded mAP@50 values of 93.2% and 93.1% under reduced and non-uniform intensity scaling, respectively, but only 74.8% under stronger Gaussian noise (σ = 20), identifying noise robustness as an important target for further improvement.
Author Contributions
Conceptualization, İ.B., S.B. and H.K.; formal analysis, İ.B.; writing—original draft preparation, İ.B.; writing—review and editing, S.B. and H.K.; visualization, İ.B.; supervision, S.B. and H.K.; resources, S.B. and H.K. All authors have read and agreed to the published version of the manuscript.
Funding
No external cash funding was received for the research.
Institutional Review Board Statement
Not applicable. This study did not involve human or animal subjects; all experiments were conducted using the publicly available DeepPCB image dataset [24].
Informed Consent Statement
Not applicable.
Data Availability Statement
The experimental images were drawn from the publicly available DeepPCB dataset, accessible at https://github.com/tangsanli5201/DeepPCB (accessed on 10 October 2025) [24]. Details of the subset used in this study are available from the corresponding author upon request.
Acknowledgments
The authors thank the AMD University Program for providing the Kria KV260 Vision AI Starter Kit used in the experimental deployment.
Conflicts of Interest
The authors declare no conflicts of interest. The authors confirm that the equipment provider had no role in the design of the study; the collection, analysis, or interpretation of data; the writing of the manuscript; or the decision to submit the results for publication.
References
- HoangVan, X.; Dinh, D.B.; Canh, T.N.; Nguyen, V.-T. ESRPCB: An edge guided super-resolution model and ensemble learning for tiny printed circuit board defect detection. Eng. Appl. Artif. Intell. 2025, 159, 111547. [Google Scholar] [CrossRef] [Scilit]
- Zhou, Y.; Yuan, M.; Zhang, J.; Ding, G.; Qin, S. Review of vision-based defect detection research and its perspectives for printed circuit board. J. Manuf. Syst. 2023, 70, 557–578. [Google Scholar] [CrossRef] [Scilit]
- Zhang, T.; Zhang, J.; Pan, P.; Zhang, X. YOLO-RRL: A lightweight algorithm for PCB surface defect detection. Appl. Sci. 2024, 14, 7460. [Google Scholar] [CrossRef] [Scilit]
- Song, X.; Cao, S.; Zhang, J.; Hou, Z. Steel surface defect detection algorithm based on YOLOv8. Electronics 2024, 13, 988. [Google Scholar] [CrossRef] [Scilit]
- Wang, Y.; Zhang, K.; Wang, L.; Wu, L. An improved YOLOv8 algorithm for rail surface defect detection. IEEE Access 2024, 12, 44984–44997. [Google Scholar] [CrossRef] [Scilit]
- Li, N.; Ye, T.; Zhou, Z.; Gao, C.; Zhang, P. Enhanced YOLOv8 with BiFPN-SimAM for precise defect detection in miniature capacitors. Appl. Sci. 2024, 14, 429. [Google Scholar] [CrossRef] [Scilit]
- Zhang, L.; Li, B.; Cui, Y.; Lai, Y.; Gao, J. Research on improved YOLOv8 algorithm for insulator defect detection. J. Real-Time Image Process. 2024, 21, 22. [Google Scholar] [CrossRef] [Scilit]
- Wu, K.; Sun, S.; Sun, Y.; Wang, C.; Wei, Y. RBS-YOLO: A lightweight YOLOv5-based surface defect detection model for castings. IET Image Process. 2025, 19, e70018. [Google Scholar] [CrossRef] [Scilit]
- Liu, Q.; Liu, M.; Wu, Q.M.J.; Shen, W. A real-time anchor-free defect detector with global and local feature enhancement for surface defect detection. Expert Syst. Appl. 2024, 246, 123199. [Google Scholar] [CrossRef] [Scilit]
- Ruengrote, S.; Kasetravetin, K.; Srisom, P.; Sukchok, T.; Kaewdook, D. Design of deep learning techniques for PCBs defect detecting system based on YOLOv10. Eng. Technol. Appl. Sci. Res. 2024, 14, 18741–18749. [Google Scholar] [CrossRef] [Scilit]
- Chi, J.; Zhang, K.; Zhang, H.; Niu, G.; Zheng, Z. An improved EAE-DETR model for defect detection of server motherboard. Sci. Rep. 2025, 15, 29063. [Google Scholar] [CrossRef] [Scilit]
- Khalili, B.; Smyth, A.W. SOD-YOLOv8—Enhancing YOLOv8 for small object detection in aerial imagery and traffic scenes. Sensors 2024, 24, 6209. [Google Scholar] [CrossRef] [Scilit]
- Yu, H.; Lin, Q.; Liu, C. Design and implementation of embedded PCB defect detection system based on FPGA. In Proceedings of the 2023 IEEE 7th Information Technology and Mechatronics Engineering Conference (ITOEC), Chongqing, China, 15–17 September 2023; pp. 530–535. [Google Scholar] [CrossRef] [Scilit]
- Zhang, J.; Zhang, H.; Zhao, B.; Liu, J.; Zhou, X. FPGA implementation of neural network accelerator for PCB defect detection. In Proceedings of the Third International Symposium on Computer Engineering and Intelligent Communications (ISCEIC 2022); SPIE: Bellingham, WA, USA, 2023; Volume 12462, p. 124622I. [Google Scholar] [CrossRef] [Scilit]
- Pan, Y.; Zhang, L.; Zhang, Y. Rapid detection of PCB defects based on YOLOx-Plus and FPGA. IEEE Access 2024, 12, 61343–61358. [Google Scholar] [CrossRef] [Scilit]
- Yang, Z.; Li, D.; Hou, L.; Nai, W. A comprehensive performance evaluation of YOLO series algorithms in automatic inspection of printed circuit boards. Machines 2026, 14, 94. [Google Scholar] [CrossRef] [Scilit]
- Liu, C.; Liu, W.; Lian, L. ESI-YOLOv11n: Efficient multi-scale fusion method for PCB defect detection. Machines 2026, 14, 240. [Google Scholar] [CrossRef] [Scilit]
- Heng, C.W.; Uttraphan, C.; Chew, C.C.; Kok, B.C. Optimizing FPGA-based YOLO series accelerators: A survey of techniques. Neurocomputing 2025, 650, 130874. [Google Scholar] [CrossRef] [Scilit]
- Nechi, A.; Groth, L.; Mulhem, S.; Merchant, F.; Buchty, R.; Berekovic, M. FPGA-based deep learning inference accelerators: Where are we standing? ACM Trans. Reconfig. Technol. Syst. 2023, 16, 60. [Google Scholar] [CrossRef] [Scilit]
- Laganier, C.; Fletcher, L.; Kwan, E.; Walters, R.; Nockles, V. Efficient SAR vessel detection for FPGA-based on-satellite sensing. In Proceedings of the Tenth ACM/IEEE Symposium on Edge Computing (SEC ’25), Washington, DC, USA, 3–6 December 2025. [Google Scholar] [CrossRef] [Scilit]
- Ji, X.; Hu, S.; Wang, H.; Hao, W.; Li, X. C2fDeploy: Function-preserving graph rewriting to eliminate runtime split overhead on FPGA deep learning processing units. Electronics 2026, 15, 4431. [Google Scholar] [CrossRef] [Scilit]
- Budak, İ. FPGA Tabanlı PCB Hata Tespitinde Derin Öğrenme Uygulaması. Master’s Thesis, Marmara University, Istanbul, Türkiye, 2024. (In Turkish) [Google Scholar]
- Budak, İ.; Bal, S.; Korkmaz, H. YOLO-based deep learning model for multi-class defect detection in PCB manufacturing. Afyon Kocatepe Univ. J. Sci. Eng. 2025, 25, 816–826. (In Turkish) [Google Scholar]
- DeepPCB Dataset. Available online: https://github.com/tangsanli5201/DeepPCB (accessed on 10 October 2025).
- Jocher, G.; Chaurasia, A.; Qiu, J. Ultralytics YOLOv8, Version 8.0.0. 2023. Available online: https://github.com/ultralytics/ultralytics (accessed on 1 October 2026).
- Liu, Y.; Liu, Y.; Guo, X.; Ling, X.; Geng, Q. Metal surface defect detection using SLF-YOLO enhanced YOLOv8 model. Sci. Rep. 2025, 15, 11105. [Google Scholar] [CrossRef] [Scilit]
- COCO Consortium. COCO API: Object Detection Evaluation (COCOeval). Available online: https://github.com/cocodataset/cocoapi/blob/master/PythonAPI/pycocotools/cocoeval.py (accessed on 21 October 2026).
- Terven, J.; Córdova-Esparza, D.-M.; Romero-González, J.-A. A comprehensive review of YOLO architectures in computer vision: From YOLOv1 to YOLOv8 and YOLO-NAS. Mach. Learn. Knowl. Extr. 2023, 5, 1680–1716. [Google Scholar] [CrossRef] [Scilit]
- Hussain, M. YOLO-v1 to YOLO-v8, the rise of YOLO and its complementary nature toward digital manufacturing and industrial defect detection. Machines 2023, 11, 677. [Google Scholar] [CrossRef] [Scilit]
- Yan, Z.; Zhang, B.; Wang, D. An FPGA-based YOLOv5 accelerator for real-time industrial vision applications. Micromachines 2024, 15, 1164. [Google Scholar] [CrossRef] [Scilit]
- Qasaimeh, M.; Denolf, K.; Khodamoradi, A.; Blott, M.; Lo, J.; Halder, L.; Vissers, K.; Zambreno, J.; Jones, P.H. Benchmarking vision kernels and neural network inference accelerators on embedded platforms. J. Syst. Archit. 2021, 113, 101896. [Google Scholar] [CrossRef] [Scilit]
- Zhu, J.; Wang, L.; Liu, H.; Tian, S.; Deng, Q.; Li, J. An efficient task assignment framework to accelerate DPU-based convolutional neural network inference on FPGAs. IEEE Access 2020, 8, 83224–83237. [Google Scholar] [CrossRef] [Scilit]
- Al Amin, R.; Hasan, M.; Wiese, V.; Obermaisser, R. FPGA-based real-time object detection and classification system using YOLO for edge computing. IEEE Access 2024, 12, 73268–73278. [Google Scholar] [CrossRef] [Scilit]
- AMD. Vitis AI 3.5 Documentation: DPU IP Details and System Integration. Available online: https://xilinx.github.io/Vitis-AI/3.5/html/docs/workflow-system-integration.html (accessed on 15 October 2026).
- AMD. DPUCZDX8G for Zynq UltraScale+ MPSoCs Product Guide (PG338); Version 4.1; Advanced Micro Devices: Santa Clara, CA, USA, 2023; Available online: https://docs.amd.com/r/en-US/pg338-dpu (accessed on 15 October 2026).
- Ramesh, S.N.; Sarkar, M.; Audette, M.; Paolini, C. Efficient real-time fall prediction and detection using privacy-centric vision-based human pose estimation on the Xilinx® Kria™ K26 SOM. In Proceedings of the 2023 IEEE Biomedical Circuits and Systems Conference (BioCAS), Toronto, ON, Canada, 19–21 October 2023; pp. 1–5. [Google Scholar]
- AMD. Hardware Architecture of the Accelerator—Kria KV260. Available online: https://xilinx.github.io/kria-apps-docs/kv260/2022.1/build/html/docs/aibox-reid/docs/hw_arch_accel_aib.html (accessed on 23 May 2026).
- Hendrycks, D.; Dietterich, T. Benchmarking neural network robustness to common corruptions and perturbations. In Proceedings of the International Conference on Learning Representations (ICLR), New Orleans, LA, USA, 6–9 May 2019. [Google Scholar]

Disclaimer/Publisher’s Note: The statements, opinions and data contained in all publications are solely those of the individual author(s) and contributor(s) and not of MDPI and/or the editor(s). MDPI and/or the editor(s) disclaim responsibility for any injury to people or property resulting from any ideas, methods, instructions or products referred to in the content. |
© 2026 by the authors. Licensee MDPI, Basel, Switzerland. This article is an open access article distributed under the terms and conditions of the Creative Commons Attribution (CC BY) license.