


Abstract
Marine natural gas hydrates are considered a highly promising green energy resource. However, their reservoirs are susceptible to wellbore instability during drilling and extraction due to their occurrence forms and the weakly cemented characteristics of the reservoir. Enhancing reservoir cementation and improving the strength of the formation surrounding the wellbore are critical to overcoming this instability challenge. Microbially induced calcium carbonate precipitation (MICP) technology offers a novel approach to addressing this issue; however, elucidating the growth patterns of microorganisms in low-temperature seawater-based drilling fluids is a prerequisite for applying MICP to improve the wellbore stability of marine natural gas hydrate reservoirs. In this study, the growth of Sporosarcina pasteurii was monitored in polyanionic cellulose (PAC) seawater-based drilling fluid at 4, 6, 8 and 10 °C, and the growth data were fitted to construct primary growth models. The results indicate that both the seawater environment and low temperatures inhibit the growth of S. pasteurii, prolonging its lag phase, and the bacterial concentration decreases with decreasing temperature. Notably, at temperatures ranging from 4 to 10 °C, the growth of S. pasteurii in PAC seawater-based drilling fluid was superior to that in natural seawater. Based on model evaluation metrics, the modified Logistic model exhibited a relatively high R2 (0.99530–0.99908) and low RMSE (0.00009–0.01487) and AIC (−93.87389 to −66.60236), indicating that it was more suitable as a primary growth model for S. pasteurii in the low-temperature PAC seawater-based drilling fluid system, whereas the square-root model exhibited an R2 of 0.90131, an Af value of 1.03306, and a Bf value of 1.00092, with all three evaluation metrics being closer to 1, indicating that it was more appropriate as a secondary growth kinetic model. These findings provide a critical theoretical foundation for future investigations into the relationship between the growth characteristics of S. pasteurii and wellbore strengthening by PAC seawater-based microbial drilling fluid, as well as for the further development of MICP-based approaches to mitigate wellbore instability during marine natural gas hydrate drilling.
1. Introduction
Natural gas hydrates are abundant, clean, and efficient unconventional energy resource, regarded as one of the most promising alternative energy sources and widely distributed in terrestrial permafrost regions and submarine sediments [1,2,3]. In the South China Sea, natural gas hydrates are mainly concentrated in soft, unconsolidated clayey silt or muddy sediments beneath the seafloor [4,5,6,7]. However, owing to their occurrence under specific temperature and pressure conditions, gas hydrate is prone to dissociation under external disturbance during drilling and production, which alters reservoir stress and induces wellbore instability, thereby increasing drilling difficulty and operational risks [8,9,10].
To achieve safe and efficient drilling and production of marine gas hydrates, related research has primarily focused on two main areas: drilling techniques and drilling fluid system optimization. Regarding drilling techniques, a series of key methods—including solid fluidization, dual-gradient drilling, managed-pressure drilling, and horizontal drilling—have been widely applied in field engineering practice. These techniques can, to some extent, balance formation pressure, mitigate drastic fluctuations in reservoir stress, and reduce the risk of large-scale gas hydrate dissociation, thereby ensuring drilling safety while effectively improving production efficiency [11,12]. With respect to drilling fluid systems, seawater is commonly used as the base fluid for marine gas hydrate drilling, and its performance is enhanced by adding hydrate inhibitors, rheology modifiers, and other treatment agents [13,14], ensuring that the drilling fluid maintains favorable rheological properties and hydrate inhibition performance under low-temperature conditions. However, these approaches largely focus on addressing the dissociation and reformation of gas hydrates during drilling, lacking an active wellbore stabilization strategy that targets the weakly cemented characteristics of the reservoir. Consequently, they are unable to fundamentally improve reservoir wellbore stability, and often involve high costs and limited overall environmental performance [15,16], making them difficult to adapt widely to the demands of marine gas hydrate drilling. Therefore, there is an urgent need for a low-temperature seawater-based drilling fluid system with strong cementation ability and the capacity to inhibit hydrate reformation, which can consolidate loose sediments through in situ cementation, enhance the formation surrounding the wellbore, and effectively address wellbore instability.
Microbially induced calcium carbonate precipitation (MICP), an emerging geotechnical reinforcement technology developed in recent years [17,18], provides a novel approach to addressing wellbore instability in marine natural gas hydrate reservoirs. This technique exploits the interaction between microbial metabolic products and substances in the surrounding environment to precipitate calcium carbonate with cementing properties, which binds soil particles and fills pores, ultimately enhancing the mechanical strength of geomaterials [19,20]. Among various approaches, ureolytic MICP represented by urea-hydrolyzing bacteria such as Sporosarcina pasteurii, Bacillus sphaericus, and Bacillus megaterium has been widely applied in soil solidification and fractured formation wellbore reinforcement owing to rapid urease-mediated hydrolysis of urea, the controllability of the process, and high solidification efficiency [21,22,23,24,25]. However, the effectiveness of MICP is closely related to multiple factors, including microbial activity, temperature, and pH. Temperature, as a critical factor influencing the MICP process, can significantly affect microbial growth and metabolism [26]. The optimal growth temperature for most mesophilic microorganisms ranges from 20–40 °C [27]. At lower temperatures, microbial growth and proliferation are restricted, and microbes may even enter dormancy, leading to a marked decline in urease activity and consequently reducing the effectiveness of MICP in improving the mechanical strength of soils [28,29]. Therefore, clarifying the effects of low-temperature seawater environments on the growth and proliferation of S. pasteurii and understanding its growth patterns are essential prerequisites for conducting experiments on the relationship between microbial growth and wellbore strengthening using seawater-based microbial drilling fluids, ensuring effective MICP cementation, and addressing wellbore instability during marine gas hydrates drilling.
To understand microbial growth patterns under different environmental conditions, methods for predicting microbial growth based on environmental monitoring data have been developed [30]. Microbial growth prediction models, grounded in microbiology, statistics, and computational applications, simulate microbial processes such as growth, metabolism, and death under specific conditions, enabling quantitative prediction of dynamic microbial growth [31,32]. These models typically include primary growth models and secondary kinetic models. Primary models describe the temporal changes in the microbial population under a given culture environment, such as the Logistic model, modified Gompertz model, and Huang model [33,34,35]. Secondary models characterize the functional relationships between environmental variables and the parameters of primary models, including the Belehradek (square-root) model, Arrhenius equation, and response surface models [36]. Currently, microbial growth predictive models have been widely applied in fields such as food safety and bioengineering. For example, Zhang et al. [37] employed the Logistic equation and the Luedeking R empirical equation to simulate changes in biomass concentration and key metabolites during mead fermentation. Fan Yang [38] developed a fungus–environment model based on an improved Gompertz model to predict fungal community dynamics under varying environmental conditions, revealing that thermotolerant fungi had a relative advantage within the fungal community. Yaoxing Niu et al. [39] established a shelf-life prediction model based on kinetic parameters and the Arrhenius equation, and further combined the Gompertz model with the Belehradek equation to predict the growth trends and shelf-life of enoki mushrooms in the presence of Pseudomonas species. Validation with quality indicators confirmed the high accuracy of the model, allowing estimation of shelf-life at any stage of cold-chain storage. These examples demonstrate that growth prediction models provide a convenient and effective approach for forecasting dynamic microbial growth processes and analyzing microbial growth patterns.
In summary, although growth prediction models have been widely applied in fields such as food safety and fermentation engineering, research on microbial growth prediction in low-temperature seawater-based drilling fluid systems remains limited. Therefore, this study aims to analyze the growth of S. pasteurii ATCC-11859 in different culture media and in polyanionic cellulose (PAC) seawater-based drilling fluid at 4, 6, 8, and 10 °C through experimental investigation and model development. Various microbial growth kinetic models are employed to fit and analyze the growth data of S. pasteurii in PAC seawater-based drilling fluid. Evaluation criteria, including the coefficient of determination (R2), root mean square error (RMSE), and Akaike information criterion (AIC), are used to select the most suitable growth model to characterize the growth patterns of S. pasteurii under different low-temperature conditions. The results provide an essential theoretical foundation for investigating the relationship between the growth characteristics of S. pasteurii and the wellbore strengthening performance of PAC seawater-based microbial drilling fluid, as well as for addressing wellbore instability during marine natural gas hydrate drilling using MICP technology.
2. Materials and Methods
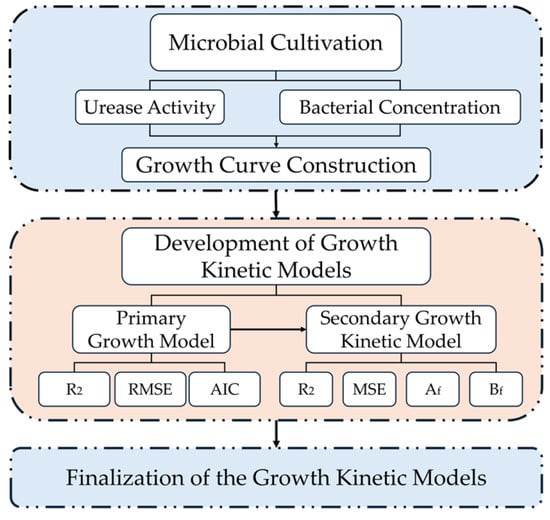
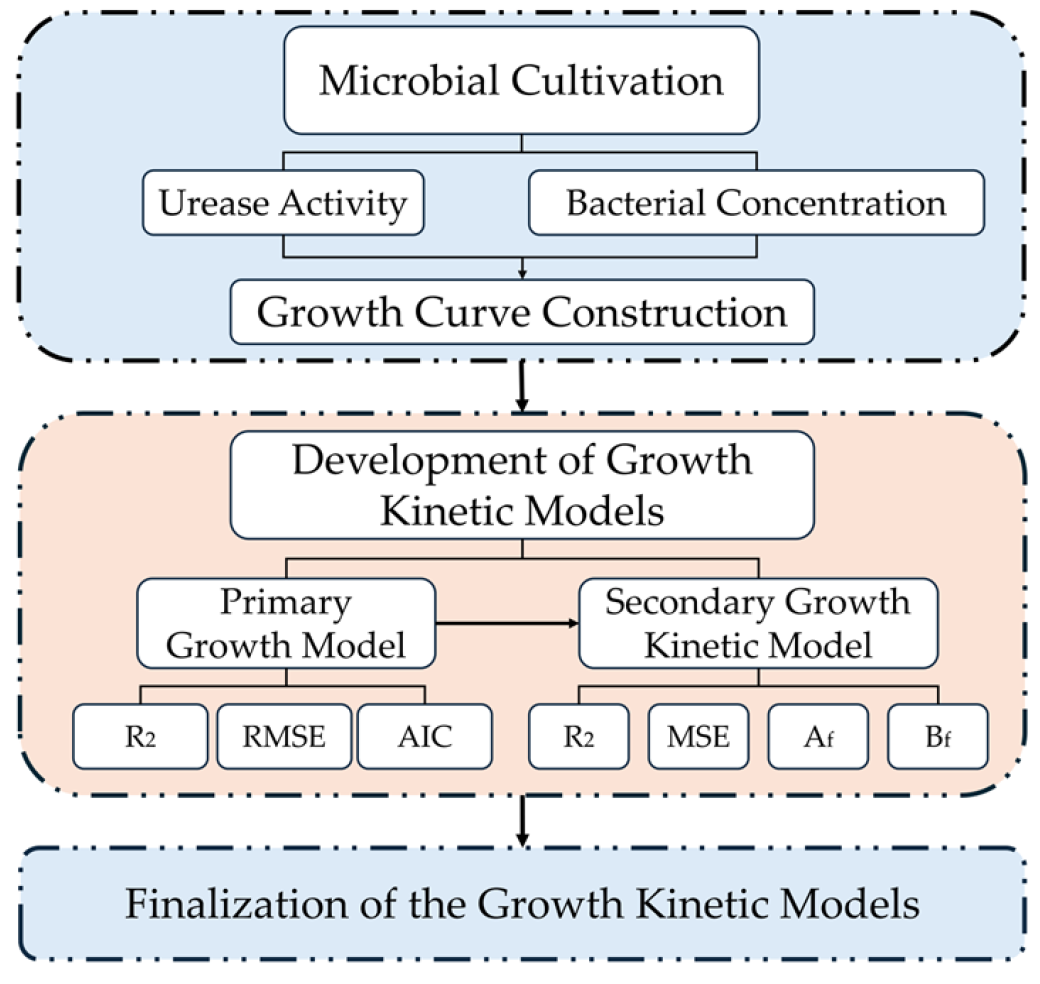
Given that the seafloor temperature is generally around 4 °C and the temperature of natural gas hydrate reservoirs typically fluctuates around 10 °C [40,41], a temperature-gradient design was adopted within the temperature range of 4–10 °C. Bacterial concentration and urease activity were used as response variables. Growth experiments were conducted with Sporosarcina pasteurii ATCC-11859 at different temperatures through the preparation of liquid culture media and bacterial cultivation. The growth characteristics of S. pasteurii under different culture media and temperature conditions were evaluated, and the experimental data were fitted to primary growth models. The optimal primary growth model was selected based on evaluation criteria such as the coefficient of determination (R2) and Akaike information criterion (AIC). A secondary growth kinetic model was further developed to quantify the relationship between temperature and the maximum specific growth rate. The specific experimental procedure is illustrated in Figure 1.
Figure 1.
Experimental flowchart.
2.1. Experimental Materials
The microorganism used in this study was Sporosarcina pasteurii ATCC-11859, obtained from Beijing BioBowei Biotechnology Co., Ltd. (Beijing, China) Other experimental materials are listed in Table 1.
Table 1.
Other experimental materials.
2.2. Experimental Methods
2.2.1. Preparation of Bacterial Suspension
Liquid culture media for S. pasteurii were prepared by adding 5 g of soy peptone, 15 g of casein peptone, and 5 g of sodium chloride to 1 L of deionized water and 1 L of seawater, respectively. The mixtures were stirred until fully dissolved, and the pH was adjusted to 7.3 using 1 mol/L NaOH solution, resulting in deionized water-based and seawater-based liquid media for S. pasteurii. Both media were then sealed and sterilized in an autoclave (YXQ-SG46-280S, Shanghai Boxun Industrial Co., Ltd., Shanghai, China) at 121 °C and 0.1 MPa for 20 min. After sterilization, the media were removed and placed on a sterile workbench (SW-CJ1FD, Suzhou Antai Air Technology Co., Ltd., Suzhou, China) to cool to room temperature. Once cooled, the activated S. pasteurii was inoculated into the liquid media at a volume ratio of 1:10 (V/V) in conical flasks, which were sealed with medical sealing film. The flasks were incubated in a shaking incubator at 30 °C and 120 r/min for 24 h to obtain the bacterial suspension used in the experiments.
2.2.2. Preparation and Performance Parameters of Seawater-Based Microbial Drilling Fluid
A 0.4% polyanionic cellulose (PAC; Shanghai Macklin Biochemical Co., Ltd., Shanghai, China) seawater-based drilling fluid was prepared by adding 4 g of polyanionic cellulose (PAC) to 1 L of seawater-based liquid medium, followed by thorough mixing using a high-speed stirrer. The pH of the mixture was adjusted to 7.3 with NaOH solution. The resulting suspension was sterilized in an autoclave at 121 °C and 0.1 MPa for 20 min, then removed and placed on a sterile workbench to cool to room temperature.
The cultured S. pasteurii suspension was diluted to OD600 = 0.6 and inoculated into 0.4% PAC seawater-based drilling fluid at a volume ratio of 1:10 (V/V). The flasks were sealed and incubated in shaking incubators at four different temperatures (4 °C, 6 °C, 8 °C, and 10 °C) for 48 h to obtain microbial drilling fluids at the respective temperatures.
In accordance with GB/T 16783.1–2006 [42], the funnel viscosity of the PAC seawater-based drilling fluid was measured at four different temperatures using a Marsh funnel (Su funnel). A six-speed rotational viscometer was then employed to obtain readings for the four drilling fluid samples at various rotational speeds, with speeds reduced from high to low. The apparent viscosity (AV), plastic viscosity (PV), and yield point (YP) of the four drilling fluid samples were calculated using Equations (1), (2) and (3), respectively.
PV = θ600 − θ300
YP = 0.511(θ300 − PY)
In Equations (1)–(3): AV denotes the apparent viscosity (mPa·s); θN denotes the viscometer reading at rotational speed N; PV denotes the plastic viscosity (mPa·s); and YP denotes the yield point (Pa).
The properties of the PAC seawater-based microbial drilling fluid at the four temperatures are presented Table 2.
Table 2.
Rheological properties of PAC seawater-based microbial drilling fluids at low temperatures.
2.2.3. Determination of Bacterial Concentration and Urease Activity
Determination of Bacterial Concentration
The bacterial concentration of S. pasteurii was determined using the turbidimetric method. Measurements began at 4 h, after which 5 mL of bacterial suspension was collected every 4 h and transferred into a cuvette for analysis using a spectrophotometer (UV2000, Shanghai Youyi Instrument Co., Ltd., Shanghai, China). The optical density at 600 nm (OD600) was used to represent the bacterial concentration. At each set temperature, PAC seawater-based drilling fluid without bacterial inoculation was used as the blank control, and the blank measurements were used as the baseline for measurements of each experimental group. Three parallel samples were prepared for each group, and the average of the measurements was taken.
Determination of Urease Activity
At room temperature, the S. pasteurii suspension was mixed uniformly with 1.6 mol/L urea solution at a volume ratio of V/V = 1:9. A conductivity meter (DDS-11A, Shanghai Leici Chuangyi Instrument & Meter Co., Ltd., Shanghai, China) was used to measure the change in conductivity within 5 min, and the average change per minute was calculated. According to the empirical value obtained by Whiffin [43], a conductivity change of 1 mS/min is equal to a urea hydrolysis rate of 11 mM urea hydrolysed/min. The average change in conductivity per minute (mS/min) is converted into the amount of urea hydrolyzed by urease per unit time, and then multiplied by the dilution factor to obtain the urea hydrolysis rate (mM urea hydrolysed/min) of the test bacterial suspension, which is used to represent the urease activity. The specific calculation formula is as follows:
2.2.4. Data Processing and Analysis
OriginPro 2022 (version 9.9.0, OriginLab Corporation, Northampton, MA, USA) was used to fit primary growth models and secondary growth kinetic models to the growth data of S. pasteurii at 4–10 °C and to estimate the corresponding model parameters. Nonlinear least-squares fitting was performed using the Levenberg–Marquardt (L-M) iterative algorithm, which determined the model parameters by minimizing the sum of squared errors (SSE) between experimental data and model predictions. Model performance was evaluated using metrics including the coefficient of determination (R2), root mean square error (RMSE), and Akaike information criterion (AIC) to compare the fitting results of different candidate models.
2.2.5. Kinetic Models
Primary Growth Models
Primary growth models are mainly used to describe the dynamic behavior of microbial cell numbers over time. Previous studies have shown that the Logistic and Gompertz models can effectively characterize the growth of S. pasteurii in drilling fluids under different environmental conditions [44,45]. Therefore, in this study, the Logistic model, Gompertz model, and their modified versions were employed as primary growthmodels to fit the temporal growth trends of S. pasteurii in PAC seawater-based drilling fluid at different temperatures. The optimal model for describing the growth of S. pasteurii in low-temperature PAC seawater-based drilling fluid was determined by comparing the goodness of fit among the four models. The commonly used forms of the Logistic and Gompertz models are shown in Equations (5) and (6), respectively:
In the equations: y(t) represents the bacterial concentration at time t (OD600); A1 is the theoretical minimum bacterial concentration (OD600); A2 is the theoretical maximum bacterial concentration (OD600); t0 is the time corresponding to the maximum specific growth rate; k is the maximum specific growth rate; and p is the model parameter.
To provide a more intuitive description of the relationship between the model and microbial growth, the model parameter p and others were replaced by biologically meaningful parameters such as A, λ, and μmax. The expressions of the modified Logistic and Gompertz models [46] are shown in Equations (7) and (8), respectively:
In the equations: N(t) represents the bacterial concentration at time t; N0 is the theoretical initial bacterial concentration; A is the theoretical maximum bacterial concentration (OD600); μmax is the maximum specific growth rate of the microorganisms; λ is the lag phase duration; and e is the base of the natural logarithm.
Secondary Growth Kinetic Models
Secondary growth kinetic models are typically used to describe the dynamic variation of primary model parameters (such as μmax, λ, etc.) under different environmental conditions. Common secondary growth kinetic models include the Belehradek (square root) model [47], Arrhenius model [48], and Rosso cardinal model [49]. Among them, the Belehradek and Arrhenius models have been widely applied to describe the effects of temperature on microbial growth rates and reaction rate parameters [50,51]. Therefore, in this study, the Belehradek model and Arrhenius model were employed to construct secondary growth prediction models to characterize the effect of temperature on the maximum specific growth rate of S. pasteurii.
The Belehradek model, due to its wide applicable temperature range, is often used to construct the functional relationship between temperature and microbial growth rate as well as lag phase duration [39,52]. Its specific expression is as follows:
The Arrhenius equation was originally introduced to describe the functional relationship between temperature and chemical reaction rate [53]. It is now widely applied in the food industry because it can be used to assess the effects of storage temperature on various quality indicators [54]. The specific expression is as follows:
In Equations (5) and (6): μmax represents the maximum specific growth rate of the microorganisms; a, b, and c are model parameters; T is the temperature; and Tmin is the theoretical minimum growth temperature of the microorganisms.
2.2.6. Evaluation of Model Reliability
According to relevant statistical methods, the reliability of the models was evaluated using the root mean square error (RMSE), coefficient of determination (R2), Akaike information criterion (AIC), mean squared error (MSE), accuracy factor (Af), and bias factor (Bf) [55,56]. In the primary model, RMSE was used to measure the dispersion and agreement between the observed and model-predicted values. An RMSE value closer to 0 indicates better goodness-of-fit of the model to the observed data [57]. The coefficient of determination (R2) was employed to evaluate the correlation between the observed and predicted values and to assess the overall fitting performance of the predictive model. The value of R2 ranges from 0 to 1, and a value closer to 1 indicates higher fitting accuracy and greater predictive reliability of the model [58]. The AIC was used to evaluate both the complexity of the predictive model and the goodness-of-fit to the experimental data. A smaller AIC value indicates better model performance [59,60]. In the secondary model, MSE was applied to evaluate the variability of the data, where a smaller MSE value indicates higher fitting accuracy of the model [61,62]. The Af and Bf values were used to determine the agreement and deviation between the predicted and observed values. Values of Af and Bf closer to 1 indicate more accurate model fitting results [63,64,65]. The specific equations for each evaluation index are presented as follows:
In the equations: SSE is the sum of squared errors; SST is the total sum of squares; ypred is the predicted value of the model; yobs is the observed value; and n is the total number of samples.
3. Results and Discussion
This section analyzes and discusses the growth characteristics of Sporosarcina pasteurii ATCC-11859 in the PAC seawater-based drilling fluid system over the temperature range of 4–10 °C and develops corresponding growth models. Primary growth models are fitted and compared based on the growth patterns of S. pasteurii at different temperatures to identify the model that best describes its observed growth behavior. A secondary growth kinetic model is then developed to investigate the effect of temperature on the maximum specific growth rate and evaluate the applicability of the developed models.
3.1. Growth Characteristics of Sporosarcina pasteurii in Different Culture Media
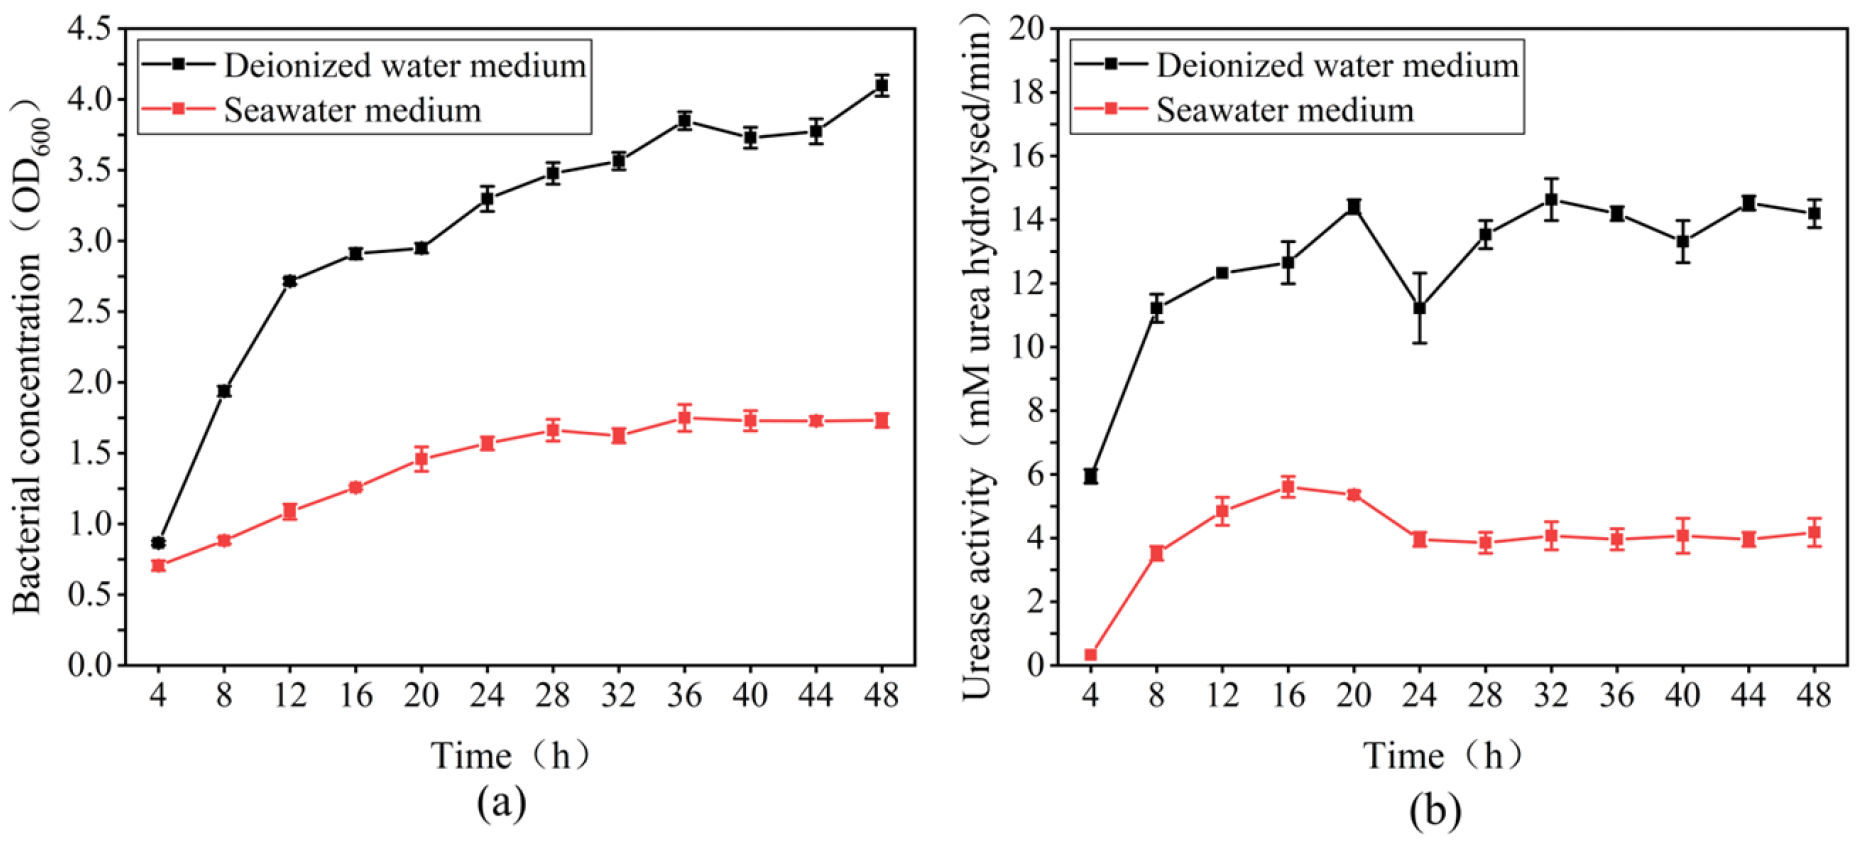
The microbial growth cycle can generally be divided into four phases: the lag phase, exponential phase, stationary phase, and death phase [66]. As shown in Figure 2, S. pasteurii exhibited no obvious lag phase and entered the exponential growth phase directly in the deionized water-based liquid medium, showing rapid proliferation, accompanied by significant increases in bacterial concentration and urease activity. At this stage, the growth rate reached its peak and metabolic activity was the most vigorous. After 12 h, due to nutrient depletion and accumulation of harmful metabolites, the growth rate gradually decreased, the increase in bacterial concentration declined, and urease activity gradually stabilized, entering the stationary phase. No death phase was observed within 48 h. Compared with freshwater environments, seawater contains abundant corrosive salts such as NaCl. The high-salinity environment readily creates an osmotic pressure difference relative to the intracellular environment of microorganisms, altering microbial morphology and exerting significant inhibitory effects on microbial growth and reproduction [67,68,69]. Therefore, although the exponential growth phase of S. pasteurii in seawater-based liquid medium was prolonged to 24 h, the maximum growth rate decreased significantly. At 48 h, the bacterial concentration 1.731 and the urease activity was 4.18 mM/min. These values were only approximately 42% and 29% of those obtained in the deionized-water-based liquid medium at the same time point (4.098 and 14.19 mM/min, respectively).
Figure 2.
Growth curves of S. pasteurii in different culture media at 30 °C over 48 h. ((a): bacterial concentration; (b): urease activity).
3.2. Growth Characteristics of Sporosarcina pasteurii in PAC Seawater-Based Drilling Fluid at 4–10 °C
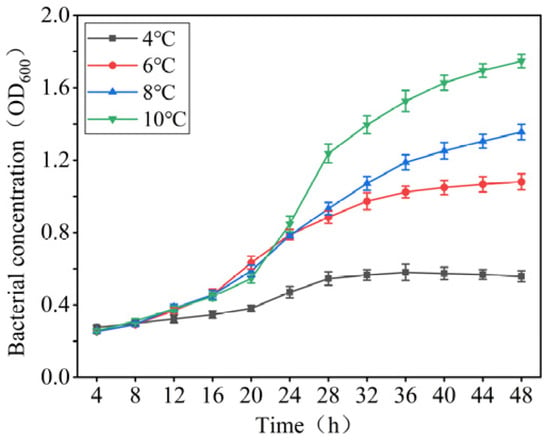
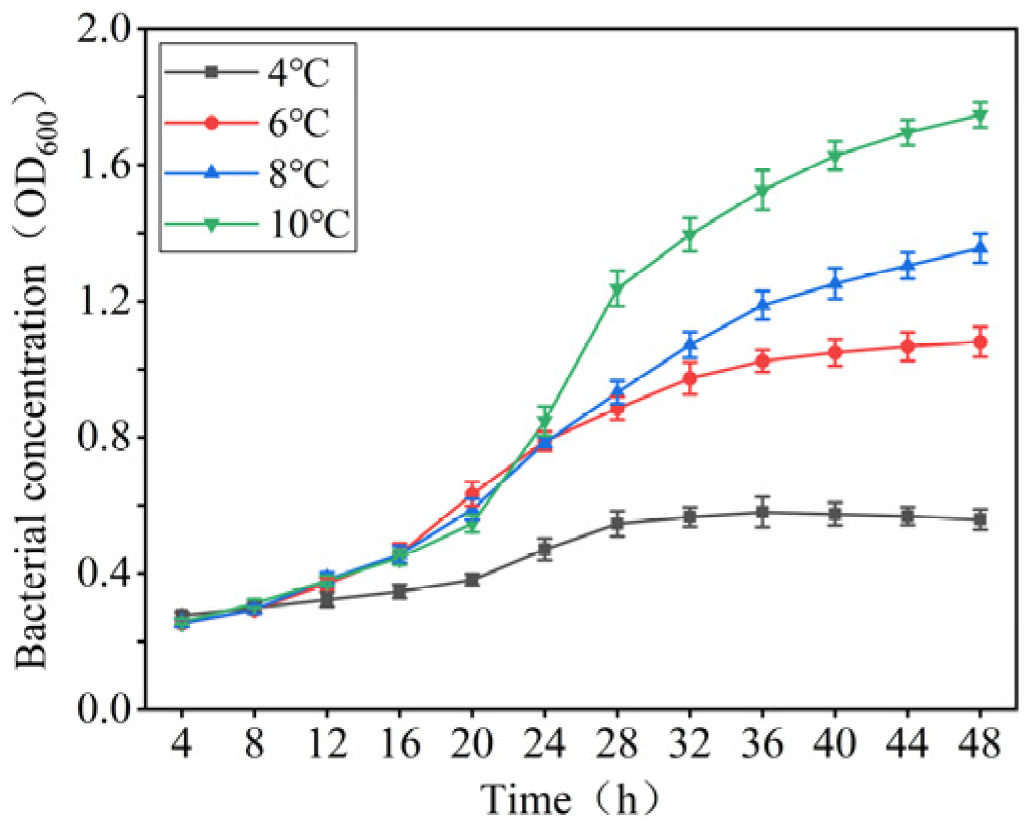
The 48 h growth curves of S. pasteurii in PAC seawater-based drilling fluid at different temperatures are shown in Figure 3.
Figure 3.
Growth curves of S. pasteurii in PAC seawater-based drilling fluid over 48 h.
As shown in Figure 2 and Figure 3, temperature exerted a significant inhibitory effect on the growth and proliferation of S. pasteurii. From a microbial physiological perspective, low temperatures generally reduce the rates of intracellular enzymatic reactions and affect physiological processes such as cell membrane fluidity, transmembrane transport, and energy metabolism. These effects restrict the uptake and utilization of nutrients as well as biosynthetic activities, thereby delaying cell growth and proliferation [70]. Meanwhile, for non-obligate psychrotrophic microorganisms such as S. pasteurii, low temperatures may increase the physiological adjustment required to maintain normal cellular functions and adapt to environmental changes, thereby prolonging the adaptation phase and reducing the overall growth rate [71]. Consequently, in PAC seawater-based microbial drilling fluids at 4–10 °C, S. pasteurii exhibited differences in lag-phase duration within the first 20 h, with the lag phase becoming longer as the temperature decreased, although bacterial growth still occurred. At 6 °C, 8 °C and 10 °C, the lag phase lasted approximately 8 h, followed by the exponential growth phase. Specifically, the bacterial concentration of S. pasteurii reached 1.747 at 48 h under 10 °C. In contrast, at 4 °C, the lag phase was prolonged to nearly 20 h, the exponential growth phase of S. pasteurii was significantly shortened, and the maximum growth rate decreased sharply. The strain entered the stationary phase after 28 h, with a bacterial concentration of only 0.558 at 48 h.
3.3. Growth Kinetic Model of Sporosarcina pasteurii
3.3.1. Primary Growth Model
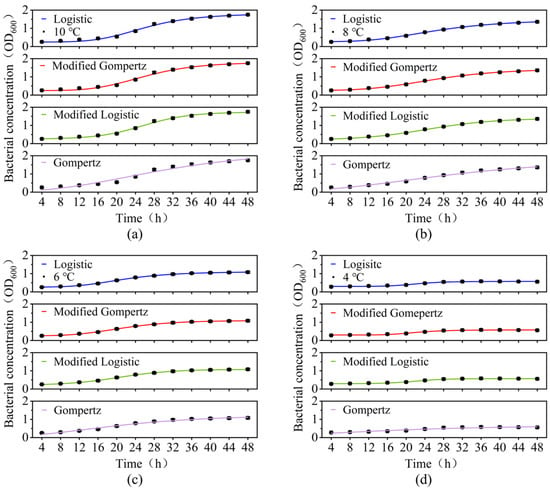
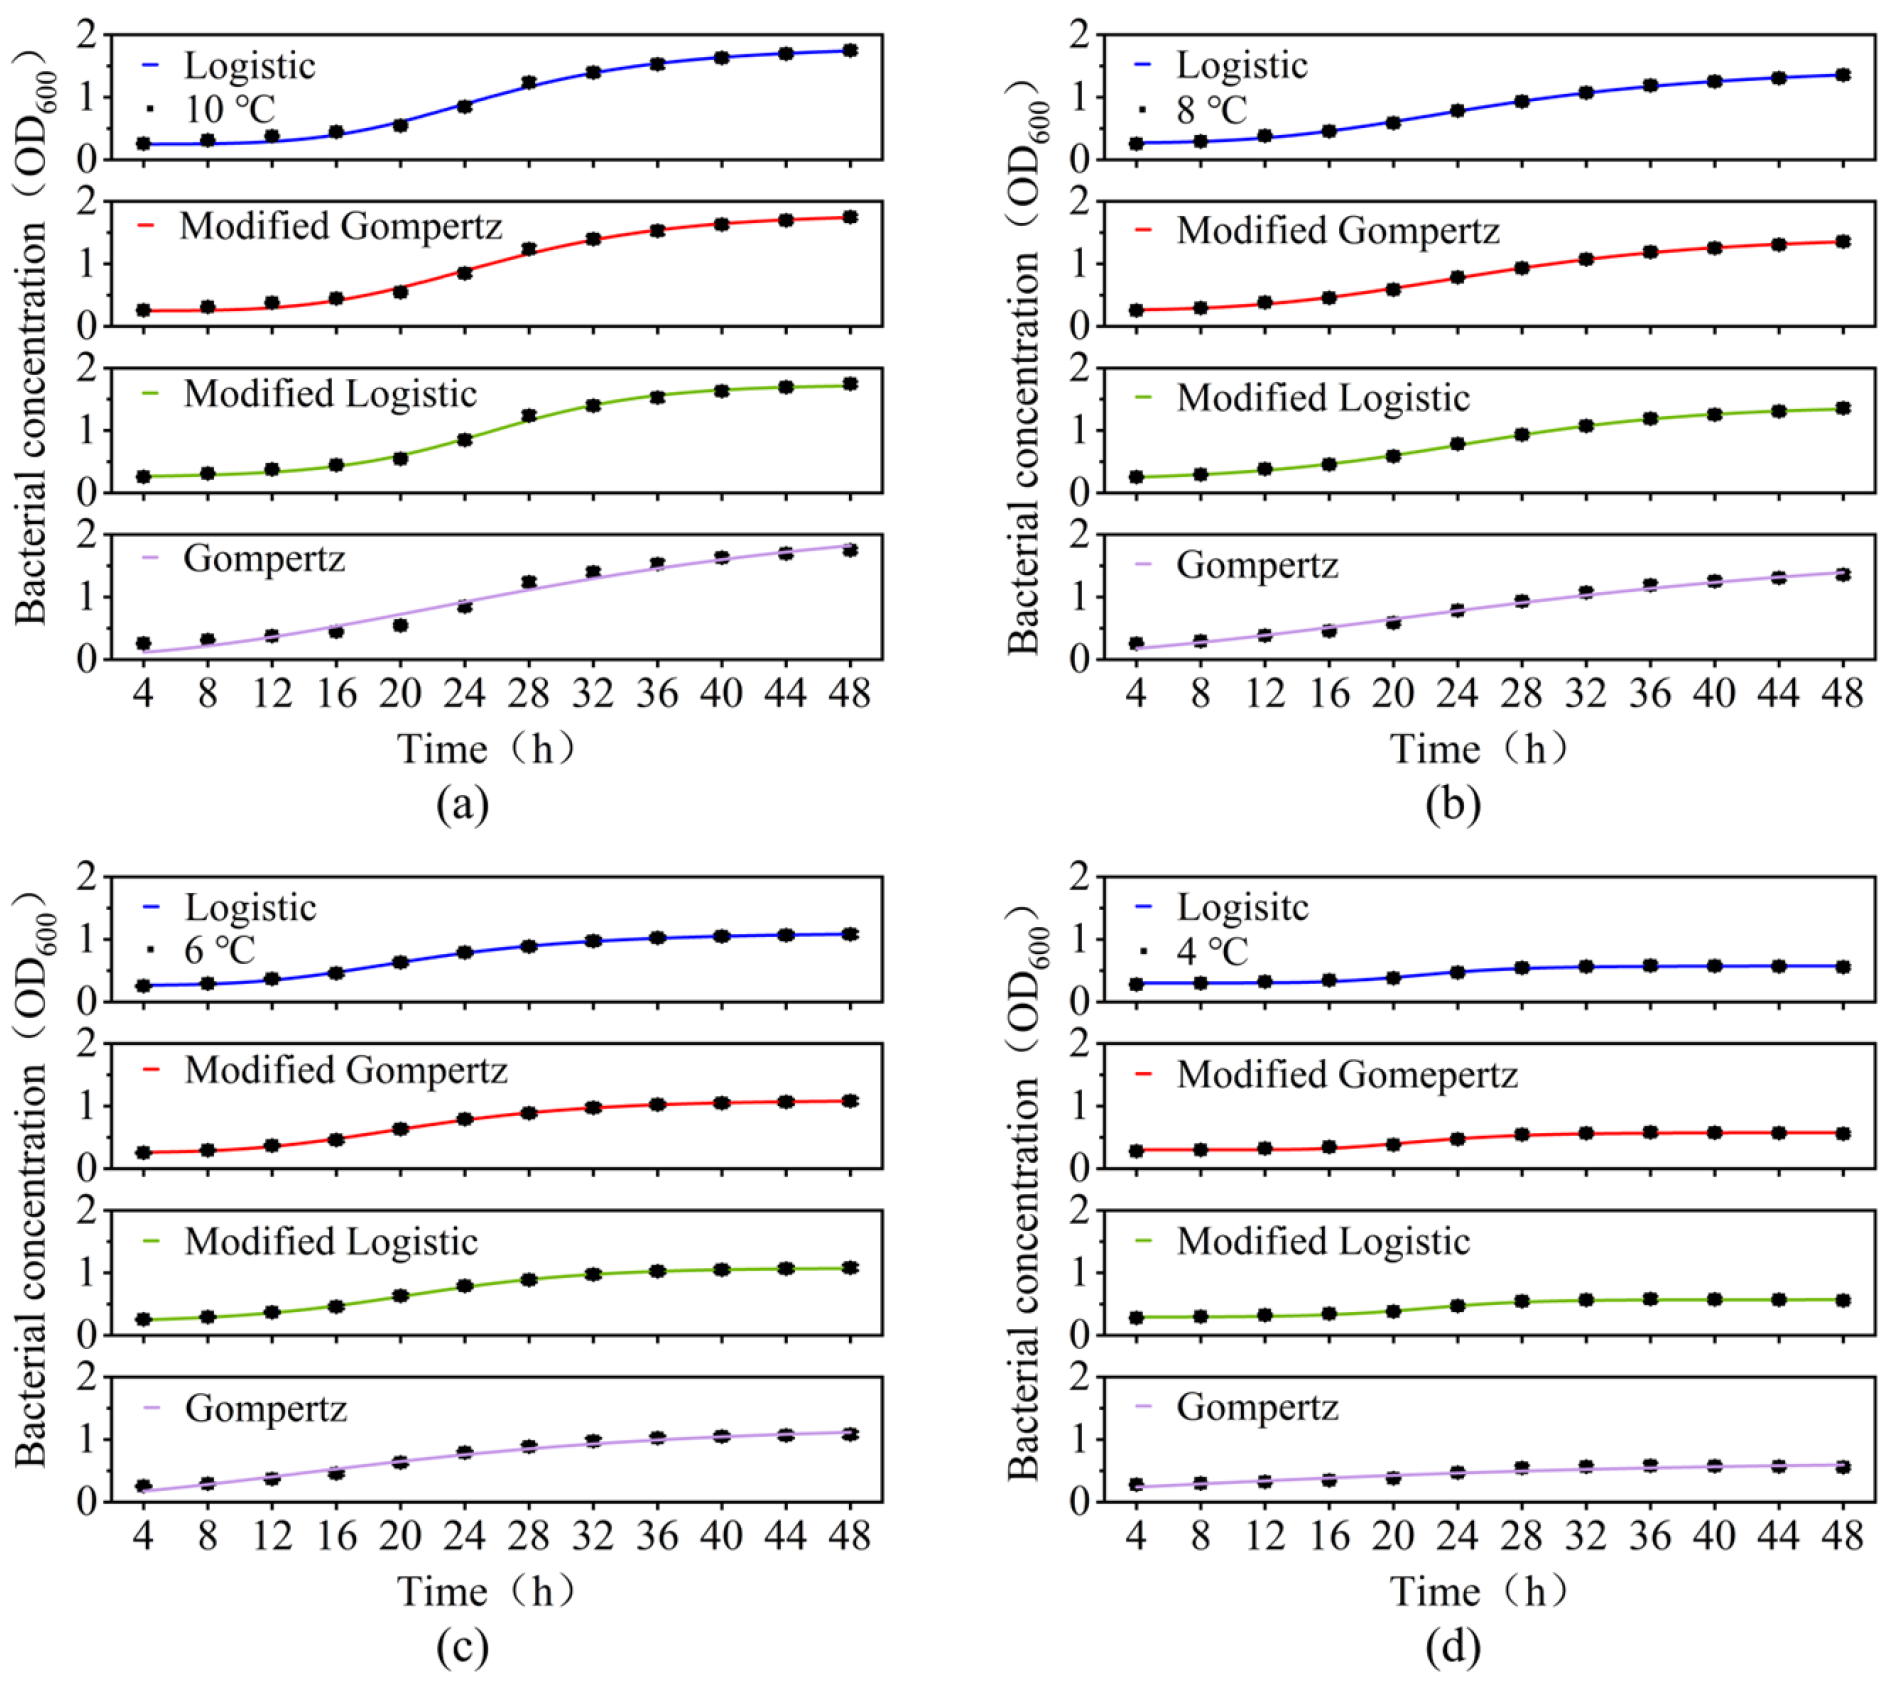
To minimize the influence of random fluctuations in individual experiments on the analysis of overall growth trends and facilitate the convergence of the model-fitting procedure, the mean bacterial concentration at each time point, calculated from three independent culture experiments over the 48 h experimental period, was used for model fitting. These mean values were intended only to characterize the overall growth trend and could not fully represent the biological variability among independent cultures. The fitting curves of the four primary growth models for S. pasteurii in PAC seawater-based drilling fluid under different temperature conditions are presented in Figure 4.
Figure 4.
Fitting curves of the primary growth predictive models for S. pasteurii at different temperatures. ((a): 10 °C; (b): 8 °C; (c): 6 °C; (d): 4 °C).
Previous studies have shown that the Logistic and modified Gompertz models can accurately describe the growth of S. pasteurii in solid-free drilling fluids at temperatures ranging from 30 to 50 °C [44,45]. As shown in Figure 4, these two models also exhibited a good fit for the growth data of S. pasteurii in PAC seawater-based drilling fluid at temperatures ranging from 4 to 10 °C. Meanwhile, all four models, including the modified Logistic and Gompertz models, provided good fits to the growth data of S. pasteurii in this drilling fluid system at all four temperatures. Within 48 h, consistent with the growth characteristics of S. pasteurii at moderate temperatures, the bacterial concentration exhibited an increasing trend over time at all temperatures ranging from 4 to 10 °C. However, as the temperature decreased, the maximum growth rate gradually declined, and the bacterial concentration (OD600) at 48 h correspondingly decreased. The coefficients of determination (R2) of the four primary growth models are presented in Figure 4.
Based on Figure 4 and Table 3 and Table 4, which present the parameter estimates and confidence intervals of the four primary growth models, preliminary comparisons indicate that the four primary growth models differ to some extent in their fitting performance and parameter estimation accuracy within the temperature range of 4–10 °C. The coefficients of determination (R2) of the modified Logistic model at 4, 6, 8, and 10 °C were 0.98809, 0.99891, 0.99908, and 0.99530, respectively, all of which were higher than those of the other three models. Meanwhile, the confidence intervals of its maximum specific growth rate parameter (μmax) were [0.036, 0.065], [0.066, 0.075], [0.061, 0.069], and [0.078, 0.108], respectively. These intervals were relatively narrow, indicating good precision in estimating the maximum specific growth rate. Compared with the modified Logistic model, the modified Gompertz model also exhibited a relatively high goodness of fit. However, its confidence intervals for the maximum specific growth rate parameter were wider at all four temperatures, indicating greater uncertainty in parameter estimation. The Logistic model exhibited the second-highest overall goodness of fit, following the modified Logistic model, and its main parameters had relatively reasonable confidence intervals, suggesting good stability in parameter estimation. In contrast, the Gompertz model showed greater uncertainty in parameter estimation under low-temperature conditions. In particular, its goodness of fit decreased markedly at 4 °C, and the confidence interval of parameter t0 crossed zero.
Table 3.
R2 values of four primary growth models at different temperatures.
Table 4.
Parameter estimates and confidence intervals of the four primary growth models.
Based on these comparisons, the modified Logistic and Logistic models were selected for further evaluation. Their other model evaluation metrics under the temperature range of 4–10 °C were further compared (Table 5) to determine which model was more suitable for describing the growth process of S. pasteurii in low-temperature PAC seawater-based drilling fluid.
Table 5.
Evaluation index parameters of the two Logistic models at different temperatures.
According to the data presented in Table 5, within the temperature range of 4–10 °C, the root mean square error (RMSE) values of the modified Logistic model ranged from 0.00009 to 0.01487, remaining below 0.015, while the corresponding R2 values exceeded 0.98. In contrast, the RMSE values of the Logistic model ranged from 0.00119 to 0.02362, with generally higher RMSE values and lower R2 values, indicating that the modified Logistic model achieved a higher fitting accuracy for the 48 h growth curves of S. pasteurii. Furthermore, comparison of the Akaike information criterion (AIC) values of the two models revealed that the AIC values of the modified Logistic model ranged from −93.87389 to −66.60236 were consistently lower than those of the Logistic model. Therefore, compared with the Logistic model, the modified Logistic model provided a more accurate description of the growth behavior of S. pasteurii in PAC seawater-based drilling fluid. The equations of the primary growth predictive models at different temperatures are listed in Table 6.
Table 6.
Modified Logistic model equations at different temperatures.
3.3.2. Secondary Growth Kinetic Model
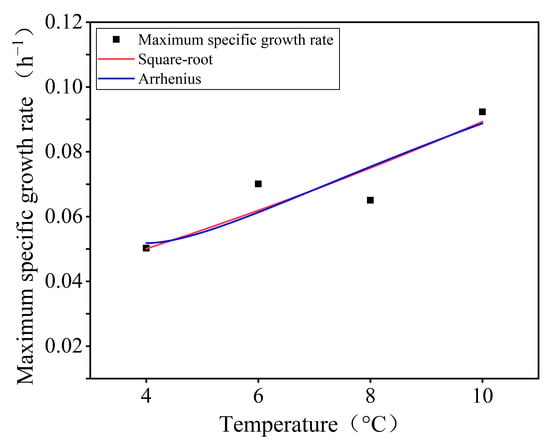
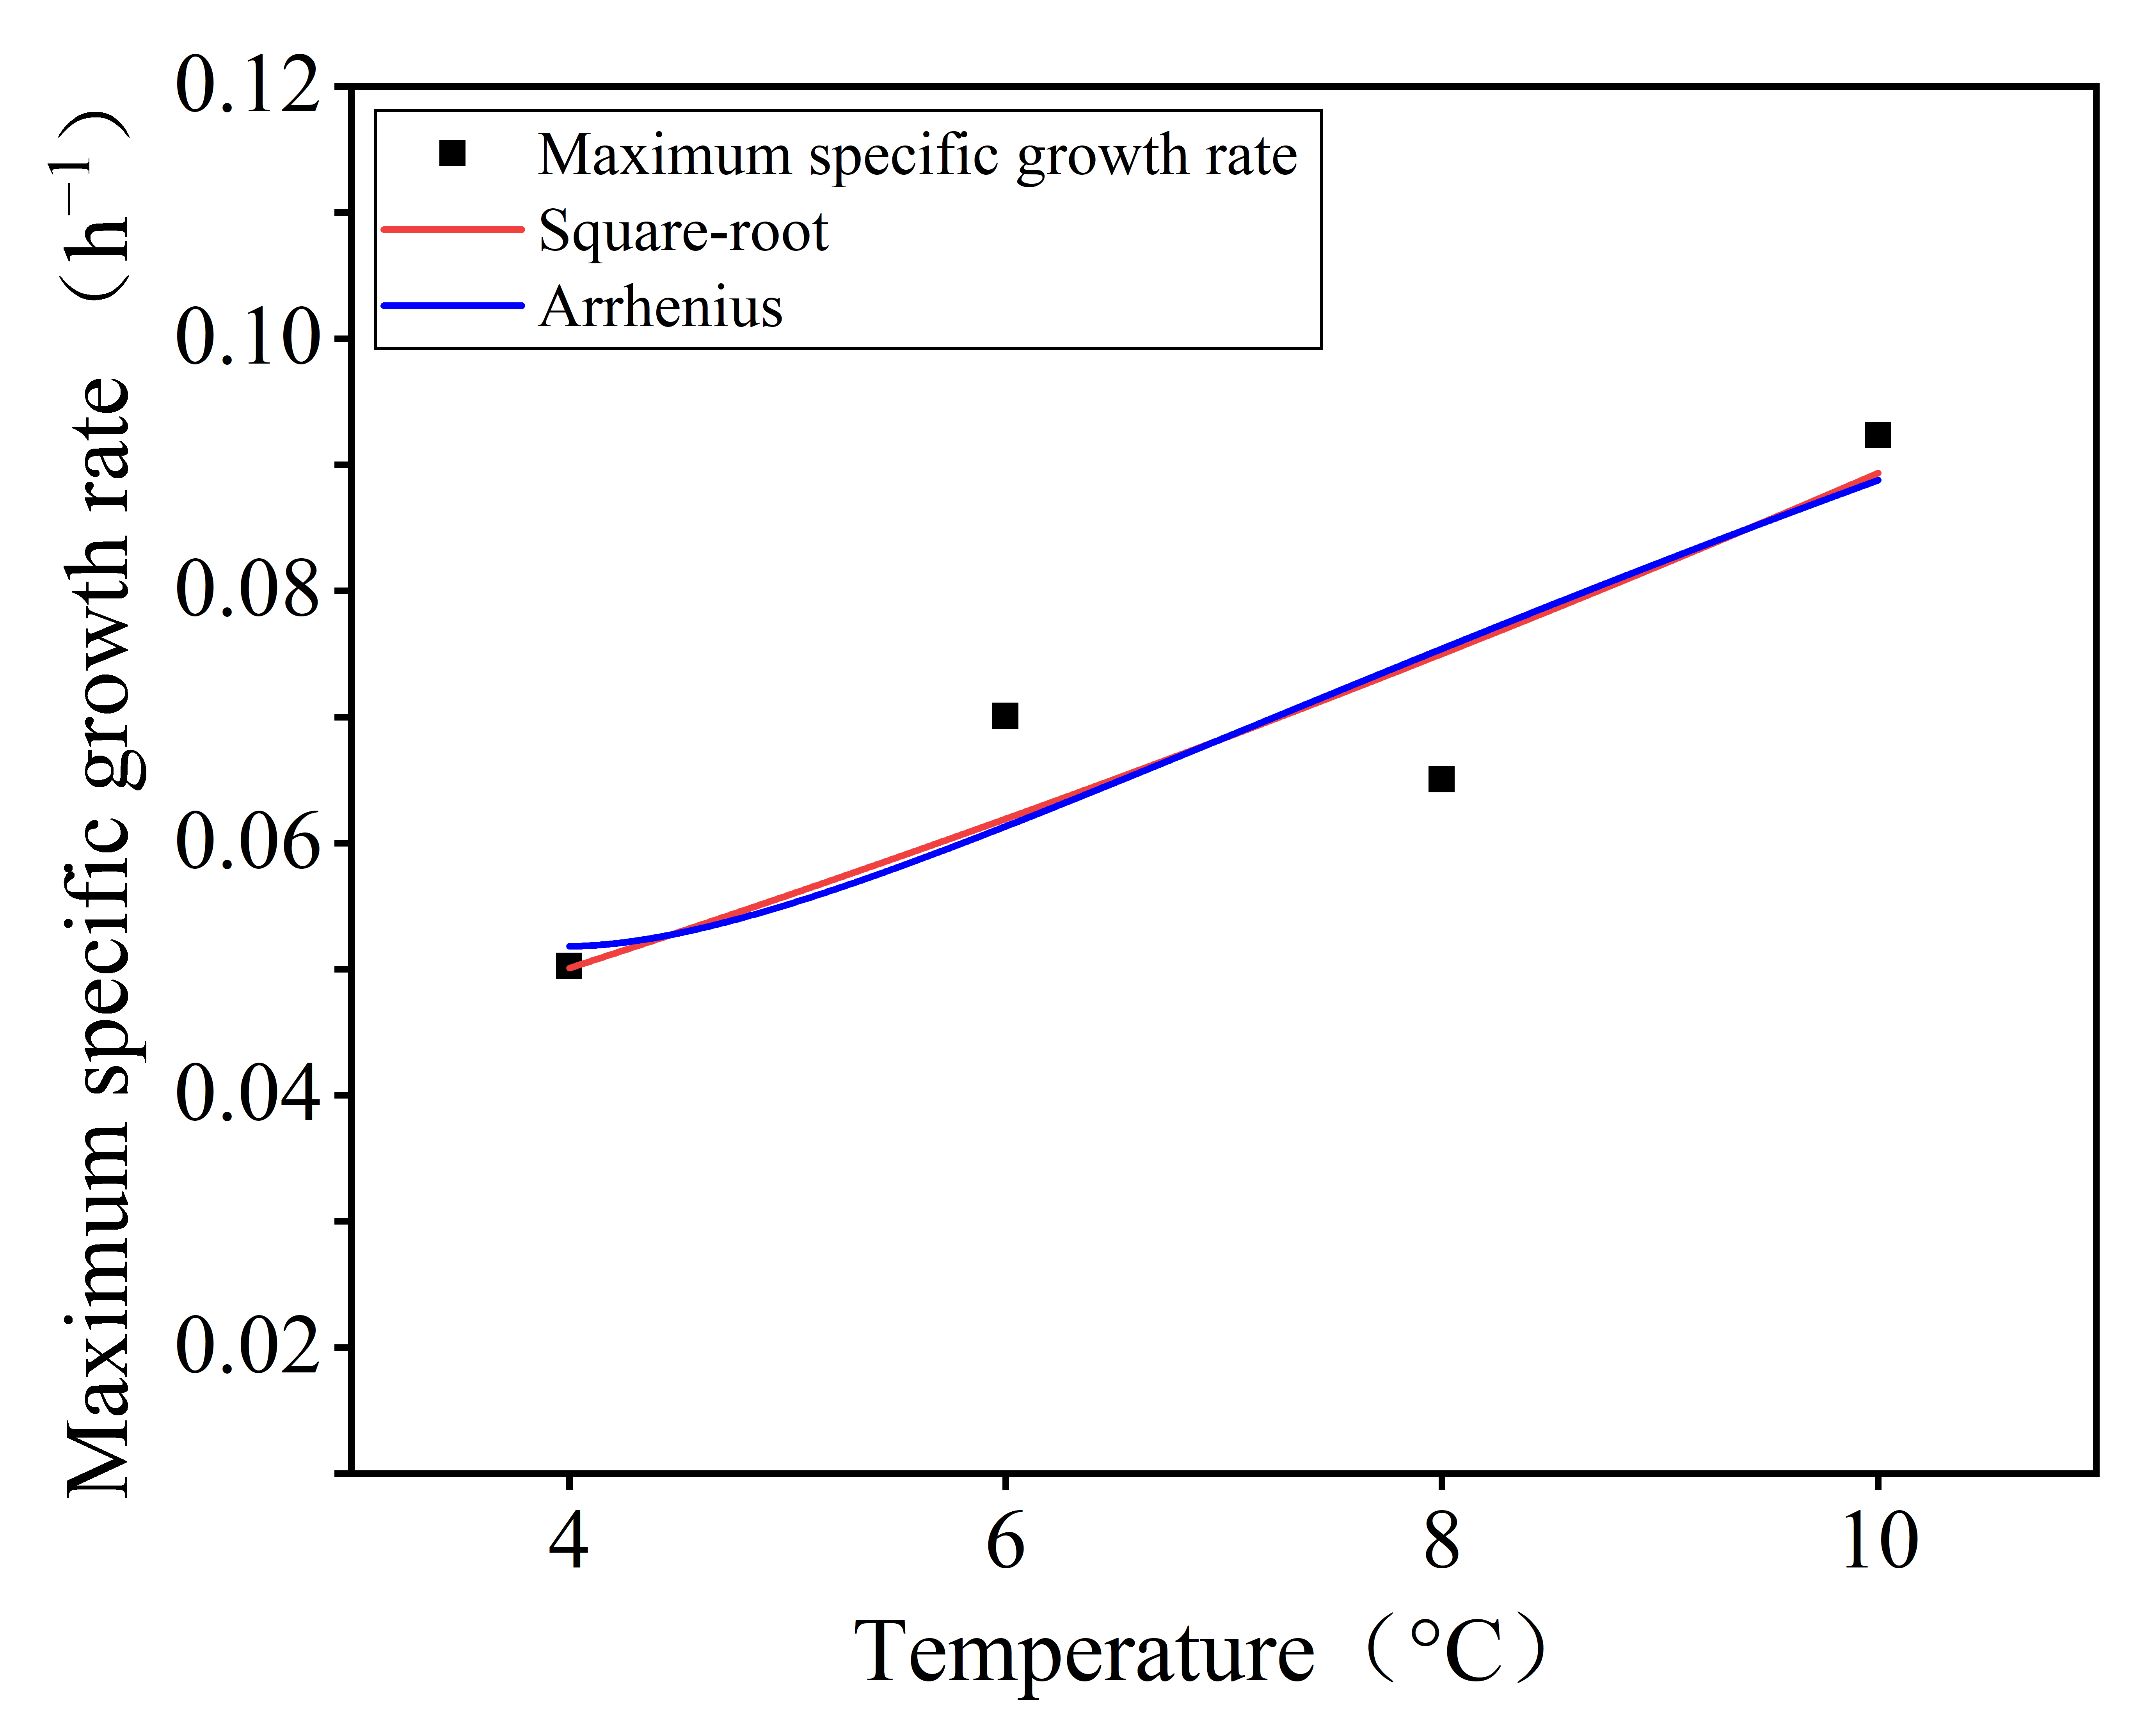
Since the primary growth model only describes the variation in the concentration of S. pasteurii with time at a specific temperature and does not directly reflect the influence of temperature on bacterial growth, two secondary growth kinetic models, namely the square-root model and the Arrhenius model, were employed to fit the functional relationship between temperature and the maximum specific growth rate of S. pasteurii. This approach further elucidated the effect of temperature on the growth behavior of S. pasteurii. The fitting results are presented in Figure 5, and the corresponding model evaluation parameters are listed in Table 6.
Figure 5.
Fitting curves of the secondary growth kinetic models for S. pasteurii at different temperatures.
As shown in Figure 5, within the temperature range of 4–10 °C, the growth rate of S. pasteurii was positively correlated with temperature, and the maximum specific growth rate increased with increasing temperature. Despite the limited number of temperature levels, both models provided good fits to the functional relationship between temperature and the maximum specific growth rate of S. pasteurii. However, comparison of the data in Table 7 indicates that, compared with the Arrhenius model, the square-root model exhibited a lower MSE value, with an R2 value of 0.90131, while the Af and Bf values were 1.03306 and 1.00092, respectively, both of which are closer to 1. Therefore, for the PAC seawater-based drilling fluid system, the square-root model better described the effect of temperature on the maximum specific growth rate of S. pasteurii within the temperature range of 4–10 °C. The specific equation is presented in Equation (17).
Table 7.
Evaluation parameters of the secondary growth kinetic models for S. pasteurii.
In summary, within the temperature range of 4–10 °C, the modified Logistic model provides a more accurate representation of the growth process of S. pasteurii in PAC seawater-based drilling fluid, while the square-root model effectively characterizes the relationship between the maximum specific growth rate and temperature and can be used to estimate the rate within this temperature range. Together, these models provide a basis for the quantitative characterization of S. pasteurii growth behavior under the investigated temperature conditions. Further experiments are needed to fit the primary growth models separately to each independent culture and to evaluate parameter stability by analyzing parameter variability and uncertainty among replicate experiments. These investigations will help clarify the relationship between the growth characteristics of S. pasteurii and the actual wellbore strengthening performance of PAC seawater-based microbial drilling fluid. This will provide a reference for evaluating its low-temperature MICP-based wellbore strengthening performance and promoting its application in low-temperature seawater environments. Meanwhile, additional studies involving an expanded temperature range and independent validation are required to clarify the applicability and limitations of the developed models and to establish more comprehensive guidelines for their application in drilling fluid systems.
4. Conclusions
This study investigated the growth behavior of Sporosarcina pasteurii ATCC-11859 in different culture media and in PAC seawater-based drilling fluids at different temperatures. Based on the experimental data and theoretical analysis, primary and secondary growth kinetic models for S. pasteurii in PAC seawater-based drilling fluid under different temperature conditions were established. The main conclusions are as follows:
(1) Compared with deionized water environment, the seawater environment exhibited a certain inhibitory effect on the growth of S. pasteurii. Its bacterial concentration (OD600) at 48 h was only 42% of that in the deionized water-based culture medium at the same time point.
(2) According to the growth data of S. pasteurii in the PAC seawater-based drilling fluid system at 4–10 °C, low temperatures prolonged the lag phase and inhibited the growth and reproduction of S. pasteurii. The bacterial concentration decreased with decreasing environmental temperature. However, the overall growth performance of S. pasteurii in the PAC seawater-based drilling fluid system was superior to that in the seawater system.
(3) The growth fitting results of S. pasteurii in PAC seawater-based drilling fluid demonstrated that, under low-temperature conditions of 4–10 °C, the modified Logistic model achieved higher fitting accuracy for describing the growth behavior of S. pasteurii and can therefore be regarded as the preferred model for characterizing primary growth in PAC seawater-based drilling fluid within this temperature range. In addition, the square-root model more accurately described the functional relationship between temperature and the maximum specific growth rate, and thus can be considered the preferred model for secondary growth in PAC seawater-based drilling fluid within the same temperature range.
Author Contributions
Z.L.: Conceptualization, Data curation; Methodology, Project administration, Resources, Writing—original draft, Writing—review and editing. M.W.: Formal analysis, Data curation, Investigation, Writing—original draft, Validation, Visualization. T.L.: Resources, Investigation, Formal analysis. Y.H.: Resources, Validation, Investigation. Z.D.: Supervision. All authors have read and agreed to the published version of the manuscript.
Funding
This study was funded by the Director’s Research Fund of Guangzhou Marine Geological Survey, China Geological Survey, grant number: 2024GMGS-QN-23 and the Everest Technology Research Proposal of Chengdu University of Technology, grant number: Grant No. 80000-2026ZF11411. The APC was funded by the State Key Laboratory of Geohazard Prevention and Geoenvironment Protection Independent Research Project, grant number: SKLGP2023Z012.
Institutional Review Board Statement
Not applicable.
Data Availability Statement
Data is contained within the article.
Conflicts of Interest
The authors declare that they have no known competing financial interests or personal relationships that could have appeared to influence the work reported in this paper.
References
- Su, P.B.; Liang, J.Q.; Zhang, W.; Xu, C.L.; He, H.C.; Lü, Y.Y.; Zhang, R.W.; Lai, H.F.; Yu, L. Strategy and considerations of natural gas hydrates exploration and development under the “dual carbon” target. Acta Geol. Sin. 2025, 100, 3015–3029. [Google Scholar] [CrossRef]
- Zhang, Z.B.; Li, Y.X.; Bian, H.; Li, S.; Ma, C. Coupled reservoir-wellbore production model and multi-physical field evolution mechanism for natural gas hydrate reservoirs. Acta Geol. Sin. 2025, 99, 3871–3882. [Google Scholar] [CrossRef]
- Bian, H.; Zhang, Z.B.; Li, S.D.; Pang, S.J.; Li, Y.X.; Sun, Y.M.; Li, X. Mechanisms and challenges of large-scale exploitation of natural gas hydrate in the South China Sea. J. Eng. Geol. 2025, 33, 1736–1750. [Google Scholar] [CrossRef]
- Wang, Z.G.; Dong, K.F.; Guo, Y.X.; Li, X.Y.; Wang, T.W.; Li, K.; Shi, S.S. Research progress on recovery improvement technology of natural gas hydrate reservoir in sea area. Geol. Rev. 2024, 70, 257–259. [Google Scholar] [CrossRef]
- Liu, C.L.; Meng, G.Q.; Li, C.F.; Sun, J.Y.; He, X.L.; Yang, S.X.; Liang, J.Q. Characterization of natural gas hydrate and its deposits recovered from the northern slope of the South China Sea. Earth Sci. Front. 2017, 24, 41–50. [Google Scholar] [CrossRef]
- Song, D.K.; Liu, L.L.; Wang, D. Experimental study on the sensitivity of hydraulic permeability of fine-grained sediments sampled from a gas hydrate distribution area in the northern South China Sea. Earth Sci. Front. 2024, 31, 405–414. [Google Scholar] [CrossRef]
- Qin, X.-W.; Lu, C.; Wang, P.-K.; Liang, Q.-Y. Hydrate phase transition and seepage mechanism during natural gas hydrates production tests in the South China Sea: A review and prospect. China Geol. 2022, 5, 201–217. [Google Scholar] [CrossRef] [Scilit]
- Guo, K.X.; Yan, G.L.; Zhang, C.Y.; Fu, R.; Gao, J.; Wang, B.Y.; Li, H.Y. Research status of natural gas hydrate mining technologies. Nat. Gas Oil 2025, 43, 49–57, 98. [Google Scholar] [CrossRef]
- Wu, L.Q.; Ding, W.; Zhang, T.; Su, P.B.; Ran, H. The key issues of the industrialization of natural gas hydrate. Geol. Bull. China 2026, 45, 561–574. [Google Scholar] [CrossRef]
- Zhang, H.L.; Bian, H.B.; Qi, S.X.; Wang, J.J. A comprehensive analysis of formation conditions, intrinsic properties, and mechanical responses of gas hydrate-bearing sediments. Rock Mech. Bull. 2024, 3, 100114. [Google Scholar] [CrossRef] [Scilit]
- Wang, Z.G.; Gong, J.Y.; Wu, J.X.; Yin, H.; Shi, S.S.; Yan, J.; Li, X.Y. Research progress on key technologies for drilling and completion of offshore gas hydrate. Sci. Technol. Rev. 2023, 41, 71–78. [Google Scholar] [CrossRef]
- Sun, J.S.; Zhao, K.; Liao, B.; Lyu, K.H.; Wang, J.T.; Liu, J.P.; Bai, Y.; Wang, R.; Bai, Y.R. Research progress on drilling fluids for wellbore stabilization in marine natural gas hydrate reservoirs. Nat. Gas Ind. 2025, 45, 1–16. [Google Scholar] [CrossRef]
- Guo, D.D.; Huang, F.F.; Ning, F.L.; Lu, Q.P.; Liu, Z.C.; Yu, Y.B. Research progress of scientific ocean drilling and marine hydrate drilling fluid system. Offshore Oil 2023, 43, 64–69. [Google Scholar] [CrossRef]
- Chen, L.; You, F.C.; Zhou, S.S.; Hou, S.S. Preparation and performance evaluation of solid-free constant rheological drilling fluid with reservoir protection for deep-water drilling. Oilfield Chem. 2023, 40, 1–6. [Google Scholar] [CrossRef]
- Wang, Z.Y.; Zhang, Y.Y.; Zhang, J.B.; Yang, H.M. Analysis and thought on economical drilling and production platform and safe drilling technology for natural gas hydrate in ocean. Ship Boat 2022, 33, 1–20. [Google Scholar] [CrossRef]
- Wang, X.X. Study on the Preparation and Mechanism of Wellbore Stabilizer in Water-Based Drilling Fluid for Natural Gas Hydrate Formation. Ph.D. Thesis, China University of Petroleum (Beijing), Beijing, China, 2024. [Google Scholar]
- Umar, M.; Kassim, K.A.; Chiet, K.T.P. Biological process of soil improvement in civil engineering: A review. J. Rock Mech. Geotech. Eng. 2016, 8, 767–774. [Google Scholar] [CrossRef] [Scilit]
- Cui, H.; Fan, W.J.; Xiao, Y.; Li, K.Y.; Zhao, Z.H.; Gao, Y.M.; Li, J.Y.; Gou, R.N.; Liu, H.L. Rainfall erosion resistance of slope models stabilized by biostimulated MICP technology. Chin. J. Geotech. Eng. 2026. Available online: https://link.cnki.net/urlid/32.1124.TU.20260319.1714.002 (accessed on 1 November 2026).
- Zhu, J.; Wei, R.J.; Peng, J.; Dai, D. Improvement schemes for bacteria in MICP: A review. Materials 2024, 17, 5420. [Google Scholar] [CrossRef] [Scilit] [PubMed]
- Ishara, S.; Anand, R.; Parihar, A.; Reddy, M.S.; Goyal, S. Suitability and challenges of biomineralization techniques for ground improvement. Int. J. Environ. Res. 2024, 18, 52. [Google Scholar] [CrossRef] [Scilit]
- Mitchell, A.C.; Dideriksen, K.; Spangler, L.H.; Cunningham, A.B.; Gerlach, R. Microbially enhanced carbon capture and storage by mineral-trapping and solubility-trapping. Environ. Sci. Technol. 2010, 44, 5270–5276. [Google Scholar] [CrossRef] [Scilit] [PubMed]
- Du, Z.-H.; Li, Z.-J.; Chen, J.-X.; Ma, Z.-Y.; Guo, G.-D.; Zhang, H.; Wang, S. Temperature- and alkali-resistant induced domestication of Bacillus pasteurii in drilling fluid and its borehole wall enhancement properties. Pet. Sci. 2024, 21, 4358–4375. [Google Scholar] [CrossRef] [Scilit]
- Li, Z.J.; Zhao, G.; Chen, J.X.; Liu, K.; Xiang, H.T.; Tian, Y. Growth Kinetics of Bacillus pasteurii in Solid-Free Drilling Fluids. ACS Omega 2021, 6, 25170–25178. [Google Scholar] [CrossRef] [Scilit] [PubMed]
- Hammes, F.; Verstraete, W. Key roles of pH and calcium metabolism in microbial carbonate precipitation. Rev. Environ. Sci. Biotechnol. 2002, 1, 3–7. [Google Scholar] [CrossRef] [Scilit]
- Ran, Y.L.; Wang, Y.Z.; Li, H.P.; Liu, J.K.; Ouyang, Z.K. Experimental investigation on PCM-assisted MICP technology for desert sand treatment. Constr. Build. Mater. 2025, 495, 143589. [Google Scholar] [CrossRef] [Scilit]
- Yin, L.Y.; Tang, C.S.; Xie, Y.H.; Lü, C.; Jiang, N.J.; Shi, B. Factors affecting improvement in engineering properties of geomaterials by microbial-induced calcite precipitation. Rock Soil Mech. 2019, 40, 2525–2546. [Google Scholar] [CrossRef]
- Toki, S.; Matsui, M.; Tominaga, K.; Suzuki, T.K.; Tsuchimatsu, T.; Iwasaki, W. Genomic and evolutionary factors influencing the prediction accuracy of optimal growth temperature in prokaryotes. mSystems 2026, 11, e00062-26. [Google Scholar] [CrossRef] [Scilit] [PubMed]
- Wang, Y.Z.; Wang, Y.; Konstantinou, C. Strength behavior of temperature-dependent MICP-treated soil. J. Geotech. Geoenviron. Eng. 2023, 149, 04023116. [Google Scholar] [CrossRef] [Scilit]
- Zhao, Q. Experimental Study on Soil Improvement Using Microbial Induced Calcite Precipitation (MICP). Ph.D. Thesis, China University of Geosciences (Beijing), Beijing, China, 2014. [Google Scholar]
- Li, H.Q.; Chen, Y.; Gao, Y.F.; Hou, K.; Song, L.P.; Li, J. ED-Stacking: A construction method of few-shot prediction model for beef microbial growth based on ensemble learning. Sci. Technol. Food Ind. 2025, 46, 43–55. [Google Scholar] [CrossRef]
- McMeekin, T.A.; Olley, J.; Ratkowsky, D.A.; Ross, T. Predictive microbiology: Towards the interface and beyond. Int. J. Food Microbiol. 2002, 73, 395–407. [Google Scholar] [CrossRef] [Scilit] [PubMed]
- Liu, H.; Zhou, J.X.; Fang, Y.; Gao, Y.L.; Qiu, W.F. Effects of different storage temperature and humidity on the growth of mold in paddy and establishment of growth prediction model. J. Chin. Chung-Kuo Liang Yu Hsueh Pao 2020, 35, 110–115. Available online: http://kns.cnki.net/kcms/detail/11.2864.TS.20200120.1136.030.html (accessed on 1 November 2026).
- Huang, L.; Hwang, C.A. Dynamic analysis of growth of Salmonella Enteritidis in liquid egg whites. Food Control 2017, 80, 125–130. [Google Scholar] [CrossRef] [Scilit]
- Gibson, A.M.; Bratchell, N.; Roberts, T.A. The effect of sodium chloride and temperature on the rate and extent of growth of Clostridium botulinum type A in pasteurized pork slurry. J. Appl. Bacteriol. 1987, 62, 479–490. [Google Scholar] [CrossRef] [Scilit] [PubMed]
- Chang, S.A.; Liu, Y.; Shao, L.L.; Hui, T.; Dai, R.T. Goodness-of-fit comparison of prediction models for aerobic bacterial count and shelf life prediction of pasteurized braised chicken. Meat Res. 2019, 33, 42–48. [Google Scholar] [CrossRef]
- Li, M.Y.; Tian, L.; Zhao, G.M.; Liu, Y.X. Research progress in predictive modeling of microbial growth in meat products. Meat Res. 2012, 26, 20–24. [Google Scholar]
- Zhang, Y.; Li, C.F.; Ai, Y.Q.; Chen, W.X. Study on fermentation kinetics of mead. Sci. Technol. Food Ind. 2015, 36, 136–139. [Google Scholar] [CrossRef]
- Yang, F. Prediction of the growth of fungal communities in different environments: A Gompertz model approach. IOP Conf. Ser. Earth Environ. Sci. 2021, 784, 012046. [Google Scholar] [CrossRef] [Scilit]
- Niu, Y.X.; Yun, J.M.; Bi, Y.; Wang, T.; Zhang, Y.; Liu, H.; Zhao, F.Y. Predicting the shelf life of postharvest Flammulina velutipes at various temperatures based on mushroom quality and specific spoilage organisms. Postharvest Biol. Technol. 2020, 167, 111235. [Google Scholar] [CrossRef] [Scilit]
- Cai, W.; Guan, W.; Zhan, L.; Lu, H.; Xu, C. Coexistence of Methane Hydrate and Gas Associated with the Difference in Thermodynamic Stabilities of Hydrate in the Pores of Sediments from Shenhu, South China Sea. Energy Fuels 2024, 38, 8612–8619. [Google Scholar] [CrossRef] [Scilit]
- Wu, H.; Su, X.; Yan, W. The microbial genesis of submarine gas hydrate and its microbi-ological indication. Mar. Sci. 2008, 32, 96–100. [Google Scholar]
- GB/T 16783.1-2006; Petroleum and Natural Gas Industries—Field Testing of Drilling Fluids—Part 1: Water-Based Fluids. Standardization Administration of China: Beijing, China, 2006.
- Whiffin, V.S. Microbial CaCO3 Precipitation for the Production of Biocement. Master’s Thesis, Murdoch University, Perth, Australia, 2004. [Google Scholar]
- Li, Z.J.; Hou, L.X.; Zhi, J.Z.; Zhang, S.X.; Wu, X.K. Growth kinetics of Bacillus pasteurii in Xanthan gum solid-free drilling fluid at different temperatures. Geoenergy Sci. Eng. 2023, 223, 211482. [Google Scholar] [CrossRef] [Scilit]
- Li, Z.J.; Wu, X.K.; Zhang, S.X.; Du, Z.H.; Ma, Z.Y.; Tan, J.P.; Li, Y.Y. Growth kinetic model of Bacillus pasteurii under different pH and temperature conditions in sodium carboxymethyl cellulose solid-free drilling fluid. Geoenergy Sci. Eng. 2023, 231, 212372. [Google Scholar] [CrossRef] [Scilit]
- Pei, P.G.; Xiong, K.; Ye, H.; Wang, X.Y.; Zhao, Z.Y.; Liu, J.Y.; Deng, L. Advances in prediction models of microbial and mycotoxin contamination in the grain and oil foods. Chung-Kuo Liang Yu Hsueh Pao 2020, 35, 179–187. Available online: http://kns.cnki.net/kcms/detail/11.2864.TS.20200120.0901.008.html (accessed on 1 November 2026).
- Ratkowsky, D.A.; Lowry, R.K.; McMeekin, T.A.; Stokes, A.N.; Chandler, R.E. Model for bacterial culture growth rate throughout the entire biokinetic temperature range. J. Bacteriol. 1983, 154, 1222–1226. [Google Scholar] [CrossRef] [Scilit] [PubMed]
- Arrhenius, S. Über die Reaktionsgeschwindigkeit bei der Inversion von Rohrzucker durch Säuren. Z. für Phys. Chem. 1889, 4, 226–248. [Google Scholar] [CrossRef] [Scilit]
- Rosso, L.; Lobry, J.R.; Flandrois, J.P. An unexpected correlation between cardinal temperatures of microbial growth highlighted by a new model. J. Theor. Biol. 1993, 162, 447–463. [Google Scholar] [CrossRef] [Scilit] [PubMed]
- Chu, Y.M.; Tan, M.T.; Yi, Z.K.; Ding, Z.Y.; Yang, D.Z.; Xie, J. Shelf-life prediction of glazed large yellow croaker (Pseudosciaena crocea) during frozen storage based on Arrhenius model and long-short-term memory neural networks model. Fishes 2021, 6, 39. [Google Scholar] [CrossRef] [Scilit]
- Wang, W.; Zhao, W.Q.; Tian, Y.; He, L.C.; Chen, Y.Y. Shelf-life prediction model of Premna microphylla Turez jelly. Food Mach. 2024, 40, 94–102. [Google Scholar] [CrossRef]
- Du, X.J.; Bai, X.P.; Jiang, Z.F.; Ma, R.Y.; Gao, X.D.; Li, X. Growth kinetics model of coliform under different storage temperatures of pitaya pulp and shelf-life prediction. Sci. Technol. Food Ind. 2018, 39, 270–275. [Google Scholar] [CrossRef]
- Elgendy, A.E.T.; Abdel-Aty, A.-H.; Youssef, A.A.; Khdher, M.A.A.; Lotfy, K.; Owyed, S. Exact solution of Arrhenius equation for non-isothermal kinetics at constant heating rate and n-th order of reaction. J. Math. Chem. 2020, 58, 922–938. [Google Scholar] [CrossRef] [Scilit]
- Liu, X.Y.; Sun, H.; Xia, N.; Liu, C.L. Storage quality analysis and shelf life prediction of steamed bread with green tea and fermented glutinous wine in different packaging method. Food Sci. Technol. 2023, 48, 147–154. [Google Scholar] [CrossRef]
- Wang, J.; Dong, Q.L.; Ding, T. An overview of evaluation methods for predictive microbial growth models. Food Sci. 2011, 32, 268–272. [Google Scholar]
- Aho, K.; Derryberry, D.; Peterson, T. Model selection for ecologists: The worldviews of AIC and BIC. Ecology 2014, 95, 631–636. [Google Scholar] [CrossRef] [Scilit] [PubMed]
- Huang, L. Thermal inactivation of Listeria monocytogenes in ground beef under isothermal and dynamic temperature conditions. J. Food Eng. 2009, 90, 380–387. [Google Scholar] [CrossRef] [Scilit]
- Staerk, C.; Klinkhammer, H.; Wistuba, T.; Maj, C.; Mayr, A. Generalizability of polygenic prediction models: How is the R2 defined on test data? BMC Med. Genom. 2024, 17, 132. [Google Scholar] [CrossRef] [Scilit] [PubMed]
- Li, Y.J.; Han, Z.Q.; Liu, Z.Y.; Ji, H.; Wan, Y.F. Construction of a growth kinetics model for Escherichia coli in braised chicken legs under fluctuating temperatures based on the Huang model. J. Food Saf. Qual. 2025, 16, 21–27. [Google Scholar] [CrossRef]
- Jiang, X.J.; Shi, J.Y.; Zhan, J.; Xu, Y.T.; Tian, J.L.; Lei, Z.D. An empirical study on the impact of rural production-living-ecological space on villagers’ mental health: A case study of an exurban village in Xi’an. J. Hum. Settl. West China 2026, 41, 1–9. [Google Scholar] [CrossRef]
- Te Giffel, M.C.; Zwietering, M.H. Validation of predictive models describing the growth of Listeria monocytogenes. Int. J. Food Microbiol. 1999, 46, 135–149. [Google Scholar] [CrossRef] [Scilit] [PubMed]
- Jeon, E.B.; Park, S.H.; Park, S.Y. Modeling the growth of Bacillus cereus in Napa cabbage (Brassica rapa subsp. pekinensis) across different sea salt concentrations. Appl. Food Res. 2025, 5, 100660. [Google Scholar] [CrossRef] [Scilit]
- Lü, J.T.; Sun, J.; Zheng, G.H.; Han, Y.; Cheng, J.Z.; Song, H.H.; Cheng, C.Y. Characterization of the glutathione reductase from Listeria monocytogenes. Acta Microbiol. Sin. 2021, 61, 714–728. [Google Scholar] [CrossRef]
- Ross, T. Indices for performance evaluation of predictive models in food microbiology. J. Appl. Bacteriol. 1996, 81, 501–508. [Google Scholar] [CrossRef] [Scilit] [PubMed]
- Yao, X.T.; Liu, S.Y.; Xiao, X.N.; Xiao, Y.P.; Yu, X.P.; Yang, H.; Wang, W. Prediction model of Salmonella growth/survival on lettuce during storage. J. China Univ. Metrol. 2025, 36, 321–328. [Google Scholar]
- Masoodi, K.Z.; Lone, S.M.; Rasool, R.S. Growth of bacterial cultures and preparation of growth curve. In Advanced Methods in Molecular Biology and Biotechnology; Elsevier: Amsterdam, The Netherlands, 2021; pp. 163–166. [Google Scholar] [CrossRef] [Scilit]
- Fu, Q.L.; Wu, Y.J.; Liu, S.Y.; Lu, L.L.; Wang, J.F. The adaptability of Sporosarcina pasteurii in marine environments and the feasibility of its application in mortar crack repair. Constr. Build. Mater. 2022, 332, 127371. [Google Scholar] [CrossRef] [Scilit]
- Dong, B.W.; Liu, S.Y.; Yu, J.; Xiao, Y.; Cai, Y.Y.; Tu, B.X. Evaluation of the effect of natural seawater strengthening calcareous sand based on MICP. Rock Soil Mech. 2021, 42, 1104–1114. [Google Scholar] [CrossRef]
- Xiong, Y.; Xiao, Y.; Deng, H.F.; Li, J.L.; Huang, Y.N.; Zhu, W.X. Study on microbial modification of concrete cracks in seawater environment. J. Basic Sci. Eng. 2024, 32, 160–177. [Google Scholar] [CrossRef]
- D’Amico, S.; Collins, T.; Marx, J.C.; Feller, G.; Gerday, C. Psychrophilic microorganisms: Challenges for life. EMBO Rep. 2006, 7, 385–389. [Google Scholar] [CrossRef] [Scilit] [PubMed]
- de Mendoza, D. Temperature Sensing by Membranes. Annu. Rev. Microbiol. 2014, 68, 101–116. [Google Scholar] [CrossRef] [Scilit] [PubMed]

Disclaimer/Publisher’s Note: The statements, opinions and data contained in all publications are solely those of the individual author(s) and contributor(s) and not of MDPI and/or the editor(s). MDPI and/or the editor(s) disclaim responsibility for any injury to people or property resulting from any ideas, methods, instructions or products referred to in the content. |
© 2026 by the authors. Licensee MDPI, Basel, Switzerland. This article is an open access article distributed under the terms and conditions of the Creative Commons Attribution (CC BY) license.