


Abstract
Artificial intelligence (AI) increasingly informs smart-city services, yet residents can rarely see why an automated decision was made or correct it when it is wrong, so their participation remains passive. This study proposes a human-in-the-loop explainable AI (HITL-XAI) framework in which residents act as sensors, annotators, evaluators, and stewards of urban trees. Residents scan the QR marker panels already mounted on municipal trees to view each tree’s measured size and AI health grade with a plain-language explanation, report damage, adopt a tree, vote on priorities, and agree or disagree with the grade. Arborists verify every report and disagreement; verified errors are diagnosed by capture condition and translated into targeted training images, citizen-informed augmentation, capture metadata, and revised vision-language prompts. In a pilot in Pyeongtaek, Republic of Korea, 50 participants contributed 200 photographs and 374 participatory actions, including 41 damage reports and 23 tree adoptions; 84% rated the explanations understandable, and the System Usability Scale score was 78.4. Verified feedback exposed systematic seasonal, illumination, and weather errors, and the resulting updates raised health-grading accuracy on the citizen photographs, in an exploratory feedback-informed evaluation, from 78.5% to 89.0%, reduced referrals to inspectors from 21.0% to 9.5%, and increased citizen agreement with the grades from 81.5% to 91.0%. Explanations thus turn citizen disagreement into a verifiable signal that improves the service itself, moving participation from consultation towards verified co-evaluation of the AI service. Although limited to a single-city volunteer pilot, the approach offers cities that already tag their trees a low-cost, transferable route to AI services that residents can scrutinise and help improve.
1. Introduction
Smart-city programmes promise public services that respond more closely to the needs of residents, yet the data and algorithms behind many of these services remain invisible to the people they affect. Studies of smart-city development report persistent gaps in citizen participation, equitable digital access, and long-term governance [1,2], and participation is frequently confined to receiving information or submitting one-way reports, the lower rungs of Arnstein’s ladder of citizen participation [3]. The arrival of artificial intelligence (AI) in urban services widens this gap: residents are told what an automated system has decided but not why, and they have no channel through which to question or correct it. Experimental evidence indicates that explaining an automated public decision, rather than merely making the algorithm accessible, is what sustains citizens’ trust in it [4]. Trust, perceived value, and the ability to influence outcomes are precisely the factors that drive engagement with AI-supported public services [5,6], so opacity does not merely limit participation; it erodes the conditions on which participation depends.
Urban trees offer a concrete and meaningful arena in which to address this problem. Trees are visible, locally valued public assets that cool cities, reduce heat-related illness, and sequester carbon [7], and residents are already willing to contribute to their care. Citizen science in urban forestry has shown that volunteers can collect inventory data of near-expert quality [8] and rate tree health in close agreement with researchers [9], and digital traceability systems have recently engaged residents in afforestation campaigns [10]. In parallel, deep learning now makes it possible to measure a tree from a single smartphone photograph [11] and to assess the vitality of street trees from imagery at city scale [12]. What is missing is a design that connects these two developments: an AI service whose outputs citizens can understand and contest, and whose errors citizens can help to correct.
Two research strands provide the building blocks. Explainable AI (XAI) makes model reasoning inspectable [13], and human-in-the-loop (HITL) machine learning routes human judgement back into model development [14]. In most HITL systems, however, the humans are expert annotators and their feedback consists of labels. Vision-language models (VLMs) change this premise: they can state the reason for a visual assessment in plain language [15], so that a non-expert can compare the stated reason with the tree in front of them and object when the two do not match. Smart-city applications already treat citizens as agents who report issues and monitor their environment [16]; we argue that an explained output turns them into evaluators as well, whose disagreements, once professionally verified, become a diagnostic signal for the model. Because such disagreements cluster around recurring conditions, such as leaf-off winter crowns or back-lit frames, rather than around individual trees, they point to remedies that can be expected to generalise beyond the photographs that triggered them.
This paper proposes a HITL-XAI framework for citizen participation in smart-city decisions on urban trees and evaluates it in a pilot deployment in Pyeongtaek, Republic of Korea. Residents scan the QR marker panels that the city has already fixed to its trees, view each tree’s measured size and health grade together with an explanation, report damage, adopt a tree, vote on the priority of reported issues, and agree or disagree with the AI assessment. The study addresses three research questions: (RQ1) how citizens use an explainable tree-monitoring service when it is embedded in existing municipal infrastructure; (RQ2) how they perceive the usability, understandability, and trustworthiness of its explanations; and (RQ3) whether verified citizen feedback can be converted into concrete model updates that measurably improve the service.
The main contributions of this work are as follows:
- A participation-centred HITL-XAI framework that maps five citizen functions (view, report, evaluate, decide, and adopt) to the levels of Arnstein’s ladder and to data flows that reach the AI models, with the explanation as the mechanism that moves evaluation beyond consultation towards partnership.
- A condition-level feedback-to-update procedure in which arborist-verified citizen reports and disagreements are diagnosed by capture condition and translated into four update channels: targeted training data, citizen-informed augmentation, capture metadata, and prompt rules.
- An AI engine that reuses the municipal QR marker panel as tree identity, entry point, and metric scale reference, combining YOLOv8 (version 8.0.0) and SAM 3 segmentation with a dual-head (CNN and Qwen3-VL) health grader and an explained referral rule. Its contribution lies in integrating established components into a participatory service rather than in a new model architecture.
- A field pilot with 50 participants and 200 real mobile photographs that reports engagement, perceived usability and trust, the composition and precision of citizen feedback, and a cumulative analysis that traces the resulting accuracy gain through the successive update channels.
Section 2 positions the study within four bodies of work and states the gap it addresses. Section 3 presents the framework, the participation design, the pilot protocol, the feedback-to-update procedure, the AI engine, and the evaluation measures; Section 4 gives the pilot results; Section 5 interprets them and sets out their limits; and Section 6 draws the conclusions.
2. Related Work
2.1. Citizen Participation in Smart-City Decision-Making
Arnstein’s ladder distinguishes non-participation, tokenism (informing, consultation, and placation), and citizen power (partnership, delegated power, and citizen control) [3]. Applying this lens to Dublin, Cardullo and Kitchin found that most smart-city initiatives position residents as users, testers, or data points rather than as co-creators [1]. Recent studies examine how AI alters this picture. AI-driven personalisation increases citizen participation in service delivery, partly through the value that citizens perceive [5]; acceptance of AI fosters citizen co-creation indirectly, through trust and adaptability [6]; and AI can support participatory planning when institutions mediate its use [2]. On the technical side, a systematic review of smart-city applications found that most of them cast citizens as agents who report issues, monitor environmental parameters, or share opinions [16]; mobile city-reporting applications are a typical example [17], and AI–IoT crowd-sensing frameworks can now process citizen tickets at scale [18]. In all of these settings, however, the loop closes at the ticket: the citizen’s input is routed, prioritised, or answered, but it does not change the underlying AI model, and the model’s reasoning is not exposed to the citizen.
Studies of how smart-city programmes operate in practice point in the same direction. Case studies show that the “smart citizen” invoked by such programmes is often confined to a narrow, predefined role, with limited influence on how the programme itself is shaped [19], and frameworks for citizen participation in smart-city design distinguish whether citizens act as democratic participants, co-creators, or users of ICT, calling for participation that reaches the design of the services themselves [20]. Small and medium-sized cities face additional constraints of budget, staff, and technical capacity, so that their smart-city development depends on collaboration among local actors and on building upon existing assets [21]. These findings motivate two design choices of the present framework: every citizen input is traceable to a concrete change in the AI service, and the service is built on infrastructure that the city already owns.
2.2. Citizen Science and Digital Participation in Urban Forestry
Urban forestry has a long tradition of volunteer engagement, and the reliability of volunteer data is well documented. Roman et al. reported that volunteers agreed with experts on genus identification for 90.7% of trees and measured diameter at breast height (DBH) within 2.54 cm of the expert value for 93.3% of single-stem trees [8]. In a citizen-science survey of 785 urban trees in Johannesburg, the volunteers’ classification of tree health did not differ significantly from a researcher’s re-survey, and their ratings of pest infestation agreed closely with it (kappa 0.71–0.89) [9]. More recently, a participatory digital traceability system deployed in Valdivia, Chile, registered 642 trees with 240 participants and achieved System Usability Scale (SUS) scores above 80 [10]. These systems demonstrate that residents can produce reliable observations and remain engaged, but they treat citizens as data providers: the analysis is performed by experts, no AI assessment is returned to the contributor, and citizen input does not improve any model.
2.3. Explainable and Human-in-the-Loop AI
XAI research has produced a wide range of post hoc explanation methods, but these methods are seldom evaluated with the people who receive the explanations [13]; measurement frameworks therefore judge an explanation by the understanding, satisfaction, and trust of its intended users rather than by technical fidelity alone [22]. XAI has also been surveyed for smart-city applications [23], and our earlier work applied explainable deep learning to endoscopic image classification [24], where the explanation served clinicians; here the explanation serves lay residents. HITL learning encompasses active learning, interactive learning, and machine teaching [14]. In practice, its human participants are domain experts, its feedback consists of labels for individual samples, and its central question is which samples to present for labelling. VLMs can state a diagnosis in natural language [15,25], which lowers the expertise required to judge whether an output is plausible, but their answers depend on the prompt [26] and the confidence they state is often miscalibrated and overconfident [27], whereas the confidence of a conventional classifier can be calibrated by temperature scaling [28]. In this work, the VLM is therefore paired with a calibrated classifier and a reject option that defers uncertain cases to a human expert [29]. Each of these families covers only part of what a participatory service needs: post hoc saliency maps explain a classifier to experts but are difficult for residents to check, a classifier alone gives a calibrated confidence without a reason, and a VLM alone gives a reason without a dependable confidence. Combining a calibrated CNN, a VLM explanation, explicit capture metadata, and prompt-level correction is intended to provide all three properties at once: a reason that residents can check, a reliable signal for deferring to an expert, and a channel through which verified errors can be corrected. What remains unexplored is a HITL loop in which the humans are non-experts, the interface is a plain-language explanation, and the feedback is aggregated into failure conditions rather than consumed as sample-level labels.
2.4. AI-Based Tree Measurement and Health Assessment
Smartphone-based methods estimate tree structure from photographs that contain a reference object: deep learning combined with a smartphone has estimated tree height with relative errors of 0.20–10.33% [11] and DBH with relative errors of 0.29–12.62% [30]. Automated assessment of tree vitality from aerial and satellite imagery is hampered by crown overlap, shadow occlusion, and acquisition-season mismatch [12]; in ground-level photographs, seasonal and illumination changes in crown appearance add to these difficulties and are precisely the conditions under which a static model fails silently. In these studies, the AI system is the end product and its user is a trained operator; in the present work, the AI system is the medium through which citizens participate, and its failure conditions are surfaced by the citizens themselves.
2.5. Research Gap
Table 1 compares representative studies along the dimensions that matter for participatory AI: whether an AI output is delivered to citizens, whether it is explained, which roles citizens can take, and whether their feedback changes the model. No prior study combines an explained AI output delivered to citizens, multiple citizen roles, and a feedback loop that retrains the model. The framework proposed here addresses all four dimensions at once.
Table 1.
Comparison of representative studies with the proposed framework.
3. Materials and Methods
3.1. Framework Overview
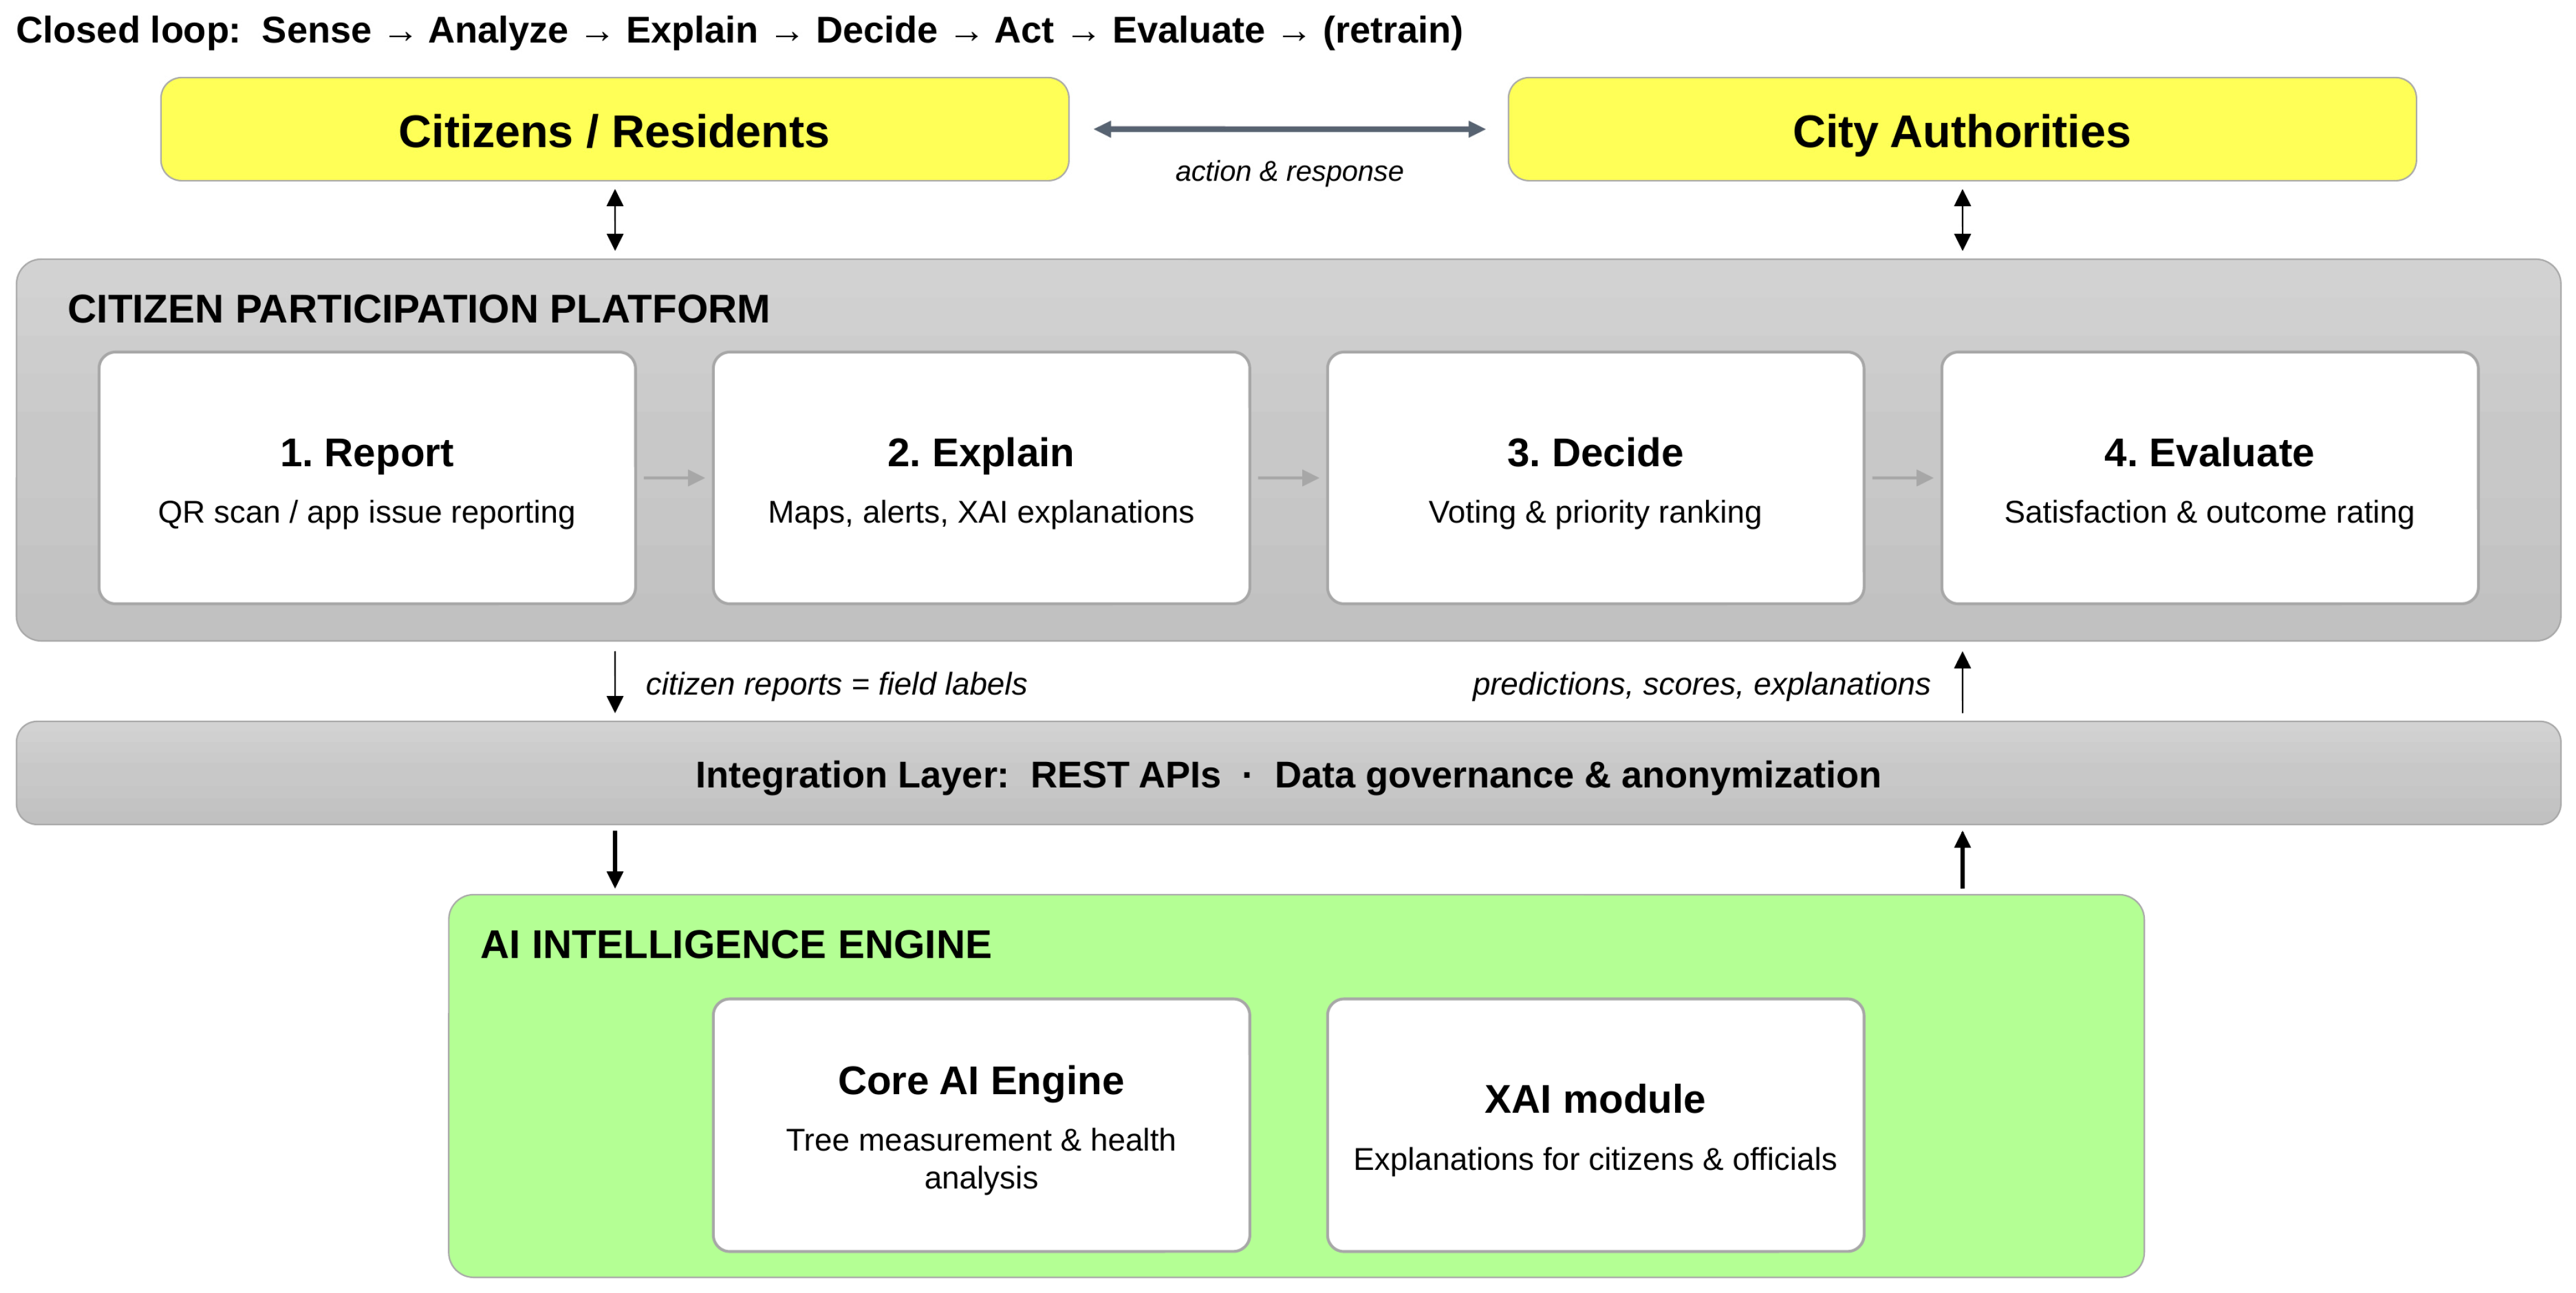
Figure 1 shows the proposed framework as a closed loop of sensing, analysis, explanation, decision, action, and evaluation, followed by retraining. Citizens and city authorities interact through a citizen participation platform with four core functions: Report (QR scan and issue reporting), Explain (maps, alerts, and XAI explanations), Decide (voting and priority ranking), and Evaluate (satisfaction and outcome rating). An integration layer of REST APIs, data governance, and anonymisation connects the platform to the AI intelligence engine, which comprises a core engine for tree measurement and health analysis and an XAI module that produces explanations for citizens and officials. Information flows in both directions: predictions, scores, and explanations flow up to the platform, and verified citizen reports flow down as field labels and update signals for the models. The loop is therefore closed twice, once between citizens and authorities (action and response) and once between citizens and the AI engine (explanation and correction).
Figure 1.
Proposed HITL-XAI framework linking the citizen participation platform, the integration layer, and the AI intelligence engine in a closed loop.
3.2. Citizen Participation Design
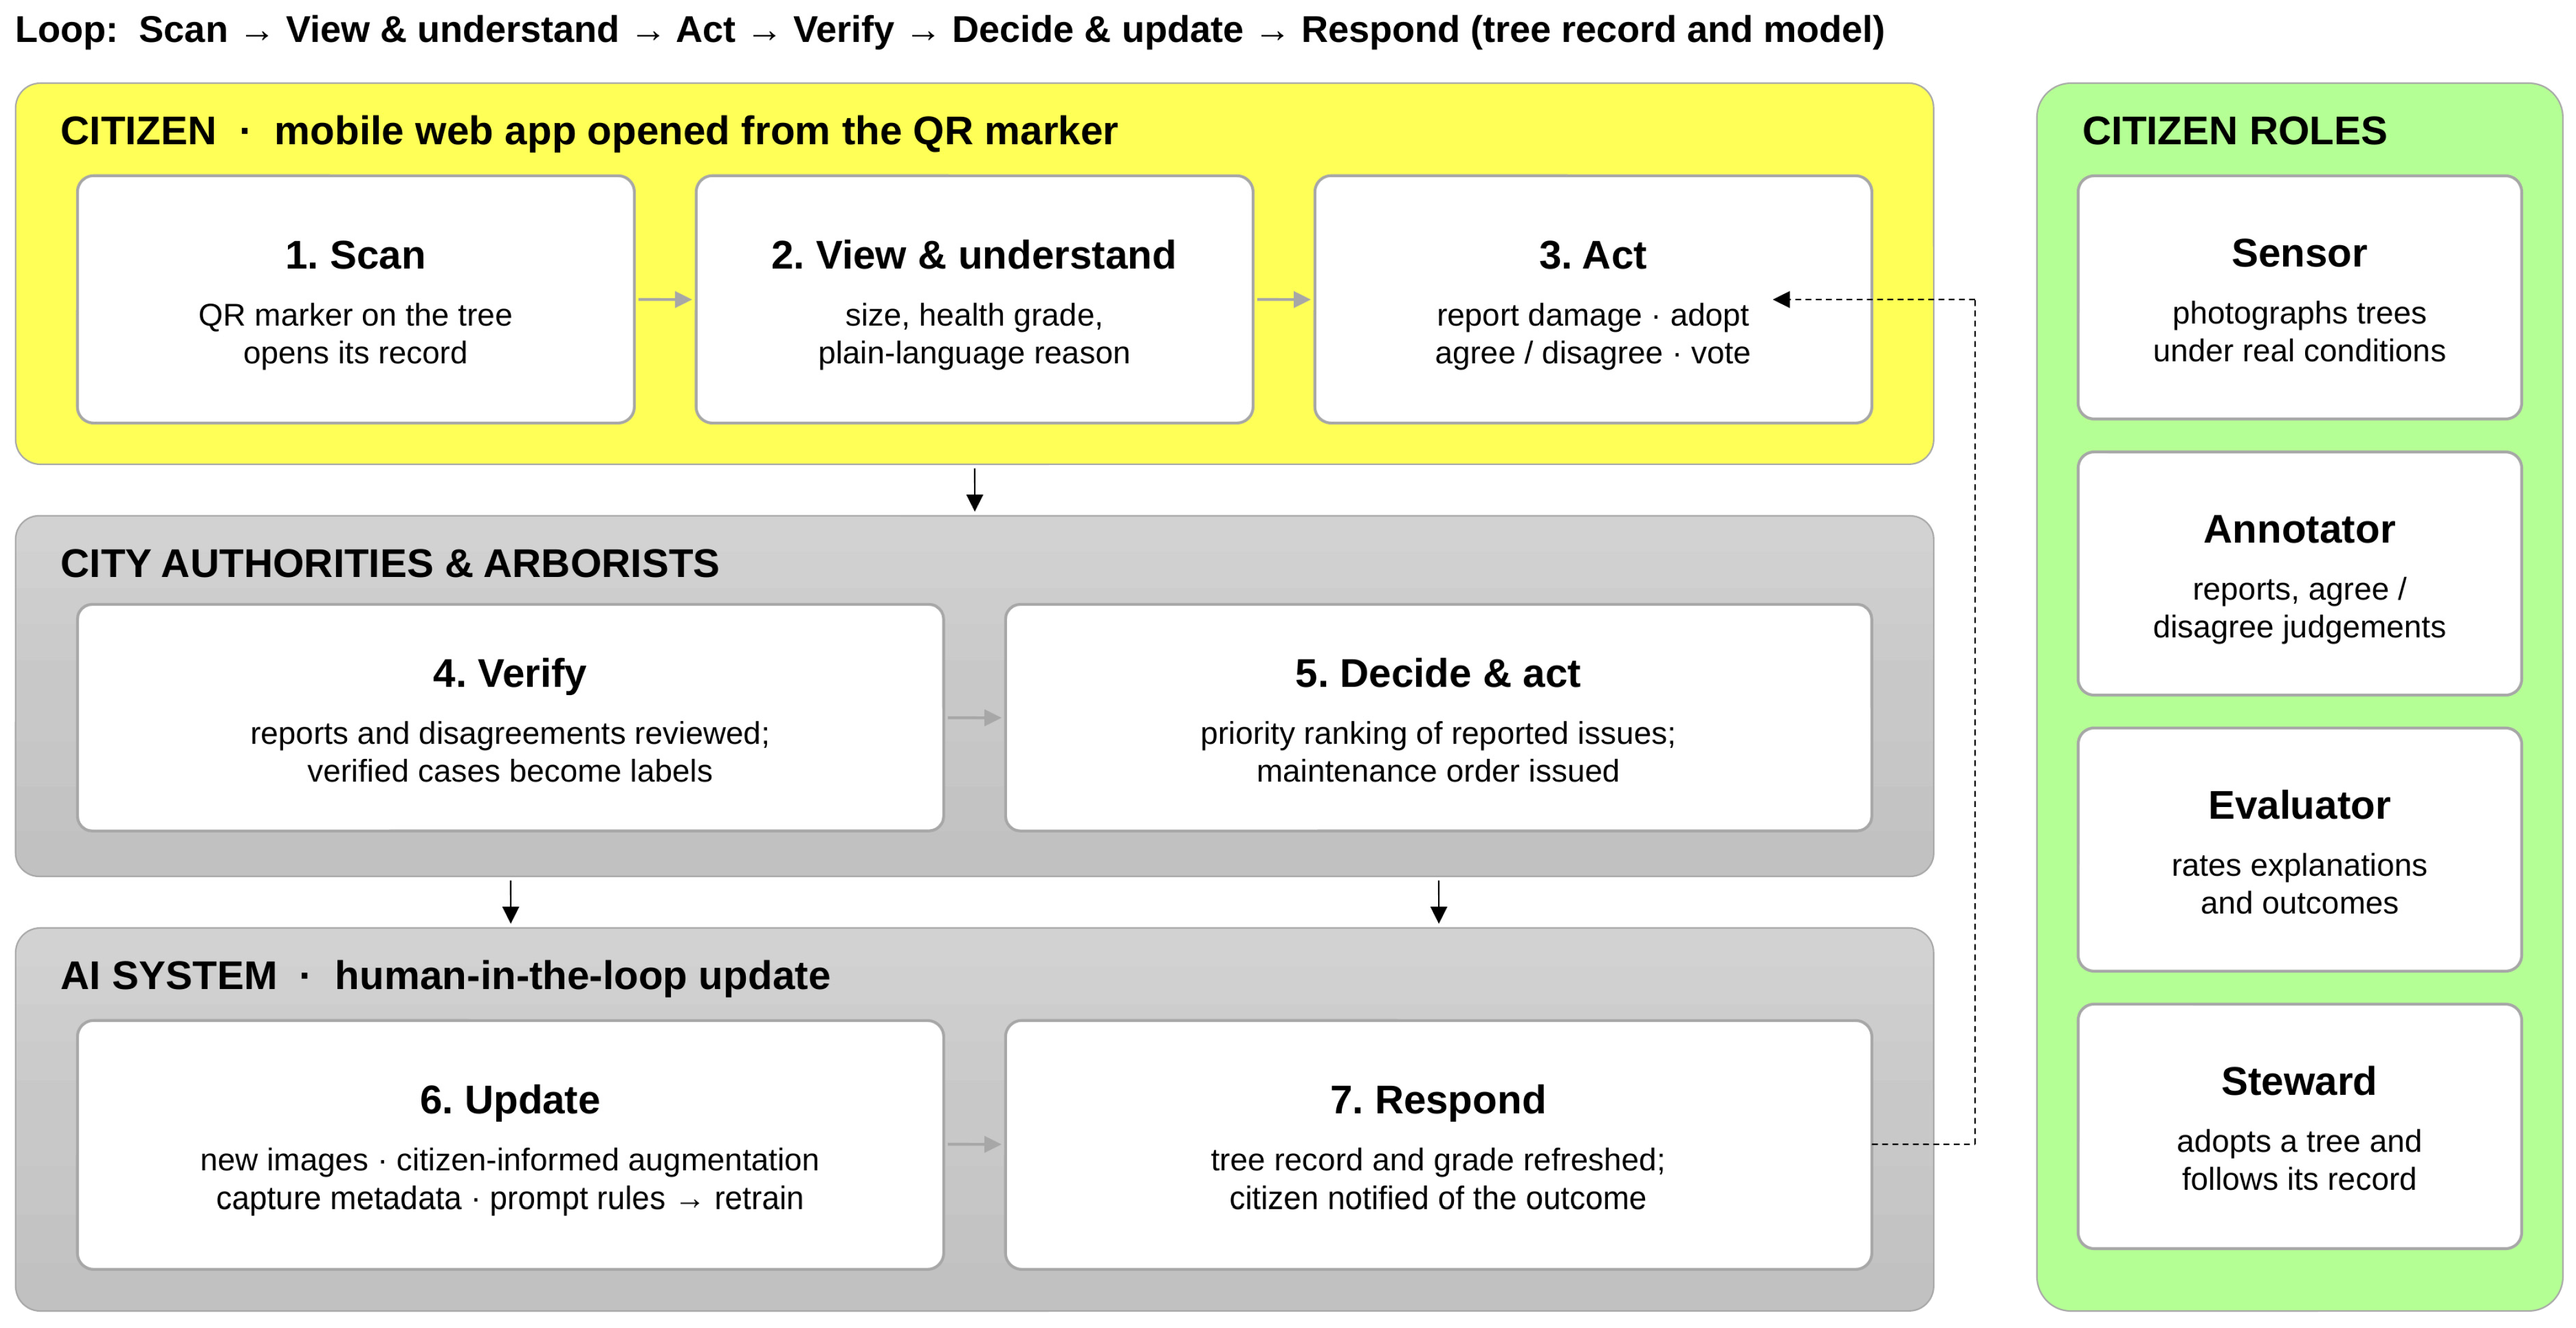
The platform is a mobile web application that opens directly from the QR code on each tree, so neither an installation nor a search for the tree is required. Figure 2 shows the resulting workflow in seven steps. A citizen scans the marker (1), views the tree’s size, health grade, and plain-language reason (2), and acts by reporting damage, adopting the tree, agreeing or disagreeing with the grade, or voting on reported issues (3). City authorities and arborists verify reports and disagreements, so that verified cases become labels (4), and rank the reported issues to issue maintenance orders (5). The AI system is updated with new images, citizen-informed augmentation, capture metadata, and prompt rules (6), and the refreshed tree record and grade are returned to the citizen, who is notified of the outcome (7).
Figure 2.
Citizen participation workflow: citizen actions are verified by arborists, drive maintenance decisions and model updates, and are answered by a refreshed tree record; the right panel lists the four citizen roles. Asterisks mark functions whose downstream effects, maintenance work orders and continued stewardship, are scheduled for the city-wide deployment (Section 3.2).
Table 2 maps each function to the data it generates, the role it gives the citizen, and its level on Arnstein’s ladder. Viewing corresponds to informing and reporting to consultation, the levels at which most reporting applications stop. Evaluating the AI grade moves towards partnership, because verified evaluations can change the model, although decisions on how the model is updated remain with professionals; votes on priorities are advisory inputs to the maintenance order and remain at the consultation level unless the city commits to act on them; and adoption offers a stewardship role in which the citizen can follow and re-photograph a specific tree over time. In the pilot, votes and adoptions were recorded as citizen inputs; their downstream effects, the issuing of maintenance work orders and the continued stewardship of adopted trees, belong to the city-wide deployment planned next (Section 5.4), so these functions are reported here as participation channels rather than as demonstrated decision-making influence. Three design principles underlie this mapping: every AI output is accompanied by a reason that a lay reader can check against the tree in front of them; every citizen judgement passes through professional verification before it acquires any weight; and every contribution receives a visible response, either a maintenance decision or a refreshed record.
Table 2.
Participation functions, generated data, and corresponding level of participation.
3.3. Study Site, Participants, and Pilot Protocol
The pilot took place in parks and green spaces of Pyeongtaek, Gyeonggi Province, Republic of Korea, within the city’s smart-city programme, in which municipal trees carry city-issued 15 × 20 cm QR marker panels mounted on the trunk at a height of 1.2 m. Fifty participants took part on a voluntary basis after giving informed consent. The pilot ran from 17 August to 28 September 2026; participants were recruited through Gachon University and the Pyeongtaek smart-city project and included university students, project staff, and local residents. Each participant photographed marked trees with their own smartphone under the lighting, weather, and seasonal conditions they encountered, yielding 200 photographs in total (four per participant on average). After each scan, participants viewed the AI result and were free to report damage, adopt the tree, vote on reported issues, and agree or disagree with the displayed grade; all actions were logged against the tree identifier. At the end of the pilot, participants completed a questionnaire comprising the ten-item SUS [31], an adapted trust-in-automation scale [32], and explanation understandability and satisfaction items [22], all on five-point Likert scales, followed by open comments. The SUS was scored by its standard 0–100 procedure [31] and the trust, understandability, and satisfaction scales as the mean of their items; the adapted trust scale was used descriptively in this pilot, and its internal consistency will be examined on the larger sample of the follow-up deployment.
Data were handled under the consent given by the participants. Photographs and participation logs were stored on an access-controlled server of the research team, accessible only to the team and the verifying arborist; participants were identified by a pseudonymous code rather than by name; participants were asked not to include people in the frame, and any faces or licence plates captured incidentally were blurred before storage; and the data are retained only for the duration of the research project. The anonymisation and privacy impact assessment procedures discussed in Section 5.3 are proposed safeguards for a city-wide deployment and were not part of the pilot.
3.4. From Citizen Feedback to Model Updates
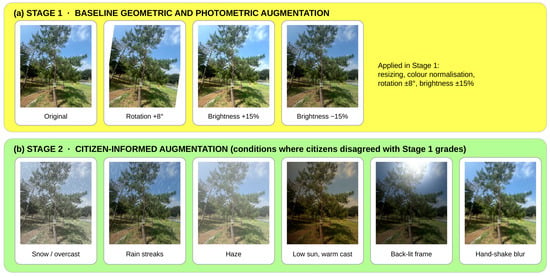
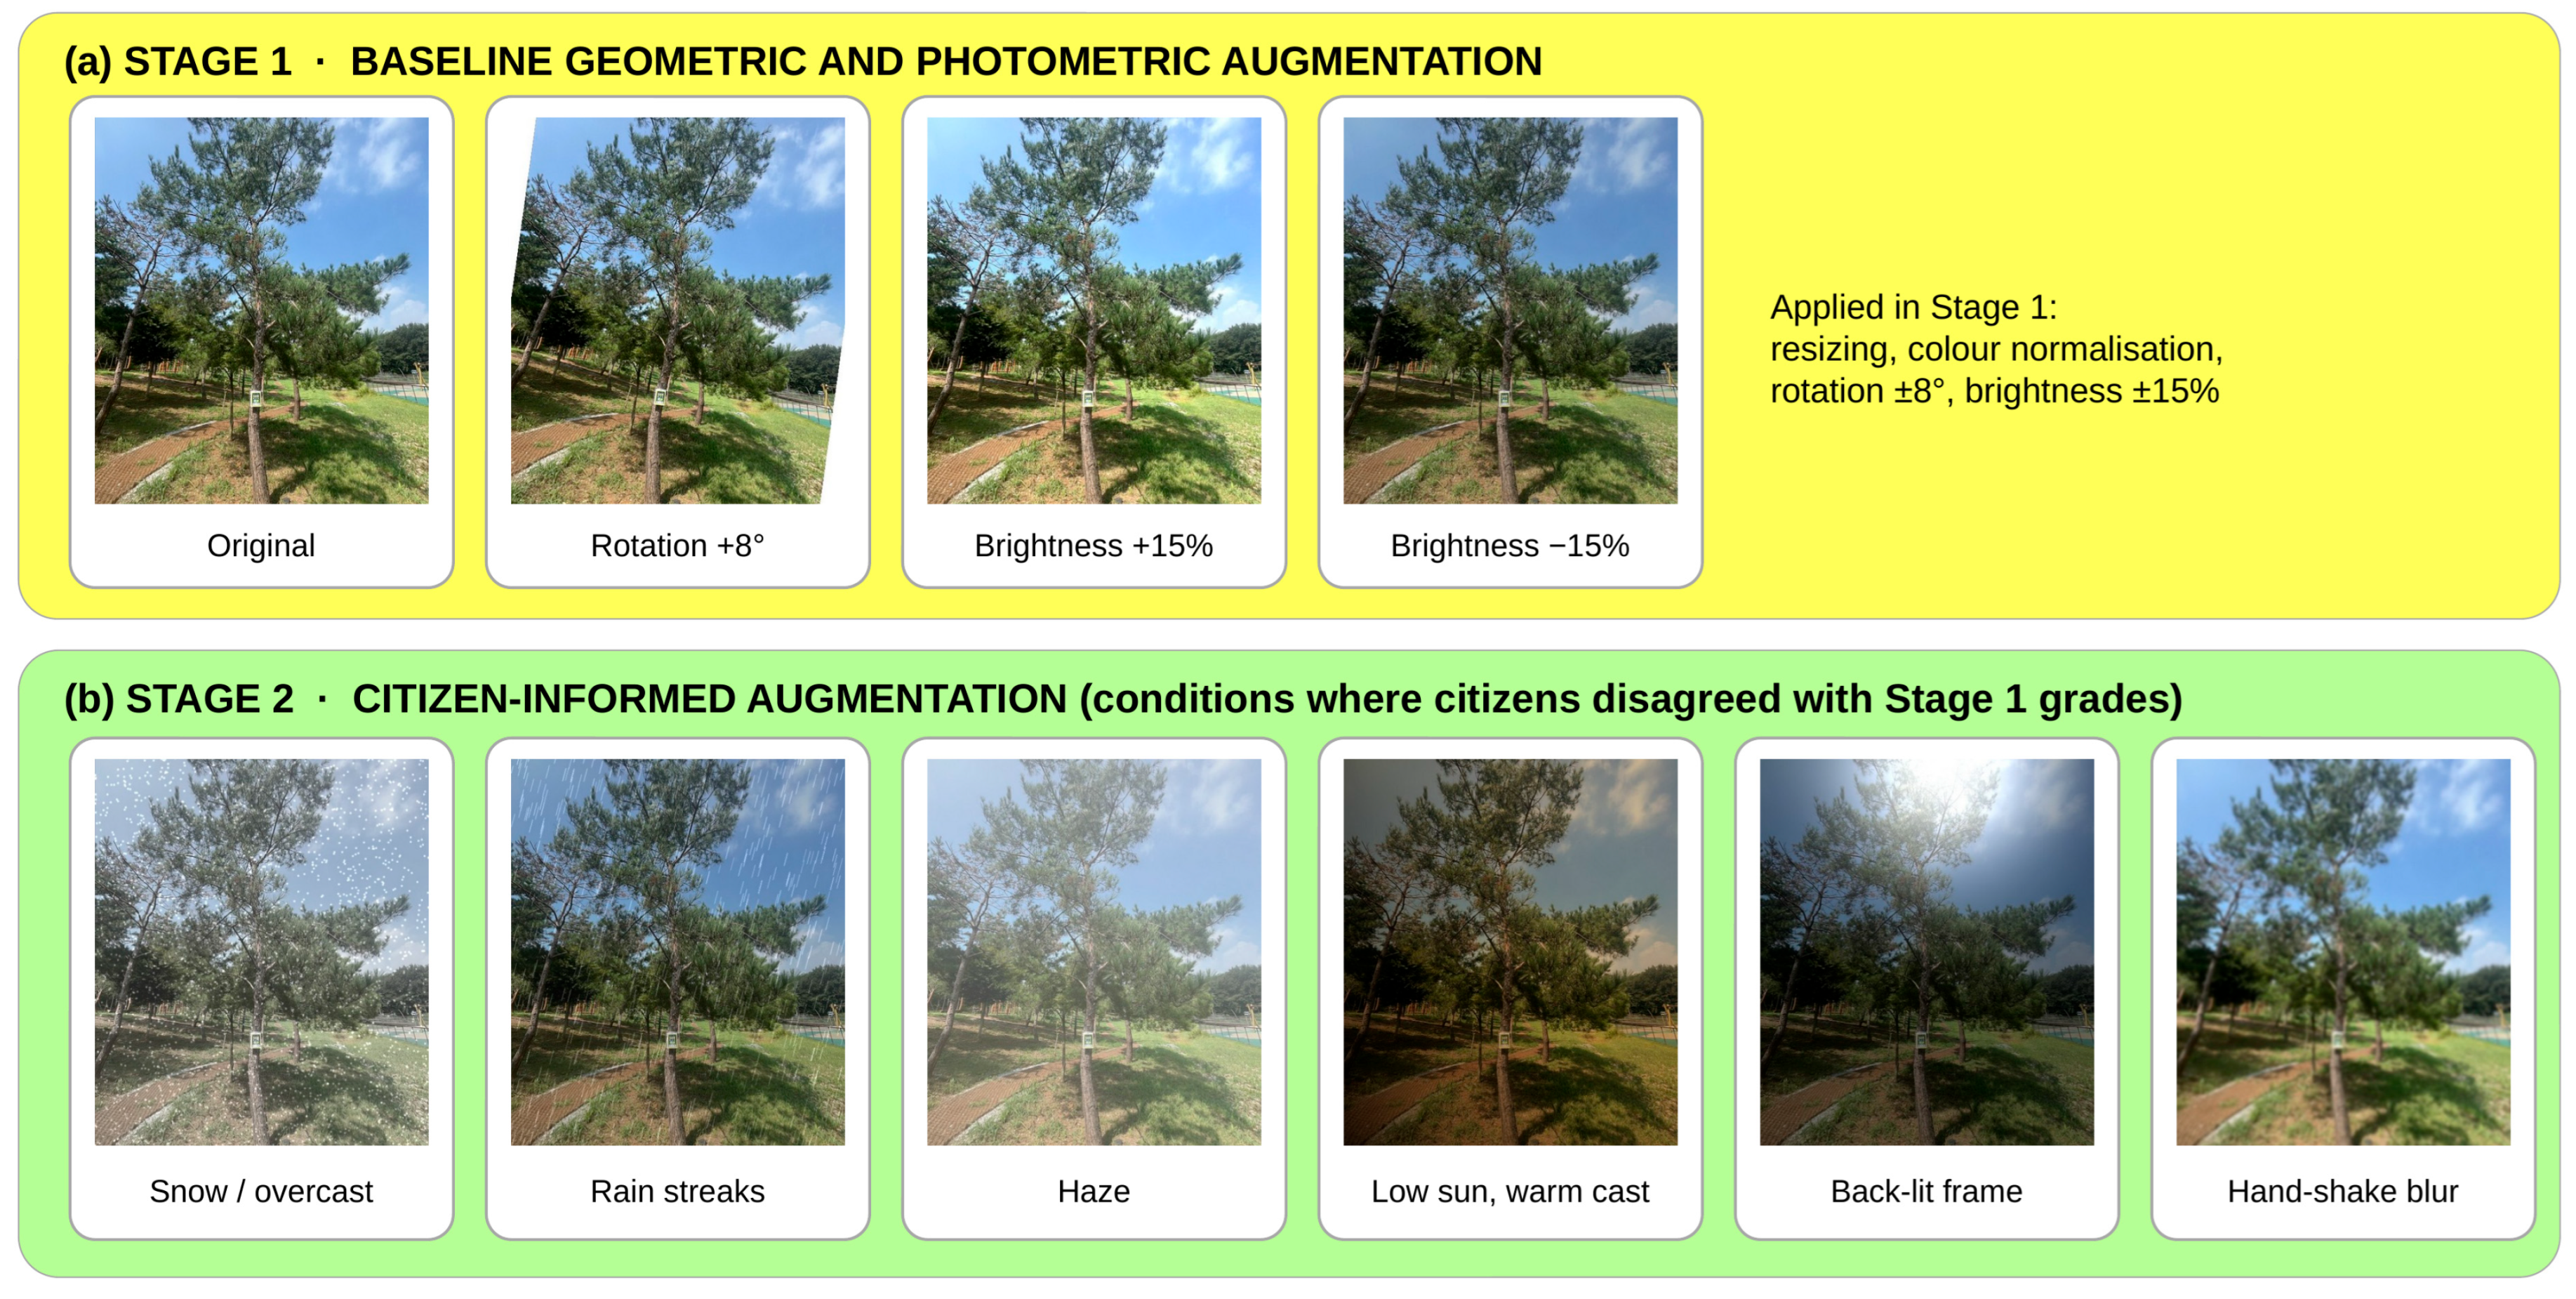
Citizen feedback was processed in four steps that separate collection, verification, diagnosis, and update (Figure 2, steps 3–6). (i) Collect: each photograph is stored with its AI output, the citizen’s judgement, and the capture metadata. (ii) Verify: an arborist reviews every damage report and every disagreement and assigns the reference label; unverified citizen judgements are never used as labels, so responsibility for the ground truth remains with a professional. (iii) Diagnose: verified errors are grouped by the condition that explains them, namely season, time of day, weather, illumination, occlusion, marker visibility, or explanation quality. (iv) Update: each condition is mapped to a remedy in one of four channels, namely new targeted training images, citizen-informed augmentation that reproduces the failing condition (Figure 3), a capture-metadata field that makes the condition known to the model at decision time, or a prompt rule that tells the VLM how to interpret the condition; the models are then retrained.
Figure 3.
Citizen-informed augmentation: (a) Stage 1 baseline policy; (b) Stage 2 policy reproducing the conditions under which citizens disagreed with Stage 1 grades. All panels show the same training photograph with each transformation applied (representative demonstrations); the parameters and application probabilities are given in Section 3.5.4.
Formally, each citizen photograph xi is stored as a record (xi, , ei, ji, mi), where is the displayed grade, ei the explanation, ji ∈ {agree, disagree} the citizen’s judgement, and mi the capture metadata. Verification adds the arborist’s decision, and the set of confirmed items E contains every photograph for which the citizen disagreed and the arborist upheld the objection, whether it concerned the grade or the explanation. Diagnosis partitions E into condition groups Ec, and the update step maps each condition c to one or more of the four channels. The unit of learning is therefore the condition c rather than the sample i: the photographs in E are never added to the training set, and what enters the models is the remedy attached to their condition.
The model trained on the initial 3500 images is referred to as Stage 1, and the model retrained with the 1500 additional images and the updates derived from citizen feedback as Stage 2. The 1500 Stage 2 images were collected by the research team under the citizen-identified conditions and are distinct from the citizen photographs: the 200 citizen photographs form a separate test set, labelled by the arborist and never used for training, on which both stages are evaluated. The sequence was as follows: the photographs were collected and graded by Stage 1 during the pilot, the disputed grades were verified and grouped by condition, and the Stage 2 data, augmentation, metadata, and prompt changes were then designed for those conditions. Because the photographs never entered training, the gain cannot result from memorisation; because their failure conditions guided the updates, however, the evaluation is feedback-informed and exploratory: it shows that the updates correct the conditions exposed by citizens, but it is not an estimate of performance on new photographs taken under other conditions, which requires an independent test set (Section 5.4).
3.5. AI Engine
3.5.1. Dataset
Smartphone images (one to four per tree) were captured with the whole tree and the QR panel in view, and height (clinometer), DBH (diameter tape at 1.2 m, the breast height used in Korean forest inventories and the mounting height of the panel, rather than the 1.3 m common elsewhere), and crown width (tape) were measured on site as reference values. Images were annotated with YOLO-format polygons for the tree and QR classes and with one of three health labels defined together with arborists: healthy (dense, uniformly coloured, full crown), stressed (partial discolouration, thinning, or local dieback), or unhealthy (extensive discolouration, crown decline, or dead branches). Labels were assigned by one arborist of the city’s tree-management programme from the photographs, taking into account the species and the capture date so that leaf-off or dormant crowns were not labelled as decline; because a single expert labelled all images, the labels reflect one professional judgement, and a multi-rater protocol is planned for the follow-up deployment. The labels therefore describe the visible crown condition at the time of capture rather than a full physiological diagnosis, and the health grader is evaluated against this definition. Each image also stores capture metadata (date, season, time of day, weather, illumination, and tree identifier). The Stage 1 dataset contains 3500 images collected by the research team and complemented by open tree and QR images; Stage 2 adds 1500 images targeting the citizen-identified conditions, giving 5000 images in total. The images collected by the research team were taken in the Hambaksan area of Pyeongtaek. Training and validation subsets were split at image level: no image appears in both subsets, but the same tree can appear in both from different viewpoints and seasons. The 200 citizen photographs are new images that belong to neither subset, although some of the 86 pilot trees also appear in the training images from other viewpoints and seasons.
3.5.2. Segmentation and Measurement
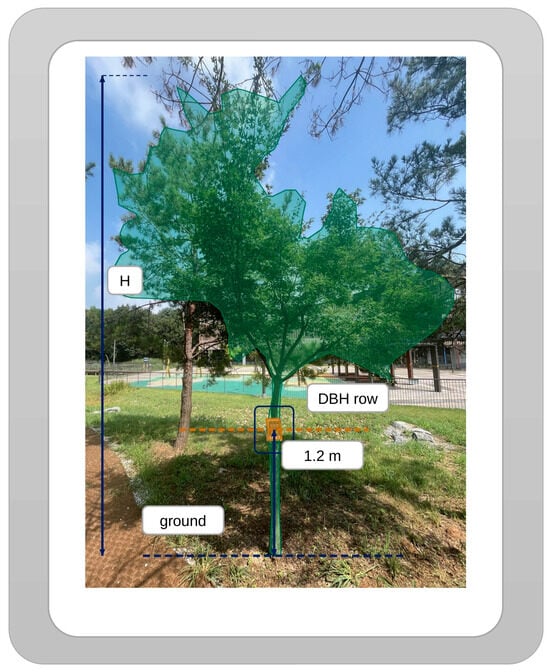
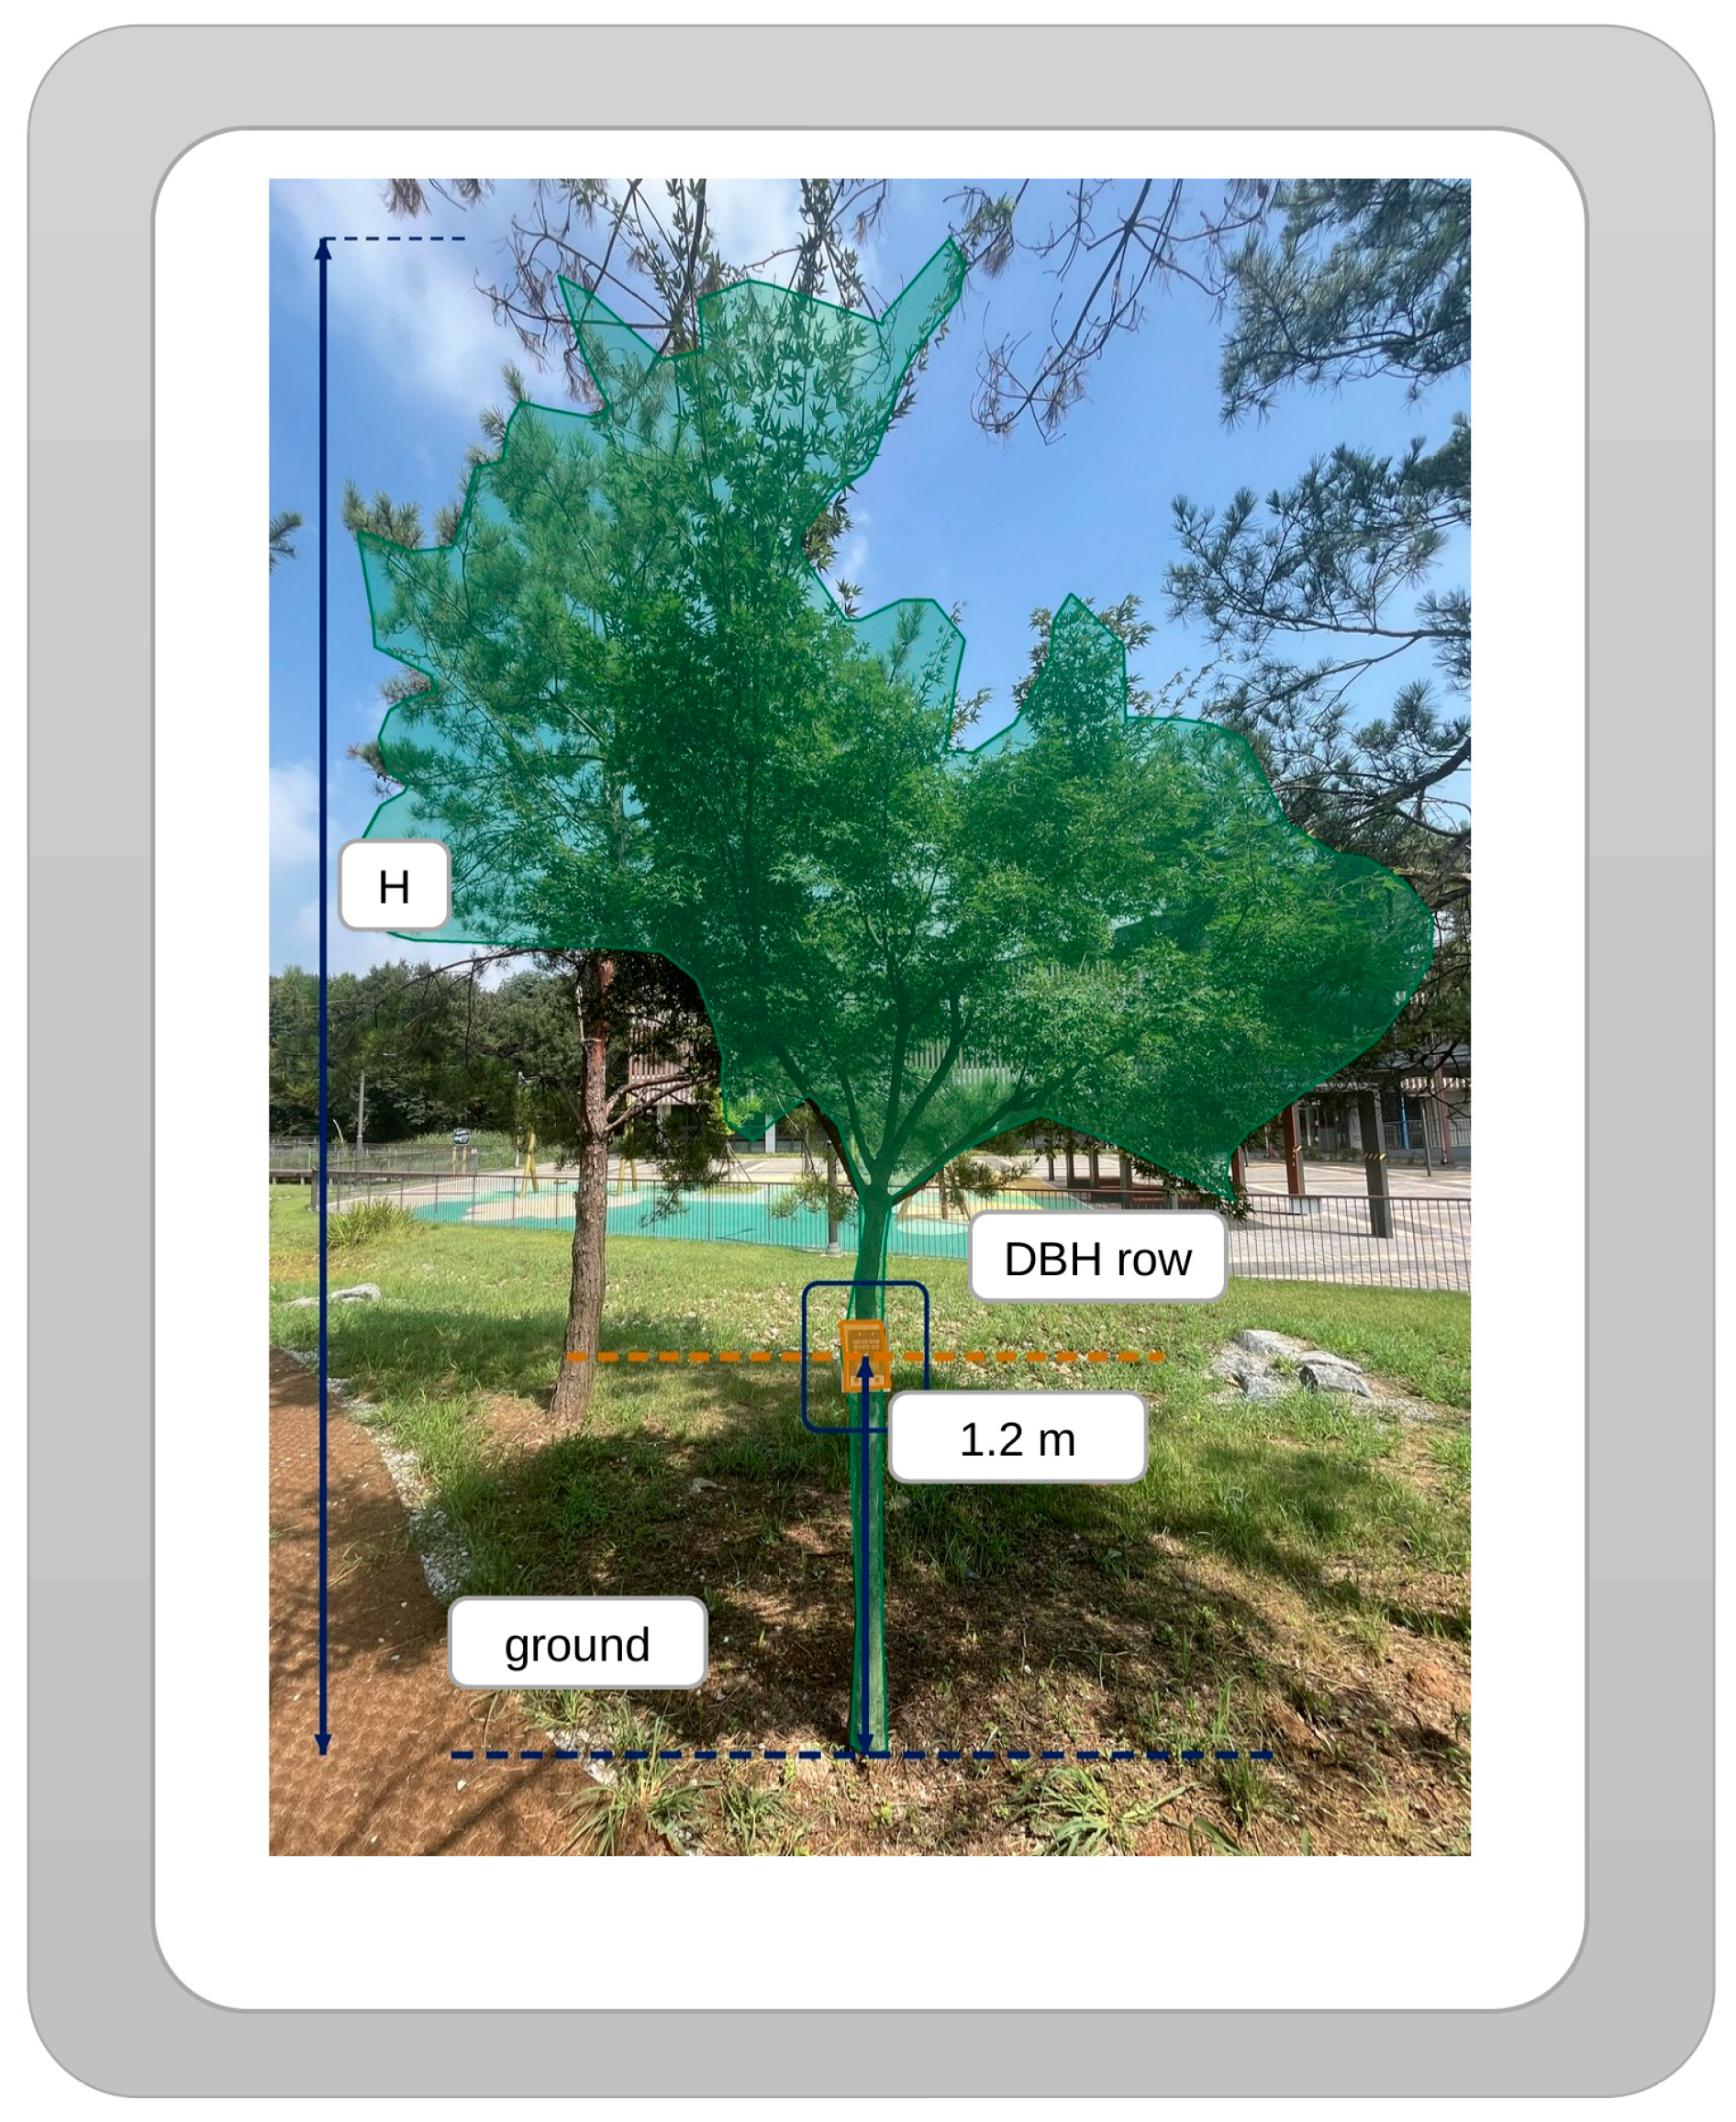
YOLOv8l-seg [33] detects the tree and the QR panel, and its bounding boxes prompt SAM 3 [34] to refine the instance masks; the target tree is the instance whose trunk carries the panel, which binds every measurement and grade to the tree identifier encoded in the QR code. Because the panel has a known physical width Wtag and is mounted at a known height D1.2 = 1.2 m, each image provides its own scale (Figure 4): a horizontal scale sw follows from the panel’s mask width wtag in pixels, and a vertical scale sv from the pixel distance dgb between the ground line and the 1.2 m baseline:
Figure 4.
Marker-based measurement on a citizen photograph: the tree mask, the city-issued 15 × 20 cm QR marker panel mounted at 1.2 m, the ground line, and the DBH row at the 1.2 m baseline, which together define the height H, DBH, and crown width in Equations (1) and (2). The scale assumes that the panel faces the camera and that the trunk and crown lie at approximately the same depth as the panel (Section 3.5.2).
Height H, DBH, and crown width CW then follow from the ground line yg, the crown top ytop, the width of the tree mask wtrunk at the baseline row y1.2 (the trunk is not annotated as a separate class; at that row the tree mask contains only the trunk), and the horizontal extent (xmin, xmax) of the crown mask:
H = sv(yg − ytop), DBH = swwtrunk(y1.2), CW = sw(xmax − xmin)
No calibration object other than the municipal panel is required, so any citizen photograph that shows the panel can extend the tree’s measurement record. The equations assume that the panel faces the camera approximately parallel to the image plane and that the trunk and crown lie at a similar depth; camera tilt, strong perspective, a crown far behind or in front of the panel, and an occluded ground line violate these assumptions and increase the measurement error.
3.5.3. Explained Health Grading
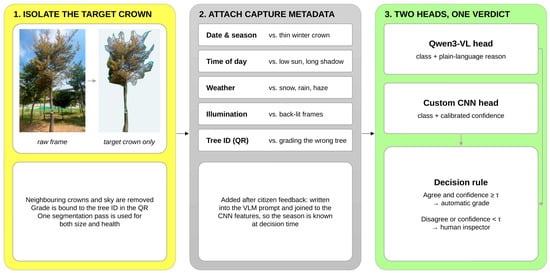
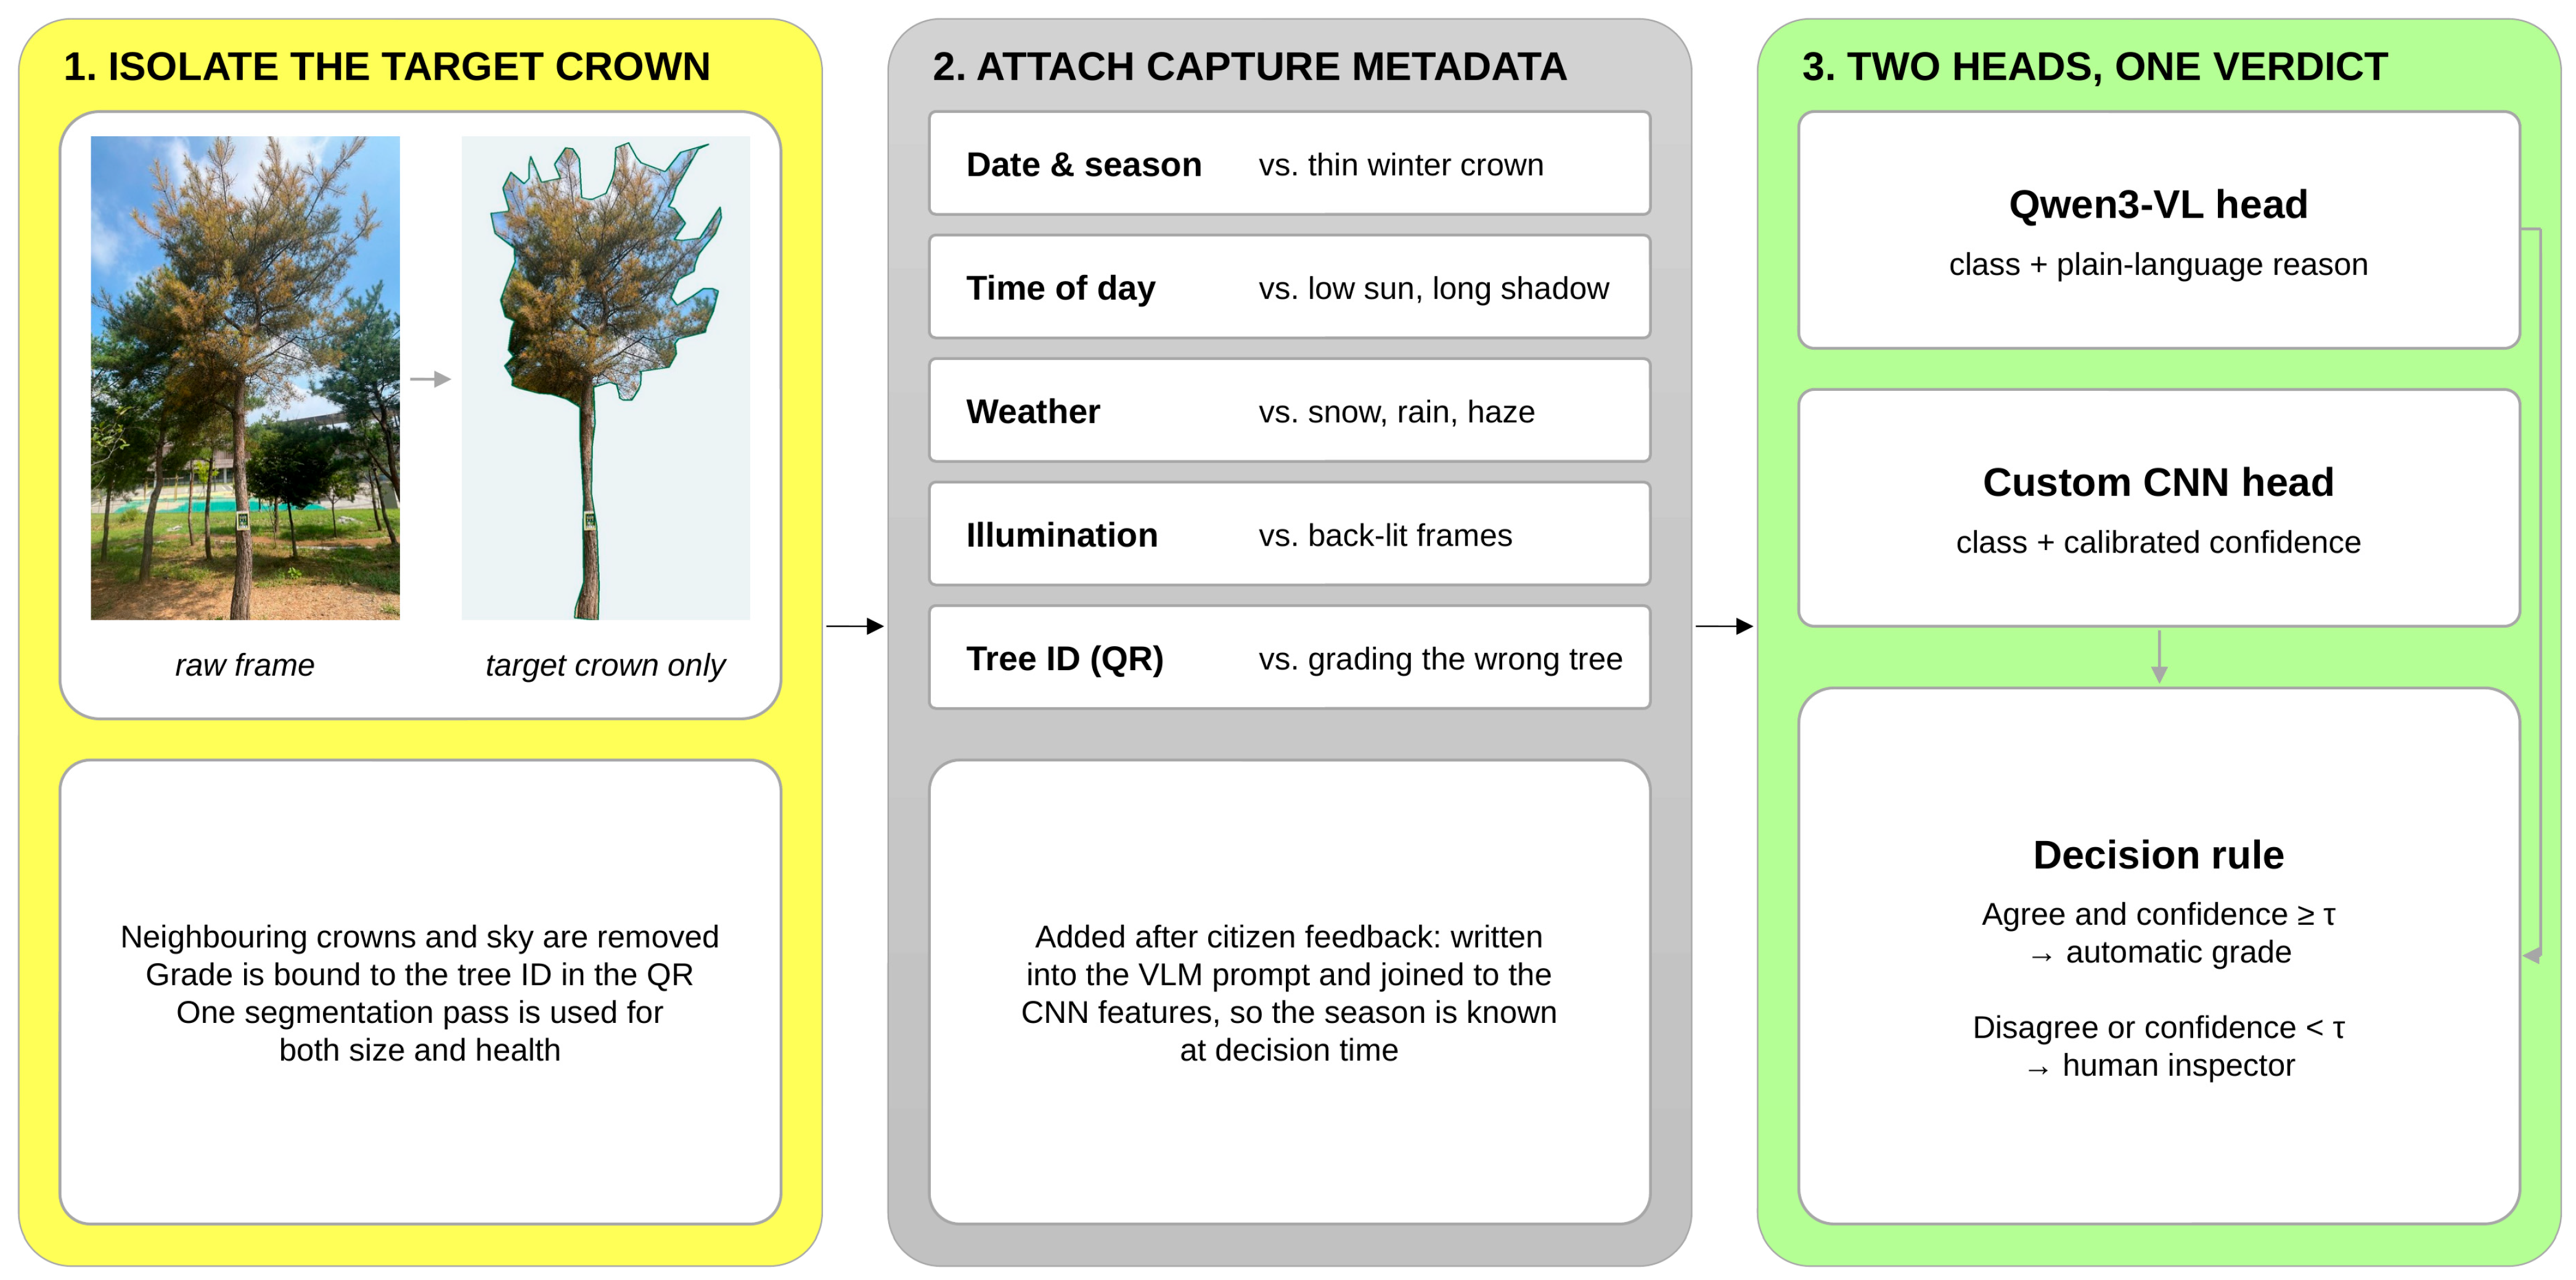
Health is graded in three steps (Figure 5). First, the crown of the target tree is isolated with the segmentation masks, so that neighbouring crowns and sky do not influence the grade and one segmentation pass serves both measurement and health assessment. Second, the capture metadata are attached: in Stage 2 they are written into the VLM prompt [26] and encoded into the CNN feature vector, so that the season, time of day, weather, and illumination are known at decision time. Third, two heads grade the isolated crown: a lightweight CNN operating on 224 × 224 crops, calibrated by temperature scaling [28], returns a class cCNN with confidence pCNN, and Qwen3-VL [15] returns a class cVLM together with a plain-language reason and the visible symptoms. The grade shown to the citizen is
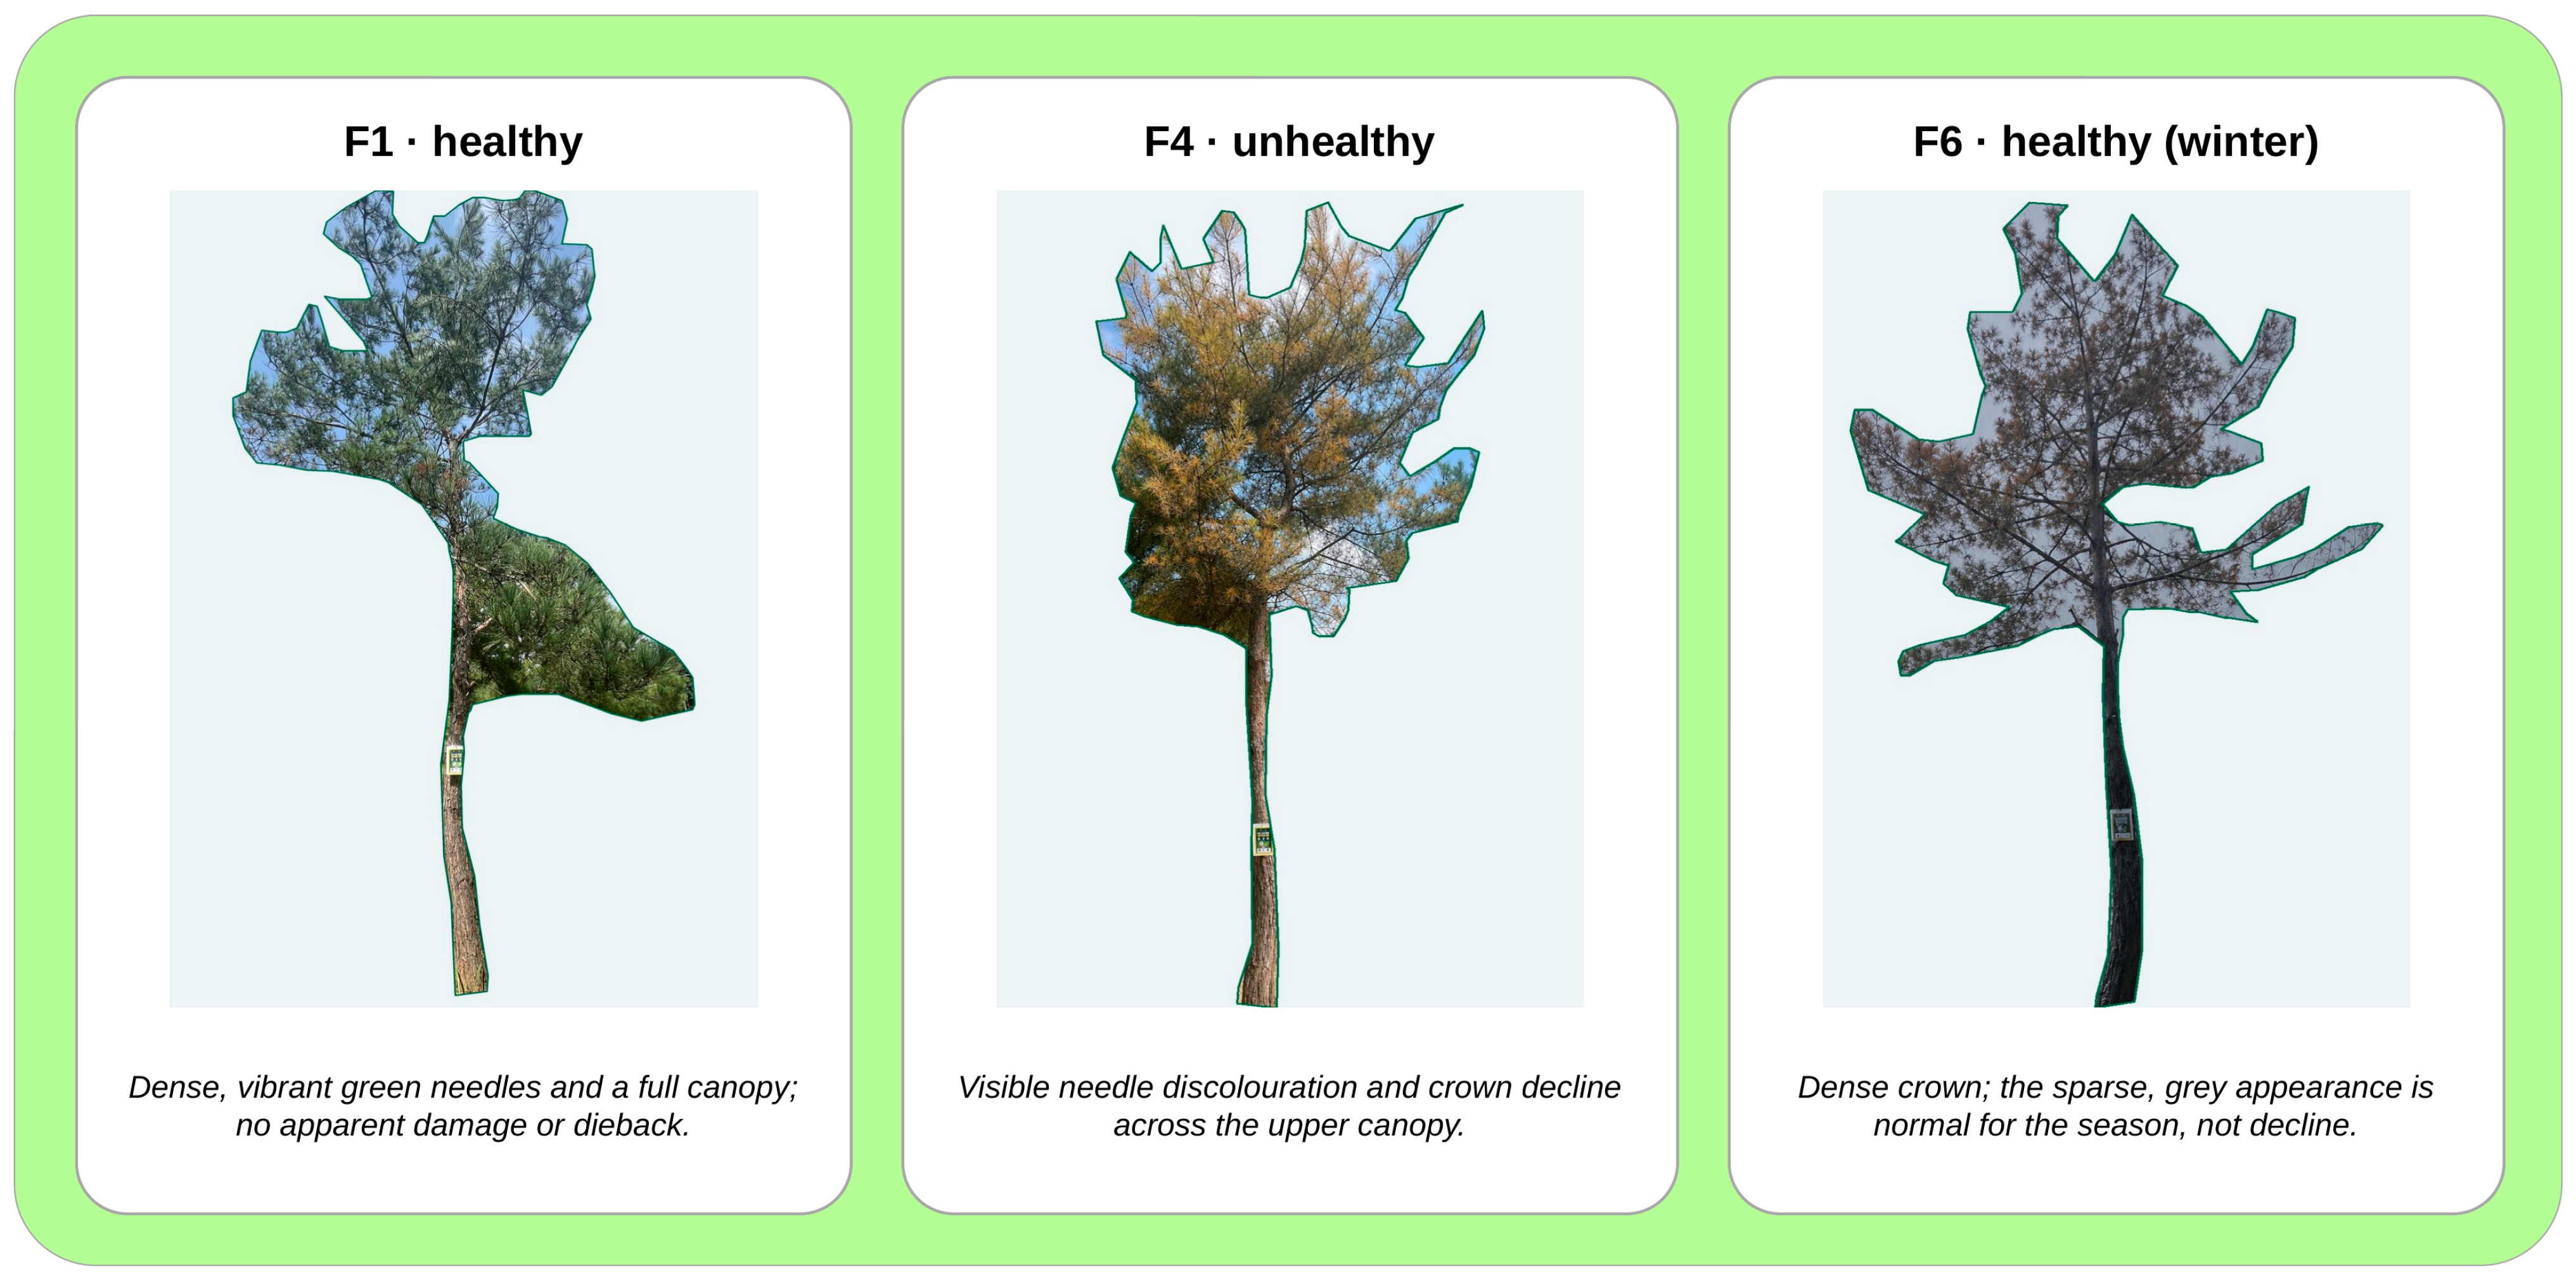
where τ is the confidence threshold. When the two heads agree and the calibrated confidence is sufficient, the grade is displayed automatically with the mask overlay, the VLM reason, and the confidence; otherwise the tree is referred to a human inspector, shown to the citizen as “awaiting inspection” and prioritised in the arborists’ queue. The rule combines the strengths of the two heads: the CNN supplies a calibrated confidence that the VLM cannot provide, and the VLM supplies the explanation that the CNN cannot produce. Both heads receive the same isolated crown, but in different forms: the CNN receives the 224 × 224 crop and, in Stage 2, the encoded metadata appended to its feature vector, whereas the VLM receives the crop with the metadata written into its prompt. Metadata enter both heads because each uses them differently: the CNN learns how appearance varies with season, time of day, and weather, whereas the VLM receives them as explicit context that its explanation can cite, such as a leaf-off crown in winter. Single-head alternatives were not adopted because each lacks one property that the loop requires: a CNN-only grader provides a calibrated confidence but no reason that a citizen can check, and a VLM-only grader provides a reason but no reliable confidence for the referral rule [27,28]. The mask overlay shows which region was graded, whereas the VLM text states why; the two are presented to the citizen as separate parts of the explanation. The four update channels are applied in the order of the training pipeline, from the training data (new images, then augmentation) to the model input (metadata), and finally to the inference-time prompt, so that each step builds on the model produced by the previous one. Table 3 lists the fields, their encoding for the CNN, and the sentence and rule that each adds to the VLM prompt; for the snow-covered winter photograph F6 (Figure 6), for example, the prompt states that the image was taken in winter under snow and that a leaf-off crown is not a sign of decline.
Figure 5.
Health module: (1) crown isolation; (2) capture metadata guarding against seasonal, lighting, and identity errors; (3) the CNN and VLM heads must agree with sufficient confidence, otherwise the tree is referred to an inspector. Both heads receive the isolated crown; the metadata enter the VLM as prompt text and the CNN as an encoded vector. The citizen sees the mask overlay (where the grade applies), the VLM reason (why), and the calibrated confidence.
Table 3.
Capture metadata attached in Stage 2 and how each field enters the two heads of the health grader.
Figure 6.
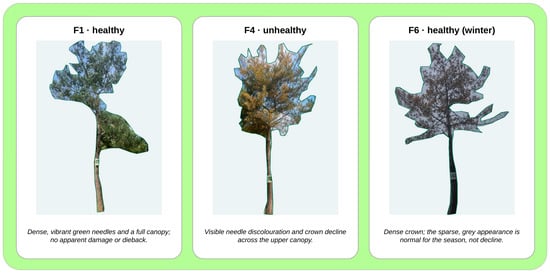
Stage 2 health grades and VLM explanations for three segmented crowns: F1 healthy; F4 unhealthy; F6 healthy in winter (same tree as F1). The examples were selected to illustrate one tree per grade.
3.5.4. Implementation Details
The YOLOv8l-seg model (45.9 M parameters) was initialised from COCO-pretrained weights and trained for 200 epochs at an input size of 1024 px with a batch size of 8, using the AdamW optimiser (learning rate 0.001667, weight decay 0.0005, β = (0.9, 0.999)) and the combined box, segmentation, classification, and distribution-focal losses of the YOLOv8 segmentation head. The health classifier is an ImageNet-pretrained MobileNetV2 operating on 224 × 224 crown crops. Its Stage 1 augmentation policy comprised resizing, colour normalisation, rotation within ±8°, and brightness changes within ±15% (Figure 3a); Stage 2 added six citizen-informed photometric transformations, namely snow or overcast, rain streaks, haze, low-sun warm cast, back-lit glare, and motion blur (Figure 3b), each applied independently with probability 0.5. The classifier was fine-tuned end-to-end with cross-entropy loss using the AdamW optimiser (learning rate 0.001, weight decay 0.0005, batch size 32) for 50 epochs with early stopping on the validation loss; in Stage 2, the capture metadata are one-hot encoded (16 dimensions) and concatenated with the 1280-dimensional feature vector before the classification layer. The calibration temperature and the referral threshold τ = 0.7 were selected on the validation split. Qwen3-VL-8B (8.8 B parameters, hidden size 4096) [15] was used without fine-tuning at batch size 1, so Stage 2 changed only its prompt: the Stage 1 prompt asks for the health class and the visible symptoms in one or two plain sentences, and the Stage 2 prompt adds the metadata sentences and rules listed in Table 3. The Stage 1 (3500 images) and Stage 2 (5000 images) datasets were each divided into training and validation subsets at image level in an 80/20 ratio (2800 and 700 images for Stage 1; 4000 and 1000 images for Stage 2), and all models were trained and run on one NVIDIA GeForce RTX 3090 GPU (24 GB).
3.6. Evaluation Measures
Three groups of measures correspond to the three research questions. Use of the service (RQ1) is assessed by the number and type of participatory actions, reported as totals and as per-participant means with standard deviations. Perception (RQ2) is assessed by the SUS score (0–100) and by the mean, standard deviation, and share of ratings of at least 4 on the five-point understandability, satisfaction, trust, and continuation items. Feedback impact (RQ3) is assessed by the number of verified feedback items per condition, by the confirmation rate of citizen reports and disagreements, and by the performance of the health grader on the citizen test set: accuracy, macro-F1, F1 of the stressed class, referral rate, and citizen agreement. Accuracy and macro-F1 are computed over all 200 photographs against the arborist labels, using the grade assigned before the referral rule is applied; the referral rate is the share of photographs that the rule in Equation (3) sends to an inspector; and citizen agreement is the share of the 200 photographs whose displayed grade the contributing citizen did not dispute. For Stage 1, 37 grades were disputed, giving 163 of 200 (81.5%); among the 184 explicit judgements, 147 (79.9%) were agreements, and the 16 photographs without a recorded judgement were counted as not disputed. For the updated configurations, the refreshed grades were returned to the contributing participants through the tree record (Figure 2, step 7) and re-judged in the same way after each cumulative update, with photographs lacking a new judgement again counted as not disputed. Updates were added cumulatively, in the order data, augmentation, metadata, and prompt; the increments therefore describe a cumulative development sequence in which each step builds on the previous ones, rather than the independent effect of each channel. Wilson 95% confidence intervals (CIs) are reported for the test-set proportions; the paired Stage 1 and Stage 2 predictions on the same photographs are compared with McNemar’s exact test. Finally, the supporting technical performance of the AI engine is assessed by segmentation mAP@0.5 on the validation split and by the deviation of the measured height, DBH, and crown width from tape and clinometer values on the pilot tree.
4. Results
4.1. Citizen Engagement
Table 4 summarises the participation data. The 50 participants scanned 312 markers covering 86 trees and performed 374 participatory actions beyond viewing, a mean of 7.5 ± 3.4 per participant, and 88% of participants used at least one of the report, evaluate, decide, or adopt functions. Evaluation was the most used function: participants recorded 184 agree or disagree judgements (3.7 ± 1.2 each), or 0.92 judgements per photograph, followed by 126 priority votes, 41 damage reports, and 23 tree adoptions. Disagreement with the displayed grade was expressed for 37 of the 200 photographs (18.5%), and these disagreements formed the raw material for the feedback loop.
Table 4.
Citizen engagement during the pilot (50 participants, 200 photographs).
4.2. Perceived Usability, Understandability, and Trust
Table 5 reports the questionnaire results. The mean SUS score was 78.4 ± 9.6, above the benchmark mean of 68 and within the B+ band (77.2–78.8) of the Sauro–Lewis curved grading scale [31]. Explanation understandability received the highest rating (4.2 ± 0.7; 84% of participants rated it 4 or 5), followed by willingness to keep participating (4.1 ± 0.9; 80%) and explanation satisfaction (4.0 ± 0.8; 76%). Trust in the AI grade was rated lower (3.8 ± 0.8; 68%), so a sizeable share of participants understood the explanations without fully trusting the grades, a pattern consistent with the premise of the pilot that explanations should enable scrutiny rather than deference.
Table 5.
Questionnaire results (n = 50; Likert items on a five-point scale).
4.3. Impact of Citizen Feedback on the AI Service
Of the 37 disagreements and 41 damage reports, 52 (66.7%) were confirmed by the arborist. Confirmation was markedly higher for disagreements with an explained grade (29 of 37, 78.4%) than for damage reports (23 of 41, 56.1%), which is consistent with the explanation giving citizens a concrete reference against which to judge; isolating this effect requires a comparison condition in which grades are shown without explanations, which is planned for the next deployment (Section 5.4). The 23 confirmed damage reports concern the condition of the tree rather than the AI grade and were therefore not used for model updates; only the 29 confirmed disagreements entered the diagnosis (Section 3.4). Table 6 shows how the 29 confirmed disagreements were distributed across capture conditions and which update each condition triggered. Three conditions accounted for 22 of the 29 items (75.9%): leaf-off winter crowns graded as decline (11), low-sun or back-lit crowns (7), and rain or haze (4); blurred or occluded crowns (3), grading of the wrong tree (2), and generic explanations (2) made up the remainder. Each confirmed item was assigned by the arborist to the single condition judged to be its main cause, so the categories are mutually exclusive; the two generic-explanation items concerned the explanation rather than the grade. Because the errors were tied to recurring conditions rather than to individual trees, they could be addressed by design changes that are intended to generalise to future photographs: targeted data and augmentation for the appearance-related conditions; season, time-of-day, weather, and illumination fields for the metadata channel; and prompt rules such as “leaf-off crowns are not decline” and “low contrast is not a symptom” for the VLM.
Table 6.
Verified citizen feedback by condition and the resulting Stage 2 update.
Table 7 compares Stage 1 and Stage 2 on the 200-photograph citizen test set, adding the updates one at a time. Accuracy rose from 78.5% (95% CI 72.3–83.6%) to 89.0% (95% CI 83.9–92.6%), a gain of 10.5 percentage points that nearly halves the error rate (from 21.5% to 11.0%), and macro-F1 rose from 0.74 to 0.87. On the same 200 photographs, Stage 2 corrected 25 of the 43 grades that Stage 1 had assigned incorrectly and newly misclassified four (McNemar’s exact test, p < 0.001). Because the photographs come from 86 trees and 50 participants, they are not fully independent, and the intervals above may understate the uncertainty. In this cumulative sequence, the 1500 targeted images added 3.5 points, citizen-informed augmentation 2.5, capture metadata 2.0, and the metadata-aware prompt 2.5, so 4.5 of the 10.5 points were gained at the two steps that add no images, namely metadata and prompt. The largest gain was on the stressed class (F1 0.61 → 0.82), which Stage 1 most often confused with seasonal appearance. Referrals to inspectors fell from 21.0% to 9.5% (42 to 19 photographs), and the share of grades that citizens accepted rose from 81.5% to 91.0%. Figure 6 shows the Stage 2 grades and VLM explanations for three segmented crowns: the snow-covered tree F6, the same tree as F1 photographed in winter, is graded healthy with the explanation that its sparse, grey appearance is normal for the season, whereas the discoloured crown F4 is graded unhealthy with the visible symptom named. The 19 photographs that Stage 2 refers to an inspector receive no automatic grade and are therefore not illustrated; the remaining errors are discussed in Section 5.4.
Table 7.
Health grading on the citizen test set (200 photographs) with cumulative updates derived from citizen feedback (exploratory, feedback-informed evaluation; rows form a cumulative development sequence, not independent effects).
4.4. Technical Performance of the AI Engine
The supporting technical results indicate that the engine is accurate enough to carry the participatory loop. Segmentation reached a box and mask mAP@0.5 of 0.991 (tree 0.995, QR panel 0.988) on the validation split of 1000 images, with identical box- and mask-level values at this precision; the trunk is not a separate class, and the trunk width is read from the tree mask at the 1.2 m row. Because the subsets were split at image level, the same tree can appear in training and validation from different viewpoints, and the tree and the QR panel are visually distinctive classes, so this value reflects in-domain performance rather than generalisation to new sites. In a qualitative check on 27 unlabelled field frames, the model returned 93 tree and 81 panel instances, which shows that the detector runs on unlabelled field imagery but, without reference annotations, does not measure its accuracy. On the pilot tree, measured 50 times at a marker scale of 0.154 cm px−1, height, DBH, and crown width deviated from the tape and clinometer values by −0.74%, −4.0%, and −1.41%, respectively. The height and DBH deviations lie within the error ranges reported for dedicated smartphone systems [11,30], although they were obtained without any calibration object beyond the municipal panel. Because these values come from repeated photographs of a single tree, they demonstrate preliminary technical feasibility rather than general measurement accuracy across species, tree sizes, and viewing conditions.
5. Discussion
5.1. From Consultation Towards Partnership
The pilot suggests that explanations change what participation can achieve. In city-reporting applications, the citizen’s role ends with the submission of a report [17]; in citizen-science inventories, citizens collect data that experts analyse [8,10]. Here, citizens saw an AI judgement and its reason, compared both with the tree in front of them, and registered disagreement; those disagreements, once verified, changed the model. This goes beyond consultation and approaches partnership in Arnstein’s sense [3] in the form of verified technical co-evaluation, although decisions on the model and on maintenance remained with the city and the research team. It also required no expertise: 78% of the disagreements were confirmed by the arborist. Because the pilot had no condition without explanations, this shows that citizens could evaluate the grades through an explanation-supported interface, not that the explanations caused this precision. Three observations support this reading. Evaluation was the most used function, ahead of reporting and voting, although it offers no direct personal benefit. Understandability was rated more highly than trust, which indicates that participants used the explanation to scrutinise the grade rather than to accept it, the calibrated rather than blind trust that XAI evaluation frameworks aim for [22]. Finally, 80% of participants were willing to continue despite the additional cognitive effort of evaluating an AI output, and the SUS score of 78.4 approaches the scores above 80 reported for the participatory traceability system in Valdivia, whose users were not asked to evaluate an AI output [10].
5.2. Citizens as a Source of Condition-Level Corrections
HITL research has concentrated on selecting which samples experts should label [14]. Citizen feedback played a different role here: it surfaced the conditions under which the model failed. Three-quarters of the confirmed disagreements concerned season, illumination, or weather, appearance changes that are unrelated to tree condition, that image-based assessment is known to find difficult [12], and that a training set collected by a research team under convenient conditions under-represents. Because the diagnosis was made at the level of conditions, the remedies were design changes, namely targeted data, augmentation, explicit metadata, and prompt rules, rather than corrections of individual predictions, and the cumulative sequence shows accuracy rising at each step. Taken together, the four updates, all of which were derived from verified citizen feedback, raised accuracy on the same 200 photographs by 10.5 percentage points (McNemar’s exact test, p < 0.001); the cumulative design limits only the attribution of this gain to individual channels, not the gain itself. Notably, 4.5 of the 10.5 accuracy points were gained at the metadata and prompt steps, which add no images: the citizens’ disagreements carried information about why the model failed, not only that it failed, and this information could be written directly into the decision process. Arborist verification was essential to this outcome. It filtered the 22% of disagreements and 44% of damage reports that were well intentioned but incorrect, kept responsibility for labels with professionals, and, because only verified items entered the diagnosis, protected the model from being retrained on citizen error.
5.3. Practical Implications for Smart-City Governance
The approach reuses infrastructure that many cities already own. The QR marker panel serves simultaneously as the tree’s identity, the entry point to its record, and the metric scale reference, so that every citizen photograph that shows the panel can extend the tree’s growth and health record at no additional hardware cost. The referral rule concentrates arborist time on uncertain cases, and the reduction of referrals from 42 to 19 of 200 photographs reduces the number of cases sent to inspectors; whether it also lowers the total professional workload, which includes verifying citizen reports and maintaining the models, remains to be quantified in a longer deployment. Priority voting is designed to make the maintenance queue transparent, and the refreshed record and notification close the loop with the individual contributor, which the engagement literature identifies as a condition for continued participation [5,6]. Because the framework is defined in terms of functions (view, report, evaluate, decide, and adopt), verification, and update channels rather than in terms of trees, the same loop can in principle be applied to other marked municipal assets whose condition an AI model assesses, provided that the assets carry standardised markers, that reliable reference labels can be defined, and that the city has the professional capacity to verify citizen feedback; such transfer has not yet been demonstrated. Finally, the anonymisation and data-governance functions of the integration layer are not optional: citizen photographs can capture people, vehicles, and private property, and a privacy impact assessment must precede any city-wide deployment.
5.4. Limitations and Future Work
Several limitations qualify these findings. The pilot involved 50 volunteers from one city over a limited period; volunteers are likely to be more engaged than the general public, and the absence of a control group that used the service without explanations limits causal claims about the effect of XAI on trust and engagement; part of the engagement may reflect the novelty of the platform rather than its explanations. The findings therefore show feasibility in one mid-sized Korean city rather than effects that generalise to other populations, and their transfer to cities with different climates, tree species, digital habits, and governance arrangements remains to be tested. The small number of participants was nevertheless sufficient for the purpose of the pilot, because the feedback saturated: the confirmed disagreements fell into six recurring conditions, three of which accounted for 76% of the items, and the open comments repeated the same few points about tree measurement and how to photograph the trees, so that additional participants would most likely have added further instances of the same conditions rather than new ones. Because the citizen photographs also guided the design of the Stage 2 updates, and because some of the pilot trees appear in the training images from other viewpoints, the reported gain is a feedback-informed estimate; evaluating both stages on an independent set of photographs, collected after the update and from trees outside the training data, is the most important next step. The test set of 200 photographs yields confidence intervals of roughly ±5 percentage points and assumes independent observations, although photographs of the same tree or by the same participant are correlated, and citizen agreement for the updated configurations was measured with the same participants, who may have been favourably disposed after seeing that their feedback had been acted upon. The evaluation compares successive versions of the proposed system rather than alternative graders; comparisons with CNN-only and VLM-only configurations and alternative classifiers, and single-channel ablations over several random seeds, lie beyond the scope of this pilot and are planned as the next step. Part of the gain from the 1500 targeted images may also reflect the larger training set rather than the citizen-informed choice of conditions; a comparison with an equally sized, non-targeted set would separate the two. Measurement accuracy was evaluated on one pilot tree, and height and crown width assume that the crown lies approximately in the plane of the marker. VLM explanations can be fluent but wrong; the referral rule and arborist verification mitigate this risk but do not remove it. The understandability ratings measure how clear the explanations were to residents, not whether they were factually correct or faithful to the evidence behind the CNN grade; an expert assessment of their factual correctness and fidelity is planned for the next deployment. A lower referral rate is beneficial only if the automatically displayed grades remain accurate, so class-specific errors among them, especially for unhealthy trees, need to be monitored in deployment. The 22 photographs that Stage 2 still misgrades and the 19 that it still refers to an inspector are the natural input to the next feedback cycle, in which the same verification and condition-level diagnosis will be applied. Future work will compare interfaces with and without explanations in a controlled design, extend the deployment over several seasons and districts to test whether the condition-level corrections hold, link prioritised reports to maintenance work orders, and follow adopted trees over time to measure the effect of stewardship on tree outcomes.
6. Conclusions
This paper presented a human-in-the-loop explainable AI framework that places citizens at the centre of smart-city decisions on urban trees and evaluated it in a pilot deployment in Pyeongtaek, Republic of Korea. The framework lets residents open a tree’s record from the QR marker panel on its trunk, read the measured size and the explained health grade, and respond by reporting damage, adopting the tree, voting on priorities, or disputing the grade; arborists verify these responses, and verified errors are diagnosed by condition and converted into targeted data, citizen-informed augmentation, capture metadata, and prompt rules. In the pilot, 50 participants took 200 photographs and carried out 374 participatory actions; they rated the platform at 78.4 on the SUS, and 84% of them found the explanations understandable. Their verified disagreements traced most grading errors to season, illumination, and weather, and the four resulting updates lifted accuracy on the citizen photographs, in a feedback-informed evaluation, by 10.5 percentage points to 89.0%, more than halved the share of cases referred to inspectors (from 21.0% to 9.5%), and raised the share of grades that citizens accepted to 91.0%. The pilot therefore suggests that explanations can do more than make AI acceptable: they can help residents without expertise to detect where an AI service fails and, with professional verification, turn that detection into a better service. Within the limits of an observational single-city pilot, explainable and correctable AI thus appears to support participation that moves beyond consultation towards partnership.
Beyond the pilot, the study has practical value for cities that want AI-based public services to be accountable to the residents they serve. It shows that a low-cost mobile interface built on existing municipal markers can let residents question an automated assessment, and that professional verification can turn their questions into improvements from which the whole city benefits. Although the pilot was carried out in one Korean city, its ingredients—tagged public assets, plain-language explanations, professional verification, and condition-level updates—are not specific to Korea, and municipalities elsewhere that run tree inventories or asset-tagging programmes could adopt the same loop, provided that verification capacity and data-governance safeguards are in place. Larger, multi-city, and multi-season deployments with an independent test set are needed to confirm these conclusions.
Author Contributions
Conceptualization, D.M. and Y.I.C.; methodology, D.M.; software, D.M.; validation, D.M., R.S., and Z.K.; formal analysis, D.M.; investigation, D.M.; resources, Y.I.C.; data curation, D.M.; writing—original draft preparation, D.M.; writing—review and editing, R.S., Z.K., and Y.I.C.; visualization, D.M.; supervision, Y.I.C.; project administration, Y.I.C.; funding acquisition, R.S. and Z.K. All authors have read and agreed to the published version of the manuscript.
Funding
This research was funded by the Science Committee of the Ministry of Science and Higher Education of the Republic of Kazakhstan (Grant No. BR24993051, ‘Development of an Intelligent City System Based on IoT and Data Analysis’).
Institutional Review Board Statement
The study was conducted in accordance with the Declaration of Helsinki. Ethical review and approval were waived for this study in accordance with Article 13 of the Enforcement Rule of the Bioethics and Safety Act of the Republic of Korea, because the pilot involved no medical or physical intervention, the participants were adult volunteers who were not individually identified in the collected data, and no sensitive personal information was collected.
Informed Consent Statement
Informed consent was obtained from all subjects involved in the study. Before taking part, participants were informed of the purpose of the pilot and of the data collected (photographs of public trees, pseudonymous usage logs, and questionnaire responses).
Data Availability Statement
The data presented in this study are available on request from the corresponding author. The photographs are not publicly available because they may show identifiable people and private property and are covered by the participants’ consent. The VLM prompts, the questionnaire, the code, and aggregate evaluation results are available from the corresponding author on request.
Conflicts of Interest
The authors declare no conflicts of interest.
References
- Cardullo, P.; Kitchin, R. Being a ‘citizen’ in the smart city: Up and down the scaffold of smart citizen participation in Dublin, Ireland. GeoJournal 2019, 84, 1–13. [Google Scholar] [CrossRef] [Scilit]
- Alhowaish, A.K. AI-Enabled Participatory Urban Planning for Sustainable Smart Cities: Evidence from the Dammam Metropolitan Area, Saudi Arabia. Urban Sci. 2026, 10, 158. [Google Scholar] [CrossRef] [Scilit]
- Arnstein, S.R. A Ladder of Citizen Participation. J. Am. Inst. Plan. 1969, 35, 216–224. [Google Scholar] [CrossRef] [Scilit]
- Grimmelikhuijsen, S. Explaining Why the Computer Says No: Algorithmic Transparency Affects the Perceived Trustworthiness of Automated Decision-Making. Public Adm. Rev. 2023, 83, 241–262. [Google Scholar] [CrossRef] [Scilit]
- Hatami, A.; Naseramini Jeloudarlou, S.; Asadzadeh, H. Empowering smart cities: Unlocking citizen participation through AI-driven personalization and perceived value. Sustain. Futures 2025, 9, 100664. [Google Scholar] [CrossRef] [Scilit]
- Phothong, L.; Sukprasert, A.; Ngamtampong, N. Artificial Intelligence Governance in Smart Cities: A Causal Model of Citizen Sustainability Co-Creation Through Acceptance, Trust, and Adaptability. Sustainability 2026, 18, 1109. [Google Scholar] [CrossRef] [Scilit]
- McDonald, R.I.; Biswas, T.; Chakraborty, T.C.; Kroeger, T.; Cook-Patton, S.C.; Fargione, J.E. Current inequality and future potential of US urban tree cover for reducing heat-related health impacts. npj Urban Sustain. 2024, 4, 18. [Google Scholar] [CrossRef] [Scilit]
- Roman, L.A.; Scharenbroch, B.C.; Östberg, J.P.A.; Mueller, L.S.; Henning, J.G.; Koeser, A.K.; Sanders, J.R.; Betz, D.R.; Jordan, R.C. Data quality in citizen science urban tree inventories. Urban For. Urban Green. 2017, 22, 124–135. [Google Scholar] [CrossRef] [Scilit]
- Mudede, M.F.; Abutaleb, K.; Newete, S.W.; Byrne, M.J. A citizen science method to monitor a polyphagous shot hole borer infestation in Johannesburg’s urban forest. Urban For. Urban Green. 2024, 97, 128368. [Google Scholar] [CrossRef] [Scilit]
- Veas-Castillo, L.; Andrade, G.; Lazo, C.; Letelier, T.; Díaz, I.; Alacid, M.; Hermosilla, M. Participatory Digital Traceability Systems for Information Governance: Design and Real-World Deployment in Urban Afforestation Programs. Information 2026, 17, 348. [Google Scholar] [CrossRef] [Scilit]
- Xuan, J.; Li, X.; Du, H.; Zhou, G.; Mao, F.; Wang, J.; Zhang, B.; Gong, Y.; Zhu, D.; Zhou, L.; et al. Intelligent Estimating the Tree Height in Urban Forests Based on Deep Learning Combined with a Smartphone and a Comparison with UAV-LiDAR. Remote Sens. 2023, 15, 97. [Google Scholar] [CrossRef] [Scilit]
- Kang, Y.; Kang, Y. Individual Street Tree Detection and Vitality Assessment Using GeoAI and Multi-Source Imagery. Smart Cities 2026, 9, 31. [Google Scholar] [CrossRef] [Scilit]
- Longo, L.; Brcic, M.; Cabitza, F.; Choi, J.; Confalonieri, R.; Del Ser, J.; Guidotti, R.; Hayashi, Y.; Herrera, F.; Holzinger, A.; et al. Explainable Artificial Intelligence (XAI) 2.0: A manifesto of open challenges and interdisciplinary research directions. Inf. Fusion 2024, 106, 102301. [Google Scholar] [CrossRef] [Scilit]
- Mosqueira-Rey, E.; Hernández-Pereira, E.; Alonso-Ríos, D.; Bobes-Bascarán, J.; Fernández-Leal, Á. Human-in-the-loop machine learning: A state of the art. Artif. Intell. Rev. 2023, 56, 3005–3054. [Google Scholar] [CrossRef] [Scilit]
- Qwen Team. Qwen3-VL Technical Report. arXiv 2025, arXiv:2511.21631. [Google Scholar] [CrossRef] [Scilit]
- Bastos, D.; Fernández-Caballero, A.; Pereira, A.; Rocha, N.P. Smart City Applications to Promote Citizen Participation in City Management and Governance: A Systematic Review. Informatics 2022, 9, 89. [Google Scholar] [CrossRef] [Scilit]
- Dehghanpour-Farashah, A.; Behnamifard, F.; Behzadfar, M.; Alalhesabi, M.; Mojtabazadeh-Hasanlouei, S. Mobile Participatory Urban Governance in a Developing Country: Women’s Acceptance of City Reporting Apps in Karaj, Iran. Sustainability 2025, 17, 5388. [Google Scholar] [CrossRef] [Scilit]
- Li, W.; Li, K.; Xu, Z.; Wu, M.; Wu, Y.; Xiong, Y.; Huang, S.; Yin, Y.; Ma, Y.; Zhang, H. Trustworthy AI-IoT for Citizen-Centric Smart Cities: The IMTPS Framework for Intelligent Multimodal Crowd Sensing. Sensors 2026, 26, 500. [Google Scholar] [CrossRef] [Scilit] [PubMed]
- Shelton, T.; Lodato, T. Actually existing smart citizens: Expertise and (non)participation in the making of the smart city. City 2019, 23, 35–52. [Google Scholar] [CrossRef] [Scilit]
- Simonofski, A.; Serral Asensio, E.; De Smedt, J.; Snoeck, M. Hearing the Voice of Citizens in Smart City Design: The CitiVoice Framework. Bus. Inf. Syst. Eng. 2019, 61, 665–678. [Google Scholar] [CrossRef] [Scilit]
- Ruohomaa, H.; Salminen, V.; Kunttu, I. Towards a Smart City Concept in Small Cities. Technol. Innov. Manag. Rev. 2019, 9, 5–14. [Google Scholar] [CrossRef] [Scilit] [PubMed]
- Hoffman, R.R.; Mueller, S.T.; Klein, G.; Litman, J. Measures for Explainable AI: Explanation Goodness, User Satisfaction, Mental Models, Curiosity, Trust, and Human-AI Performance. Front. Comput. Sci. 2023, 5, 1096257. [Google Scholar] [CrossRef] [Scilit]
- Javed, A.R.; Ahmed, W.; Pandya, S.; Maddikunta, P.K.R.; Alazab, M.; Gadekallu, T.R. A Survey of Explainable Artificial Intelligence for Smart Cities. Electronics 2023, 12, 1020. [Google Scholar] [CrossRef] [Scilit]
- Mukhtorov, D.; Rakhmonova, M.; Muksimova, S.; Cho, Y.-I. Endoscopic Image Classification Based on Explainable Deep Learning. Sensors 2023, 23, 3176. [Google Scholar] [CrossRef] [Scilit] [PubMed]
- Zhang, Y.; Han, Z.; Chen, J.; Xu, C.; Qin, Y.; Wang, B.; Zhang, X.; Zhang, L. CropGPT: A large multimodal model for precise and explainable diagnosis of crop pests and diseases. J. Ind. Inf. Integr. 2026, 51, 101107. [Google Scholar] [CrossRef] [Scilit]
- Zhou, K.; Yang, J.; Loy, C.C.; Liu, Z. Learning to Prompt for Vision-Language Models. Int. J. Comput. Vis. 2022, 130, 2337–2348. [Google Scholar] [CrossRef] [Scilit]
- Xuan, W.; Zeng, Q.; Qi, H.; Wang, J.; Yokoya, N. Seeing is Believing, but How Much? A Comprehensive Analysis of Verbalized Calibration in Vision-Language Models. In Proceedings of the 2025 Conference on Empirical Methods in Natural Language Processing (EMNLP 2025), Suzhou, China, 4–9 November 2025; Association for Computational Linguistics: Stroudsburg, PA, USA, 2025; pp. 1408–1450. [Google Scholar] [CrossRef] [Scilit]
- Guo, C.; Pleiss, G.; Sun, Y.; Weinberger, K.Q. On Calibration of Modern Neural Networks. In Proceedings of the 34th International Conference on Machine Learning (ICML 2017), Sydney, Australia, 6–11 August 2017; PMLR: Cambridge, MA, USA, 2017; Volume 70, pp. 1321–1330. [Google Scholar]
- Hendrickx, K.; Perini, L.; Van der Plas, D.; Meert, W.; Davis, J. Machine learning with a reject option: A survey. Mach. Learn. 2024, 113, 3073–3110. [Google Scholar] [CrossRef] [Scilit]
- Xuan, J.; Li, X.; Mao, F.; Wang, J.; Zhang, B.; Gong, Y.; Huang, Z.; Chen, C.; Lv, L.; Zhao, Y.; et al. Deep learning combined with smartphone for intelligent estimation of diameter at breast height and AGB in urban forests—Dual LiDAR system for validation. Urban For. Urban Green. 2025, 113, 129119. [Google Scholar] [CrossRef] [Scilit]
- Lewis, J.R. The System Usability Scale: Past, Present, and Future. Int. J. Hum.-Comput. Interact. 2018, 34, 577–590. [Google Scholar] [CrossRef] [Scilit]
- Jian, J.-Y.; Bisantz, A.M.; Drury, C.G. Foundations for an Empirically Determined Scale of Trust in Automated Systems. Int. J. Cogn. Ergon. 2000, 4, 53–71. [Google Scholar] [CrossRef] [Scilit] [PubMed]
- Ultralytics YOLOv8, version 8.0.0 (AGPL-3.0); Ultralytics: Frederick, MD, USA, 2023.
- Carion, N.; Gustafson, L.; Hu, Y.-T.; Debnath, S.; Hu, R.; Suris, D.; Ryali, C.; Alwala, K.V.; Khedr, H.; Huang, A.; et al. SAM 3: Segment Anything with Concepts. arXiv 2025, arXiv:2511.16719. [Google Scholar] [CrossRef] [Scilit]

Disclaimer/Publisher’s Note: The statements, opinions and data contained in all publications are solely those of the individual author(s) and contributor(s) and not of MDPI and/or the editor(s). MDPI and/or the editor(s) disclaim responsibility for any injury to people or property resulting from any ideas, methods, instructions or products referred to in the content. |
© 2026 by the authors. Licensee MDPI, Basel, Switzerland. This article is an open access article distributed under the terms and conditions of the Creative Commons Attribution (CC BY) license.