


Abstract
Reconstructing force-plate measurements from wearable pressure insoles could support portable biomechanical assessment, but generalization to unseen wearers and fast loading events requires rigorous validation. We investigated pressure-only regression of six right-foot force and moment components and derived center-of-pressure (COP) coordinates during in-place walking and quiet standing. Twenty-one university volunteers performed both tasks using an 89-sensor insole (50 Hz) and AMTI force plates (1000 Hz). Force-plate signals were filtered, downsampled to 50 Hz, and aligned by cross-correlation. Each task used subject-wise seven-fold cross-validation. For every fold, sensor Z-score normalization was fitted using only its training participants and then applied unchanged to its held-out test participants. Mean ± SD of participant-level R2 during walking was 0.88 ± 0.071 (Fx), 0.80 ± 0.062 (Fy), 0.89 ± 0.075 (Fz), 0.95 ± 0.090 (Mx), 0.89 ± 0.078 (My), and 0.43 ± 0.390 (Mz); COPx and COPy achieved 0.99 ± 0.039 and 0.76 ± 0.055. During standing, Fz, Mx, and My each reached mean R2 = 0.99, while COPx and COPy reached 0.77 and 0.98, respectively. The contribution of this study is a pressure-only six-component reconstruction assessed across unseen individuals and complementary controlled loading tasks. To our knowledge, this is the first study to combine a high-density, pressure-only insole (no inertial sensors), estimation of all six force-plate components plus COP, and evaluation on participants unseen during training in both a dynamic and a static task.
1. Introduction
The force plate, a fundamental element in biomechanical research, provides pivotal insights into human gait and posture analysis. Its ability to accurately record ground reaction forces (GRF) and moments of force (GRM) has been indispensable in understanding biomechanics, particularly in diagnosing and treating gait abnormalities [1,2,3]. Insights obtained from force plate data are crucial for developing tailored rehabilitation interventions and for evaluating their effectiveness [4,5]. However, the use of force plates is not without limitations. The primary constraints include their prohibitive cost and the necessity of a controlled laboratory environment, which confines their application and limits the scope for capturing natural gait patterns [6,7]. As an alternative, smart insoles are increasingly gaining attention in the realm of gait analysis. These devices provide a cost-effective and accessible solution compared to traditional force plates [8,9,10]. They offer the versatility to collect data in varied settings, extending their application beyond the laboratory to natural environments. This capability is particularly significant for long-term monitoring and early detection of gait anomalies, as it allows for the collection of more representative and ecologically valid gait data [11,12].
The application of smart insoles as mobile force plates presents a paradigm shift in gait analysis. Their portability and affordability facilitate the capture of gait data in natural, everyday settings, thus addressing one of the significant limitations of traditional force plates. This transition from lab-based to real-world environments is critical for a more comprehensive understanding of gait dynamics in various contexts, which is paramount for accurate diagnosis and effective intervention strategies [13,14,15].
Previous smart-insole studies have investigated activity recognition, plantar-pressure distribution, gait phases, and abnormal gait [11,12,13,14,15,16,17,18,19,20,21,22,23,24,25,26,27]. In rehabilitation, pressure-insole measurements have also been used to characterize altered loading following lower-limb fractures. For example, a recent study found differences in pressure and temporal gait parameters during tibial fracture recovery [28]. Changes in loading and locomotor mechanics also motivate clinical biomechanics in knee osteoarthritis, hip-fracture recovery, and joint gait abnormalities [29,30,31]. Such applications motivate wearable assessment.
Research on mobile force plates and smart insoles has been extensive, focusing on applications from rehabilitation to athletic performance enhancement. These innovations are key in assessing ground reaction forces and center of pressure during movement. Liu et al. [8] created a mobile force plate and 3D motion analysis system (M3D) by integrating compact triaxial force sensors and 3D inertial sensors to estimate multi-axial ground reaction forces and foot orientations throughout consecutive gait movements. Tan et al. [32,33] employed carbon-embedded piezoresistive material sandwiched between two layers of electrodes to create a pressure-sensing insole. While the outcomes of these studies show a strong correlation with the force plate, they are based solely on experiments involving a single participant in a controlled walking environment, raising concerns about their ability to generalize.
In another study [34], five healthy participants were enrolled. Three inertial measurement unit (IMU) sensors were attached to the left toe, lateral side, and heel of an experimental shoe, with an additional IMU sensor at the waist level. Data from 74 steps were collected, with 70% used for training and 30% for testing. A simple long short-term memory (LSTM) model was used to predict the COP, achieving a prediction accuracy of 94% using the Jaccard similarity coefficient [35]. Zhang et al. [36] designed and implemented a system comprising an insole with eight piezoresistive sensors and one IMU. They used a linear regression method to estimate COP trajectories, reporting a root mean square error (RMSE) of 0.72 cm based on data from nine subjects. Fukushi et al. [37] utilized a linear regression model to predict GRF and COP during stair and slope ascent/descent. Their system included eight IMUs and an insole with four pressure sensors. Ten participants performed these tasks, and an average accuracy of approximately R2 = 0.77 was reported for COP estimation. Oubre et al. [38] estimated GRF and COP using random forest algorithms; their system featured a custom-made insole with six force-sensitive resistors (FSRs) and a string-based knee angle sensor. Leave-One-Subject-Out Cross-Validation (LOSOCV) was used to evaluate the system’s performance, and they reported an average R2 value of 0.83 for COP estimation. In comparison to these prior works, our system relies solely on a single pressure-sensing insole (a research prototype) without additional inertial or joint-angle sensors.
Finally, Duong et al. [39] introduced a method using Gaussian process regression to reconstruct COP trajectories with custom-engineered instrumented insoles featuring eight force-sensitive resistor (FSR) sensors and an IMU for overground walking tasks. They recruited seven healthy adults and six patients. Although they reported high accuracy for healthy subjects, with R2 values of 0.99 in the anterior–posterior direction and 0.81 in the medial–lateral direction, their evaluation had some limitations. Specifically, while they employed 10-fold validation, the testing samples came from the same subjects included in the training folds—that is, the separation of training and testing data was based on samples rather than subjects. In contrast, we used a seven-fold cross-validation method, partitioning our dataset of 21 subjects by assigning all samples from three subjects to each fold. This approach enables a more accurate evaluation of the model’s performance on unseen subjects. A selected comparison of relevant smart-insole and mobile force-measurement studies is provided in Table 1. Study populations, sensor arrangements, task conditions, and COP error metrics differ across investigations; the table is descriptive rather than a head-to-head performance benchmark.
Table 1.
Prior work on smart insoles.
In summary, previous studies utilizing smart insoles for force-plate reconstruction have encountered several critical challenges, as follows. Here, “force-plate reconstruction” refers specifically to predicting the six components of a force-plate measurement (Fx, Fy, Fz, Mx, My, and Mz) and deriving COP from plantar-pressure recordings.
- Limitation of algorithm: Studies [17,41,42] highlight issues surrounding the accuracy and reliability of data captured by smart insoles, particularly when assessing GRF and the center of pressure (COP). Existing algorithms have notable limitations in their ability to handle complex non-linear transformations inherent in human movement. This results in loss of the precision required for detailed and reliable analysis of gait patterns, leading to potential errors in diagnosing and addressing gait abnormalities.
- Limited subject variety: A notable drawback in previous research involved relying on data from a very limited number (mostly fewer than 10) of subjects. Many studies were confined to analyzing data from just one or a few individuals, leading to a lack of diversity in the subject pool. This narrow approach significantly restricted the scope and applicability of the findings, as conclusions drawn from such a small sample size may not be representative or generalizable to a broader population. This limitation is evident in prior studies [8,32,33,34], which, despite their contributions, could not provide a comprehensive overview of gait dynamics across different demographics or physical conditions.
- Lack of objective evaluation: Another major shortcoming was the absence of a clear distinction between training and testing datasets in the machine learning model development process. Previous studies often either used the same data for both training and evaluating the models [41,42] or split the dataset for training and testing based on samples instead of subjects [32,33,40,43]. This approach undermines the objectivity of the evaluation, as it does not test the model’s ability to perform accurately on previously unseen data. Without a crucial split between training and testing data by subject, it is challenging to assess the true predictive power and generalizability of the models, raising concerns about their practical utility in real-world applications.
This study addresses these limitations by evaluating a high-density pressure-sensitive insole in a larger cohort than many earlier mobile-force-plate studies and, importantly, by separating training and testing data at the participant level. The proposed approach uses a customized ResNet-18 regression model to estimate six force-plate outputs from 89 plantar-pressure measurements. Note that we included quiet standing alongside in-place walking because the tasks present complementary loading regimes: standing permits assessment under relatively stable vertical loading and slow postural shifts, whereas marching in place imposes cyclic load transfer and larger changes in force and moment. Postural control and its measured components can vary between populations [44]. The standing task is not intended as a substitute for a dynamic-gait assessment. Our objective is to assess the feasibility and limitations of pressure-insole-based force-plate estimation under controlled conditions as a step toward future mobile biomechanical monitoring. Beyond clinical gait assessment, such wearable, field-deployable force estimation could support athletic training and injury prevention applications, for example, by monitoring loading asymmetries or fatigue-related changes in ground reaction forces during outdoor running or field-based training, where laboratory force plates are impractical.
This feasibility study makes three contributions: (1) pressure-only prediction of six right-foot force/moment components and derived COP; (2) a common subject-wise seven-fold evaluation protocol for both walking and standing, with three of 21 participants held out in each fold; and (3) explicit assessment of two complementary loading regimes with synchronized 50 Hz inputs and reference outputs. Each participant contributed one five-minute, 15,000-frame dataset per task. The conclusions remain restricted to these controlled trials. Overground, injury rehabilitation, and higher-frequency events require separate validation.
2. Materials and Methods
2.1. Force Plate Outputs
Force plates measure three force components (Fx, Fy, and Fz) and three moment components (Mx, My, and Mz). In this study, each 89-element input vector came from sensors under the right foot; the six corresponding reference outputs were recorded by the force plate beneath that foot. Left-foot recordings were not combined with the right-foot targets. Only the right foot was modeled, for three reasons. First, the estimation problem is defined separately for each foot: each foot stood on its own force plate, so that plate measured only the ground-reaction forces and moments transmitted through that foot, and the insole beneath it recorded only that foot’s plantar pressure. Left-foot pressure therefore carries no direct information about the right-foot plate outputs, and combining the two would mix signals from two independent load paths. Second, a single instrumented insole was available. Placing it on the same foot for every participant kept insole fixation, synchronization, and the insole-thickness correction identical across participants. Third, ground-reaction-force patterns of the left and right feet are largely symmetric in healthy adults [45,46], so a single-foot model is expected to reflect the method’s performance for either foot. Applying the model to the left foot would require mirroring the mediolateral sensor layout and the signs of the mediolateral components. COP was derived from the predicted forces and moments, rather than learned as a separate output. Specifically, the forces measured are as follows:
- Fx (mediolateral force): Reflects side-to-side movements, crucial for analyzing lateral stability.
- Fy (anteroposterior force): Indicates forward and backward dynamics, integral in studying propulsion and braking forces during gait.
- Fz (vertical force): Essential for understanding weight-bearing dynamics, particularly in activities like walking and standing.
Moments captured by these plates are equally important, representing the torques about the respective axes:
- Mx (torque about the X-axis): Indicative of rotational tendencies in the sagittal plane.
- My (torque about the Y-axis): Indicative of rotational tendencies in the frontal plane.
- Mz (torque about the Z-axis): Represents twisting movements due to horizontal-plane forces.
The center of pressure (COP) was derived from the six-component force-plate measurements after correcting the moments for the manufacturer’s calibrated true-origin offsets. The offsets (x0, y0, and z0) were obtained from the AMTI force plate’s calibration certificate, and the magnitude of the vertical offset was increased by the measured insole thickness t to represent the raised right-foot contact surface. Because z0 is negative in the AMTI coordinate convention (the true origin lies below the plate surface), the effective vertical offset is z0 − t. In vector notation, the corresponding moment-origin translation can be written as
M_corrected = M_plate − d × F, d =( x0, y0, z0 − t).
Here F = (Fx, Fy, Fz) and M_plate = (Mx, My, Mz). The offset directions and component signs follow the AMTI calibration coordinate convention. Under the COP component convention adopted for this analysis, the coordinates were derived from the offset-corrected moments, as follows:
COPx = My,corrected/Fz; COPy = Mx,corrected/Fz.
The identical calibration-origin and insole-thickness correction was used when deriving reference COP from measured force/moment values and estimated COP from model-predicted force/moment values. The moment-origin translation also accounts for the contributions of horizontal forces to moments at the raised contact plane. Equation (2) therefore uses offset-corrected rather than raw plate moments. COP was calculated only for frames with vertical force Fz ≥ 20 N to avoid unstable division at very low loading. The actual offset values are plate specific and were taken from the manufacturer’s calibration certificate. For the right-foot plate, the certificate offsets were x0 = 0.051 mm (0.0020 in), y0 = 0.203 mm (0.0080 in), and z0 = −39.751 mm (−1.5650 in), and the measured insole thickness was t ≈ 1 mm, giving an effective vertical offset of z0 − t ≈ −40.75 mm.
2.2. ResNet Architecture for Simulating Force Plate Data
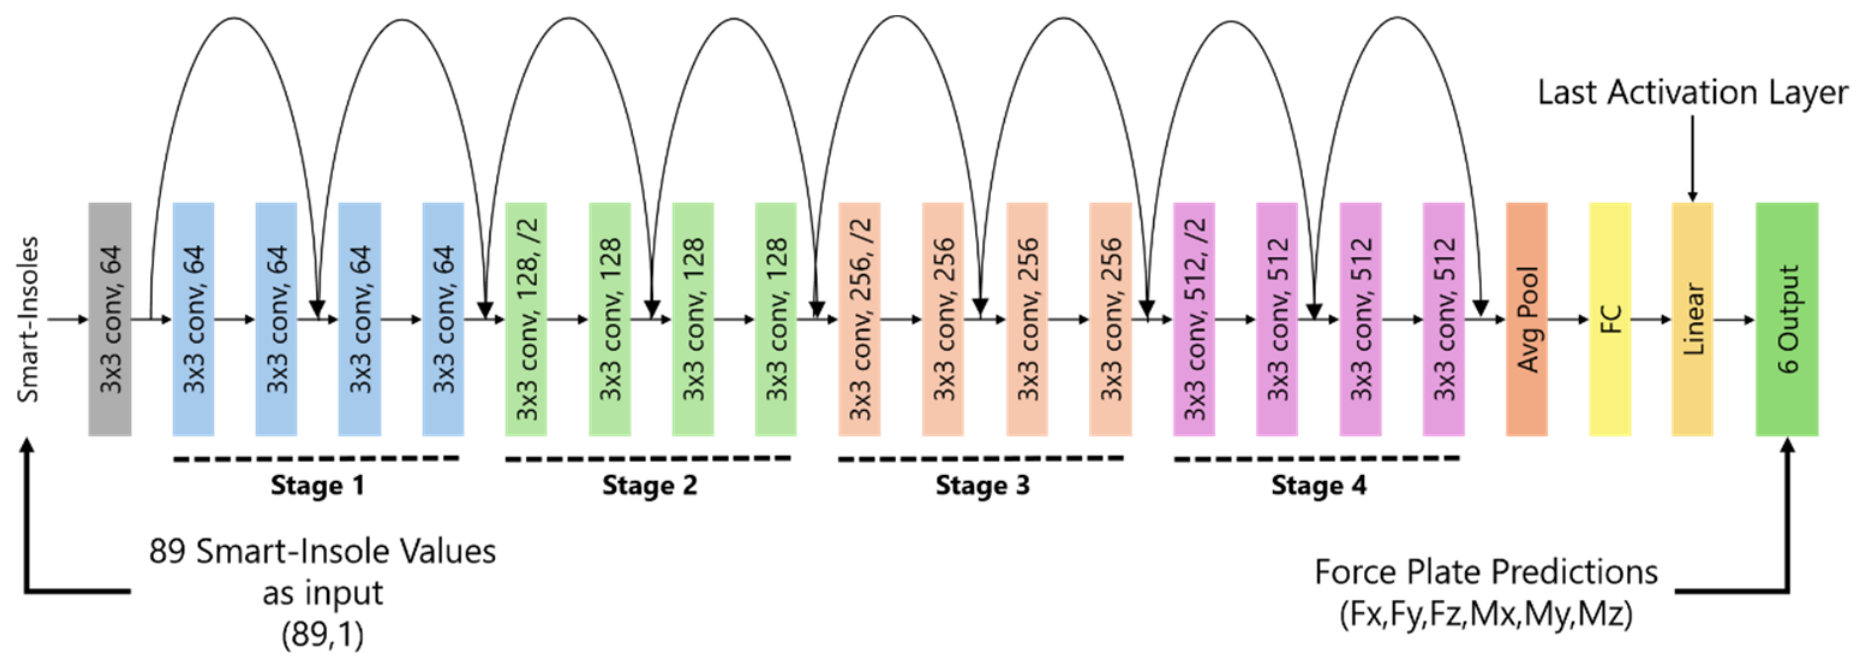
The study adapted ResNet-18 [47] to a six-output regression task. Each observation consisted of a single 89-element plantar-pressure vector (not a temporal window). Sensor indices were arranged to follow their physical positions on the insole. Each sensor channel was standardized using Z-score normalization, with its mean and standard deviation calculated exclusively from the training participants in the corresponding fold. Those training-derived parameters were applied unchanged to the held-out test participants, preventing test-set statistics from entering preprocessing. The ordered vector was processed using one-dimensional convolutional layers and residual blocks, and the final layer generated Fx, Fy, Fz, Mx, My, and Mz. The model consequently learns spatially ordered pressure-feature relationships rather than processing an ordinary two-dimensional image.
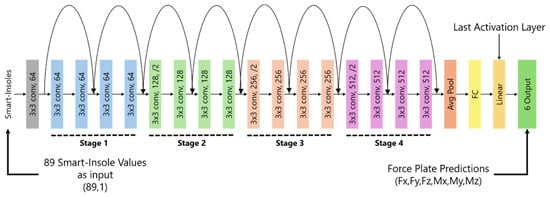
The regression network processes an 89 × 1 input through a one-dimensional convolutional stem, residual stages, global average pooling, and a six-component regression output (Figure 1).
Figure 1.
One-dimensional ResNet-18 regression architecture. A single Z-score-normalized, physically ordered 89-element sensor vector yields six force/moment predictions. COP is subsequently calculated from predicted forces and moments.
- Convolutional layers within residual blocks: Detect local patterns in the input data.
- Global average pooling layer: Reduces the dimensionality of the data, discarding fewer informative details.
- Fully connected layer: Interprets the associations between input features and the targeted force-plate values.
- Output layer: Produces the model’s predictions for the various force plate values.
2.3. Subjects
Twenty-one adults were enrolled from university volunteers (11 women aged 22–39 years and 10 men aged 23–35 years). Body mass ranges were 43–80 kg for women and 53–87 kg for men, and height ranged from 146 to 185 cm. Eleven participants were from Indonesia and ten from Taiwan. Seventeen were students and four were researchers. Eligibility was screened by a self-reported questionnaire before testing. Inclusion required (1) age 20–60 years, (2) ability to walk and stand independently without assistive devices, and (3) no current self-reported lower-limb or back pain. Exclusion criteria were (1) neurological, musculoskeletal, or vestibular disorders affecting gait or balance; (2) lower-limb or spinal injury/surgery in the previous six months; (3) relevant foot deformities (e.g., severe flatfoot or hallux valgus) or diabetic foot conditions; and (4) pregnancy. All 21 screened volunteers were enrolled, with no screening exclusions. Health status was self-reported, not independently clinically verified. No a priori power calculation was performed. Instead, the sample size was set by feasibility. It is larger than those of the comparable mobile-force-plate and smart-insole studies in Table 1 (1–17 participants). Including both sexes and a wide range of body mass (43–87 kg) and height (146–185 cm) increases between-participant variability. Rather than masking this variability, subject-wise testing exposes it as a wider spread of participant-level R2 (e.g., walking Mz, Section 3.1). This was a small, exploratory feasibility cohort.
2.4. Experimental Setup and Data Collection
2.4.1. Hardware
- AMTI force plates: Two AMTI six-component force plates (model BP400600-2000; Advanced Mechanical Technology Inc., Watertown, MA, USA) were used as reference instruments. They were chosen because (1) they measure three orthogonal forces and three moments simultaneously, allowing COP to be calculated for the same foot; (2) each plate is supplied with a factory 6 × 6 calibration matrix that corrects cross-talk between channels, together with certified true-origin offsets; (3) AMTI strain-gauge platforms are widely used as reference instruments in gait and posture laboratories, which eases comparison with prior work; and (4) two plates allowed right- and left-foot loads to be recorded separately. The manufacturer’s calibration certificate supplied the plate-specific true-origin offsets (x0, y0, and z0), which were used for COP correction. No comparative experiment or manufacturer-verified superiority over other force-plate brands is claimed. The plates were zeroed and checked using known weights before each session.
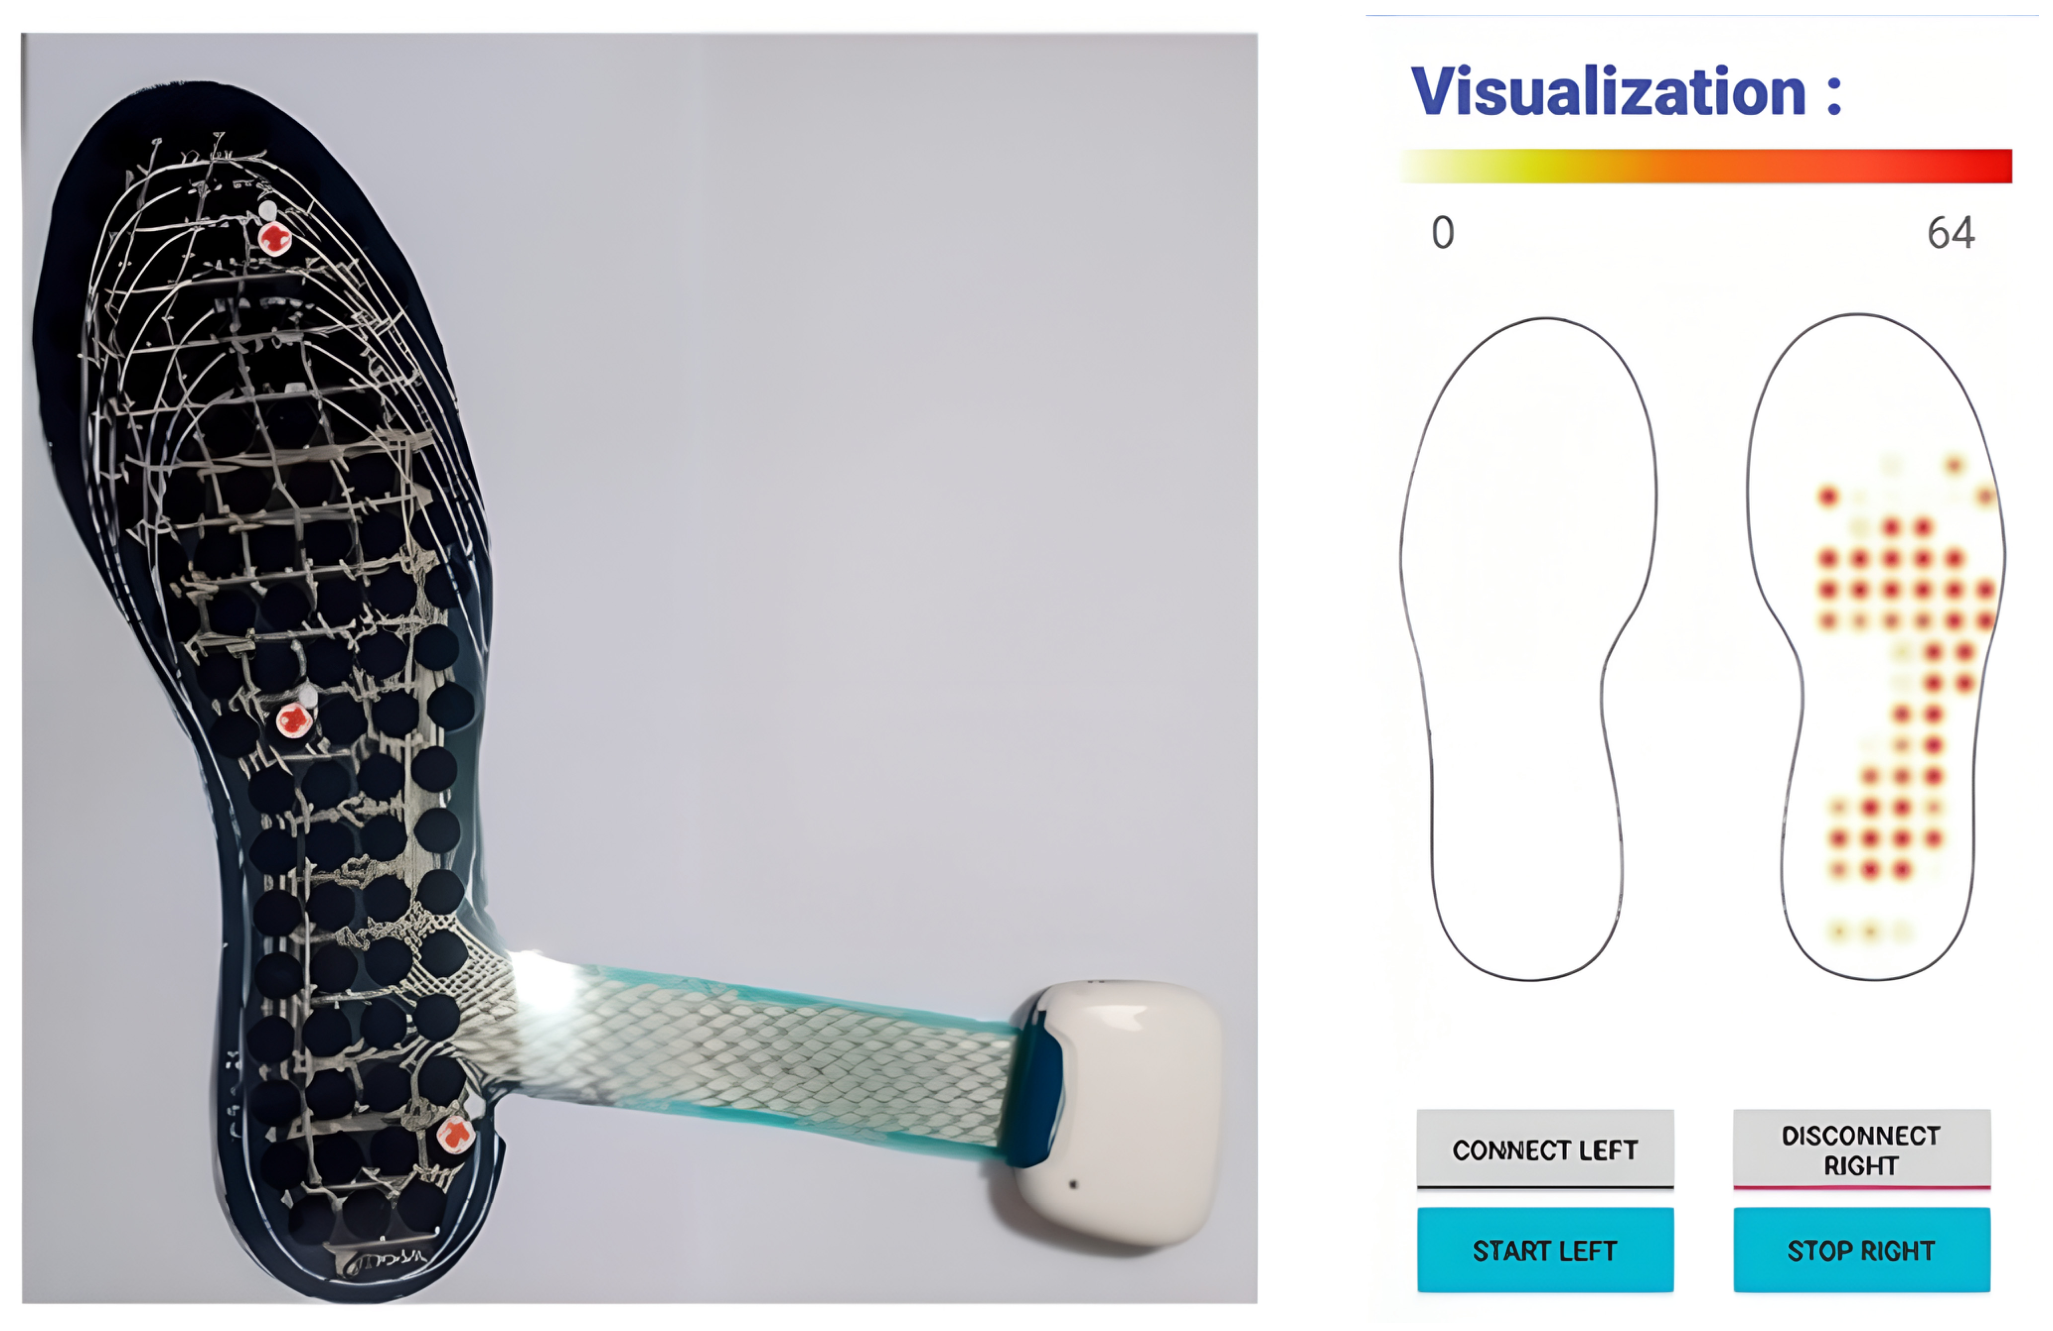
- ITRI pressure insole and force-plate sampling: The ITRI research prototype insole (Hsinchu, Taiwan) contains 89 polymer pressure-sensitive elements with fork-type electrodes. Sensor readings were sampled at 50 Hz and sent by Bluetooth to a smartphone (reported transport latency 50–100 ms; mean 74 ms). Two AMTI BP400600-2000 plates supplied the reference six-axis measurements at 1000 Hz. Using Python 3.10 scipy.signal, force-plate channels were low-pass filtered with a fourth-order zero-lag Butterworth filter (20 Hz cutoff), then downsampled by a factor of 20 to 50 Hz. The filter reduces aliasing but attenuates loading features above its passband. Model performance is evaluated against the filtered 50 Hz references rather than original full-bandwidth peaks [48]. Temporal alignment is described in Section 2.4.2.
2.4.2. Software and Time Alignment
- Android insole application: A custom-built Android application received Bluetooth data, displayed the plantar-pressure distribution and logged the 50 Hz samples (Figure 2). It was used for acquisition and visualization, not as an independently validated reference instrument. Bluetooth timestamp jitter and packet loss were not separately quantified.
- Acquisition, preprocessing, synchronization, and machine learning software: Force-plate signals were collected from two AMTI force plates using Vicon Nexus 2.16 (Vicon Motion Systems Ltd., Oxford, UK) on a Windows 10 PC. The insole was logged using the custom Android application. Filtering and resampling were implemented in Python [49] using SciPy [50] (scipy.signal.butter and filtfilt for zero-lag filtering); the regression model was implemented in PyTorch 2.2 [51]. The PC and Android device were referenced to network time (NTP). After low-pass filtering and conversion to 50 Hz, residual lag was determined by maximizing the cross-correlation between insole-derived total vertical load and force-plate vertical GRF (Fz). Applying that lag produced paired 20 ms samples, each containing 89 sensor inputs and six force/moment reference outputs. Cross-correlation corrects bulk offset, but does not demonstrate the absence of timestamp jitter or drift.
Figure 2.
The ITRI smart insole and its companion smartphone application.
2.4.3. Equipment Calibration
- Force plates: Before each session, plate readings were zeroed and checked using known weights. The AMTI manufacturer-calibrated true-origin offsets (x0, y0, and z0) were used when calculating COP, and the measured right-insole thickness was subtracted from z0 (z0 − t, increasing its magnitude) to reference the raised contact surface. This is a coordinate correction, not a mechanical compensation for the thickness of the insole.
- Smart insole: Sensors were checked for functionality and correctly paired with the recording device.
- Data collection setup: Force plates acquired reference signals at 1000 Hz. The rate of 50 Hz refers to the resampled reference stream used in the paired dataset and regression model, not the original force-plate acquisition rate. Right-foot insole vectors were paired with the underlying right-foot plate forces/moments. During standing, the left foot was supported on the separate plate and left-foot outputs were not used as right-foot prediction targets. Signal filtering, resampling, and residual-lag alignment are specified above.
2.4.4. Walking Experiments
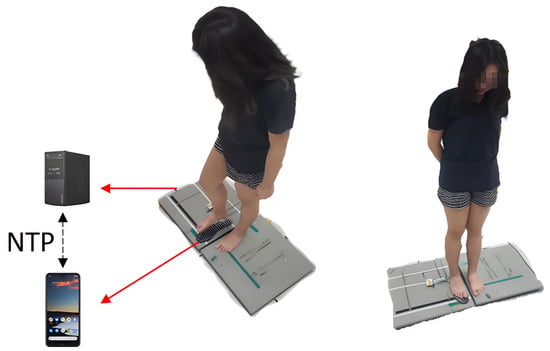
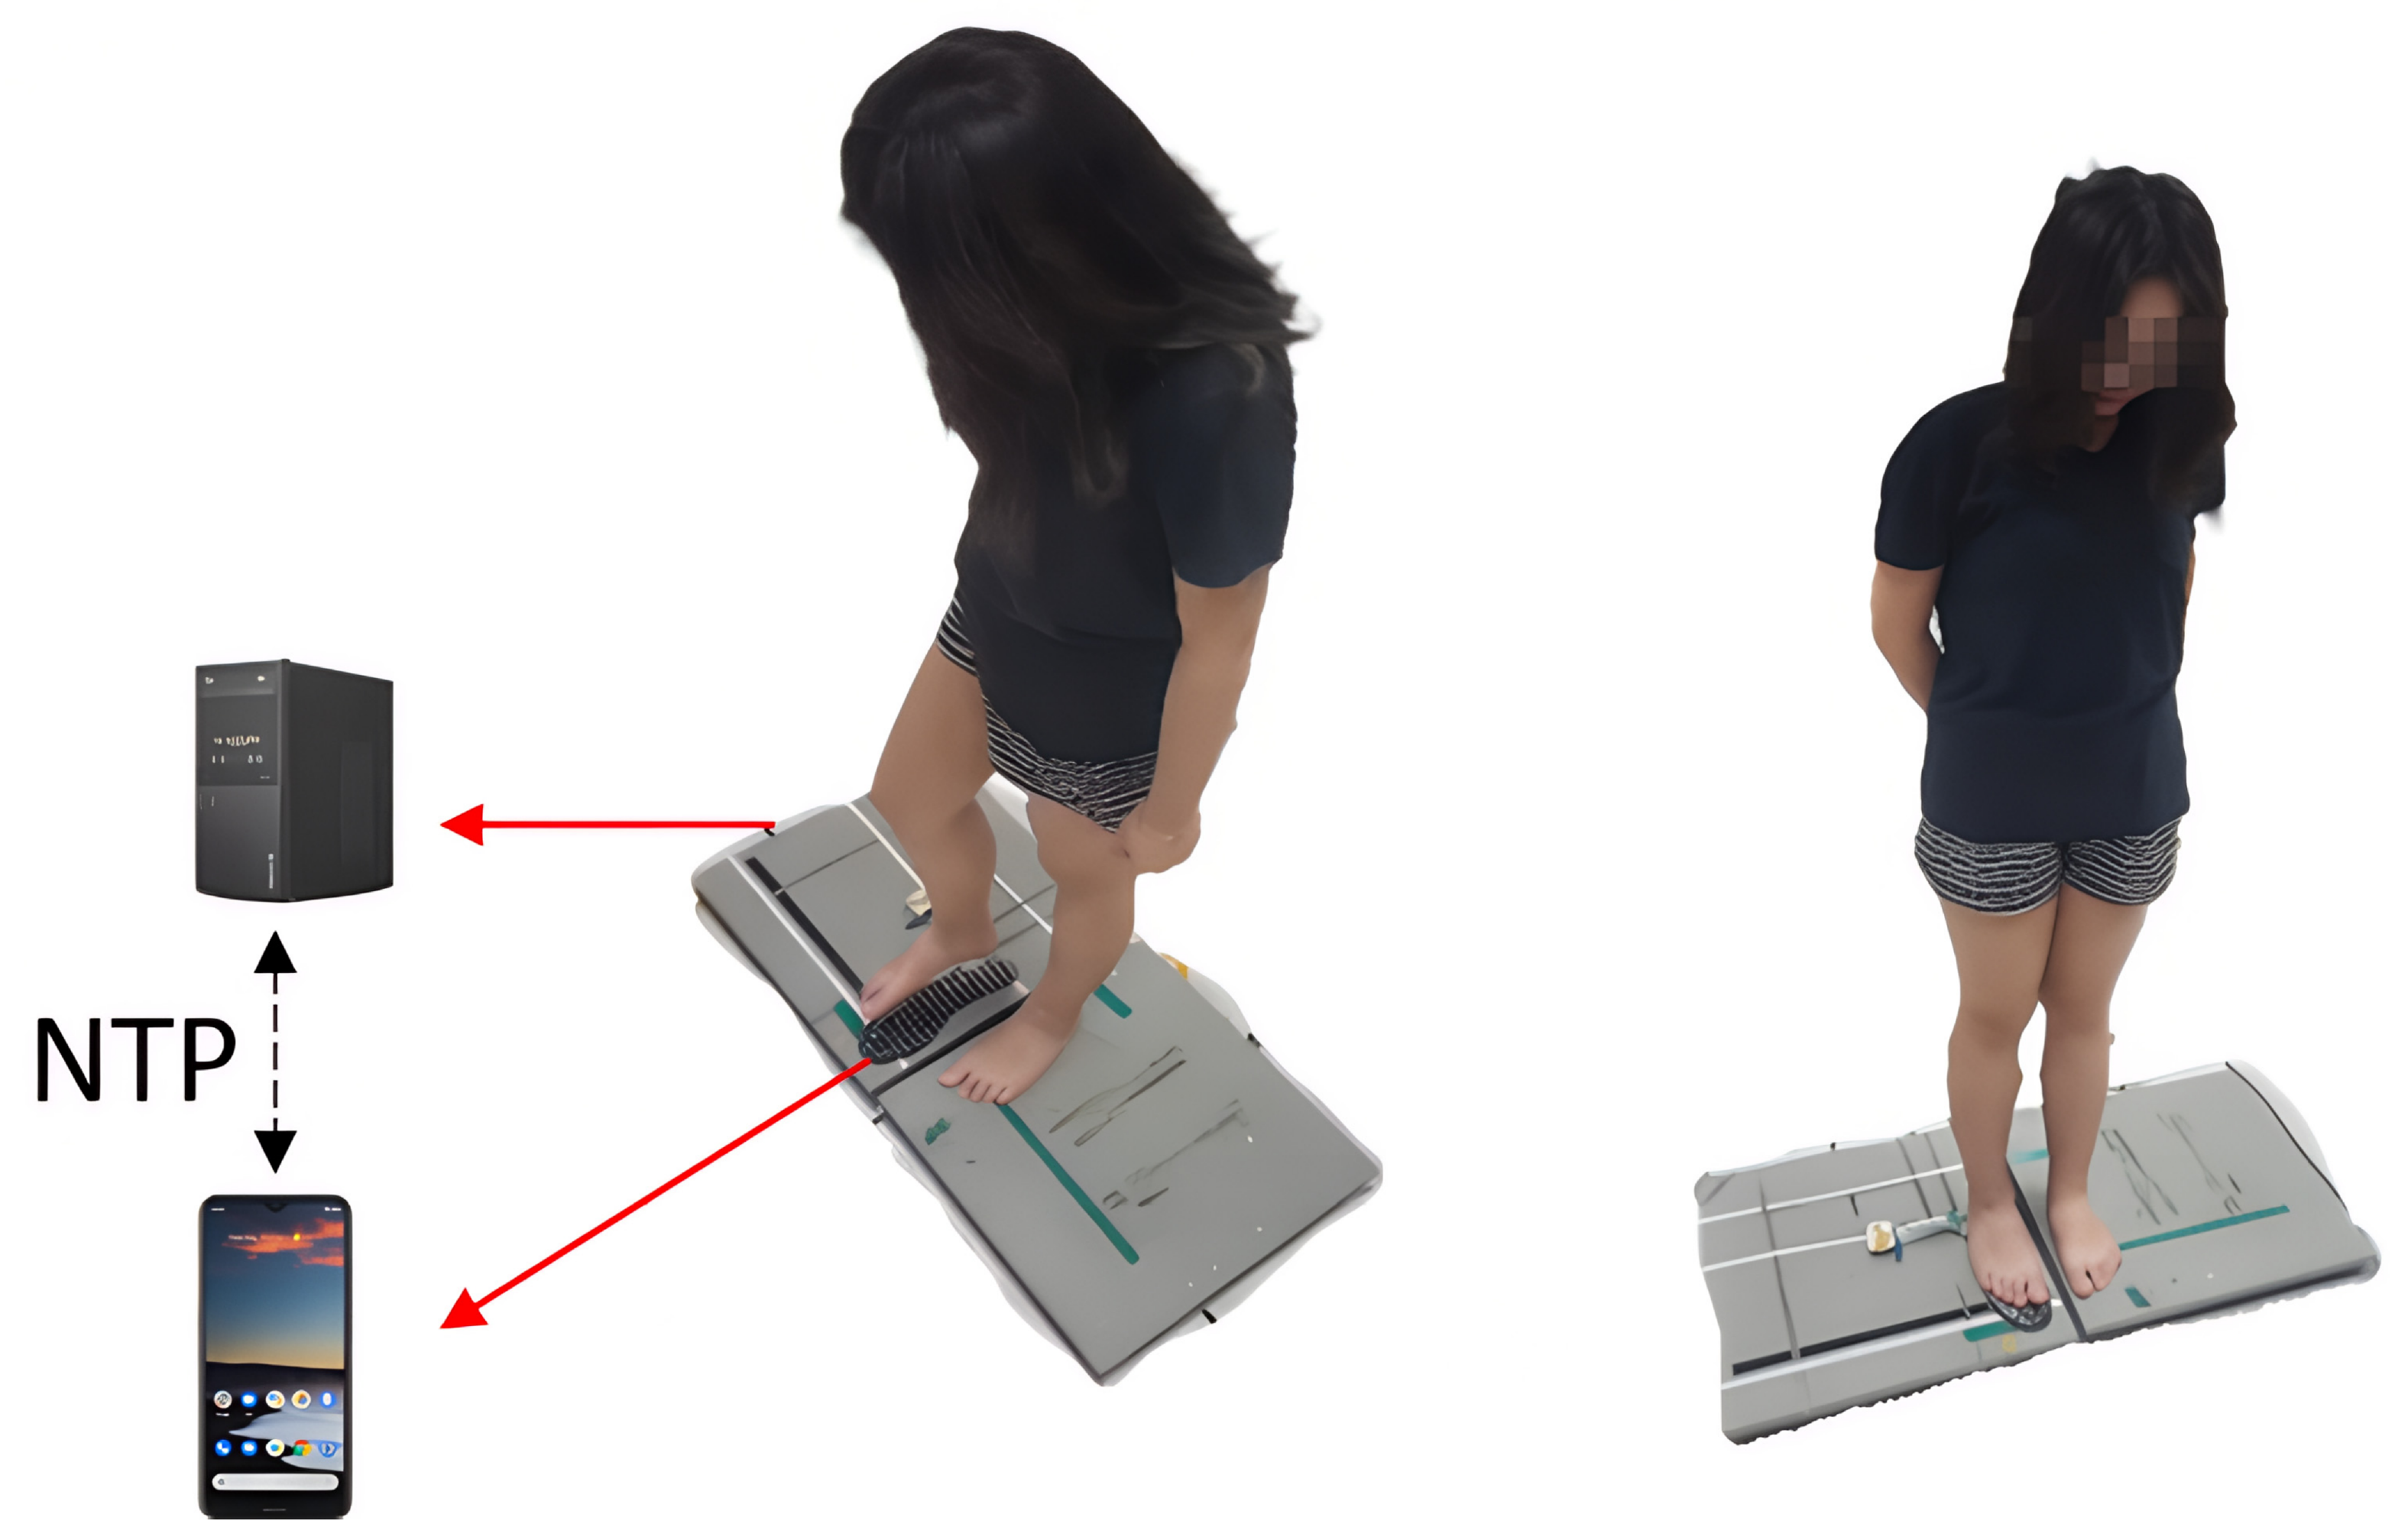
Each participant completed a five-minute in-place walking/marching trial (approximately 300 steps), yielding 15,000 synchronized 50 Hz frames. As Figure 3 shows, the participants were barefoot. The right foot contacted the pressure-sensitive insole on top of its force plate. The left foot stepped directly on the second force plate without an insole. The insole was secured with double-sided adhesive tape to reduce movement relative to the plate. Participants were instructed to keep the right foot within the sensorized area. Tape fixation helps maintain device position but does not eliminate movement of the foot relative to the insole, or trial-to-trial placement variability. Marching in place is biomechanically distinct from overground walking.
Figure 3.
Illustration of the in-place walking and standing experiments. Data from the insole are sent to a smartphone and force-plate data are sent to a PC; both are synchronized via NTP. Barefoot setups for in-place walking and quiet standing: the right foot rests on a pressure-sensing insole secured by double-sided tape on one force plate; the left foot has no insole; possible support-height asymmetry due to insole thickness is acknowledged.
2.4.5. Standing Experiments
Each participant completed five minutes of quiet standing, with all 15,000 synchronized frames retained for the force/moment prediction analysis. For COP calculations, frames with vertical force below 20 N were excluded. Participants first assumed a stable stance and then were asked to avoid deliberate large weight shifts or foot movements. Both feet were barefoot. The right foot stood on the pressure-sensitive insole, secured to one plate with double-sided tape. The left foot stood directly on a separate plate (Figure 3). Normal postural sway remained possible and is an uncertainty source.
Two AMTI force plates provided independent right- and left-foot measurements during standing. Only right-foot targets were modeled. The insole thickness was measured and used to increase the magnitude of the manufacturer’s vertical origin offset (z0 − t) when calculating COP for the right foot (Section 2.1). This geometric correction addresses the COP reference-plane height, but it does not remove any genuine stance or load-sharing changes caused by the right foot being physically raised above the left.
2.4.6. Training and Testing Data
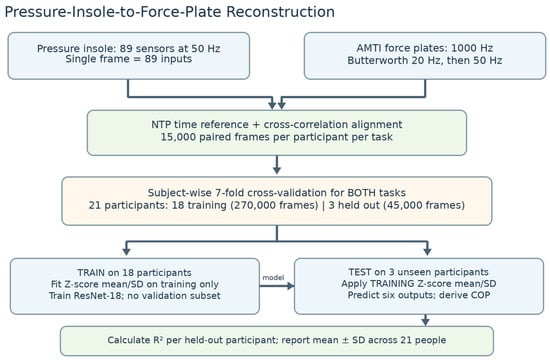
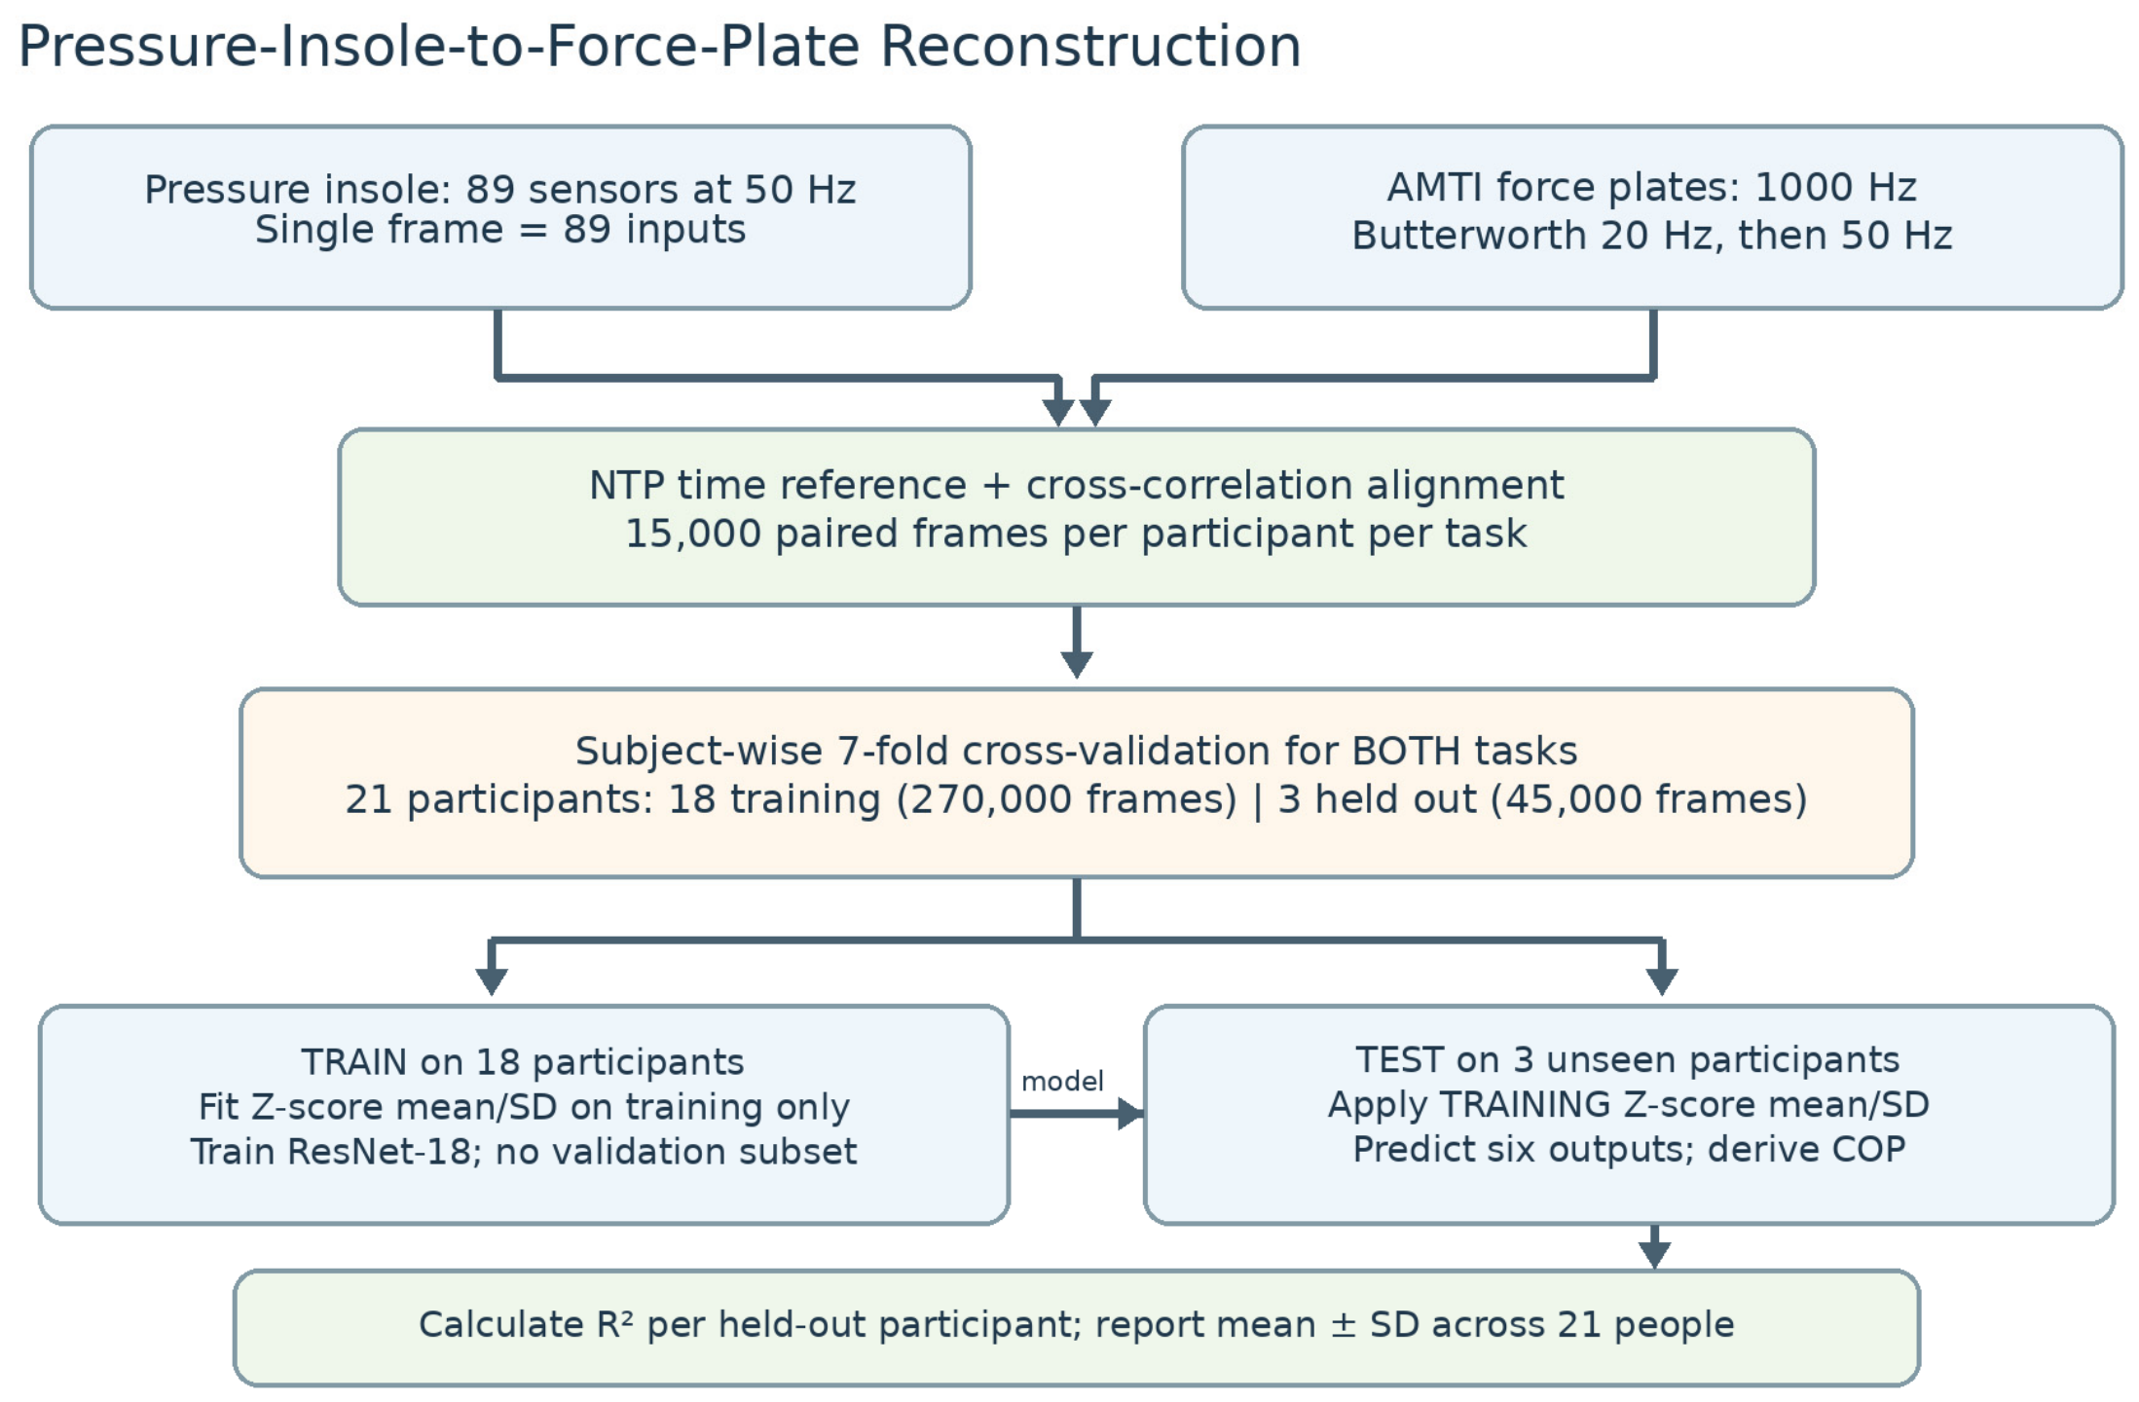
The same subject-wise seven-fold cross-validation approach was used for walking and standing. The 21 participants were randomly allocated to seven disjoint groups of three participants. In each fold, three entire participants (45,000 frames) were held out for testing; the other 18 participants (270,000 frames) were used to train the regression model. No separate validation set was used for hyperparameter tuning. Within each fold, Z-score means and standard deviations were computed from the 18 training participants only and then applied unchanged to their training records and the three held-out participants’ test records. Every participant provided 15,000 retained, synchronized 50 Hz frames per task, so each task comprised 315,000 frames and each participant was tested exactly once over the seven folds. Data were paired individual time frames, not independent gait cycles. Adjacent measurements from the same participant were temporally autocorrelated. Thus, the independent-person sample size was 21. The experimental and analytical workflow of this study is shown in Figure 4.
Figure 4.
Experimental and analysis workflow. Both tasks used seven subject-disjoint folds, each with 18 training participants (270,000 frames) and three held-out test participants (45,000 frames). Z-score parameters were fitted using training data only and applied unchanged at test time. No separate validation subset was used for hyperparameter tuning. Force-plate signals were filtered and downsampled before temporal alignment with the insole recordings.
2.5. ResNet Model Configuration and Training Parameters
- Input layer: Readings from the 89 pressure sensors of the smart insole were used as input features.
- Convolution: 64 filters, a 7 × 1 kernel size, and a stride of 2.
- Residual blocks: Four blocks, each with multiple layers and varying numbers of filters (64, 128, 256, and 512).
- Global average pooling: Transforms the extracted features into a 512-dimensional vector.
- Output layers: Six outputs, each tailored for regression tasks corresponding to the key force plate values (Fx, Fy, Fz, Mx, My, and Mz).
Training used 50 epochs, an Adam optimizer with learning rate 1 × 10⁻⁴, mean squared error loss and batch size 64.
2.6. Statistical Analysis
For each task and output variable, predictive agreement was evaluated with the coefficient of determination R2 = 1 − Σ(y − ŷ)2/Σ(y − ȳ)2 and normalized root mean squared error (NRMSE = RMSE/[max(y) − min(y)]). Reference and predicted COPx/COPy were computed from their respective six-component force/moment values using the same plate-specific true-origin offsets (x0, y0, and z0) obtained from the AMTI calibration certificate, with the magnitude of the vertical offset increased by the measured insole thickness (Section 2.1). Frames with vertical force below 20 N were excluded from COP calculations. This exclusion does not alter the frame accounting for six-axis force/moment regression. Per-participant R2 was calculated for each of 21 out-of-fold participants, and the reported mean ± sample SD summarizes variability between participants rather than between correlated frames. No inferential significance tests were undertaken.
The participant was the independent unit for between-subject inference. Seven-fold withholding ensured that no held-out participant appeared in the model-development records for the corresponding fold. Per-participant R2 was calculated from each participant’s complete held-out prediction sequence and then summarized across the 21 participants. The 315,000 time points per task describe correlated repeated measurements and should not be interpreted as 315,000 independent biological replicates. Because R2 can be negative for poorly predicted individuals, both mean and SD are reported rather than claiming uniformly high accuracy.
Each five-minute task comprises 21 × 15,000 = 315,000 unique synchronized frame pairs. 630,000 pairs were recorded across the two tasks. Each of the seven folds evaluated three new participants (45,000 test frames) and trained on the other 18 (270,000 frames). Across folds, each subject contributed to the held-out prediction set exactly once. Z-score normalization was fitted within each fold using its training subset only. The resulting channel statistics were then applied to held-out test data. For inference, participant-level R2 mean and SD were used, not the number of frames.
3. Results
The dataset included 21 participants with five minutes of paired right-foot insole and force-plate signals for each of two tasks (315,000 frames per task). Both tasks used randomly assigned subject-wise seven-fold cross-validation, with three participants held out at a time. The remaining 18 participants were used for training. Test data were normalized using training-derived Z-score statistics. Signals were aligned after 20 Hz zero-lag Butterworth filtering, downsampling to 50 Hz and cross-correlation lag correction. Performance in both tasks is summarized as participant-level mean ± SD of held-out R2, avoiding the assumption that frame-to-frame observations are independent.
3.1. Prediction Results for Walking Scenarios
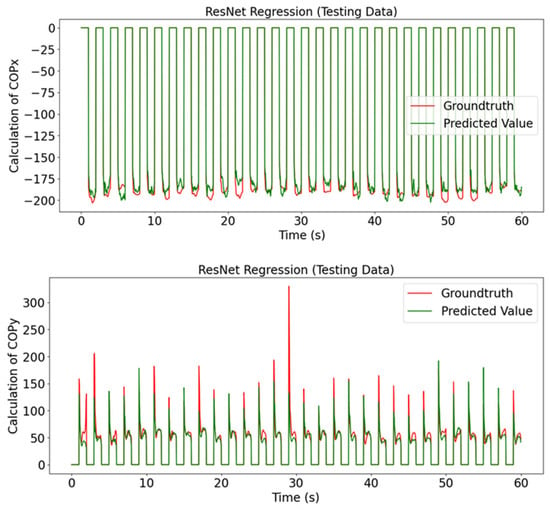
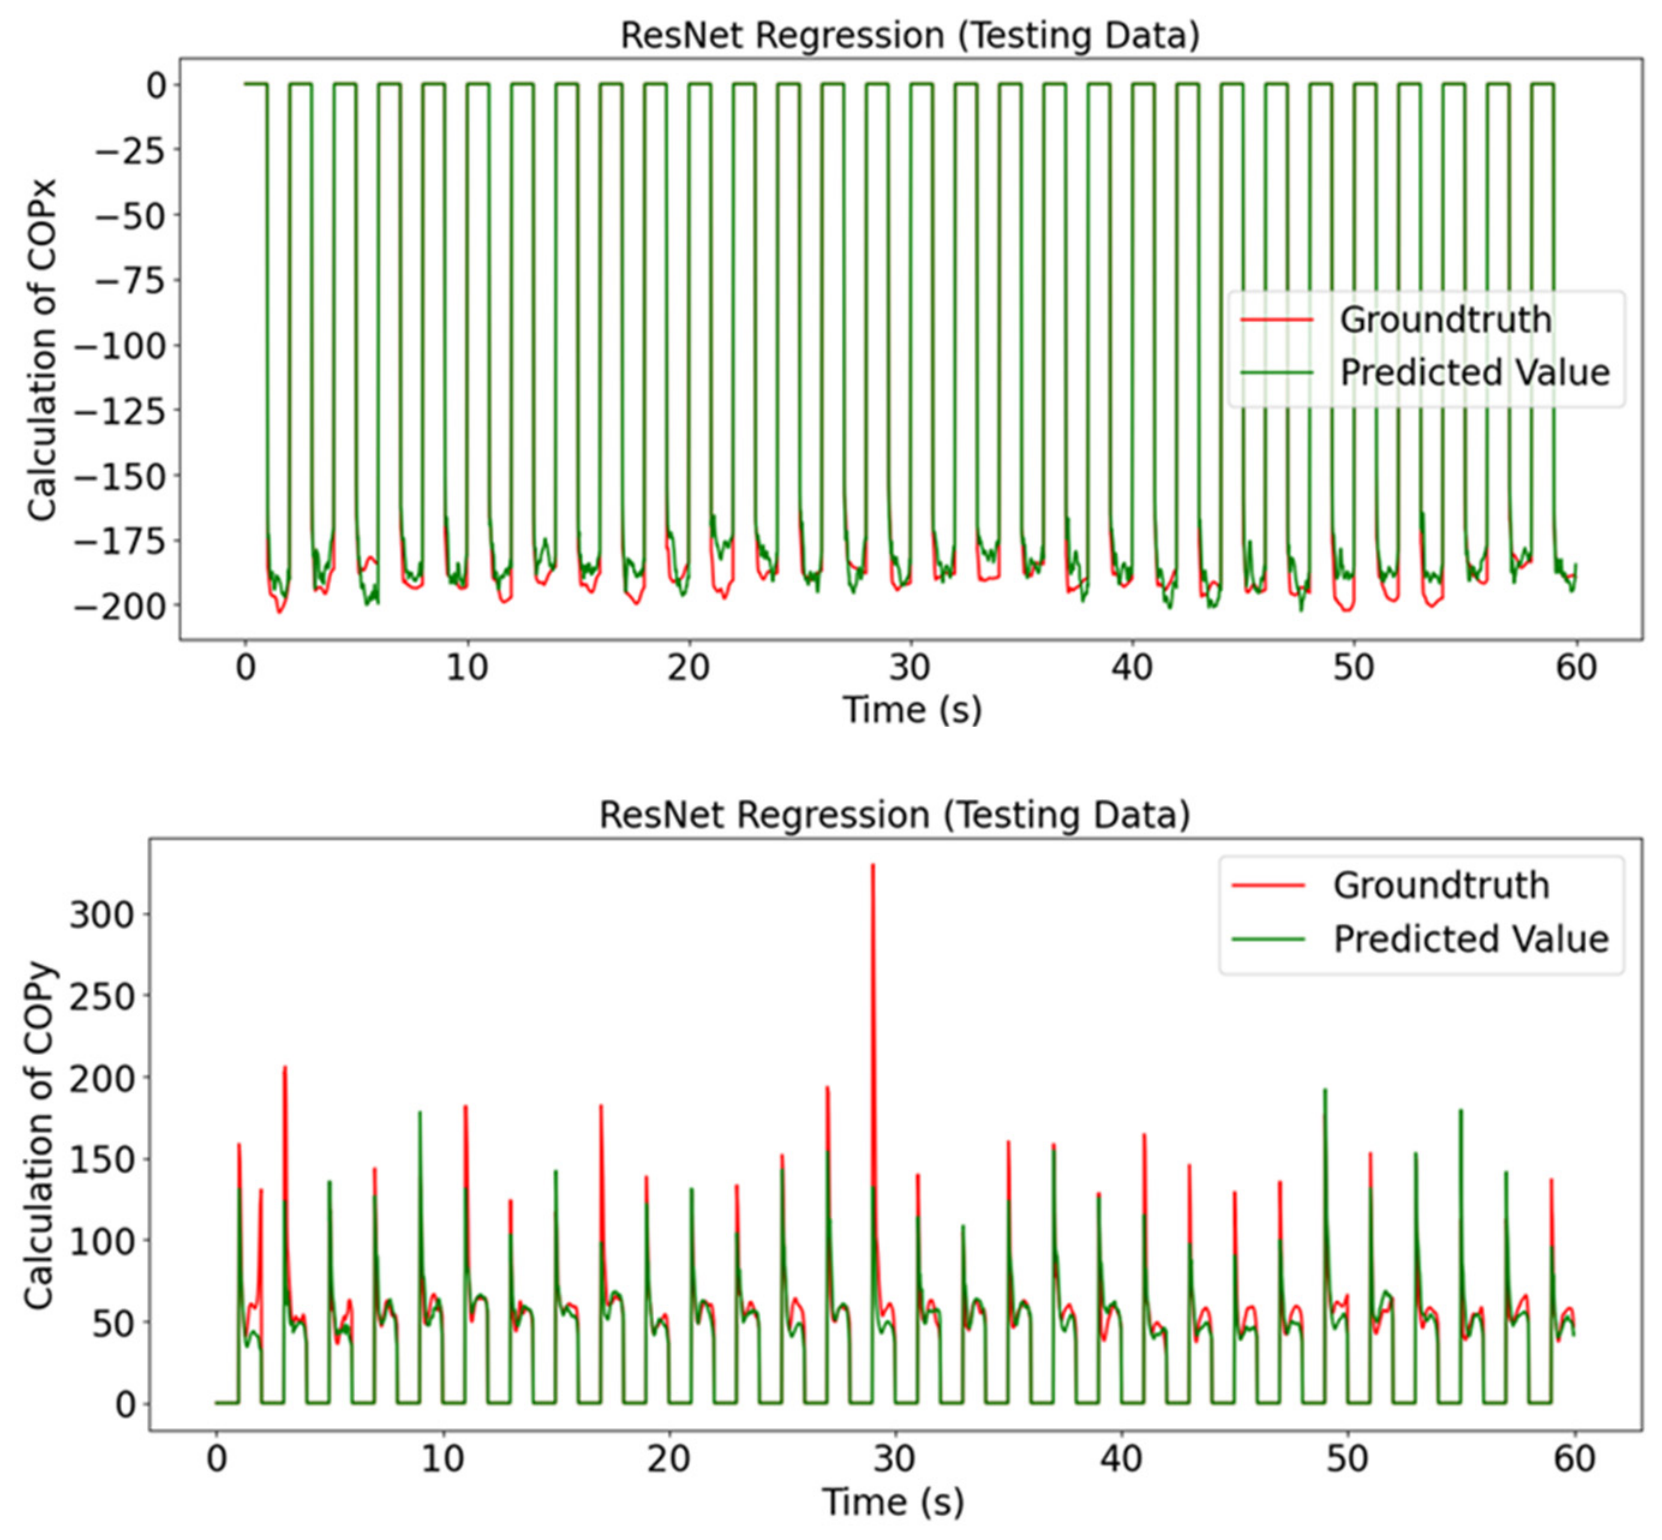
For in-place walking, the participant-level mean ± SD of held-out R2 was 0.88 ± 0.071 (Fx), 0.80 ± 0.062 (Fy), 0.89 ± 0.075 (Fz), 0.95 ± 0.090 (Mx), 0.89 ± 0.078 (My), and 0.43 ± 0.390 (Mz). COPx and COPy reached 0.99 ± 0.039 and 0.76 ± 0.055 (Table 2). The corresponding normalized root mean square errors (NRMSEs) were 0.05, 0.08, 0.05, 0.03, 0.03, and 0.20 for Fx, Fy, Fz, Mx, My, and Mz, respectively, and 0.02 and 0.11 for COPx and COPy, respectively. Walking Mz had both lower average R2 and much greater between-participant variability than most other outputs. In a separate, exploratory post hoc sensitivity calculation, the existing held-out predictions for the tallest and shortest participant were omitted and the predictions from the remaining 19 participants (285,000 frames) were concatenated to obtain pooled Mz R2 = 0.81. Because this pooled R2 uses a different aggregation from the primary 21-participant mean ± SD, 0.81 is not a direct increase from 0.43 and is not evidence of improved generalization. Representative predicted and measured COP trajectories are shown in Figure 5.
Table 2.
In-place walking: mean and sample SD of R2 across 21 held-out participants (subject-wise seven-fold evaluation).
Figure 5.
Representative measured and predicted right-foot COPx and COPy for in-place walking.
3.2. Prediction Results for Standing Scenarios
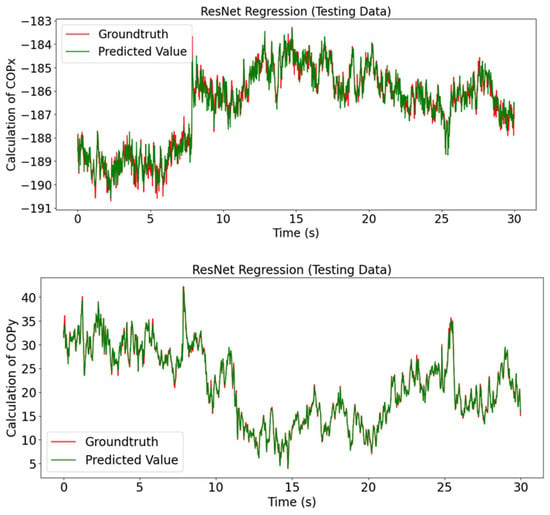
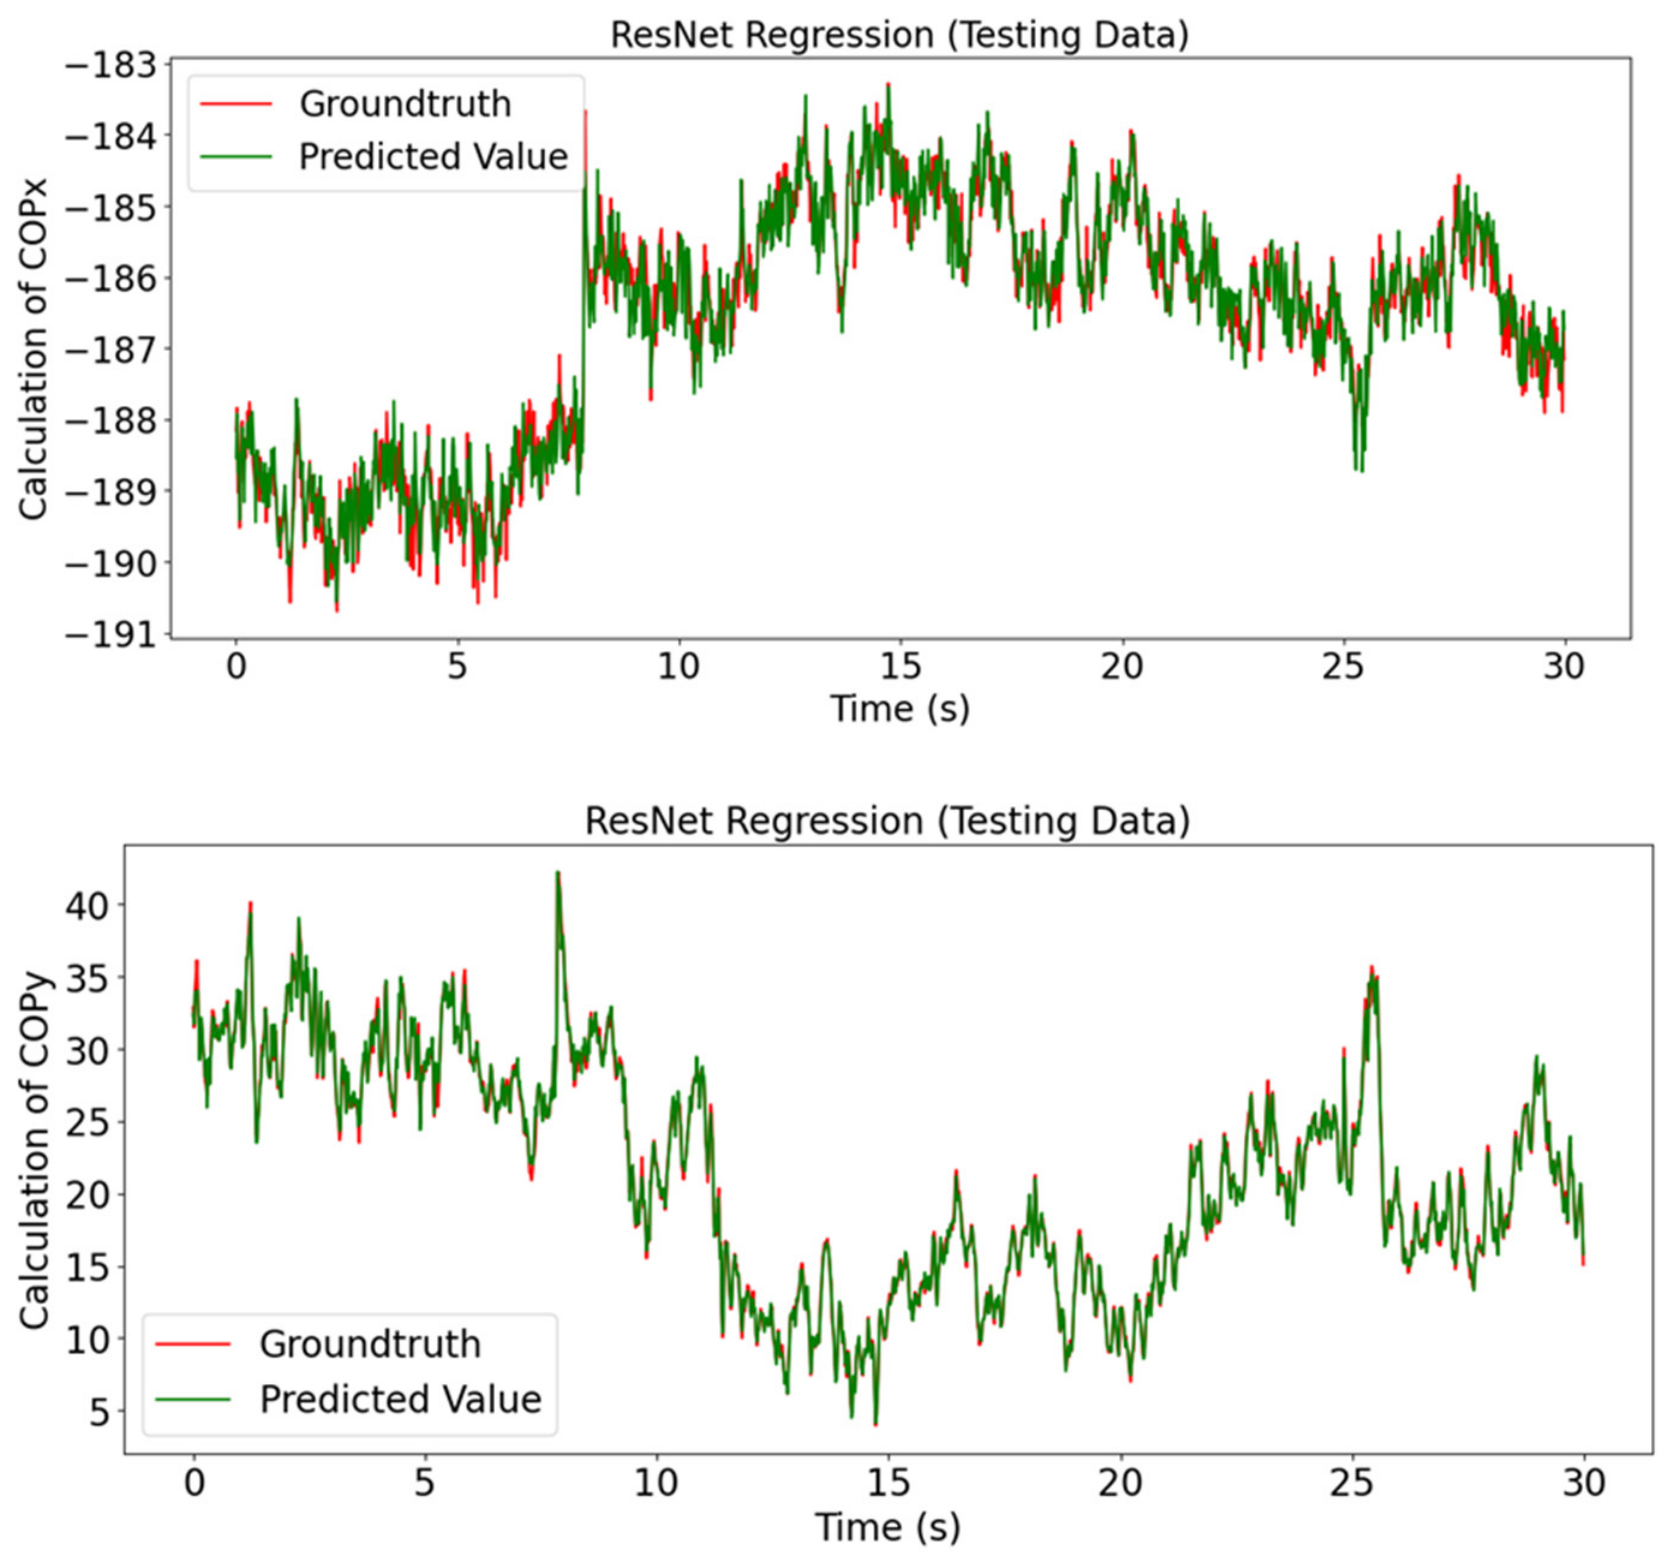
For quiet standing, the participant-level mean ± SD of held-out R2 was 0.83 ± 0.053 (Fx), 0.86 ± 0.051 (Fy), 0.99 ± 0.040 (Fz), 0.99 ± 0.038 (Mx), 0.99 ± 0.037 (My), and 0.83 ± 0.049 (Mz). COPx and COPy reached 0.77 ± 0.029 and 0.98 ± 0.033 (Table 3). Although the standing task yielded high mean R2 for several outputs, these results characterize the controlled quiet-standing condition rather than natural walking or force-plate interchangeability. Figure 6 shows representative measured and predicted right-foot COPx and COPy trajectories for quiet standing.
Table 3.
Quiet standing: mean and sample SD of R2 across 21 held-out participants (subject-wise seven-fold evaluation).
Figure 6.
Representative measured and predicted right-foot COPx and COPy for quiet standing.
The arithmetic mean of the four COP axis mean R2 values across both tasks is 0.875. This arithmetic summary is not a pooled R2 or a measure of clinical agreement, and axis- and task-specific results should be interpreted individually.
4. Discussion
The results support pressure-only estimation of multiple right-foot force-plate outputs under the two controlled study protocols. Subject-wise test-fold separation avoids optimistic evaluation caused by placing one participant’s highly correlated frames in both model-development and test sets. The independent test evidence nevertheless comprises only 21 participants, and accuracy differed across participants, particularly for walking Mz (0.43 ± 0.390). Table 2 and Table 3 report this between-participant variability for both tasks. External generalization remains untested. Comparisons with earlier studies in Table 1 are descriptive, not controlled benchmarks.
The comparatively low R2 for the Mz moment during walking (0.43) illustrates a key limitation of training deep models on modestly sized, heterogeneous cohorts: participants with atypical anthropometry (in this case, the tallest and shortest subjects) can dominate the error and destabilize the fit, an effect also noted by Tian et al. [25]. For walking Mz, the exploratory pooled R2 of 0.81 after omitting the tallest and shortest participants was calculated from 285,000 concatenated held-out frames using the unchanged original model predictions. This pooled metric is not directly comparable with the primary participant-level mean R2 of 0.43 ± 0.390. Moreover, height-based exclusion was post hoc, removed difficult cases, and may change the variance of the reference signal. The result therefore illustrates sensitivity to participant composition rather than an improvement in model generalization or evidence that anthropometry caused the errors. Normal plantar pressure does not directly measure shear forces or free torsional moments, which may partly explain task- and component-dependent performance.
The following limitations are central to interpreting the findings:
- AI model generalization: Assessing the ResNet regression model’s performance in diverse environments and with different datasets is crucial for evaluating its adaptability.
- Signal bandwidth and processing: The 1000 Hz AMTI data were filtered with a fourth-order zero-lag Butterworth low-pass filter (20 Hz) before downsampling to the 50 Hz insole rate [48]. An NTP-shared time reference was followed by cross-correlation lag adjustment using insole total load and plate Fz. The 20 Hz cutoff removes information at higher frequencies and may attenuate brief loading peaks. However, the frequency content of walking ground-reaction forces lies predominantly below about 15 Hz [52]. An FFT of our force-plate recordings likewise showed that most signal energy was concentrated at low frequencies in both tasks. Marching in place is slower than overground walking, and quiet standing is quasi-static. The 20 Hz cutoff is therefore expected to retain most of the task-relevant signal. Nevertheless, the reported errors quantify agreement with filtered 50 Hz force-plate signals, not the ability to reproduce original 1000 Hz impact transients. A future existing-data sensitivity analysis of 1000 Hz peak attenuation or alternative cutoffs would strengthen this specific point.
- Foot-support asymmetry and motion: Figure 3 shows barefoot participants with a taped-down insole beneath the right foot, whereas the left foot stood without an insole. We used the measured insole thickness to adjust the vertical offset in the COP calculation, in addition to correcting for the true-origin offsets stated in the AMTI calibration certificate. This coordinate-plane adjustment does not mechanically equalize right- and left-foot heights and therefore cannot exclude altered balance or inter-limb load distribution. Tape attachment reduces sensor movement relative to the force plate but cannot prevent relative foot sliding or changes in plantar contact.
- Task protocol and ecological validity: Participants performed quiet standing and walking/marching in place with visually guided foot placement on the insole and force plate. We adopted this protocol because, as an initial exploration of this insole, our priority was to collect stable, accurate data while participants simultaneously engaged both devices, and because capturing natural overground walking with one or two force plates is difficult (particularly during double-limb support) and awareness of plate location can itself alter gait (a targeting effect). However, marching in place changes propulsion, braking, step placement, and neuromuscular demands relative to forward walking, and participants had to look down to step onto the insole, which may have introduced additional artifacts. The findings therefore do not demonstrate accuracy during natural overground gait, turning, running, or rehabilitation. Future work should test whether trained models maintain performance during overground walking along a walkway with additional insoles and force plates, and extend to dynamic sports movements such as running, cutting, and jumping for field-based performance monitoring and injury-risk assessment.
- Device validation and hardware dependency: The pressure-sensitive ITRI research prototype was checked for basic operation but did not undergo a separately reported laboratory calibration or repeatability assessment, and no published data exist on its precision, accuracy, or reliability. Validation results from commercial devices cannot be transferred to it [53], and pressure/force agreement may vary by movement type. Future research should examine calibration drift, test–retest variability, and sensor resolution, and should assess how insole design (e.g., number and layout of sensors) affects model performance across devices.
- Population and model generalization: The 21 university volunteers passed self-reported eligibility screening with no exclusions. This convenience cohort is not representative of clinical or general populations. In particular, no participants with lower-limb fractures or other gait pathologies were tested, so the rehabilitation applications mentioned in the introduction (e.g., monitoring recovery after tibial fracture [28]) remain to be evaluated. In addition, only the right foot was instrumented and modeled. Left–right symmetry in healthy gait supports transfer to the left foot, but this was not tested. In populations with marked asymmetry (e.g., after a unilateral fracture or stroke), each foot should be modeled and validated separately, ideally with bilateral insoles. The subject-disjoint test procedure supports generalization to unseen participants within these controlled tasks, but not to other populations, environments, or datasets. Future work should evaluate the model on independent datasets and clinical recordings, and systematically compare alternative deep learning architectures to identify the most effective approach for this task.
5. Conclusions
An 89-sensor pressure insole with a ResNet-18 regressor estimated six right-foot forces/moments and derived COP in 21 adults during in-place walking and quiet standing. Both tasks used subject-wise seven-fold testing with three unseen participants per outer fold and participant-level R2 mean ± SD summaries. Walking performed well for several components (e.g., Fx 0.88 ± 0.071; Fz 0.89 ± 0.075; COPx 0.99 ± 0.039), while Mz was less reliable (0.43 ± 0.390). During standing, Fz reached 0.99 ± 0.040 and COPy reached 0.98 ± 0.033, illustrating differences between tasks and outputs. The method is feasible under controlled, 50 Hz low-pass-filtered conditions but has not been validated for free overground gait or full-bandwidth impact forces. Subsequent work should address hardware repeatability, overground and long-duration validation, support-height asymmetry and external populations.
Author Contributions
Conceptualization, K.-C.L. and C.-L.T.; methodology, K.-C.L.; software, I.T. and J.J.; validation, I.T. and J.J.; investigation, J.J.; resources, K.-C.L. and C.-L.T.; data curation, I.T. and J.J.; writing—original draft preparation, I.T.; writing—review and editing, K.-C.L. and C.-L.T.; visualization, I.T.; supervision, K.-C.L. and C.-L.T.; project administration, K.-C.L. All authors have read and agreed to the published version of the manuscript.
Funding
This research received no external funding.
Institutional Review Board Statement
The study was conducted in accordance with the Declaration of Helsinki and approved by the HREC of NCKU with approval number E-111-021-2.
Informed Consent Statement
Informed consent was obtained from all subjects involved in the study.
Data Availability Statement
The data are available from the corresponding author upon reasonable request.
Conflicts of Interest
The authors declare no conflicts of interest.
References
- Favre, J.; Hayoz, M.; Erhart-Hledik, J.C.; Andriacchi, T.P. A neural network model to predict knee adduction moment during walking based on ground reaction force and anthropometric measurements. J. Biomech. 2012, 45, 692–698. [Google Scholar] [CrossRef] [Scilit]
- Oh, S.E.; Choi, A.; Mun, J.H. Prediction of ground reaction forces during gait based on kinematics and a neural network model. J. Biomech. 2013, 46, 2372–2380. [Google Scholar] [CrossRef] [Scilit]
- Tao, W.; Liu, T.; Zheng, R.; Feng, H. Gait analysis using wearable sensors. Sensors 2012, 12, 2255–2283. [Google Scholar] [CrossRef] [Scilit]
- Cramp, M.C.; Greenwood, R.J.; Gill, M.; Lehmann, A.; Rothwell, J.C.; Scott, O.M. Effectiveness of a community-based low intensity exercise programme for ambulatory stroke survivors. Disabil. Rehabil. 2010, 32, 239–247. [Google Scholar] [CrossRef] [Scilit]
- Srivastava, A.; Taly, A.B.; Gupta, A.; Kumar, S.; Murali, T. Post-stroke balance training: Role of force platform with visual feedback technique. J. Neurol. Sci. 2009, 287, 89–93. [Google Scholar] [CrossRef] [Scilit]
- Wu, J.Z.; Chiou, S.S.; Pan, C.S. Analysis of musculoskeletal loadings in lower limbs during stilts walking in occupational activity. Ann. Biomed. Eng. 2009, 37, 1177–1189. [Google Scholar] [CrossRef] [Scilit]
- Lin, Y.C.; Walter, J.P.; Banks, S.A.; Pandy, M.G.; Fregly, B.J. Simultaneous prediction of muscle and contact forces in the knee during gait. J. Biomech. 2010, 43, 945–952. [Google Scholar] [CrossRef] [Scilit]
- Liu, T.; Inoue, Y.; Shibata, K.; Hirota, Y.; Shiojima, K. A mobile force plate system and its application to quantitative evaluation of normal and pathological gait. In Proceedings of the 2010 IEEE/ASME International Conference on Advanced Intelligent Mechatronics (AIM), Montreal, QC, Canada, 6–9 July 2010; pp. 272–277. [Google Scholar] [CrossRef] [Scilit]
- O’Donovan, K.J.; Kamnik, R.; O’Keeffe, D.T.; Lyons, G.M. An inertial and magnetic sensor based technique for joint angle measurement. J. Biomech. 2007, 40, 2604–2611. [Google Scholar] [CrossRef] [Scilit]
- Abdul Razak, A.H.; Zayegh, A.; Begg, R.K.; Wahab, Y. Foot plantar pressure measurement system: A review. Sensors 2012, 12, 9884–9912. [Google Scholar] [CrossRef] [Scilit]
- Muro-de-la Herran, A.; Garcia-Zapirain, B.; Mendez-Zorrilla, A. Gait analysis methods: An overview of wearable and non-wearable systems, highlighting clinical applications. Sensors 2014, 14, 3362–3394. [Google Scholar] [CrossRef] [Scilit]
- Liu, T.; Inoue, Y.; Shibata, K. A wearable force plate system to successively measure multi-axial ground reaction force for gait analysis. In 2009 IEEE International Conference on Robotics and Biomimetics (ROBIO); IEEE: New York, NY, USA, 2009; pp. 836–841. [Google Scholar] [CrossRef] [Scilit]
- Hori, N.; Newton, R.U.; Kawamori, N.; McGuigan, M.R.; Kraemer, W.J.; Nosaka, K. Reliability of performance measurements derived from ground reaction force data during countermovement jump and the influence of sampling frequency. J. Strength Cond. Res. 2009, 23, 874–882. [Google Scholar] [CrossRef] [Scilit]
- Nikooyan, A.A.; Zadpoor, A.A. Effects of muscle fatigue on the ground reaction force and soft-tissue vibrations during running: A model study. IEEE Trans. Biomed. Eng. 2012, 59, 797–804. [Google Scholar] [CrossRef] [Scilit]
- Giakas, G.; Baltzopoulos, V.; Dangerfield, P.H.; Dorgan, J.C.; Dalmira, S. Comparison of gait patterns between healthy and scoliotic patients using time and frequency domain analysis of ground reaction forces. Spine 1996, 21, 2235–2242. [Google Scholar] [CrossRef] [Scilit]
- Bruyneel, A.V.; Chavet, P.; Bollini, G.; Allard, P.; Berton, E.; Mesure, S. Dynamical asymmetries in idiopathic scoliosis during forward and lateral initiation step. Eur. Spine J. 2009, 18, 188–195. [Google Scholar] [CrossRef] [Scilit]
- Savelberg, H.H.C.M.; de Lange, A.L.H. Assessment of the horizontal, fore-aft component of the ground reaction force from insole pressure patterns by using artificial neural networks. Clin. Biomech. 1999, 14, 585–592. [Google Scholar] [CrossRef] [Scilit]
- Miller, N.H. Idiopathic scoliosis: Cracking the genetic code and what does it mean. J. Pediatr. Orthop. 2011, 31, S49–S52. [Google Scholar] [CrossRef] [Scilit]
- Cross, R. Standing, walking, running, and jumping on a force plate. Am. J. Phys. 1999, 67, 304–309. [Google Scholar] [CrossRef] [Scilit]
- Xu, W.; Huang, M.C.; Amini, N.; Liu, J.J.; He, L.; Sarrafzadeh, M. Smart insole: A wearable system for gait analysis. In Proceedings of the 5th International Conference on Pervasive Technologies Related to Assistive Environments (PETRA), Heraklion, Greece, 6–8 June 2012; pp. 1–4. [Google Scholar] [CrossRef] [Scilit]
- Wipperman, M.F.; Lin, A.Z.; Gayvert, K.M.; Lahner, B.; Somersan-Karakaya, S.; Wu, X.; Harari, O. Machine learning analysis of a digital insole versus clinical standard gait assessments for digital endpoint development. medRxiv 2022. [Google Scholar] [CrossRef] [Scilit]
- Domínguez-Morales, M.J.; Luna-Perejón, F.; Miró-Amarante, L.; Hernández-Velázquez, M.; Sevillano-Ramos, J.L. Smart footwear insole for recognition of foot pronation and supination using neural networks. Appl. Sci. 2019, 9, 3970. [Google Scholar] [CrossRef] [Scilit]
- Nascimento, D.H.A.; Magalhães, F.A.; Sabino, G.S.; Resende, R.A.; Duarte, M.L.M.; Vimieiro, C.B.S. Development of a human motion analysis system based on sensorized insoles and machine learning algorithms for gait evaluation. Inventions 2022, 7, 98. [Google Scholar] [CrossRef] [Scilit]
- D’Arco, L.; Wang, H.; Zheng, H. Deephar: A deep feed-forward neural network algorithm for smart insole-based human activity recognition. Neural Comput. Appl. 2023, 35, 13547–13563. [Google Scholar] [CrossRef] [Scilit]
- Tian, Y.; Zhang, L.; Zhang, C.; Bao, B.; Li, Q.; Wang, L.; Li, D. Deep-learning enabled smart insole system aiming for multifunctional foot-healthcare applications. Exploration 2024, 4, 20230109. [Google Scholar] [CrossRef] [Scilit]
- Moon, J.; Lee, D.; Jung, H.; Choi, A.; Mun, J.H. Machine learning strategies for low-cost insole-based prediction of center of gravity during gait in healthy males. Sensors 2022, 22, 3499. [Google Scholar] [CrossRef] [Scilit]
- Ershadi, G.; Gwak, M.; Aminian, A.; Soangra, R.; Grant-Beuttler, M.; Sarrafzadeh, M. Smart insole: Remote gait detection algorithm using pressure sensors for toe walking rehabilitation. In 2021 IEEE 7th World Forum on Internet of Things (WF-IoT); IEEE: New York, NY, USA, 2021; pp. 332–337. [Google Scholar] [CrossRef] [Scilit]
- Warmerdam, E.; Orth, M.; Müller, M.; Pohlemann, T.; Ganse, B. Gait analysis with smart insoles can identify patients at risk of tibial shaft fracture nonunion as early as six weeks after surgery: Longitudinal and cross-sectional study. Front. Bioeng. Biotechnol. 2025, 13, 1536738. [Google Scholar] [CrossRef] [Scilit]
- Fregly, B.J.; Reinbolt, J.A.; Rooney, K.L.; Mitchell, K.H.; Chmielewski, T.L. Design of patient-specific gait modifications for knee osteoarthritis rehabilitation. IEEE Trans. Biomed. Eng. 2007, 54, 1687–1695. [Google Scholar] [CrossRef] [Scilit]
- Houck, J.; Kneiss, J.; Bukata, S.V.; Puzas, J.E. Analysis of vertical ground reaction force variables during a sit to stand task in participants recovering from a hip fracture. Clin. Biomech. 2011, 26, 470–476. [Google Scholar] [CrossRef] [Scilit][Green Version]
- Shin, K.Y.; Rim, Y.H.; Kim, Y.S.; Kim, H.S.; Han, J.W.; Choi, C.H.; Lee, K.S.; Mun, J.H. A joint normalcy index to evaluate patients with gait pathologies in the functional aspects of joint mobility. J. Mech. Sci. Technol. 2010, 24, 1901–1909. [Google Scholar] [CrossRef] [Scilit]
- Tan, A.M.; Fuss, F.; Weizman, Y.; Azari, M. Centre of pressure detection and analysis with a high-resolution and low-cost smart insole. Procedia Eng. 2015, 112, 146–151. [Google Scholar] [CrossRef] [Scilit]
- Tan, A.; Fuss, F.; Weizman, Y.; Troynikov, O. Development of a smart insole for medical and sports purposes. Procedia Eng. 2015, 112, 152–157. [Google Scholar] [CrossRef] [Scilit]
- Wu, C.C.; Chen, Y.J.; Hsu, C.S.; Wen, Y.T.; Lee, Y.J. Multiple inertial measurement unit combination and location for center of pressure prediction in gait. Front. Bioeng. Biotechnol. 2020, 8, 566474. [Google Scholar] [CrossRef] [Scilit]
- Anwary, A.R.; Yu, H.; Vassallo, M. Optimal foot location for placing wearable imu sensors and automatic feature extraction for gait analysis. IEEE Sens. J. 2018, 18, 2555–2567. [Google Scholar] [CrossRef] [Scilit]
- Zhang, H.; Zanotto, D.; Agrawal, S.K. Estimating cop trajectories and kinematic gait parameters in walking and running using instrumented insoles. IEEE Robot. Autom. Lett. 2017, 2, 2159–2165. [Google Scholar] [CrossRef] [Scilit]
- Fukushi, K.; Sekiguchi, Y.; Honda, K.; Yaguchi, H.; Izumi, S.I. Three-dimensional grf and cop estimation during stair and slope ascent/descent with wearable imus and foot pressure sensors. In 2019 41st Annual International Conference of the IEEE Engineering in Medicine and Biology Society (EMBC); IEEE: New York, NY, USA, 2019; pp. 6401–6404. [Google Scholar] [CrossRef] [Scilit]
- Oubre, B.; Lane, S.; Holmes, S.; Boyer, K.; Lee, S.I. Estimating ground reaction force and center of pressure using low-cost wearable devices. IEEE Trans. Biomed. Eng. 2021, 69, 1461–1468. [Google Scholar] [CrossRef] [Scilit]
- Duong, T.T.H.; Uher, D.; Young, S.D.; Duong, T.; Sangco, M.; Cornett, K.; Montes, J.; Zanotto, D. Gaussian process regression for cop trajectory estimation in healthy and pathological gait using instrumented insoles. In 2021 IEEE/RSJ International Conference on Intelligent Robots and Systems (IROS); IEEE: New York, NY, USA, 2021; pp. 9548–9553. [Google Scholar] [CrossRef] [Scilit]
- Adachi, W.; Tsujiuchi, N.; Koizumi, T.; Aikawa, M.; Shiojima, K.; Tsuchiya, Y.; Inoue, Y. Development of walking analysis system consisting of mobile force plate and motion sensor. In 2011 Annual International Conference of the IEEE Engineering in Medicine and Biology Society (EMBC); IEEE: New York, NY, USA, 2011; pp. 8359–8362. [Google Scholar] [CrossRef] [Scilit]
- Rouhani, H.; Favre, J.; Crevoisier, X.; Aminian, K. Ambulatory assessment of 3d ground reaction force using smart insoles distribution. Gait Posture 2010, 32, 311–316. [Google Scholar] [CrossRef] [Scilit]
- Forner Cordero, A.; Koopman, H.J.F.M.; van der Helm, F.C.T. Use of pressure insoles to calculate the complete ground reaction forces. J. Biomech. 2004, 37, 1427–1432. [Google Scholar] [CrossRef] [Scilit]
- Liu, T.; Inoue, Y.; Shibata, K. A wearable force plate system for the continuous measurement of triaxial ground reaction force in biomechanical applications. Meas. Sci. Technol. 2010, 21, 085804. [Google Scholar] [CrossRef] [Scilit]
- Oba, N.; Sasagawa, S.; Yamamoto, A.; Nakazawa, K. Difference in postural control during quiet standing between young children and adults: Assessment with center of mass acceleration. PLoS ONE 2015, 10, e0140235. [Google Scholar] [CrossRef] [Scilit]
- Sadeghi, H.; Allard, P.; Prince, F.; Labelle, H. Symmetry and limb dominance in able-bodied gait: A review. Gait Posture 2000, 12, 34–45. [Google Scholar] [CrossRef] [Scilit]
- Herzog, W.; Nigg, B.M.; Read, L.J.; Olsson, E. Asymmetries in ground reaction force patterns in normal human gait. Med. Sci. Sports Exerc. 1989, 21, 110–114. [Google Scholar] [CrossRef] [Scilit]
- He, K.; Zhang, X.; Ren, S.; Sun, J. Deep residual learning for image recognition. In Proceedings of the IEEE Conference on Computer Vision and Pattern Recognition (CVPR), Las Vegas, NV, USA, 27–30 June 2016; pp. 770–778. [Google Scholar] [CrossRef] [Scilit]
- Winter, D.A. Biomechanics and Motor Control of Human Movement, 4th ed.; John Wiley & Sons: Hoboken, NJ, USA, 2009. [Google Scholar] [CrossRef] [Scilit]
- Van Rossum, G.; Drake, F.L. Python 3 Reference Manual; CreateSpace: Scotts Valley, CA, USA, 2009. [Google Scholar]
- Virtanen, P.; Gommers, R.; Oliphant, T.E.; Haberland, M.; Reddy, T.; Cournapeau, D.; Burovski, E.; Peterson, P.; Weckesser, W.; Bright, J.; et al. SciPy 1.0: Fundamental algorithms for scientific computing in Python. Nat. Methods 2020, 17, 261–272. [Google Scholar] [CrossRef] [Scilit]
- Paszke, A.; Gross, S.; Massa, F.; Lerer, A.; Bradbury, J.; Chanan, G.; Killeen, T.; Lin, Z.; Gimelshein, N.; Antiga, L.; et al. PyTorch: An imperative style, high-performance deep learning library. In Advances in Neural Information Processing Systems 32 (NeurIPS 2019); Curran Associates: Red Hook, NY, USA, 2019; pp. 8024–8035. [Google Scholar]
- Antonsson, E.K.; Mann, R.W. The frequency content of gait. J. Biomech. 1985, 18, 39–47. [Google Scholar] [CrossRef] [Scilit]
- Lambrich, J.; Hagen, M.; Schwiertz, G.; Muehlbauer, T. Concurrent Validity and Test–Retest Reliability of Pressure-Detecting Insoles for Static and Dynamic Movements in Healthy Young Adults. Sensors 2023, 23, 4913. [Google Scholar] [CrossRef] [Scilit]

Disclaimer/Publisher’s Note: The statements, opinions and data contained in all publications are solely those of the individual author(s) and contributor(s) and not of MDPI and/or the editor(s). MDPI and/or the editor(s) disclaim responsibility for any injury to people or property resulting from any ideas, methods, instructions or products referred to in the content. |
© 2026 by the authors. Licensee MDPI, Basel, Switzerland. This article is an open access article distributed under the terms and conditions of the Creative Commons Attribution (CC BY) license.