


Abstract
Previous studies of HYROX have described its physiological demands and pacing, but the organization of race-segment performance and the existence of distinct performance profiles among high-performing athletes remain unclear. This retrospective observational study analyzed official results of 11,592 male HYROX Pro athletes (one performance per athlete; 143 events; 2018–2025). Event-related differences were accounted for by centering race-segment times within each event (venue × year). Segment contributions were quantified using partial correlations controlling for event, part–rest correlations, and an additive decomposition of between-athlete variance. In the fastest within-event quartile (n = 2847), K-means clustering was applied to level-independent residual segment profiles, and exploratory classification trees examined whether these profiles discriminated faster from slower athletes. All segments correlated with total race time (partial r = 0.55–0.78). Running plus Roxzone time and workout-station time each accounted for about half of the between-athlete variance; Wallballs, Sled Pull, and Roxzone were the largest single components, whereas mid-race running segments were most strongly associated with the rest of the race. Two reproducible profiles emerged, characterized by relatively faster workout stations or relatively faster running, with equivalent total times in the primary residual-profile analysis; given their low separation (silhouette = 0.18), they represent positions along a continuum rather than distinct athlete types. In exploratory analyses with training and test data fully separated, profiles discriminated poorly between faster and slower high performers (AUC ≈ 0.54). These findings provide a descriptive basis for Performance Architecture and Competitive Phenotypes in HYROX.
1. Introduction
Hybrid sports have experienced remarkable international growth over the past decade, attracting athletes from endurance- and strength-based disciplines and establishing themselves as a rapidly expanding competitive sector within contemporary sport [1]. Among these disciplines, HYROX has emerged as one of the most standardized competitive formats, requiring athletes to complete eight 1-km running intervals interspersed with eight fixed functional exercise stations performed in a predetermined order under identical competition rules [1,2]. Unlike many multidimensional sports in which tactical decisions, environmental variability, or opponent interactions substantially influence performance, every HYROX competitor performs the same tasks in the same sequence under highly standardized competitive conditions, making HYROX an attractive model for investigating how performance in hybrid sport is distributed across its components [3,4]. Despite the rapid expansion of HYROX, scientific evidence remains scarce. Initial investigations have described the acute physiological demands of the competition [1], while more recent observational studies have begun to characterize pacing strategies and temporal performance trends across competitive seasons [5]. However, how the individual race segments relate to total race time, and whether high-performing athletes distribute their race time across segments in different ways, remain largely unexplored.
To date, research has primarily focused on describing the physiological demands of HYROX competition and identifying the physical characteristics associated with successful race performance. The currently available studies have primarily examined aerobic capacity, muscular strength, muscular endurance, body composition, and laboratory-based physiological responses [1,6,7,8]. Collectively, these studies have substantially improved current understanding of the physiological requirements of HYROX competition and have provided valuable guidance for athlete preparation. However, they share an important limitation. The few available investigations have examined performance determinants in relative isolation, providing valuable information regarding individual predictors while offering limited insight into how these physiological capacities interact throughout competition [3,6,9,10,11]. Competitive performance in HYROX requires athletes to repeatedly alternate between running and high-load functional tasks while fatigue accumulates [12,13,14]. Consequently, competitive success may depend not only on the magnitude of individual capacities but also on how performance in the different race segments is combined, an issue that can be examined descriptively from official split times.
This distinction highlights a broader challenge in sport performance research that extends well beyond HYROX competition. Identifying variables associated with successful performance is not equivalent to understanding how performance is composed. When the outcome is a sum of its parts, as total race time is in HYROX, conventional regression of the outcome on its components largely reproduces an accounting identity and cannot, by itself, reveal how capacities interact [3,4]. In the present study, this perspective provides the conceptual foundation for Performance Architecture, understood as a descriptive framework for examining how race-segment performance is organized within standardized hybrid competition. This framework is used as an interpretive lens rather than as evidence of physiological interactions, which cannot be directly established from race-segment data.
When considered within the context of standardized hybrid competition, this perspective suggests that successful performance may not require a single optimal profile. Instead, comparable competitive outcomes might be achieved with different distributions of race time across running and workout segments [10,15,16,17,18,19]. Although performance in each segment can be quantified individually, the segments are completed consecutively, as athletes alternate between repeated running bouts and high-load functional tasks under progressively increasing fatigue [12,14]. Despite the growing popularity of HYROX, little research has quantified how each race segment relates to total race time, or whether athletes of similar level show distinct and reproducible segment profiles [1,5,20]. This gap motivates the present study.
To address this gap, the present study proposes a descriptive framework encompassing Organization of Performance, Performance Architecture, and Competitive Phenotypes. Organization of Performance refers to the statistical associations between individual race segments and total race time, including their contribution to between-athlete variance after accounting for event-related differences. Performance Architecture describes the distribution and organization of race-segment performance within standardized hybrid competition. Competitive Phenotypes refer to recurrent patterns in how athletes distribute their race time across segments relative to their overall performance level. These concepts are derived from official race-segment times and should be interpreted as descriptive and conceptual representations of competitive performance rather than direct measures of physiological capacities.
Using official results from more than 11,000 male HYROX Pro athletes collected across multiple seasons, we aimed to (i) quantify the association of each running segment, workout station, and the Roxzone transitions with total race time, accounting for venue and year, and decompose the between-athlete variance in total race time; (ii) identify level-independent performance profiles within the fastest quartile of each event using unsupervised clustering; and (iii) examine whether these profiles are associated with different total race times and whether profile features discriminate faster from slower athletes within this group. Because total race time is the sum of the analyzed segments, all analyses were designed to account for this mathematical coupling and are interpreted descriptively. Together, these analyses provide an empirical basis for exploring Performance Architecture and Competitive Phenotypes as descriptive features of HYROX race performance.
2. Materials and Methods
2.1. Experimental Approach to the Problem
A retrospective observational design was used to examine the Organization of Performance in HYROX Pro competition through associations between race-segment times and total race time, and to identify recurrent performance profiles conceptualized as Competitive Phenotypes among athletes of similar competitive levels. Because total race time is, by construction, the sum of the segment times, regressing it on its components reproduces an accounting identity [3]; the contribution of each segment was therefore quantified with partial correlations controlling for event (venue × year), complemented by part–rest correlations and an additive variance decomposition. Performance profiles were identified with K-means clustering on level-independent segment profiles within the fastest quartile of each event, and exploratory classification trees examined whether these profiles discriminated faster from slower athletes within that group. Robustness was examined with a replication across two independent periods (2018–2023 and 2024–2025) and with bootstrap resampling; non-overlapping performance strata were analyzed descriptively and do not constitute independent validation.
2.2. Data Source and Sample
Performance data were obtained from the official HYROX results portal (all-time ranking of the male Pro category), which provides publicly available split times for every race segment and official finishing times. The source dataset contained 20,250 male Pro race results from events held between 2018 and 2025. Each event was identified by its venue (city) and year (event = venue × year); spelling variants of the same venue that never coexisted in the same year were harmonized (e.g., Wien/Vienna, Singapur/Singapore).
Results were excluded, in this order, if they had (a) one or more missing split times (n = 102); (b) an official total time inconsistent with the sum of the sixteen splits and the recorded Roxzone time by more than 60 s, indicating a recording error (n = 223); (c) a non-positive Roxzone time (n = 363); (d) any split shorter than 25% or longer than 500% of the event median for that split, considered implausible timing errors (n = 29); or (e) a venue that could not be identified in the source data (city recorded only as “HYROX”; n = 1258). The remaining 18,275 valid results corresponded to 11,596 unique athletes (identified by name and nationality); 3115 athletes contributed more than one result (maximum 23). To avoid dependence between observations, the main analyses used one performance per athlete, namely the athlete’s first season in the dataset (ties broken at random with a fixed seed). After excluding events with fewer than 10 athletes (n = 4), the final sample comprised 11,592 athletes from 143 events held at 69 venues (median event size 66 athletes; range 14–386). The sample flow is shown in Supplementary Table S1. All available results were used in a sensitivity analysis. The present dataset was drawn from the same public source as a previous study by our group on temporal trends and pacing [5], which addressed a different research question. The prescribed loads and distances of all workout stations for the male Pro category remained unchanged throughout the study period.
The study was conducted within a broader research project approved by the Ethics Committee of Universidad Francisco de Vitoria (protocol code 35/2025; date of approval: 17 July 2025). The present analysis was retrospective and based on publicly available official competition results.
2.3. Procedures
HYROX Pro competitions follow a standardized race format consisting of eight 1-km running intervals interspersed with eight functional workout stations performed in a fixed order: SkiErg (1000 m), Sled Push (50 m), Sled Pull (50 m), Burpee Broad Jumps (80 m), Rowing (1000 m), Farmers Carry (200 m), Sandbag Lunges (100 m), and Wall Balls (100 repetitions). Each interval and workout station is individually timed, resulting in sixteen official split times. The time spent in the transition zone between running and workout stations (Roxzone) is recorded separately, so that total race time equals the sum of the sixteen splits and the Roxzone time (median absolute discrepancy 3 s in the final sample, attributable to rounding of the splits).
The running splits do not include the Roxzone transitions. Three aggregated variables were therefore computed: total running time (sum of the eight 1 km runs), running plus Roxzone time (the sum of the eight runs and the Roxzone time), and total workout-station time (sum of the eight stations). The seventeen additive components (eight runs, eight stations and Roxzone) were analyzed individually, and descriptive labels are used throughout (e.g., “Run 4 (1 km)” for the fourth running segment).
Absolute race times differ between competitions because of factors specific to each event, such as temperature, humidity and other environmental conditions, venue characteristics, course layout, distances between stations, floor surface and season. To account for systematic differences between competitions and allow events to be analyzed jointly, race-segment times and total race time were centered within each event (venue × year). For the correlation and variance analyses, every segment and total time was expressed as a deviation from the mean of its event, which is equivalent to including event fixed effects; for the performance profiles, log-transformed times were centered on the event mean, which expresses each time relative to the typical level of its event; and where a standardized scale was required (to compare profiles), total race time was converted to z-scores within each event. As a sensitivity analysis, the analyses were repeated after converting every segment to z-scores within each event, with virtually identical results (Supplementary Table S2).
Performance strata were defined from each athlete’s percentile rank of total race time within his own event: Q1 (the fastest 25% of each event; hereafter “fastest quartile”, n = 2847), Q2, Q3 and Q4. These four strata do not overlap. In addition, the analyses of segment contributions were replicated in two independent periods, 2018–2023 (n = 5754; 95 events) and 2024–2025 (n = 5838; 48 events), which share no events or athletes. Because the strata are defined from total race time, which is the sum of the analyzed segments, selecting athletes within a stratum restricts the range of total time and, through this mathematical coupling, can induce associations between segments (for example, negative associations due to compensation between segments). The within-stratum analyses are therefore descriptive and are not independent validations of the whole-sample results; independent replication was assessed only between the two periods. The corresponding segment-level results by performance quartile and study period are provided in Supplementary Table S3.
The analytical workflow followed three steps. First, the contribution of each race segment to total race time was quantified with partial correlations and an additive variance decomposition in the whole sample, in each performance stratum and in each period. Second, within the fastest quartile, performance profiles were identified with K-means clustering on level-independent residual segment profiles, and the total race time of the resulting profiles was compared. Third, exploratory classification trees (Classification and Regression Trees, CART [21]) examined whether level-independent profile features discriminated the faster from the slower half of the fastest quartile, with all feature construction performed within the training data.
2.4. Statistical Analysis
All analyses were performed in Python (version 3.12; pandas 3.0, NumPy 2.4, SciPy 1.17, and scikit-learn 1.8 [22]). Uncertainty is expressed with 95% confidence intervals (CIs); p-values are reported only where a formal test is used.
Segment contributions. For each segment X and total race time T, the partial correlation controlling for event was computed as the Pearson correlation between the within-event deviations of X and T, which is equivalent to controlling for event fixed effects. Because T contains X, this part–whole correlation includes a mechanical component; therefore, the partial correlation between X and the rest of the race (T − X) was also computed (part–rest correlation, analogous to the corrected item–total correlation). In addition, the between-athlete variance of total time was decomposed additively: the share of segment X was computed as Cov(X, T)/Var(T) using within-event deviations, so that the shares of the seventeen components sum exactly to 100%. CIs were obtained from 1000 bootstrap resamples stratified by event (percentile method). Sensitivity analyses used (i) additive venue and year fixed effects instead of venue × year, (ii) the precision-weighted mean of the within-event correlations (Fisher z), (iii) all valid performances with bootstrap resampling of athletes (n = 18,275), (iv) athletes in standard age groups only, and (v) full z-standardization of every segment within each event (for the variance decomposition, all segments of an event were divided by the standard deviation of that event’s total time, which preserves additivity).
Performance profiles. Within the fastest quartile, a level-independent profile was computed for each athlete and for each of the seventeen components: the logarithm of the segment time was centered on the event mean (computed with all athletes of the event) and regressed on the equally centered logarithm of total race time; the residual indicates whether the athlete was relatively slower (positive) or faster (negative) in that segment than expected for his total time. By construction, these residuals are uncorrelated with total race time, and total race time was not a clustering variable. The seventeen standardized residuals were analyzed with K-means (50 random starts) for k = 2 to 8. The number of clusters was pre-specified as the solution with the highest average silhouette width [23,24], and the Calinski–Harabasz and Davies–Bouldin indices are also reported. Cluster stability was assessed with the mean Jaccard similarity over 200 bootstrap resamples [25], with 100 random split-half replications and with a replication between the two periods, summarized by the adjusted Rand index (ARI) [26]. As a sensitivity analysis, clustering was repeated on compositional profiles (proportion of total time in each component, centered log-ratio transformed and centered by event [27]). Because cluster stability shows that a partition is reproducible but not that the data contain separate groups, the two-cluster solution was also compared with a unimodal reference [28]: 100 datasets of the same size were simulated from a multivariate normal distribution with the covariance matrix of the observed standardized residual profiles, and the same K-means procedure was applied to each (silhouette in all datasets; bootstrap Jaccard stability in 20 of them). In addition, the bimodality coefficient [29] of the athletes’ projections on the axis joining the two cluster centroids was computed (values above 0.555 suggest bimodality), and Gaussian mixture models with one to four components were compared with the Bayesian information criterion [30]. Additional details on cluster-number selection, cluster stability, the unimodal reference comparison, and alternative profile solutions are provided in Supplementary Material.
Total race time (standardized within event) was compared between profiles with Welch’s analysis of variance [31] and the Kruskal–Wallis test, reporting ω2 and ε2, and with pairwise Hedges’ g and 95% CIs. Whether profiles achieved comparable total times was tested formally with two one-sided tests of equivalence (TOST) [32], using a margin of ±0.2 pooled standard deviations defined before the analysis. As an exploratory analysis, classification trees were fitted to discriminate the faster from the slower half of the fastest quartile (median split of within-event standardized total time; approximately 50:50 classes, so no class-imbalance correction was required), using the seventeen residual profile variables as predictors. Because these predictors are constructed relative to total race time, which also defines the outcome, all feature construction was performed within the training data to avoid information leakage. The athletes of the fastest quartile were first randomly split into training (70%) and test (30%) sets; the event means used for centering, the event mean and standard deviation used to standardize total time, the residualization slopes, and the median threshold defining the classes were estimated without the test athletes and then applied unchanged to the test set. Because each athlete contributed a single performance, no athlete appeared in both sets. Trees were pruned by cost-complexity using 10-fold cross-validation, with the same preprocessing nested within each fold, and the one-standard-error rule, with a minimum of 30 athletes per terminal node. Test-set accuracy, the no-information rate (NIR) with a one-sided binomial test of accuracy > NIR, sensitivity, specificity, balanced accuracy, Cohen’s κ and the area under the ROC curve (AUC; 2000 bootstrap resamples for the CI) are reported, with logistic regression on the same predictors as a benchmark; to assess the variability due to the partition, the whole procedure was repeated over 20 random training–test splits. As a complementary analysis with predictors generated independently of the outcome, athletes with valid results in two or more events were analyzed: residual profiles were computed in the athlete’s first race and used to discriminate the faster from the slower half of the fastest quartile in a later, different race, with 5 × 10-fold cross-validation and nested preprocessing. A descriptive tree was also fitted to reproduce profile membership.
3. Results
3.1. Segment Contributions to Total Race Time
Mean total race time was 88.9 min (SD 15.9) in the whole sample and 72.8 min (SD 5.8) in the fastest quartile. Running accounted for 46.9% of total race time, Roxzone for 7.5%, and the workout stations for 45.6% (Table 1). Between-athlete variability differed markedly between segments: the coefficient of variation ranged from 7.1% (SkiErg) and 9.2% (Rowing) to 39.3% and 39.6% (Sled Push and Sled Pull).
Table 1.
Descriptive statistics, partial correlations with total race time controlling for event (venue × year) and decomposition of the between-athlete variance in total race time (n = 11,592; one performance per athlete).
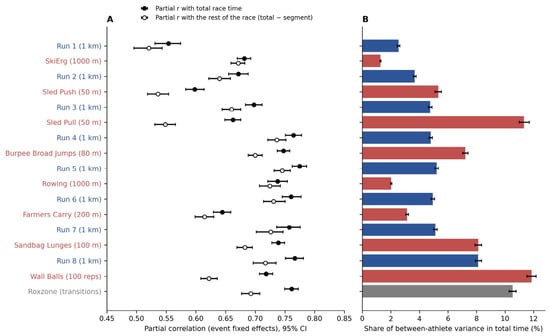
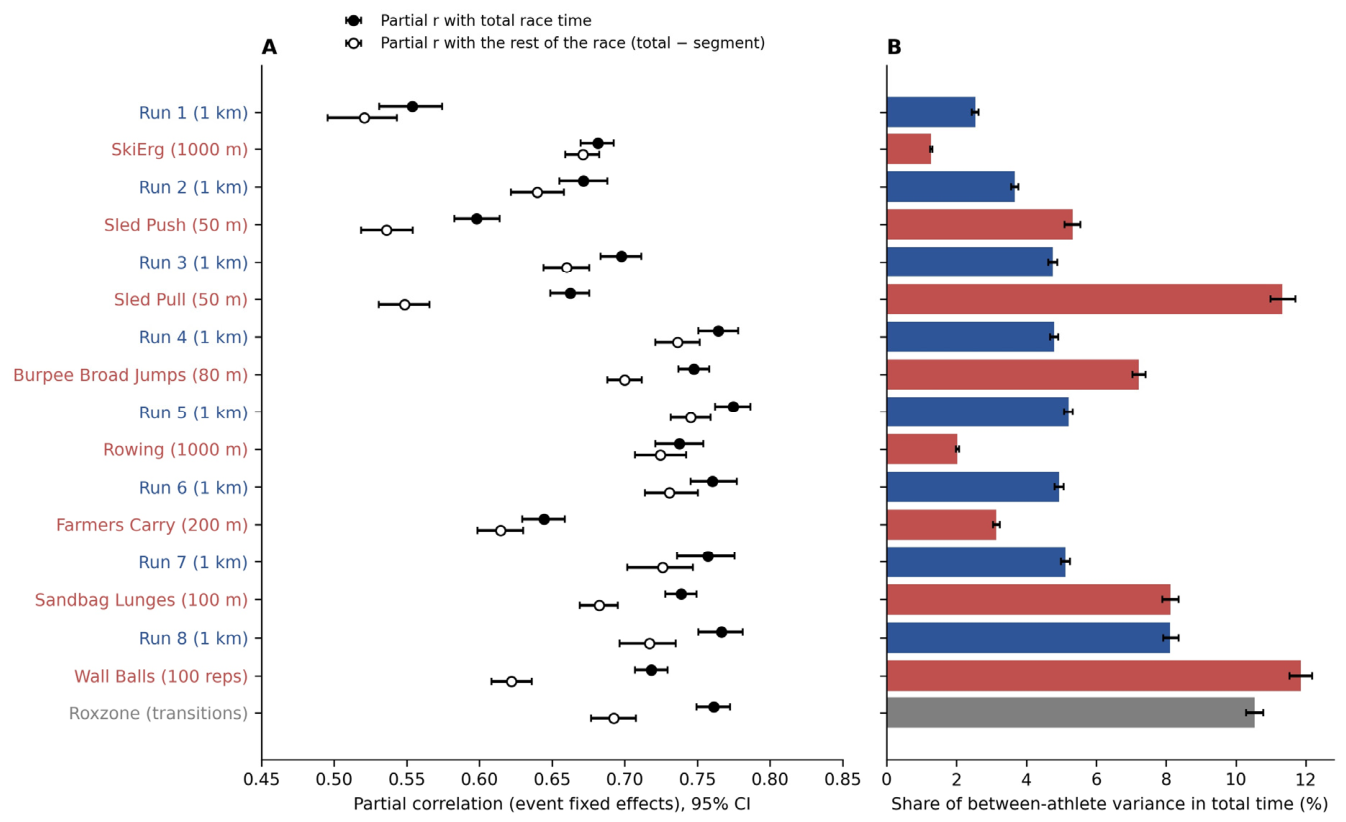
After accounting for event, all segments were positively associated with total race time (partial r = 0.55–0.78; Table 1 and Figure 1A). The strongest associations corresponded to the running segments from Run 4 to Run 8 (r = 0.76–0.78), Roxzone (r = 0.76), Burpee Broad Jumps (r = 0.75), Sandbag Lunges (r = 0.74) and Rowing (r = 0.74), and the weakest to Run 1 (r = 0.55) and Sled Push (r = 0.60). Removing the part–whole overlap reduced the correlations most for the segments with the largest variability: the part–rest correlation fell from 0.72 to 0.62 for Wall Balls and from 0.66 to 0.55 for Sled Pull, whereas the mid-race running segments (Run 4 to Run 7; r = 0.73–0.75) and Rowing (r = 0.73) showed the strongest association with the rest of the race.
Figure 1.
Contribution of race segments to total race time (n = 11,592; one performance per athlete). (A) Partial correlations controlling for event (venue × year) of each segment with total race time (filled circles) and with the rest of the race, i.e., total time minus the segment (open circles); bars are bootstrap 95% CIs. (B) Share of the between-athlete variance in total race time attributable to each segment (additive decomposition; the seventeen shares sum to 100%). Running segments are shown in blue, workout stations in red, and Roxzone in grey. The HYROX race format comprises eight nominal 1-km running segments (8 km in total), interspersed with eight workout stations. However, running course layouts and the spatial organization of individual segments may vary across events. Accordingly, Run 1–Run 8 refer to the official race segments rather than identical running courses across venues.
The variance decomposition (Figure 1B) showed that running plus Roxzone time and workout-station time each accounted for about half of the between-athlete variance in total race time (49.7%, 95% CI 49.0–50.3%, and 50.3%, 49.7–51.0%, respectively), with the eight runs contributing 39.2%. The largest single components were Wall Balls (11.9%), Sled Pull (11.3%) and Roxzone (10.5%), followed by Sandbag Lunges (8.1%), Run 8 (8.1%) and Burpee Broad Jumps (7.2%); SkiErg (1.3%) and Rowing (2.0%) contributed least. The large shares of Wall Balls and Sled Pull therefore reflect their large between-athlete dispersion rather than a particularly strong association with the rest of the race.
Associations were weaker within the fastest quartile, as expected from the restricted range of total times (partial r = 0.34–0.61), and the part–rest correlations of Wall Balls (0.12), Sled Push (0.20) and Sled Pull (0.21) were particularly low; running plus Roxzone accounted for 52.8% of the variance in this group (Supplementary Table S3). In the two intermediate strata (Q2 and Q3), several part–rest correlations were negative, an expected consequence of selecting athletes within a narrow band of total time, in which a slower segment must be compensated by faster ones; these within-stratum results are therefore descriptive. The results were replicated in the two independent periods (2018–2023 and 2024–2025; differences in partial r ≤ 0.07) and were robust to additive venue and year effects, to averaging the within-event correlations, to the inclusion of all valid performances (n = 18,275) and to the exclusion of non-standard age groups and to full z-standardization of every segment within each event (maximum differences of 0.05 in partial r and 0.24 percentage points in variance shares; Supplementary Tables S2 and S3).
3.2. Classification Trees in the Fastest Quartile
The pruned classification tree, fitted with all preprocessing restricted to the training data, had 4 terminal nodes (depth 3; training n = 1993), with SkiErg, Run 8, and Farmers Carry as splitting variables (Supplementary Figure S1). Its performance in the test set (n = 854) did not exceed chance: accuracy 0.525 (NIR 0.520; p = 0.41), sensitivity 0.68, specificity 0.36, balanced accuracy 0.52, κ = 0.04 and AUC 0.52 (95% CI 0.48–0.55); logistic regression with the same predictors gave an AUC of 0.49 (0.45–0.52). Across 20 random training–test splits, the mean AUC was 0.54 for the tree (range 0.50–0.57) and 0.54 for logistic regression (range 0.51–0.58). When the profiles were measured in an earlier race, and the outcome was defined in a later, different race (n = 1088 athletes; median interval 1 year), discrimination remained weak (cross-validated AUC 0.55 for the tree and 0.60 for logistic regression); the logistic score was unrelated to performance level in the earlier race (r = 0.01), and all segment coefficients had the same sign, suggesting a global feature of the profile rather than a specific running-versus-station pattern. These analyses are exploratory and are not interpreted as predictive models: once overall level is removed, the way athletes distribute their race time across segments carried little information about whether they finished in the faster or slower half of the fastest quartile.
3.3. Competitive Phenotypes: Performance Profiles in the Fastest Quartile
The average silhouette width was highest for k = 2 (0.18) and decreased for larger solutions (0.11 for k = 3 and ≤0.08 for k ≥ 4; Supplementary Table S4 and Figure S2). According to the pre-specified criterion, the two-cluster solution was retained. Values below 0.25 indicate that the clusters are not sharply separated [24], so the profiles should be understood as tendencies along a continuum rather than as discrete athlete types. Nevertheless, the two-cluster solution was highly reproducible: the mean bootstrap Jaccard similarity was 0.98 for both clusters, the split-half ARI was 0.92 (95% range 0.81–0.98), and the ARI between the solutions obtained in 2018–2023 and 2024–2025 was 0.73 (Supplementary Table S5). However, stability and separation are different properties, because a reproducible partition can be obtained even when the data form a single continuous distribution. In unimodal reference data simulated with the same covariance structure, K-means produced the same stability (mean Jaccard 0.98; 95% range 0.97–0.99) and similar silhouette values (mean 0.17; 95% range 0.17–0.18; observed 0.18, at the upper limit of this range). The bimodality coefficient of the projections on the axis joining the two centroids was 0.29, below the 0.555 threshold and below the unimodal reference (0.33), indicating no bimodality along the dimension that separates the profiles. Gaussian mixture models favored three components over one or two, which is compatible with departures from normality of a single continuous distribution rather than with well-separated groups (Supplementary Table S5). Thus, the stability of the two-cluster solution reflects a consistent main axis of variation, the balance between running and station performance, rather than evidence of genuinely distinct athlete profiles.
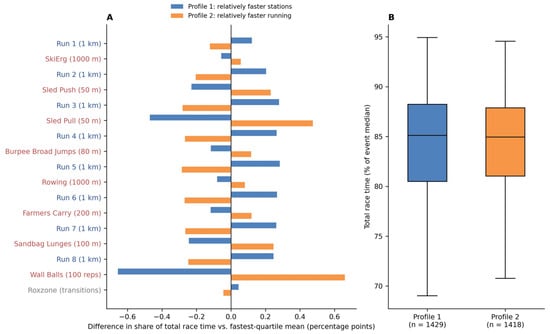
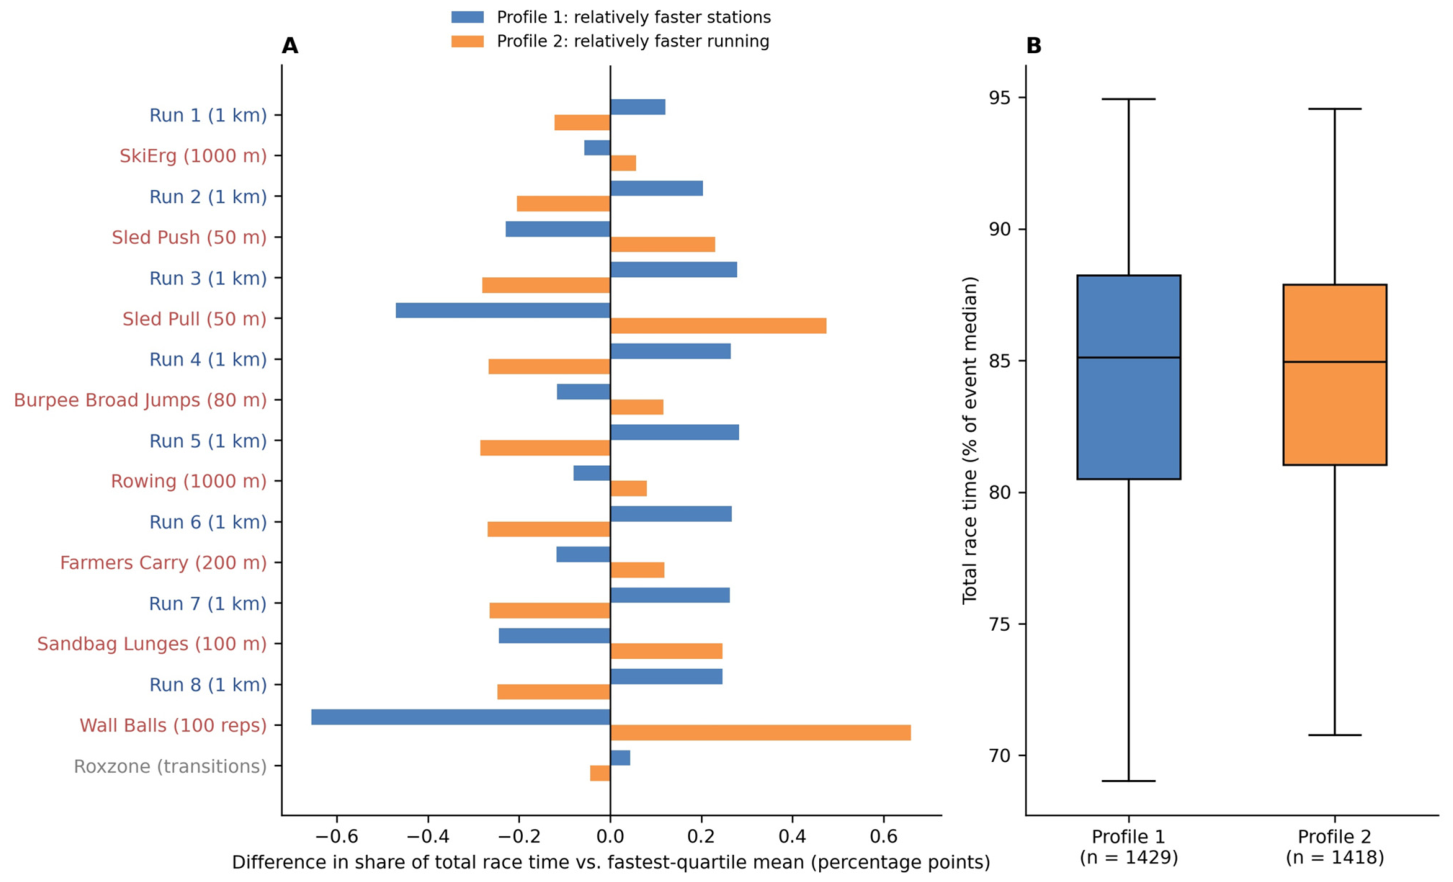
The two profiles differed mainly in the balance between running and the strength-endurance stations (Figure 2A and Table 2). Profile 1 (n = 1429) spent a relatively larger share of race time running (+0.20 to +0.28 percentage points in each of Runs 2–8), and a relatively smaller share in Wall Balls (−0.66 points), Sled Pull (−0.47), Sandbag Lunges (−0.24) and Sled Push (−0.23); that is, these athletes were relatively faster at these stations than at running. Profile 2 (n = 1418) showed the mirror pattern, with relatively faster running. A descriptive tree reproduced profile membership with an accuracy of 0.87 using only the residuals of Run 6 and Run 4 (Supplementary Figure S3).
Figure 2.
Performance profiles in the fastest quartile of each event (n = 2847; K-means clustering on level-independent residual profiles, k = 2). (A) Difference between each profile and the fastest-quartile mean in the share of total race time spent in each segment (percentage points); positive values indicate that a relatively larger share of race time was spent in that segment (i.e., that segment was relatively slower). (B) Total race time of each profile, expressed as a percentage of the median total time of the athlete’s event (boxes: interquartile range; whiskers: 1.5 × interquartile range). The two profiles showed equivalent total race times in the primary residual-based analysis (Hedges’ g = −0.03, 95% CI −0.10 to 0.04; TOST p < 0.001, equivalence margin ±0.2 SD). This equivalence was not confirmed in the compositional sensitivity analysis. The two profiles summarize positions along a continuum rather than distinct groups (see text).
Table 2.
Characteristics of the two performance profiles identified in the fastest quartile of each event (n = 2847). The profiles are based on observed race-segment times and are not physiological classifications.
Total race time did not differ between the profiles (Figure 2B): 4377 s (SD 358) versus 4364 s (SD 337); Welch F(1, 2837) = 0.64, p = 0.42; ω2 < 0.001; Hedges’ g = −0.03 (95% CI −0.10 to 0.04). The difference lay within the pre-specified equivalence margin of ±0.2 SD (TOST p < 0.001). Because the profiles were built from residuals that are uncorrelated with total time, similar total times are partly expected by design; the substantive finding is that athletes of the same performance level differ reproducibly in how they distribute their race time, along a continuum between relatively faster running and relatively faster workout stations.
As a sensitivity analysis, a three-cluster solution was also examined; it was stable (Jaccard 0.94; split-half ARI 0.83) and separated an even profile (n = 1345) from profiles with relatively faster stations (n = 783) and relatively faster running (n = 719). Differences in total race time were small (ω2 = 0.003; largest g = −0.15, 95% CI −0.24 to −0.06, for the even profile versus the relatively faster-running profile), and equivalence within ±0.2 SD was supported for two of the three pairwise comparisons (Supplementary Table S6 and Figure S4). Clustering on compositional (proportion-based) profiles also selected two clusters with a similar running-versus-station pattern, but these clusters differed slightly in total time (g = −0.20, 95% CI −0.27 to −0.13), because proportions are not independent of overall level: low-variability segments such as SkiErg occupy a larger proportion of a shorter total time (Supplementary Tables S4–S6). When the residual profiles were computed from segment times z-standardized within each event, the two-cluster solution classified 90% of athletes in the same profile, with the same running-versus-station pattern, high stability (Jaccard 0.97) and equivalent total times (g = 0.04, 95% CI −0.04 to 0.11; TOST p < 0.001; Supplementary Table S2).
4. Discussion
Recent large-scale observational studies have characterized temporal performance evolution, pacing characteristics, and the relative contribution of race segments in HYROX competitions [5,20]. The present study extends these descriptive findings by examining the Organization of Performance in HYROX through an additive analysis of race-segment contributions and by exploring Performance Architecture and Competitive Phenotypes as descriptive frameworks for understanding how athletes of similar competitive level distribute their race time across different segments.
The present analysis of 11,592 male Pro athletes yields three principal findings. First, running plus Roxzone time and the workout stations each accounted for about half of the between-athlete variance in total race time; the largest single components were Wall Balls, Sled Pull, and Roxzone, whereas the mid-race running segments and Rowing were most closely associated with performance in the rest of the race. Second, within the fastest quartile, athletes differed reproducibly along a continuum between relatively faster workout stations and relatively faster running, which a two-cluster solution summarized as two weakly separated profiles with equivalent total times. Third, in exploratory analyses, once overall level was removed, segment profiles discriminated poorly between the faster and slower halves of the fastest quartile.
The analytical approach is central to the interpretation of these results. Because total time is a sum, regressing it on its components reproduces an accounting identity, in which standardized coefficients mainly reflect the dispersion of each segment relative to that of total time. Partial correlations controlling for event, together with part–rest correlations and an additive variance decomposition, separate two different questions: how much of the observed variability in total time arises in each segment, and how strongly performance in each segment is associated with performance in the rest of the race. The answers differ. Wall Balls and Sled Pull generated the largest shares of variance mainly because their times vary widely between athletes, whereas the mid-race running segments and Rowing, with smaller shares, were the best indicators of an athlete’s overall level. This distinction refines previous reports that running-related performance is the principal determinant of success [20]: running is important both because it represents almost half of race time and because it closely reflects overall level, but the stations as a block contribute as much to between-athlete differences in total time.
The low part–rest correlations of Wall Balls, Sled Pull and Sled Push, particularly within the fastest quartile, indicate that performance in these stations is comparatively specific: fast athletes are not uniformly fast in them. Their large dispersion may reflect differences in strength-endurance, technique, local fatigue after the preceding efforts, or equipment and floor conditions [1,12,13]; these explanations are hypotheses, since none of these factors was measured. Similarly, the high variance share of Roxzone, which includes the transitions and the walking or jogging between stations, suggests that transition time is not trivial; however, the official data does not allow it to be separated into its components.
Within the fastest quartile, the stability of the results across the two independent periods suggests that these patterns are not specific to a particular stage of the development of the sport. In contrast, comparisons across performance strata defined by total time must be interpreted cautiously and do not provide independent validation: because total time is the sum of the segments, selecting athletes within a narrow band of total time restricts its range and, through this mathematical coupling, induces negative associations between segments, because a slower segment must be compensated by faster ones. For the same reason, classifying athletes by a threshold on total time necessarily admits compensation between segments, which is why level-independent predictors constructed within the training data were used in the classification trees, and why this analysis is interpreted as exploratory rather than predictive. The corresponding segment-level correlations across the four non-overlapping quartiles are illustrated in Supplementary Figure S5.
The profile analysis addresses whether athletes of similar levels reach their total time with different distributions of race time. The answer is a qualified yes. Two profiles, one relatively faster at the strength-endurance stations and one relatively faster at running, were highly reproducible across resamples and periods, and they showed equivalent total times in the primary residual-profile analysis. However, silhouette values were low, the same stability was obtained in unimodal reference data, and the projections showed no bimodality. Cluster stability therefore indicates that the partition is reproducible, not that distinct athlete profiles exist: the profiles represent tendencies along a continuum, essentially the balance between running and station performance, rather than distinct athlete types. Within this descriptive framework, Competitive Phenotypes should therefore be understood as recurrent patterns of relative race-segment performance rather than discrete physiological or functional athlete categories. When three clusters were extracted, an even profile appeared between the two specialized ones, with only small differences in total time. These findings are compatible with the idea, derived from ecological dynamics and from the concept of degeneracy, that different configurations can lead to similar outcomes [9,10,18,19]; the present data, however, describe race-time distributions and cannot show that different physiological solutions or coordination processes underlie them.
The exploratory classification-tree analysis complements this interpretation. Once the overall level was removed, and with all preprocessing restricted to the training data, the profile features did not discriminate the faster from the slower half of the fastest quartile better than chance (AUC 0.52; mean 0.54 across 20 splits), and profiles measured in an earlier race showed only weak discrimination in a later race (AUC 0.55–0.60; Supplementary Table S7). In other words, among high-performing athletes, being faster seems to depend mainly on being faster across the race rather than on a particular distribution of time between running and stations. This result, together with the equivalence of total times across profiles in the primary residual-profile analysis, suggests that no single profile confers a clear advantage at this level of performance, although small advantages cannot be excluded.
From a practical perspective, these findings support individualized performance analysis. Expressing each segment relative to the athlete’s own overall level, as done here with residual profiles, allows coaches to identify where an athlete is relatively faster or slower during the race, and to monitor how this profile changes over time. The data do not indicate which physiological quality underlies a relative weakness or how it should be trained, and they do not suggest that athletes should be moved towards a particular profile [16,33,34].
Other factors not captured by split times may also contribute to the observed profiles. As in other endurance events, pacing in HYROX is likely to be regulated in anticipation of the remaining efforts (teleoanticipation) [35,36], and psychological factors such as perceived exertion, motivation and experience with the race format may shape how athletes distribute their effort between running and stations. Combining official race data with pacing, perceptual and physiological measurements would allow these hypotheses to be tested. Beyond HYROX, the analytical approach used here, which avoids regressing a total on its own components, may be useful for other sports in which the outcome is a sum of segments.
The present study should be interpreted considering several limitations. First, the analyses were restricted to male athletes competing in the HYROX Pro category; the results cannot be directly generalized to female athletes, Open divisions, doubles or relays. Second, the design is observational and based on official split times; the results describe associations and the composition of race time, not causal effects, mechanisms or physiological capacities, and the profiles are performance-based rather than physiological classifications. Third, the partial correlations of a segment with total time contain a part–whole component; the part–rest correlations and the variance decomposition were reported to address this, but both remain descriptive. Fourth, the fastest quartile is a relative criterion within each event and does not correspond to an independent elite category; moreover, the analyses within performance strata are affected by range restriction and by the mathematical coupling between segments and total time, so they are descriptive and do not constitute independent validation. Fifth, events were identified by venue and year; occasionally, more than one competition held in the same city and year may have been combined, results whose venue was not identifiable were excluded, and athletes were identified by name and nationality, which may not resolve homonyms. Sixth, one performance per athlete was selected for the main analysis; results with all valid performances were similar. Seventh, the dataset covers 2018–2025, a period of rapid growth of the sport. Although event fixed effects account for systematic differences between competitions and replication across periods supports the stability of the results, conditions that may affect athletes differently within the same event (for example, heat or humidity affecting some athletes more than others) cannot be ruled out.
Finally, the residual profiles are uncorrelated with total time by construction, so equivalence of total times across profiles is partly expected and should not be interpreted as evidence of physiological equifinality. Likewise, the classification analyses are exploratory and should not be interpreted as predictive models.
Practical Applications
The present findings have implications for performance assessment in HYROX. Because the workout stations as a block contribute as much as running plus Roxzone to between-athlete differences in total race time, neither component should be neglected when analyzing performance. Segments with large dispersion, such as Wall Balls, Sled Pull, and the Roxzone transitions, are where time differences between athletes are largest, whereas the mid-race running segments showed the strongest associations with performance in the rest of the race.
Athlete evaluation can go beyond overall race time or raw segment times by expressing each segment relative to the athlete’s own performance level (residual profile). Within the proposed descriptive framework, this approach allows coaches to characterize individual Competitive Phenotypes by identifying whether an athlete is relatively faster at running or at the strength-endurance stations, comparing these patterns with those of athletes of similar level and monitoring their evolution across races.
Such profiles indicate where in the race an athlete is relatively faster or slower; they do not identify the underlying physiological limitation. Decisions about training should therefore be based on additional assessments (for example, laboratory or field tests of aerobic and strength-endurance capacities, technique analysis and the athlete’s history) rather than on race-segment data alone [37].
Importantly, the present data do not support moving all athletes towards a single “ideal” profile: different distributions of race time, along a continuum between relatively faster running and relatively faster workout stations, were compatible with the same performance level, and profile features did not distinguish faster from slower athletes within the fastest quartile.
5. Conclusions
In official HYROX Pro races, total race time reflects running plus Roxzone time and workout-station time in roughly equal parts of its between-athlete variance. Wall Balls, Sled Pull, and Roxzone generate the largest single shares of variance, largely because of their wide dispersion, whereas the mid-race running segments are most closely associated with performance in the rest of the race. Among the fastest quartile of each event, athletes differ reproducibly along a continuum between relatively faster workout stations and relatively faster running, summarized by two weakly separated profiles with equivalent total times in the primary residual-profile analysis, and in exploratory analyses the distribution of race time across segments barely discriminates faster from slower athletes at this level. These findings provide a descriptive basis for understanding Performance Architecture and Competitive Phenotypes in HYROX, supporting individualized performance monitoring while emphasizing that physiological interpretations require direct measurements.
Supplementary Materials
The following supporting information can be downloaded at: https://www.mdpi.com/article/10.3390/app162110832/s1, Table S1: Sample flow; Table S2a: Sensitivity analyses of the partial correlations of each segment with total race time (r total) and with the rest of the race (r rest); Table S2b: Sensitivity to full z-standardization of every segment within each event: partial correlations with total race time and with the rest of the race, and share of between-athlete variance (%), compared with the main analysis (deviations from the event mean); Table S3: Partial correlations and variance shares by within-event quartile and period; Table S4: Cluster validation indices by k; Table S5a: Cluster stability; Table S5b: Two-cluster solution (residual profiles) compared with a unimodal reference: 100 datasets simulated from a multivariate normal distribution with the covariance matrix of the observed standardized residual profiles (n = 2847 each), analysed with the same K-means procedure; and Gaussian mixture models (full covariance) with one to four components; Table S6: Three-cluster and compositional solutions; Table S7: Exploratory classification analyses; Figure S1: Pruned classification tree (exploratory) discriminating the faster from the slower half of the fastest quartile, fitted with all preprocessing restricted to the training data (values are residuals × 100, approximately the percentage by which the segment was slower (+) or faster (−) than expected for the athlete’s total time; the numbers in each node are athletes of the slower and faster halves); Figure S2: Average silhouette width by number of clusters in the fastest quartile (residual and compositional profiles). The dotted line marks 0.25, below which clusters are not considered sharply separated; Figure S3: Descriptive classification tree reproducing membership of the two performance profiles; Figure S4: Three-cluster solution on residual profiles: difference in share of total race time vs. fastest-quartile mean (percentage points); Figure S5: Partial correlations with total race time and with the rest of the race in the four non-overlapping within-event quartiles.
Author Contributions
Conceptualization, I.Y.A., J.G.-H. and A.M.; methodology, I.Y.A., J.G.-H., J.S.d.C. and J.D.C.; formal analysis, I.Y.A., J.S.d.C. and J.D.C.; data curation, J.G.-H., J.S.d.C. and J.D.C.; writing—original draft preparation, I.Y.A., S.A.-D., A.F.-A. and A.M.; writing—review and editing, I.Y.A., J.G.-H., J.D.C., S.A.-D., A.F.-A., J.S.d.C. and A.M. All authors have read and agreed to the published version of the manuscript.
Funding
This research received support from Universidad Francisco de Vitoria.
Institutional Review Board Statement
The study was conducted in accordance with the Declaration of Helsinki and approved by the Ethics Committee of Universidad Francisco de Vitoria (protocol code 35/2025; date of approval: 17 July 2025).
Informed Consent Statement
Not applicable. This study involved a retrospective analysis of publicly available competition results.
Data Availability Statement
The data analyzed in this study were obtained from the publicly available official HYROX race database. The analysis scripts are retained by the research team and are not publicly available.
Conflicts of Interest
The authors declare no conflicts of interest.
References
- Brandt, T.; Ebel, C.; Lebahn, C.; Schmidt, A. Acute physiological responses and performance determinants in HYROX©—A new running-focused high intensity functional fitness trend. Front. Physiol. 2025, 16, 1519240. [Google Scholar] [CrossRef] [Scilit] [PubMed]
- HYROX GmbH. Official Rulebook. Version Valid During the 2024 Competitive Season. Available online: https://hyrox.com/rulebook/ (accessed on 28 October 2026).
- Glazier, P.S. Game, set and match? Substantive issues and future directions in performance analysis. Sports Med. 2010, 40, 625–634. [Google Scholar] [CrossRef] [Scilit] [PubMed]
- Bartlett, R. Performance analysis: Can bringing together biomechanics and notational analysis benefit coaches? Int. J. Perform. Anal. Sport 2001, 1, 122–126. [Google Scholar] [CrossRef] [Scilit]
- Gutiérrez-Hellín, J.; Santos-del-Cerro, J.; Yustres-Amores, I. Evolution of performance and pacing strategies in HYROX competitions: A large-scale observational analysis across competitive seasons. Appl. Sci. 2026, 16, 6674. [Google Scholar] [CrossRef] [Scilit]
- Joyner, M.J.; Coyle, E.F. Endurance exercise performance: The physiology of champions. J. Physiol. 2008, 586, 35–44. [Google Scholar] [CrossRef] [Scilit] [PubMed]
- Saunders, P.U.; Pyne, D.B.; Telford, R.D.; Hawley, J.A. Factors affecting running economy in trained distance runners. Sports Med. 2004, 34, 465–485. [Google Scholar] [CrossRef] [Scilit]
- Barnes, K.R.; Kilding, A.E. Running economy: Measurement, norms, and determining factors. Sports Med. Open 2015, 1, 8. [Google Scholar] [CrossRef] [Scilit] [PubMed]
- Davids, K.; Araújo, D.; Vilar, L.; Renshaw, I.; Pinder, R. An ecological dynamics approach to skill acquisition: Implications for development of talent in sport. Talent Dev. Excell. 2013, 5, 21–34. [Google Scholar]
- Pol, R.; Balagué, N.; Ric, A.; Torrents, C.; Kiely, J.; Hristovski, R. Training or synergizing? Complex systems principles change the understanding of sport processes. Sports Med. Open 2020, 6, 28. [Google Scholar] [CrossRef] [Scilit] [PubMed]
- Button, C.; Seifert, L.; Chow, J.Y.; Araújo, D.; Davids, K. Dynamics of Skill Acquisition: An Ecological Dynamics Approach; Human Kinetics: Champaign, IL, USA, 2020. [Google Scholar]
- Fyfe, J.J.; Bishop, D.J.; Stepto, N.K. Interference between concurrent resistance and endurance exercise: Molecular bases and the role of individual training variables. Sports Med. 2014, 44, 743–762. [Google Scholar] [CrossRef] [Scilit] [PubMed]
- Wilson, J.M.; Marin, P.J.; Rhea, M.R.; Wilson, S.M.C.; Loenneke, J.P.; Anderson, J.C. Concurrent training: A meta-analysis examining interference of aerobic and resistance exercises. J. Strength Cond. Res. 2012, 26, 2293–2307. [Google Scholar] [CrossRef] [Scilit] [PubMed]
- Coffey, V.G.; Hawley, J.A. Concurrent exercise training: Do opposites distract? J. Physiol. 2017, 595, 2883–2896. [Google Scholar] [CrossRef] [Scilit] [PubMed]
- Newell, K.M. Constraints on the development of coordination. In Motor Development in Children: Aspects of Coordination and Control; Wade, M.G., Whiting, H.T.A., Eds.; Martinus Nijhoff: Dordrecht, The Netherlands, 1986; pp. 341–360. [Google Scholar]
- Araújo, D.; Davids, K. Team synergies in sport: Theory and measures. Front. Psychol. 2016, 7, 1449. [Google Scholar] [CrossRef] [Scilit] [PubMed]
- Chow, J.Y.; Davids, K.; Button, C.; Renshaw, I. Nonlinear Pedagogy in Skill Acquisition: An Introduction, 2nd ed.; Routledge: London, UK, 2022. [Google Scholar]
- Seifert, L.; Button, C.; Davids, K. Key properties of expert movement systems in sport: An ecological dynamics perspective. Sports Med. 2013, 43, 167–178. [Google Scholar] [CrossRef] [Scilit] [PubMed]
- Edelman, G.M.; Gally, J.A. Degeneracy and complexity in biological systems. Proc. Natl. Acad. Sci. USA 2001, 98, 13763–13768. [Google Scholar] [CrossRef] [Scilit] [PubMed]
- Rappelt, L.; Brandt, T.; Ebel, C.; Schmidt, A. Longitudinal performance development in HYROX Pro and Elite athletes across seven competitive seasons. Front. Physiol. 2026, 17, 1847569. [Google Scholar] [CrossRef] [Scilit] [PubMed]
- Breiman, L.; Friedman, J.H.; Olshen, R.A.; Stone, C.J. Classification and Regression Trees; Wadsworth International Group: Belmont, CA, USA, 1984. [Google Scholar]
- Pedregosa, F.; Varoquaux, G.; Gramfort, A.; Michel, V.; Thirion, B.; Grisel, O.; Blondel, M.; Prettenhofer, P.; Weiss, R.; Dubourg, V.; et al. Scikit-learn: Machine learning in Python. J. Mach. Learn. Res. 2011, 12, 2825–2830. [Google Scholar]
- Rousseeuw, P.J. Silhouettes: A graphical aid to the interpretation and validation of cluster analysis. J. Comput. Appl. Math. 1987, 20, 53–65. [Google Scholar] [CrossRef] [Scilit]
- Kaufman, L.; Rousseeuw, P.J. Finding Groups in Data: An Introduction to Cluster Analysis; Wiley: New York, NY, USA, 1990. [Google Scholar]
- Hennig, C. Cluster-wise assessment of cluster stability. Comput. Stat. Data Anal. 2007, 52, 258–271. [Google Scholar] [CrossRef] [Scilit]
- Hubert, L.; Arabie, P. Comparing partitions. J. Classif. 1985, 2, 193–218. [Google Scholar] [CrossRef] [Scilit]
- Aitchison, J. The Statistical Analysis of Compositional Data; Chapman and Hall: London, UK, 1986. [Google Scholar]
- Tibshirani, R.; Walther, G.; Hastie, T. Estimating the number of clusters in a data set via the gap statistic. J. R. Stat. Soc. Ser. B 2001, 63, 411–423. [Google Scholar] [CrossRef] [Scilit]
- Pfister, R.; Schwarz, K.A.; Janczyk, M.; Dale, R.; Freeman, J.B. Good things peak in pairs: A note on the bimodality coefficient. Front. Psychol. 2013, 4, 700. [Google Scholar] [CrossRef] [Scilit] [PubMed]
- Fraley, C.; Raftery, A.E. Model-based clustering, discriminant analysis, and density estimation. J. Am. Stat. Assoc. 2002, 97, 611–631. [Google Scholar] [CrossRef] [Scilit]
- Welch, B.L. On the comparison of several mean values: An alternative approach. Biometrika 1951, 38, 330–336. [Google Scholar] [CrossRef] [Scilit]
- Lakens, D. Equivalence tests: A practical primer for t tests, correlations, and meta-analyses. Soc. Psychol. Personal. Sci. 2017, 8, 355–362. [Google Scholar] [CrossRef] [Scilit] [PubMed]
- Kiely, J. Periodization paradigms in the 21st century: Evidence-led or tradition-driven? Int. J. Sports Physiol. Perform. 2012, 7, 242–250. [Google Scholar] [CrossRef] [Scilit] [PubMed]
- Coutts, A.J. Working fast and working slow: The benefits of embedding research in high-performance sport. Int. J. Sports Physiol. Perform. 2016, 11, 1–2. [Google Scholar] [CrossRef] [Scilit] [PubMed]
- Ulmer, H.V. Concept of an extracellular regulation of muscular metabolic rate during heavy exercise in humans by psychophysiological feedback. Experientia 1996, 52, 416–420. [Google Scholar] [CrossRef] [Scilit] [PubMed]
- Tucker, R. The anticipatory regulation of performance: The physiological basis for pacing strategies and the development of a perception-based model for exercise performance. Br. J. Sports Med. 2009, 43, 392–400. [Google Scholar] [CrossRef] [Scilit] [PubMed]
- Kiely, J. Periodization theory: Confronting an inconvenient truth. Sports Med. 2018, 48, 753–764. [Google Scholar] [CrossRef] [Scilit] [PubMed]

Disclaimer/Publisher’s Note: The statements, opinions and data contained in all publications are solely those of the individual author(s) and contributor(s) and not of MDPI and/or the editor(s). MDPI and/or the editor(s) disclaim responsibility for any injury to people or property resulting from any ideas, methods, instructions or products referred to in the content. |
© 2026 by the authors. Licensee MDPI, Basel, Switzerland. This article is an open access article distributed under the terms and conditions of the Creative Commons Attribution (CC BY) license.