


Abstract
During the drilling and well test operation cycles of horizontal wells, wellbore instability and collapse frequently occur in sand–mudstone reservoirs. The fallen wellbore debris and rock fragments accumulate inside the wellbore, triggering local wellbore blockage. At present, research regarding the influence of collapse-induced blockage on test productivity under various blockage conditions is lacking. A self-developed visualized experimental system for horizontal well productivity testing was adopted in this study to investigate the fluid flow characteristics and pressure loss in the wellbore under variable blockage degrees and fluid flow parameters. The influence mechanism of collapse blockage on flow pressure loss was analyzed. The results show that at low production rates (less than 100 m3/d) under blockage degrees of 1/3 and 2/3, the fluid flow velocity in the wellbore is low, and the collapsed solid fragments exhibit no migration behavior. Severe blockage can hardly form in the wellbore, and the proportion of hydraulic pressure loss along the wellbore to the total production pressure difference of the reservoir is relatively low. Under high production rates (greater than 150 m3/d), fine debris fills the voids between large collapsed fragments and forms blockages. Furthermore, the pipe flow friction factor of horizontal wells under different collapse blockage degrees was revised based on measured experimental data, which fills the theoretical gap for the selection of pipe flow friction factors under blockage conditions.
1. Introduction
With the continuous expansion of the development scale of deep and unconventional heavy-oil reservoirs, horizontal wells have become the core technology for efficient heavy-oil exploitation owing to their advantages of large drainage area and high single-well productivity [1,2,3]. Wellbore collapse frequently occurs during the drilling and well-testing operations of horizontal wells. The accumulation of collapsed debris leads to local wellbore blockage, which remarkably increases flow resistance and reduces test productivity, thereby severely restricting the economical and efficient development of heavy-oil resources [4]. At present, the influence mechanism of mudstone wellbore collapse on the flow capacity and productivity of heavy oil remains unclear. There is a lack of systematic quantitative research on the evolution law of flow resistance under the coupling effect of key factors such as the blockage degree, fluid viscosity and solid-phase characteristics. Consequently, it is difficult for field operations to accurately evaluate the damage degree of productivity caused by collapse blockage.
In the field of wellbore instability of horizontal wells in deep argillaceous reservoirs, scholars have carried out extensive systematic research on the generation mechanism, failure morphology and quantitative prediction models of wellbore collapse. The hydration of clay minerals and the development of weak structural planes in strata serve as the core internal factors triggering wellbore spalling and collapse, and this characteristic also exists in deep heavy-oil reservoirs [5,6,7]. Liu et al. [8] established a calculation model for the collapse amount of horizontal wells in open-hole sections for multi-weak-surface formations, achieving quantitative characterization of the scale of collapsed material production. On this basis, Xu et al. [9] further combined two key indicators, namely the wellbore collapse angle and collapse depth, to construct an evaluation system for the stability of shale horizontal section wellbore walls. They clarified the geometric differences in collapsed blocks under different instability modes and found that the wellbore wall not only produces local small block detachment, but also easily forms large-volume block collapse. Ding et al. [10] combined the theory of rock weak planes to establish a horizontal wellbore stability model controlled by multiple structural planes. They confirmed that the distribution angle of weak planes in the formation directly changes the collapse range and block size, thereby affecting the variation law of the wellbore flow cross-sectional area. Shi et al. [11] used microscopic digital methods to analyze the instability forms of mudstone wellbore walls, and explained the evolution process of mudstone gradually breaking and forming discrete solid particles from the perspective of mineral microscopic damage, supplementing the generation mechanism of small collapsed particles. Liu et al. [12] conducted wellbore collapse tests on deep brittle shale and pointed out that the collapse of brittle formations is sudden, and large collapsed bodies are prone to quickly accumulate locally in the wellbore. Zhang et al. [13] explored the coupling relationship between drilling immersion time, mechanical drilling speed, and the formation collapse cycle by combining the on-site conditions of offshore large displacement wells. Based on existing research, it is known that the current academic community has basically clarified the mechanical mechanism of wellbore instability in shale reservoirs, and can predict the collapse form and volume. However, most studies only focus on the instability determination of the wellbore itself, and have not further extended to the accumulation characteristics of collapsed materials after entering the wellbore.
With the increasing attention paid to the problem of wellbore collapse, more and more scholars are turning to the study of the impact of collapsed solid-phase and wellbore blockage on fluid flow and oil and gas production capacity. Dong et al. [14,15] conducted experiments on sand-carrying in low-viscosity-fluid wellbores and established a method for evaluating the skin coefficient and productivity of horizontal wells under multiple completion methods. They confirmed that solid-phase accumulation can significantly increase skin resistance and cause productivity decline. Zhu et al. [16] found through permeability experiments of sand bodies outside sand control pipes that the density of solid-phase accumulation directly determines the magnitude of seepage resistance. Li et al. [17] and Huang et al. [18] constructed a productivity model for sand filter tube completion and variable skin factor conditions, clarifying that local blockage in the wellbore will form a non-uniform resistance field. Chen et al. [19] focused on sandstone–mudstone interbedded formations and explored the impact of formation collapse on the skin factor through indoor experiments, directly confirming that wellbore collapse is an important cause of wellbore blockage and productivity decline. Ma et al. [20] used numerical simulation methods to study the progressive sand production law of igneous rock formations and analyzed the dynamic changes in wellbore flow parameters under continuous solid-phase migration. Yang et al. [21] conducted a simulation of wellbore collapse in fractured formations using 3D-printed rock samples, and reconstructed the entire process of collapsed block movement and channel narrowing. Cao et al. [22] and Jiang [23] analyzed the disturbance of wellbore instability on production conditions under complex working conditions by combining fluid–solid thermal coupling models with overseas oilfield cases.
Existing research has not comprehensively considered the effects of multiple factors such as the blockage degree, heavy-oil viscosity, and block size, and lacks indoor experimental support for the flow resistance and productivity changes of horizontal wells with different blockage levels. Therefore, this study conducted research on the flowability and pressure changes of horizontal wells under the condition of sandstone and mudstone wellbore collapse. Through physical experiments, the pressure drop characteristics of wellbores with different degrees of collapse, fluid viscosity, and block size were quantified, revealing the mechanism of fluid energy loss in collapsed confined spaces. At present, the friction coefficient of pipe flow under different degrees of collapse is blank. This study used collapsed blocks collected on site for experiments, which can better reflect the impact of collapse blockage on flow friction under actual working conditions. Furthermore, based on experimental data fitting, a friction coefficient correction model was obtained for different degrees of blockage and flow characteristics. This has positive significance for future research in this field.
2. Experimental Equipment and Methods
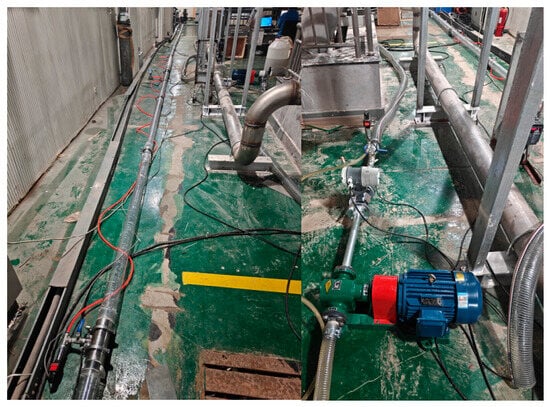
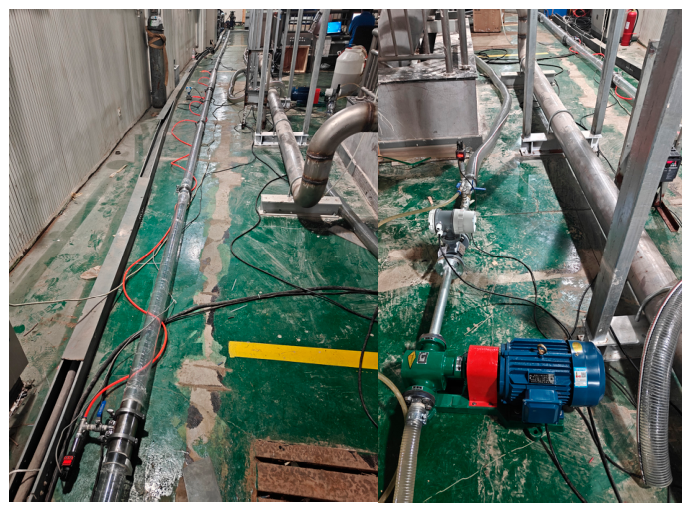
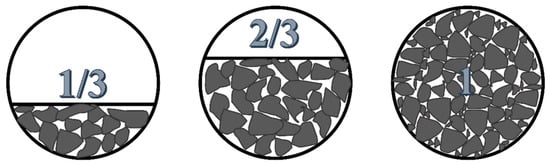
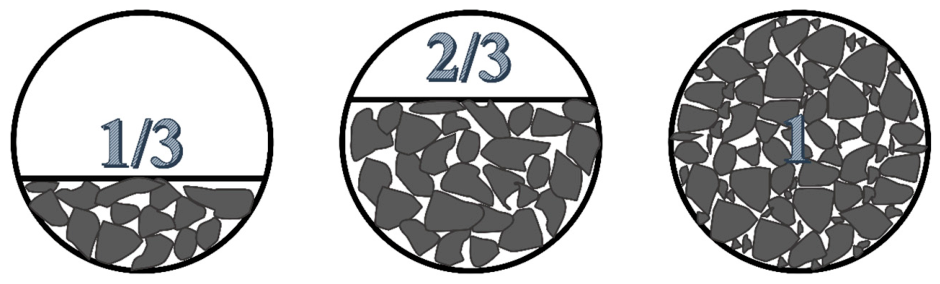
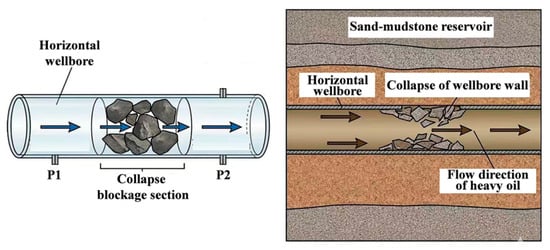
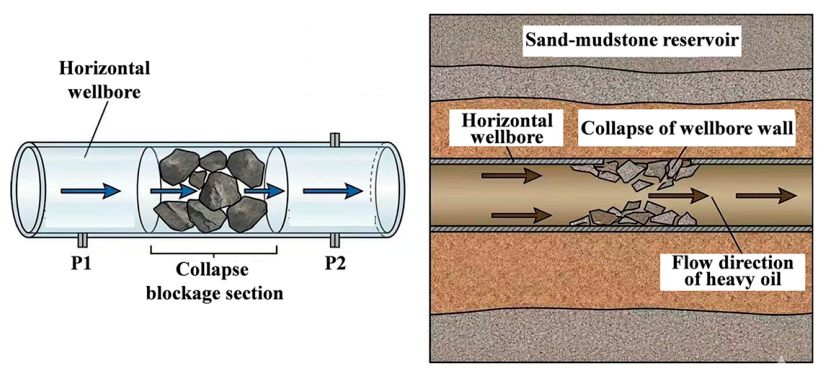
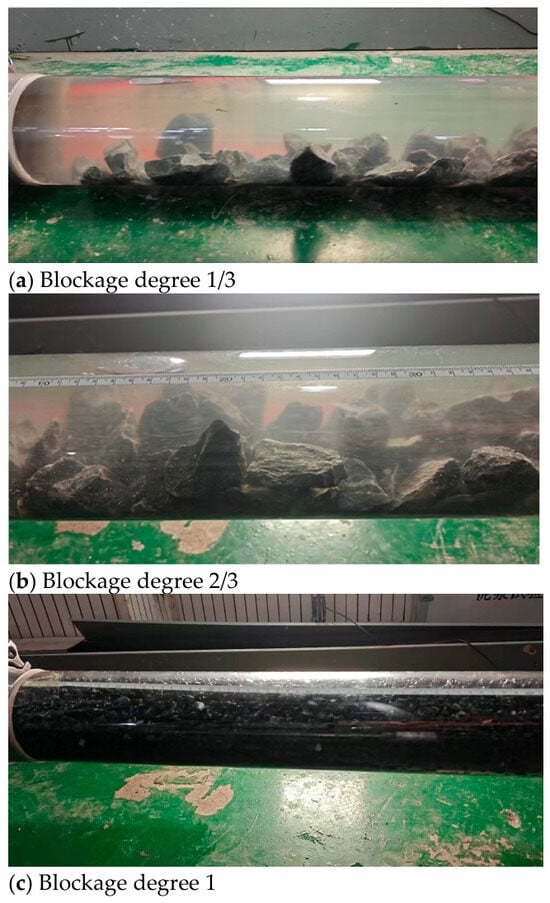
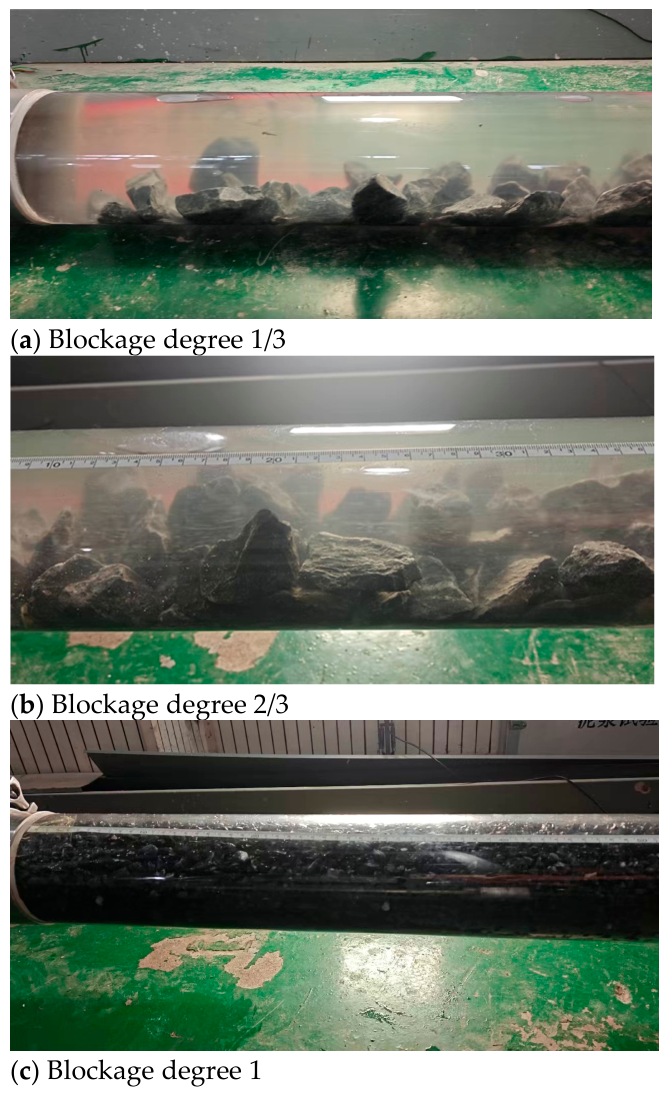
The impact of different degrees of collapse and blockage on the fluidity and production capacity of heavy oil is still unclear. Therefore, quantitatively exploring the impact of the blockage degree on flow resistance is the basis for accurately evaluating the impact of wellbore collapse on testing productivity. To this end, this study constructed a large-scale visualization horizontal tube experimental system as shown in Figure 1. The visualization horizontal tube length is 40 m, and the length and diameter of the collapsed blockage section are 2 m and 4 inches, respectively. The flow rate can be adjusted within 5 m3/h. Simulations of collapsed blocks of different lengths and sizes were conducted in a horizontal pipe, as shown in Figure 2. The collapsed blocks of sandstone and mudstone wellbore walls with different degrees of blockage were collected from the sandstone and mudstone reservoir sections salvaged on site. The sizes of larger and smaller blocks were 30–50 mm and 3–6 mm, respectively. The filling ratio of large and small debris is 1:1, and the volume-weighted average particle size is about 22 mm. The degree of blockage of 1/3 and 2/3 respectively refers to the use of mixed blocks of different sizes to fill 1/3 and 2/3 of the pipeline cross-sectional area. Blockage level 1 refers to the use of mixed blocks of different sizes to fill the entire cross-sectional area of the pipeline, but there are still small channels between the mixed blocks that allow fluid to continue passing through. A simulated heavy oil with a viscosity of 20–80 mPa·s was prepared, and a multi-condition flow pressure drop experiment was carried out systematically. During the experiment, the pressure difference before and after the same blockage section was tested to characterize the effect of accumulated blockage caused by wellbore collapse on the flowability of heavy oil in the wellbore (Figure 3). The specific experimental procedure is as follows:
Figure 1.
Physical image of the visualized horizontal wellbore experimental system.
Figure 2.
Schematic diagram of horizontal wellbore cross-sections with blockage degrees of 1/3, 2/3, and 1.
Figure 3.
Schematic diagram of wellbore flow conditions after wellbore collapse simulated by experiments.
- (1)
- Fill the collapsed blocks into the test section and simulate different collapse states by filling different volumes and quantities of collapsed blocks.
- (2)
- By adjusting the different mass fractions of carboxymethyl cellulose, carboxymethyl cellulose fluids with different viscosities were prepared, and then the liquid was transported to the non-collapsing and collapsing sections of the column using a pump.
- (3)
- Set the pump flow rate to a specific value, start the pump and wait for stable fluid flow, then record data such as the pressure, pressure difference, and flow rate. And capture the collapse and blockage of the section, as well as the state of fluid migration.
- (4)
- If different collapse and blockage states need to be simulated, remove the test pipe section and replace the block after the experiment is completed.
- (5)
- If different fluid properties need to be simulated, use an air pump to blow the pipeline to remove the liquid inside, and then pump in a specific fluid property again.
Each experimental condition was repeated in three parallel tests, and raw measurements such as the flow rate and pressure difference were collected during the steady-state period of each test. Invalid data points recorded during condition switching and unsteady flow periods were first excluded. Afterwards, the arithmetic mean was calculated from the three valid parallel datasets for the same condition, and this mean value was adopted as the representative result for subsequent analysis and plotting. The experimental uncertainty is characterized by the standard deviation of repeated measurements, and all error bars in the figures denote the standard deviation to reflect the data dispersion among parallel tests.
The experiments were conducted at a temperature of 15 ± 2 °C, and all measurements of parameters including pressure drop and viscosity were completed under this temperature condition. After each set of fluid was prepared, a suitable rotational digital viscometer was used to perform 3 measurements at the specified rotational speed, and the average value was taken as the viscosity of the fluid in that group. The average flow velocity was directly calculated based on the real-time volumetric flow rate collected during the experiment, combined with the effective flow cross-sectional area of the test pipe section. The equivalent diameters at blockage degrees of 1/3 and 2/3 are 3.27 inches and 2.31 inches respectively, and the equivalent diameter at a blockage degree of 1 is taken as 0.85 inches. The Reynolds number was calculated based on the equivalent diameter, apparent viscosity and the average flow velocity. The CMC fluids used in the experiment were treated as a power-law fluid, and the apparent viscosity measured by a rheometer was adopted for Reynolds number calculation. The measurement error of the flow meter is ±0.05 m3/h, and the measurement error of the differential pressure sensor is ±0.1 kPa. For experiments with different blockage degrees, the cuttings were reloaded according to a uniform particle size gradation. After the blockage section was filled, data were collected after the flow stabilized under stepwise varying flow rates from 1 m3/h to 4 m3/h.
This physical model is designed based on the Reynolds number similarity criterion, aiming to reproduce the pressure drop law of fluid flowing through the collapsed blockage section of the wellbore. Two representative control measures are adopted to ensure that the experiments can capture the target flow characteristics. First, the Reynolds number range under field horizontal well-testing conditions is matched by adjusting fluid viscosity and the injection flow rate, so that the flow regime and the variation law of frictional pressure loss are consistent between the model and the field. Second, the rock fragments used to construct the blockage are collected from the target sand–mudstone reservoir. Their particle size distribution and stacking pattern are arranged according to the natural accumulation characteristics of collapse debris in field wellbores to reconstruct the geometric features of the blockage. During the experiment, the temperature of the fluid and the temperature of the collapsed block were both the same as the ambient temperature, so the influence of temperature can be ignored. The experimental group settings are shown in Table 1. To investigate the influence of different flow rates and fluid viscosity conditions on the pressure drop of heavy-oil flow, 16 sets of experiments were conducted for each degree of blockage. The steady-state flow assumption was used in the experimental analysis. Data were collected after the flow rate and pressure difference readings stabilized, meaning that the flow inside the tube had reached a steady state. A controlled-variable method was adopted in the experiments. The core variables, including the blockage degree, flow rate and fluid viscosity, which exert the most significant influence on the pressure drop of heavy-oil wellbore blockages, were selected for investigation. For tests with the same blockage degree, the same particle ratio and packing method were applied to guarantee the consistency of the geometric structure of the blockage after each packing. Each experiment was repeated three times, and the average value of the measurements was used for analysis.
Table 1.
Experimental group settings for the impact of collapse blockage on horizontal well-testing productivity.
3. Results
3.1. The Impact of Different Degrees of Blockage on Flow Resistance
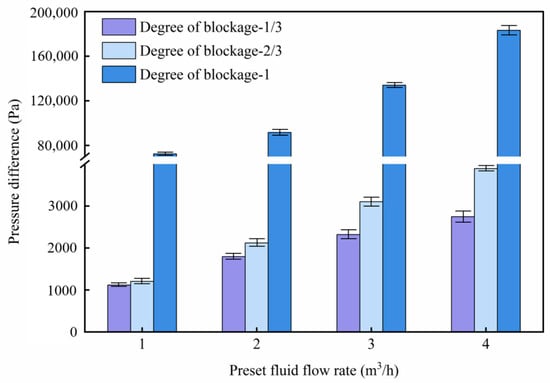
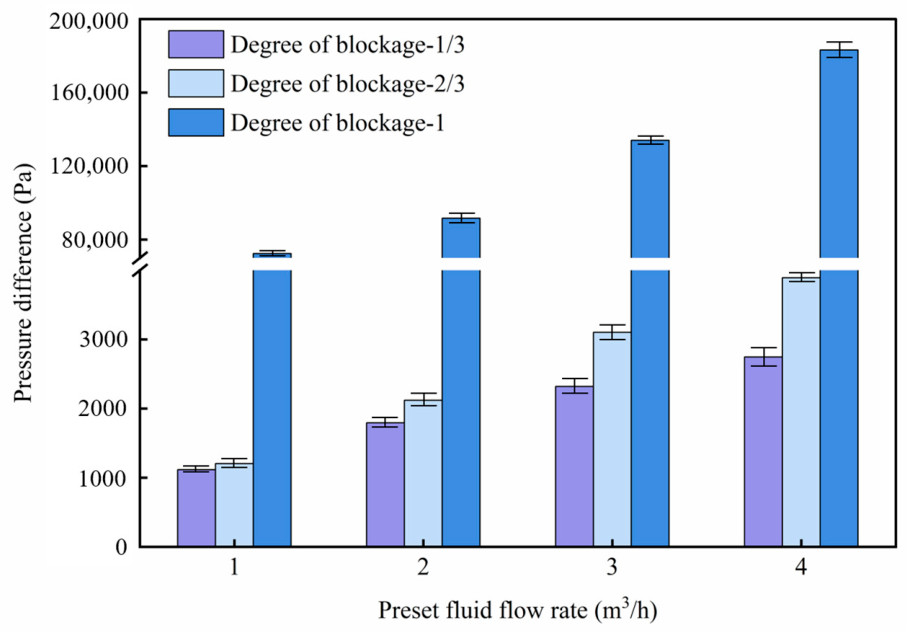
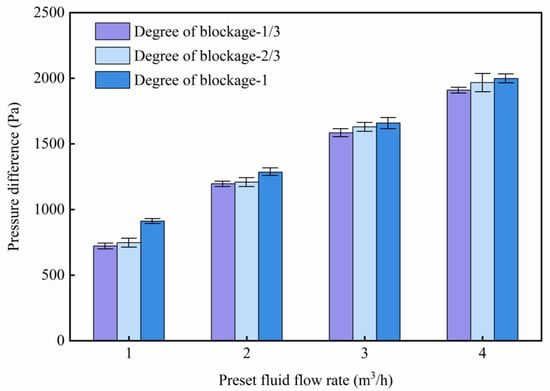
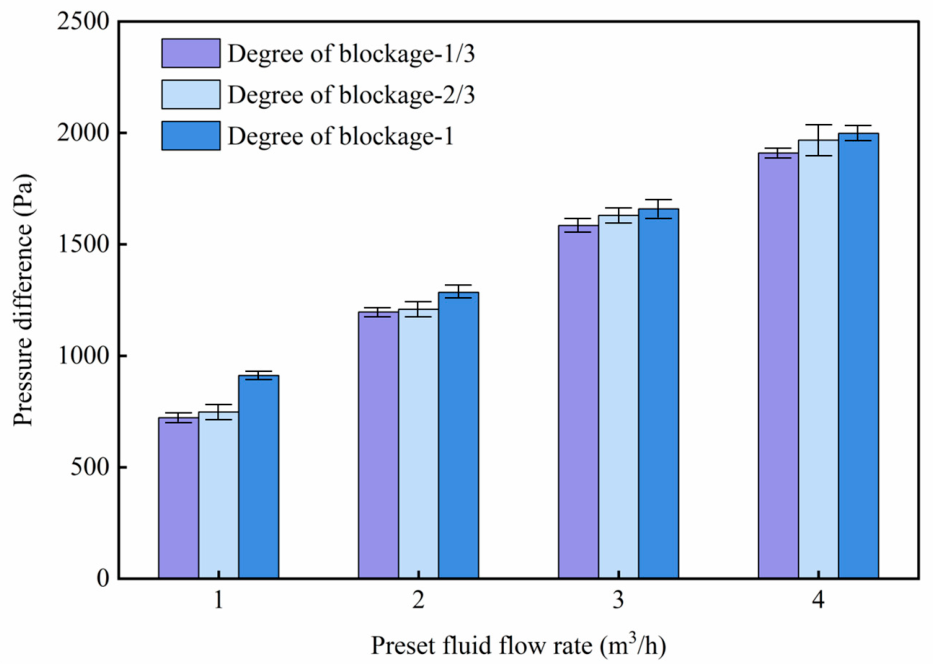
Flow phenomena of simulated heavy oil in the wellbore under various blockage degrees are presented in Figure 4. No migration of rock fragments along with simulated heavy oil is observed under different flow velocities when the blockage degree reaches approximately 1/3 and 2/3. In contrast, migration of small fragments along with fluids is detected at relatively high flow velocities (above 3 m3/h) when the blockage degree approaches 1. Local void fractions inside the wellbore are reduced below the initial porosity due to the migration of small rock fragments. With the pump injection displacement increased from 1 m3/h to 4 m3/h, positive correlations with the flow rate are exhibited by pressure differentials across both collapsed blockage sections and intact wellbore sections. Comparisons of flow pressure differentials for blocked and unblocked intervals shown in Figure 5 and Figure 6 reveal that pressure differentials of collapsed blockage sections remain markedly higher than those of intact wellbore sections, with larger growth amplitudes of pressure differentials against flow rates. Pressure differentials in intact wellbore sections originate merely from frictional resistance of heavy oil flowing through regular circular pipes. By contrast, flow resistance within collapsed sections is formed via the superposition of frictional resistance and local resistance. Narrowing of local flow cross-sections induced by accumulated rock blocks generates distinct throat effects, which trigger sharp rises in local flow velocities of heavy oil within constricted zones and further lead to exponential growth of frictional resistance. Meanwhile, wall surface roughness is substantially enlarged by coarse surfaces of large-size rock fragments. Boundary layer separation and local vortex energy dissipation occur as fluids pass through sudden contraction zones in front of rock fragments and sudden expansion zones behind rock fragments, which further amplify local energy loss. The superposition effect of amplified frictional resistance and local vortex dissipation is macroscopically reflected as additional pressure differentials across collapsed blockage sections, while such extra energy loss does not exist in intact wellbore sections. Flow resistance at the blockage degree of 2/3 is only slightly higher than that at the blockage degree of 1/3. The reduction in local void fractions caused by the migration of small fragments results in far larger flow pressure loss under the blockage degree of 1 compared with the blockage degrees of 1/3 and 2/3.
Figure 4.
Flow of heavy oil in wellbore with different degrees of blockage.
Figure 5.
Pressure difference in collapsed blockage section under different blockage degrees and pump displacement.
Figure 6.
Pressure difference in non-collapsed section under different blockage degrees and pump displacement.
3.2. Influence of Different Viscosities and Flow Rates on Flow Resistance
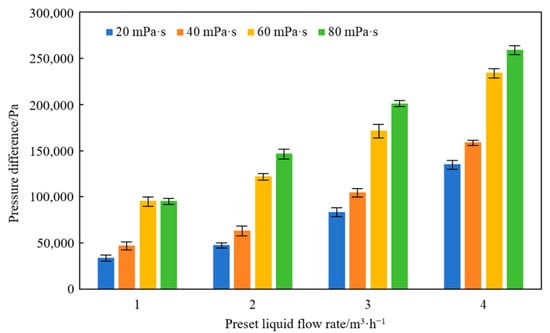
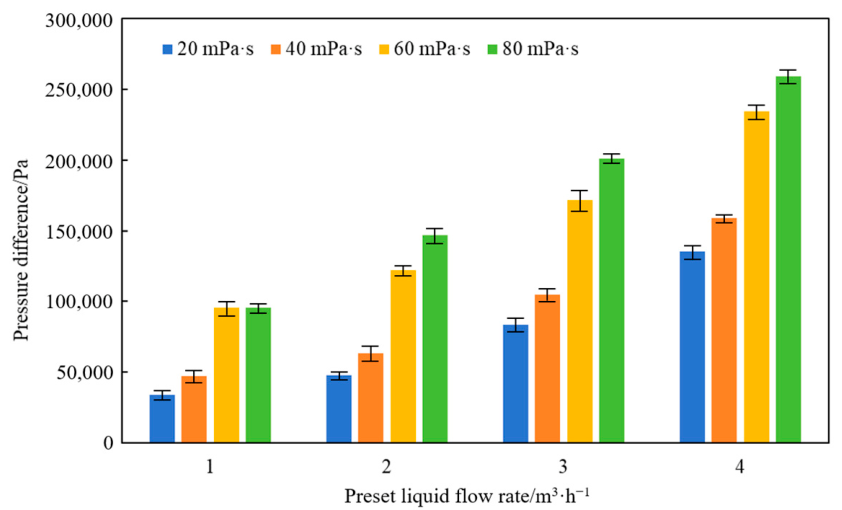
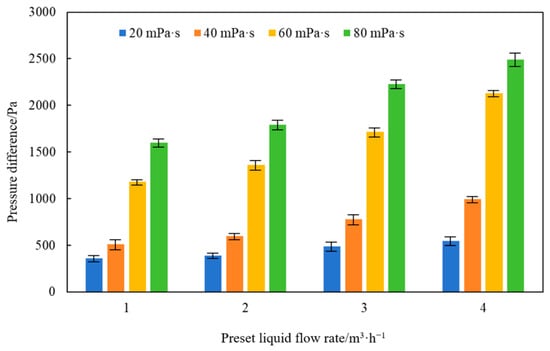
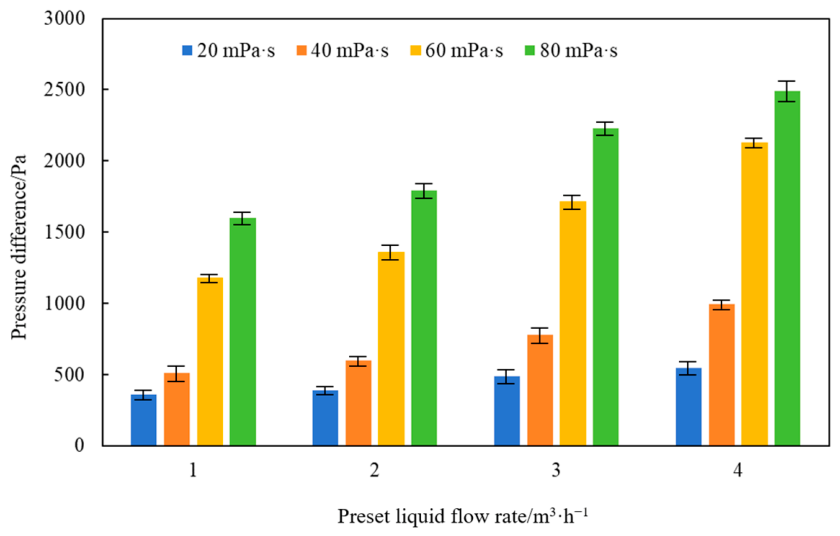
To clarify the coupling effect of viscosity and displacement of heavy oil on the flow resistance in confined spaces caused by wellbore collapse, simulated fluids with viscosities of 20 mPa·s, 40 mPa·s, 60 mPa·s, and 80 mPa·s were prepared. Multi-condition flow pressure drop tests were conducted at constant flow rates of 1–4 m3/h. Note that the displacement rate here refers to the injection rate of the laboratory experiment, which is different from the production rate of the field well. Figure 7 and Figure 8 respectively obtained the pressure difference evolution characteristics of the collapsed blockage section and the non-collapsed section.
Figure 7.
Flow pressure drop in collapsed blockage section with different flow rates and fluid viscosities.
Figure 8.
Flow pressure drop in non-collapsing section with different flow rates and fluid viscosities.
The experimental results show that under the low displacement condition of 1 m3/h, the regulating effect of fluid viscosity on the basic friction has been preliminarily manifested: the pressure difference in the collapsed blockage section increases from 3.50 × 10⁴ Pa at 20 mPa·s to 9.60 × 10⁴ Pa at 80 mPa·s. The pressure difference in the non-collapsed section increases from 360 Pa to 1600 Pa, indicating that even under low-flow-rate conditions, the internal friction effect of high-viscosity fluids will intensify the flow resistance, and this effect is further amplified in the restricted channel. As the displacement increases to 2 m3/h, the coupling effect of viscosity and the flow rate further increases the pressure drop difference. When the displacement is increased to 3 m3/h, the flow field enters the stage of synergistic effect of viscosity and inertia, and the pressure difference in the collapsed blockage section increases rapidly and nonlinearly with viscosity. The throttling effect of the collapsed section on high-viscosity fluids has become the dominant factor in the increase in resistance. Under the condition of a maximum test displacement of 4 m3/h, the pressure difference in the collapsed blockage section increased from 1.35 × 10⁵ Pa at 20 mPa·s to 2.60 × 10⁵ Pa at 80 mPa·s. The pressure difference in the non-collapsed section increased from 550 Pa to 2500 Pa. The viscous shear loss and local throttling loss of the high-viscosity fluid in the collapsed channel jointly dominated the system pressure drop.
Comparing the evolution of pressure drop between the collapsed section and the non-collapsed section, it can be found that under the same viscosity and displacement conditions, the pressure difference in the collapsed blockage section is always much higher than that in the non-collapsed section, and the difference between the two continues to expand with the increase in viscosity and displacement. This phenomenon directly confirms that the irregular channels formed by collapse are the core factor that exacerbates flow resistance. The multi-condition test data further shows that under a fixed degree of collapse and blockage, fluid viscosity is a key physical parameter that determines flow resistance, and its influence increases exponentially with the increase in displacement. When high-viscosity heavy oil flows through the micro-pores and tortuous channels formed by collapse, it not only needs to overcome the vortex dissipation caused by sudden cross-sectional changes, but also needs to withstand the local high-speed shear effect caused by channel shrinkage. The viscous friction resistance between fluid layers and the fluid solid interface increases sharply, ultimately manifested as significant loss of system mechanical energy.
3.3. Influence of Coexistence of Drilling and Completion Fluid and Heavy Oil on Flow Resistance
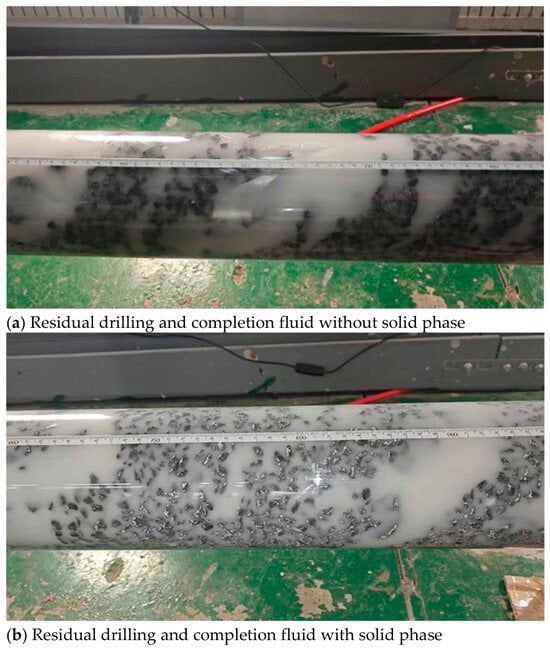
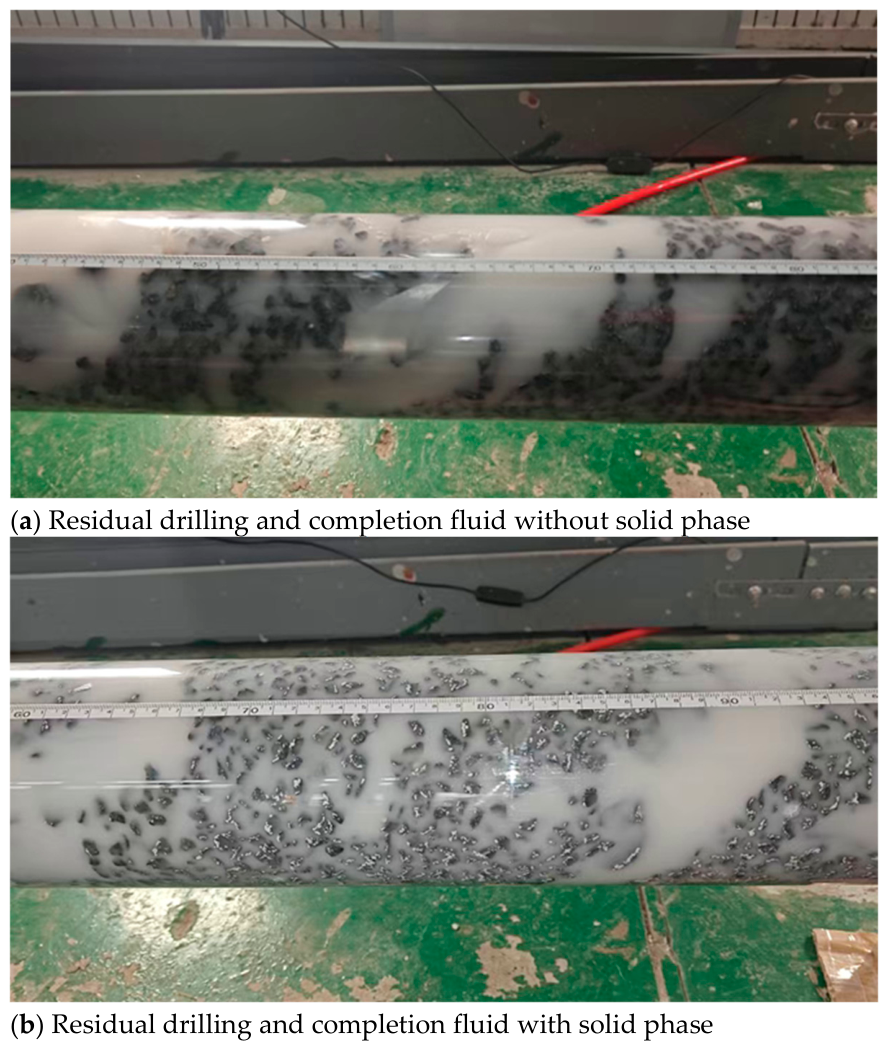
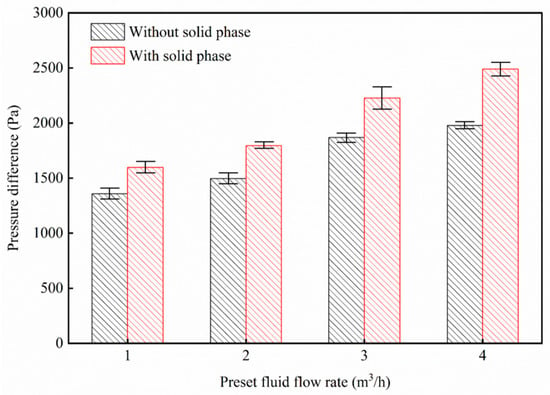
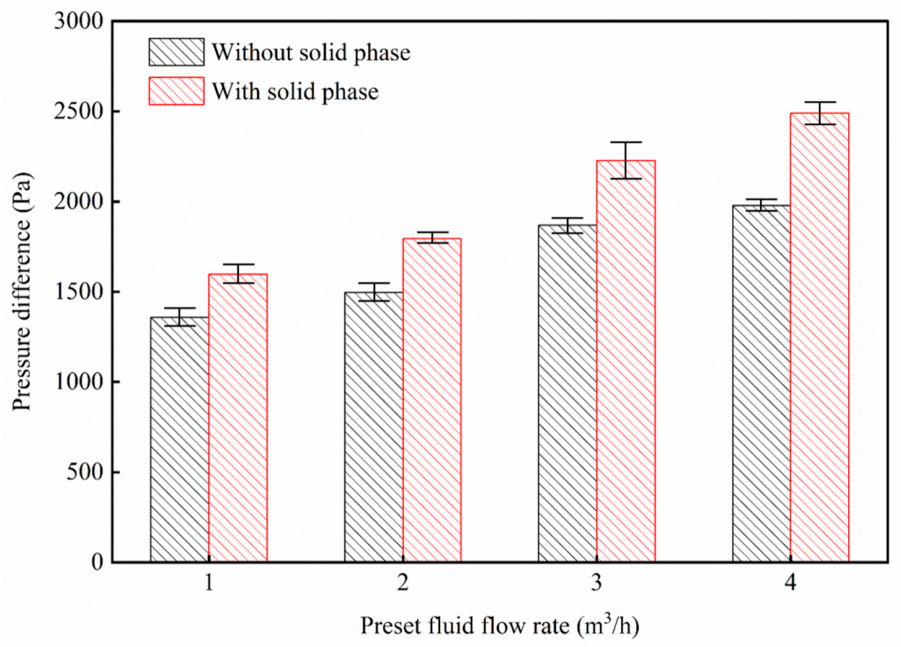
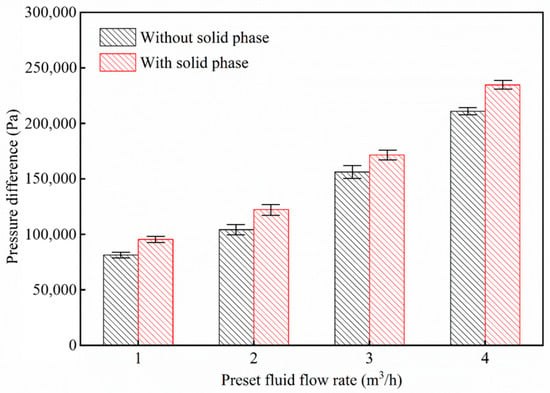
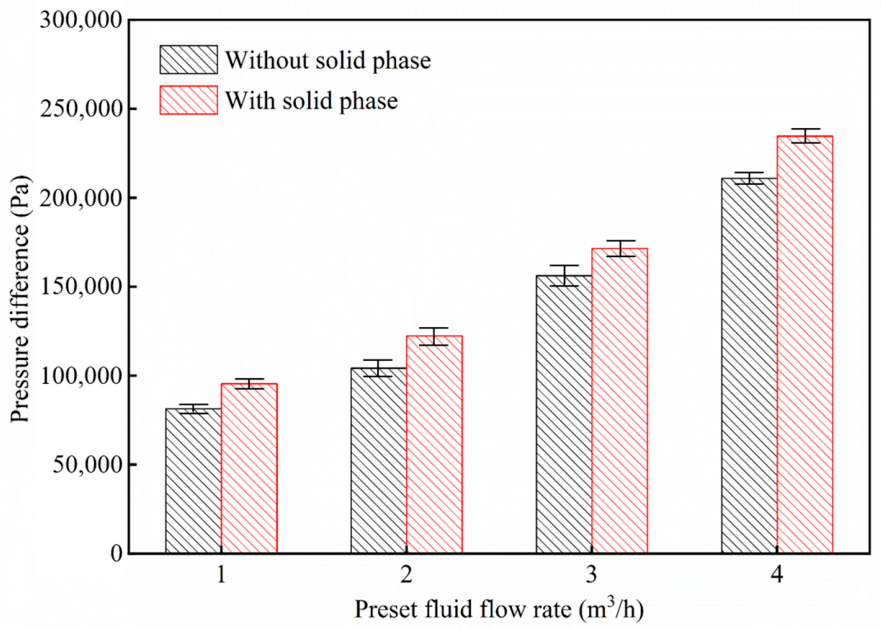
During on-site heavy-oil testing, the drilling and completion fluid in the wellbore may not have been completely discharged. During the testing process, there may be flow under mixed conditions of heavy-oil and drilling and completion fluid, and the drilling and completion fluid itself may contain solid small particles. Therefore, the impact of collapse blockage on flow pressure drop during heavy oil testing under residual drilling and completion fluid conditions in the wellbore was further investigated. The viscosity of residual drilling and completion fluids with and without solid phases mixed with heavy oil is about 60 mPa·s. The flow phenomena during the experiment are shown in Figure 9a and Figure 9b, respectively. As shown in Figure 10 and Figure 11, under the same collapse and blockage conditions, the flow resistance of drilling and completion fluid with the solid phase is significantly higher than that without the solid phase. Taking a displacement of 2 m3/h as an example, the average front pressure difference in the solid-free system is 8.13 × 10⁴ Pa, and the rear pressure difference is 1358 Pa. The front pressure difference in the solid-containing system increases to 9.54 × 10⁴ Pa, and the rear pressure difference increases to 1598 Pa. From the evolution law of pressure drop at different displacements, the pressure difference between the solid-free and solid-containing systems increases linearly with the increase in the flow rate, but the difference between the two continues to expand with the increase in the flow rate. When the displacement increases from 1 m3/h to 4 m3/h, the difference in front pressure between the solid-phase-containing and non-solid-phase-containing conditions increases from about 1.20 × 10⁴ Pa to about 2.50 × 10⁴ Pa, and the difference in back pressure also increases from about 200 Pa to about 500 Pa. This is because in the solid-phase-containing drilling and completion fluid system, heavy spar particles are prone to stagnate and accumulate in the narrow channel when flowing through the collapsed blockage section, further compressing the effective flow area and forming local blockage, greatly increasing the local throttling loss and viscous shear loss of the fluid. Comparing the pressure drop characteristics of solid-free and solid-containing conditions, it can be found that solid particles in drilling and completion fluids not only directly increase the apparent viscosity and internal friction resistance of the fluid, but also significantly amplify the negative impact of local wellbore blockage through the accumulation effect in the collapsed confined space. Multi-condition data confirms that the solid phase in residual drilling and completion fluids is one of the key factors exacerbating flow resistance during the testing process of heavy-oil horizontal wells.
Figure 9.
Experimental phenomena of co-flow of residual drilling completion fluid and heavy oil.
Figure 10.
Comparison of flow pressure drop in non-collapsed section.
Figure 11.
Comparison of flow pressure drop in collapsed, blocked section.
4. Friction Coefficient Correction for Different Degrees of Collapse Blockage and Flow Characteristics
The process of fluid flowing through the collapsed and blocked section in a horizontal wellbore is essentially the conversion and dissipation of fluid kinetic energy and pressure energy. According to the conservation equation of mechanical energy in fluid mechanics, in horizontal pipe flow without considering elevation changes, the total energy loss generated by fluid overcoming rough walls and restricted channels is macroscopically converted into pressure drop at both ends of the pipe section. Based on the principles of energy conservation and dissipation, combined with the classical fluid mechanics pressure drop equation, the following equation can be used to describe the flow resistance in the collapsed blockage section [24]:
where is the pressure loss, Pa. is the length of the collapsed blockage section, m. is the equivalent diameter of the pipeline, m. is the fluid density, kg/m3. is the average flow velocity, m/s. is the coefficient of friction, dimensionless. The most critical parameter in this model is the friction coefficient. In this study, the use of Equation (1) is divided into the following three steps.
- (1)
- Back-calculation of friction coefficient: The experimentally measured pressure drop, flow velocity, equivalent diameter, fluid density and length of the blockage section are substituted into Equation (1) to back-calculate the actual friction coefficient under different blockage degrees and Reynolds numbers.
- (2)
- Development of modified friction correlation: Using multiple sets of friction coefficient data back-calculated from experiments, an engineering correlation of friction coefficient suitable for wellbores with collapse blockage is obtained by fitting.
- (3)
- Pressure drop prediction: For subsequent engineering calculations, the fitted modified friction coefficient is substituted back into Equation (1) to predict the flow pressure loss in wellbores with collapse blockage.
The novelty of this work does not lie in proposing a new pressure drop equation. Instead, within the framework of Equation (1), a modified friction coefficient under collapse blockage conditions is obtained through laboratory experiments, to address the limitation that classical friction models cannot describe the additional local pressure loss induced by irregularly packed blockage.
Currently, the friction coefficient of pipe flow under different degrees of collapse is blank. This study used collapsed blocks collected on site for experiments, which can better reflect the impact of collapse blockage on flow friction under actual working conditions. Therefore, based on experimental data fitting, a modified friction coefficient model was obtained for different degrees of blockage and flow characteristics. The fitting of the friction coefficient correlation equation covers three types of wellbore collapse blockage degrees. Forty-eight sets of effective experimental data points were used, with 16 sets of experimental data for each of the three different degrees of blockage. The Reynolds number range is 100~2500. The overall fitting accuracy meets the engineering calculation requirements for the 1/3 blockage condition R2 = 0.987, the 2/3 blockage condition R2 = 0.992, and the 1 blockage condition R2 = 0.979. The data in Table 2 is independent validation data.
Table 2.
Comparison between calculated and measured results.
The correction formulas for the friction coefficient obtained based on experimental data when the blockage degree is 1/3, 2/3, and 1 are:
Table 2 compares the flow friction of different blockage degrees calculated using the modified friction coefficient calculation formula with the experimental measurement results. The results show that the error between the calculated friction coefficients for different degrees of blockage using the modified formula and the measured data is less than 5%, indicating that the modified model has a certain degree of reliability.
Based on the modified friction coefficient formula, the flow pressure loss in the wellbore under different degrees of blockage and flow characteristic conditions is calculated to evaluate the impact of different degrees of blockage on the production capacity of heavy-oil testing. The research object of this experiment is the flow process after the collapse structure has formed, rather than the complete reproduction of the multi-field coupled mechanical evolution of the entire process of wellbore collapse. Therefore, the complex mechanical effects such as continuous compaction, further fragmentation and geological stress evolution during the collapse process were not considered. Meanwhile, this study also introduces two key assumptions: assuming that there is no free gas precipitation during the flow of heavy oil in the wellbore, and the collapse and blockage debris distribution in the wellbore is relatively uniform. The above simplification and assumptions will bring clear applicable boundaries. The flow pressure drop law obtained from the experiment is feasible for on-site application under the conditions of pure liquid-phase flow, stable blockage structure, and no-longer-continuous compaction and crushing. But if the on-site conditions deviate from the above assumptions, such as free gas precipitation, extremely uneven distribution of blocked debris, continuous compaction and collapse of blocked bodies, and continuous fragmentation of rock debris, the mechanism of action between the fluid and the blocked body will change. At this time, the results of this experiment are no longer applicable and cannot be directly extrapolated.
In this study, the Reynolds number similarity criterion is adopted as the core basis for scale-up. By adjusting the flow rate and fluid viscosity in the experiment, the Reynolds number range of on-site wellbore flow is matched, so as to ensure that the experiment and the field have consistent flow patterns and frictional resistance laws along the path. The accumulation structure of collapsed blocks adopted in the experiment conforms to the natural accumulation characteristics of fallen blocks after on-site wellbore collapse. The blockage fragments used in the experiment are collected from the field, which also ensures that the particle size of the blockage in the experiment is consistent with that in the field.
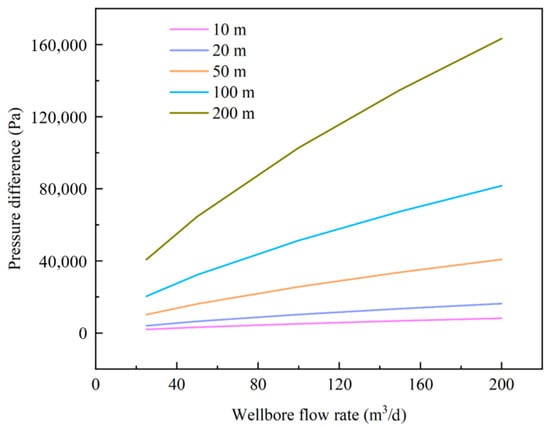
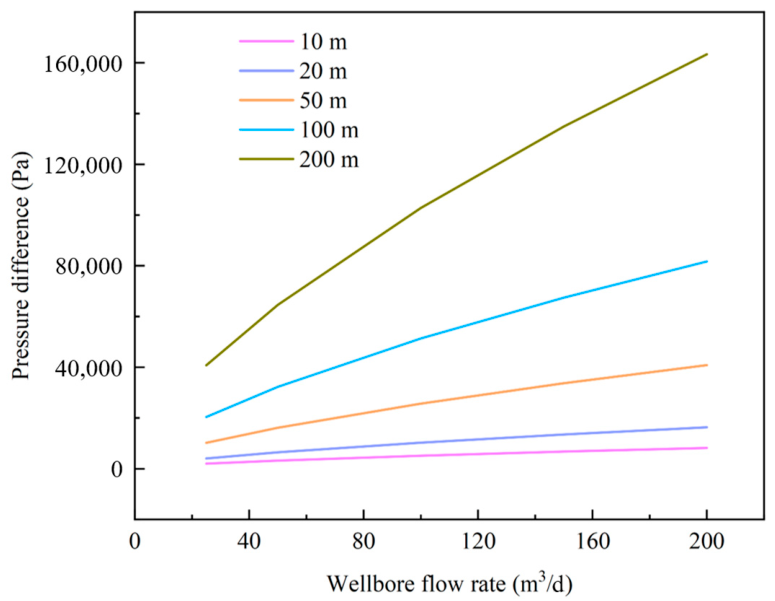
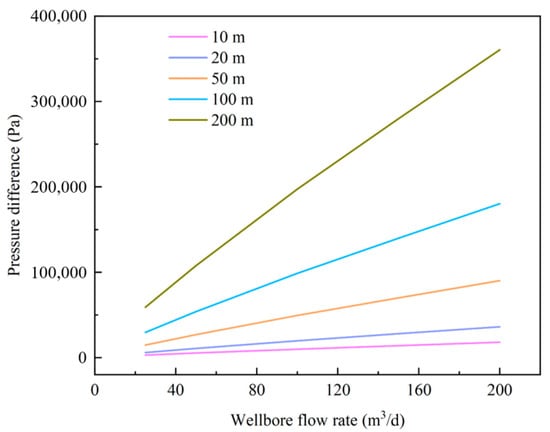
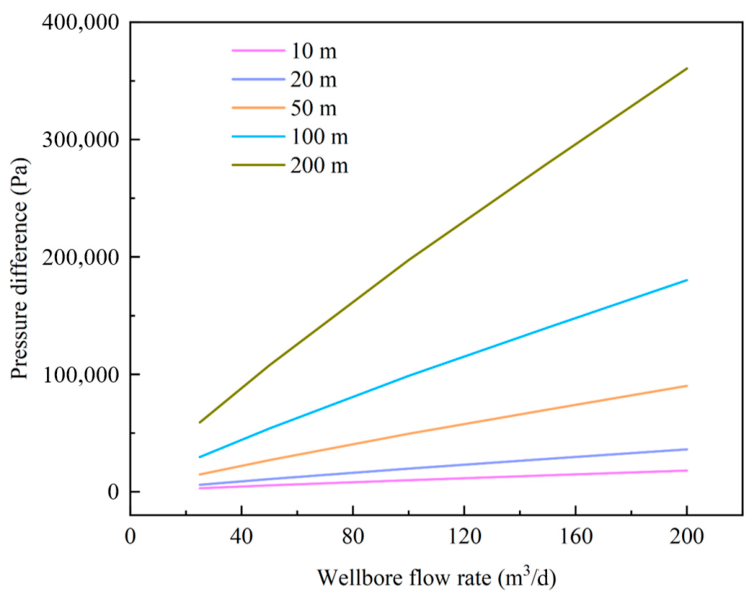
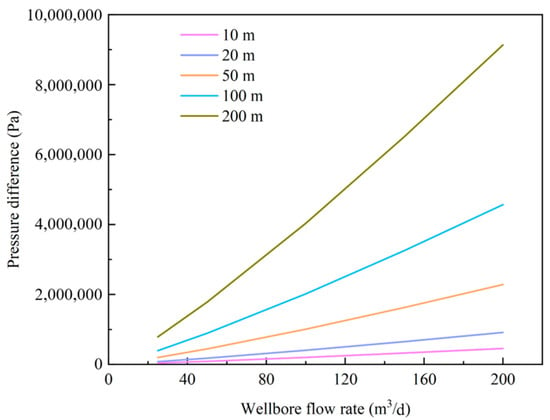
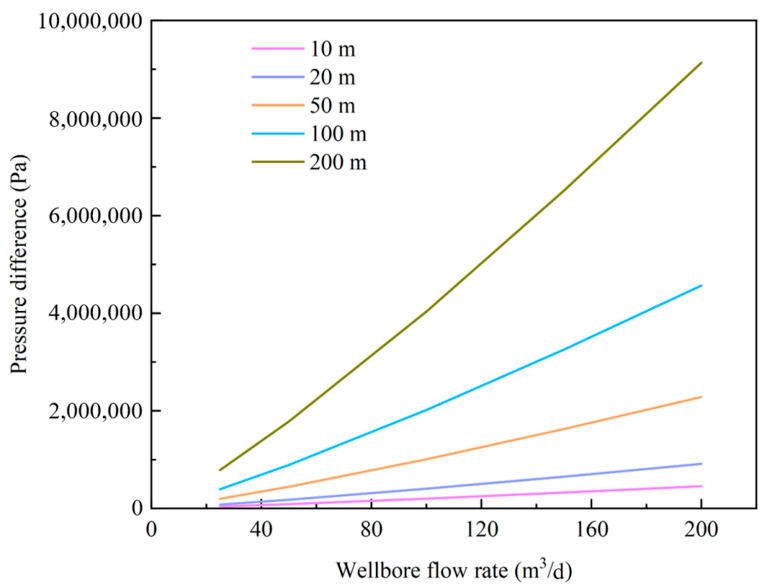
Figure 12, Figure 13 and Figure 14 show the variation in pressure drop with the production rate under different degrees of blockage. The viscosity of the heavy oil on-site is 60 mPa·s and the density is 950 kg/m3. Taking the condition with a blockage degree of 1 and a production rate of 100 m3/d as an example, the equivalent diameter is approximately 0.85 inches. After the equivalent diameter is specified, the corresponding average flow velocity is calculated to be about 3.16 m/s. With the viscosity, density, equivalent diameter and flow velocity known, the Reynolds number is approximately 1081. Substituting the Reynolds number into the friction coefficient correlation (Equation (4)) yields a corrected friction coefficient of roughly 0.0915. Using this corrected friction coefficient and Equation (1), the pressure-drop for a blockage length of 100 m under this condition is calculated to be approximately 2.010 MPa, which is consistent with the pressure-drop value shown in Figure 14 for a blockage length of 100 m and a flow rate of 100 m3/d.
Figure 12.
Pressure loss under different test flow rates and blockage lengths at blockage degree 1/3.
Figure 13.
Pressure loss under different test flow rates and blockage lengths at blockage degree 2/3.
Figure 14.
Pressure loss under different test flow rates and blockage lengths at blockage degree 1.
The calculation results show that under the condition of a collapse blockage degree of about 1/3, the flow pressure loss of different blockage lengths in the blockage section at a production rate of 25 m3/d is in the range of 2039–40,780 Pa. At a flow rate of 200 m3/d, the flow pressure loss of the 200 m collapsed blockage section is about 0.16 MPa (Figure 12). Under the condition of collapse and a blockage degree of about 2/3, when the production is less than 100 m3/d and the blockage length is less than 100 m, the flow pressure loss in the blockage section is less than 0.1 MPa. When the output is 200 m3/d, the flow pressure consumption in the 200 m blockage section is about 0.36 MPa (Figure 13). Under the condition of a collapse blockage degree of about 1, the flow pressure loss in the 200 m blockage section reaches 0.79 MPa when the production is 25 m3/d, and a flow pressure loss of 9.1 MPa is generated in the 200 m collapsed blockage section when the production is 200 m3/d (Figure 14).
Through laboratory experiments and pressure-drop computational analysis, it was found that under lower production conditions (less than 100 m3/d) and for blockage degrees of 1/3 and 2/3, the flow velocity is slower and the collapsed blocks do not migrate. The blockage structure remains stable and it is difficult for the wellbore to develop full blockage. For these stable moderate blockage conditions, the pressure loss induced by collapse blockage is small and its influence on testing productivity can be ignored. However, for a blockage degree of 1, considerable pressure loss can still be generated even at a low flow rate of 25 m3/d, which will impair testing productivity. For production rates between 100 and 150 m3/d, the influence of flow pressure loss gradually becomes apparent. Fluid flow may drive small debris to migrate, which increases local blockage severity and reduces testing productivity. Under the conditions of this study and for blockage degrees of 1/3 and 2/3, limiting the length of the collapsed blockage section below 100 m can effectively mitigate the adverse effect on testing productivity. Under high production conditions (greater than 150 m3/d), it may lead to large debris filling, collapse, and blockage of block gaps. If further consideration is given to residual drilling and completion fluids containing solid phases in the wellbore, it may result in local blockage levels approaching 1. According to the calculation results in Figure 14, when the degree of blockage is about 1, the collapsed blockage section will significantly reduce the testing capacity. At this point, it is necessary to take measures such as lowering the incident hole tube to suppress the collapse of the wellbore wall in order to obtain more accurate testing productivity.
5. Conclusions
This study utilized a self-designed visual horizontal well-testing productivity simulation experimental system to conduct experiments on the impact of wellbore collapse blockage on testing productivity under different degrees of blockage and flow characteristics. The main conclusions drawn are as follows:
- (1)
- Under the fluid viscosity (20–80 mPa·s) and wellbore diameter conditions set in this study, the flow velocity is slower at lower production rates (less than 100 m3/d), and the collapsed blocks do not migrate, making it difficult for the wellbore to be completely blocked. The proportion of hydraulic pressure loss along the wellbore to the total production pressure difference of the reservoir is relatively low for blockage degrees of 1/3 and 2/3.
- (2)
- As the fluid velocity increases, the movement of the fluid may cause the movement of smaller-sized chunks, leading to an increase in the degree of local blockage. Under the conditions of this study, controlling the length of the collapsed blockage section of the wellbore to be less than 100 m at higher production rates (100–150 m3/d) can effectively reduce the negative impact of collapse blockage on testing productivity.
- (3)
- A high fluid flow velocity will cause debris to fill the gaps between large collapsed rock fragments and form blockages. If further consideration is given to residual drilling and completion fluids containing solid phases in the wellbore, it may result in local blockage levels approaching 1. Under high-yield conditions (greater than 150 m3/d), it is necessary to take measures such as lowering the inlet pipe to suppress wellbore collapse in order to obtain more accurate testing productivity.
This study has several limitations. First, mechanical breakage and compaction of collapsed debris were not considered in the laboratory experiments. Second, the modified friction coefficient correlations for different blockage degrees obtained in this work are only applicable to pure liquid-phase flow conditions. In addition, only three blockage levels of 1/3, 2/3 and 1 were designed in the experiments. The predictive capability of this correlation for flow characteristics under other blockage degrees needs further verification.
Author Contributions
Conceptualization, J.L. and W.L.; methodology, Y.G.; software, F.Y.; validation, J.L. and F.Y.; formal analysis, W.L.; investigation, F.Y.; resources, J.L.; data curation, W.L.; writing—original draft preparation, J.L.; writing—review and editing, Y.G.; visualization, F.Y.; supervision, Y.G.; project administration, Y.G.; funding acquisition, Y.G. All authors have read and agreed to the published version of the manuscript.
Funding
This research was funded by Oil & Gas Major Project of China, grant number 2025ZD1403201.
Data Availability Statement
The data supporting the conclusions of this article will be made available by the authors on request.
Conflicts of Interest
Jizhi Li was employed by Shenzhen Branch of China National Offshore Oil Co., Ltd. Faling Yin and Wenlei Liu were employed by Drilling Technology Research Institute, SINOPEC Shengli Oilfield Service Corporation. The remaining authors declare that the research was conducted in the absence of any commercial or financial relationships that could be construed as a potential conflict of interest.
References
- Contreras, V.; Paz, P.; Netto, T.A. Experimental analysis of inorganic scale deposition in pipes: Mesoscale flow loop development and case study. J. Pet. Sci. Eng. 2022, 209, 109776. [Google Scholar] [CrossRef] [Scilit]
- Cheng, W.; Sun, J.; Yin, D.; Jiang, G. Research status of the wellbore failure mechanism and predicting model in deep mudstone and shale. Drill. Eng. 2021, 48, 21–28. [Google Scholar]
- Rahmati, H.; Jafarpour, M.; Azadbakht, S.; Nouri, A.; Vaziri, H.; Chan, D.; Xiao, Y. Review of sand production prediction models. J. Pet. Eng. 2013, 2013, 864981. [Google Scholar] [CrossRef] [Scilit]
- Lin, H.; Kang, W.H.; Oh, J.; Canbulat, I.; Hebblewhite, B. Numerical simulation on borehole breakout and borehole size effect using discrete element method. Int. J. Min. Sci. Technol. 2020, 30, 623–633. [Google Scholar] [CrossRef] [Scilit]
- Lee, H.; Ong, S.H.; Azeemuddin, M.; Goodman, H. A wellbore stability model for formations with anisotropic rock strengths. J. Pet. Sci. Eng. 2012, 97, 109–119. [Google Scholar] [CrossRef] [Scilit]
- Liu, H.; Cui, S.; Meng, Y.; Li, Z.; Yu, X.; Sun, H.; Zhou, Y.; Luo, Y. Rock mechanics and wellbore stability of deep shale during drilling and completion processes. J. Pet. Sci. Eng. 2021, 205, 108882. [Google Scholar] [CrossRef] [Scilit]
- García, F.; García, J.; García, R.; Joseph, D. Friction factor improved correlations for laminar and turbulent gas–liquid flow in horizontal pipelines. Int. J. Multiph. Flow 2007, 33, 1320–1336. [Google Scholar] [CrossRef] [Scilit]
- Liu, Z.; Chen, M.; Jin, Y.; Yang, X.; Lu, Y.; Xiong, Q. Calculation model for borehole collapse volume of a horizontal openhole in multiple-weak-plane formation. Pet. Explor. Dev. 2014, 41, 102–107. [Google Scholar] [CrossRef] [Scilit]
- Xu, S.; Liu, R.; Meng, X.; Liu, B.; Sun, Z.; Fu, J.; Zhai, X.; Zhang, J. Wellbore stability evaluation of horizontal wellbore in mudstone: A method based on wellbore collapse angle and depth model. Oil Drill. Prod. Technol. 2023, 45, 136–142. [Google Scholar]
- Ding, Y.; Luo, P.; Liu, X.; Liang, L. Wellbore stability model for horizontal wells in shale formations with multiple planes of weakness. J. Nat. Gas. Sci. Eng. 2018, 52, 334–347. [Google Scholar] [CrossRef] [Scilit]
- Shi, B.; Zhang, D.; Chu, Q. Micro digital analysis on instability form and mechanism of mudstone borehole wall in Songnan Gas Field. Pet. Drill. Tech. 2023, 51, 22–33. [Google Scholar]
- Liu, H.; Cui, S.; Meng, Y.; Zhou, Y.; Luo, Y. Study on wellbore caving and instability of horizontal well in deep brittle shale. Fault-Block Oil Gas Field 2021, 28, 323–328. [Google Scholar]
- Zhang, J.; Li, J.; Li, Z.; Hu, P.; Lian, W.; Yang, H.; Han, J. Open-hole extension limit of offshore extended-reach well considering formation collapse. J. Pet. Explor. Prod. Technol. 2024, 14, 2473–2489. [Google Scholar] [CrossRef] [Scilit]
- Dong, C.; Gao, K.; Wang, P.; Zhang, Q.; Cui, M.; Yao, F. Sand-carrying flow in low-viscosity wellbore fluid and characteristic flow velocities. Acta Pet. Sin. 2016, 37, 1280–1286. [Google Scholar]
- Dong, C.; Wu, L.; Wang, A.; Zhang, Q. A new model of skin factor and productivity ratio evaluation for horizontalwells with various completion systems. Spec. Oil Gas Reserv. 2009, 16, 77–81. [Google Scholar]
- Zhu, C.; Deng, J.; Wang, L.; Wang, X.; Wei, L.; He, B.; Zeng, X. Experimental study of accumulated sand permeability outside sand control screen. Oil Drill. Prod. Technol. 2010, 32, 70–73. [Google Scholar]
- Li, B.; Wu, X.; An, Y.; Zhang, J.; Zhang, J.; Han, G. Modeling the skin factor of horizontal well completed with precision screen. Oil Drill. Prod. Technol. 2012, 34, 52–56. [Google Scholar]
- Huang, S.; Cheng, L.; Li, C.; Zhao, F. The Productivity Model of Horizontal Well Considering the Skin Variation in Production Section. Drill. Prod. Technol. 2005, 28, 31–34. [Google Scholar]
- Chen, W.; Ke, A.; Ma, Z. Experimental study on the effect of interbedded collapse of sandstone and mudstone on skin coefficient. Petrochem. Ind. Appl. 2022, 41, 22–25. [Google Scholar]
- Ma, T.; Qiu, Y.; Zhang, Y.; Liu, Y. Numerical simulation of progressive sand production of open-hole completion borehole in heterogeneous igneous formation. Int. J. Rock Mech. Min. Sci. 2022, 150, 105030. [Google Scholar] [CrossRef] [Scilit]
- Yang, B.; Liu, H.; Lei, J.; Feng, C.; Du, S. Simulation Study of Wellbore Collapse in Fractured RockLike Samples Based on 3D Printing. Int. Pet. Petrochem. Technol. Conf. J. Phys. Conf. Ser. 2025, 3048, 012069. [Google Scholar] [CrossRef] [Scilit]
- Cao, W.; Xing, X.; Zhou, C.; Zhu, H. Fluid-solid-thermal-chemical coupling model for wellbore instability ofdirectional wells in central Bohai Sea and its application. J. Xi’an Shiyou Univ. (Nat. Sci. Ed.) 2024, 39, 71–77. [Google Scholar]
- Jiang, K. Mechanisms and countermeasures of mudshale welbore instability in M gas field, indonesia1. China Offshore Oil Gas 2021, 33, 142–147. [Google Scholar]
- White, F.M. Viscous Fluid Flow; McGraw-Hill: New York, NY, USA, 2006. [Google Scholar]

Disclaimer/Publisher’s Note: The statements, opinions and data contained in all publications are solely those of the individual author(s) and contributor(s) and not of MDPI and/or the editor(s). MDPI and/or the editor(s) disclaim responsibility for any injury to people or property resulting from any ideas, methods, instructions or products referred to in the content. |
© 2026 by the authors. Licensee MDPI, Basel, Switzerland. This article is an open access article distributed under the terms and conditions of the Creative Commons Attribution (CC BY) license.