


Featured Application
The multi-modal smart sensing and analytical framework established in this study provides sports scientists, athletic coaches, and physiotherapists with an objective exploratory screening framework to evaluate how muscular strength interacts with sensorimotor postural control. By combining force platform stabilometry and isokinetic dynamometry, practitioners can identify functional sensory-strength mismatches (such as athletes with high quadriceps torque who exhibit elevated postural sway during visual deprivation) and design targeted proprioceptive conditioning and velocity-specific eccentric hamstring training to optimize athletic preparation and neuromuscular resilience.
Abstract
Background: The diagnostic integration of complementary smart sensing technologies offers significant advantages for functional neuromuscular profiling and athletic screening. This study investigated the biomechanical coupling between unilateral postural stability and multi-speed isokinetic knee strength in thirty physically active males (mean age: 24.9 ± 3.97 years, body mass: 84.8 ± 10.50 kg) using a multi-modal smart-sensing framework. Methods: Postural sway kinematics were captured on an AMTI high-frequency force platform (1000 Hz) during single-leg stance under Eyes Open (EO) and Eyes Closed (EC) conditions. Multi-angular muscular torque, total work, and concentric Hamstrings-to-Quadriceps (H/Q) ratios were evaluated via a computerized Biodex System 4 dynamometer across three angular velocities (60°/s, 180°/s, and 240°/s). Repeated-measures Linear Mixed-Effects Models (LMM) with Torque × Condition interaction terms and False Discovery Rate (FDR) corrections were applied to assess sensory reweighting and torque–sway interactions. Results: Visual deprivation elicited a substantial sensory reweighting response, with Center of Pressure path length nearly tripling from EO to EC across both limbs (left: 1655.4 ± 437.6 mm vs. 4772.3 ± 1929.9 mm, p < 0.001, Cohen’s d = 2.23; right: 1641.4 ± 412.6 mm vs. 4885.9 ± 1968.0 mm, p < 0.001, Cohen’s d = 2.28). Concentric Hamstrings-to-Quadriceps (H/Q) ratios increased progressively with angular velocity, rising for the left limb from 0.49 ± 0.05 (60°/s) to 0.60 ± 0.10 (180°/s) and 0.64 ± 0.10 (240°/s), and for the right limb from 0.51 ± 0.08 (60°/s) to 0.59 ± 0.11 (180°/s) and 0.64 ± 0.11 (240°/s). Under EO, maximal extensor torque (60°/s) showed no correlation with postural sway (r = +0.007, p = 0.969); however, during EC, torque demonstrated a significant positive correlation with sway (r = +0.546, p = 0.0018). LMM confirmed a significant Torque × Condition interaction (β = +21.13 mm/(N·m), p < 0.001), indicating divergence in postural control dynamics under sensory challenge. Bilateral strength asymmetries exceeding 10% were prevalent in 30.0% to 46.7% of participants depending on velocity. Conclusions: These empirical findings confirm a sensory-dependent neuromuscular decoupling: high maximal knee strength does not inherently confer somatosensory stabilization when visual feedback is occluded. The established exploratory four-quadrant screening framework provides an objective screening model to detect functional strength–stability mismatches and guide individualized athletic conditioning.
1. Introduction
In contemporary sports science and sports medicine, diagnostics of motor performance and neuromuscular capacity serves two primary and interconnected purposes: the longitudinal monitoring of athletic conditioning and the early detection of functional deficits associated with musculoskeletal injury risk [1,2]. A substantial proportion of all sports-related injuries affects the lower extremity, with the knee joint being particularly vulnerable due to its complex anatomical architecture, high degrees of freedom, and exposure to intense ground reaction forces during dynamic athletic maneuvers such as jumping, cutting, and rapid deceleration [3,4]. Non-contact knee traumas, notably anterior cruciate ligament (ACL) disruptions and hamstring strain injuries, frequently occur during single-leg landing or sudden directional changes [5,6]. Consequently, identifying the underlying biomechanical and neuromuscular prerequisites that govern dynamic joint stabilization represents a crucial objective in applied sports diagnostics.
Advances in smart sensor technologies and computerized diagnostic instrumentation have transformed the field of sports biomechanics. On the one hand, computerized isokinetic dynamometers (e.g., the Biodex System) represent the clinical gold standard for quantifying isolated joint torques, velocity-specific force generation, total work capacity, and agonist–antagonist balance (hamstrings-to-quadriceps concentric ratio, H/Q) across standardized angular velocities [7,8]. On the other hand, high-precision piezoelectric and strain-gauge force platforms (e.g., AMTI systems) provide high-frequency stabilometric assessment by tracking Center of Pressure (COP) trajectories, sway velocities, and Romberg quotients during unilateral or bilateral stances [9,10]. While both smart sensing modalities provide rich, objective data regarding kinetic muscular output and stabilometric sensorimotor control, respectively, they are conventionally evaluated in clinical isolation or through simple bivariate linear correlations [11,12].
However, human motor control is fundamentally non-linear, adaptive, and redundant [13,14]. Unilateral postural stabilization relies on continuous multi-sensory integration—incorporating visual, vestibular, and somatosensory/proprioceptive feedback—coupled with fine-tuned closed-loop activation of periarticular musculature [15,16]. When visual input is removed (e.g., in Eyes Closed conditions), the central nervous system undergoes acute sensory reweighting, demanding increased reliance on proprioceptive mechanoreceptors located within joint capsules, ligaments, and muscle spindles [17,18]. Under such sensory manipulation, conventional linear statistical models frequently fail to capture the subtle interactions between bulk muscular strength, velocity-dependent force generation, and stabilometric sway dynamics, often reporting weak or non-significant linear associations [19,20].
In sports biomechanics research, sample sizes are often constrained (typically N = 20–50) due to intensive laboratory instrumentation protocols, multi-sensor calibration requirements, and the physical fatigue imposed by exhaustive testing [21]. Recent systematic reviews have emphasized that understanding the complex association between muscle strength and dynamic balance across athletic populations requires nuanced statistical modeling rather than simplistic correlation analyses [22,23]. Under these experimental constraints, extracting maximum physiological insight requires robust analytical pipelines that incorporate factorial designs, effect size calculations, and repeated-measures mixed-effects modeling to isolate sensory conditions from mechanical force outputs.
From a broader sensor-engineering perspective, contemporary diagnostic frameworks increasingly recognize that isolated single-sensor assessments often fail to capture multifaceted physiological phenomena. Recent advancements in multimodal information fusion and interpretable computational modeling have demonstrated that combining heterogeneous data streams significantly enhances diagnostic robustness and eliminates single-modality blind spots [24,25,26]. For example, methodological frameworks incorporating dynamic cross-feature calibration and multi-target tissue modeling illustrate how cross-domain signal fusion overcomes the inherent boundaries of single-sensor evaluation in knee diagnostic workflows [25,26], while knowledge-guided information fusion networks emphasize the necessity of structured feature attribution across complementary modalities [24]. In an analogous manner, evaluating human athletic performance through an isolated modality—whether solely kinetic force production or single-dimensional kinematic sway—yields an incomplete functional picture. Translating the principles of multimodal information integration into athletic biomechanics provides a compelling conceptual rationale for coupling force platform stabilometry with computerized isokinetic dynamometry: rather than assessing neuromuscular strength and postural balance in separate operational silos, synthesizing these complementary sensor streams into a unified diagnostic pipeline enables researchers and practitioners to capture cross-domain interactions, expose sensory-dependent control trade-offs, and construct explainable functional profiles.
To address these gaps within the scope of multi-modal sensing, smart devices, and data analysis in sports, this study investigates the non-linear coupling between isokinetic knee performance and postural stability under sensory manipulation in physically active males. We combine force platform stabilometry (AMTI) and computerized isokinetic dynamometry (Biodex 4) through a structured multi-modal analytical pipeline incorporating factorial statistical modeling, velocity-specific H/Q ratios, bilateral asymmetry stratification, and diagnostic athletic profiling. Specifically, we test three explicit hypotheses:
Hypothesis 1 (H1).
Visual deprivation (Eyes Closed) will induce a profound sensory reweighting effect, substantially magnifying Center of Pressure displacement and velocity compared to baseline Eyes Open conditions across both lower limbs.
Hypothesis 2 (H2).
Under baseline visual conditions (Eyes Open), isokinetic knee torque will show negligible correlation with postural sway, whereas under visual deprivation (Eyes Closed), a significant positive relationship will emerge, reflecting a sensory-dependent neuromuscular decoupling where higher maximal torque is associated with increased sway magnitude in the absence of visual feedback, as verified by a statistically significant torque × condition interaction in repeated-measures mixed modeling.
Hypothesis 3 (H3).
Unilateral postural stability and velocity-dependent isokinetic torque profiles provide distinct, complementary diagnostic dimensions that enable the objective, exploratory classification of athletic functional profiles for individualized conditioning and neuromuscular screening considerations.
2. Materials and Methods
2.1. Methodological Workflow and Study Design
The comprehensive experimental and analytical framework developed in this study followed a structured four-stage sequential pipeline: (1) Participant Preparation and Standardization: Athletes completed health screening, anthropometric profiling, and a standardized 13-exercise dynamic warm-up protocol (Table 1) to ensure uniform physiological preparation; (2) Multi-Modal Smart Sensing: High-frequency AMTI force platform stabilometry (1000 Hz) was captured during 30-s single-leg stances under Eyes Open and Eyes Closed conditions(AMTI, 176 Waltham Street Watertown, MA, USA), followed by computerized Biodex System 4 isokinetic dynamometry across three angular velocities (60°/s, 180°/s, 240°/s) evaluating concentric knee extension and flexion (Biodex Medical Systems, Inc., Shirley, New York, NY, USA); (3) Signal Processing and Feature Extraction: Raw stabilometric signals were filtered (10 Hz low-pass Butterworth) to compute Center of Pressure (COP) total path length and average sway velocity, while isokinetic torque signals were gravity-corrected to extract peak torque, total work, concentric Hamstrings-to-Quadriceps (H/Q) ratios, and inter-limb asymmetry indices (ASI); and (4) Statistical Modeling and Functional Profiling: Factorial repeated-measures Linear Mixed-Effects Models (LMM) with Torque × Sensory Condition interaction terms, False Discovery Rate (FDR)-adjusted bivariate correlations, and an exploratory four-quadrant screening matrix were implemented to evaluate sensory reweighting dynamics and athletic functional profiles. Computations were made usin Noraxon’s MR 3.18 software (Noraxon U.S.A., Inc., Scottsdale, AZ, USA), then by custom script in python 3.11.
Table 1.
Standardized 13-exercise dynamic warm-up protocol performed prior to biomechanical testing.
2.2. Participants and Statistical Power Justification
The experimental cohort comprised thirty physically active young males (mean age: 24.9 ± 3.97 years, height range: 169–203 cm, body mass range: 67–109 kg, mean body mass: 84.8 ± 10.50 kg). All participants engaged in regular physical activity (resistance training, team sports, or running) for a minimum of 4–6 h per week. Inclusion criteria required participants to be free from any lower extremity musculoskeletal injuries, neurological disorders, vestibular impairments, or concussions for at least twelve months prior to testing. All subjects gave written informed consent prior to participation, and the experimental protocol was conducted in accordance with the Declaration of Helsinki and approved by the Institutional Ethics Committee (protocol code KE-02/2024). Given the demographic characteristics of the sample (young, recreationally active males), the findings are primarily applicable to this population, and generalization to female athletes, pediatric cohorts, or elite athletic groups requires independent external validation.
An a priori statistical power analysis was performed using G*Power software (version 3.1.9.7, Franz Faul, Universität Kiel, Kiel, Germany) based on established biomechanical stability waveforms and isokinetic torque effect sizes [27,28]. For primary paired stabilometric sensory comparisons (Eyes Open vs. Eyes Closed), detecting a moderate-to-large effect size (Cohen’s d = 0.80) with α = 0.05 (two-tailed) and a statistical power of (1 − β) = 0.95 required a minimum sample size of N = 23 participants. Our experimental cohort of N = 30 achieved statistical power exceeding 0.99 for the observed large paired sensory effects (Cohen’s d > 2.2). To evaluate the statistical adequacy for correlation and bivariate analyses, a sensitivity power analysis was conducted with N = 30 and α = 0.05 (two-tailed), demonstrating that the sample size achieves 80% power ((1 − β) = 0.80) to detect moderate-to-strong correlations of r ≥ 0.49; the observed primary correlation of r = 0.546 achieved an empirical statistical power of (1 − β) = 0.89. Furthermore, the repeated-measures linear mixed-effects model (LMM) incorporated 60 to 120 repeated observations across sensory conditions and limbs, providing enhanced parameter precision and robust statistical power to detect fixed-effect interaction slopes.
2.3. Standardized Warm-Up Protocol
The warm-up protocol was standardized and meticulously systematized to ensure a uniform level of physiological preparation and muscle temperature across all participants prior to high-intensity isokinetic and stabilometric assessments [29,30]. As detailed in Table 1, the routine consisted of 13 structured dynamic exercises combining progressive mobility, multi-planar neuromuscular activation, and dynamic potentiating drills (e.g., skips, lunges, leg swings, and explosive hops) with strictly controlled repetitions and rest intervals.
2.4. Smart Multi-Modal Sensing Protocols
2.4.1. Force Platform Stabilometry (Smart Sensor 1)
Postural stability was recorded using a calibrated AMTI BS 400600 high-frequency multi-axis force platform (Advanced Mechanical Technology Inc., Watertown, MA, USA) operating at a sampling rate of 1000 Hz. Participants maintained a single-leg stance with hands placed firmly on the iliac crests and the non-supporting contralateral leg flexed at approximately 45° at the knee joint for 30 s. The test involved 4 separate experimental trials per subject: one trial with Eyes Open (EO, visual target positioned at eye level at a 2-m distance) and one trial with Eyes Closed (EC, total visual deprivation) for each supporting limb (Left EO, Left EC, Right EO, Right EC) in a randomized block order, yielding 4 single-leg stance trials per participant in total. Each trial lasted 30 s, and a 60-s passive rest period was provided between consecutive trials to prevent neuromuscular fatigue. Raw continuous force signals (1000 Hz) were filtered using a fourth-order zero-lag Butterworth low-pass filter with a cutoff frequency of 10 Hz via Noraxon MR 3.18 software. From each 30-s filtered trial, total Center of Pressure (COP) Path Length (mm) and Average Sway Velocity (mm/s) were extracted, directly providing the final stabilometric dataset utilized for statistical analyses.
2.4.2. Isokinetic Dynamometry (Smart Sensor 2)
Concentric knee flexion and extension performance was quantified using a computerized Biodex System 4 Pro isokinetic dynamometer (Biodex Medical Systems, Shirley, NY, USA). Participants were secured in an adjustable chair with stabilizing straps placed across the chest, pelvis, and distal thigh to isolate knee joint motion. The dynamometer axis of rotation was precisely aligned with the lateral femoral condyle, and gravity compensation was performed at 30° of knee flexion. Testing was conducted across three angular velocities representing distinct neuromuscular qualities: 60°/s (maximal strength/torque capacity, 5 repetitions), 180°/s (intermediate velocity power, 5 repetitions), and 240°/s (high-velocity endurance and speed, 10 repetitions). Rest intervals were strictly timed to 120 s between angular velocities and 5 min between limbs, with precise rotational axis alignment maintained across all tests. Peak Torque (N·m) and Total Work (J) were extracted for both muscle groups across all velocities. The complete specifications for laboratory instrumentation, acquisition settings, mechanical calibrations, testing protocols, and repetition structures across both smart sensing modalities are summarized in Table 2.
Table 2.
Summary of experimental instrumentation, acquisition parameters, and testing protocols.
2.5. Feature Engineering and Asymmetry Quantification
To construct a physiologically comprehensive feature vector, domain-specific biomechanical metrics were calculated and standardized as follows:
1. Functional Agonist–Antagonist Ratios: The conventional concentric Hamstrings-to-Quadriceps (H/Q) torque ratio was computed across each angular velocity (60°/s, 180°/s, 240°/s) and limb according to Equation (1):
where PT_flex represents peak concentric knee flexor torque (N·m) and PT_ext represents peak concentric knee extensor torque (N·m).
H/Q Ratio = PT_flex/PT_ext
2. Romberg Sensory Quotient: To quantify individual visual dependency and the magnitude of somatosensory reweighting during unilateral stance, the Romberg Sway Ratio was calculated via Equation (2):
where COP_EC and COP_EO represent total Center of Pressure path length (mm) during Eyes Closed and Eyes Open single-leg stance, respectively. A ratio equal to 1.0 indicates identical postural sway across conditions, whereas higher values indicate pronounced visual dependency and elevated postural instability during visual deprivation.
Romberg Ratio = COP_EC/COP_EO
3. Inter-Limb Asymmetry Index (ASI): To assess bilateral muscular symmetry, the Inter-Limb Asymmetry Index was quantified across velocities and muscle groups according to Equation (3):
where PT_dominant and PT_non-dominant represent peak torque values for the dominant and non-dominant limbs, respectively. Under this definition, 0% represents complete bilateral symmetry, with values ≥ 10% indicating functional asymmetry [11,12]. This index is directly related to the traditional Limb Symmetry Index (LSI = 100% − ASI, where values > 90% indicate normal symmetry) [11,22].
ASI (%) = (|PT_dominant − PT_non-dominant|/max(PT_dominant, PT_non-dominant)) × 100%
Participants were categorized as exhibiting normal inter-limb balance (ASI < 10%) or functional asymmetry (ASI ≥ 10%), adhering to established sports clinical criteria [11,12,22]. To translate multi-modal sensor features into an exploratory athletic screening tool, a four-quadrant diagnostic matrix was constructed crossing maximal extensor torque (60°/s) and visual dependency (Romberg Sway Ratio). Cut-off thresholds were objectively anchored to the empirical sample distributions of the primary evaluated limb (unilateral left single-leg stance): extensor strength was partitioned at 270 N·m based on the rounded sample mean of the left knee extensor peak torque (270.1 ± 49.7 N·m; sample median: 269.2 N·m; bilateral pooled mean across all 60 limbs: 268.4 ± 48.3 N·m), and Romberg sway ratio was partitioned at 3.00, reflecting the approximate threefold escalation in COP path length during visual deprivation (left limb Romberg mean: 3.10 ± 1.42; right limb Romberg mean: 3.06 ± 1.46; pooled cohort mean: 3.08 ± 1.43). This partition yields four mutually exclusive quadrants: Quadrant I (High Strength/High Visual Dependency: PT ≥ 270 N·m, Romberg ≥ 3.00), Quadrant II (High Strength/Sensorimotor Competent: PT ≥ 270 N·m, Romberg < 3.00), Quadrant III (Low Strength/High Visual Dependency: PT < 270 N·m, Romberg ≥ 3.00), and Quadrant IV (Low Strength/Sensorimotor Competent: PT < 270 N·m, Romberg < 3.00). This matrix is presented as an exploratory, hypothesis-generating screening framework requiring prospective validation.
2.6. Statistical Analysis and Linear Mixed-Effects Modeling
Statistical analysis was performed in Python 3.11 (using SciPy, statsmodels, and pandas). The normality of all continuous variable distributions was formally verified using the Shapiro–Wilk test, complemented by visual inspection of Q-Q plots. For paired sensory comparisons (Eyes Open vs. Eyes Closed) and bilateral limb comparisons, both parametric paired Student’s t-tests and non-parametric Wilcoxon signed-rank tests were computed to ensure robustness against distributional deviations. Standardized effect sizes were quantified using Cohen’s d (interpreted as: small d = 0.20, medium d = 0.50, large d ≥ 0.80) and 95% confidence intervals (95% CI) were calculated for all mean differences. Bivariate relationships between isokinetic torque and stabilometric sway were evaluated using Pearson product-moment correlation coefficients with 95% confidence intervals calculated via Fisher’s z-transformation. To control the family-wise error rate and false discovery rate across multiple correlation tests, p-values were adjusted using both the Benjamini–Hochberg False Discovery Rate (FDR) procedure and Holm’s step-down method.
To formally evaluate whether the relationship between muscular strength and postural control differed between sensory conditions, repeated-measures Linear Mixed-Effects Models (LMM) were fitted using Restricted Maximum Likelihood (REML) estimation. The primary model evaluated unilateral left single-leg stance across both sensory conditions (N = 30 participants, 2 repeated condition levels = 60 total observations) to examine within-limb torque–sway interactions without bilateral dependency confounding. The model was formulated as Equation (4):
where Condition was dummy-coded (0 = Eyes Open, 1 = Eyes Closed), Torque represented maximal knee extensor peak torque at 60°/s, β_cond was the main condition effect, β_torque was the torque slope under Eyes Open, β_int represented the critical Torque × Condition interaction slope increment under Eyes Closed, u0i ~ N(0, σ_u2) was the athlete-specific random intercept, and ε_ij ~ N(0, σ_e2) was the residual error. Sensitivity analysis confirmed identical interaction patterns for the right limb. Statistical significance was set at α = 0.05 (two-tailed) for all inferential tests.
COP Path Length_ij = (β0 + u0i) + β_cond · Condition_ij + β_torque · Torque_i + β_int · (Condition_ij × Torque_i) + ε_ij
3. Results
3.1. Stabilometric Posturography Profile and Sensory Reweighting Effect
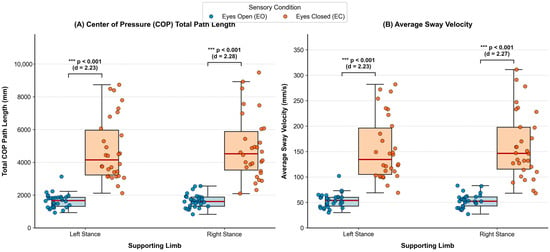
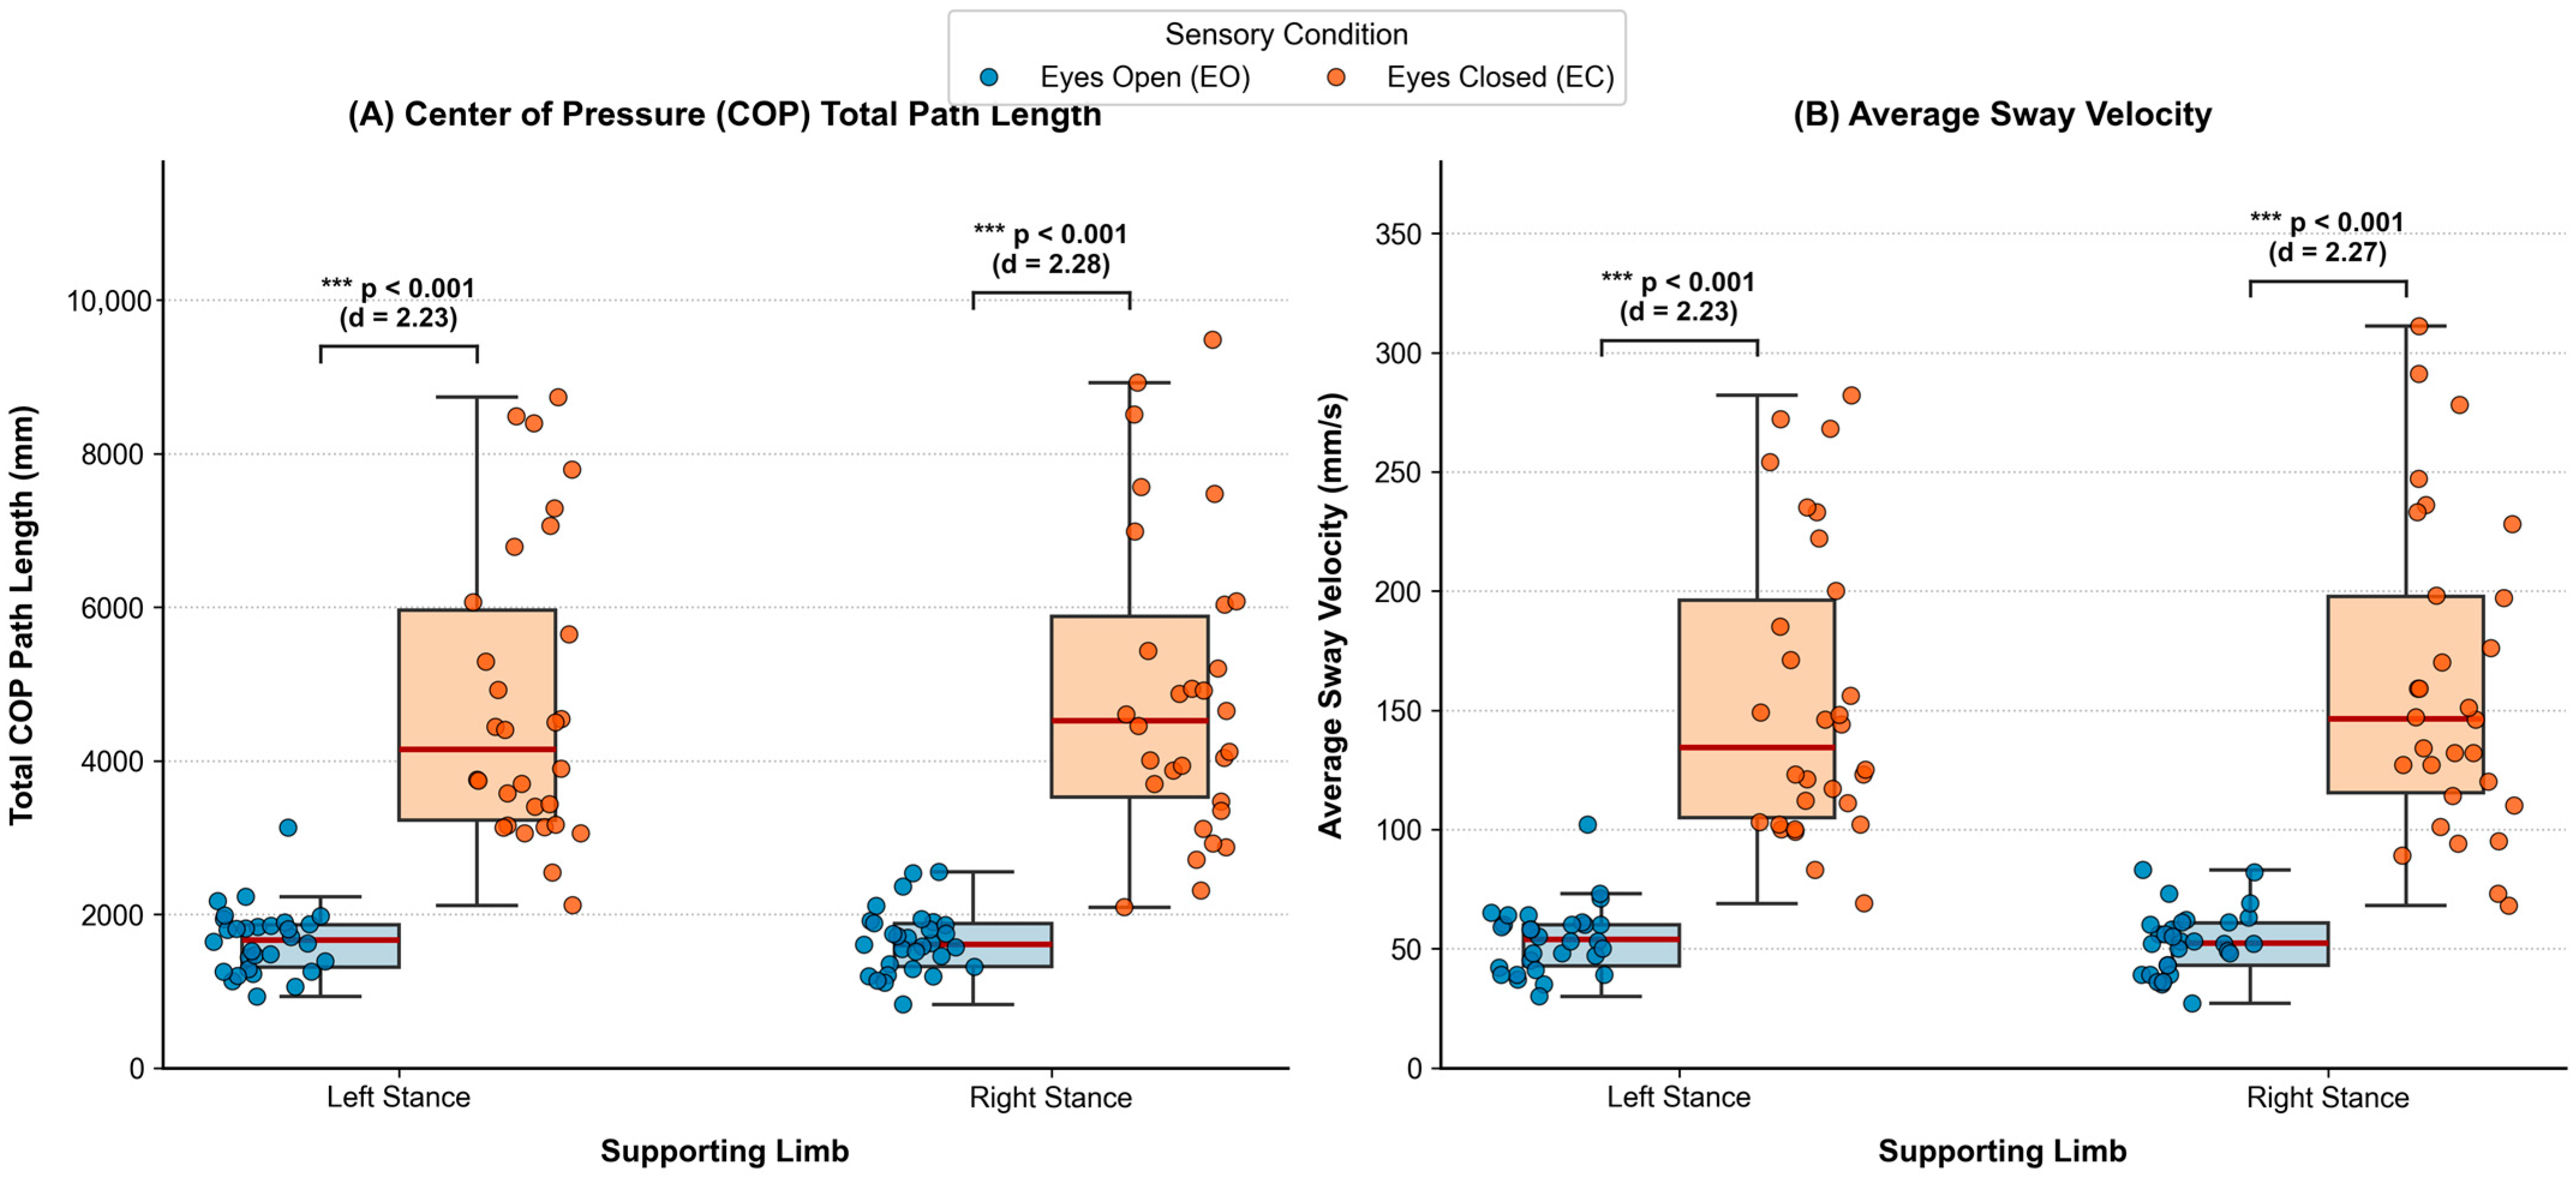
Descriptive stabilometric parameters for unilateral stance under Eyes Open (EO) and Eyes Closed (EC) conditions are summarized in Table 3 and visualized in Figure 1. In full confirmation of Hypothesis 1, visual deprivation provoked an extreme, highly significant increase in COP total path length and sway velocity across both lower limbs. For the left stance limb, COP path length increased nearly threefold from 1655.4 ± 437.6 mm (EO) to 4772.3 ± 1929.9 mm (EC) (paired mean difference: +3116.9 mm, 95% CI: [2369.3, 3864.6] mm, t = 8.53, p < 0.001; Wilcoxon W = 0.0, p < 0.001; Cohen’s d = 2.23). Similarly, for the right stance limb, path length surged from 1641.4 ± 412.6 mm (EO) to 4885.9 ± 1968.0 mm (EC) (paired mean difference: +3244.5 mm, 95% CI: [2520.1, 3968.8] mm, t = 9.16, p < 0.001; Wilcoxon W = 0.0, p < 0.001; Cohen’s d = 2.28). Average sway velocity mirrored this pattern, increasing from ~53 mm/s (EO) to over 155 mm/s (EC). No significant bilateral asymmetry was observed between left and right limbs under either EO (p = 0.781) or EC (p = 0.694) conditions.
Table 3.
Descriptive stabilometric parameters (Center of Pressure total path length, average sway velocity, paired mean differences with 95% confidence intervals, and standardized effect sizes) during single-leg stance under Eyes Open (EO) and Eyes Closed (EC) conditions (N = 30).
Figure 1.
Publication-grade boxplots with overlaid individual athlete data points (N = 30), median, and interquartile ranges for Center of Pressure (COP) Total Path Length (A) and Average Sway Velocity (B) under Eyes Open vs. Eyes Closed sensory conditions (*** p < 0.001).
3.2. Isokinetic Torque–Velocity Profiles and Agonist–Antagonist Balance
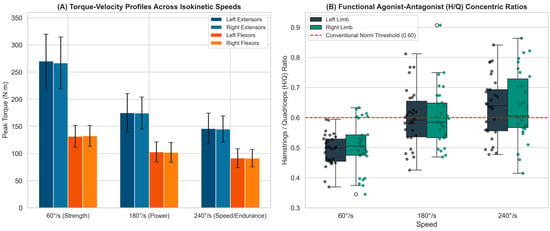
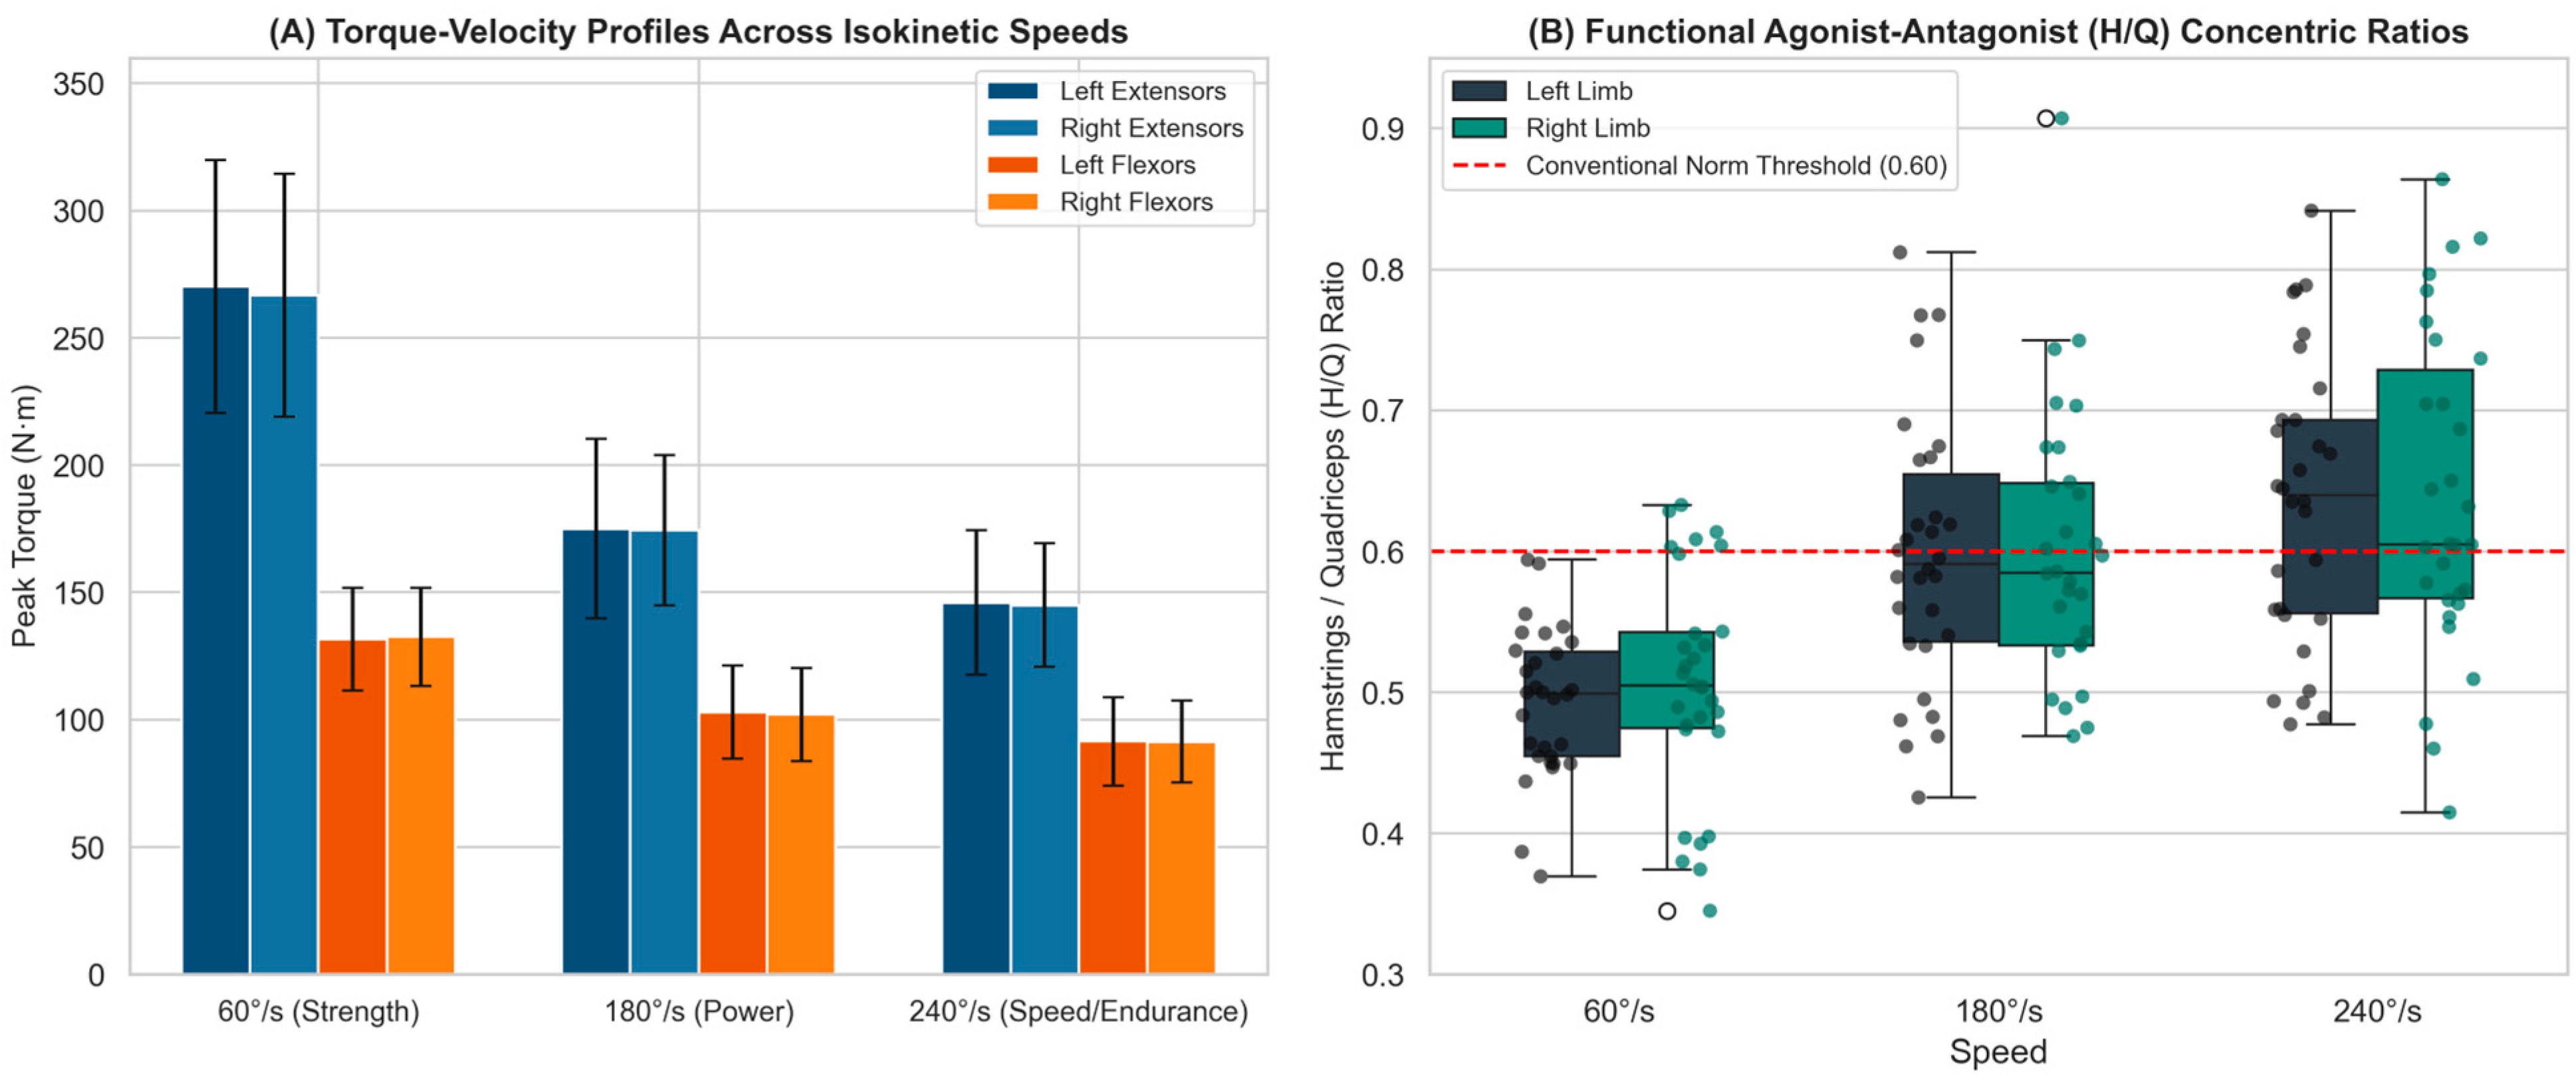
The velocity-dependent isokinetic torque and work capacities are presented in Table 4 and Figure 2. Both extensor and flexor peak torques exhibited classic force–velocity degradation across increasing angular speeds (60°/s > 180°/s > 240°/s). At 60°/s, extensor peak torque averaged 270.1 ± 49.7 N·m (left) and 266.7 ± 47.6 N·m (right) (p = 0.520; bilateral pooled mean across all 60 limbs: 268.4 ± 48.3 N·m [95% CI: 255.9, 280.9], median: 265.0 N·m), while flexor torque was 131.6 ± 20.2 N·m (left) and 132.6 ± 19.3 N·m (right) (p = 0.748; bilateral pooled mean: 132.1 ± 19.6 N·m). Total work for the 5-repetition set at 60°/s reached 1401.2 ± 277.3 J (extensor left) and 1360.4 ± 228.8 J (extensor right), alongside 747.7 ± 141.9 J (flexor left) and 736.6 ± 140.2 J (flexor right). At 180°/s (5 repetitions), extensor total work was 1001.0 ± 203.5 J (left) and 997.2 ± 189.7 J (right), whereas at 240°/s, where a 10-repetition protocol was employed, total cumulative work reached 2088.7 ± 438.0 J (left) and 2064.3 ± 366.2 J (right), reflecting sustained high-velocity mechanical output. The conventional concentric H/Q ratio increased progressively with angular velocity, rising for the left limb from 0.49 ± 0.05 at 60°/s to 0.60 ± 0.10 at 180°/s and 0.64 ± 0.10 at 240°/s, and for the right limb from 0.51 ± 0.08 at 60°/s to 0.59 ± 0.11 at 180°/s and 0.64 ± 0.11 at 240°/s (Table 4), reflecting the relatively greater preservation of hamstring torque at high speeds.
Table 4.
Velocity-dependent isokinetic knee concentric peak torques, total work capacities, functional hamstrings-to-quadriceps (H/Q) ratios, and limb asymmetry indices across angular velocities (60°/s, 180°/s, and 240°/s) with 95% confidence intervals.
Figure 2.
Isokinetic knee performance characteristics: (A) Torque–velocity bar curves across angular velocities (60°, 180°, 240°/s) for extensors and flexors; (B) Boxplots with overlaid individual data points illustrating functional concentric H/Q ratios relative to the 0.60 normative threshold.
3.3. Prevalence of Bilateral Strength Asymmetries
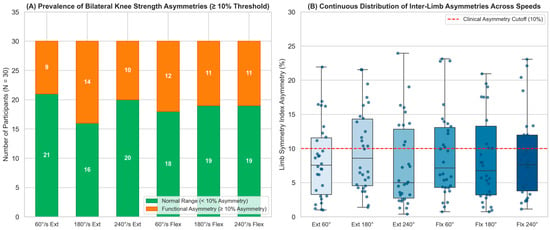
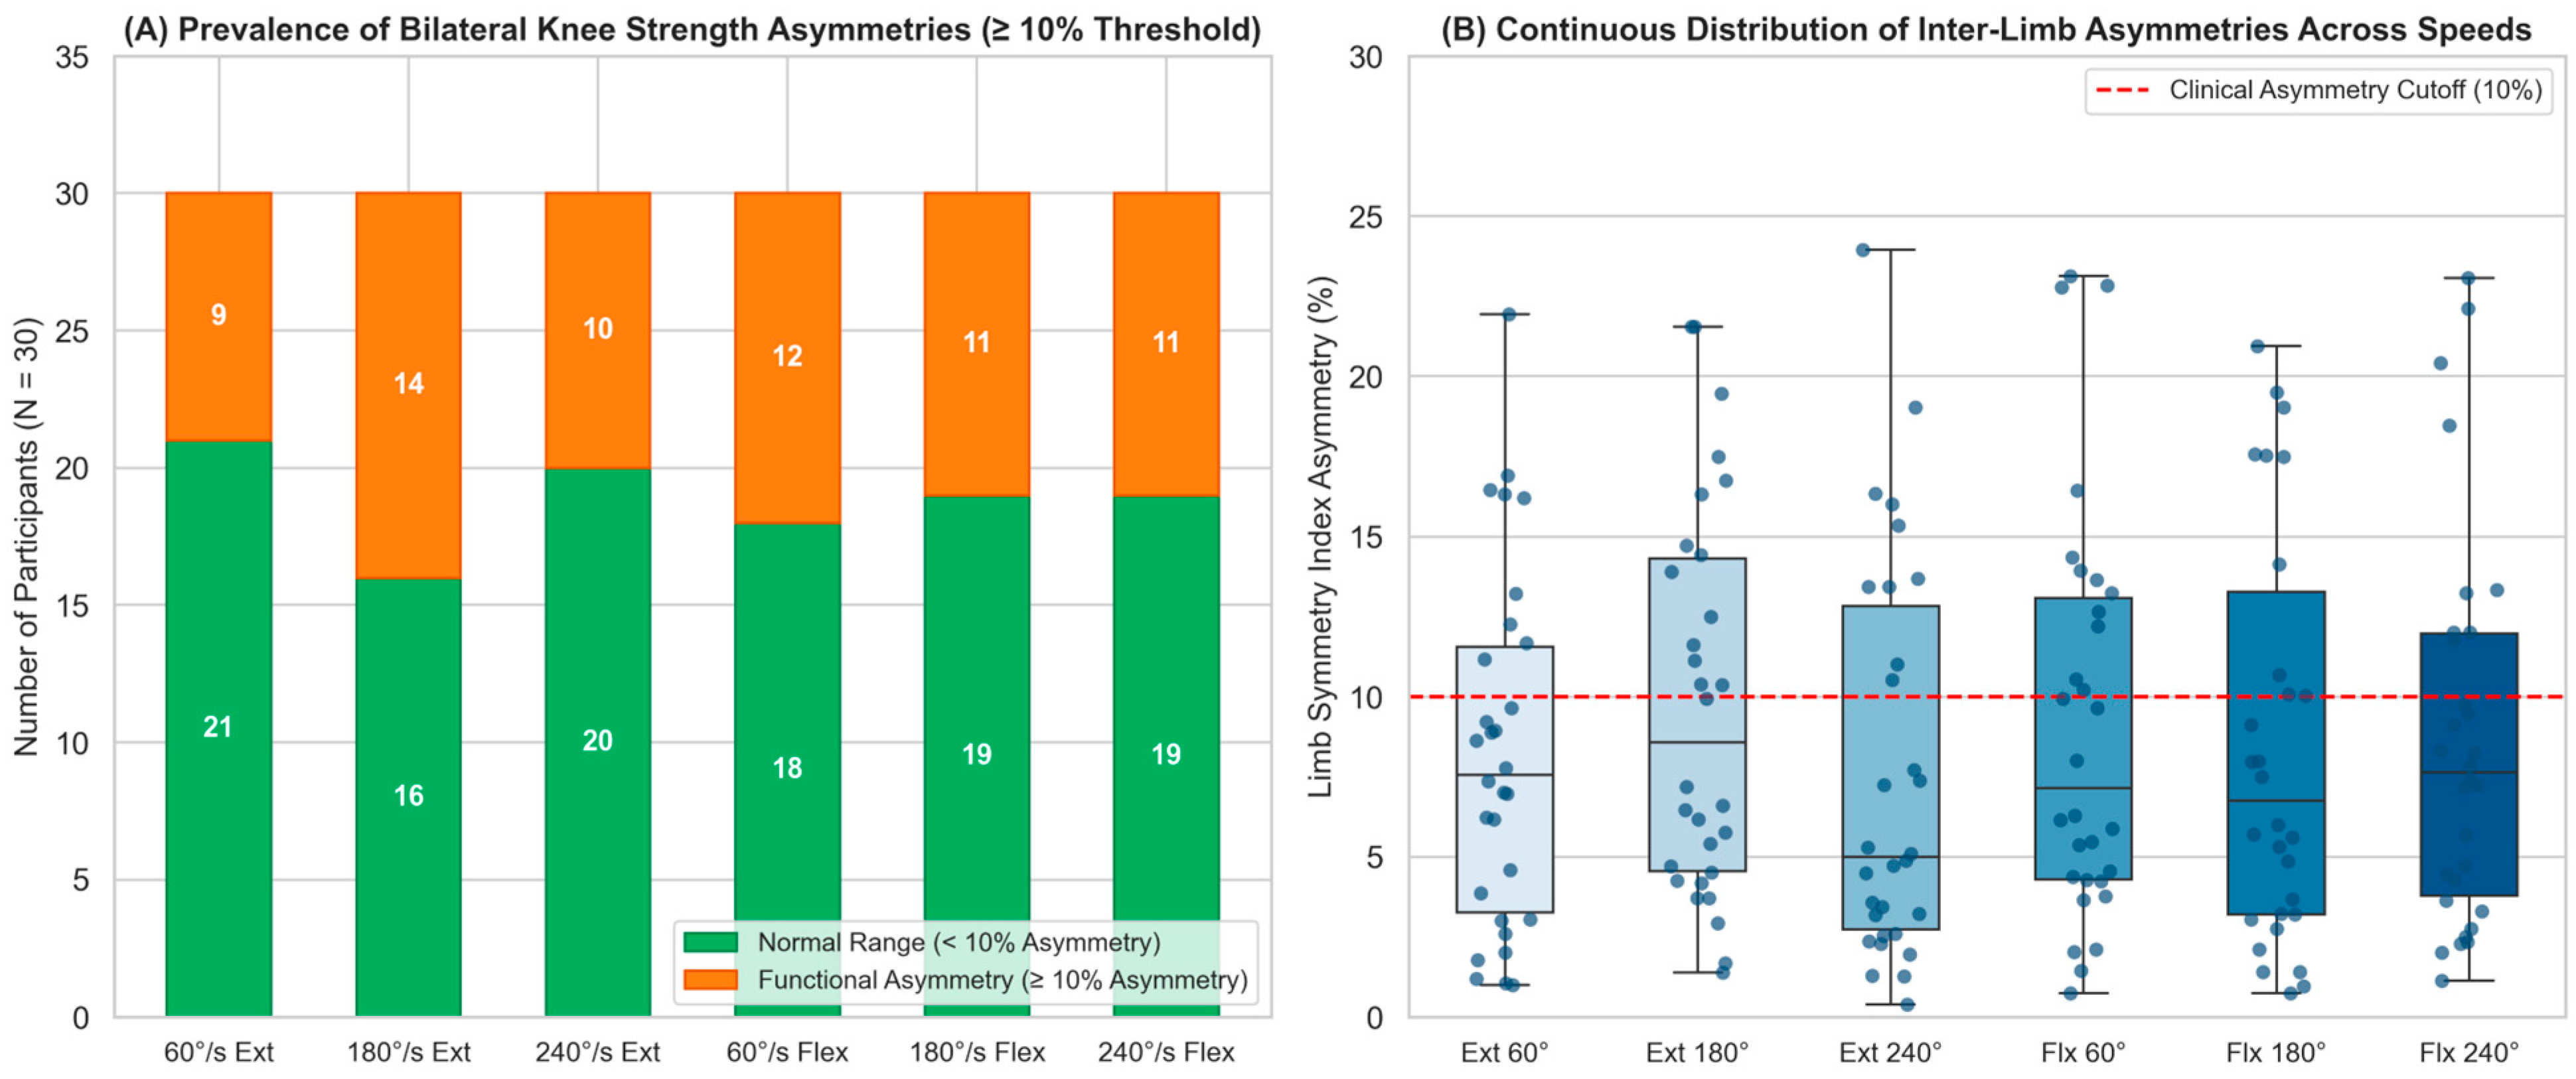
Bilateral asymmetry stratification across angular velocities is detailed in Table 5 and visualized in Figure 3. Although mean inter-limb values did not differ significantly at the group level (p > 0.05), individual-level analysis revealed that approximately one-third of participants displayed inter-limb asymmetries exceeding the 10% clinical threshold. For knee extension, 9 participants (30.0%) at 60°/s, 14 participants (46.7%) at 180°/s, and 10 participants (33.3%) at 240°/s showed asymmetries ≥ 10%. For knee flexion, asymmetries ≥ 10% were present in 12 participants (40.0%) at 60°/s, 11 participants (36.7%) at 180°/s, and 11 participants (36.7%) at 240°/s. This highlights the importance of multi-speed testing, as athletes symmetric at low velocity frequently manifest functional deficits at higher contraction velocities.
Table 5.
Prevalence and stratification of bilateral knee strength asymmetries (<10% normal symmetry vs. ≥10% functional deficit) across movement velocities with 95% confidence intervals.
Figure 3.
Bilateral knee strength asymmetry analysis: (A) Proportion of participants exhibiting normal symmetry (<10%) vs. functional asymmetry (≥10%) across velocities; (B) Boxplots illustrating continuous inter-limb asymmetry distributions with individual athlete points.
3.4. Sensory Decoupling and the Neuromuscular Paradox of Bulk Strength
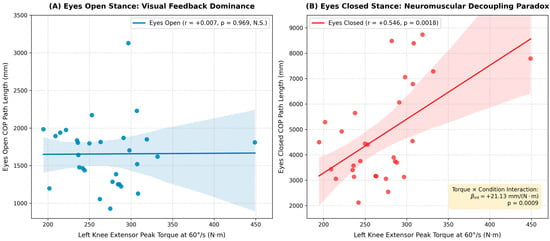
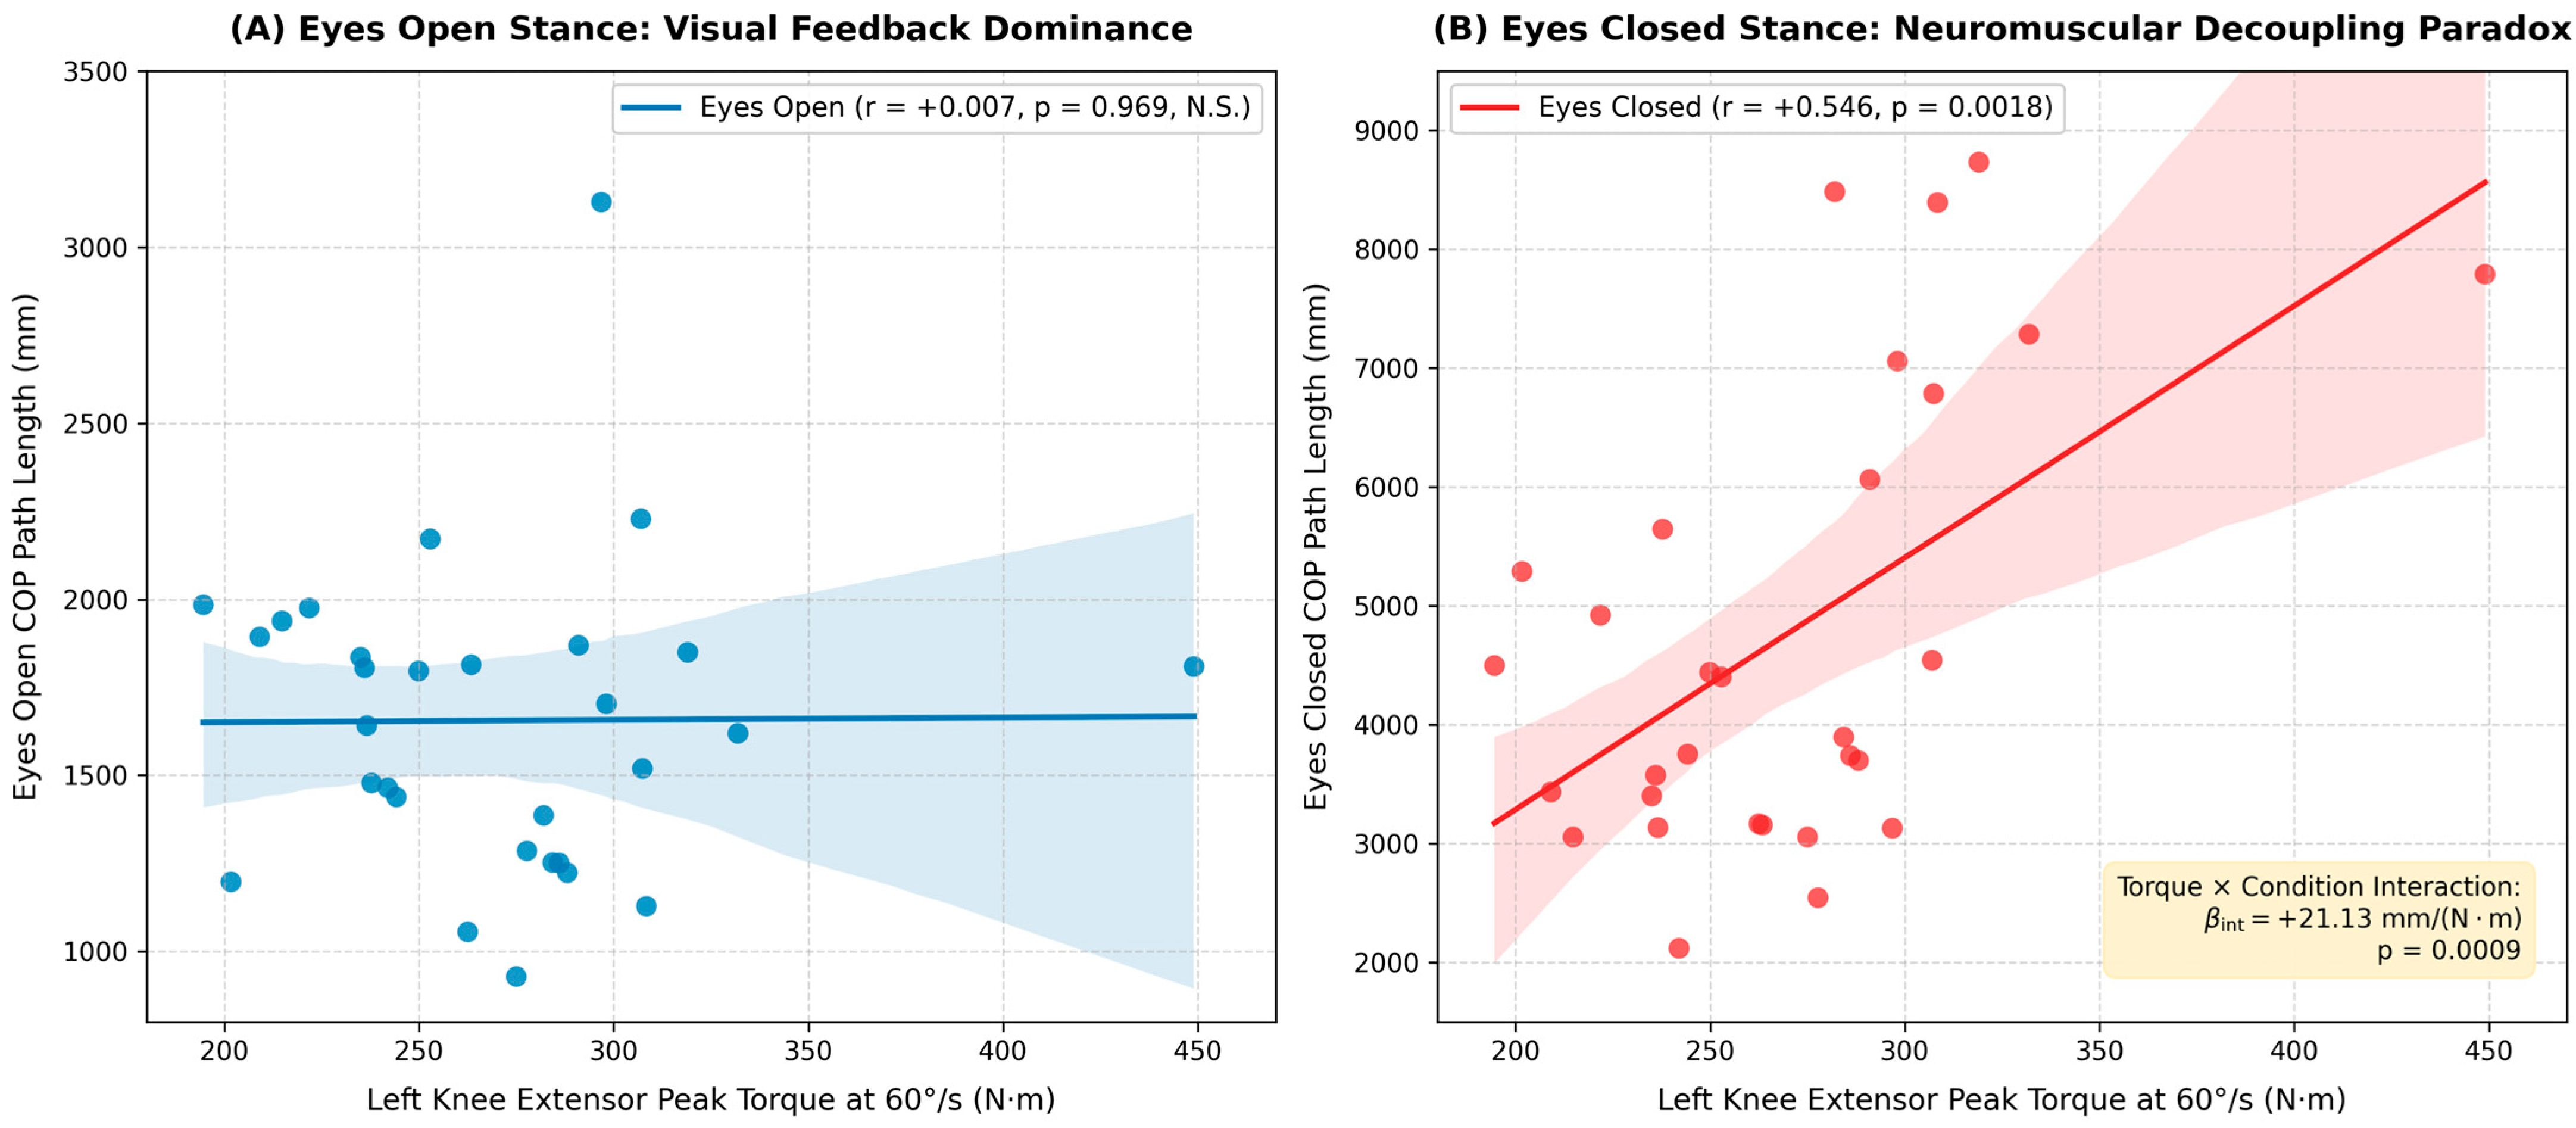
The correlation analysis between isokinetic knee torques and stabilometric sway parameters under both sensory conditions is presented in Table 6 and illustrated in Figure 4. Under baseline visual control (Eyes Open), isokinetic torque across all velocities and muscle groups showed no meaningful association with COP path length (all r between −0.100 and +0.081, all p > 0.60, 95% CIs crossing zero). In sharp contrast, under visual deprivation (Eyes Closed), marked positive associations emerged between knee torque and postural sway. Specifically, left extensor peak torque at 60°/s correlated significantly with EC path length (r = +0.546, 95% CI: [0.231, 0.757], p_raw = 0.0018, p_FDR = 0.0108, p_Holm = 0.0108), as did flexor peak torque at 60°/s (r = +0.480, 95% CI: [0.144, 0.716], p_raw = 0.0073, p_FDR = 0.0220, p_Holm = 0.0366) and extensor torque at 180°/s (r = +0.453, 95% CI: [0.111, 0.699], p_raw = 0.0119, p_FDR = 0.0238, p_Holm = 0.0477). Even after controlling for false discovery rate across multiple tests, these associations remained statistically robust.
Table 6.
Bivariate Pearson correlation coefficients (r [95% CI]), raw p-values, and False Discovery Rate (FDR)/Holm-adjusted p-values between isokinetic knee torques and COP path length under Eyes Open (EO) vs. Eyes Closed (EC) conditions.
Figure 4.
Sensory decoupling scatter plots demonstrating: (A) Lack of correlation between maximal extensor peak torque (60°/s) and Center of Pressure path length under baseline Eyes Open conditions (r = +0.007, p = 0.969); and (B) Significant positive correlation under Eyes Closed conditions (r = +0.546, 95% CI: [0.231, 0.757], p = 0.0018, p_FDR = 0.0108), illustrating the sensory-dependent neuromuscular decoupling phenomenon during visual deprivation.
3.5. Linear Mixed-Effects Modeling and Functional Screening Framework
To formally test whether the relationship between muscular torque and postural sway differed statistically between sensory conditions, repeated-measures Linear Mixed-Effects Models were fitted on unilateral left stance data (Table 7). In the primary model for knee extensor torque at 60°/s (N = 30 participants, 60 repeated observations), the baseline intercept (β0 = 1655.37 mm, SE = 220.06, z = 7.52, p < 0.001, 95% CI: [1224.05, 2086.68]) matched the left EO mean sway, while the fixed effect for baseline Eyes Open torque was negligible (β_torque = +0.066 mm/(N·m), SE = 4.502, z = 0.015, p = 0.988, 95% CI: [−8.757, 8.889]). The main condition effect of visual deprivation was highly significant (β_cond = +3116.93 mm, SE = 311.22, z = 10.02, p < 0.001, 95% CI: [2506.96, 3726.91]), reflecting the mean increase from EO to EC. Crucially, the Torque × Sensory Condition interaction was highly significant (β_int = +21.131 mm/(N·m), SE = 6.366, z = 3.319, p = 0.0009, 95% CI: [8.653, 33.609]). This confirms that the slope between muscular torque and sway path length increased significantly by +21.13 mm per N·m of torque during visual deprivation, resulting in a total EC slope of β_EC = +21.197 mm/(N·m) (p < 0.001).
Table 7.
Repeated-measures Linear Mixed-Effects Model (LMM) parameter estimates for Center of Pressure path length as a function of sensory condition (Eyes Open vs. Eyes Closed) and peak extensor torque (60°/s) during unilateral left stance (N = 30, n = 60 observations).
To evaluate whether this relationship was driven by anthropometric variation (body mass range: 67–109 kg), a sensitivity analysis was performed examining the Romberg sensory quotient (EC/EO path length ratio, which intrinsically normalizes each participant to their own baseline body mass and stabilometric mechanics). Extensor peak torque (60°/s) remained significantly correlated with the Romberg ratio (r = +0.440, 95% CI: [0.094, 0.691], p = 0.0150), as did flexor peak torque (r = +0.405, 95% CI: [0.052, 0.668], p = 0.0264), confirming that the observed neuromuscular decoupling is not an artifact of body size.
To synthesize these multi-modal sensing metrics into an objective, exploratory screening tool, athletes were cross-classified across extensor torque capacity and Romberg sway ratio. The extensor torque division threshold of 270 N·m was established based on the empirical sample mean of the evaluated limb (unilateral left knee extensor peak torque at 60°/s: 270.1 ± 49.7 N·m; median: 269.2 N·m; bilateral pooled mean: 268.4 ± 48.3 N·m; Table 4), rounded to 270 N·m, which separates high from moderate/low bulk torque generation and aligns with established literature normative ranges for concentric quadriceps peak torque in physically active young adult males (~250–280 N·m) [12]. The Romberg sway ratio threshold of 3.00 was established based on the observed threefold escalation in COP path length during visual occlusion (left limb mean Romberg ratio: 3.10 ± 1.42; right limb: 3.06 ± 1.46; pooled cohort mean: 3.08 ± 1.43), differentiating athletes who maintain stable somatosensory balance from those exhibiting excessive visual dependency. This cross-classification resulted in four mutually exclusive functional quadrants summarized in Table 8:
Table 8.
Exploratory four-quadrant functional neuromuscular screening matrix based on knee extensor torque capacity and Romberg sensory stability ratio.
- Quadrant I (‘High Strength/High Visual Dependency’, n = 11, 36.7%): High extensor torque (≥270 N·m) coupled with elevated Romberg sway ratio (≥3.00). These athletes possess strong bulk torque production but display pronounced visual dependency and elevated postural instability when vision is occluded, indicating a need for dedicated closed-loop proprioceptive and somatosensory training.
- Quadrant II (‘High Strength/Sensorimotor Competent’, n = 4, 13.3%): High extensor torque (≥270 N·m) coupled with low Romberg sway ratio (<3.00), representing superior strength combined with fine-tuned somatosensory stability.
- Quadrant III (‘Low Strength/High Visual Dependency’, n = 3, 10.0%): Lower torque capacity (<270 N·m) and elevated Romberg sway ratio (≥3.00), indicating concurrent strength deficits and sensorimotor vulnerability.
- Quadrant IV (‘Low Strength/Sensorimotor Competent’, n = 12, 40.0%): Lower-to-moderate torque capacity (<270 N·m) with preserved somatosensory postural stability (Romberg <3.00), representing athletes well-adapted for progressive resistance overload without prior sensory deficits.
4. Discussion
This study successfully establishes an integrated multi-modal smart sensing and analytical framework that decouples velocity-specific knee torque capacity from unilateral postural control under sensory manipulation. By combining force platform stabilometry (AMTI) and computerized isokinetic dynamometry (Biodex 4) through factorial statistical modeling and asymmetry profiling, our findings provide critical insights into applied sports biomechanics and diagnostic data analysis.
4.1. Sensory Reweighting and the Neuromuscular Paradox of Bulk Strength
In full agreement with Hypotheses 1 and 2, our findings demonstrate a pronounced sensory reweighting effect during unilateral stance and establish a sensory-dependent neuromuscular decoupling between muscular strength and postural control. Under visual control (Eyes Open), single-leg stance is primarily governed by visual and vestibular feedback loops operating at low corrective force thresholds, rendering knee torque capacity largely unrelated to sway (r = +0.007, p = 0.969; LMM slope β = +0.066 mm/(N·m), p = 0.988). Recent meta-analyses across athletic and healthy populations have similarly observed that resting static balance and maximal strength measures frequently decouple when visual feedback is unobstructed [22,23].
However, removing visual input (Eyes Closed) prompted immediate somatosensory reweighting, magnifying COP path length by over 280% (Cohen’s d > 2.2). Crucially, under visual deprivation, extensor peak torque (60°/s) showed a strong positive association with postural sway (r = +0.546, 95% CI: [0.231, 0.757], p_FDR = 0.0108), supported by a statistically significant torque × condition interaction (β_int = +21.13 mm/(N·m), p = 0.0009). This reveals what may be characterized as a sensory-dependent ‘neuromuscular decoupling’: physically active individuals with higher maximal quadriceps strength exhibited significantly greater postural sway when forced to rely solely on proprioceptive and vestibular feedback. Biomechanically, this association is plausible: individuals with high bulk muscular strength who lack proportional sensorimotor fine-tuning often exhibit elevated joint stiffness and coarser motor unit recruitment, generating larger corrective force impulses that can lead to greater total center of pressure excursions during unconstrained single-leg stance [13,15,31,32].
4.2. Multi-Modal Smart Device Diagnostics and Velocity-Specific Asymmetries
A primary strength of this investigation is demonstrating the diagnostic value of multi-modal smart device integration in sports science. While single-sensor diagnostics provide isolated parameters (e.g., peak torque alone or sway area alone), combining computerized dynamometry with stabilometry enables sports practitioners to evaluate the athlete holistically. Furthermore, our asymmetry stratification (Table 5) demonstrated distinct velocity-dependent patterns: for knee extension, inter-limb asymmetries exceeding 10% were present in 30.0% of participants at 60°/s, rising to 46.7% at 180°/s and 33.3% at 240°/s; for knee flexion, asymmetry rates were 40.0% at 60°/s, 36.7% at 180°/s, and 36.7% at 240°/s. Rather than an omnibus increase across all high velocities, high asymmetry was particularly pronounced during intermediate-velocity extension (180°/s, 46.7%) and low-velocity flexion (60°/s, 40.0%). This highlights the necessity of multi-velocity testing, as athletes symmetric at low velocity can exhibit functional deficits during dynamic velocities [22,28].
4.3. Practical Sports Coaching and Functional Screening Applications
The exploratory diagnostic quadrant matrix developed in this study (Table 8) offers conceptual utility for athletic trainers, strength and conditioning coaches, and sports physiotherapists as a hypothesis-generating framework:
1. Exploratory Screening for Strength–Stability Mismatches: In sports involving dynamic, visually demanding environments (such as soccer, basketball, or handball), athletes frequently focus their visual attention on external stimuli (ball, opponents, tactical positioning) rather than limb landing mechanics. Athletes categorized in Quadrant I (high quadriceps torque but high Romberg sway and low H/Q ratios) may present functional vulnerabilities during unexpected perturbations or single-leg landings, warranting targeted assessment.
2. Tailored Conditioning Interventions: For athletes displaying Quadrant I characteristics, conditioning staff can implement targeted multi-sensory perturbation training (unstable surface balance, stroboscopic eyewear, visual restriction drills) alongside velocity-specific eccentric hamstring strengthening (Nordic hamstring curls, flywheel eccentric overloading) to enhance functional H/Q balance and refine somatosensory closed-loop feedback [6,30,32].
3. Return-to-Sport Assessment Considerations: Following lower extremity rehabilitation, clearing an athlete based solely on isokinetic peak torque symmetry (ASI < 10%, or corresponding traditional LSI > 90%) may be insufficient [33,34]; multi-modal assessments should verify that somatosensory postural control under visual deprivation has also been restored, ensuring holistic neuromuscular readiness [11,19,35].
4.4. Study Limitations
Several methodological limitations should be explicitly acknowledged. First, the study cohort was restricted to thirty physically active young adult males (aged 24.9 ± 3.97 years). Consequently, the observed findings cannot be directly generalized to female athletes, adolescent populations, older adults, or elite professional competitors without independent validation across diverse demographic groups [22]. Second, the investigation utilized a cross-sectional observational design without longitudinal injury follow-up. While the identified functional quadrants represent distinct biomechanical profiles, prospective epidemiological studies are necessary to establish whether these profiles correlate with actual prospective injury incidence [33,34]. Third, isokinetic testing was performed in concentric–concentric mode across 60°, 180°, and 240°/s; future research should incorporate eccentric hamstring evaluations to examine functional dynamic ratios (Hecc/Qcon) under varied contraction velocities [6,36]. Fourth, the four-quadrant screening thresholds were derived from sample distributions (mean values); prospective multi-center studies with receiver operating characteristic (ROC) analyses and external cohorts are required to validate the clinical reliability and predictive utility of this exploratory framework. Fifth, isokinetic knee strength was quantified as absolute peak torque (N·m) and total work (J) rather than normalized to body mass (N·m/kg) or fat-free mass. Although our sensitivity analysis utilizing the within-subject Romberg sensory quotient (EC/EO ratio)—which intrinsically normalizes each participant to their own baseline body mass and stabilometric scaling—confirmed that the positive torque–sway correlation under visual occlusion was not driven by individual body mass differences, absolute torque output is inherently influenced by body size and overall muscle mass. The rationale for utilizing absolute torque in the primary screening framework stems from its direct reflection of maximal joint mechanical capacity and load demands in sports performance. Nonetheless, the absence of body weight normalization or body mass covariates in the primary regression models represents a methodological limitation. Future multi-sensor biomechanical investigations should systematically record body composition (e.g., dual-energy X-ray absorptiometry or bioelectrical impedance) and evaluate allometric scaling and body-mass-normalized torque metrics to further elucidate the complex interactions between body dimensions, muscular force output, and somatosensory balance dynamics.
5. Conclusions
This study demonstrates that multi-modal smart sensing combining AMTI force plate stabilometry and Biodex System 4 isokinetic dynamometry provides a comprehensive and objective framework for athletic performance diagnostics and neuromuscular screening. Visual deprivation provoked a massive sensory reweighting effect (increasing COP sway by ~300%, p < 0.001, Cohen’s d > 2.2), while concentric H/Q ratios increased systematically with angular velocity (from 0.49 ± 0.05 at 60°/s to 0.64 ± 0.10 at 240°/s for the left limb, and from 0.51 ± 0.08 to 0.64 ± 0.11 for the right limb). Over 30% of participants exhibited velocity-specific bilateral strength asymmetries exceeding 10%. Factorial repeated-measures linear mixed-effects modeling confirmed a significant sensory-dependent neuromuscular decoupling interaction (β_int = +21.13 mm/(N·m), p = 0.0009): maximal quadriceps strength showed no association with balance under visual control but correlated significantly with increased sway during visual deprivation (r = +0.55, 95% CI: [0.23, 0.76], p_FDR = 0.0108). These findings provide coaches, sports scientists, and physiotherapists with an objective, exploratory screening matrix (Table 8) to identify strength–sway mismatches and guide personalized proprioceptive and resistance training strategies.
Author Contributions
Conceptualization, D.M. and E.F.; methodology, D.M. and E.F.; software, D.M. and E.F.; validation, D.M.; formal analysis, D.M.; investigation, E.F. and D.M.; resources, D.M.; data curation, E.F.; writing—original draft preparation, D.M. and E.F.; writing—review and editing, D.M.; visualization, D.M.; supervision, D.M.; project administration, D.M. All authors have read and agreed to the published version of the manuscript.
Funding
This research received no external funding. The study was supported by internal statutory research funds of the Jan Dlugosz University in Częstochowa.
Institutional Review Board Statement
The study was conducted in accordance with the Declaration of Helsinki and approved by the Institutional Ethics Committee of Jan Dlugosz University in Częstochowa (protocol code KE-02/2024).
Informed Consent Statement
Informed consent was obtained from all subjects involved in the study.
Data Availability Statement
The raw and processed biomechanical datasets, as well as the analytical scripts, are openly available in the Zenodo repository at: 10.5281/zenodo.21939171.
Conflicts of Interest
The authors declare no conflicts of interest.
References
- Bahr, R.; Clarsen, B.; Derman, W.; Dvorak, J.; Emery, C.A.; Finch, C.F.; Hägglund, M.; Junge, A.; Kemp, S.; Khan, K.M.; et al. International Olympic Committee Consensus Statement: Methods for Recording and Reporting of Epidemiological Data on Injury and Illness in Sport 2020 (Including STROBE Extension for Sport Injury and Illness Surveillance (STROBE-SIIS)). Br. J. Sports Med. 2020, 54, 372–389. [Google Scholar] [CrossRef] [Scilit] [PubMed]
- Bittencourt, N.F.N.; Meeuwisse, W.H.; Mendonça, L.D.; Nettel-Aguirre, A.; Ocarino, J.M.; Fonseca, S.T. Complex Systems Approach for Sports Injuries: Moving from Risk Factor Identification to Pattern Recognition—Narrative Review and New Concept. Br. J. Sports Med. 2016, 50, 1309–1314. [Google Scholar] [CrossRef] [Scilit] [PubMed]
- Munro, A.; Herrington, L.; Carolan, M. Reliability of 2-Dimensional Video Assessment of Frontal-Plane Dynamic Knee Valgus During Common Athletic Screening Tasks. J. Sport Rehabil. 2012, 21, 7–11. [Google Scholar] [CrossRef] [Scilit] [PubMed]
- Zhao, Y.; Chen, Z.; Li, L.; Wu, X.; Li, W. Changes in Proprioception at Different Time Points Following Anterior Cruciate Ligament Injury and Reconstruction: A Systematic Review and Meta-Analysis. J. Orthop. Surg. Res. 2023, 18, 547. [Google Scholar] [CrossRef] [Scilit] [PubMed]
- Hewett, T.E.; Myer, G.D.; Ford, K.R.; Heidt, R.S.; Colosimo, A.J.; McLean, S.G.; van den Bogert, A.J.; Paterno, M.V.; Succop, P. Biomechanical Measures of Neuromuscular Control and Valgus Loading of the Knee Predict Anterior Cruciate Ligament Injury Risk in Female Athletes: A Prospective Study. Am. J. Sports Med. 2005, 33, 492–501. [Google Scholar] [CrossRef] [Scilit] [PubMed]
- Croisier, J.-L.; Ganteaume, S.; Binet, J.; Genty, M.; Ferret, J.-M. Strength Imbalances and Prevention of Hamstring Injury in Professional Soccer Players: A Prospective Study. Am. J. Sports Med. 2008, 36, 1469–1475. [Google Scholar] [CrossRef] [Scilit] [PubMed]
- Drouin, J.M.; Valovich-mcLeod, T.C.; Shultz, S.J.; Gansneder, B.M.; Perrin, D.H. Reliability and Validity of the Biodex System 3 Pro Isokinetic Dynamometer Velocity, Torque and Position Measurements. Eur. J. Appl. Physiol. 2004, 91, 22–29. [Google Scholar] [CrossRef] [Scilit] [PubMed]
- Undheim, M.B.; Cosgrave, C.; King, E.; Strike, S.; Marshall, B.; Falvey, É.; Franklyn-Miller, A. Isokinetic Muscle Strength and Readiness to Return to Sport Following Anterior Cruciate Ligament Reconstruction: Is There an Association? A Systematic Review and a Protocol Recommendation. Br. J. Sports Med. 2015, 49, 1305–1310. [Google Scholar] [CrossRef] [Scilit] [PubMed]
- Limpach, S.; Leinen, P.; Muehlbauer, T.; Borgmann, K.; Panzer, S. Pendulum Model to Compare Center of Pressure Data Between Different Force Plates. Gait Posture 2025, 118, 109280. [Google Scholar] [CrossRef] [Scilit] [PubMed]
- Zaghlul, N.; Goh, S.L.; Razman, R.; Danaee, M.; Chan, C.K. Test-Retest Reliability of the Single Leg Stance on a Lafayette Stability Platform. PLoS ONE 2023, 18, e0280361. [Google Scholar] [CrossRef] [Scilit] [PubMed]
- Urban, N.; Królikowska, A. Comparison of Limb Symmetry Index Values Across Different Knee Flexor Strength Testing Conditions in Healthy Male Recreational Athletes. Appl. Sci. 2026, 16, 3440. [Google Scholar] [CrossRef] [Scilit]
- Daneshjoo, A.; Rahnama, N.; Mokhtar, A.H.; Yusof, A. Bilateral and Unilateral Asymmetries of Isokinetic Strength and Flexibility in Male Young Professional Soccer Players. J. Hum. Kinet. 2013, 36, 45–53. [Google Scholar] [CrossRef] [Scilit] [PubMed]
- Latash, M.L. Muscle Coactivation: Definitions, Mechanisms, and Functions. J. Neurophysiol. 2018, 120, 88–104. [Google Scholar] [CrossRef] [Scilit] [PubMed]
- Stergiou, N.; Decker, L.M. Human Movement Variability, Nonlinear Dynamics, and Pathology: Is There a Connection? Hum. Mov. Sci. 2011, 30, 869–888. [Google Scholar] [CrossRef] [Scilit] [PubMed]
- Peterka, R.J. Sensorimotor Integration in Human Postural Control. J. Neurophysiol. 2002, 88, 1097–1118. [Google Scholar] [CrossRef] [Scilit] [PubMed]
- Wang, H.; Ji, Z.; Jiang, G.; Liu, W.; Jiao, X. Correlation Among Proprioception, Muscle Strength, and Balance. J. Phys. Ther. Sci. 2016, 28, 3468–3472. [Google Scholar] [CrossRef] [Scilit] [PubMed]
- Drigny, J.; Rolland, M.; Gauthier, A. The Influence of Knee Proprioception and Strength on Lower-Limb Functional Symmetry in Healthy Adults. Muscles 2025, 4, 3. [Google Scholar] [CrossRef] [Scilit] [PubMed]
- Karagül, S.; Kartaloğlu, I.F. The Effects of Dynamic Flamingo Balance Exercises and Balance Training with a Tetrax Posturography Device on the Balance Performance and Fall Risk of Patients with Parkinson’s Disease. J. Back Musculoskelet. Rehabil. 2025, 38, 766–773. [Google Scholar] [CrossRef] [Scilit] [PubMed]
- Read, P.J.; Mc Auliffe, S.; Thomson, A. Commonly Used Clinical Criteria Following ACL Reconstruction Including Time from Surgery and Isokinetic Limb Symmetry Thresholds Are Not Associated with Between-Limb Loading Deficits During Running. Phys. Ther. Sport 2021, 49, 236–242. [Google Scholar] [CrossRef] [Scilit] [PubMed]
- Dong, M.; Kim, B.; Lee, J.; Choi, Y.; Shi, P.; Zhang, G. Isokinetic Muscle Function, Dynamic Balance, and Injury Risk in Dominant and Non-Dominant Lower Extremities of Adolescent Taekwondo Athletes. Front. Sports Act. Living 2025, 7, 1599516. [Google Scholar] [CrossRef] [Scilit] [PubMed]
- Robinson, M.A.; Vanrenterghem, J.; Pataky, T.C. Sample Size Estimation for Biomechanical Waveforms: Current Practice, Recommendations and a Comparison to Discrete Power Analysis. J. Biomech. 2021, 122, 110451. [Google Scholar] [CrossRef] [Scilit] [PubMed]
- Bishop, C.; Turner, A.; Read, P. Effects of Inter-Limb Asymmetries on Physical and Sports Performance: A Systematic Review. J. Sports Sci. 2018, 36, 1135–1144. [Google Scholar] [CrossRef] [Scilit] [PubMed]
- Muehlbauer, T.; Gollhofer, A.; Granacher, U. Associations Between Measures of Balance and Lower-Extremity Muscle Strength/Power in Healthy Individuals Across the Lifespan: A Systematic Review and Meta-Analysis. Sports Med. 2015, 45, 1671–1692. [Google Scholar] [CrossRef] [Scilit] [PubMed]
- Li, L.; Ma, J.; Zou, B.; Liao, S.; Zhi, L. Explainable Graph Network with Information Fusion of Data and Medical Knowledge for KOA Diagnosis. Biomed. Signal Process. Control 2026, 127, 111097. [Google Scholar] [CrossRef] [Scilit]
- Li, L.; Ma, J.; Zou, B.; Xu, H.; Liao, S.; Xiong, W.; Zhi, L. SymUnet-DynCFC: Multimodal MRI Fusion for Robust Cartilage Segmentation and Clinically Confirmed Moderate-to-Severe KOA Diagnosis. Inf. Fusion 2026, 130, 104145. [Google Scholar] [CrossRef] [Scilit]
- Li, L.; Xing, Y.; Xiong, W.; Liao, S.; Zou, B.; Sun, X.; Zhi, L. SwMrNet: A Multi-Target Tissue Segmentation Method for Robust and Accurate Clinical Knee Diagnosis Assistance. Bioengineering 2026, 13, 784. [Google Scholar] [CrossRef] [Scilit] [PubMed]
- Faul, F.; Erdfelder, E.; Lang, A.-G.; Buchner, A. G*Power 3: A Flexible Statistical Power Analysis Program for the Social, Behavioral, and Biomedical Sciences. Behav. Res. Methods 2007, 39, 175–191. [Google Scholar] [CrossRef] [Scilit] [PubMed]
- Wiprich, M.T.; Eberle, E.F.; Balbinot, G.F.; Cecconi, M.P.; Binotti, F.; Tadiello, G.S.; Bonetti, L.V. Evaluation of Muscular and Functional Inter-Limb Asymmetries During Mid-Season in Young Male Soccer Athletes. J. Bodyw. Mov. Ther. 2024, 38, 605–614. [Google Scholar] [CrossRef] [Scilit] [PubMed]
- Racinais, S.; Cocking, S.; Périard, J.D. Sports and Environmental Temperature: From Warming-Up to Heating-Up. Temperature 2017, 4, 227–257. [Google Scholar] [CrossRef] [Scilit] [PubMed]
- Herman, K.; Barton, C.; Malliaras, P.; Morrissey, D. The Effectiveness of Neuromuscular Warm-Up Strategies, That Require No Additional Equipment, for Preventing Lower Limb Injuries During Sports Participation: A Systematic Review. BMC Med. 2012, 10, 75. [Google Scholar] [CrossRef] [Scilit] [PubMed]
- Butler, R.J.; Crowell, H.P.; Davis, I.M. Lower Extremity Stiffness: Implications for Performance and Injury. Clin. Biomech. 2003, 18, 511–517. [Google Scholar] [CrossRef] [Scilit] [PubMed]
- Akbar, S.; Soh, K.G.; Jazaily Mohd Nasiruddin, N.; Bashir, M.; Cao, S.; Soh, K.L. Effects of Neuromuscular Training on Athletes Physical Fitness in Sports: A Systematic Review. Front. Physiol. 2022, 13, 939042. [Google Scholar] [CrossRef] [Scilit] [PubMed]
- Webster, K.E.; Hewett, T.E. What Is the Evidence for and Validity of Return-to-Sport Testing After Anterior Cruciate Ligament Reconstruction Surgery? A Systematic Review and Meta-Analysis. Sports Med. 2019, 49, 917–929. [Google Scholar] [CrossRef] [Scilit] [PubMed]
- Grindem, H.; Snyder-Mackler, L.; Moksnes, H.; Engebretsen, L.; Risberg, M.A. Simple Decision Rules Can Reduce Reinjury Risk by 84% After ACL Reconstruction: The Delaware-Oslo ACL Cohort Study. Br. J. Sports Med. 2016, 50, 804–808. [Google Scholar] [CrossRef] [Scilit] [PubMed]
- Steib, S.; Rahlf, A.L.; Pfeifer, K.; Zech, A. Dose-Response Relationship of Neuromuscular Training for Injury Prevention in Youth Athletes: A Meta-Analysis. Front. Physiol. 2017, 8, 920. [Google Scholar] [CrossRef] [Scilit] [PubMed]
- Green, B.; Bourne, M.N.; van Dyk, N.; Pizzari, T. Recalibrating the Risk of Hamstring Strain Injury (HSI): A 2020 Systematic Review and Meta-Analysis of Risk Factors for Index and Recurrent Hamstring Strain Injury in Sport. Br. J. Sports Med. 2020, 54, 1081–1088. [Google Scholar] [CrossRef] [Scilit] [PubMed]

Disclaimer/Publisher’s Note: The statements, opinions and data contained in all publications are solely those of the individual author(s) and contributor(s) and not of MDPI and/or the editor(s). MDPI and/or the editor(s) disclaim responsibility for any injury to people or property resulting from any ideas, methods, instructions or products referred to in the content. |
© 2026 by the authors. Licensee MDPI, Basel, Switzerland. This article is an open access article distributed under the terms and conditions of the Creative Commons Attribution (CC BY) license.