


Abstract
The transportation phase of offshore wind power installation projects, which links onshore manufacturing with offshore installation, is exposed to complex and coupled risks arising from oversized and overweight components, dynamic marine environments, and spatiotemporal coordination among multiple operational stages. A systematic framework integrating the Bayesian Network (BN) and the Bow-Tie model is proposed for quantitative risk assessment and barrier design of offshore wind power equipment transportation. First, thirty risk factors were identified from five dimensions, namely human, material, technical, environmental, and managerial, through literature review, accident case analysis, and two rounds of expert consultation, and a risk evaluation index system was established. Second, prior probabilities of root nodes were determined by aggregating weighted expert judgments with triangular fuzzy numbers; conditional probability tables were generated using the Noisy-OR gate model; and probability inference, criticality importance analysis, and risk forecasting were performed with Netica software (V.5.19). Finally, guided by the criticality ranking, Bow-Tie models were constructed for the five risk factors addressed in the scenario analysis, and multi-level preventive and mitigative barriers were designed. The results show that the overall risk probability of the transportation phase is 3.99%, with both the risk probability level and the risk loss level at Level II, corresponding to a comprehensive safety risk level of Level 3 (medium risk). Insufficient personnel qualifications (x11) and equipment design risks (x24) rank first and second both by posterior probability and by reconstructed critical importance, followed by the accuracy of spudcan punch-through assessment (x31); when the leading factors are set to occur simultaneously, the modelled accident probability rises to 27.6%, an absolute increase of 23.61 percentage points, a factor of approximately 6.9. The proposed BN-BowTie framework organically combines quantitative risk assessment with qualitative barrier design, providing theoretical support and practical guidance for transportation safety management of offshore wind power installation projects.
1. Introduction
1.1. Research Background
Driven by the dual imperatives of global climate change and energy-structure transformation, offshore wind power, with its advantages of abundant resources, stable wind speeds, and no occupation of land resources, has become one of the key pathways for countries to achieve their carbon-reduction targets [1], providing policy impetus for the large-scale development of offshore wind power. According to statistics from the Global Wind Energy Council, by 2023, the global cumulative installed capacity of offshore wind power had exceeded 76 GW, of which China ranked first in the world with more than 33.9 GW [2]. China’s 14th Five-Year Plan also explicitly calls for accelerating the construction of offshore wind power bases in coastal areas and promoting large-scale and intensive industrial development [3]. As the development of nearshore resources approaches saturation, the layout of offshore wind farms is rapidly advancing toward deep and distant waters. The capacity of individual wind turbines continues to increase, with wind turbine blades generally exceeding 100 m in length and tower heights continuously rising, placing higher demands on the load-bearing capacity and operational stability of offshore transportation and installation equipment [4,5].
As a critical link connecting onshore manufacturing bases with offshore installation sites, the transportation stage undertakes the offshore transfer of oversized and overweight equipment, including tower sections, blades, nacelles, and foundation piles. Compared with onshore transportation, the transportation of offshore wind power equipment must take into careful consideration multiple constraints, such as marine hydrometeorological conditions, route planning, vessel–cargo compatibility, and port loading and unloading capacity. The transport fleet must not only withstand the dynamic marine environmental loads caused by wind and waves, tides, and low visibility, but also maintain precise coordination in time and space with installation platforms, port storage yards, and other stages. Any equipment damage or transportation delay may trigger a chain reaction, resulting in missed construction windows, soaring costs, or even casualties [5]. In recent years, related accidents have occurred frequently: in 2022, the crane vessel “Fujing 001” dragged anchor and sank during Typhoon “Chaba”, resulting in 25 deaths and 1 person missing; a crane vessel in an offshore wind farm under construction in Guangdong suffered a boom fracture; and during Typhoon “Mangkhut”, a vessel at an offshore wind power project became severely unstable because operations were not suspended in time.
Accident investigations have shown that inadequate equipment maintenance, insufficient personnel training, improper responses to extreme weather, and deficiencies in on-site management were the primary causes of these accidents, highlighting the significant shortcomings of the transportation stage in risk prevention and control and emergency response. Therefore, systematically identifying risk factors in offshore wind power transportation, quantitatively assessing risk levels, and designing targeted prevention and control barriers are of great theoretical value and practical significance for ensuring project progress, controlling costs, and safeguarding safety.
1.2. Current Status of Research at Home and Abroad
Regarding offshore wind power installation projects, scholars in China and abroad have conducted extensive research on equipment technology, risk management, and quantitative assessment methods. In terms of equipment and construction technology, research has focused on the design of key structures of installation vessels and platforms [6,7,8], simulation-based optimization of installation and construction schemes [9,10], and integrated transportation and installation technologies for deepwater and floating applications [11,12,13]. These studies have provided equipment-level technical support for transportation and installation; however, they have primarily focused on structural hydrodynamics and mechanical performance, with limited attention paid to the risk mechanisms throughout the transportation process. In terms of project risk management, existing studies have conducted risk identification and assessment of offshore wind power projects from a life-cycle perspective [14]. Foreign scholars established life-cycle cost and risk assessment frameworks at an early stage and proposed integrated risk assessment models based on methods such as BNs and fuzzy analytic hierarchy processes, providing methodological references for risk quantification [15,16]. In terms of quantitative assessment methods, Bayesian networks, owing to their capabilities in uncertainty representation and bidirectional reasoning, have been widely applied to operational risk assessment of offshore wind farms, fault analysis of floating wind turbines, and installation risk modeling [17,18,19,20]. The Bow-Tie model graphically depicts the evolutionary chain of “threat–top event–consequence” and the configuration of barriers, and has been widely applied in process industries and safety analysis of heavy-load transportation [21,22].
Overall, existing research still has three major shortcomings. First, risk assessment has mainly focused on the operational stage or the macro level of the entire life cycle of offshore wind power projects, while systematic and quantitative research on transportation, a high-risk link in installation projects, remains relatively limited. Second, individual methods have their respective limitations: methods such as fuzzy comprehensive evaluation have difficulty characterizing the causal dependencies and dynamic coupling among risk factors, while BNs are effective in probabilistic reasoning but cannot intuitively present accident evolution paths and the configuration of prevention and control barriers. Third, risk research on the transportation stage has mostly stopped at risk ranking, lacking a systematic transformation from assessment results to barrier design; consequently, prevention and control measures lack sufficient specificity and operability [23].
1.3. Work of This Paper
In response to the aforementioned deficiencies, this paper takes the transportation stage of offshore wind power installation projects as the research object and proposes an integrated risk analysis and barrier design framework based on the Bayesian Network (BN) and Bow-Tie models. The main tasks include: (1) based on a literature review, analysis of typical accident cases, and two rounds of expert consultation, 30 transportation risk factors are systematically identified from five dimensions—people, equipment, technology, environment, and management—and a risk evaluation index system and risk evaluation criteria are established; (2) triangular fuzzy numbers and weighted expert assessments are integrated to determine the prior probabilities of root nodes, and the Noisy-OR gate model is introduced to simplify the acquisition of conditional probability tables, thereby establishing a BN-based transportation risk assessment model. Netica software is used to conduct probabilistic reasoning, posterior probability calculation, criticality ranking, and multifactor coupled risk prediction. In addition, the risk loss levels and overall risk levels are determined by combining the analytic hierarchy process with the secondary fuzzy comprehensive evaluation method; (3) guided by the criticality ranking results, Bow-Tie models are constructed for the five risk factors addressed in the scenario analysis, and preventive barriers, mitigative barriers, and degradation control measures are systematically designed, forming a sequential pathway of “quantitative assessment—critical factor identification—barrier design”.
2. Research Methods
2.1. Overall Research Framework
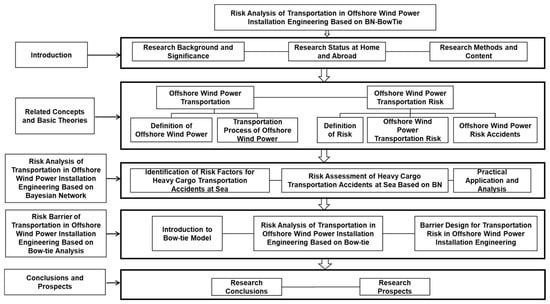
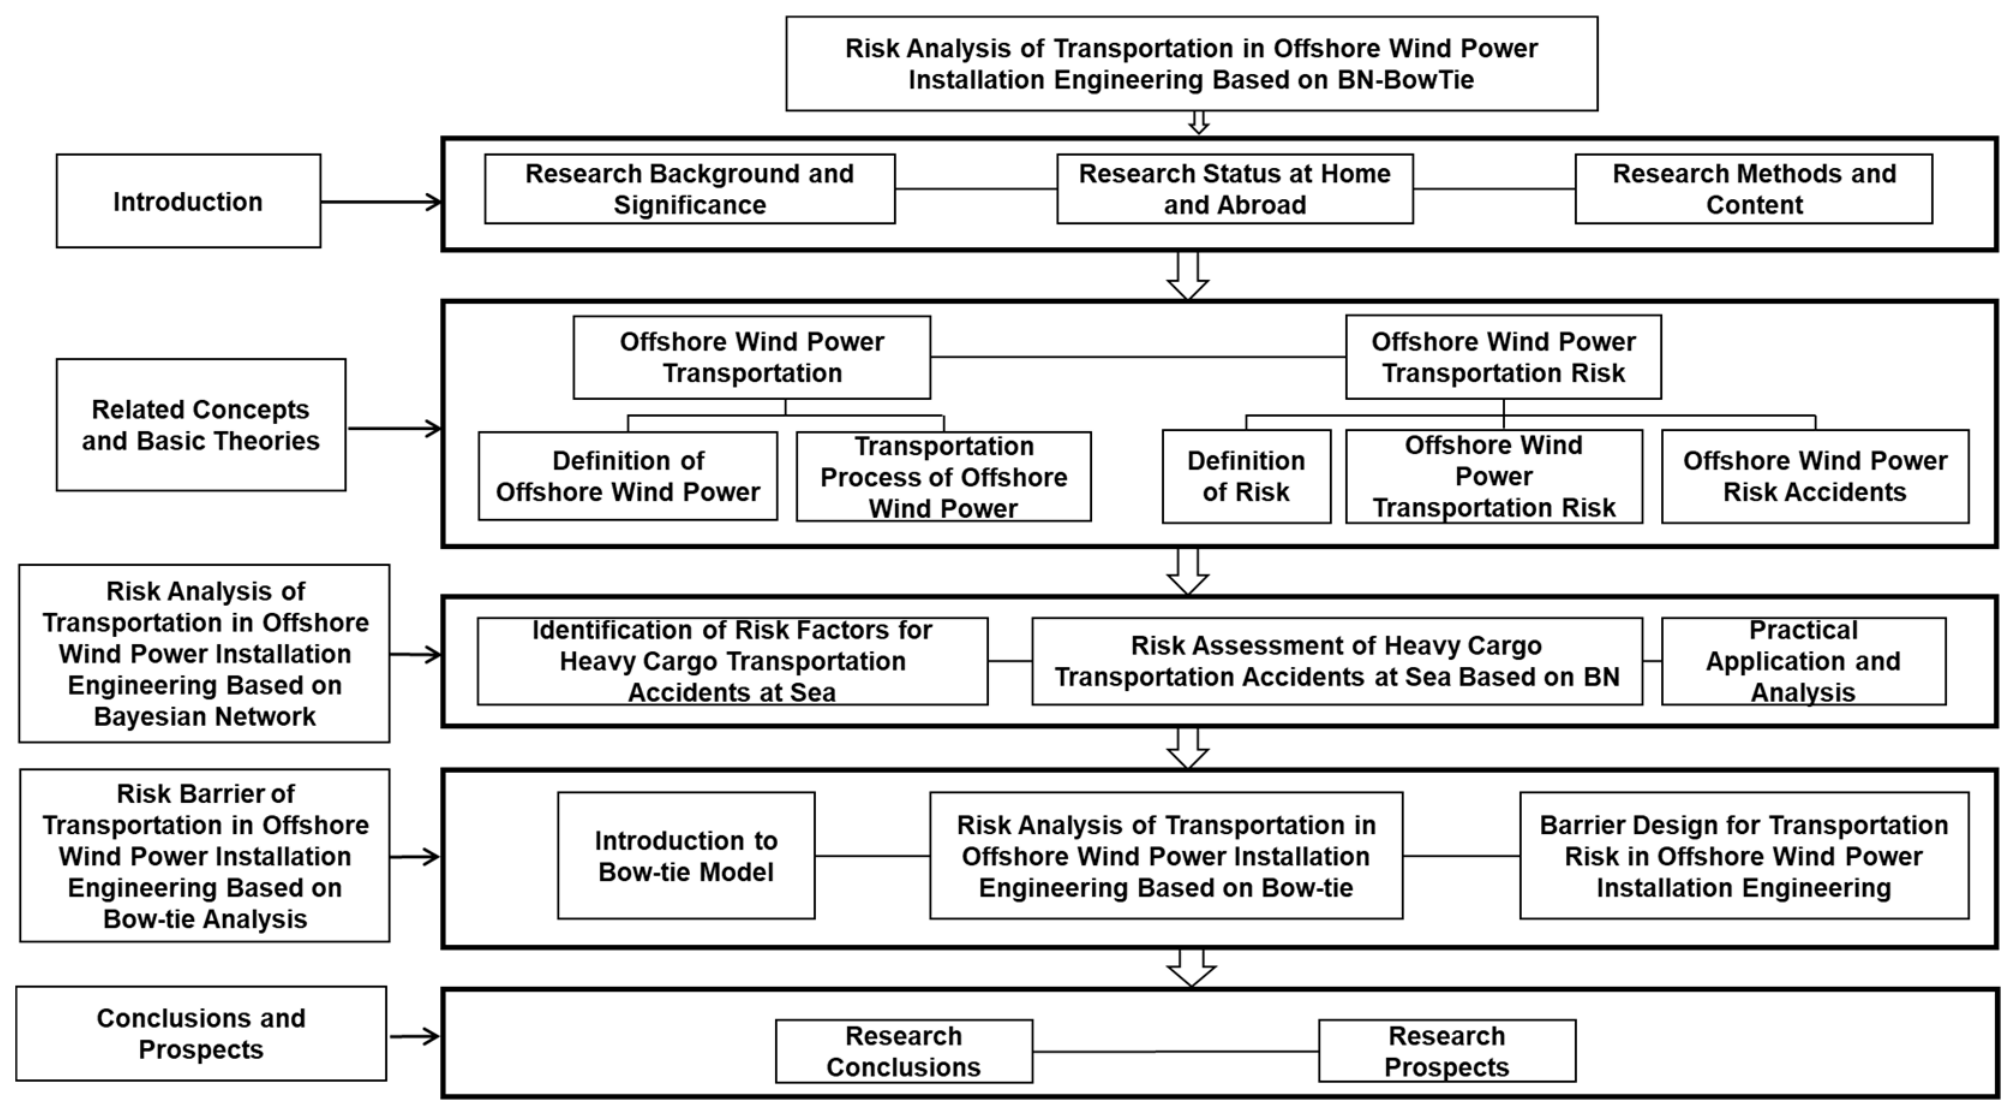
This paper follows the technical route of “risk identification—quantitative assessment—barrier design.” First, transportation-stage risk factors are identified through a literature review, accident case analysis, and expert consultation, and an evaluation index system with a hierarchical structure is established. Next, a BN model is constructed, the prior probabilities and conditional probabilities of the nodes are determined, and Netica software is used to conduct forward reasoning (risk probability assessment), backward diagnosis (posterior probabilities), and the probability- and critical-importance ranking used to select the risk factors for Bow-Tie modelling. A local sensitivity analysis of the elicited prior probabilities, in which each expert’s linguistic judgement is moved by one level and the effect on the prior probabilities and on their ranking is examined, is reported in Section 3.6; sensitivity to the Noisy-OR assumption, to the expert-weighting scheme, and to the network structure requires re-running the network and is identified as further work in Section 4.4. The risk loss levels are then determined through fuzzy comprehensive evaluation, and the overall risk level is determined using a risk matrix. Finally, Bow-Tie models are constructed for the risk factors ranking high in terms of criticality, multilayered risk barriers are designed, and optimization strategies are proposed. The overall research framework and technical route are shown in Figure 1.
Figure 1.
Technical Route.
2.2. Identification of Transportation Risk Factors and Establishment of the Indicator System
In the notation used throughout, xij denotes a risk factor (root node), with i the dimension index (1 human, 2 equipment, 3 technical, 4 environmental, 5 managerial) and j the factor index within the dimension; Xi denotes a criterion-layer node; and T denotes the leaf node, transportation safety risk. All other abbreviations are defined at first use.
The transportation of offshore wind power equipment comprises four stages: land transportation and loading/unloading from the manufacturing plant to the port, port loading and stowage, transportation by sea, and unloading and handover at the wind farm. Risk factors at each stage are intertwined and coupled. First, through a systematic literature review, this study collected accident case reports, industry statistics, and relevant research literature on offshore wind power installation engineering transportation from China and abroad, thereby initially establishing a risk factor database. Subsequently, the expert consultation method was adopted, involving two rounds of consultation with 10 experts from the fields of offshore wind power engineering design, construction, and transportation. The risk factors were supplemented and revised to reduce subjective bias and ensure the comprehensiveness and scientific rigor of the identification. Finally, the analytic hierarchy process was used to construct a transportation risk evaluation indicator system with a hierarchical structure. In this system, transportation safety risk is the objective layer, while people, equipment, technology, environment, and management constitute the five dimensions of the criterion layer. The indicator layer contains 30 risk factors, as shown in Table 1.
Table 1.
Risk Evaluation Indicator System for Offshore Wind Power Installation and Transportation.
The safety risk evaluation criteria incorporate risk probability and risk loss grading on the basis of the risk matrix. Risk probability is divided into four levels: I (low), II (moderate), III (relatively high), and IV (high). Risk loss is divided into four levels: I (minor), II (moderate), III (serious), and IV (catastrophic). The comprehensive risk level is determined by coupling the risk probability level and risk loss level through the risk matrix and is divided into Levels 1–4. The corresponding control requirements are as follows: Level 1 requires no supervision or inspection; Level 2 requires regular supervision and inspection; Level 3 requires improvement measures; and Level 4 requires real-time supervision and inspection to strictly prevent accidents, as shown in Table 2.
Table 2.
Risk Level Evaluation Criteria.
2.3. Construction of the BN Evaluation Model
2.3.1. Basic Principles of BN
A BN is a probabilistic graphical model based on Bayesian theory and consists of two parts: a directed acyclic graph (DAG) and conditional probability tables (CPTs). Nodes represent random variables, directed arcs represent causal relationships between variables, parent nodes point to child nodes, root nodes have no parent nodes, and leaf nodes have no child nodes [24]. The mathematical foundations of BN are conditional probability and Bayes’ theorem. Let A and B be two elementary events; then, the conditional probability is:
Let B1, B2, …, Bn be a complete set of mutually exclusive events in the sample space. Then, the law of total probability and Bayes’ theorem are, respectively:
where P(Bi) is the prior probability of event Bi, and P(Bi|A) is the posterior probability of event Bi. Based on the above reasoning mechanism, a BN can not only forward-propagate from the states of root nodes to infer the risk probabilities of leaf nodes, but also, given evidence at the leaf nodes, perform backward diagnosis of the posterior probabilities of various risk factors. It is therefore suitable for evaluating transportation risks characterized by the coupling of multiple factors and information uncertainty.
2.3.2. Determination of Network Structure and Prior Probabilities
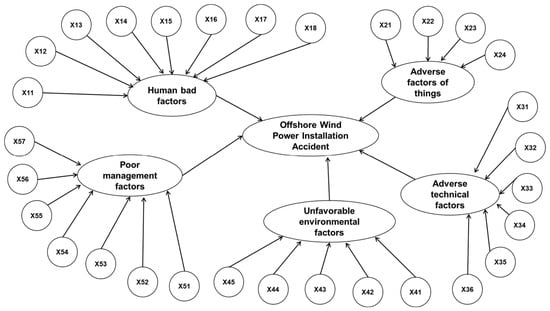
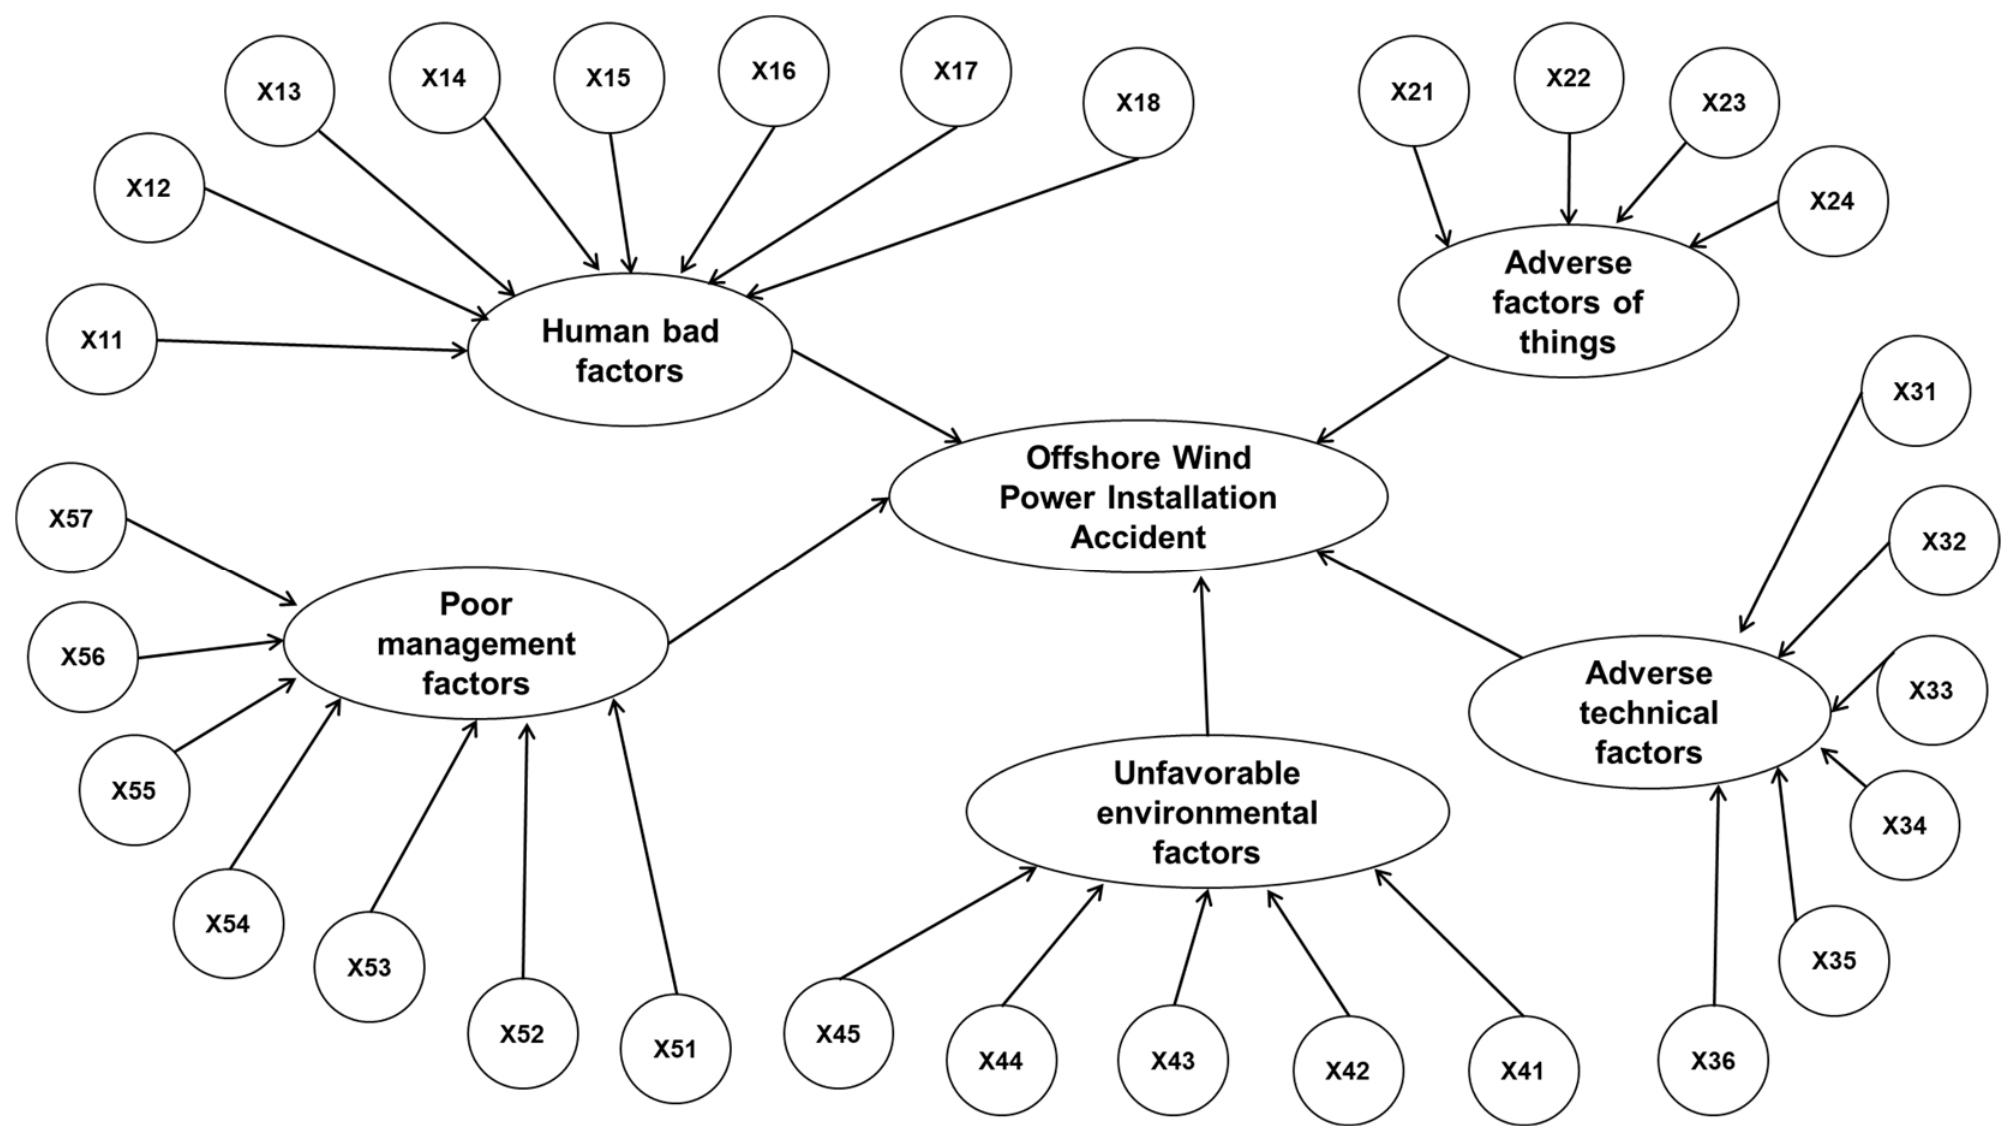
A transportation risk BN model was established based on the indicator system in Table 1, with the 30 risk factors serving as root nodes xij, with people, equipment, technology, environment, and management serving as the five criterion-layer factors and intermediate nodes X1—X5, with transportation safety risk serving as the leaf node T. The network parameters include the prior probabilities of the root nodes and the conditional probabilities of the intermediate and leaf nodes. The established BN model of transportation risk is shown in Figure 2.
Figure 2.
BN model of transportation risks in offshore wind power installation projects.
Due to the scarcity of historical statistical data on offshore wind transportation accidents, this study adopts a weighted expert assessment method based on fuzzy theory to determine the prior probabilities of the root nodes. Four safety experts from research institutions and enterprises were invited, and weights were assigned according to their professional titles and positions: senior engineer, 0.30; professor, 0.25; lecturer, 0.20; and enterprise safety officer, 0.25. The experts evaluated the likelihood of occurrence of each root node using a seven-level linguistic evaluation set {Very Low (VL), Low (L), Relatively Low (RL), Moderate (M), Relatively High (RH), High (H), Very High (VH)}. The linguistic variables correspond to triangular fuzzy numbers, as shown in Table 3.
Table 3.
Correspondence Between Linguistic Evaluations and Triangular Fuzzy Numbers.
The prior probability calculation procedure is as follows: (1) Aggregate the experts’ natural-language evaluations into triangular fuzzy probabilities according to their weights:
where wk is the weight of the kth expert, and is the triangular fuzzy number assigned by the kth expert to node i. (2) Apply averaging to the aggregation results to obtain the triangular fuzzy mean probability; then use the area mean method for defuzzification to obtain the fuzzy possibility score (FPS):
(3) Convert the fuzzy possibility score into the objective fuzzy probability (FP):
where K is the Onisawa conversion coefficient, K = 2.301 × ((1 − FPS)/FPS)^(1/3), and FP = 10^(−K). The prior probabilities of all 30 root nodes can be obtained through the above steps.
FP = 10−K
2.3.3. Determination of Conditional Probabilities Based on the Noisy-OR Gate
The conditional probability table characterizes the probability of occurrence of a child node under different combinations of parent-node states. When the network structure is complex, relying entirely on experts to assign values individually requires substantial effort and is prone to error: in this model, the six non-root nodes have 8, 4, 6, 5, 7 and 5 parent nodes respectively, resulting in a total of 528 conditional-probability entries. Therefore, the Noisy-OR gate model is introduced to generate conditional probabilities: under the Noisy-OR assumption, the influences of the parent nodes on the child node are mutually independent, and the probability of child-node occurrence is synthesized from the probabilities of the individual effects of the parent nodes. Let the probabilities that parent nodes x1, …, xn individually cause child node X to occur be P(X←xi), respectively; then, the conditional probability of child-node occurrence given a combination of parent-node states is:
where the probability of the effect of a single parent node, P(X←xi) is the fuzzy possibility score of parent node xi obtained by the area mean method as described in Section 2.3.2; Equation (7) gives P(X = 1|S) = 0 when S is empty. The criterion-layer probabilities recorded from the network run are P(X1) = 0.101 (human), P(X2) = 0.406 (equipment), P(X3) = 0.0192 (technical), P(X4) = 0.0174 (environmental) and P(X5) = 0.0148 (management). In Equation (7), the single-cause probability of each parent-to-child link was specified in the network software and was not retained; the criterion-layer probabilities therefore cannot be recomputed from the root-node probabilities of Table 4, and they are reported here as recorded values. The five single-cause probabilities that link the criterion-layer nodes to the leaf node T were specified in the network software and are not recoverable from the project records; the overall probability of 3.99% and the multi-factor result of 27.6% are therefore reported as the outputs of the network as it was run, and the recovery of these five parameters is identified in Section 4.4 as the first requirement for an independent replication of the numerical results. This approach can substantially reduce the cost of parameter acquisition while ensuring accuracy.
Table 4.
Aggregated Results of Prior Probabilities for Root Nodes.
2.3.4. Critical Importance and Posterior Probability
The contribution of a root node to the occurrence of a risk event at a leaf node is measured by critical importance. Let the failure probability of leaf node T be P(T), and the failure probability of root node xi be P(xi), then the probability importance of root node xii is the rate of change in the leaf-node failure probability with respect to the root-node failure probability:
Critical importance comprehensively considers the probability of occurrence of the root node itself and its probability importance:
When the leaf-node probabilities are known, the posterior probabilities of each root node can be obtained through backward inference using the BN:
Notes on the equations. The following points concern the four equations whose external basis is least self-evident. Equation (5) is a defuzzification that gives the peak of the triangular number twice the weight of its two end points; the standard centroid of a triangular fuzzy number is (a + b + c)/3, and the form adopted here is stated so that a reader recomputing the values is not misled. Equation (6) follows Onisawa [25], where the coefficient 2.301 and the exponent 1/3 were calibrated on human-reliability data; applying it to equipment, technical, environmental and managerial factors is therefore a formal analogy rather than an empirical calibration. Because the transformation is strictly monotone, the ordering of the root nodes by failure probability is identical to their ordering by fuzzy score, so the identification of the leading factors does not depend on this calibration, whereas the absolute probabilities do. In Equation (7), the single-cause parameter of each parent-to-child link is an independent expert assessment for that link rather than the parent node’s own failure probability or its fuzzy possibility score; the six conditional-probability tables are therefore recorded elicitation results, and they cannot be regenerated from the root-node probabilities of Table 4. In Equation (9), the critical importance is written without the customary division by P(T); because P(T) is common to all root nodes, this changes the magnitude of the importance values but not their ordering.
Posterior probability reflects the conditional probability of each risk factor given the evidence that “the accident has occurred,” and can be used for factor diagnosis under accident scenarios; the ranking of critical importance is used to identify priorities for risk control. Together, the two provide a targeted basis for Bow-Tie barrier design.
2.4. Barrier Design Method Based on the Bow-Tie Model
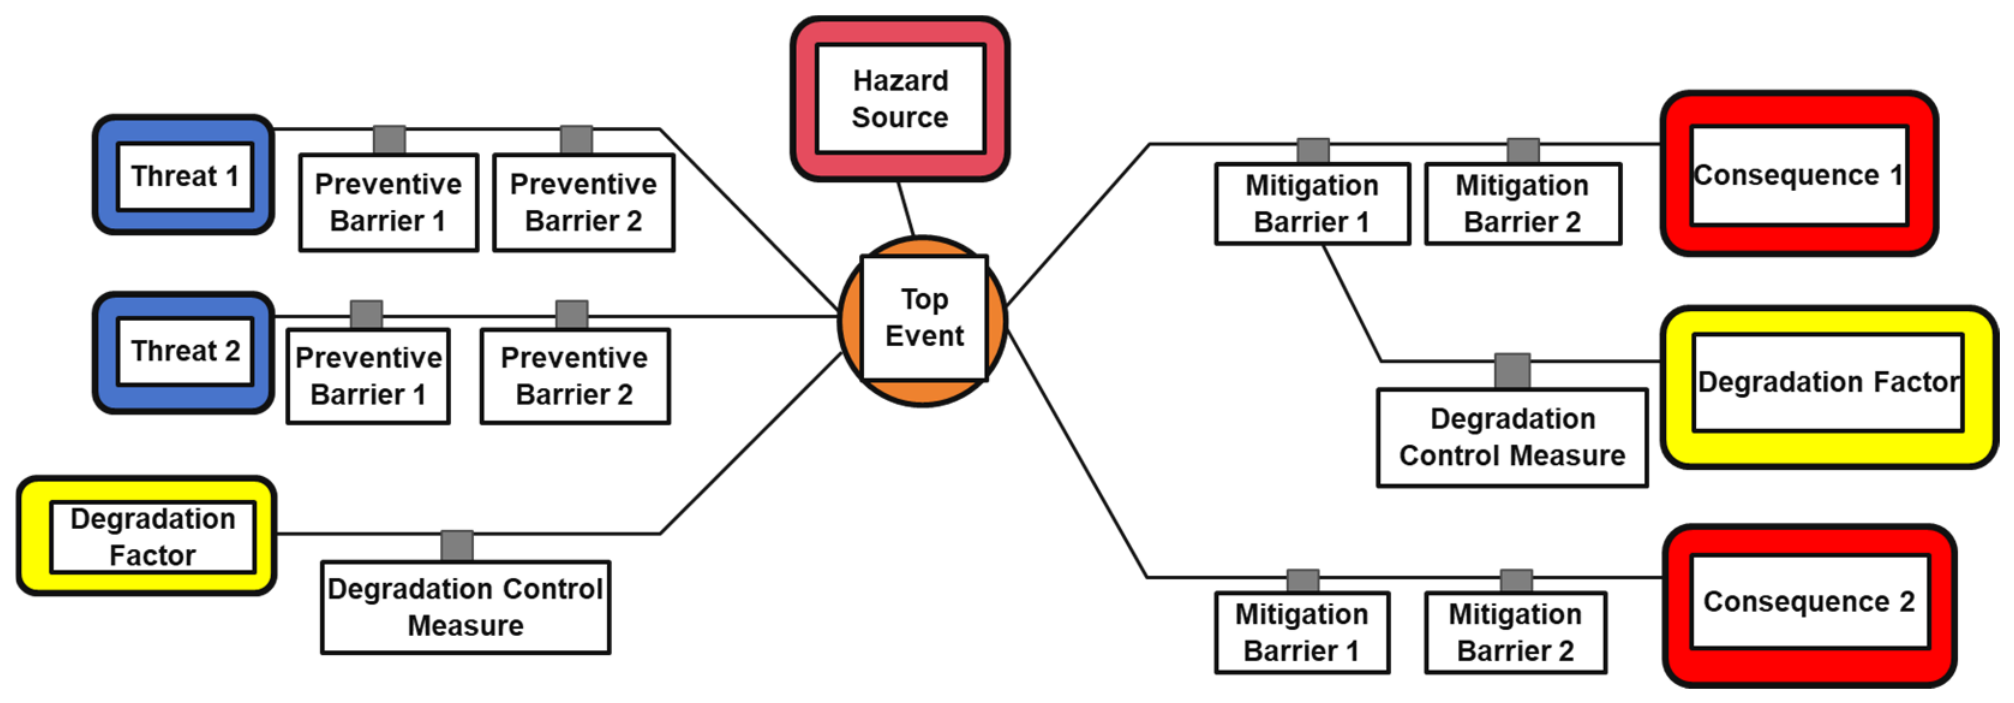
Bow-Tie analysis is a graphical risk assessment method. It was first documented in course materials on hazard analysis of Imperial Chemical Industries at the University of Queensland in Australia, and was subsequently widely applied in safety reports in the British petrochemical industry and by the U.S. Federal Aviation Administration [21]. It was gradually extended to fields such as the transportation of oversized goods by road and aviation maintenance inspections, resulting in a standardized modeling process [26]. A standard Bow-Tie diagram contains eight elements: hazards, top event, threats, consequences, preventive barriers, mitigative barriers, escalation factors, and escalation control measures [27]. The model takes the top event as its central node. The left side has a fault-tree structure, expanding layer by layer the potential threats that may trigger the top event and the preventive barriers deployed before the accident; the right side has an event-tree structure, presenting the various consequences that may develop after the event occurs and the mitigative barriers along the consequence-reduction paths. Escalation factors describe conditions that may weaken barrier effectiveness, while escalation control measures are used to maintain the intended functions of the barriers. This study adopts the Bow-Tie model interpretation framework of the Center for Chemical Process Safety (CCPS) [27]. For the key risk factors identified through BN assessment, a Bow-Tie model is constructed for each factor: the accident scenario caused by the loss of control of a key risk factor is taken as the top event; its underlying threat factors are analyzed, and preventive barriers are designed; potential consequences of the event are analyzed, and mitigative barriers are designed; escalation factors affecting barrier degradation are also identified, and escalation control measures are configured, thereby forming a full-chain risk barrier system of “threat—prevention—event—mitigation”. The structure of the standard Bow-Tie model is shown in Figure 3.
Figure 3.
Structure of the Standard Bow-Tie Model.
2.5. Limitations of the Independence Assumption and Emergent Failure Modes
The network developed in Section 2.3 rests on two simplifying assumptions that bound the interpretation of every result reported in this paper. The first is the conditional independence of parental contributions implied by the Noisy-OR gate, which is weakest for the factors describing management and competence—personnel qualification, safety awareness, technical briefing, inspection quality, and management practice—since these are strongly correlated in practice; where such correlation exists, the gate will misstate the probability of a child node whenever two or more correlated parents are active simultaneously. The second is the absence of inter-factor dependencies: all 30 factors enter the network as root nodes and are treated as conditionally independent given the criterion-layer nodes, so the network cannot represent coupling between factors in the strict sense. Two consequences follow. The network should be read as a structured and auditable representation of expert belief rather than as an exhaustive description of the failure space, and emergent failure modes arising from interactions not represented in the network, for example, the combination of an adverse weather window, cumulative crew fatigue, and the silent ageing of lifting gear, may occur without being predictable from any single arc of the model.
3. Data and Result Analysis
3.1. Prior Probabilities of Root Nodes
According to the weighted expert assessment and fuzzy conversion process described in Section 2.3.2, four experts scored each of the 30 root nodes individually using the linguistic evaluation set in Table 3. After weighted aggregation, averaging of triangular fuzzy numbers, and defuzzification using the area mean method, the fuzzy possibility score (FPS), conversion coefficient K, and prior probability (FP) of each root node were obtained, as shown in Table 4.
As shown in Table 4, insufficient personnel qualifications x11 has the highest prior probability (0.0440), more than twice the next highest value, reflecting the experts’ widespread concern regarding the “human-factor” shortcomings in the transportation stage. Equipment design risk x24, inadequate accuracy in assessing spudcan punch-through risk x31, and inadequate technical briefings x36 are also at relatively high levels, whereas factors related to the operating environment and institutional arrangements have relatively low prior probabilities.
3.2. Risk Probability Inference Results
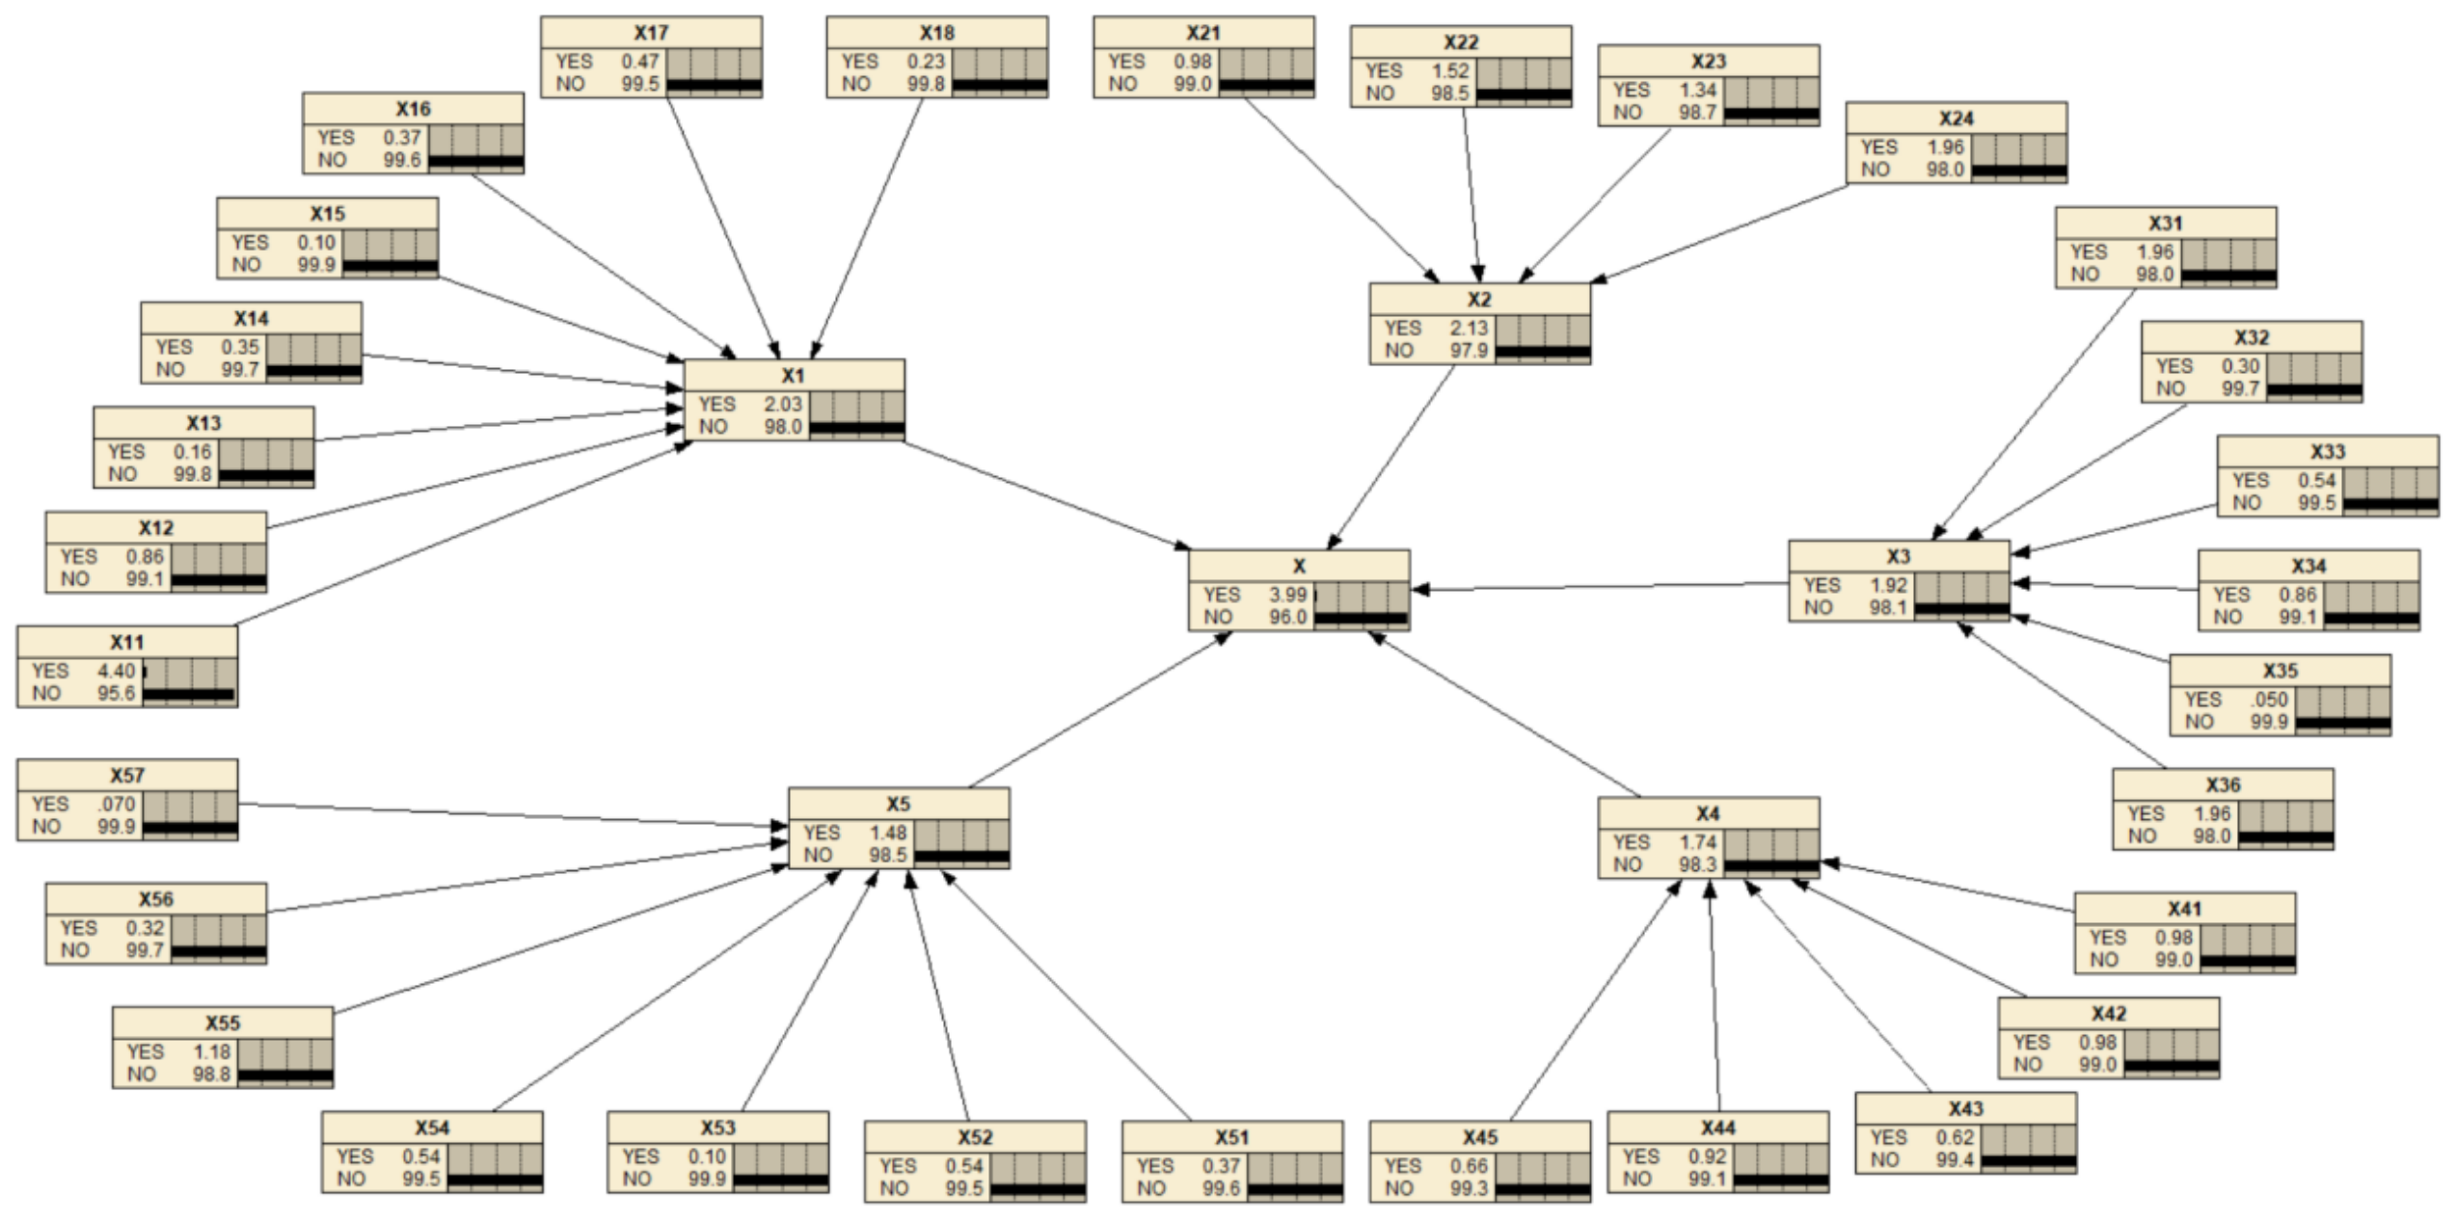
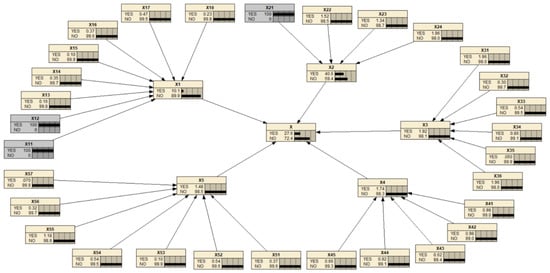
The prior probabilities of all nodes and the conditional probability table generated by the Noisy-OR gate model were input into Netica for probabilistic inference. The overall risk probability for the transportation stage of the offshore wind power installation project was found to be 3.99%, and among the four risk probability levels of the leaf nodes, Level II (moderate) had the highest likelihood. According to the evaluation criteria in Table 2, the risk probability level for the transportation stage was determined to be Level II. This result indicates that, under the existing management and technical conditions, the transportation stage is generally under control. The value of 3.99% is a model-based estimate derived from expert-elicited parameters under the assumptions stated in Section 2.3; it is not an observed accident frequency and has not been calibrated against operating records. It should therefore be read as an indicator of the relative level of risk in the transportation stage and used to prioritize barriers, rather than as a prediction that a given number of accidents will occur in a given number of operations. This should not be overlooked in offshore wind power projects, where equipment values are high, and accidents may have significant cascading effects. The Netica probabilistic inference results are shown in Figure 4.
Figure 4.
Netica-Based Probabilistic Inference Results for Transportation Risks.
3.3. Posterior Probabilities and Criticality Analysis
Using the leaf node “risk event occurrence” as evidence, BN backward inference was used to obtain the posterior probabilities of all root nodes, as shown in Table 5. Compared with the prior probabilities, the posterior probability of insufficient personnel qualifications x11 increased to 0.0443. The posterior probabilities of equipment design risk x24, inadequate accuracy in assessing spudcan punch-through risk x31, and the captain’s insufficient understanding of the platform x12 (corresponding to the material, technical, and human dimensions) also increased slightly relative to their prior values. This indicates that the suspected “contribution” of these factors was amplified under the accident scenario.
Table 5.
Calculated Results of Posterior Probabilities for Root Nodes.
Equations (8)–(9) define the probability importance and the critical importance of a root node. The values produced by the original network were not retained, because the five leaf-node parameters are no longer available. The posterior probabilities in Table 5 are reproducible, and they place x11 (0.0443), x24 (0.0205), x31 (0.0202) and x36 (0.0202) highest, with x21 and x12 ranking eighth and thirteenth respectively. Under every one of those scenarios x11 and x24 rank first and second, and neither x12 nor x21 enters the top three. The results indicate that, in the safety control of the offshore wind power transportation process, the human and material dimensions are the key weaknesses determining the system safety level. In terms of personnel, transportation operations involve highly skilled procedures such as loading and stowage, lashing and securing, and precise berth control. The qualifications of operators and the captain’s understanding of the platform’s load characteristics (self-weight, pile-leg load-bearing capacity, and stability margin) directly determine the correctness of operational decisions. In terms of materials, transportation and lifting tools are exposed to high-humidity, high-salinity, and high-load environments for extended periods, resulting in a high probability of aging and failure and posing a direct threat to system safety. Therefore, personnel qualification control and tool condition management should be prioritized in transportation risk prevention and control.
3.4. Multi-Factor Coupled Risk Prediction
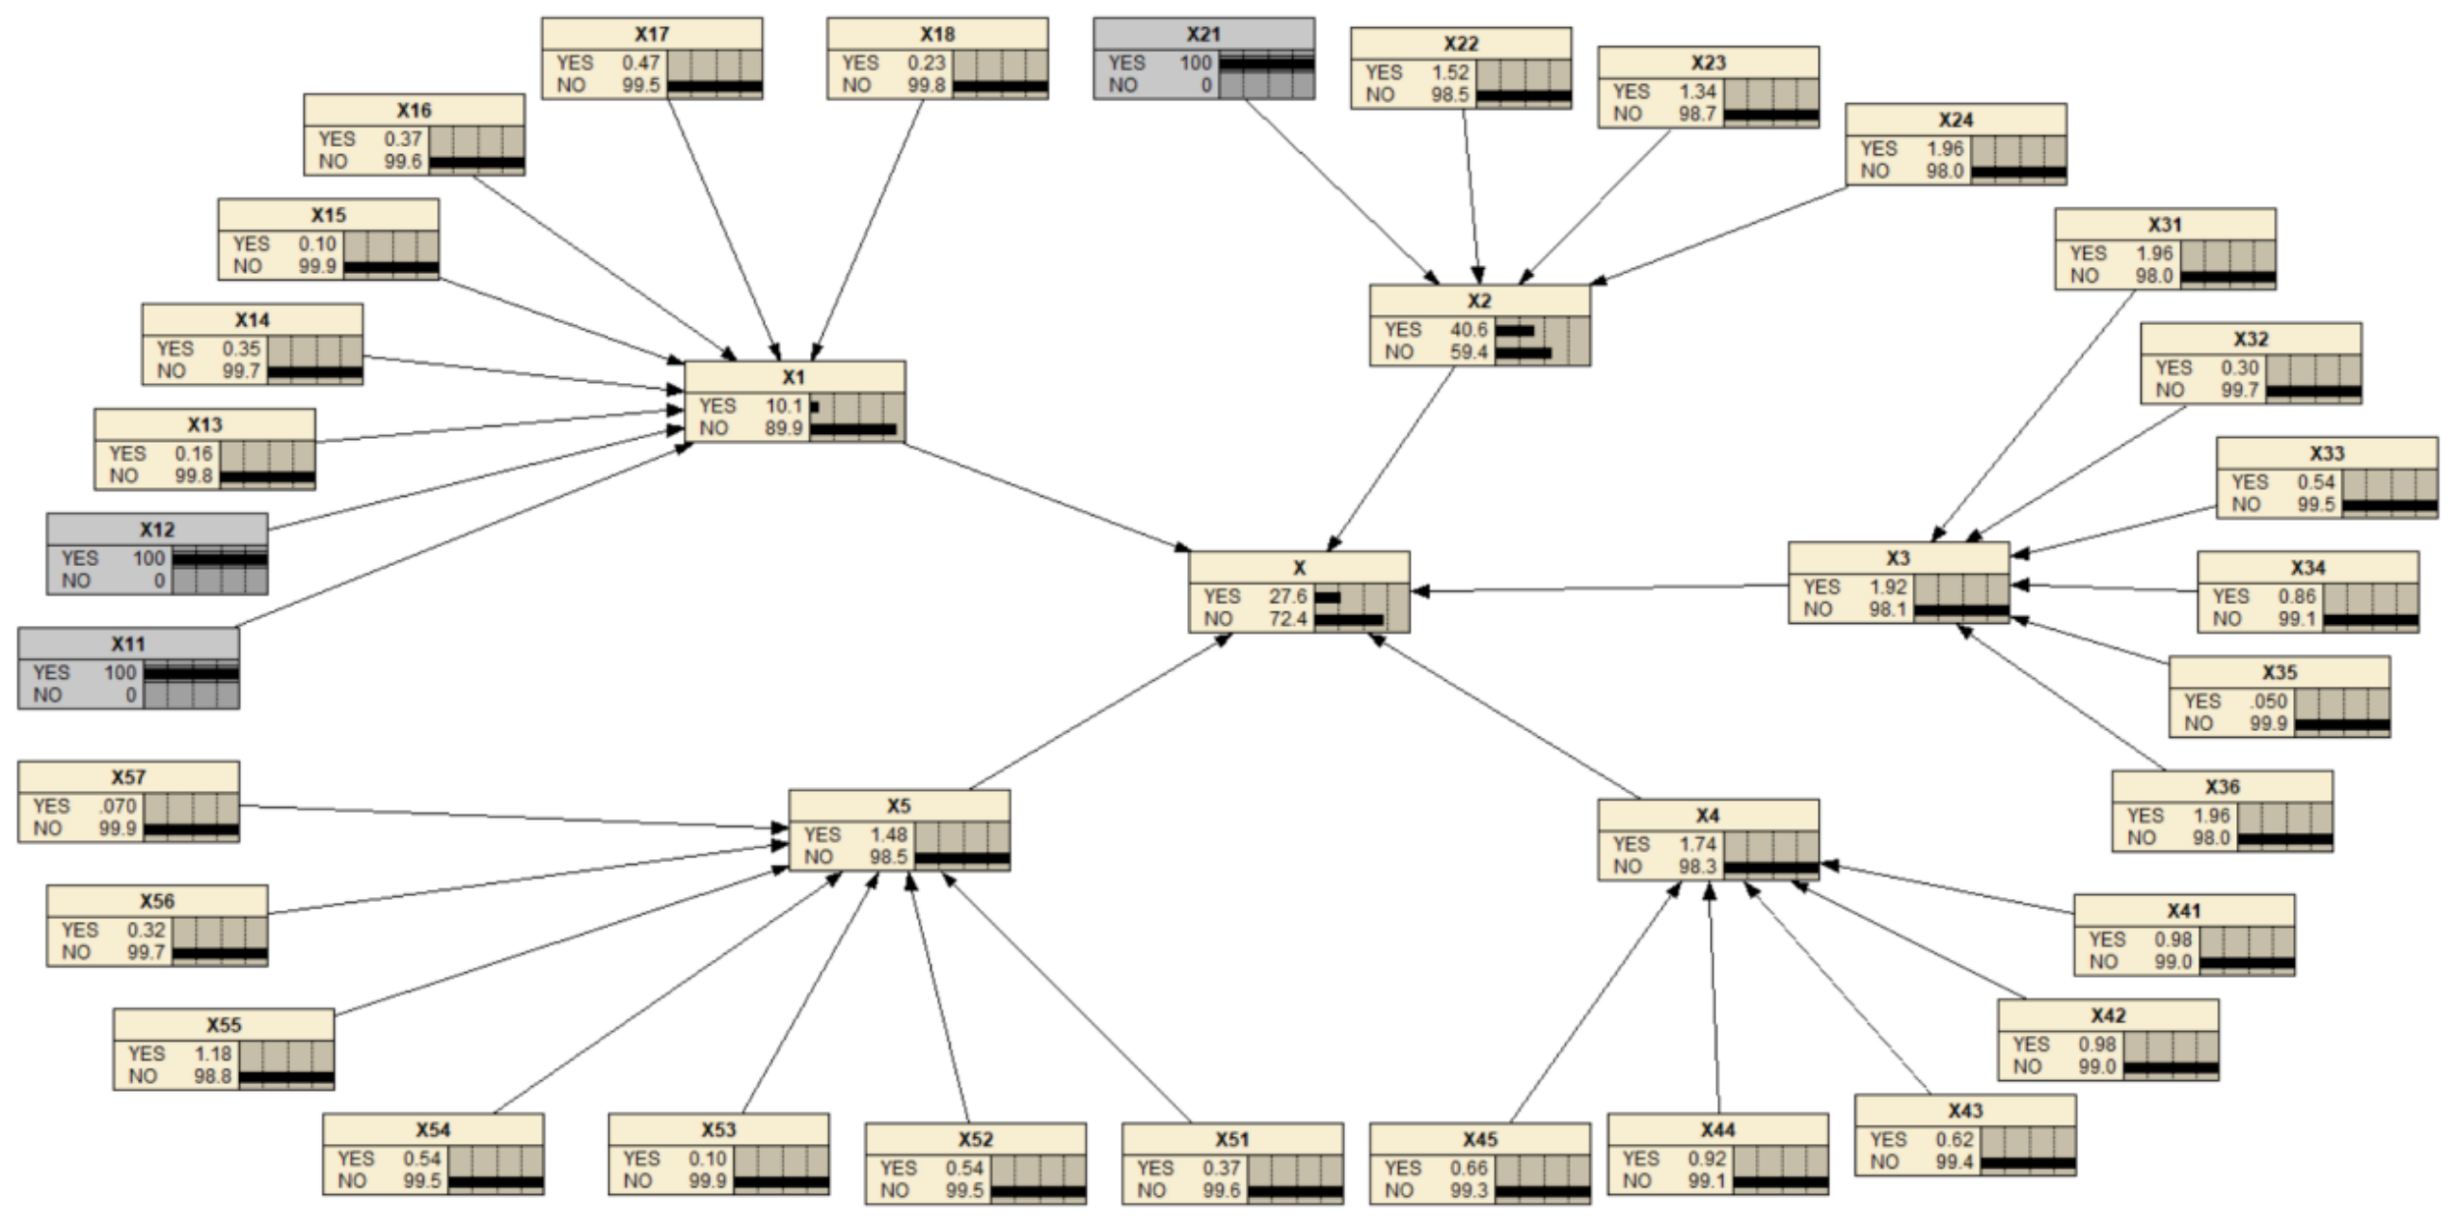
In actual engineering practice, risk accidents are often triggered by the coupling of multiple factors. To characterize the amplification effect of the superposition of key factors on system risk, the simultaneous occurrence of three factors that represent the dominant hazards of the transport sequence—insufficient personnel qualifications x11, insufficient understanding of the platform by the captain x12, and use of aged tools x21—was taken as the scenario, and the corresponding evidence nodes were set in Netica for risk prediction. The three factors were selected for their contribution to the dominant accident sequences rather than by their position in the criticality ranking. The results show that when all three factors occur simultaneously, the probability of accidents in the transportation process reaches as high as 27.6%, which is 23.61 percentage points higher than the 3.99% baseline, corresponding to a factor of approximately 6.9. This quantitative result reveals the amplification of system vulnerability under multi-factor co-activation and confirms the importance of “avoiding the superposition of key factors” in transportation safety management. In daily management, measures such as strengthening personnel safety education and training, conducting special training for captains on platform operations, and promptly updating and maintaining operational tools should be implemented to break the coupling chain of key factors and prevent a sharp increase in the system risk level. The results of the probability prediction of transportation risks under multi-factor coupling are shown in Figure 5.
Figure 5.
Results of transportation risk probability prediction under multi-factor coupling.
3.5. Risk Loss and Comprehensive Risk Level
The risk loss level was determined using the analytic hierarchy process and the two-level fuzzy comprehensive evaluation method. Experts from offshore wind power installation companies and the safety field were invited to construct judgment matrices by pairwise comparison of risk factors at the same level according to the “1–9 scale method.” The indicator weight vectors and maximum eigenvalues were calculated, and consistency tests were conducted. The results are shown in Table 6. Consistency was examined with the consistency index CI = (λmax − n)/(n − 1) and the consistency ratio CR = CI/RI, taking RI = 1.12, 1.41, 0.89, 1.24, 1.12 and 1.32 for n = 5, 8, 4, 6, 5 and 7 [28]. Table 6 reports the maximum eigenvalue and the consistency ratio of each of the six matrices. Four of the printed ratios are the consistency index rather than the consistency ratio and have been corrected, and the human-factors and management-factors matrices, which exceeded the 0.10 threshold in the form in which they were elicited, were corrected using a standard consistency-correction procedure. Separately, to establish that the reported weight vectors are compatible with a reciprocal matrix on the 1–9 scale, the matrix nearest to each reported weight ratio was constructed; both satisfy the 0.10 threshold. The itemized arithmetic, together with that check and the difference between the eigenvectors of the constructed matrices and the reported weight vectors.
Table 6.
Indicator Weight Sets and Consistency Test Results.
A further 10 experts engaged in transportation safety and risk research at universities were invited to evaluate the losses caused by each risk factor with reference to the risk loss rating set. The membership degree vectors for each criterion layer were obtained, and the first-level fuzzy comprehensive evaluation was completed. The results were V1 = [0.27, 0.29, 0.28, 0.16], V2 = [0.26, 0.28, 0.28, 0.17], V3 = [0.34, 0.31, 0.24, 0.10], V4 = [0.25, 0.28, 0.31, 0.16], V5 = [0.29, 0.33, 0.25, 0.12]. On this basis, a second-level fuzzy comprehensive evaluation was conducted, yielding a preliminary membership result of V = [0.298, 0.142, 0.272, 0.282]. After the weights were adjusted, the comprehensive membership degree vector indicated that the transportation stage had the highest probability of causing Level II (moderate) risk losses. Based on the Level II risk probability and Level II risk loss ratings, the risk matrix in Table 2 was used to determine that the overall safety risk level of the transportation stage in offshore wind power installation projects is Level 3. Table 2 maps a risk-probability level of II combined with a risk-loss level of II to comprehensive level 2; the computed loss membership is, however, spread across levels I, II and III of the loss scale, with the largest component only 0.024 above the third largest, and the consequences at this stage are severe. The comprehensive level is therefore assigned conservatively one level above the matrix cell, at level 3, which requires improvement measures. Combined with the conclusions in Section 3.3, improvement efforts should focus on human and material factors: strengthening safety education and training for personnel; strictly formulating safety operating procedures and carrying out pre-duty inspections and supervision; implementing the enterprise safety and environmental management system; strengthening the maintenance and replacement of tools; and improving the safety conditions of the working environment.
3.6. Local Sensitivity Analysis of the Elicited Prior Probabilities
Because the prior probabilities rest on the judgements of four experts, their sensitivity to those judgements is examined here. On the seven-level linguistic scale of Section 2.3.2, moving one expert’s judgement by one level changes the aggregated triangular fuzzy number by 0.05 in each of its three components and therefore changes the fuzzy possibility score by 0.05 for an expert weighted 0.25, by 0.06 for the expert weighted 0.30 and by 0.04 for the expert weighted 0.20; a one-level shift corresponds to a change of about 0.05 in the fuzzy possibility score. The fuzzy probability of each root node was accordingly recomputed with its fuzzy possibility score shifted by +0.05 and by −0.05. The relative change in the fuzzy probability ranges from +37% to +81% (mean +45%) for an upward shift and from −27% to −52% (mean −32%) for a downward shift, so the prior probabilities are numerically sensitive to individual expert judgements and the values in Table 4 should be read as estimates rather than as precise quantities. The five factors analyzed in the Bow-Tie models are x11, x24 and x31, which the reproducible posterior ranking places first, second and third, together with x12 (the captain’s insufficient understanding of the platform) and x21 (the use of aged tools). The two were added after discussion. Under the Work Safety Law of the People’s Republic of China, the person in charge of the operating unit carries statutory responsibility for safety, and the captain, as the core decision-maker on site, determines how the unit is loaded and positioned. If the captain does not understand the unit’s self-weight, the bearing capacity of its legs, and its stability margin, an overloading condition can be created at the stowage and positioning stage, leading to tilt, settlement, or even leg fracture. Tools are the element that appears most frequently in routine installation and maintenance, and old tools cannot be kept out of service altogether; because the same batch of tools is shared by different crews, maintenance and replacement are often deferred, so that an unsafe equipment state arises in critical operations and, combined with unsafe acts, amplifies the accident risk.
4. Discussion
4.1. Analysis of the Causal Mechanisms of Key Risk Factors
The BN assessment results indicate that human and material factors dominate the risk level in the transportation process, a conclusion that is highly consistent with the causal analysis of typical accident cases [18,19]. In the “Fujing 001” sinking accident, mechanical failure of the main crane on the floating crane vessel and operational errors were the direct causes, while inadequate equipment maintenance, insufficient personnel training, and blind operations under complex weather conditions constituted the indirect causes. The boom fracture accident involving a crane vessel at a wind farm in Guangdong, on the other hand, resulted from insufficient consideration of the design load and overloaded operations. It can be seen that human and material factors not only have a high prior probability of occurrence but also exert a strong driving effect on accident consequences. First, inadequate personnel qualifications leave operators without the necessary knowledge and skills during critical stages such as loading and stowage calculations, lashing and reinforcement, and emergency decision-making, directly increasing the probability of operational errors; Second, inadequate equipment design leaves the unit without the structural margin it needs: where load calculations, fatigue checks and lifting-point verification are incomplete, the barge or the lifting gear is selected on an assumed rather than a demonstrated capacity, and the shortfall only becomes apparent when dynamic loads are applied at sea, directly increasing the probability of structural failure and loss of cargo; Third, inadequate accuracy in spudcan punch-through assessment removes the only warning before an event that develops within minutes: where the soil profile is inferred from sparse boreholes and the bearing capacity is not re-checked against the preloading sequence, the spudcan may break through the seabed during jacking, and the resulting leg penetration and hull tilt can no longer be arrested once loading has begun, directly increasing the probability of a punch-through accident. Therefore, the barrier design that follows takes the three factors on which the scenario analysis is based—insufficient personnel qualifications, equipment design risk and inadequate accuracy in punch-through assessment—as its mainline, and extends it to two further factors, the captain’s insufficient understanding of the platform and the use of aged tools, so that a complete Bow-Tie barrier system is constructed.
4.2. Design of Key Risk Barriers Based on Bow-Tie
According to the method described in Section 2.4, Bow-Tie models are constructed for each of the 3 key risk factors identified above, and the elements of each model are selected as follows: a transportation accident triggered by the loss of control of a key risk factor is taken as the top event; deep-seated threats are analyzed, and preventive barriers are configured on the left, while potential consequences are analyzed and mitigating barriers are configured on the right. At the same time, barrier degradation factors are identified, and corresponding degradation control measures are established [20,22]. The key design elements of the Bow-Tie barrier system for the five key risks are shown in Table 7.
Table 7.
Bow-Tie Barrier Design System for Key Risk Factors.
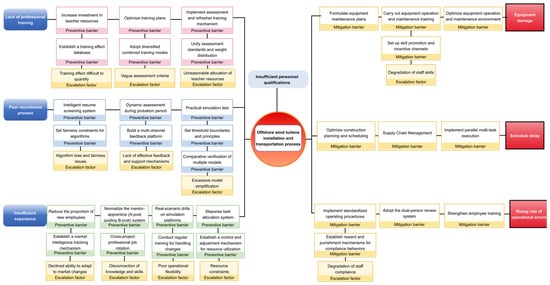
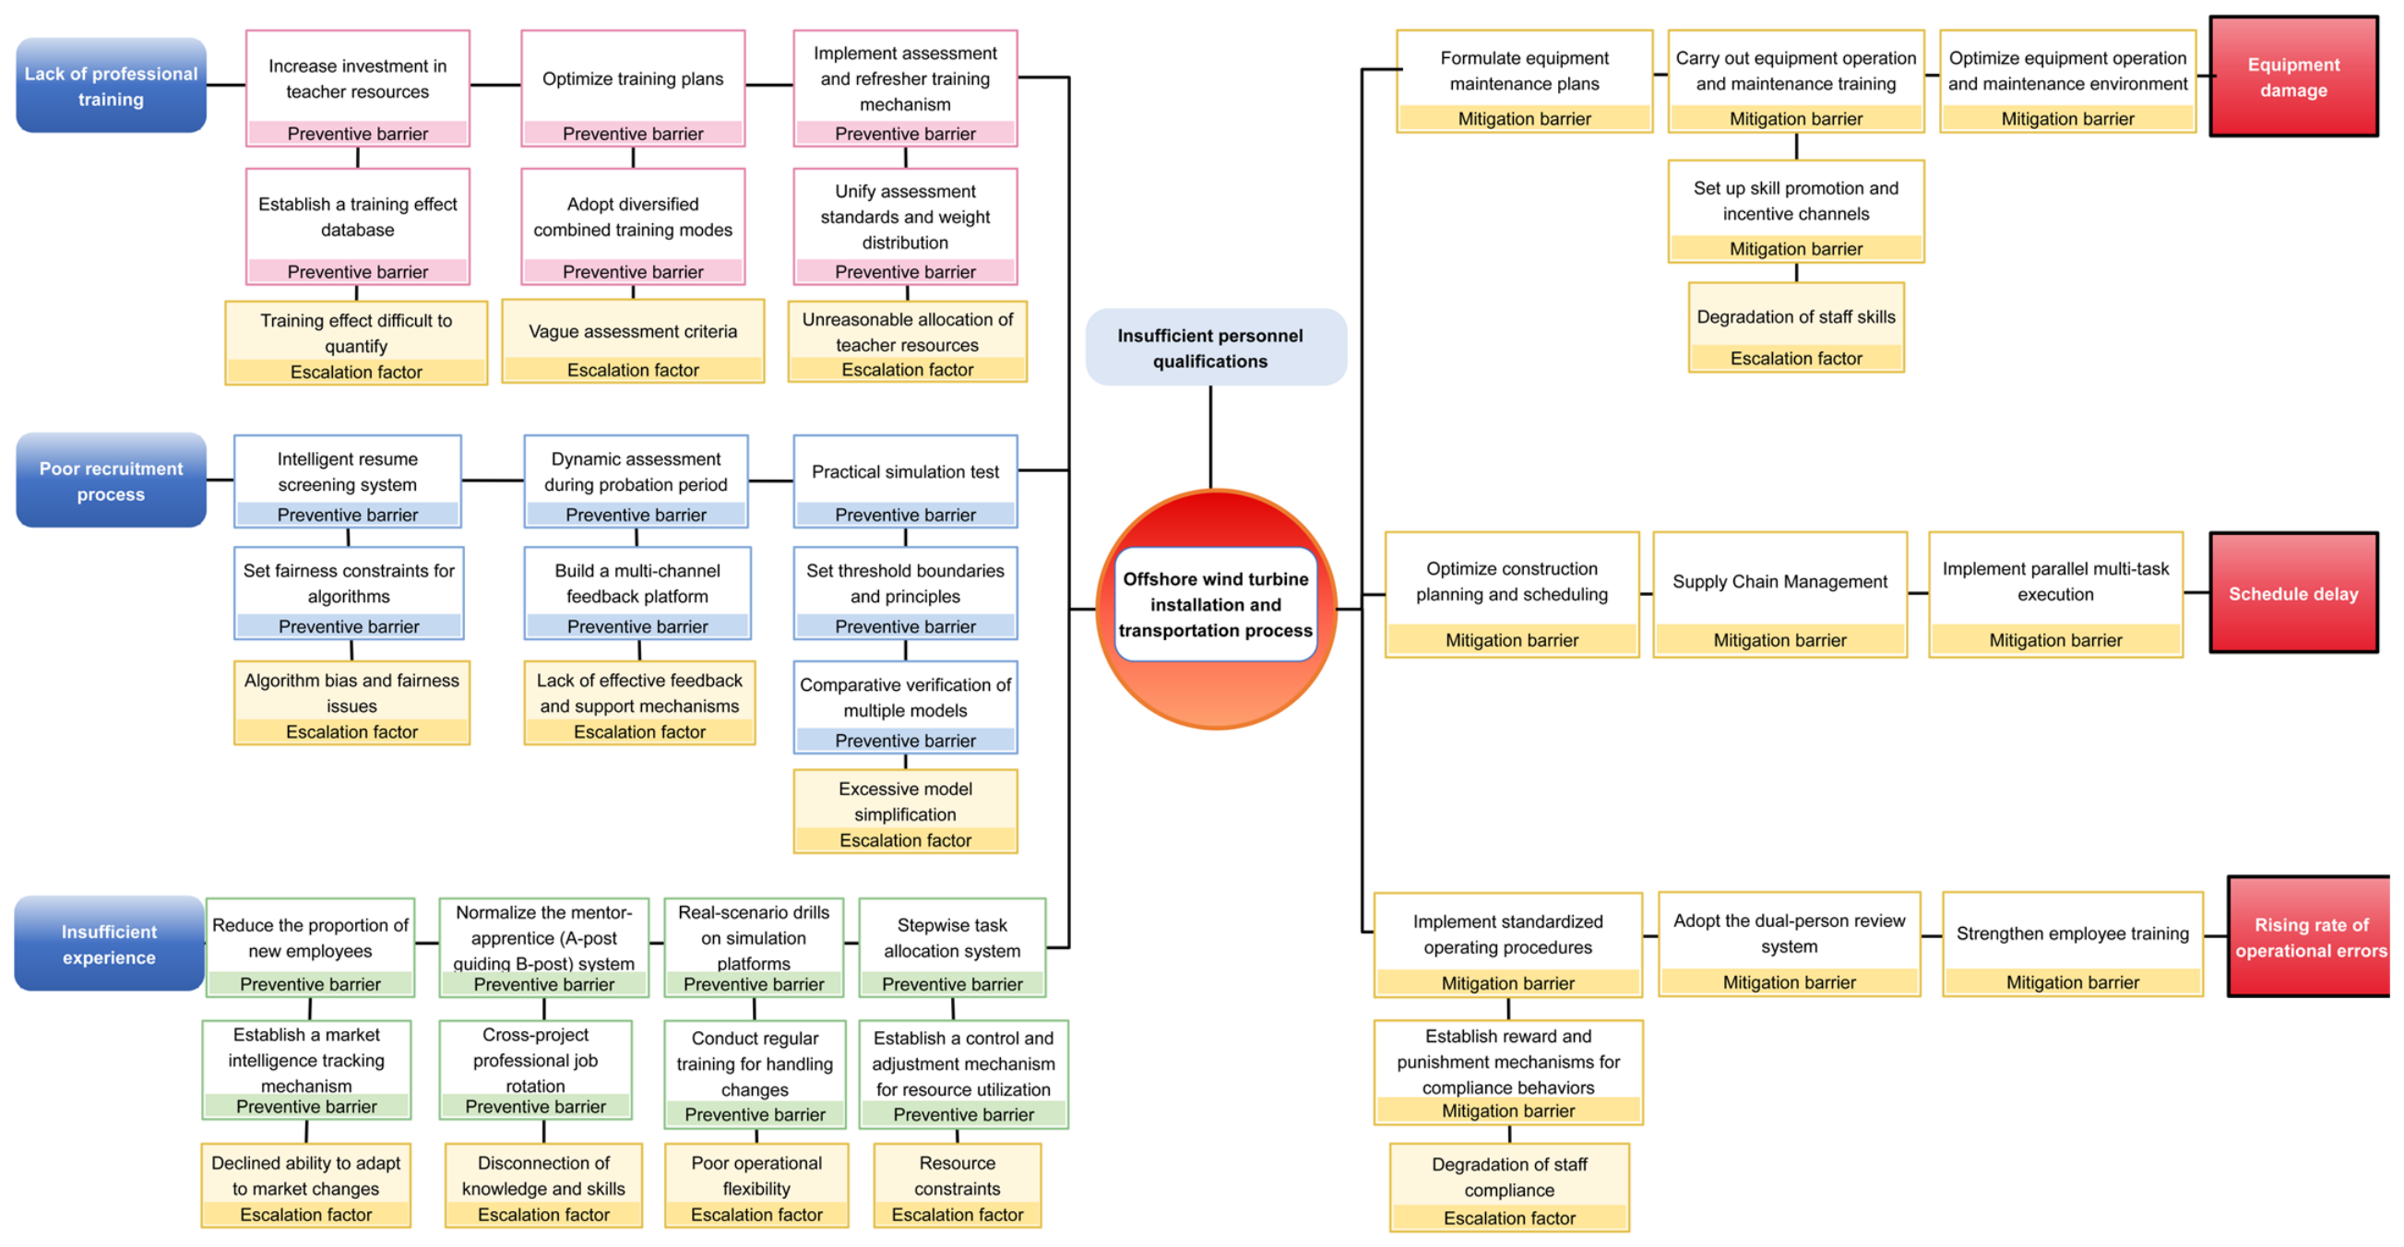
4.2.1. Barrier Design for Inadequate Personnel Qualifications
Insufficient personnel qualifications are the highest-importance risk factor. The threat side comprises three underlying hazardous factors: (1) Lack of professional training. Maritime transportation involves highly precise, high-risk operational procedures, and personnel without systematic training are prone to operational errors and improper emergency response. Preventive barriers include: increasing investment in training resources; introducing maritime operation simulators, virtual reality training platforms, and specialized courses provided by equipment suppliers; using a training effectiveness database as a degradation control measure to continuously verify training effectiveness; optimizing training plans by setting specialized courses for scenarios such as weather changes, emergency berth adjustments, and overload conditions; implementing a “pre-job assessment-periodic evaluation-specialized retraining” mechanism; and ensuring the scientific validity and fairness of evaluations through unified assessment criteria and weighting. (2) Poor recruitment processes. Transportation engineering is highly seasonal and has high technical barriers, and inefficient recruitment may result in personnel-job mismatches. Barriers include introducing an intelligent résumé screening system, supplemented by algorithmic fairness constraints as a degradation control measure; establishing a dynamic assessment mechanism during the probationary period; and conducting practical simulation tests. (3) Insufficient experience. Barriers include reducing the proportion of new employees during peak transportation periods, implementing a cross-project professional rotation mechanism, establishing a realistic simulation and exercise system on a simulation platform, and implementing a tiered task allocation system to avoid “parachuting inexperienced personnel” into positions.
On the consequence side, insufficient personnel qualifications may lead to three types of consequences: equipment damage, schedule delays, and an increased rate of operational errors. The corresponding mitigating barriers are as follows: for equipment damage, formulate equipment maintenance plans, provide training on equipment operation and maintenance, and optimize the equipment operating environment (transportation supports, shock-absorbing facilities, and route design); for schedule delays, optimize construction plans and dispatching mechanisms (dynamic planning management, buffer time, and redundant routes), strengthen supply chain coordination and management, and implement a multitask parallel strategy; for the increased rate of operational errors, implement standardized operating procedures (visualized SOPs), introduce a two-person verification system at critical points, and strengthen employee training and pre-job assessments. The Bow-Tie barrier model for insufficient personnel qualifications is shown in Figure 6.
Figure 6.
Bow-Tie Barrier Model for Insufficient Personnel Qualifications.
4.2.2. Barrier Design for Equipment Design Risks
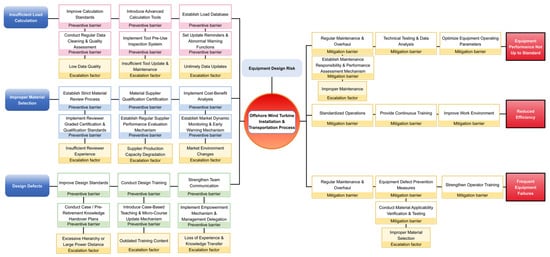
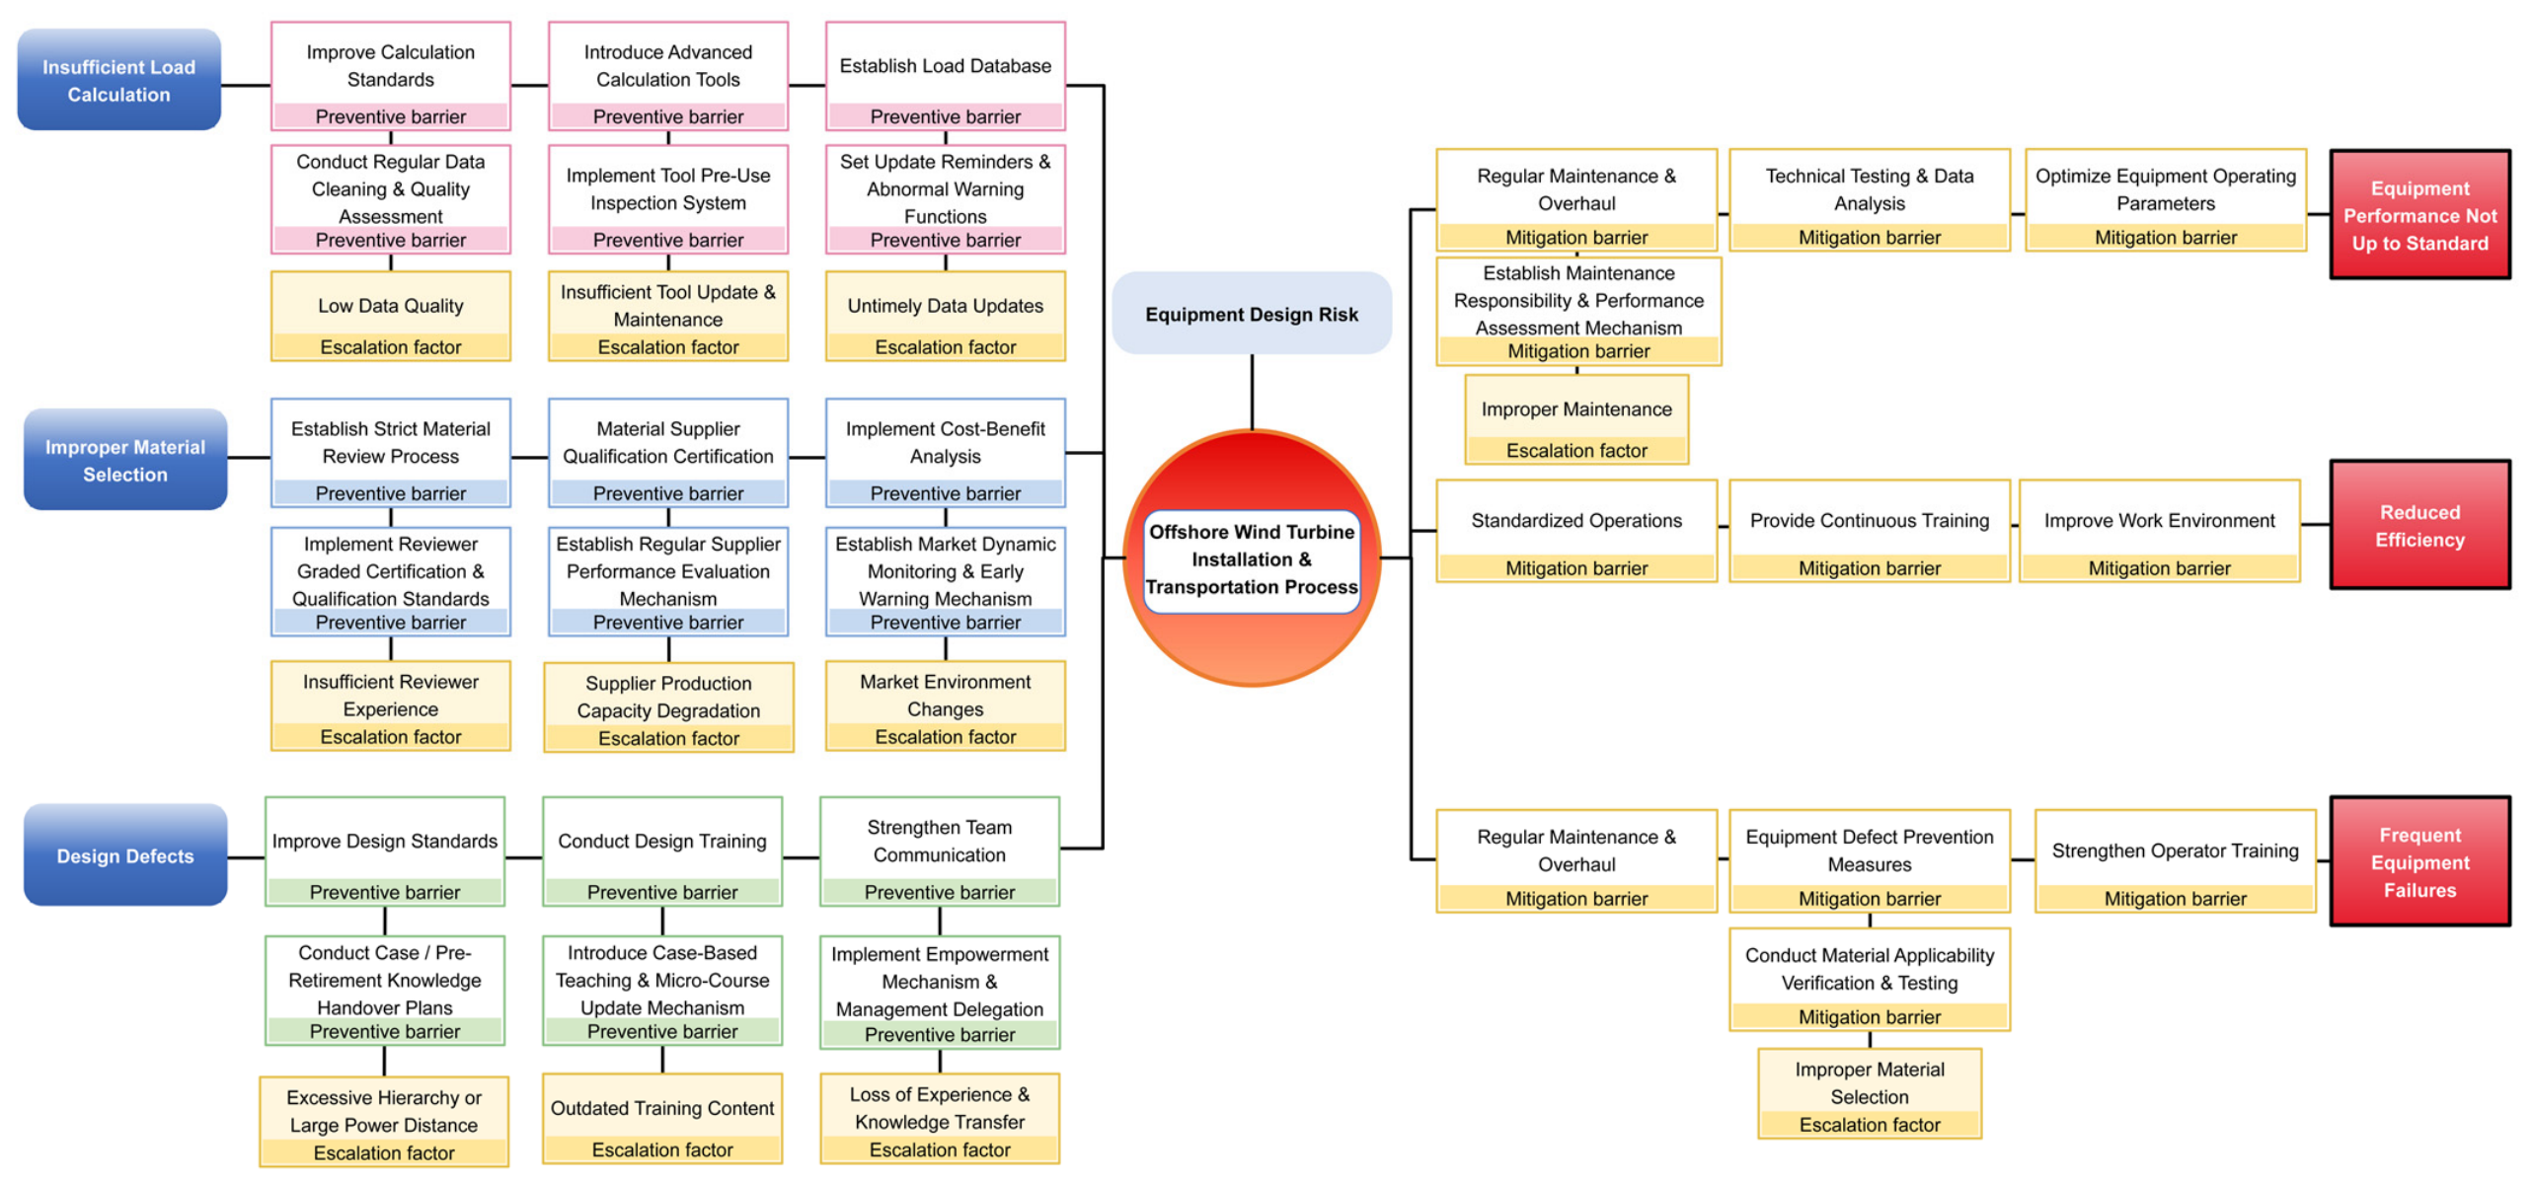
Threat-side hazards include: (1) insufficient load calculations, with barriers consisting of improving and aligning calculation standards with international standards (refining the selection of parameters such as wind and wave loads and inertial forces), introducing advanced computational tools such as finite element analysis and marine environmental simulation, and establishing a load database to support subsequent calculations; (2) improper material selection, with barriers consisting of a rigorous material review process (including performance testing, standards certification, and application-scenario matching), supplier qualification certification and batch consistency reviews, and full life-cycle cost-benefit analysis, thereby promoting a shift in material selection from “the cheapest” to “the most suitable”; (3) design defects, with barriers consisting of improving design standards and redundancy requirements, providing specialized marine engineering training for design personnel, and establishing a multidisciplinary joint review mechanism covering design, construction, and operation and maintenance.
On the consequence side, equipment design risks may lead to substandard equipment performance, reduced efficiency, and frequent equipment failures. Mitigation barriers include: regular maintenance, inspections, and technical testing (combining vibration analysis, temperature monitoring, and oil analysis with big-data trend forecasting), and optimization of equipment operating parameters; promoting standardized operations and continuous training, and improving the working environment; defect prevention based on Failure Mode and Effects Analysis (FMEA), adopting highly reliable protective measures such as anti-corrosion coatings and sealing, and strengthening training for operators in abnormal-condition identification and emergency response. The Bow-Tie barrier model for equipment design risks is shown in Figure 7.
Figure 7.
Bow-Tie Barrier Model for Equipment Design Risks.
4.2.3. Barrier Design for Inadequate Accuracy in Spudcan Punch-Through Assessment
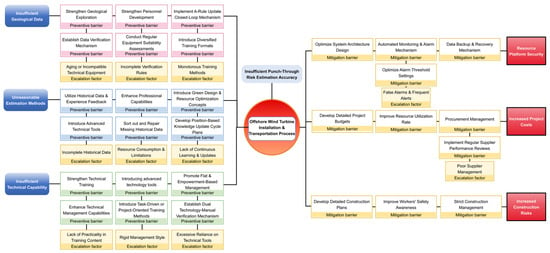
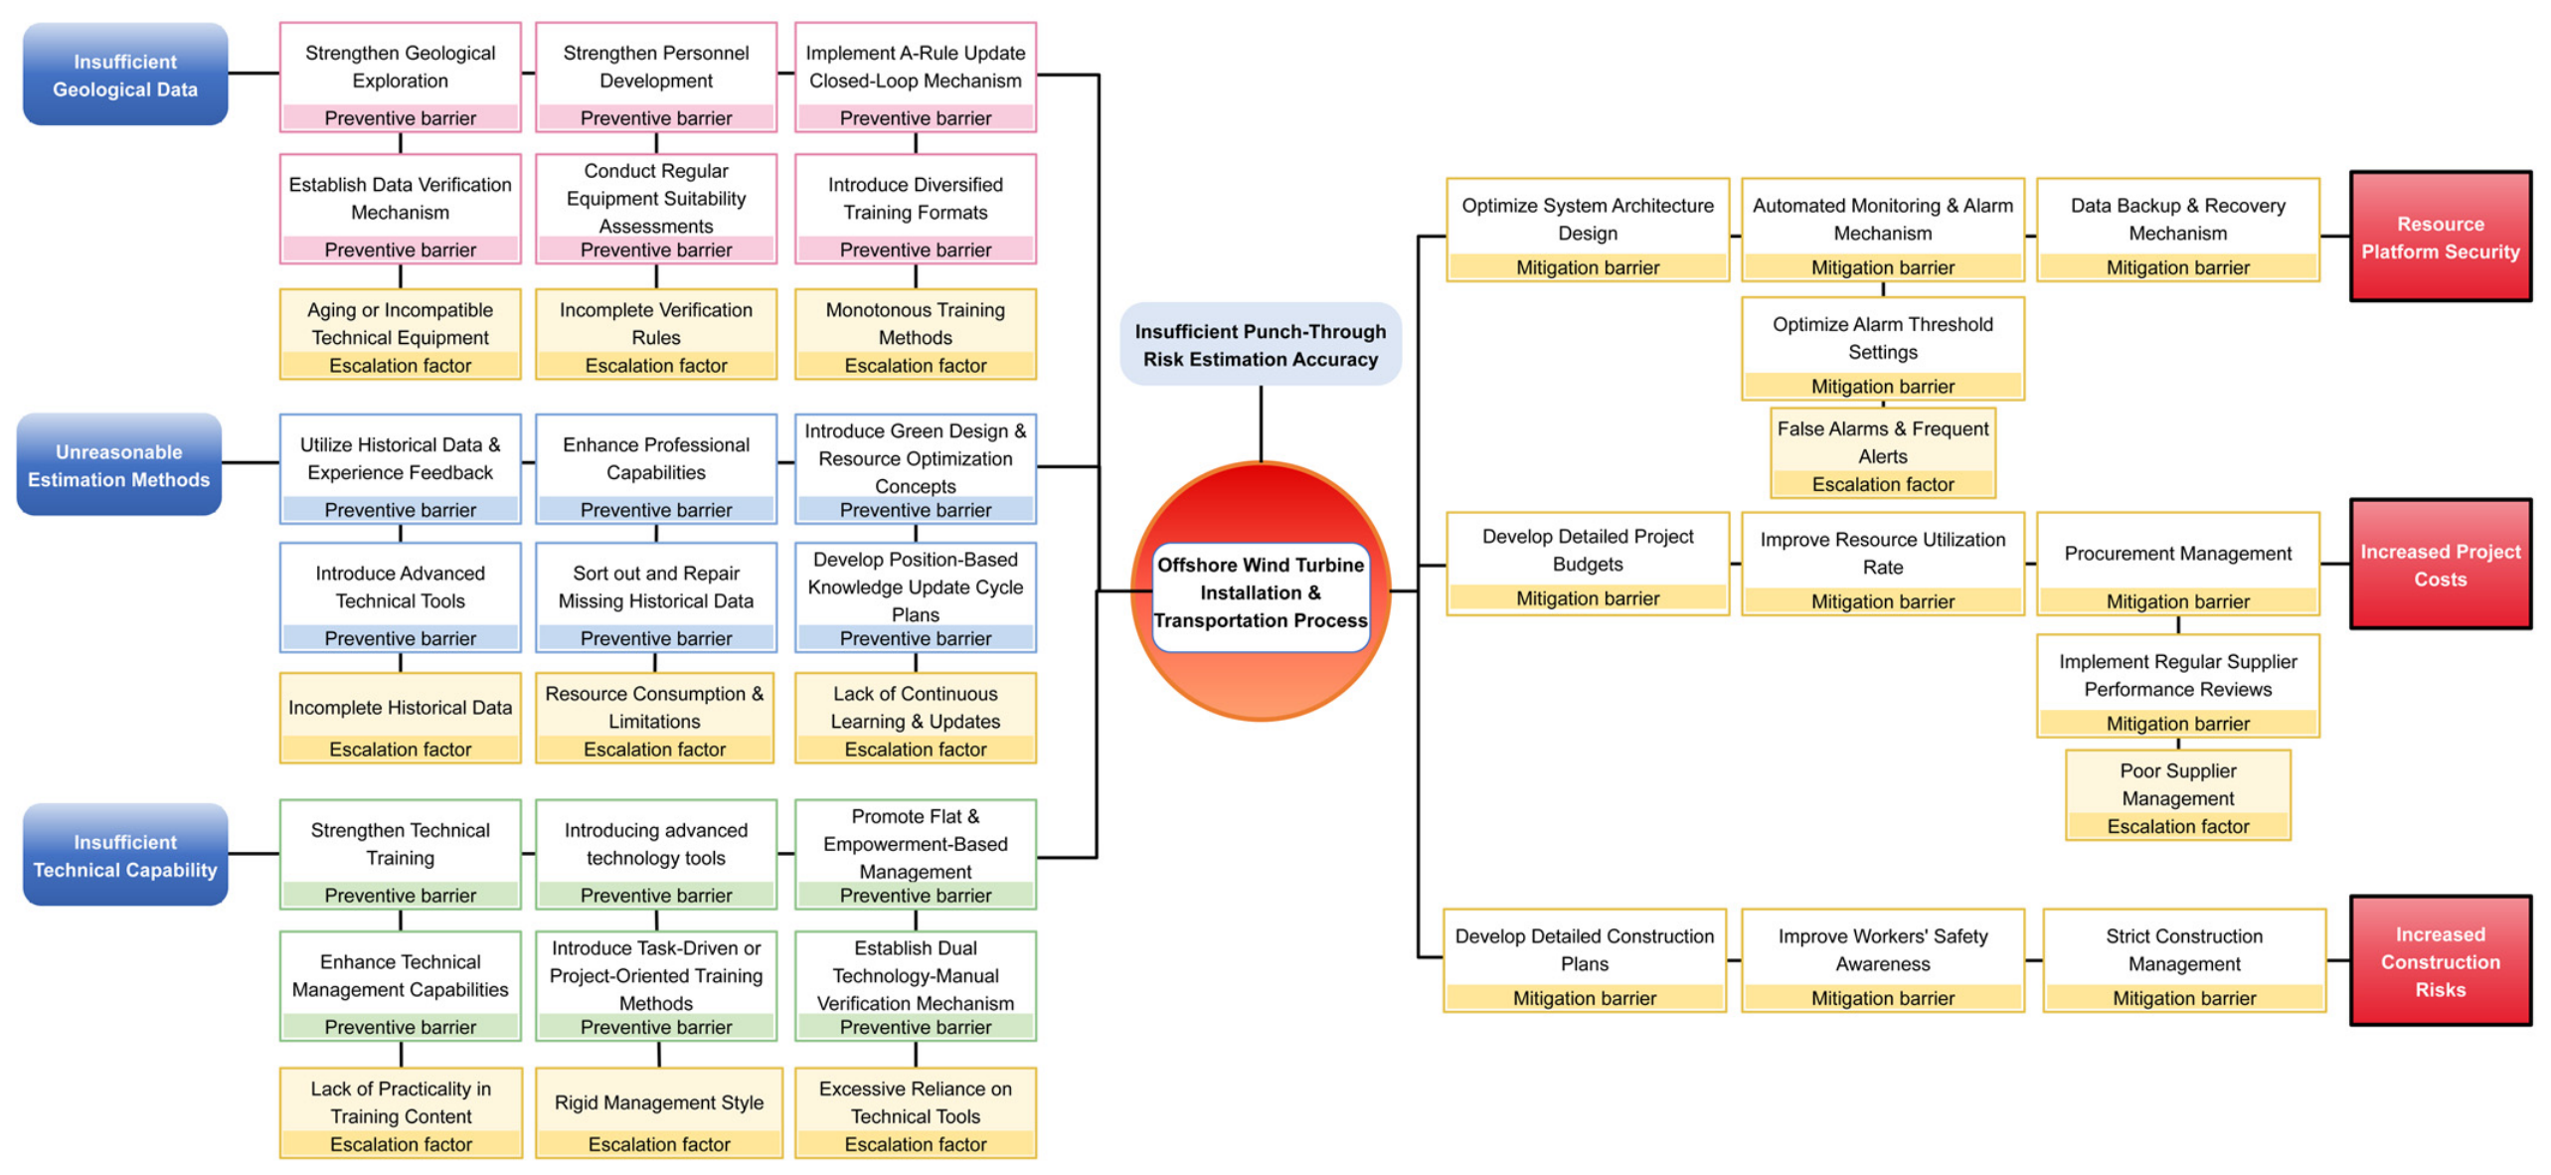
Threat-side hazard factors include: (1) insufficient geological data, with safeguards consisting of conducting high-resolution surveys using multiple detection methods covering all sea areas related to transportation, establishing a data validation mechanism involving cross-comparison of data from multiple batches and third-party reviews, and creating a systematic professional training system for exploration and data interpretation personnel; (2) unreasonable estimation methods, with safeguards consisting of establishing a historical data and experience feedback database, introducing advanced tools such as transportation simulation platforms and dynamic load analysis models, and improving estimation capabilities through continuous training and internal reviews; (3) insufficient technical capabilities, with safeguards consisting of interdisciplinary technical training and case reviews, standardized technical management with closed-loop accountability, and the introduction of intelligent transportation monitoring systems and 3D modeling virtual training platforms.
On the consequence side, insufficient estimation accuracy may lead to reduced platform stability, increased project costs, and increased construction risks. Mitigating safeguards include optimizing the platform system architecture design (modularization, wind- and wave-resistant structures, and dynamic load distribution), deploying high-precision sensors for real-time monitoring of platform attitude and automatic warning of exceedances, and establishing data backup and recovery mechanisms; preparing detailed project budgets and implementing dynamic cost control, improving resource utilization, and optimizing procurement management; and developing scientifically sound construction plans, enhancing workers’ safety awareness, and implementing strict permit approval procedures and third-party risk assessments. The Bow-Tie barrier model for insufficient estimation accuracy of spudcan punch-through is shown in Figure 8.
Figure 8.
Bow-Tie barrier model for inadequate estimation accuracy of spudcan punch-through.
4.2.4. Barrier Design for the Captain’s Insufficient Understanding of the Platform
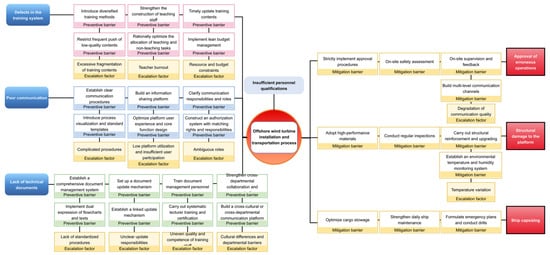
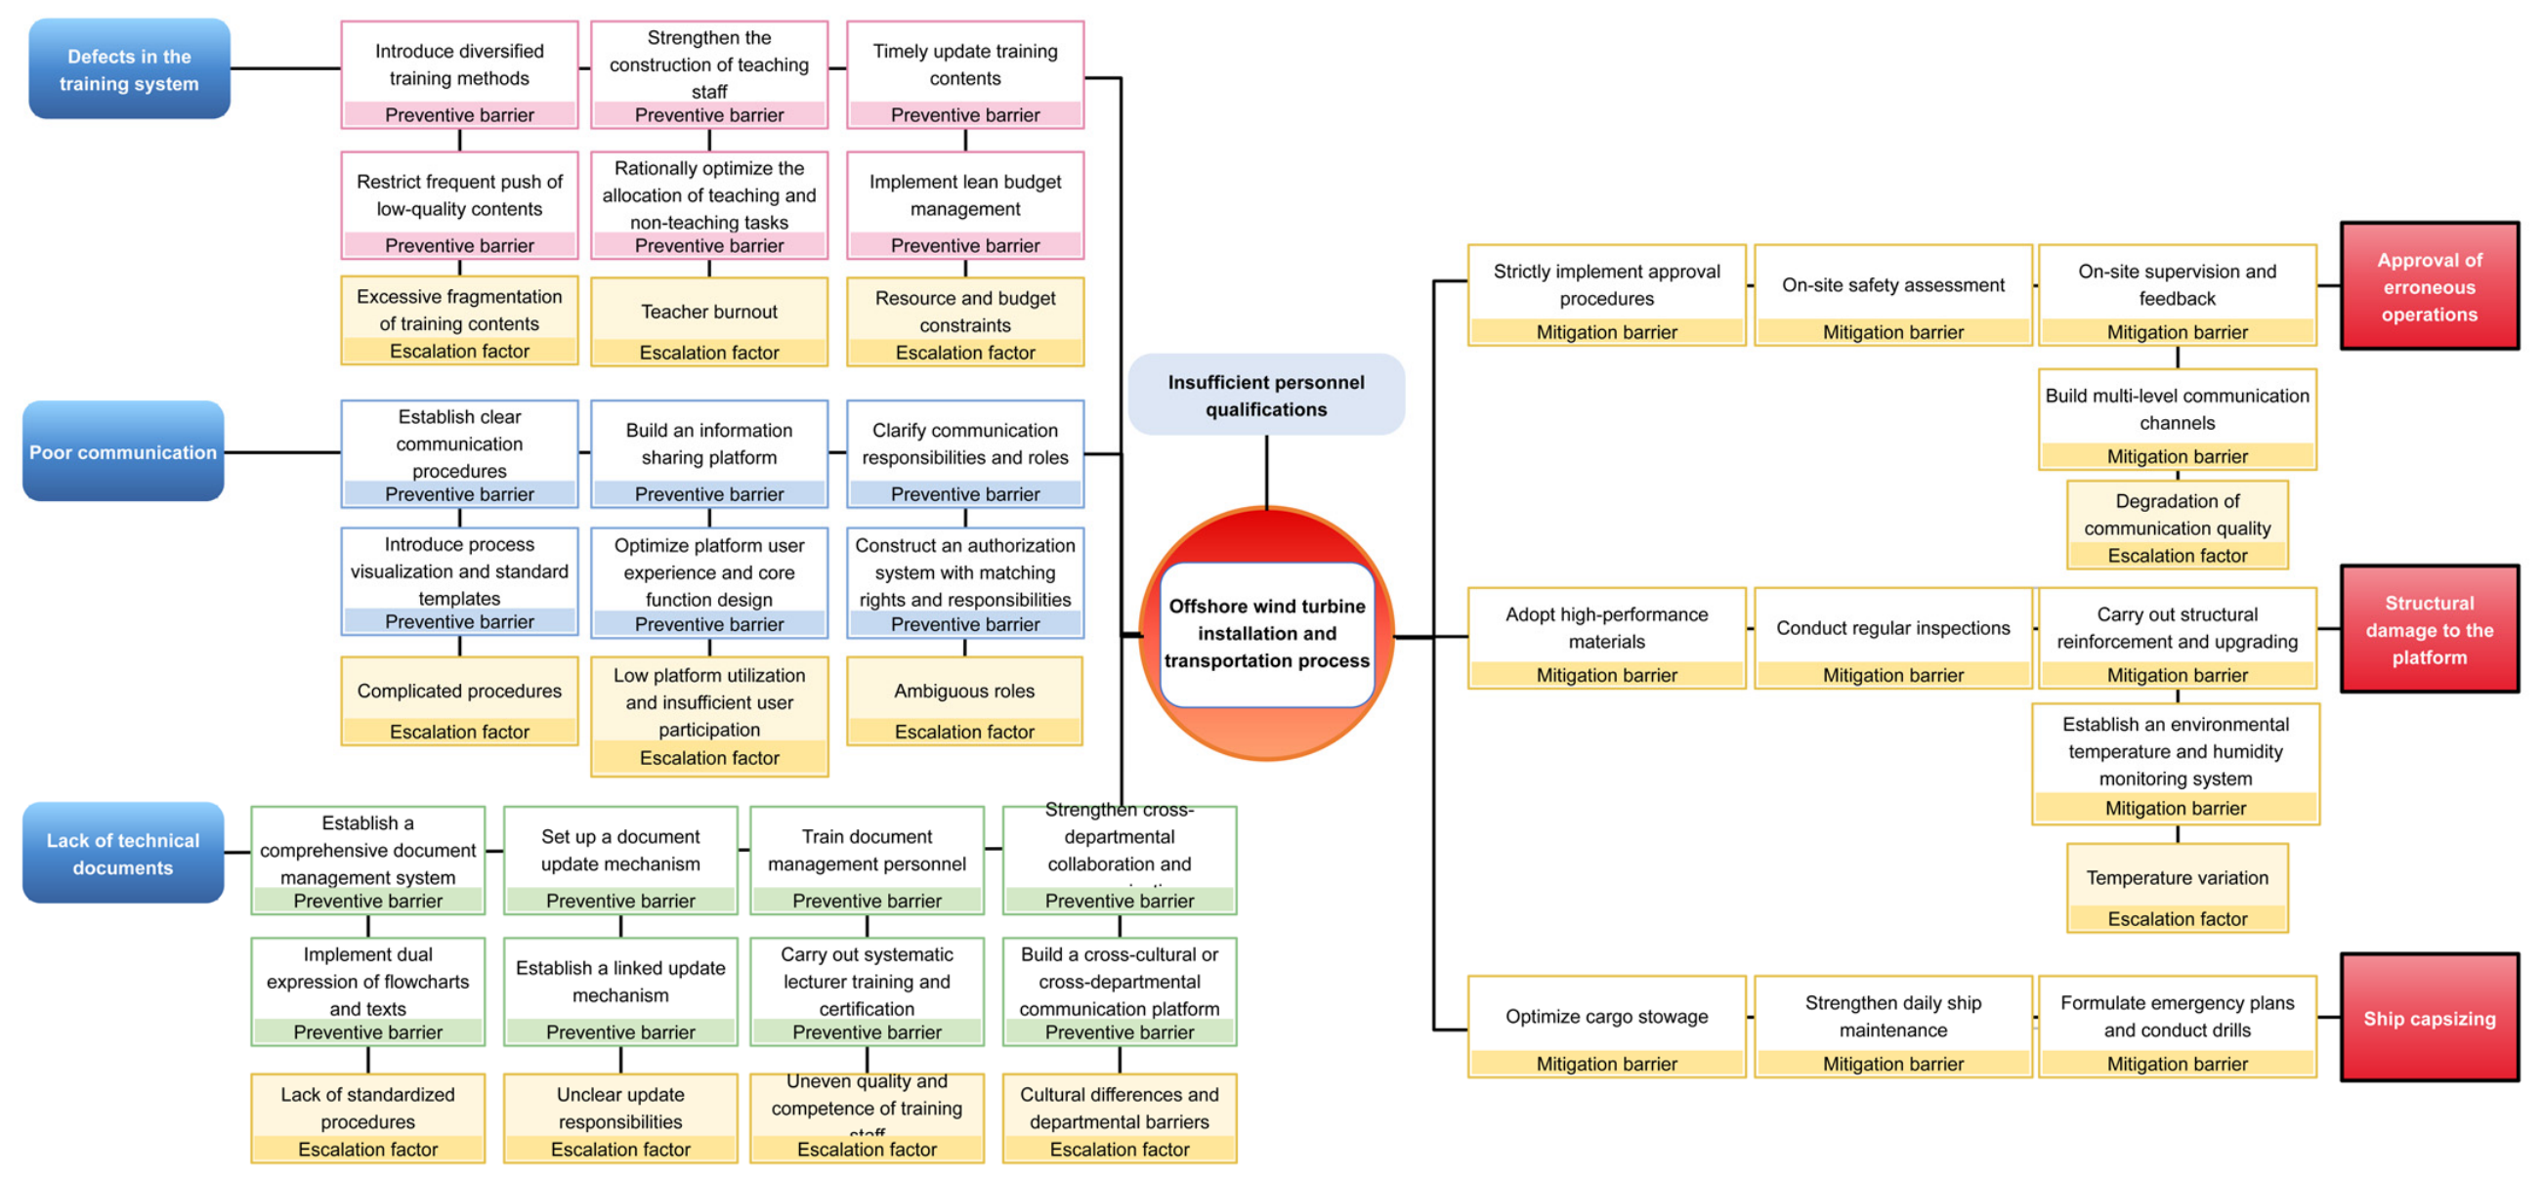
Threat-side hazard factors include: (1) deficiencies in the training system, with barriers consisting of diversified training methods (online courses, VR scenario simulations, expert instruction, and case reviews), the dual-track development of an “theory + practice” teaching staff, and the timely updating of training content in line with changes to standards and equipment; (2) missing technical documentation, with barriers consisting of the establishment of a comprehensive document management system (classification, access permissions, and traceability), a regular document update mechanism, training for document management personnel, and a cross-departmental sharing mechanism to break down information barriers; (3) poor communication, with barriers consisting of clearly defined communication procedures and instruction feedback mechanisms, the development of an information-sharing platform to achieve real-time synchronization of fleet dispatching and weather warnings, and clearly defined communication responsibilities and emergency contact mechanisms.
On the consequence side, the captain’s insufficient understanding of the platform may lead to the erroneous approval of operations, structural damage to the platform, and vessel capsizing. The corresponding mitigative barriers are as follows: for erroneous approval of operations, establish a strict hierarchical approval process with records retained on a digital platform, conduct on-site safety assessments before critical operations, and implement spot checks and feedback by dedicated supervisors; for structural damage to the platform, use high-strength, corrosion-resistant materials at critical load-bearing locations, conduct regular structural inspections and non-destructive testing (ultrasonic and magnetic particle testing), implement structural health monitoring, and reinforce and upgrade aging platforms; for vessel capsizing, optimize cargo stowage plans based on stability calculations and simulations, strengthen routine vessel maintenance, and establish and regularly drill an emergency capsizing response plan. The Bow-Tie barrier model for the captain’s insufficient understanding of the platform is shown in Figure 9.
Figure 9.
Bow-Tie barrier model for the captain’s insufficient understanding of the platform.
4.2.5. Barrier Design for the Aging of Tools
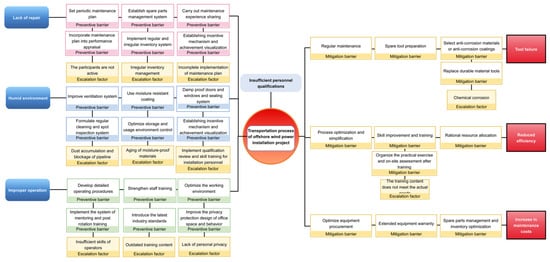
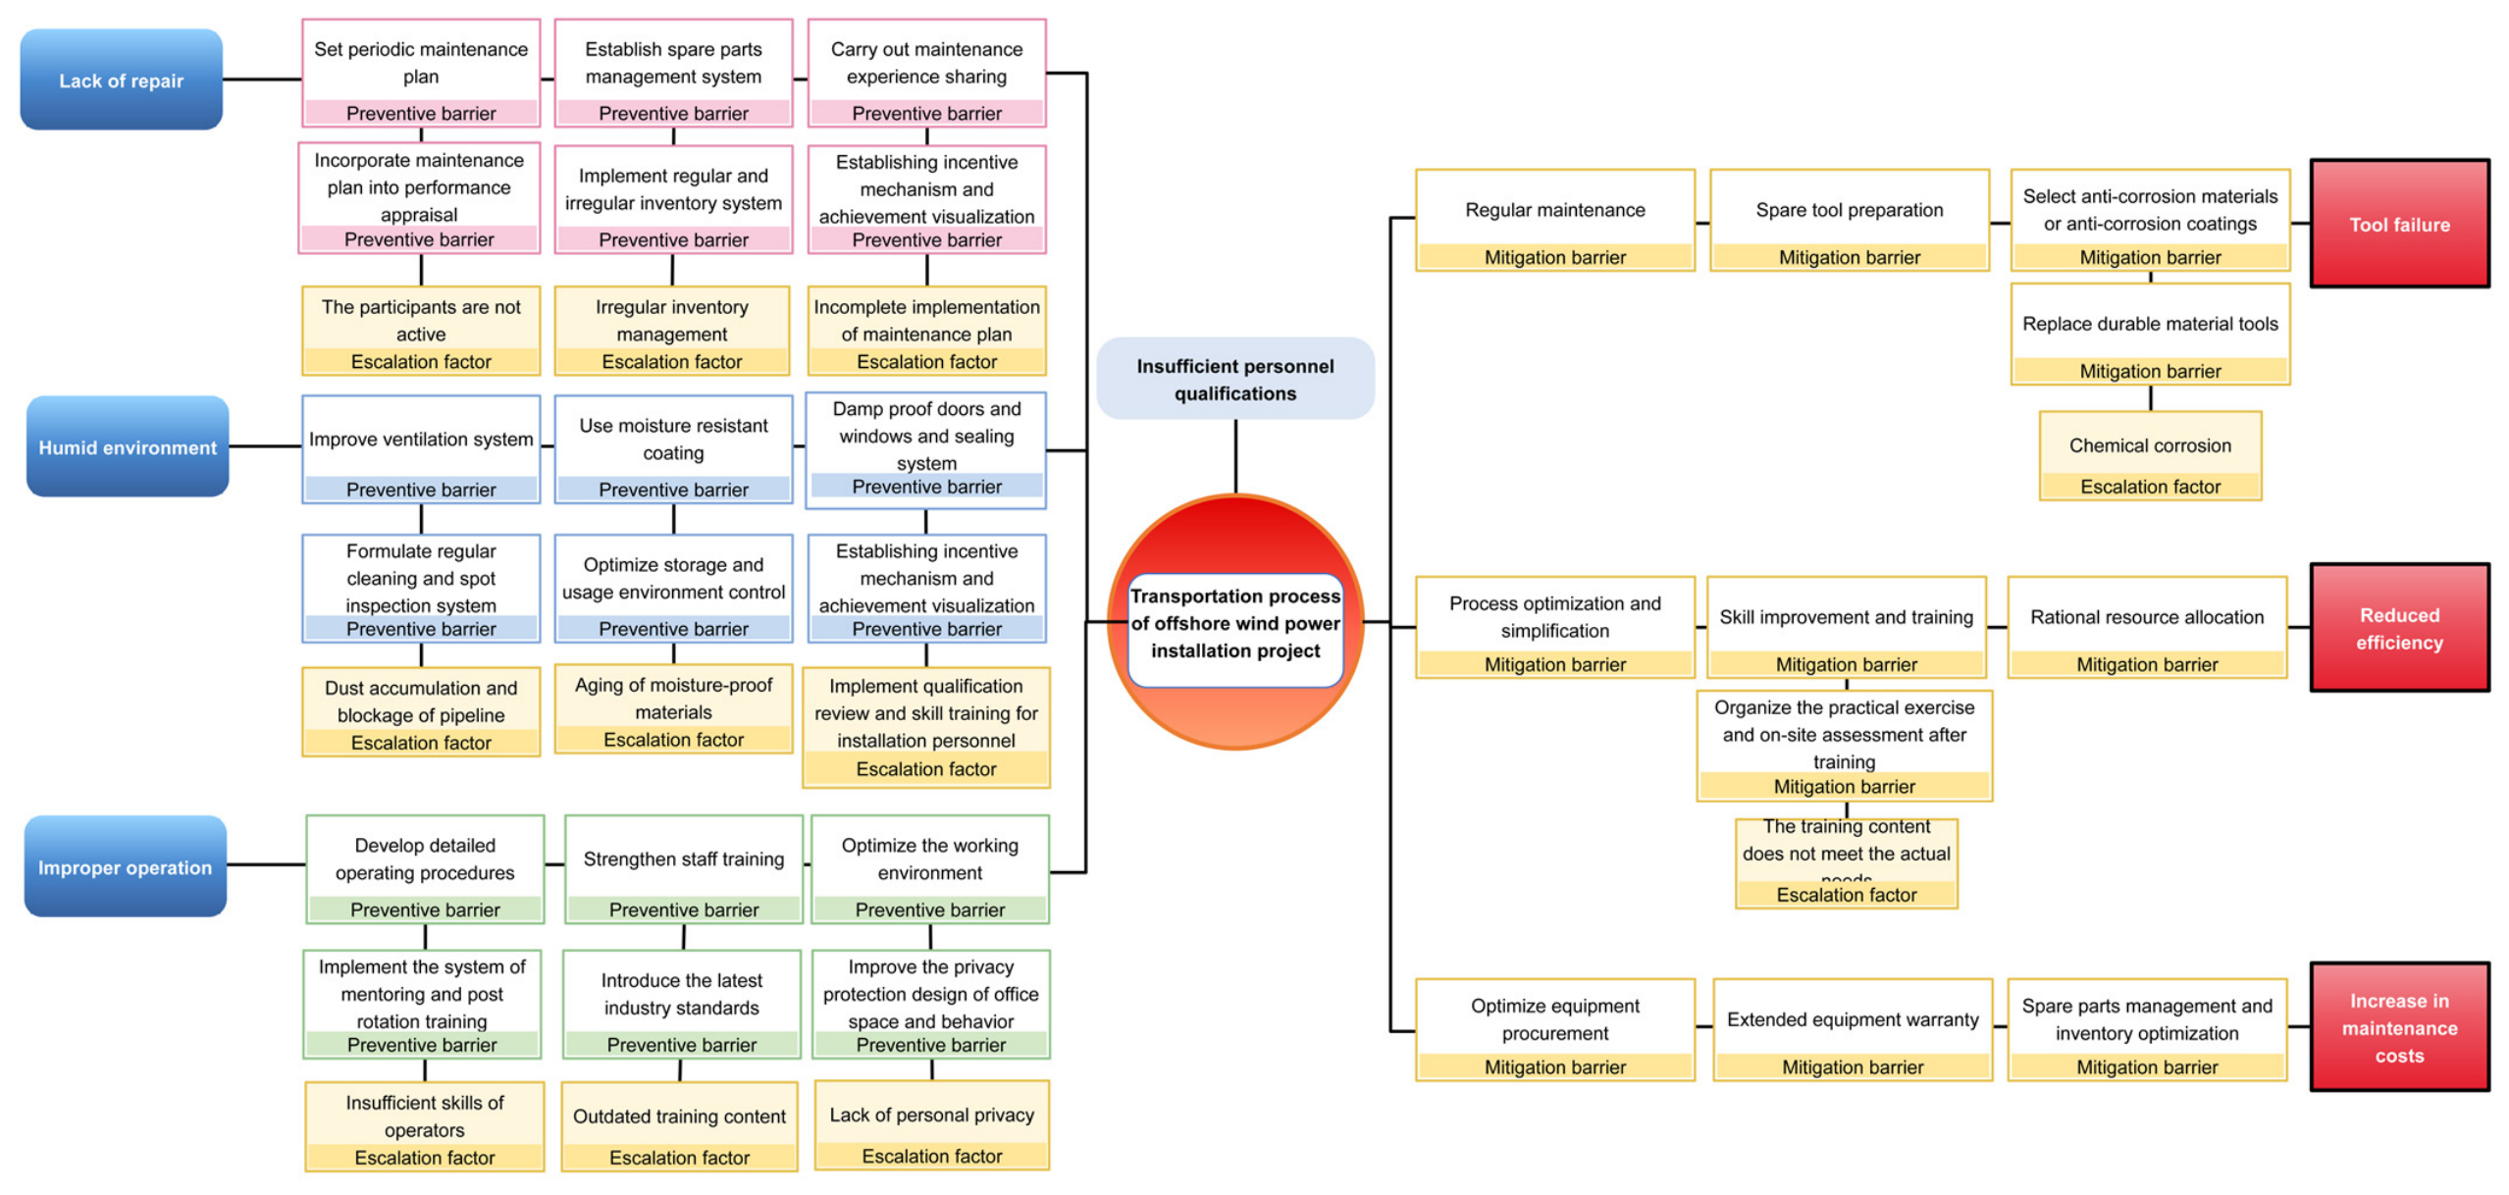
Threat-side hazard factors include: (1) lack of maintenance, with barriers consisting of a regular inspection, servicing, and overhaul system based on operating hours and loads, a spare-parts ledger and procurement warning mechanism, and the sharing of maintenance experience and the establishment of a typical fault case database; (2) a humid environment, with barriers consisting of the renovation of cabins to include forced ventilation and dehumidification, moisture-proof coating and sealing treatment for critical metal components and offshore engineering cable interfaces, and moisture-proof doors, windows, and sealing systems; (3) improper operation, with barriers consisting of the formulation and posting of detailed operating procedures, practical drills and safety education and training assessments, optimization of the operating environment through measures such as improved lighting and anti-slip features, and the establishment of an on-site feedback mechanism.
On the consequence side, tool aging may lead to tool failures, reduced efficiency, and increased maintenance costs. Mitigation barriers include: for tool failures, implementing regular maintenance and servicing, conducting service-life assessments, preparing critical backup tools, and replacing them with corrosion-resistant and wear-resistant tools specifically designed for offshore operations; for reduced efficiency, carrying out process optimization and streamlining (eliminating redundant steps and optimizing loading/unloading sequences and routes), providing skills enhancement training, and dynamically allocating resources; for increased maintenance costs, optimizing equipment procurement at the source (including supplier audits and after-sales support), seeking extended equipment warranty periods, and establishing a scientific spare-parts inventory management system. The Bow-Tie barrier model for tool aging is shown in Figure 10.
Figure 10.
Bow-Tie Barrier Model for Tool Aging.
4.3. Management Implications of the Barrier System
The above Bow-Tie barrier system provides three implications for the safety management of offshore wind power transportation. First, barrier configuration should prioritize human factors. Two of the five key risks are directly attributable to human factors, and their preventive barriers all point to training systems, assessment mechanisms, and experience management. Enterprises should make personnel qualification access, special training for platform captains, and tiered task allocation the core measures of transportation safety management. Second, barrier effectiveness depends on degradation control. Degradation factors such as humid corrosion, inadequate maintenance, and data distortion can systematically weaken barrier effectiveness. Measures such as training-effect databases, spare-parts ledgers, data validation, and third-party reviews must be implemented to maintain barrier functionality and achieve management of “barriers—degradation—control.” Third, quantitative assessment and barrier design should be iterative. BN importance ranking provides targeted guidance for barrier design, while changes in the probabilities of risk factors after barrier implementation can be fed back into the BN model to update its parameters, forming a dynamic risk management cycle of “assessment—prevention and control—reassessment.”
4.4. Limitations of the Study
This study still has certain limitations: first, the prior probabilities of the nodes rely mainly on fuzzy expert assessments, and the sample size of experts is relatively small, which may introduce subjective bias. In the future, historical accident statistics and project operation data can be incorporated to calibrate the probability parameters; second, the BN model is based on a static structural assumption and has difficulty characterizing the dynamic evolution of risks throughout the work process. Subsequently, dynamic BN or system dynamics methods can be introduced to achieve real-time risk assessment throughout the entire operation; third, the effectiveness verification of the Bow-Tie barriers remains at the stage of qualitative analysis; fourth, apart from the local sensitivity analysis reported in Section 3.6, no uncertainty or sensitivity analysis of the network output—to the Noisy-OR assumption, to the expert-weighting scheme or to the network structure—has yet been carried out, so the value of 3.99% is reported as a point estimate; fifth, the model has not been validated against observed accident frequencies or project operating records. In the future, actual project data can be used to compare and validate indicators such as error rates and accident rates before and after barrier implementation, while also exploring the optimized allocation of barrier costs and benefits.
4.5. Organisational Factors, Safety Culture and Subcontractor Governance
The criticality results place two human factors and one equipment factor at the top of the ranking, which should not be read as evidence that organisational factors are unimportant; the five management factors entered the model with comparatively low elicited prior probabilities. Because these factors are, in the judgement of the authors, the mechanisms through which most human and equipment failures are enabled or prevented, they are analysed here qualitatively. The two evacuation-related factors represent the visible end of a chain of coordination and communication failures: late or ambiguous dissemination of weather warnings, an unclear division of responsibility at the vessel-shore interface, and decision latency among the owner, the contractor, the vessel operator and the subcontracted crew each delay the decision to suspend operations. Safety culture, training and subcontractor governance should likewise not be treated as independent, since subcontracting dilutes accountability at the point of highest exposure. It follows that the preventive barriers designed in Section 4.2 are organisational controls rather than static technical devices, whose effectiveness depends on continued organisational maintenance.
4.6. Barrier Dynamics, Degradation and Organisational Embedding
The Bow-Tie models identify escalation factors and configure degradation control measures, but they present barrier degradation as a design category rather than as a process that unfolds in time. Three properties of the barrier set deserve explicit statement. First, barriers that are performed by people are only as reliable as the staffing level, the competence of the individual concerned, and the supervisory attention they receive; under schedule pressure, the first measures to be relaxed are typically those whose absence produces no immediate visible consequence, which is precisely the class to which most preventive barriers belong. Second, degradation is often silent: the dominant mechanisms differ between the five key risks, but in each case, the barrier continues to appear present after it has ceased to function effectively, which is why the escalation control measures are specified as auditable records rather than declarative commitments. Third, each Bow-Tie model should be treated as a living document, revised when a new accident or near-miss occurs, when vessel or equipment configuration changes, when standards are updated, or when the network parameters change materially. The pathway from barrier implementation back to the network parameters is defined but has not been validated in service; the framework is therefore sequential rather than closed, and the term closed-loop is used only where it describes the internal operation of the barrier-degradation control loop.
5. Conclusions
This paper focuses on the transportation stage of offshore wind power installation projects and proposes and applies an integrated risk analysis and barrier design framework based on BN and Bow-Tie models. The main conclusions are as follows:
- (1)
- A transportation risk evaluation index system and BN evaluation model were established, covering 30 factors across five dimensions: people, equipment, technology, environment, and management. By integrating triangular fuzzy weighted expert assessment with the Noisy-OR gate model, the difficulty of obtaining network parameters under conditions of data scarcity was addressed, thereby enabling the quantitative assessment of transportation risks.
- (2)
- The quantitative assessment results show that the overall risk probability during the transportation stage is 3.99%. Both the risk probability level and the risk loss level are Level II, while the comprehensive safety risk level is Level 3, assigned conservatively one level above the matrix cell for a probability level of II combined with a loss level of II, indicating the need for targeted improvement measures. The ranking of critical importance places insufficient personnel qualifications and equipment design risk first and second. The people and equipment dimensions are the weak points in transportation safety control. When the three key factors occur in combination, the accident risk probability rises to 27.6%, an absolute increase of 23.61 percentage points, corresponding to a factor of approximately 6.9, highlighting the importance of severing the coupling chain among key factors.
- (3)
- Guided by the importance ranking, a Bow-Tie barrier system was constructed for the five key risk factors. Preventive barriers on the threat side, mitigation barriers on the consequence side, and degradation control measures were systematically designed, forming a sequential pathway of “quantitative assessment—identification of key factors—barrier design.” This can provide a theoretical basis and practical tool for proactive risk prevention and control as well as safety management decision-making in offshore wind power transportation. Subsequent research will calibrate the model parameters using historical accident data, introduce dynamic inference methods to characterize risk evolution, and conduct empirical tests of barrier effectiveness.
Author Contributions
Conceptualization, M.P. and D.Y.; methodology, W.Z.; software, K.X.; validation, K.X., D.Y. and C.Z.; formal analysis, M.P.; investigation, Y.Y. and W.Z.; resources, Y.Y.; data curation, M.P. and C.Z.; writing—original draft preparation, K.X.; writing—review and editing, D.Y.; visualization, Y.Y.; supervision, M.P. and D.Y.; project administration, M.P.; funding acquisition, D.Y. All authors have read and agreed to the published version of the manuscript.
Funding
This research was funded by the “Pioneer” and “Leading Goose” R&D Program of Zhejiang (2024C04049), the Zhejiang Emergency Management Research and Development Project (2024YJ025), and the Central-Guided Local S&T Development Fund of Zhejiang Province (2025ZY01079).
Data Availability Statement
The primary data used to support the findings of this study are available from the corresponding author upon request.
Conflicts of Interest
Authors Moyu Pan, Wei Zhao and Caigui Zhou are employed by the company Power China Northwest Engineering Corporation Limited. The remaining authors declare that the research was conducted in the absence of any commercial or financial relationships that could be construed as a potential conflict of interest.
References
- Li, W.; Liang, Y.; Liu, L. Assessment of carbon reduction potential for China’s energy transition under the dual carbon target. Energy Clim. Change 2026, 7, 100243. [Google Scholar] [CrossRef] [Scilit]
- Global Wind Energy Council. Global Wind Report 2023; Global Wind Energy Council: Brussels, Belgium, 2023; Available online: https://gwec.net/globalwindreport2023/ (accessed on 26 October 2026).
- National Development and Reform Commission of the People’s Republic of China. The 14th Five-Year Plan for National Economic and Social Development of the People’s Republic of China and the Outline of the 2035 Long-Range Goals; National Development and Reform Commission: Beijing, China, 2021. Available online: https://www.gov.cn/xinwen/2021-03/13/content_5592681.htm (accessed on 26 October 2026).
- Cappellari, M.; Lorenzoni, A.; Turolla, A.; Zampato, M.; Scalco, E. Floating offshore wind generation: Where could we go? Present framework of challenges and future developments for Italy and Europe. Ocean Eng. 2026, 343, 123216. [Google Scholar] [CrossRef] [Scilit]
- Wu, J.; Guedes Soares, C. Multi-dimensional resilience modelling framework for offshore wind farms under operational and extreme disruptions. Renew. Sustain. Energy Rev. 2026, 230, 116667. [Google Scholar] [CrossRef] [Scilit]
- Li, J.; Lian, J.; Guo, Y.; Wang, H. Concept design and floating installation method study of multi-bucket foundation floating platform for offshore wind turbines. Mar. Struct. 2024, 93, 103541. [Google Scholar] [CrossRef] [Scilit]
- Seo, J.H. Floating offshore substations for offshore wind energy: A review of design challenges, structural integrity, and standardisation gaps. Ocean Eng. 2026, 363, 126528. [Google Scholar] [CrossRef] [Scilit]
- Sharman, K.T.; Koop, A.; Bouman, G.; de Ridder, E.-J. Critical review and recommendations for scaled model testing of floating offshore wind turbines. Renew. Sustain. Energy Rev. 2026, 241, 117249. [Google Scholar] [CrossRef] [Scilit]
- He, W.; Li, C.; Zheng, S.; Zhou, S.; Liu, S.; Ou, J. Structural design and optimization of a novel semi-submersible floating offshore wind turbine platform using reinforced concrete. Ocean Eng. 2026, 346, 123951. [Google Scholar] [CrossRef] [Scilit]
- Wen, X.; Yin, G.; Liu, T.; Ong, M.C.; Wang, C.; Wang, K. An optimization framework for mooring design of floating offshore wind turbines using a genetic algorithm based on a surrogate model. Renew. Energy 2025, 245, 122807. [Google Scholar] [CrossRef] [Scilit]
- Qi, J.; He, P.; Wang, C.; Qi, W.; Shen, X.; Liang, F. From shallow to deep water: A review of scour and its impacts on floating wind turbines. Marit. Eng. 2026, 179, 78–98. [Google Scholar] [CrossRef] [Scilit]
- Rehman, S.; Zayed, M.E.; Syed, A.H.; Ghazy, M.; Irshad, K.; Al-Shaikhi, A.; Mohandes, M.A.; Alhems, L.M. Assessment of offshore wind power potential in Saudi Arabia’s Red Sea: Insights into fixed-bottom and floating offshore technologies. Results Eng. 2026, 29, 108626. [Google Scholar] [CrossRef] [Scilit]
- Yu, Z.; Xu, Z.; Chen, Y.; Walmsley, T.G.; Chen, L.; He, Y.; Tao, H.; Wang, B. Power generation and utilization in deep-sea offshore wind integrated energy systems: A review. Energy Convers. Manag. X 2026, 31, 102169. [Google Scholar] [CrossRef] [Scilit]
- Zhang, J.; Hou, Y.; Wang, Y.; Li, C.; Liu, S. Safety risk assessment of an offshore integrated wind-solar-storage hydrogen energy system—An improved hybrid analysis framework combining STPA and FRAM. Int. J. Hydrogen Energy 2026, 262, 156841. [Google Scholar] [CrossRef] [Scilit]
- Zhou, C.H.; Liu, X.; Gan, L.X.; Zheng, Y.Z.; Zhong, Q.Y.; Ge, K.L.; Zhang, L. Assessment and countermeasures for offshore wind farm risks based on a dynamic Bayesian network. J. Environ. Prot. 2018, 9, 368–384. [Google Scholar] [CrossRef][Green Version]
- Shafiee, M. A fuzzy analytic network process model to mitigate the risks associated with offshore wind farms. Expert Syst. Appl. 2015, 42, 2143–2152. [Google Scholar] [CrossRef] [Scilit]
- Bhardwaj, U.; Guedes Soares, C. A Bayesian network framework for evidence-based risk analysis of offshore wind turbines. Ocean Eng. 2026, 349, 124162. [Google Scholar] [CrossRef] [Scilit]
- Liu, B.; Jin, W.; Zhao, J.; Zhang, Q.; An, W. Research on risk assessment techniques of offshore wind power projects during operation period. IOP Conf. Ser. Earth Environ. Sci. 2021, 766, 012023. [Google Scholar] [CrossRef] [Scilit]
- Zhang, J.; Kang, J.; Sun, L.; Bai, X. Risk assessment of floating offshore wind turbines based on fuzzy fault tree analysis. Ocean Eng. 2021, 239, 109859. [Google Scholar] [CrossRef] [Scilit]
- Garcia Munoz, N.; Lange, A.-K.; Kaczenski, J.; Wiggert, M. Development of a risk analysis model for the installation of offshore wind farms. J. Phys. Conf. Ser. 2023, 2626, 012042. [Google Scholar] [CrossRef] [Scilit]
- Yang, D.; Huang, X.; Xie, B.; Ding, Z.; Zheng, J.; Wang, J. Multidimensional causation chain analysis of marine oil spill accidents: Based on grounded theory and bow-tie model. Ocean Eng. 2025, 341, 122824. [Google Scholar] [CrossRef] [Scilit]
- Kirchsteiger, C. Towards harmonising risk-informed decision making: The ARAMIS and COMPASS projects. J. Loss Prev. Process Ind. 2002, 15, 199–203. [Google Scholar] [CrossRef] [Scilit]
- Gatzert, N.; Kosub, T. Risks and risk management of renewable energy projects: The case of onshore and offshore wind parks. Renew. Sustain. Energy Rev. 2016, 60, 982–998. [Google Scholar] [CrossRef] [Scilit]
- Kandemir, I. Latent educational risks in maritime training: A hybrid Bayesian network SCBA case study. Ocean Eng. 2026, 365, 127478. [Google Scholar] [CrossRef] [Scilit]
- Onisawa, T. An approach to human reliability in man-machine systems using error possibility. Fuzzy Sets Syst. 1988, 27, 87–103. [Google Scholar] [CrossRef] [Scilit]
- Aust, J.; Pons, D. A systematic methodology for developing Bowtie in risk assessment: Application to borescope inspection. Aerospace 2020, 7, 86. [Google Scholar] [CrossRef] [Scilit]
- Djemai, Z.; Aissani, N.; Bekrar, A.; Lounis, Z. Risk analysis of petroleum storage tank based on uncertain data incorporated into mapped Bow-tie to Bayesian network. Process Saf. Environ. Prot. 2024, 190, 1202–1221. [Google Scholar] [CrossRef] [Scilit]
- Zhang, B. Analytic Hierarchy Process and Its Application Cases; Publishing House of Electronics Industry: Beijing, China, 2014. (In Chinese) [Google Scholar]

Disclaimer/Publisher’s Note: The statements, opinions and data contained in all publications are solely those of the individual author(s) and contributor(s) and not of MDPI and/or the editor(s). MDPI and/or the editor(s) disclaim responsibility for any injury to people or property resulting from any ideas, methods, instructions or products referred to in the content. |
© 2026 by the authors. Licensee MDPI, Basel, Switzerland. This article is an open access article distributed under the terms and conditions of the Creative Commons Attribution (CC BY) license.