


Abstract
The increasing demand for sustainable mobility solutions requires the evaluation of traffic management strategies that can accommodate changing travel demand while maintaining acceptable operational and environmental performance. This study investigates the effects of implementing a woonerf-type shared-space concept on vehicle fuel consumption and carbon monoxide (CO) emissions using microscopic traffic simulation. The analysis was conducted for Morska Street in Rewa, a small coastal tourist village in northern Poland characterized by substantial seasonal variations in traffic demand, intensive pedestrian activity, high parking demand, and interactions between different transport modes. Four simulation scenarios were developed using PTV Vissim 2026 with the Viswalk module, representing the existing traffic organization and the proposed woonerf solution under typical and increased tourist traffic conditions. The models incorporated vehicle trajectories, pedestrian interactions, parking search behavior, and public transport operations to provide an integrated representation of local traffic conditions. The results indicate that the implementation of the woonerf-type solution did not result in deterioration of traffic performance or increased environmental impacts. Under comparable traffic demand conditions, differences in fuel consumption and CO emissions between the existing and proposed configurations remained below 2%. Under increased tourist traffic intensity, the woonerf scenario resulted in slightly lower fuel consumption and pollutant emissions compared with the existing street configuration. The findings indicate that a shared-space solution can be implemented in a small tourist settlement without increasing vehicle-related environmental impacts or adversely affecting traffic performance. The study also demonstrates that microscopic traffic simulation can serve as an effective decision-support tool for assessing sustainable mobility interventions and their environmental implications before physical implementation.
1. Introduction
Contemporary urban streets are increasingly expected to perform multiple functions simultaneously. In addition to providing mobility and access, streets constitute important public spaces that support social interaction, recreation, commercial activities, and everyday life. This multifunctionality challenges the traditional approach to street design, in which the primary objective was to provide efficient and safe movement of motor vehicles. In response to these changes, alternative approaches have emerged that seek to rebalance the relationship between mobility and the social and environmental functions of urban streets. One of the most prominent examples is the woonerf concept, which represents a fundamental shift from conventional traffic-oriented street design towards a more integrated form of public-space planning.
The term woonerf originates from the Netherlands and is commonly translated as a “living street” or “living yard”. The concept emerged during the 1960s and 1970s as a response to the increasing dominance of motorized traffic in residential neighborhoods. Rather than completely separating pedestrians and vehicles, the woonerf concept integrates different road users within a common spatial environment while reducing vehicle speeds and increasing the importance of social and residential functions. Consequently, motor vehicles no longer constitute the dominant element determining the spatial organization of the street. The woonerf can therefore be understood not simply as a traffic-calming measure, but as a broader transformation of the functional and spatial role of the urban street.
The emergence of woonerfs was closely related to a broader criticism of modernist approaches to urban planning. Jacobs emphasized the importance of streets as places of social life, interaction, and informal surveillance [1], while Appleyard demonstrated the negative relationship between increasing motor traffic and the quality of residential life [2]. Similarly, Gehl argued that streets and public spaces should be designed not only to facilitate movement but also to support activities such as staying, observing, talking, and socializing. These theoretical foundations provide an important basis for understanding the woonerf as an urban design intervention rather than solely a traffic-management measure. The concept subsequently evolved into related approaches, including Home Zones in the United Kingdom and various forms of shared space and shared streets. Biddulph described Home Zones as an adaptation of the Dutch woonerf concept to British residential environments [3,4], while Karndacharuk et al. identified woonerf and shared-space environments as important stages in the broader evolution from traffic-oriented street design towards integrated public-space planning [5].
The literature therefore suggests two complementary interpretations of the woonerf. The first treats it primarily as a traffic-calming intervention intended to reduce vehicle speeds and improve road safety. The second considers it a public-space intervention that modifies the functional hierarchy of the street and promotes interaction among different road users. This distinction is particularly important when considering environmental performance. The environmental consequences of a woonerf cannot be evaluated solely using conventional traffic indicators such as average speed or traffic volume. Changes in street geometry and spatial organization may simultaneously affect vehicle trajectories, acceleration and deceleration patterns, pedestrian activity, parking behavior, traffic distribution, and, consequently, transport-related energy consumption and emissions. Traffic calming constitutes one of the principal functional dimensions of woonerf design. Conventional traffic-calming measures include speed humps, raised intersections, chicanes, lane narrowing, horizontal deflections, gateways, and changes in road surface. In woonerf environments, these measures are typically combined with spatial interventions such as street furniture, vegetation, parking arrangements, and modifications to the visual definition of the carriageway. The underlying principle is that vehicle speed should be influenced not only by regulatory measures but also by the physical and psychological characteristics of the street.
Hamilton-Baillie argued that shared-space environments can encourage drivers to adopt more cautious behavior because conventional visual cues associated with vehicle priority are reduced [6]. Instead of creating an unambiguous road environment designed primarily for high-speed vehicle movement, shared space introduces a greater degree of uncertainty and requires road users to negotiate their movements with one another. Empirical evidence indicates that such interventions can effectively reduce vehicle speeds. Biddulph, in an analysis of 14 English Home Zones, reported lower vehicle speeds and improvements in perceived safety [3]. Polish research has similarly demonstrated that the spatial configuration of parking can influence vehicle speeds in home-zone environments. In particular, the arrangement of parked vehicles may modify the perceived width of the carriageway and consequently influence the speed selected by drivers.
However, the relationship between traffic calming and environmental performance is considerably more complex than the relationship between traffic calming and vehicle speed. A reduction in average speed does not necessarily translate into lower fuel consumption or reduced pollutant emissions. Vehicle emissions are strongly influenced by acceleration, deceleration, engine operating conditions, and stop-and-go behavior. Consequently, an intervention that reduces average speed while simultaneously increasing the frequency of acceleration and braking may produce ambiguous or even adverse environmental effects.
This issue has been demonstrated in both empirical and simulation-based studies of traffic-calming measures. Kyoungho et al. showed that aggressive acceleration associated with traffic calming can increase fuel consumption and emissions, whereas eliminating sharp acceleration maneuvers can produce substantial environmental benefits [7]. This observation is particularly relevant to woonerfs because their spatial configuration deliberately modifies vehicle trajectories. Horizontal deflections, carriageway narrowing, parking maneuvers, pedestrian interactions, and informal priority negotiations may result in highly variable driving cycles. Consequently, the environmental performance of a woonerf should be assessed using detailed vehicle trajectories rather than average speed alone.
1.1. Microscopic Modelling of Shared-Space Environments
The complex interactions occurring in shared-space environments create a substantial modelling challenge. Conventional traffic microsimulation models were primarily developed for relatively structured traffic environments in which lanes, priorities, and traffic rules are explicitly defined. Shared-space environments differ considerably from such settings because pedestrians, cyclists, and vehicles may occupy the same spatial area and dynamically negotiate priority.
Anvari et al. developed a microscopic model specifically for shared-space environments [8]. Their framework combined route planning, an extended Social Force Model, and rule-based conflict resolution to reproduce interactions between pedestrians and vehicles. The model was calibrated using empirical trajectory data from New Road in Brighton, United Kingdom. The results demonstrated that the proposed approach could reproduce heterogeneous pedestrian–vehicle interactions and could potentially be used to evaluate alternative street designs. A related approach was developed by Rinke et al., who proposed a multi-layer Social Force approach for modelling interactions between pedestrians, cyclists, and vehicles [9]. Their framework explicitly addressed collision avoidance and the dynamic nature of interactions occurring in shared spaces.
The importance of calibration and validation has subsequently been emphasized in studies comparing simulated behavior with observed trajectories. This issue is particularly important in environmentally oriented analyses because relatively small differences in acceleration, braking, yielding, or interaction behavior may significantly affect estimated energy consumption and emission levels. More recent research has expanded the modelling framework towards agent-based approaches. Johora proposed a general model for pedestrian–vehicle [10].
The literature therefore demonstrates that microscopic simulation can be used to represent the complex behavioral characteristics of shared spaces. Nevertheless, most existing research has concentrated on mobility, safety, and pedestrian–vehicle interaction, while substantially less attention has been given to the energy consumption and pollutant emissions resulting from these interactions.
1.2. Microsimulation and Environmental Performance
PTV Vissim provides sophisticated representations of vehicle behavior, pedestrian movement, and conflict areas. However, its fundamental traffic logic was developed primarily for relatively structured road environments. Modelling shared-space environments therefore requires additional assumptions concerning priority, yielding, pedestrian interaction, and vehicle trajectory selection. Research examining the application of microsimulation to shared-space environments has shown that adaptations may be necessary because conventional microsimulation platforms do not provide a dedicated mechanism for representing all characteristics of shared space.
One possible approach is to use conflict areas and modified priority rules to reproduce pedestrian–vehicle interactions. This issue has direct implications for woonerf modelling. A model may reproduce aggregate traffic flow characteristics while failing to reproduce the behavioral characteristics that are fundamental to a woonerf. Such discrepancies may result in unrealistic acceleration and deceleration profiles and consequently propagate into fuel-consumption and emission calculations.
For environmentally oriented studies, model validation should therefore not be restricted to traffic volume and travel time. Ideally, the validation process should include vehicle speed distributions, acceleration and deceleration distributions, stop frequency, travel time, queue length, pedestrian–vehicle interactions, and vehicle trajectories. Such a multidimensional validation approach is particularly important when the objective is to estimate environmental indicators that depend on second-by-second vehicle behavior.
Research on traffic-calming measures has demonstrated the importance of integrating microscopic traffic simulation with emission modelling. Lee et al. developed a framework for evaluating traffic-calming measures using traffic microsimulation and emission modelling [11]. Their analysis included measures such as speed humps, speed tables, and chicanes and demonstrated that the environmental effects of traffic calming cannot be inferred solely from changes in vehicle speed. Ghafghazi and Hatzopoulou further demonstrated the importance of combining microscopic traffic simulation, emission modelling, and dispersion modelling [12]. Their study investigated isolated and area-wide traffic-calming schemes in a dense urban neighborhood. The simulated changes in NOx emissions were substantially larger than the corresponding changes in ambient NO2 concentrations: NOx emissions varied by approximately 5–160%, whereas average NO2 concentrations changed by approximately 0.1–10%. Speed bumps produced some of the largest increases in simulated NO2 concentrations.
These findings demonstrate an important methodological distinction between vehicle-level emissions and ambient air quality. Changes in exhaust emissions cannot be interpreted directly as equivalent changes in ambient pollutant concentrations because atmospheric dispersion is influenced by meteorological conditions, street geometry, building configuration, and wind direction. Therefore, environmental assessments of woonerfs should clearly distinguish between changes in vehicle emissions and changes in ambient pollutant concentrations.
1.3. Driving Cycles, Energy Consumption, and Emissions
The environmental implications of speed reduction depend strongly on the resulting driving cycle. Although lower vehicle speeds may reduce energy consumption under some operating conditions, repeated braking and acceleration may increase fuel consumption and emissions. This issue is particularly relevant to woonerfs because their geometric characteristics may generate repeated changes in vehicle speed.
Recent microscopic modelling studies reinforce this conclusion. Hu et al. investigated the effect of speed humps on instantaneous emissions using a microscopic traffic-flow model with limited deceleration capacity [13]. Their simulations demonstrated that increasing the number of speed humps can increase CO2, NOx, and particulate emissions under free-flow conditions, with the magnitude of the effect depending on traffic density and vehicle dynamics. Similarly, research on speed humps has demonstrated that the environmental consequences of traffic-calming measures depend on the detailed characteristics of the driving cycle rather than simply on posted or average speed.
These findings are highly relevant to woonerf design. A woonerf that successfully maintains a low average speed may nevertheless generate a relatively large number of acceleration and braking events. Conversely, a design that achieves moderate speed reduction while maintaining smoother vehicle trajectories may potentially provide better environmental performance. Speed alone should therefore be regarded as an insufficient indicator of the environmental effectiveness of a woonerf.
Road-transport energy consumption is directly related to vehicle operating conditions, including speed, acceleration, vehicle mass, road gradient, and stop frequency. Microscopic simulation provides an important methodological advantage because it can reproduce the trajectory of each simulated vehicle. These trajectories can subsequently be coupled with fuel-consumption and emission models. The resulting modelling chain can be conceptualized as: street geometry → traffic demand → vehicle trajectories → speed and acceleration → fuel consumption → pollutant emissions.
This approach has been applied in research on traffic-calming measures and urban traffic management. For example, Qi et al. demonstrated that second-by-second vehicle trajectory data can be combined with microscopic energy and emission models to evaluate environmental impacts. The same methodological framework can be applied to woonerf environments. Instead of treating a woonerf as a binary intervention, microsimulation can represent alternative geometric and operational configurations and evaluate their respective energy and emission implications. This creates the possibility of identifying environmentally preferable woonerf configurations rather than simply determining whether woonerfs are environmentally beneficial or detrimental.
1.4. Spatial Redistribution of Environmental Effects
Recent studies of larger-scale urban interventions provide additional support for integrating microsimulation with environmental assessment. Nguyen et al. used SUMO/SUMOPy to develop a microscopic door-to-door simulation of superblocks in Bologna, Italy [14]. The model represented individual vehicles and travelers and incorporated an emission model based on HBEFA. Fuel consumption, CO, CO2, and particulate emissions were estimated for alternative network configurations. The authors reported substantial reductions in several emission indicators within the simulated superblock areas, while effects on surrounding roads were also considered.
Although superblocks differ fundamentally from woonerfs in terms of spatial scale and implementation, both interventions share an important principle: the reallocation of street space and modification of motor-vehicle movement. Consequently, their environmental effects should not necessarily be evaluated exclusively within the physical boundaries of the intervention.
A related research stream concerns Low Traffic Neighborhoods (LTNs). These interventions reduce or eliminate through traffic on selected residential streets, potentially improving local environmental conditions while redistributing traffic to surrounding roads. Recent modelling evidence from five LTNs in London reported small average reductions in NO2 and PM2.5 within intervention areas, while no average increase in pollution was observed on boundary roads. Nevertheless, the overall environmental effect was found to be relatively small at the scale of the interventions considered.
This research introduces an important consideration for woonerf assessment: the spatial redistribution of environmental impacts. A woonerf may reduce traffic and associated emissions on the treated street while potentially redirecting traffic towards adjacent streets. Therefore, evaluating only the intervention area may provide an incomplete picture of its environmental consequences. A comprehensive assessment should distinguish between: (i) direct effects within the woonerf, (ii) effects on immediately adjacent streets, and (iii) network-wide effects.
1.5. Current State of Research on Woonerfs and Shared-Space Modelling
Recent research on woonerfs and shared-space streets increasingly focuses on the interaction between transport functions, public-space quality, and the behavior of different street users. Although woonerfs are primarily associated with integrated street design and the prioritization of pedestrians and social activities, their operational complexity has encouraged the development of analytical and simulation-based methods for evaluating design alternatives. The literature published between 2021 and 2026 indicates growing interest in microscopic traffic simulation, agent-based modelling, virtual reality, and empirical assessments of the built environment.
An important contribution to this field is the study by Slack-Smith et al., who proposed the Integrated Pedestrian–Vehicle Model (IPVM), combining social force models, car-following models, and collision-avoidance algorithms [15]. The framework addresses interactions between pedestrians and vehicles in environments without conventional physical separation. It also considers activity areas and pedestrian route choices, extending the analytical perspective beyond traffic movement alone. Nevertheless, the authors identify the need for further empirical calibration and validation before the framework can be applied reliably to real-world shared-space projects. Agent-based modelling has also been investigated as a means of assessing shared-space networks and representing the influence of perceived safety on transport choices [16]. Complementary research using virtual reality has examined how street configuration affects the perceptions of pedestrians and drivers, demonstrating the relevance of human-centered evaluation in shared-space design [17].
Research focused specifically on woonerfs complements these simulation-based approaches by examining environmental quality and user experience. For example, empirical investigations of Dutch woonerfs have considered perceived tranquility, acoustic conditions, and visual characteristics, illustrating the importance of integrating environmental indicators into street assessment [18]. Studies of Polish examples, including the woonerf on Traugutta Street in Łódź, have additionally explored spatial quality, patterns of use, and the relationship between urban design and public-space functions [19]. These studies provide useful evidence for defining evaluation criteria, although they do not necessarily constitute predictive simulation models.
Microscopic traffic simulation provides an additional methodological perspective for investigating woonerfs, particularly when evaluating alternative street layouts and their effects on multimodal traffic interactions. PTV Vissim is a widely used simulation environment for analyzing vehicle movements, traffic operations, and interactions between different transport modes. When combined with PTV Viswalk, it can also represent pedestrian movement and interactions between pedestrians and vehicles, making it potentially suitable for the analysis of shared-space environments. However, modelling woonerfs requires specific adaptations because conventional traffic simulation models do not necessarily reproduce the informal interactions, pedestrian priority, and multifunctional use of shared streets without additional behavioral assumptions.
1.6. Synthesis of the Literature
The reviewed literature indicates three major research streams relevant to the environmental assessment of woonerfs.
First, research on woonerfs, Home Zones, and shared spaces has demonstrated that changes in street geometry and spatial organization can reduce vehicle speeds, modify driver behavior, and increase the social functionality of streets. These studies establish the fundamental role of spatial design in shaping vehicle behavior.
Second, a growing body of research has developed microscopic models of shared-space interactions. These studies demonstrate that pedestrian–vehicle interactions require behavioral representations that are substantially more sophisticated than conventional car-following models. The dynamic negotiation of priority and the interaction between different road users are fundamental characteristics of shared-space environments.
Third, research on traffic calming and emissions has demonstrated that changes in vehicle speed alone do not provide sufficient information for determining environmental impacts. Acceleration, deceleration, stop frequency, and the overall characteristics of the driving cycle can substantially modify fuel consumption and pollutant emissions. Consequently, environmental evaluation requires a detailed representation of vehicle trajectories. Despite the development of these three research streams, they have largely evolved independently. The intersection between them remains insufficiently explored, particularly in relation to the following chain: woonerf → microscopic traffic behavior → energy consumption → vehicle emissions.
1.7. Research Gap
Despite the growing body of research on woonerfs, Home Zones, and shared-space environments, limited attention has been given to the energy and environmental consequences of their specific geometric and operational characteristics. Existing studies have primarily evaluated vehicle speed, traffic safety, user behavior, and public-space quality, whereas studies directly linking microscopic vehicle trajectories within woonerf environments to energy consumption and pollutant emissions remain scarce.
In particular, the existing literature does not provide sufficient evidence to determine whether the reduction in average vehicle speed associated with woonerf implementation is necessarily accompanied by lower energy consumption and emissions, or whether potential benefits may be offset by increased acceleration, deceleration, and stop-and-go behavior. This issue is particularly important because the environmental performance of a traffic-calming intervention depends not only on the resulting average speed but also on the detailed characteristics of the driving cycle.
Although microscopic models have been developed for shared-space environments, their application has mainly focused on safety, mobility, and pedestrian–vehicle interactions rather than the estimation of energy consumption and pollutant emissions. Conversely, microscopic emission models have been extensively applied to conventional traffic-calming measures, but their application to woonerf-type shared environments remains limited. This separation between behavioral modelling and environmental assessment represents an important research gap. The need to address this research gap is further reinforced by the continuous growth of motorization observed across Europe. The increasing number of passenger vehicles has substantially transformed urban transport systems and increased the demand for road infrastructure. According to data published by Statistics Poland, the number of passenger cars registered per 1000 inhabitants in Poland increased from 288.6 in 2002 to 612.2 in 2023, illustrating the steadily growing dependence on private automobile transport. Although increased vehicle ownership has improved individual mobility and accessibility, it has also generated a range of environmental, social, and economic consequences, including traffic congestion, increased fuel consumption, greenhouse-gas emissions, deteriorating air quality, traffic noise, road-safety concerns, and the progressive degradation of urban public spaces.
The transport sector remains one of the major consumers of energy worldwide and represents a substantial source of anthropogenic greenhouse-gas emissions. According to the International Energy Agency, road transport accounts for the majority of transport-related energy consumption and CO2 emissions, with passenger vehicles representing a substantial proportion of this demand. Improving the energy efficiency of urban transport systems has therefore become an important objective of contemporary transport policy and a key component of strategies aimed at mitigating climate change and supporting sustainable development [20].
Traditional approaches to congestion mitigation have largely focused on expanding road infrastructure to increase traffic capacity. However, numerous studies have demonstrated that increasing road capacity does not necessarily provide long-term improvements in traffic conditions. The Lewis–Mogridge hypothesis suggests that increases in road capacity may induce additional travel demand, ultimately restoring previous congestion levels while generating additional environmental impacts [21]. Consequently, contemporary transport planning increasingly prioritizes sustainable mobility strategies that seek to improve accessibility and quality of life while simultaneously reducing energy consumption and transport-related emissions [22].
Within this context, traffic calming has emerged as an important approach to improving urban transport performance without expanding road infrastructure [23]. Traffic-calming strategies can reduce vehicle operating speeds, improve traffic safety, encourage active modes of transport, and enhance the overall quality of public space [24]. Moreover, lower and more uniform driving speeds may reduce acceleration and deceleration cycles, which directly influence fuel consumption and exhaust emissions [25]. Properly designed traffic-calming measures may therefore generate both operational and environmental benefits [26]. Nevertheless, as discussed above, these benefits cannot be assumed solely on the basis of reduced average speed and should instead be evaluated using detailed vehicle operating data.
Among the comprehensive traffic-calming concepts, the woonerf represents a particularly relevant approach. Originally developed in the Netherlands during the 1970s [27,28] a woonerf, commonly referred to as a living street, is a shared-space environment in which pedestrians and cyclists are given priority over motor vehicles and vehicle speeds are typically restricted through a combination of spatial design and regulatory measures. The principal objective is not merely to reduce vehicle speeds but to transform the street into a multifunctional public space integrating transport, recreation, commercial activity, and social interaction [29,30,31]. Previous studies have reported benefits related to road safety, pedestrian comfort, environmental quality, and the attractiveness of urban environments [32].
The implementation of shared-space solutions is particularly relevant in small tourist towns, where seasonal increases in visitor numbers can generate substantial fluctuations in traffic demand. During peak tourist periods, intensive pedestrian activity may coincide with increased vehicle traffic, resulting in conflicts between different groups of road users, congestion, prolonged vehicle idling, and increased fuel consumption. These characteristics make tourist destinations particularly suitable for investigating the environmental performance of alternative street designs under conditions in which pedestrian and vehicle flows interact intensively.
Despite the growing body of research concerning shared-space environments, most previous studies have focused primarily on road safety, pedestrian behavior, traffic operations, or urban design [33,34,35]. Comparatively little attention has been devoted to the influence of woonerf implementation on vehicle fuel consumption [36,37] and carbon monoxide (CO) emissions [38,39,40], particularly under realistic traffic conditions reproduced using microscopic traffic simulation. Given the increasing importance of transport decarbonization and energy efficiency, quantitative assessment of these environmental effects represents an important research challenge.
Microscopic traffic simulation has become an important tool for evaluating alternative transport-management strategies before their physical implementation [41,42]. By reproducing individual vehicle trajectories, acceleration profiles, and interactions between different road users, microscopic models enable detailed estimation of operational, environmental, and energy-related performance indicators. Recent developments in PTV Vissim 2026 and the integrated Viswalk module provide enhanced possibilities for representing pedestrian–vehicle interactions within shared-space environments through dynamic pedestrian routing, vehicle-aware trajectory selection, and conflict modelling. These capabilities create new opportunities for investigating the environmental consequences of woonerf-type street designs.
The present study addresses the identified research gap by evaluating the effects of implementing a woonerf concept on vehicle fuel consumption and carbon monoxide emissions using microscopic traffic simulation. The analysis focuses on Morska Street in Rewa, a small coastal tourist village in northern Poland characterized by intensive seasonal pedestrian activity and substantial parking-related vehicle movements. Two traffic-organization scenarios were developed using PTV Vissim 2026 with the Viswalk module: the existing street configuration and a proposed woonerf alternative. The scenarios were compared in terms of vehicle fuel consumption, CO emissions, travel time, and selected operational performance indicators.
By linking changes in street configuration with microscopic vehicle behavior and environmental performance, the study provides a quantitative assessment of the potential consequences of woonerf implementation. The results contribute to the broader discussion on sustainable mobility, traffic calming, and energy-efficient urban transport planning, while also providing a methodological basis for assessing shared-space interventions in small tourist settlements.
The study followed a six-stage procedure, summarized in Figure 1. The procedure combines the assessment of the local road system, field traffic measurements on two types of day, the development of a microscopic traffic simulation model for four traffic organization scenarios, model calibration and validation, and a comparative evaluation of the scenarios in terms of travel time, fuel consumption and NOx and CO emissions.
Figure 1.
The methodological framework.
Figure 1 shows the flowchart of the research procedure: (I) analysis of the road system and feasibility of a woonerf; (II) traffic data collection on a typical day; (III) traffic data collection on a holiday day; (IV) development of the microscopic traffic model for four scenarios; (V) calibration and validation using the GEH statistic; (VI) comparative analysis of fuel consumption and CO emissions.
To ensure the comparability of results, all traffic demand parameters, vehicle fleet composition, simulation duration, and environmental conditions were kept identical for both variants. The only differences between the scenarios concerned the geometric layout of the street and the traffic organization associated with the implementation of the woonerf concept.
2. Materials and Methods
The study was conducted on a selected street located in a small tourist village characterized by a high intensity of pedestrian activity during the tourist season. The study was conducted in Rewa, a small coastal village located in the Pomeranian Voivodeship in northern Poland, within the municipality of Kosakowo. According to the data of the Central Statistical Office in Poland, the village of Rewa has a population of 958 inhabitants, of whom 64.4% are of working age, which gives 617 people.
Situated on the Bay of Puck, Rewa is recognized as one of the region’s most popular tourist destinations due to its sandy beaches, marina facilities, water sports infrastructure, and the unique natural feature known as the Rewa Spit (Cypl Rewski). Although the permanent population is fewer than 1000 inhabitants, the number of visitors increases several-fold during the summer tourist season, resulting in substantial seasonal variations in traffic demand. The village is characterized by a compact urban layout, where residential, commercial, and recreational functions are concentrated within a relatively small area. Consequently, motorized traffic, pedestrian activity, cyclists, and tourist-related services compete for the same public space, particularly during periods of peak tourist demand. These conditions frequently lead to traffic congestion, reduced pedestrian comfort, and increased conflicts between different groups of road users.
Morska Street constitutes the principal transportation corridor within the village and provides access to the waterfront, restaurants, accommodation facilities, and recreational areas. In addition to its transportation function, the street serves as one of the main public spaces in Rewa, accommodating intensive pedestrian movement associated with tourism and local commercial activities. During the summer season, pedestrian volumes often exceed those observed in typical residential streets, while vehicle traffic remains significant due to tourist arrivals, service vehicles, and residents.
The combination of high seasonal traffic demand, intensive pedestrian activity, and the multifunctional character of Morska Street makes Rewa a representative case study for evaluating the environmental and operational impacts of shared-space implementation. From the perspective of sustainable urban mobility, the location provides favorable conditions for investigating whether a woonerf-type street can contribute to reducing vehicle fuel consumption and CO emissions while preserving acceptable traffic performance under tourist traffic conditions.
Figure 2 shows the main problematic layout of the town. During the summer season, the main tourist area is divided by Morska Street—B into two parts: A—the beach recreation area, and C—the service, hotel, and restaurant area. Due to the sometimes very narrow sidewalks or their absence, most pedestrians move mainly on side A. However, because they need to cross the street to use services, they are often forced to take a long route to a pedestrian crossing, as they are not very frequent. As a result, pedestrians often cross at random.
Figure 2.
Morska Street in Rewa, view of the division of usable zones by residents and tourists.
2.1. Microscopic Traffic Simulation Model
The microscopic traffic model was developed in PTV Vissim 2026, which enables detailed representation of multimodal traffic systems through the explicit simulation of individual vehicle and pedestrian movements. The model was constructed using geometric, operational, and traffic demand data collected for the study area. To ensure a realistic representation of traffic conditions, all network components were implemented in accordance with the existing road infrastructure and traffic organization. The road network geometry was reproduced using the linear and curved link elements available in PTV Vissim. The geometric design included the number and width of traffic lanes, lengths of auxiliary turning lanes, locations of stop lines, lane markings, and the radii of horizontal curves. These parameters were derived from field measurements, orthophotographs, and available design documentation to ensure consistency between the simulation model and the existing street layout.
Traffic demand was introduced into the model using hourly traffic volumes obtained from field observations. Vehicle inputs were assigned to individual network entry points, while the composition of the traffic stream was defined according to the observed vehicle fleet structure, expressed as the percentage share of passenger cars, light commercial vehicles, heavy goods vehicles, and buses. Traffic demand was assumed to vary according to the analyzed time period, allowing the simulation of representative operating conditions during peak tourist activity.
Vehicle routing was established using static routing decisions at all locations where drivers could select alternative travel paths, primarily at intersections and network junctions. Route choice proportions were determined from observed turning movement counts, and each routing decision was assigned a corresponding percentage distribution reflecting the measured directional traffic demand. The use of static routing ensured identical traffic assignment in all analyzed simulation scenarios, thereby facilitating a direct comparison between the existing street configuration and the proposed woonerf alternative. Potential interactions between conflicting traffic streams were modelled using Conflict Areas and Priority Rules, which constitute the primary mechanisms governing vehicle right-of-way in PTV Vissim. Conflict Areas were applied to represent interactions between vehicles as well as between vehicles and pedestrians within shared traffic spaces. Where a more detailed representation of priority relationships was required, Priority Rules were introduced to specify acceptable temporal and spatial gaps for conflicting movements. These modelling elements were calibrated to reproduce observed driver behavior under unsignalized operating conditions. Public transport operations were incorporated into the simulation by introducing scheduled bus services operating within the study area. Bus routes, stop locations, dwell times, and departure schedules were implemented according to the published public transport timetable. Passenger waiting areas and stop facilities were modelled using the dedicated public transport objects available in PTV Vissim, enabling a realistic representation of bus stopping behavior and its influence on surrounding traffic. Pedestrian traffic was simulated using the Viswalk module integrated with PTV Vissim. Pedestrian walking areas, connectors, and crossing facilities were reproduced according to the existing urban layout. Pedestrian demand was introduced on the basis of field observations, with walking routes reflecting the principal origins and destinations within the study area. The pedestrian model was based on the Social Force Model, which enables continuous interaction among pedestrians as well as between pedestrians and vehicles.
Four simulation models were developed:
- Scenario A—The existing traffic organization—typical day
- Scenario B—The existing traffic organization—vacation day
- Scenario C—Woonerf traffic organization—typical day
- Scenario D—Woonerf traffic organization—vacation day
The geometric characteristics of both models were based on the same road corridor, ensuring that differences in simulation outputs resulted exclusively from the introduced traffic organization measures. Figure 3 shows the modeled network with elements of public transport, pedestrians, and parking lots.
Figure 3.
Modeled network.
2.2. Traffic Demand
Traffic demand was determined based on field traffic surveys conducted during representative periods of the non-tourist season, thereby reflecting typical operating conditions unaffected by seasonal fluctuations in visitor activity. Traffic volumes were classified according to vehicle category, with passenger cars constituting the dominant traffic component. Public transport operations were incorporated into the simulation model using the official timetable of bus route 146, which serves the study area. Bus departure times and service frequencies were reproduced in accordance with the existing schedule to ensure a realistic representation of public transport operations. Pedestrian demand was established from field observations of pedestrian movements, with pedestrian volumes and movement patterns reflecting the spatial distribution of the principal origins and destinations within the analyzed area. Table 1 shows the results of entry and exits measurements in the village of Rewa at the measurement hour of 7:00–8:00 on the typical days and 7:00–10:00 during the vacation day.
Table 1.
Traffic measurements during non-holiday periods.
Vehicles traveling on the network were passenger cars and no more than five small delivery vehicles. Due to their low traffic volume, they were entered into the model as passenger vehicles. If the model is to be replicated for another town or village, and the vehicle composition is significantly different, this should be taken into account.
2.3. Parking Lots
During the tourist season, parking demand was represented by explicitly incorporating the available parking supply within the study area into the simulation model. An inventory of both public and private parking facilities was conducted to determine the total parking capacity. For public parking areas, the number of available parking spaces was established through field surveys reflecting the existing parking layout. The capacity of private parking facilities, predominantly associated with accommodation establishments and residential properties, was determined through interviews with property owners. In one instance where direct information could not be obtained, the parking capacity was estimated using high-resolution orthophotography imagery and on-site verification.
Unlike conventional urban parking facilities, the majority of private parking areas in Rewa are characterized by informal parking arrangements, with vehicles parked on unmarked surfaces lacking designated parking bays and clearly defined internal circulation routes. Consequently, these facilities are capable of accommodating a greater number of vehicles than would be expected under standard urban parking design guidelines. To accurately represent these local conditions, the observed parking capacities were implemented directly in the simulation model rather than being derived from normative parking standards.
In total, 562 parking spaces were identified, inventoried, and incorporated into the microscopic simulation model. This detailed representation of parking infrastructure enabled a realistic simulation of vehicle arrivals, parking search behavior, and traffic generation associated with tourist activity within the study area.
The microscopic simulation model was developed using static traffic assignment, with vehicle movements represented by predefined static routes reflecting the observed directional distribution of traffic. This approach was selected to ensure consistent traffic demand across all simulation scenarios and to facilitate a direct comparison of the analyzed street configurations.
Parking facilities were modelled to reproduce the parking search behavior observed during field investigations. Direct observations indicated that the majority of drivers entering Rewa initially direct their vehicles toward the public parking facilities located at the entrance to the village. In the event that these parking areas reach full occupancy, drivers continue along Morska Street in search of the next available parking facility. This sequential parking search process reflects the actual behavior of visitors during periods of increased tourist demand.
To replicate these observed travel patterns, a hierarchy of parking destinations was implemented within the simulation model. Vehicle routes were assigned such that drivers first attempted to access the primary public parking areas. When parking capacity was unavailable, vehicles were redirected along predefined alternative routes toward subsequent parking facilities located within the study area (Figure 4). When the simulation starts (1), vehicles are generated at the network entrance according to the traffic volumes set in the vehicle inputs. Immediately after the network entrance is a section (static routing decision) where each vehicle is assigned a route (2) along which it will travel through the network—according to the user manual, this is a required element for the proper operation of parking routes. As they travel through the network, vehicles reach a section (Parking Routing Decision) leading to individual parking spaces (3). A vehicle seeking a parking space enters a given parking lot and “searches” for an available parking space. If there are no available spaces in the parking lot, the vehicle exits the lot and heads toward the next parking lot (5), and the procedure repeats (steps 3, 4, 5) until it successfully finds a parking space. As soon as a vacant space is found in the parking lot, the vehicle parks there (6) for a period of time determined by the time distribution. After this time, the vehicle exits the parking lot and heads toward the network exit (7). This procedure is performed for every vehicle entering the network until the simulation ends (8).
Figure 4.
Parking logic in the modeled road network.
This modelling approach enabled a realistic representation of parking search behavior and its influence on traffic operations, particularly with respect to vehicle circulation, travel distances, and congestion occurring along Morska Street during peak demand conditions: For the representation of parking behavior in the microscopic simulation model.
The Route Choice Method parameter available in PTV Vissim was configured using the Formula option. This approach enabled the implementation of a conditional routing algorithm based on the parking status of individual vehicles. Two complementary logical expressions were applied:
IF([VEHICLE\PARKDURTOT]>0;0;1)
The first expression identifies vehicles for which the total parking duration is greater than zero, indicating that a parking activity has already been completed. In this case, the vehicle is assigned to the outbound route leading towards the exit from Rewa.
IF([VEHICLE\PARKDURTOT]>0;1;0)
The second expression identifies vehicles that have not yet completed any parking activity. Such vehicles are directed towards available parking facilities. If the selected parking facility has no available capacity, the vehicle is assigned to the next available parking location according to the predefined route hierarchy.
The implemented algorithm enables a realistic representation of visitor parking behavior by preventing vehicles from performing multiple parking attempts at different locations after successfully occupying a parking space. Once a vehicle completes the parking process, it is automatically removed from the parking search procedure and routed towards the exit from the study area. This approach ensures that parking-related traffic generation and vehicle circulation patterns within Rewa are represented consistently with the observed behavior during field investigations.
2.4. Woonerf Modeling in PTV Vissim
The implementation of the Woonerf solution required the modification of the existing network geometry by adding an additional pedestrian area within the road surface and establishing appropriate interactions between pedestrian and vehicle traffic flows. In the model, the added pedestrian zone functions as an area dedicated to pedestrian activity rather than as a separated sidewalk facility, allowing for the simulation of mixed-use space conditions typical of woonerf streets. This approach enables the assessment of the impact of shared-space design on vehicle operation, traffic performance indicators, pedestrian accessibility, and transport-related emissions under conditions reflecting real-world woonerf implementation. The applied parameters were intended to reduce the attractiveness of the additional pedestrian area compared to conventional sidewalks. As a result, although the introduced zone remains accessible to pedestrians, it is expected to be used less frequently due to the continuous presence and movement of vehicles within the shared space. This approach reflects the actual operating conditions of a woonerf, where pedestrians have priority but are required to interact with vehicular traffic occupying the same area. Additionally, a parameter increasing the walking speed of pedestrians within this zone was implemented to facilitate more efficient avoidance of approaching vehicles and to better represent pedestrian behavior under shared-space conditions.
To ensure the correct representation of conflict areas within the simulation model, additional links crossing (Figure 5) the roadway was introduced throughout the entire section where the woonerf was implemented. These elements enabled the proper definition of pedestrian–vehicle interaction zones and supported the realistic simulation of movement within the shared space. The combination of the additional pedestrian area and the newly introduced cross-links ensured the correct operational functioning of the woonerf environment in the VISSIM model, allowing for an appropriate representation of pedestrian priority, vehicle interaction, and the resulting effects on traffic performance. Figure 6 shows the woonerf simulations in PTV Vissim.
Figure 5.
Additional settings in PTV Vissim—Woonerf.
Figure 6.
The woonerf in PTV Vissim.
2.5. Model Calibration and Validation
The microscopic simulation model was calibrated by adjusting the parameters of the Wiedemann car-following model and the Social Force pedestrian model to achieve consistency between simulated and observed traffic conditions. The calibration process considered key operational parameters, including vehicle travel times, average operating speeds, queue lengths, pedestrian walking speeds, and pedestrian–vehicle interaction patterns.
The calibration procedure was conducted using the GEH statistic [43], which is widely applied in transport modelling studies to evaluate the agreement between simulated and observed traffic volumes. The GEH values were calculated for the analyzed traffic flows and used as the primary calibration criterion. The obtained results confirmed a high level of consistency between the simulated and observed traffic conditions, with all GEH values remaining below the commonly accepted threshold value of 5. The raw file containing the GEH calculations has been approved for use as an attachment.
The GEH statistic is defined as:
where:
- M—represents simulated traffic volume,
- C—represents observed traffic volume.
In accordance with the Transport for London (TfL) modelling guidelines for microsimulation studies [44], each simulation scenario was evaluated using 20 independent simulation runs to account for the stochastic variability of microscopic traffic processes. The application of multiple simulation replications is recommended to obtain statistically reliable results and to minimize the influence of random variations associated with individual vehicle and pedestrian behavior.
For each simulation scenario, the initial random seed was set to 42 and subsequently increased by one for each consecutive simulation run (43–61). This approach ensured both the statistical variability required for stochastic simulation analysis and the reproducibility of the modelling procedure. The final performance indicators presented in this study, including vehicle fuel consumption, CO emissions, travel time, and traffic efficiency measures, represent the arithmetic mean values calculated from the 20 simulation replications.
The use of the recommended number of simulations runs provided a robust basis for comparison between the existing traffic organization and the proposed woonerf-type shared-space scenario.
2.6. Fuel Consumption and Emissions Estimations
Vehicle fuel consumption and CO emissions were estimated using the environmental assessment functions integrated within PTV Vissim. According to the PTV Vissim manual, emissions and fuel consumption were calculated by the method: “Node evaluation also determines exhaust emissions. The basis for these is formed by standard formulas for consumption values of vehicles from TRANSYT 7-F, a program for optimizing signal times, as well as data on emissions of the Oak Ridge National Laboratory of the U.S. Department of energy. The data refers to a typical North American vehicle fleet and does not differentiate between individual vehicle types. Thus, node evaluation is used to compare the emissions of different scenarios”. The calculations were based on second-by-second vehicle trajectories generated during the simulation, including instantaneous speed and acceleration profiles.
The following indicators were evaluated:
- Number of vehicles (vehicles/hour);
- Fuel consumption (US liquid gallon);
- Carbon monoxide (CO) emission (grams);
- Nitrogen oxides (NOx) emission (grams);
- Volatile Organic Compounds (VOC) emission (grams);
- QLEN—average queue length (m);
- QLENMAX—maximum length of the queue (m);
- VEHS(ALL)—all vehicles measured in the node evaluation (-);
- PERS(ALL)—all pedestrian measured in the node evaluation (-);
- VEHDELAY(ALL)—vehicle delay (s);
- PERSDELAY(ALL)—pedestrian delay (s);
- STOPS(ALL)—number of stops in the node evaluation (-).
2.7. Simulation Parameters
Each simulation represented one hour of traffic operation, preceded by an appropriate warm-up period allowing traffic conditions to stabilize before data collection. Identical simulation parameters were applied in both scenarios.
The principal simulation settings included:
- warm-up period: 1800s;
- simulation period: 3600 × 3 =10,800 s;
- cooldown period: 1800 s;
- inputs—traffic volume (Table 2):
Table 2.
Vehicle inputs—demand value.
3. Results
The environmental and operational performance of the four simulation scenarios was assessed using output data exported from PTV Vissim 2026. Each scenario comprised 20 simulation replications. The exported results were reported for three time intervals: 1800–5400 s, 5400–9000 s, and 9000–12,600 s. For each replication, additive indicators were aggregated across the three intervals to obtain a scenario-level estimate for the complete evaluation period. These indicators included the number of vehicles, carbon monoxide (CO) emissions, nitrogen oxides (NOx) emissions, and fuel consumption. Delay indicators were summarized using vehicle-count-weighted averages. The maximum queue-length indicator was represented by the largest value recorded across the three intervals within each replication. The effects of the woonerf were evaluated through two direct comparisons: Scenario A versus Scenario C under typical-day conditions, and Scenario B versus Scenario D under vacation-day conditions. This approach allows the proposed traffic organization to be assessed separately for the two traffic-demand profiles.
Vehicle volumes were similar in Scenarios A and C across all three evaluation intervals (Table 3). The mean numbers of vehicles were 328 and 326 in the first interval, 55 and 57 in the second interval, and 53 in both scenarios in the third interval, respectively.
Table 3.
Scenarios A–C comparison.
Pedestrian volumes were also similar. In the first interval, the mean numbers of pedestrians were 353 in Scenario A and 351 in Scenario C. In the second and third intervals, both scenarios recorded 83 and 81 pedestrians, respectively.
The similarity in vehicle and pedestrian volumes provides a useful basis for comparing operational performance under the existing and woonerf traffic organizations.
Scenarios B and D also recorded similar vehicle volumes (Table 4). The mean numbers of vehicles were 328 and 326 in the first interval, 109 and 111 in the second interval, and 393 and 390 in the third interval, respectively.
Table 4.
Scenarios B–D comparison.
Pedestrian volumes were similarly close, with 354 pedestrians in Scenario B and 351 in Scenario D in the first interval, 138 and 140 in the second interval, and 420 and 417 in the third interval. The most notable feature of the vacation-day scenarios was the increase in vehicle and pedestrian volumes during the third interval. This pattern differed from that observed on a typical day, when the vehicle count decreased substantially after the first interval. The high demand during the final vacation-day interval is important when interpreting queue lengths, delays, and aggregate fuel-consumption and emission estimates.
Fuel consumption and exhaust emissions were estimated using the Node Evaluation. The indicators considered were CO, NOx, VOCs, and fuel consumption. These values are model-based estimates and should be interpreted as indicators of the relative environmental performance of the simulated scenarios, rather than as direct measurements of real-world emissions.
On a typical day, the woonerf scenario produced slightly higher aggregate emission estimates and fuel consumption than the existing traffic organization in all three evaluation intervals (Table 5).
Table 5.
A–C Environmental comparison.
In the first interval, mean CO emissions increased from 211.784 in Scenario A to 214.464 in Scenario C, corresponding to an increase of approximately 1.3%. NOx emissions increased from 41.205 to 41.727, VOC emissions from 49.083 to 49.704, and fuel consumption from 3.030 to 3.068.
In the second interval, the differences were more pronounced. CO emissions increased from 33.942 to 36.288, representing an increase of approximately 6.9%. NOx increased from 6.604 to 7.060, VOC emissions from 7.866 to 8.410, and fuel consumption from 0.486 to 0.519.
In the third interval, CO emissions increased from 33.329 to 34.261, or approximately 2.8%. NOx emissions increased from 6.485 to 6.666, VOC emissions from 7.724 to 7.940, and fuel consumption from 0.477 to 0.490.
The direction of change was consistent across the four environmental indicators: Scenario C had higher aggregate values than Scenario A in each interval. The largest relative differences occurred during the second interval, whereas the first interval showed the smallest differences.
Considering the sums of the reported interval means, CO emissions increased from 279.055 in Scenario A to 285.013 in Scenario C, an increase of approximately 2.1%. The corresponding summed fuel-consumption values increased from 3.993 to 4.077, also by approximately 2.1%. These sums are descriptive aggregates of the reported interval means.
The environmental comparison between Scenarios B and D (Table 6) showed a different pattern. Unlike the consistent increases observed in the typical-day comparison, the direction of change varied across the three evaluation intervals.
Table 6.
B–D Environmental comparison.
In the first interval, the woonerf scenario produced lower aggregate values. Mean CO emissions decreased from 226.629 in Scenario B to 217.224 in Scenario D, corresponding to a reduction of approximately 4.2%. NOx emissions decreased from 44.094 to 42.264, VOC emissions from 52.524 to 50.344, and fuel consumption from 3.242 to 3.108.
In the second interval, the direction of change was reversed. CO emissions increased from 73.738 in Scenario B to 76.510 in Scenario D, or approximately 3.8%. NOx increased from 14.347 to 14.886, VOC emissions from 17.089 to 17.732, and fuel consumption from 1.055 to 1.095.
The third interval also showed higher values in the woonerf scenario. CO emissions increased from 283.905 to 293.535, representing an increase of approximately 3.4%. NOx emissions increased from 55.238 to 57.111, VOC emissions from 65.798 to 68.030, and fuel consumption from 4.062 to 4.199.
When the three interval means are summed, CO emissions increase from 584.272 in Scenario B to 587.269 in Scenario D, corresponding to approximately 0.5%. Summed fuel consumption increases from 8.359 to 8.402, also by approximately 0.5%.
These results show that the environmental implications of the woonerf configuration under vacation-day conditions varied over time. Lower aggregate values were observed in the first interval, while higher values were observed in the second and third intervals. The overall differences across the three intervals were small, despite the opposite directions of change in the first interval and the later intervals.
The two paired comparisons reveal distinct patterns. Under typical-day conditions, Scenario C had higher aggregate emissions and fuel consumption than Scenario A in all three intervals. Under vacation-day conditions, Scenario D had lower values than Scenario B in the first interval but higher values in the subsequent intervals.
The summed CO and fuel-consumption values were approximately 2.1% higher in the typical-day woonerf scenario and approximately 0.5% higher in the vacation-day woonerf scenario. These results suggest that the overall aggregate differences between the existing and woonerf configurations were relatively small when all three evaluation intervals were considered together.
Queue-related indicators showed higher values under the woonerf configuration in both paired comparisons, although the magnitude and timing of the differences varied.
Under typical-day conditions, the mean queue-length indicator was 0.01 in the first interval and zero in the second and third intervals in Scenario A. In Scenario C, the corresponding values were 0.10, 0.11, and 0.11. The maximum queue-length indicator was also higher in Scenario C during the second and third intervals, reaching 33.06 and 32.76, compared with 3.77 and 2.33 in Scenario A.
Under vacation-day conditions, Scenario D recorded higher mean queue-length values than Scenario B in all three intervals. The values were 0.18, 0.24, and 0.63 in Scenario D, compared with 0.07, 0.01, and 0.13 in Scenario B. The difference was especially pronounced in the third interval, when the maximum queue-length indicator reached 102.30 in Scenario D and 31.31 in Scenario B.
These results suggest that the woonerf configuration was associated with higher queue-related indicators, particularly during the later part of the vacation-day simulation. The pattern is relevant to the evaluation of a shared-space design under high traffic demand. However, the aggregate indicators do not establish the specific mechanisms responsible for the differences. Further examination of vehicle trajectories, speed distributions, pedestrian interactions, and local geometric constraints would be required to determine the causes of the observed queue patterns.
On a typical day, mean vehicle delay was 0.93, 2.07, and 2.11 in Scenario A, compared with 1.70, 1.81, and 1.79 in Scenario C. The first interval therefore showed a higher delay under the woonerf configuration. In the second and third intervals, however, the reported mean delay was lower in Scenario C than in Scenario A.
This pattern indicates that the woonerf did not affect vehicle delay uniformly throughout the typical-day simulation. The higher value in the first interval was followed by lower values in the later intervals. These differences should be interpreted together with the queue-related measures and the temporal distribution of traffic.
Under vacation-day conditions, mean vehicle delay was 2.17, 2.63, and 3.71 in Scenario B and 1.96, 2.39, and 4.12 in Scenario D. The woonerf scenario showed lower delay in the first two intervals but higher delay in the third. The increase from 3.71 to 4.12 coincided with the high vehicle volume and higher queue-related indicators recorded in the final interval.
Figure 7 compares vehicle-related emissions of CO, NOx, and VOC, as well as fuel consumption per vehicle, across the four traffic scenarios and three time intervals.
Figure 7.
Comparison—indicators per vehicle.
Under typical-day conditions, the comparison between the existing traffic organization (Scenario A) and the woonerf design (Scenario C) indicates a slight increase in emissions and fuel consumption per vehicle. Under vacation-day conditions, the comparison between Scenario B and Scenario D shows a different pattern: indicator values are slightly lower in the first interval but higher in the second and third intervals after the woonerf implementation.
4. Discussion
The emission results follow the same pattern as fuel consumption, with differences between A and C, and between B and D, of approximately 0.7% and 1.9%, respectively. This is a consequence of the emission model implemented in the simulation software, in which emissions are calculated on the basis of vehicle operating parameters and fuel use. Therefore, the emission results should be treated as a confirmation of the fuel consumption trend rather than as independent evidence, and they do not allow conclusions about combustion processes, such as combustion temperature or oxidation efficiency.
These findings are particularly relevant for small tourist towns, where the traffic problem is seasonal and detailed implementation studies are rarely affordable. The results show that a simulation carried out before implementation can provide quantitative evidence that a woonerf, which is comparatively inexpensive to build, does not deteriorate traffic and environmental performance even at peak summer demand. This can reduce the uncertainty that discourages local authorities from introducing such solutions.
The study has limitations. The analysis covers one street and four scenarios, and the results are expressed as total values for the simulated period. The model does not capture safety indicators or pedestrian comfort, which are among the main reasons for introducing a woonerf. Real behavior in shared space may also differ from that represented by the model parameters.
Further research is planned to determine the traffic volume at which significant disruptions and delays begin to occur in the road network. The scenarios analyzed in this study represent two demand levels (approximately 445 and 800 vehicles), which showed that the woonerf does not worsen the operation of the street under peak summer conditions. They do not, however, indicate how much additional traffic the street can absorb before its performance deteriorates. In future work, traffic volume will be increased gradually in both the baseline and the woonerf configuration, and indicators such as travel time, delay, queue length, and the number of stops will be analyzed to identify the threshold values at which congestion begins to develop. This will make it possible to compare the capacity of both solutions and to assess whether the woonerf remains a suitable option should tourist traffic continue to grow. The analysis will also be extended to the surrounding road network, so that the effects of possible traffic redistribution on adjacent streets can be evaluated.
5. Conclusions
The results of this study demonstrate that microscopic traffic simulation using PTV Vissim constitutes an effective decision-support tool for evaluating the operational and environmental impacts of woonerf-type street designs before their physical implementation. The obtained results indicate that the implementation of woonerf solutions in rural areas does not necessarily lead to a deterioration of traffic conditions. The observed relationship is primarily determined by the characteristics of the existing road network, its operational capacity, and the current level and structure of vehicular traffic. Achieving further improvements in the assessment outcomes may provide an additional incentive for local authorities in small rural settlements to undertake infrastructure modifications. Such interventions have the potential to improve conditions for maintaining a neutral or even beneficial impact on pollutant emissions generated by road transport. Therefore, the implementation of the woonerf concept may be considered an element of sustainable spatial and transport planning, integrating objectives related to the improvement of public space quality, and the mitigation of the environmental impacts associated with road transportation.
By enabling the detailed representation of vehicle–pedestrian interactions, traffic operations, parking behavior, and fuel consumption, the simulation environment allows alternative traffic management strategies to be assessed under realistic operating conditions without the financial and organizational risks associated with field implementation. Collecting data for a model performed in rural locations often involves obtaining data locally through interviews with local residents; the lack of ITS infrastructure necessitates manual data collection.
The proposed modelling framework is particularly applicable to small towns and rural communities, where financial resources for transport infrastructure investments are often limited, and the consequences of unsuccessful traffic interventions may significantly affect local accessibility and tourism. Through the use of microscopic simulation, local authorities and transport planners can evaluate multiple design variants, identify potential operational deficiencies, and quantify expected changes in vehicle fuel consumption, carbon dioxide emissions, and traffic performance before undertaking costly reconstruction works.
Consequently, microscopic simulation represents a valuable component of evidence-based transport planning, supporting informed decision-making in the implementation of sustainable mobility measures. The approach presented in this study may therefore serve as a practical methodology for municipalities considering the introduction of woonerf-type shared-space solutions, particularly in tourist destinations where balancing vehicle accessibility, pedestrian comfort, and environmental performance is of fundamental importance. An important implication of the present study is that the evaluation of woonerf-type traffic calming measures should not be limited solely to road safety and operational performance, which have traditionally been the primary criteria considered during the planning and implementation of shared-space solutions. Owing to the lower operating speeds and the potentially increased frequency of vehicle stops and acceleration events associated with woonerf environments, the assessment of fuel consumption and exhaust emissions should also constitute an integral part of the decision-making process. These environmental indicators provide valuable information regarding the overall sustainability of the proposed intervention and its potential contribution to reducing transport-related energy consumption and greenhouse gas emissions.
Furthermore, the findings indicate that the implementation of a woonerf should not be regarded as a universally applicable solution for all tourist towns or villages. The effectiveness of such interventions depends strongly on local characteristics, including the existing road network configuration, traffic demand, parking organization, pedestrian activity, and the functional role of the analyzed street within the transport system. In some locations, the geometric layout of the road network or the intensity of vehicular traffic may prevent the efficient operation of a shared-space environment, potentially leading to increased congestion, longer vehicle delays, and higher fuel consumption and emissions.
For this reason, comprehensive pre-implementation analyses based on microscopic traffic simulation are strongly recommended. Such analyses enable local authorities to evaluate whether the introduction of a woonerf is compatible with local traffic conditions and sustainability objectives before undertaking costly infrastructure modifications. Consequently, simulation-based assessment provides an evidence-based framework for identifying locations where shared-space solutions are likely to deliver operational, environmental, and social benefits, while simultaneously identifying cases in which alternative traffic management strategies may be more appropriate.
Author Contributions
Conceptualization, M.Z.-O.; methodology, M.Z.-O.; software, D.O.; validation, M.Z.-O. and D.O.; formal analysis, M.Z.-O.; investigation, M.Z.-O.; resources, M.Z.-O. and D.O.; data curation, M.Z.-O. and D.O.; writing—original draft preparation, M.Z.-O.; writing—review and editing, M.Z.-O.; visualization, D.O.; supervision, M.Z.-O.; project administration, M.Z.-O.; funding acquisition, M.Z.-O. and D.O. All authors have read and agreed to the published version of the manuscript.
Funding
This research was funded by the statutory activities of Gdynia Maritime University, grant numbers WN/2026/PZ/06 and WN/2026/PZ/13.
Institutional Review Board Statement
Not applicable.
Informed Consent Statement
Not applicable.
Data Availability Statement
The raw data supporting the conclusions of this article will be made available by the authors on request.
Conflicts of Interest
The authors declare no conflicts of interest.
Abbreviation
| CO | carbon monoxide |
| NOx | nitrogen oxides |
| VOC | Volatile Organic Compounds |
References
- Row, A.T.; Jacobs, J. The Death and Life of Great American Cities. Yale Law J. 1962, 71, 1597. [Google Scholar] [CrossRef] [Scilit] [PubMed]
- Appleyard, D. Livable Streets; University of California Press: Los Angeles, CA, USA; London, UK, 1981. [Google Scholar]
- Biddulph, M. Evaluating the English Home Zone Initiatives. J. Am. Plan. Assoc. 2010, 76, 199–218. [Google Scholar] [CrossRef] [Scilit]
- Biddulph, M. Home Zones: A Planning and Design Handbook; Policy Press: Bristol, UK, 2001. [Google Scholar]
- Karndacharuk, A.; Wilson, D.J.; Dunn, R. A Review of the Evolution of Shared (Street) Space Concepts in Urban Environments. Transp. Rev. 2014, 34, 190–220. [Google Scholar] [CrossRef] [Scilit]
- Hamilton-Baillie, B. Shared Space: Reconciling People, Places and Traffic. Built Environ. 2008, 34, 161–181. [Google Scholar] [CrossRef] [Scilit]
- Ahn, K.; Rakha, H.; Trani, A.; Van Aerde, M. Estimating Vehicle Fuel Consumption and Emissions Based on Instantaneous Speed and Acceleration Levels. J. Transp. Eng. 2002, 128, 182–190. [Google Scholar] [CrossRef] [Scilit]
- Anvari, B.; Bell, M.G.H.; Sivakumar, A.; Ochieng, W.Y. Modelling Shared Space Users via Rule-Based Social Force Model. Transp. Res. Part C Emerg. Technol. 2015, 51, 83–103. [Google Scholar] [CrossRef] [Scilit]
- Rinke, N.; Schiermeyer, C.; Pascucci, F.; Berkhahn, V.; Friedrich, B. A Multi-Layer Social Force Approach to Model Interactions in Shared Spaces Using Collision Prediction. Transp. Res. Procedia 2017, 25, 1249–1267. [Google Scholar] [CrossRef] [Scilit]
- Johora, F.T. Modeling Interactions among Pedestrians and Cars in Shared Spaces. In Modeling Interactions Among Pedestrians and Cars in Shared Spaces; Springer: Wiesbaden, Germany, 2022; pp. 1–174. [Google Scholar] [CrossRef] [Scilit]
- Lee, G.; Joo, S.; Oh, C.; Choi, K. An Evaluation Framework for Traffic Calming Measures in Residential Areas. Transp. Res. Part D Transp. Environ. 2013, 25, 68–76. [Google Scholar] [CrossRef] [Scilit]
- Ghafghazi, G.; Hatzopoulou, M. Simulating the Air Quality Impacts of Traffic Calming Schemes in a Dense Urban Neighborhood. Transp. Res. Part D Transp. Environ. 2015, 35, 11–22. [Google Scholar] [CrossRef] [Scilit]
- Hu, Y.-C.; Li, Q.-L.; Liu, J.; Wang, J.-X.; Wang, B.-H.; Liu, H.; Jiang, R.; Qi, H.-S.; Ying, Y.-Y.; Wang, W.-L.; et al. Effect of Speed Humps on Instantaneous Traffic Emissions in a Microscopic Model with Limited Deceleration Capacity. Chin. Phys. B 2024, 33, 064501. [Google Scholar] [CrossRef] [Scilit]
- Nguyen, N.A.; Schweizer, J.; Rupi, F.; Palese, S.; Posati, L. Superblock Design and Evaluation by a Microscopic Door-to-Door Simulation Approach. ISPRS Int. J. Geo-Inf. 2024, 13, 77. [Google Scholar] [CrossRef] [Scilit]
- Wang, D.; Mei, Z.; Zhang, L.; Ye, X.; Slack-Smith, D.; Wijayaratna, K.P.; Zeibots, M. The Development of Modeling Shared Spaces to Support Sustainable Transport Systems: Introduction to the Integrated Pedestrian–Vehicle Model (IPVM). Sustainability 2024, 16, 4227. [Google Scholar] [CrossRef] [Scilit]
- Tzouras, P.G.; Karolemeas, C.; Bakogiannis, E.; Kepaptsoglou, K. A Concept Agent-Based Simulation Model to Evaluate the Impacts of a Shared Space Network. Procedia Comput. Sci. 2021, 184, 680–685. [Google Scholar] [CrossRef] [Scilit]
- Xu, L.; Oh, T.; Kim, I.; Hu, X. Are Shared Streets Acceptable to Pedestrians and Drivers? Evidence from Virtual Reality Experiments. PLoS ONE 2022, 17, e0266591. [Google Scholar] [CrossRef] [Scilit] [PubMed]
- Leereveld, T.; Estévez-Mauriz, L.; Margaritis, E. Understanding Perceived Tranquillity in Urban Woonerf Streets: Case Studies in Two Dutch Cities. Noise Mapp. 2024, 11, e20240009. [Google Scholar] [CrossRef] [Scilit]
- Bąkała, W. Ocena Jakości Woonerfu Jako Przestrzeni Publicznej: Przykład Ulicy Traugutta w Łodzi. KWARTAŁ. Mag. SKN Spat. 2024, 28, 24–35. [Google Scholar]
- International Energy Agency (IEA). Energy Efficiency; International Energy Agency (IEA): Paris, France, 2025. [Google Scholar]
- Kucharski, R.; Drabicki, A.; Paszkowski, J.; Szarata, A. Lewis–Mogridge Points: A Nonarbitrary Method to Include Induced Traffic in Cost-Benefit Analyses. J. Adv. Transp. 2020, 2020, 3096260. [Google Scholar] [CrossRef] [Scilit]
- Żukowska, S.; Chmiel, B.; Połom, M. The Smart Village Concept and Transport Exclusion of Rural Areas—A Case Study of a Village in Northern Poland. Land 2023, 12, 260. [Google Scholar] [CrossRef] [Scilit]
- Magkafas, F.; Fountas, G.; Anastasopoulos, P.C.; Basbas, S. Beyond Speed Reduction: A Systematic Literature Review of Traffic-Calming Effects on Public Health, Travel Behaviour, and Urban Liveability. Infrastructures 2025, 10, 147. [Google Scholar] [CrossRef] [Scilit]
- Ogryzek, M.; Adamska-Kmieć, D.; Klimach, A. Sustainable Transport: An Efficient Transportation Network—Case Study. Sustainability 2020, 12, 8274. [Google Scholar] [CrossRef] [Scilit]
- Faris, W.F.; Rakha, H.A.; Kafafy, R.I.; Idres, M.; Elmoselhy, S. Vehicle Fuel Consumption and Emission Modelling: An in-Depth Literature Review. Int. J. Veh. Syst. Model. Test. 2011, 6, 318–395. [Google Scholar] [CrossRef] [Scilit]
- Paszkowski, J.; Herrmann, M.; Richter, M.; Szarata, A. Modelling the Effects of Traffic-Calming Introduction to Volume–Delay Functions and Traffic Assignment. Energies 2021, 14, 3726. [Google Scholar] [CrossRef] [Scilit]
- Joseph, E. Ben Changing the Residential Street Scene: Adapting the Shared Street (Woonerf) Concept to the Suburban Environment. J. Am. Plan. Assoc. 1995, 61, 504–515. [Google Scholar] [CrossRef] [Scilit]
- Nalmpantis, D.; Lampou, S.C.; Naniopoulos, A. The Concept of Woonerf Zone Applied in University Campuses: The Case of the Campus of the Aristotle University of Thessaloniki. Transp. Res. Procedia 2017, 24, 450–458. [Google Scholar] [CrossRef] [Scilit]
- Orsini, F.; Batista, M.; Friedrich, B.; Gastaldi, M.; Rossi, R. Before-after Safety Analysis of a Shared Space Implementation. Case Stud. Transp. Policy 2023, 13, 101021. [Google Scholar] [CrossRef] [Scilit]
- Tzouras, P.G.; Batista, M.; Kepaptsoglou, K.; Vlahogianni, E.I.; Friedrich, B. Can We All Coexist? An Empirical Analysis of Drivers’ and Pedestrians’ Behavior in Four Different Shared Space Road Environments. Cities 2023, 141, 104477. [Google Scholar] [CrossRef] [Scilit]
- Batista, M.; Friedrich, B. Investigating Spatial Behaviour in Different Types of Shared Space. Transp. Res. Procedia 2022, 60, 44–51. [Google Scholar] [CrossRef] [Scilit]
- Nio, I. Communal versus Private: The Unfinished Search for the Ideal Woonerf. DASH|Delft Archit. Stud. Hous. 2010, 2, 4–17. [Google Scholar]
- Thaker, P.; Gokhale, S. The Impact of Traffic-Flow Patterns on Air Quality in Urban Street Canyons. Environ. Pollut. 2016, 208, 161–169. [Google Scholar] [CrossRef] [Scilit] [PubMed]
- Szagała, P.; Brzeziński, A.; Kieć, M.; Budzynski, M.; Wachnicka, J.; Pazdan, S. Pedestrian Safety at Midblock Crossings on Dual Carriageway Roads in Polish Cities. Sustainability 2022, 14, 5703. [Google Scholar] [CrossRef] [Scilit]
- Ruiz-Apilánez, B.; Karimi, K.; García-Camacha, I.; Martín, R. Shared space streets: Design, user perception and performance. Urban Des. Int. 2017, 22, 267–284. [Google Scholar] [CrossRef] [Scilit]
- Verma, P.; Stevanovic, S.; Zare, A.; Dwivedi, G.; Van, T.C.; Davidson, M.; Rainey, T.; Brown, R.J.; Ristovski, Z.D. An Overview of the Influence of Biodiesel, Alcohols, and Various Oxygenated Additives on the Particulate Matter Emissions from Diesel Engines. Energies 2019, 12, 1987. [Google Scholar] [CrossRef] [Scilit]
- Medina-Salgado, B.; Sánchez-DelaCruz, E.; Pozos-Parra, P.; Sierra, J.E. Urban Traffic Flow Prediction Techniques: A Review. Sustain. Comput. Inform. Syst. 2022, 35, 100739. [Google Scholar] [CrossRef] [Scilit]
- Ziemska, M. Exhaust Emissions and Fuel Consumption Analysis on the Example of an Increasing Number of HGVs in the Port City. Sustainability 2021, 13, 7428. [Google Scholar] [CrossRef] [Scilit]
- Zhang, X.; Wang, Q.; Qin, W.; Guo, L. Sustainable Policy Evaluation of Vehicle Exhaust Control—Empirical Data from China’s Air Pollution Control. Sustainability 2019, 12, 125. [Google Scholar] [CrossRef] [Scilit]
- Ravi, S.S.; Osipov, S.; Turner, J.W.G. Impact of Modern Vehicular Technologies and Emission Regulations on Improving Global Air Quality. Atmosphere 2023, 14, 1164. [Google Scholar] [CrossRef] [Scilit]
- Yang, Z.; Li, G.; Zhang, X.; Wang, P. Research on Microscopic Traffic Simulation Model in VISSIM. DEStech Trans. Comput. Sci. Eng. 2019, 14, 120–136. [Google Scholar] [CrossRef] [Scilit] [PubMed][Green Version]
- Krivda, V.; Petru, J.; Macha, D.; Novak, J. Use of Microsimulation Traffic Models as Means for Ensuring Public Transport Sustainability and Accessibility. Sustainability 2021, 13, 2709. [Google Scholar] [CrossRef] [Scilit]
- Villa, A.R.d.; Casas, J.; Breen, M.; Perarnau, J. Static OD Estimation Minimizing the Relative Error and the GEH Index. Procedia-Soc. Behav. Sci. 2014, 111, 810–818. [Google Scholar] [CrossRef] [Scilit]
- Beeston, L.; Blewitt, R.; Bulmer, S.; Wilson, J. Traffic Modelling Guidelines; Transport for London: London, UK, 2021.
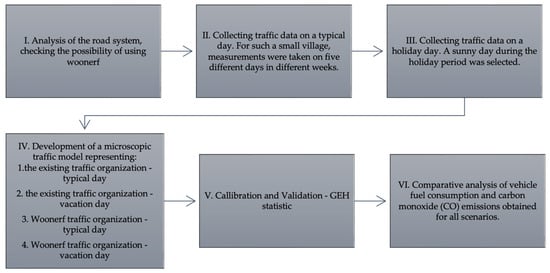
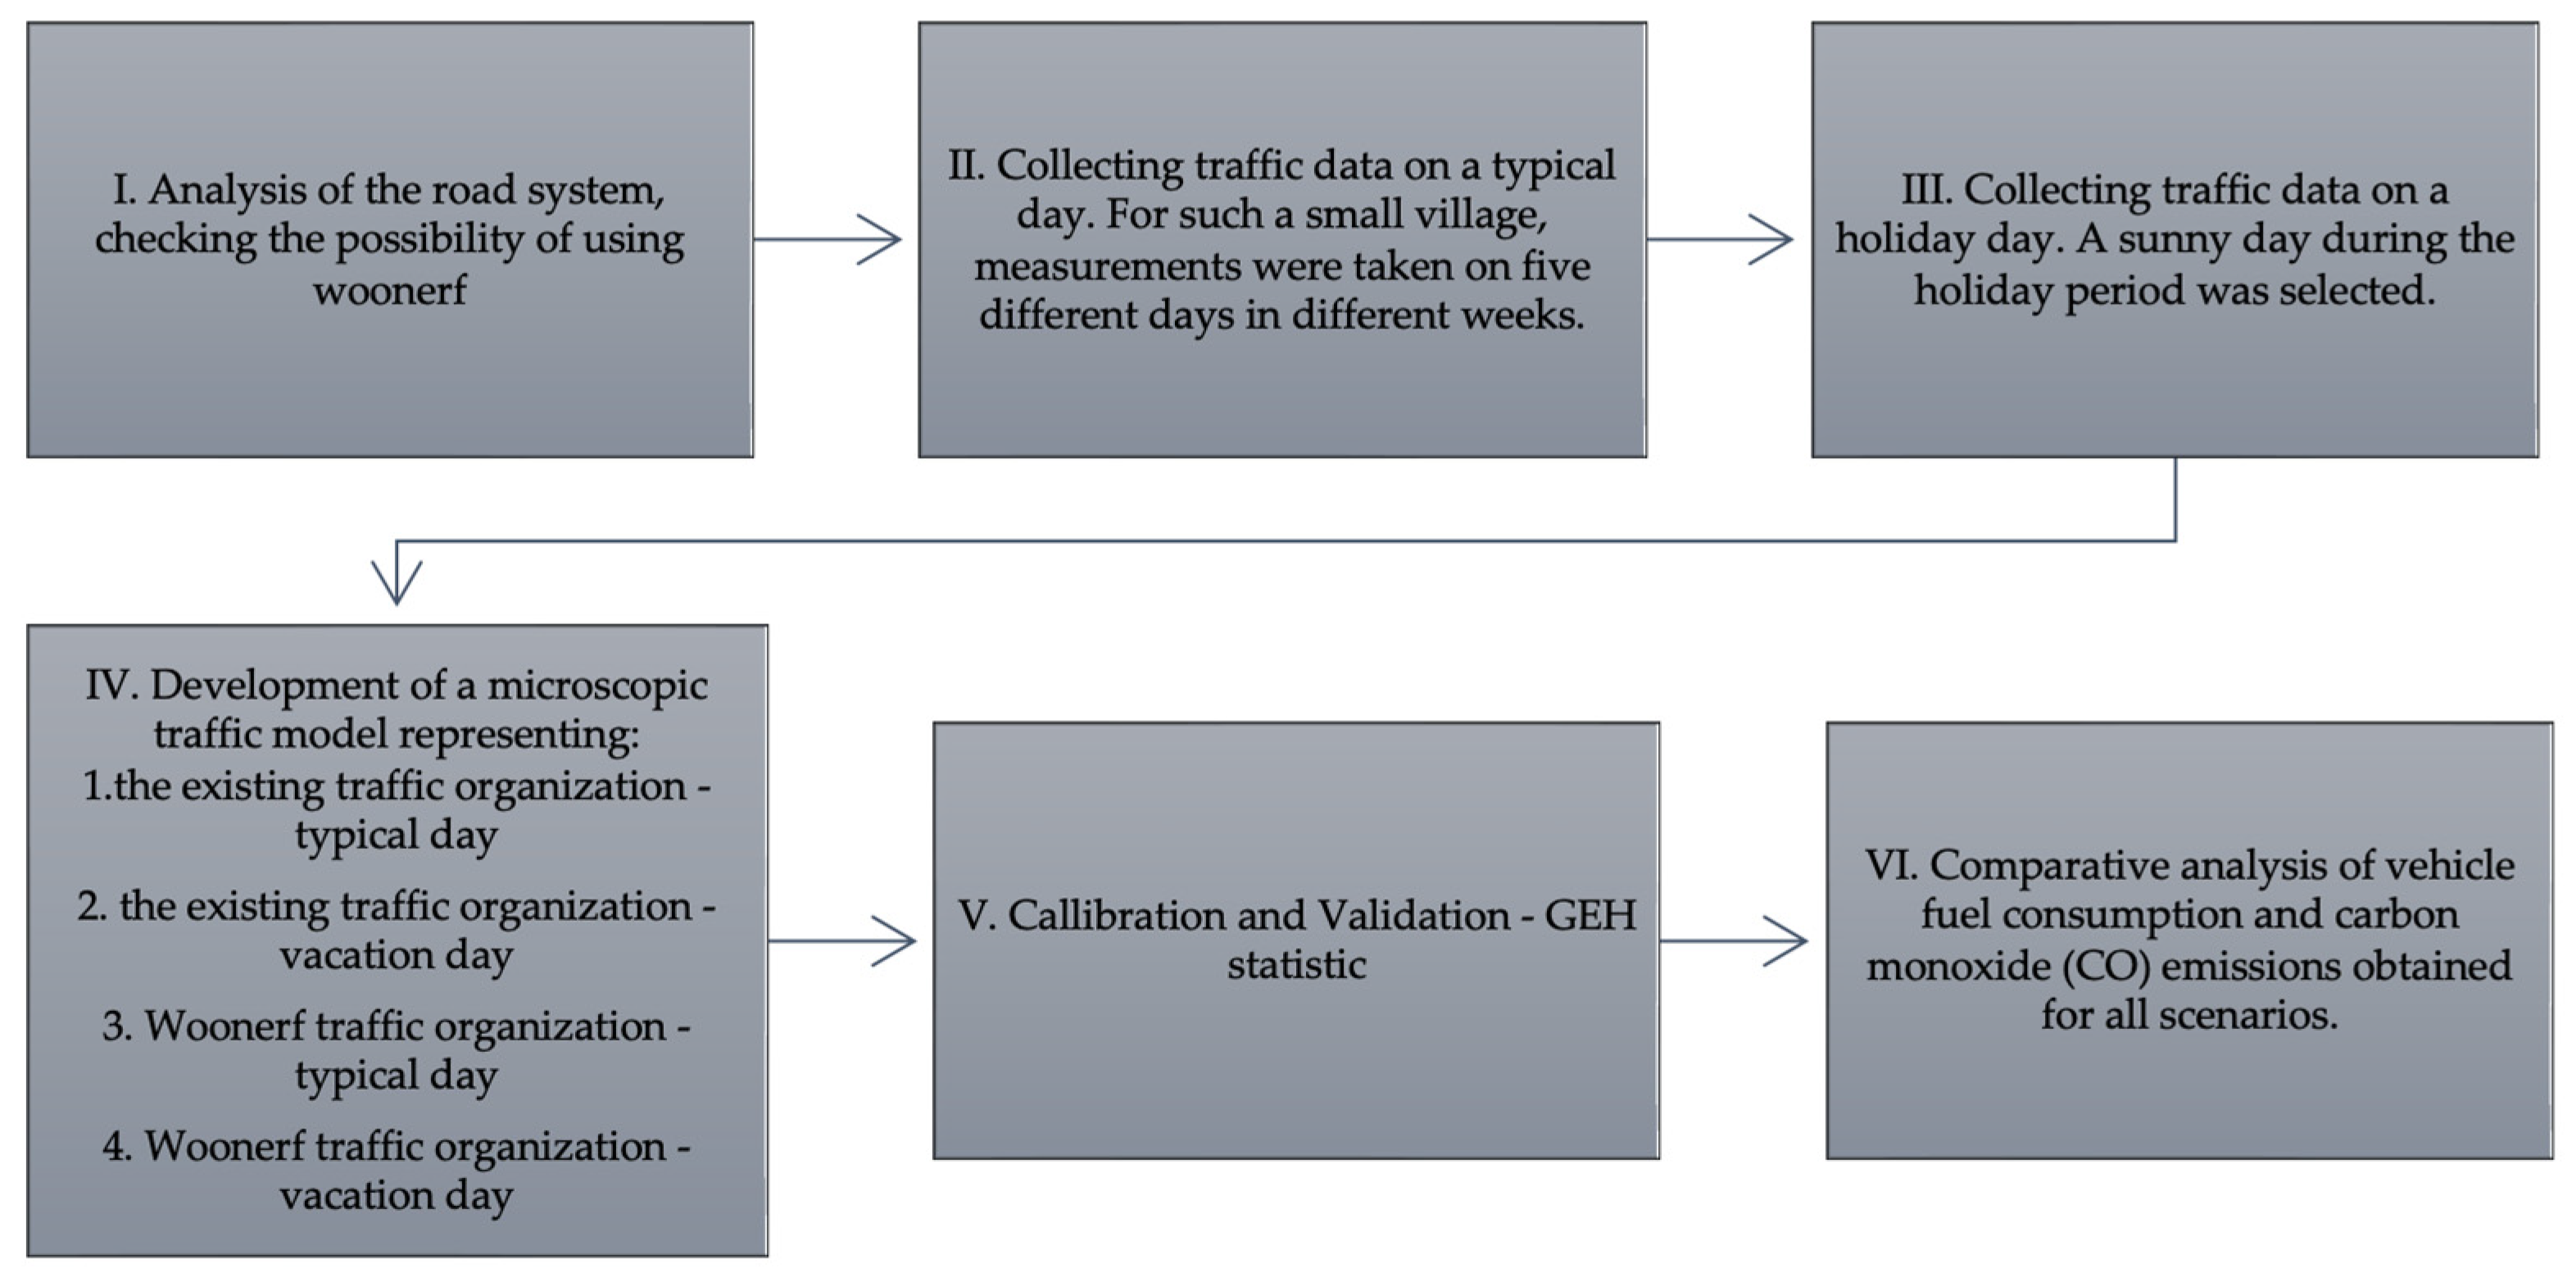
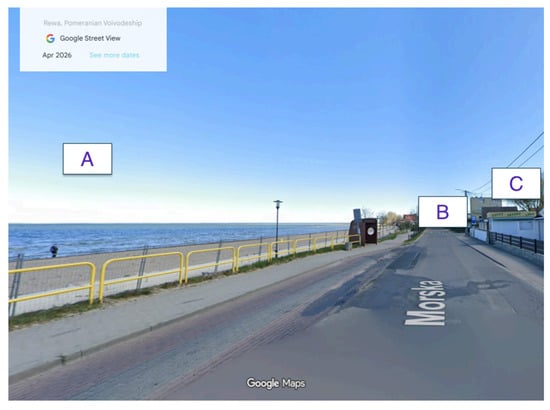
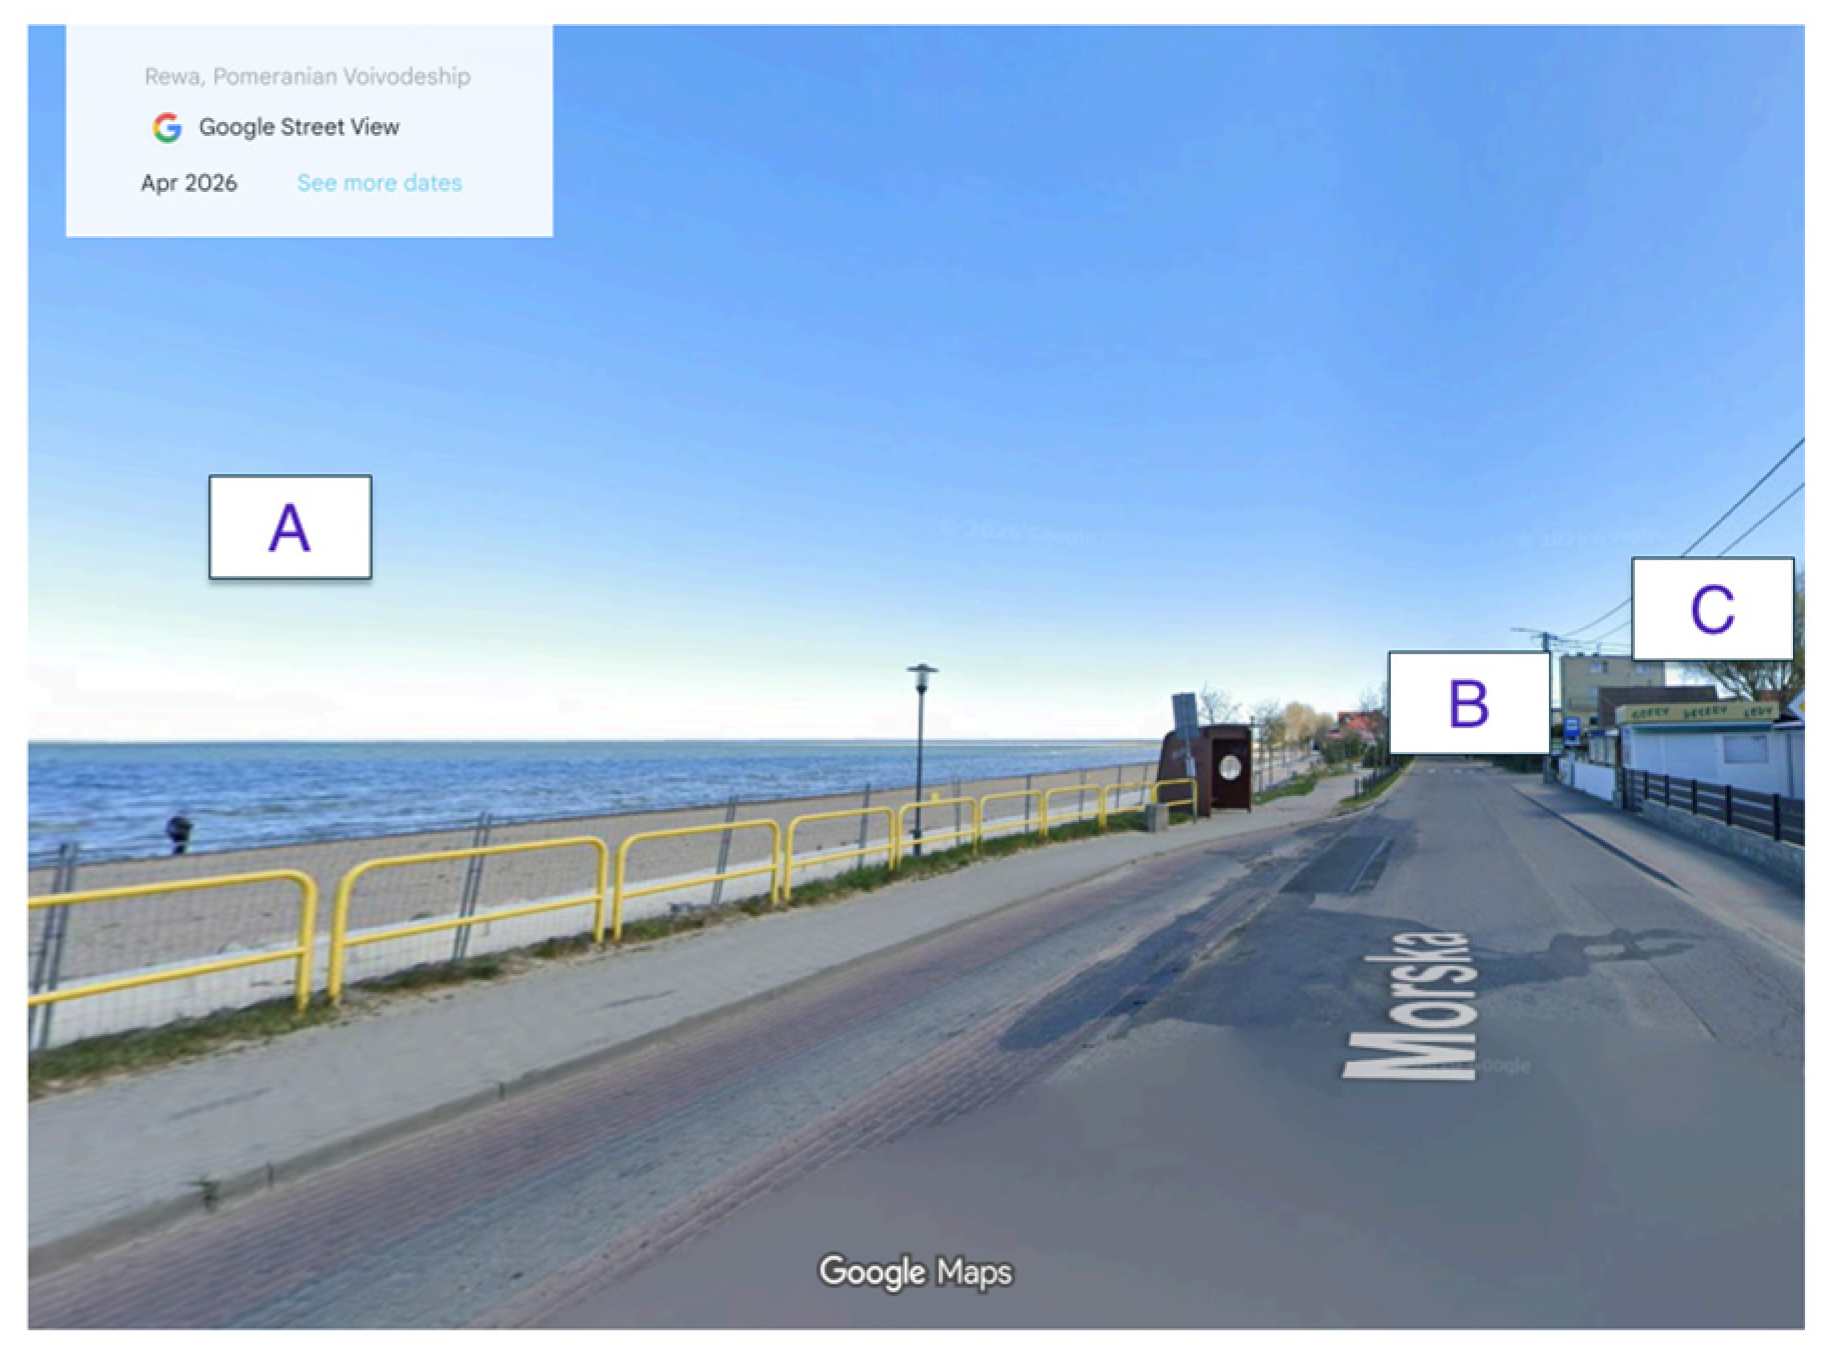
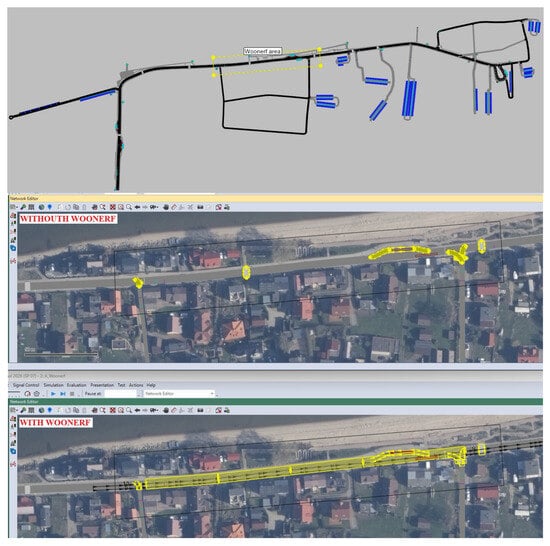
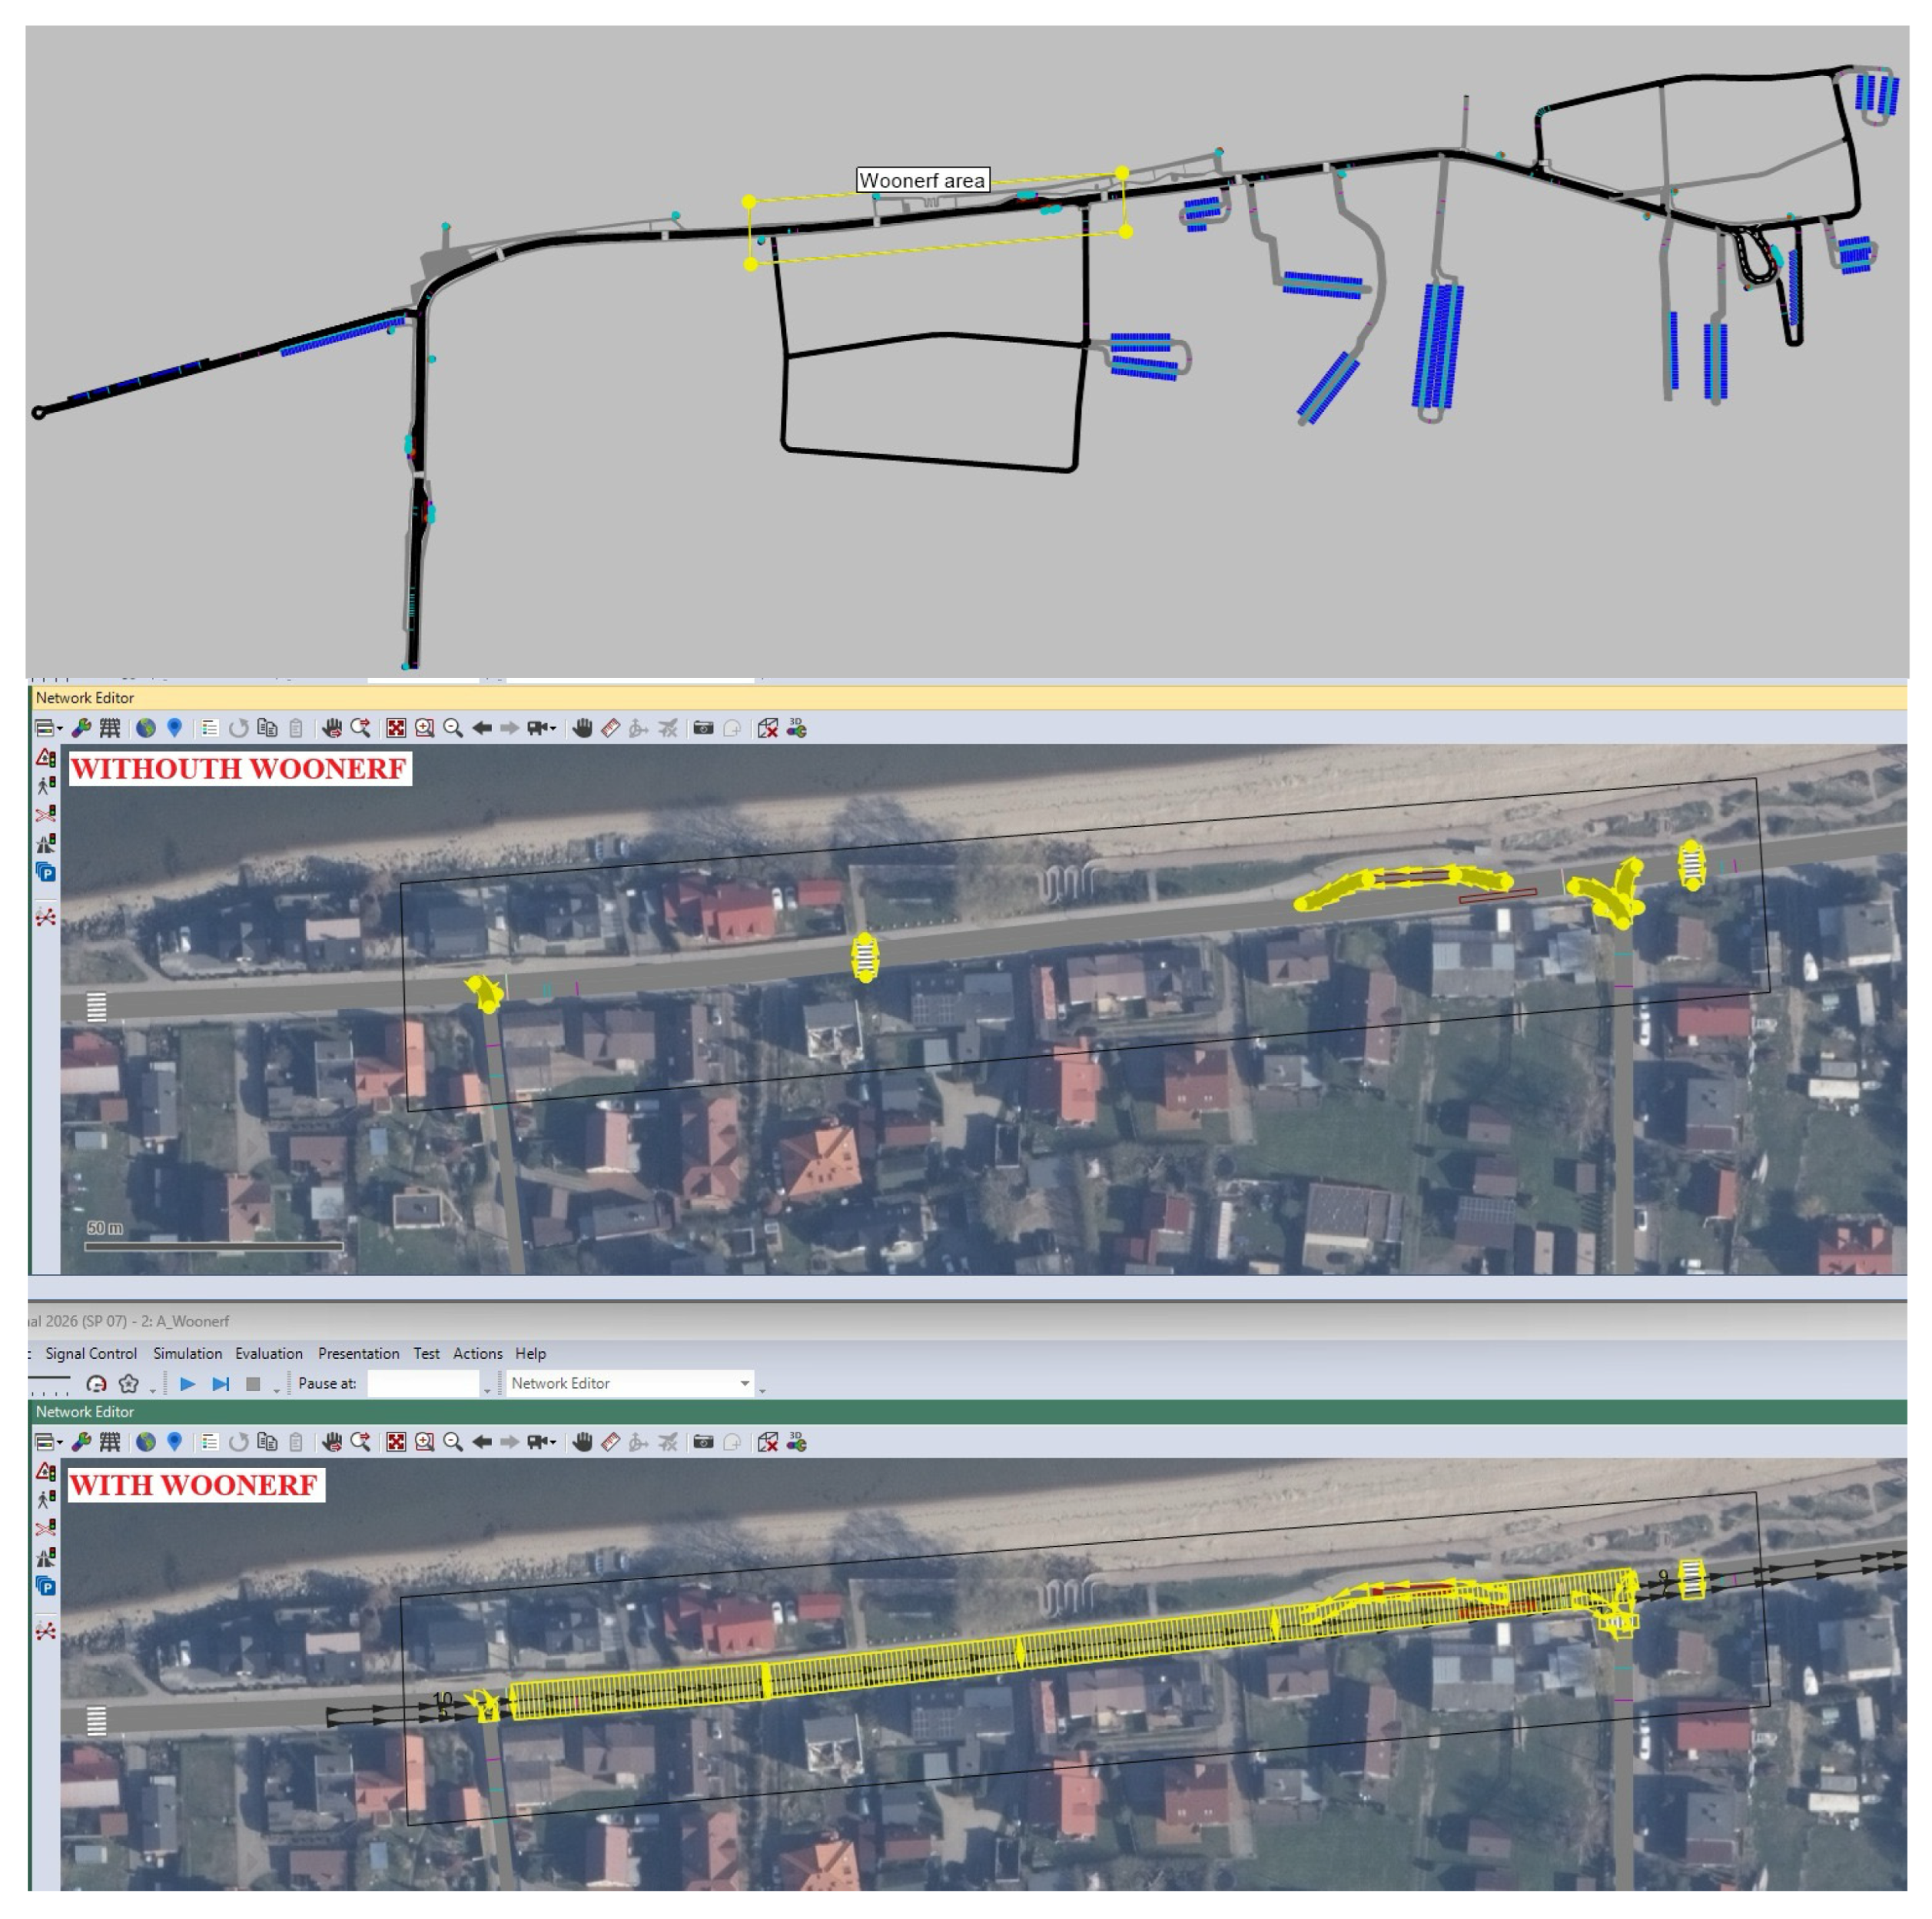
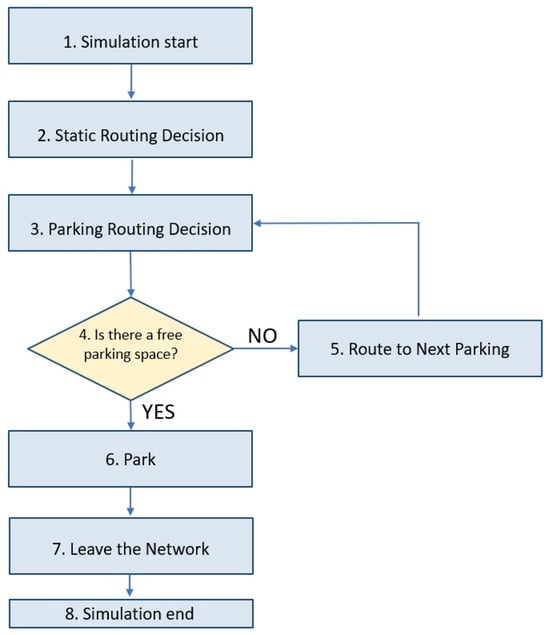
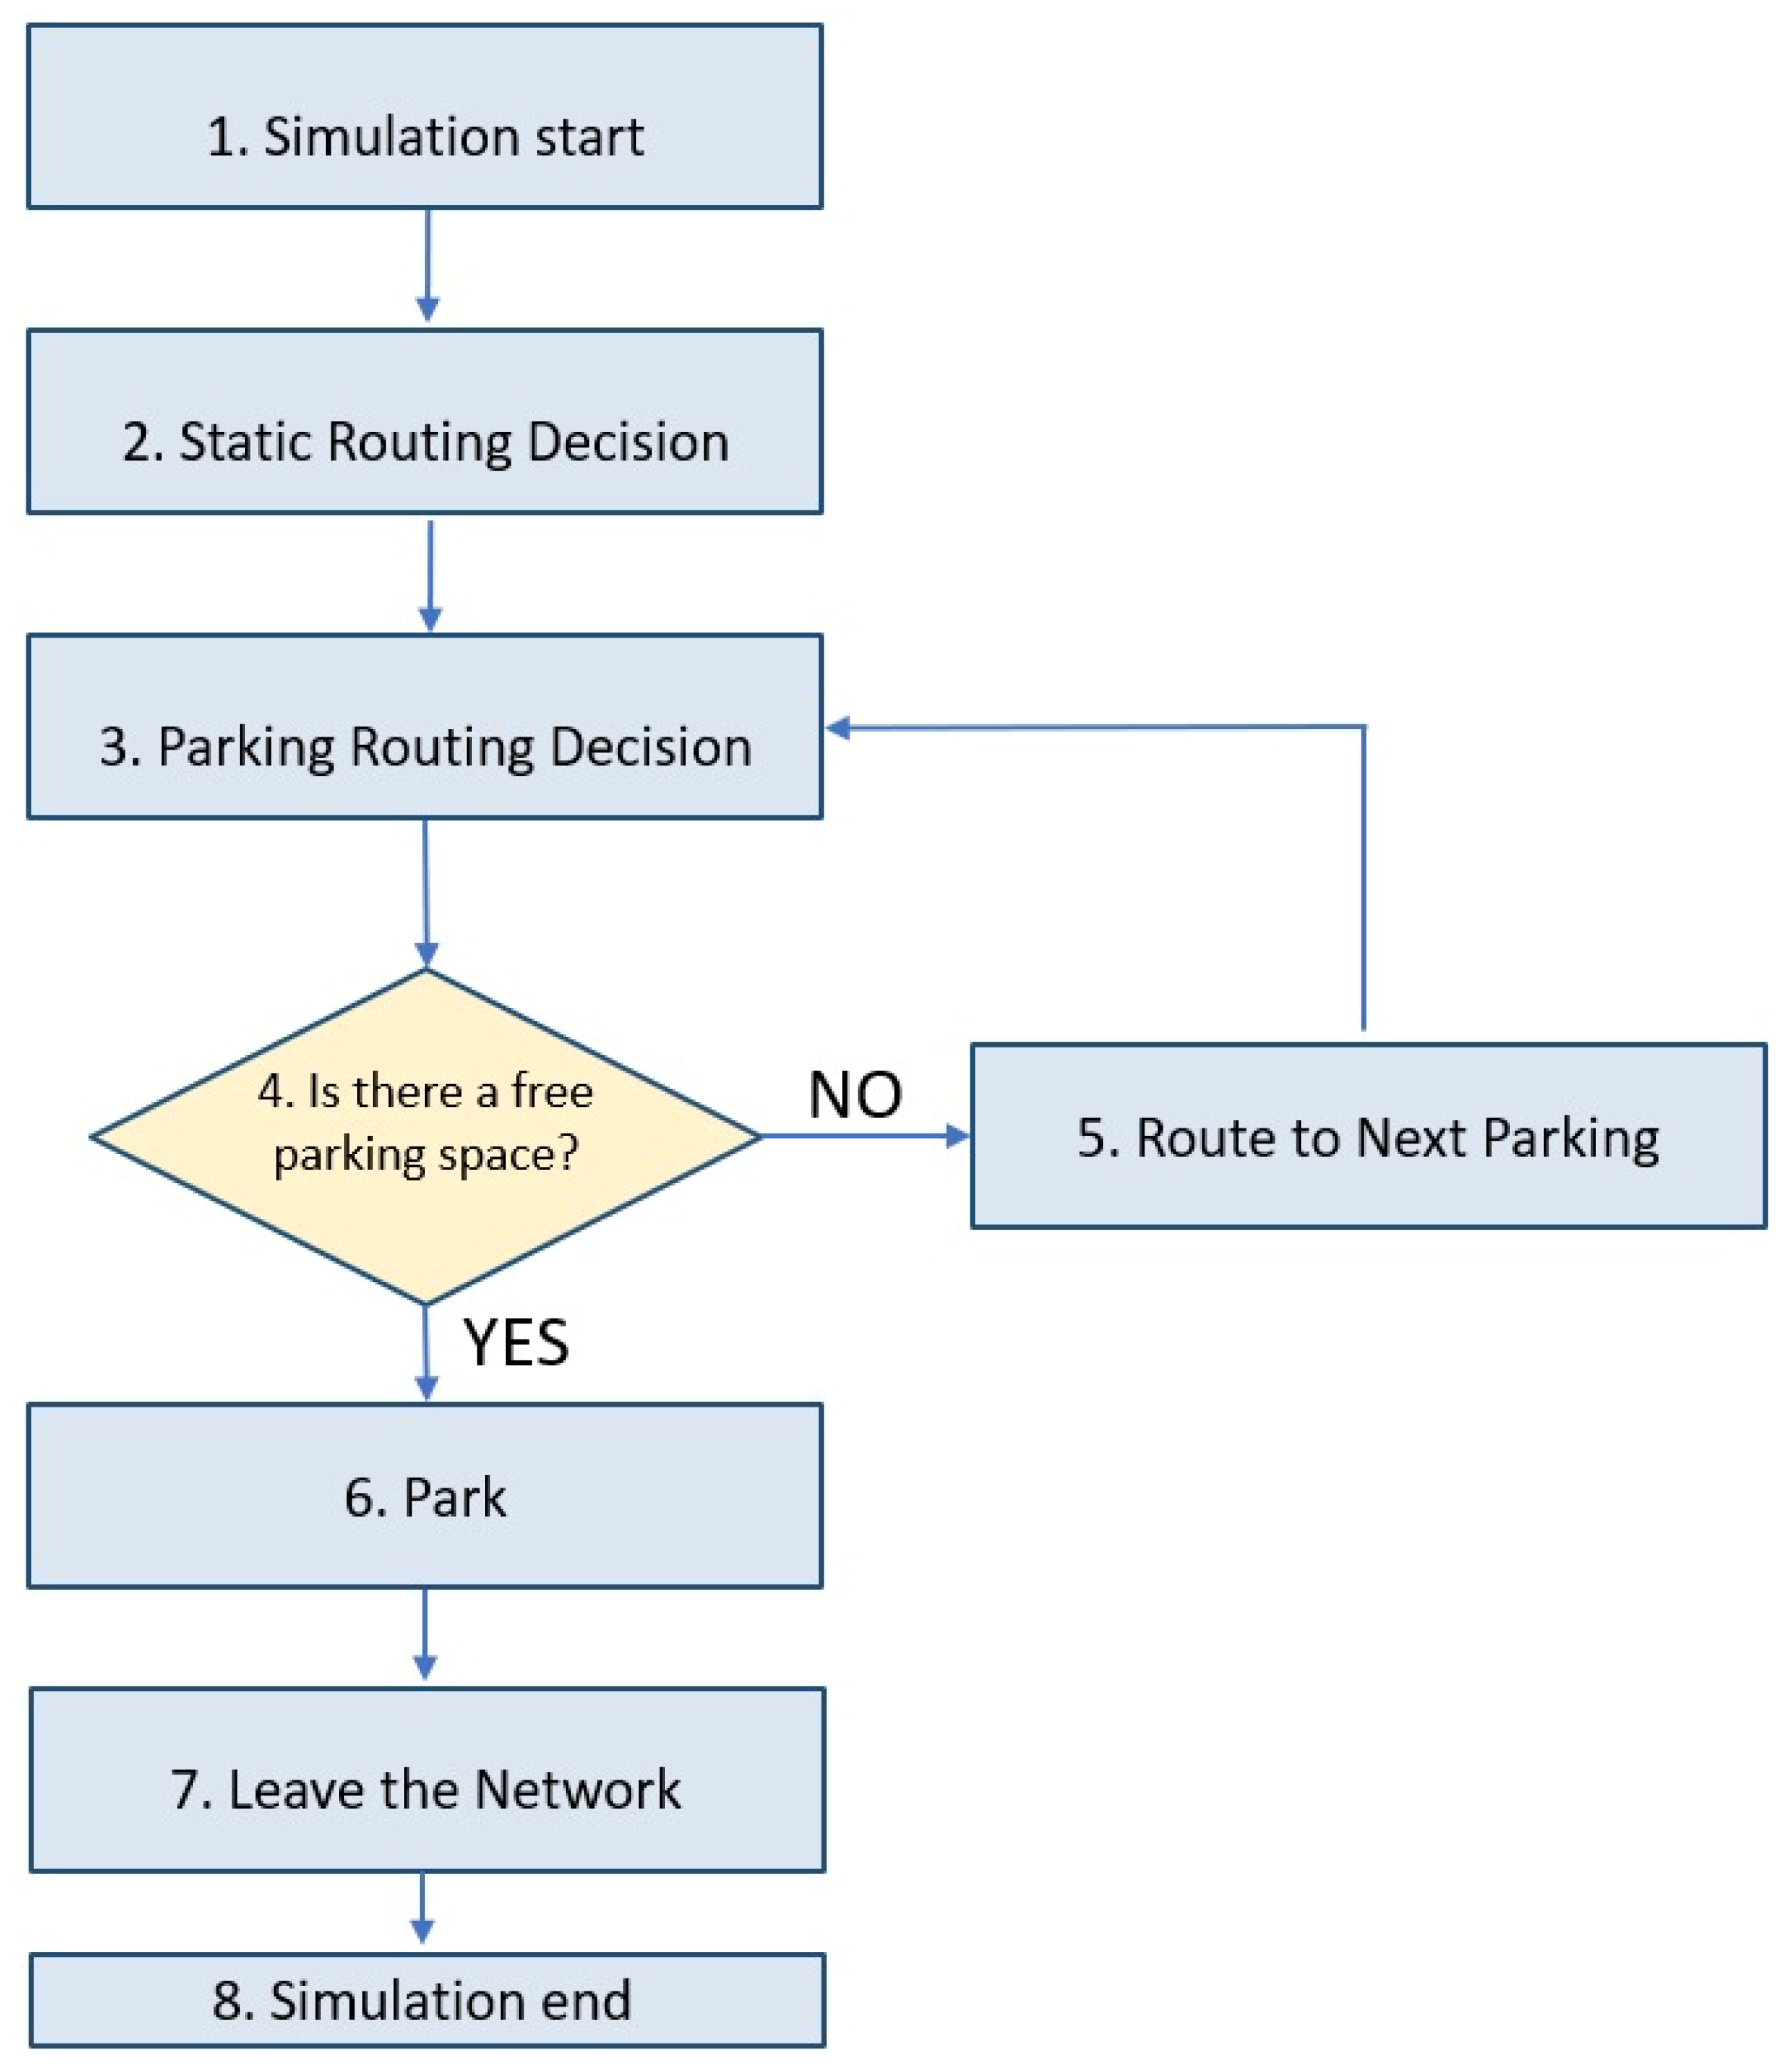
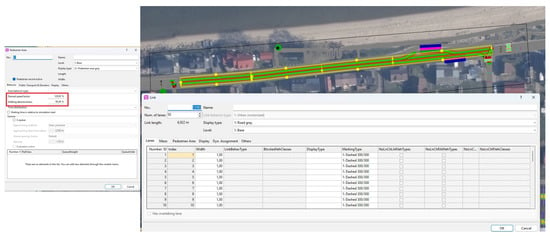
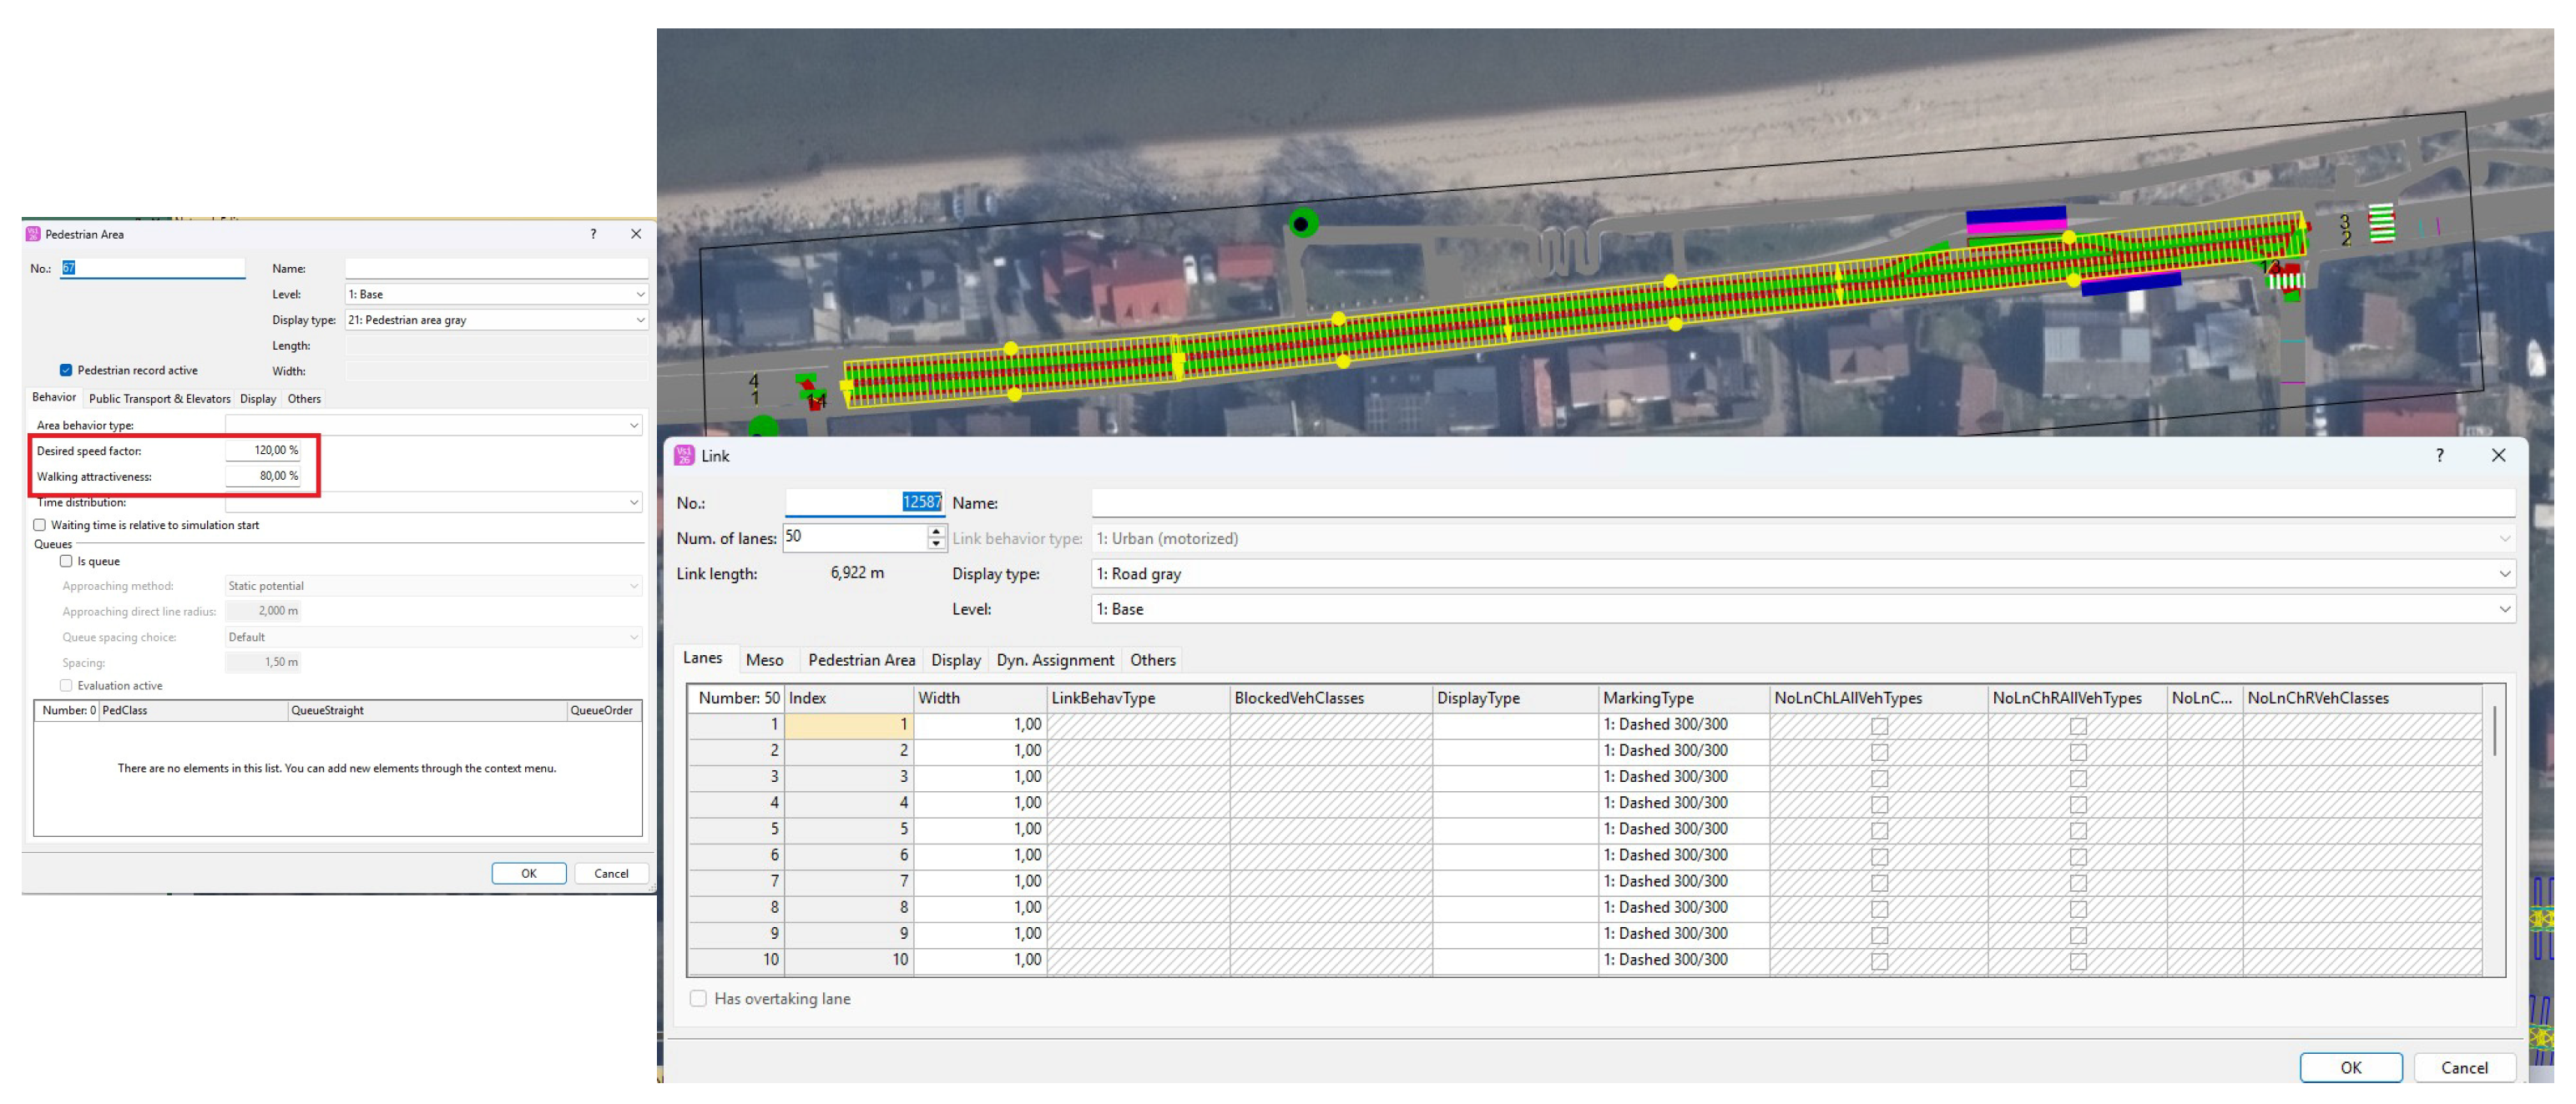
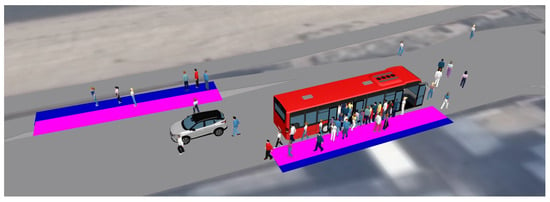
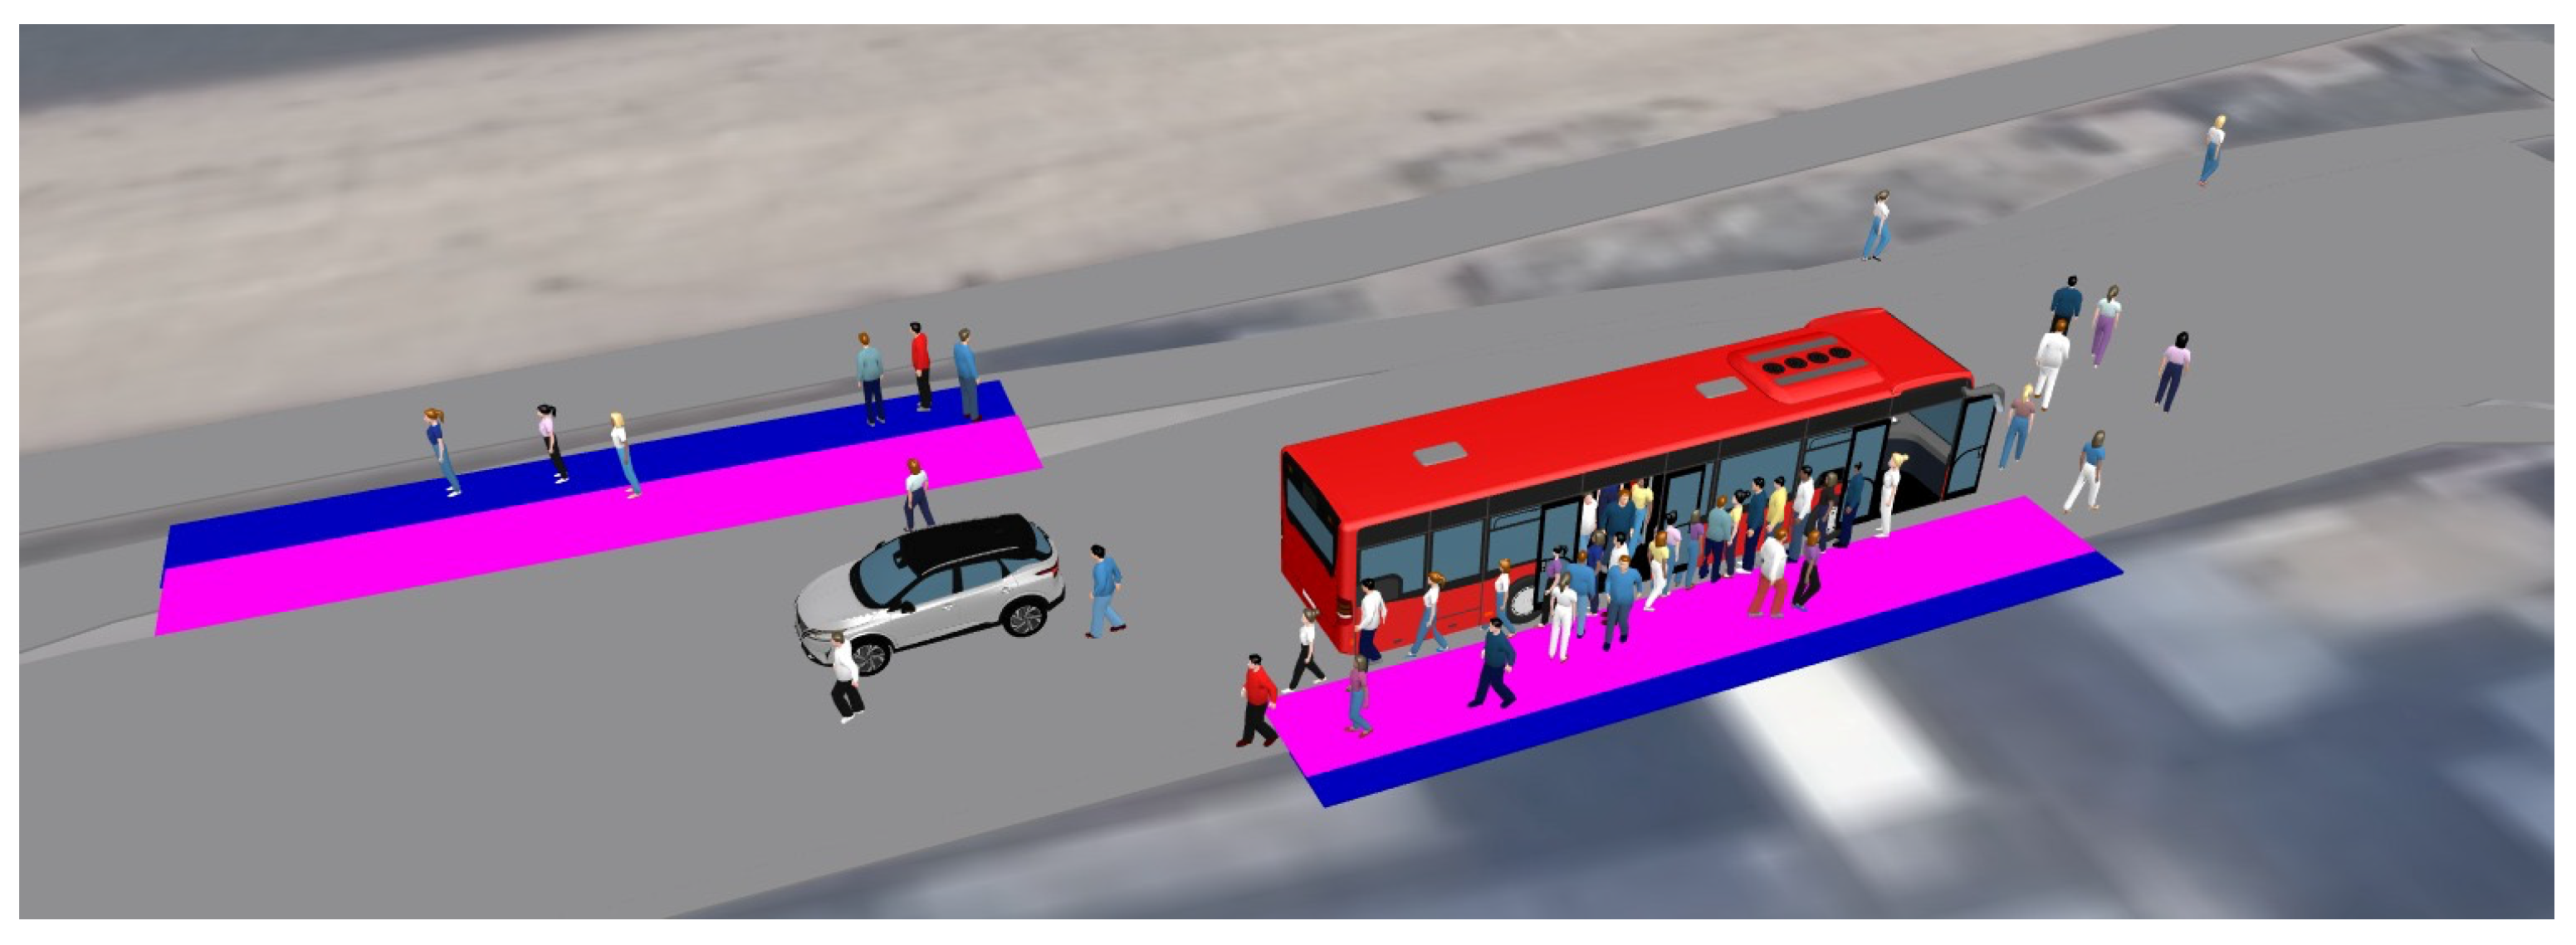
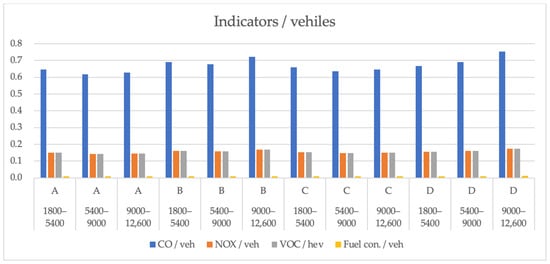
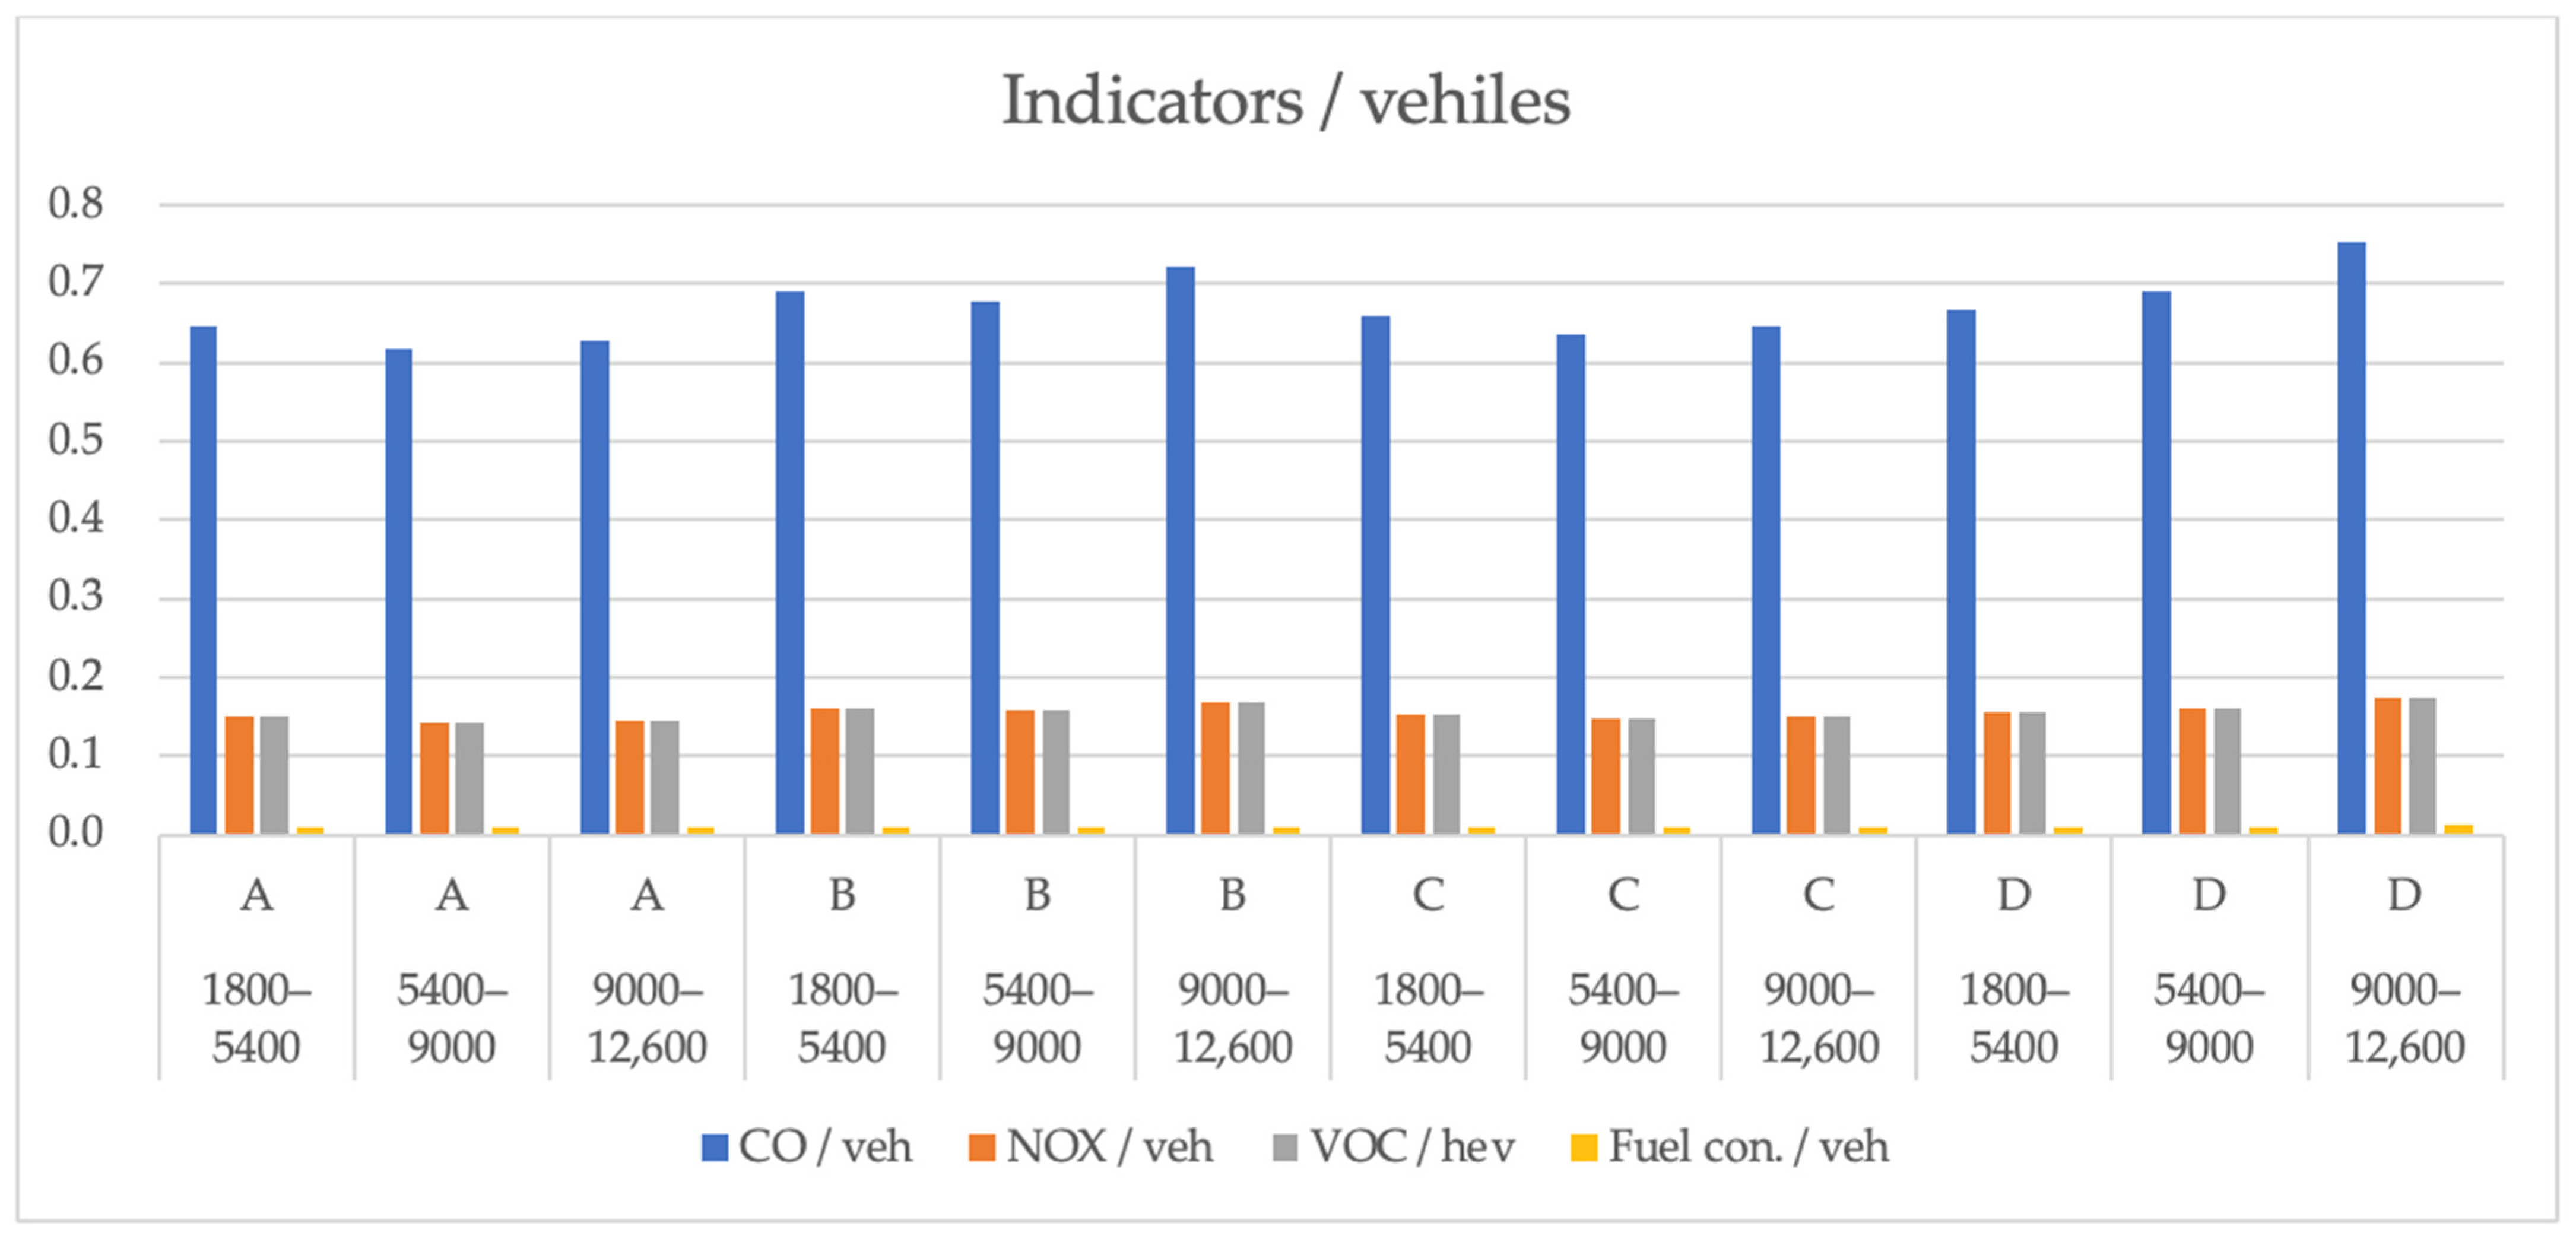

Disclaimer/Publisher’s Note: The statements, opinions and data contained in all publications are solely those of the individual author(s) and contributor(s) and not of MDPI and/or the editor(s). MDPI and/or the editor(s) disclaim responsibility for any injury to people or property resulting from any ideas, methods, instructions or products referred to in the content. |
© 2026 by the authors. Licensee MDPI, Basel, Switzerland. This article is an open access article distributed under the terms and conditions of the Creative Commons Attribution (CC BY) license.