


Abstract
Recently, the demand for long-distance underground tunnels constructed using the shield tunneling method has increased, raising the chance of encountering significant changes in ground composition during excavation. Ground composition is commonly evaluated based on discharged soil characteristics, earth pressure at the tunnel face, and cutter torque. However, these approaches generally provide average information about the excavation face and may not accurately represent local geological variations. Particularly, maintaining the vertical and horizontal alignment of shield machines can become difficult when hard ground is encountered, increasing the risk of machine climbing, sliding, and reduced excavation efficiency. To address this limitation, this study reports on the development of a real-time face visualization system for evaluating and visualizing ground composition at the tunnel face using measurements obtained from accelerometers installed directly beneath the cutter bit. The developed system was subsequently implemented and evaluated in an earth-pressure-balance shield tunnel excavated using a 2.36 m diameter shield machine. The results demonstrated qualitative correspondence between measured acceleration responses and observed ground compositions, indicating the potential of the proposed system for real-time visualization and prediction of major ground transitions ahead of the excavation face. At the same time, detailed field validation remains limited to the investigated projects, and further validation is needed to evaluate discrimination and prediction performance under different geological conditions. Therefore, the system should be regarded as a supplementary tool that complements conventional geological investigations and supports excavation management.
1. Introduction
Recently, with rapid urbanization, there has been an increasing demand for the construction of long-distance underground tunnels as part of infrastructure development projects for sewage systems, communications, and roads. The shield tunneling method plays a key role in these efforts. In addition, there is a growing trend toward longer shield tunnels to avoid the complications associated with launching, intermediate, and arrival shafts, particularly issues related to land acquisition and the congestion of underground utilities and buried structures [1,2,3]. For long shield tunnels, a single span can reach 4–5 km for sewage and water supply systems and 5–10 km for road tunnels, which increases the likelihood of encountering significant changes in ground composition during excavation [4,5]. Hence, controlling earth and slurry pressure at the tunnel face, as well as maintaining the slurry quality, becomes increasingly challenging.
Typically, changes in ground composition during excavation in closed-type shield tunnels are evaluated based on pre-construction boring surveys, as well as the characteristics of discharged soil, earth pressure at the tunnel face, and cutter torque. A pre-construction boring survey is performed to establish a geological profile and identify the main components of the ground composition within the planned excavation section. However, due to economic constraints, boreholes are typically spaced at intervals of up to 200 m. As a result, the geological profile is often interpolated between investigation points, which can overlook significant local variations and fail to capture detailed subsurface conditions between boreholes. The evaluation of ground composition based on discharged soil tends to reflect average ground conditions at the excavation face, potentially leading to excavation without a precise understanding of the actual ground composition. Particularly, maintaining the vertical and horizontal alignment of shield machines can become challenging when hard strata are encountered, increasing the risk of machine deviation in both directions during excavation. Therefore, accurately understanding ground composition is essential for maintaining tunnel face stability and ensuring a safe excavation process [6,7,8].
Approaches to face stability vary depending on the shield tunneling method, such as earth pressure balanced shield and slurry-shield-driven tunnelling [9,10], which depend on geology, depth of tunneling and close existence of other structures [11,12,13,14,15], and type of ground composition [16,17,18]. In recent years, significant efforts have been devoted to ground characterization using machine learning techniques based on TBM operational parameters, geophysical forward-prospecting methods, acceleration-based monitoring systems, and other related approaches.
Machine learning and deep learning techniques have been applied to cutterhead torque, thrust force, penetration rate, rotational speed, chamber pressure, and other operational data to infer geological conditions during excavation. For example, Kang et al. [19] developed machine-learning models using TBM operating parameters and demonstrated that ensemble-learning algorithms and Light Gradient Boosting Machine could effectively classify soil conditions encountered during tunneling. Similarly, Liu et al. [20] proposed a Long Short-Term Memory (LSTM) framework for predicting geological parameters from real-time TBM monitoring data and reported high prediction accuracy for multiple geological indicators. Qiu et al. [21] further developed a real-time surrounding rock identification model based on TBM tunneling performance and machine-learning techniques. These approaches demonstrated promising classification accuracy and enabled continuous interpretation of ground conditions without additional instrumentation. However, their performance generally depends on the availability of large training datasets and geological labels obtained from previous site investigations. Furthermore, model transferability between tunnel projects remains a challenge because machine–ground interaction is strongly influenced by local geological conditions and TBM specifications.
Geophysical forward-prospecting methods, including tunnel seismic prediction, seismic reflection, and electrical resistivity techniques, can detect geological anomalies ahead of the tunnel face and are particularly useful for identifying faults, fractured zones, and water-bearing formations before excavation reaches them. Recent developments have also enabled the integration of seismic sensing systems with TBMs for advanced geological forecasting during excavation [22,23]. While such methods provide valuable predictive information, they often require additional equipment, specialized data interpretation, and interruption or modification of routine excavation activities. Consequently, implementation complexity and operational costs may limit their application for continuous monitoring during shield tunneling.
Acceleration-based monitoring provides an alternative approach because the interaction between the shield machine and surrounding ground generates mechanical responses that are related to soil and rock properties. Several studies have investigated cutterhead acceleration measurements and signal analysis for ground characterization, including both direct measurements at the cutterhead [24,25,26,27,28,29,30,31,32] and indirect acceleration measurements within shield machines [33,34,35,36]. More recently, acceleration signals combined with deep-learning techniques have also been successfully applied to rapid rock mass classification and ground-condition identification during tunneling. Nevertheless, many previous investigations focused primarily on signal interpretation or classification, whereas practical implementation for continuous face visualization and real-time assessment during routine shield excavation remains limited.
One of the first practical implementations of ground composition assessment at the tunnel face was reported by Shinohara et al. [37]. The case reported by Shinohara et al. [37] involved a sewer tunnel with a diameter of 9450 mm and a tunnel length of 4435 m, for which cutter bit replacement was required during excavation. Because the ground consisted of hardened silt and loose sand, cutter-bit replacement was preferably conducted under relatively stable geological conditions. To determine the soil composition at the tunnel face, a special cutter bit equipped with an accelerometer sensor was mounted on a 9450 mm diameter slurry shield machine (Figure 1). This setup enabled differentiation between silt and sand based on variations in cutting acceleration levels. This technique effectively identified ground composition and accurately performed soil assessments that matched the pre-construction boring survey results, allowing determination of optimal locations for cutter bit replacement. However, the technology relied on comparing acceleration waveform of the target soil—confirmed in advance through laboratory tests—with acceleration data recorded by the cutter bit during excavation. This approach presented challenges, including the large size of the device and its limited applicability to small- and medium-diameter shields or cutterhead-type shield machines. Additionally, the system was designed specifically to identify ground conditions for cutter-bit replacement and lacked continuous measurement and data collection. As a result, its development did not extend to applications such as real-time geological performance monitoring during excavation or predictive analysis of geological conditions ahead of the tunnel face.
Figure 1.
A photograph of a shield tunnelling machine with spherical bit replacement.
The studies reviewed above demonstrate that real-time ground characterization can be achieved through machine-learning approaches, geophysical prospecting techniques, and acceleration-based monitoring. However, machine-learning methods require extensive training data, geophysical methods often require additional instrumentation, and many previous acceleration-based approaches rely on accelerometers installed within the shield machine or provide only average information for the tunnel face.
To address these limitations and the need for continuous ground-condition assessment at the “invisible tunnel face” of closed-type shield machines, an acceleration-based face visualization system was developed. The proposed system utilizes accelerometers installed directly beneath the cutter bits on the cutterhead, enabling direct measurement of acceleration responses generated at the cutter–ground interaction locations. By combining these measurements with the circumferential position of the rotating cutterhead, the spatial distribution of acceleration can be mapped continuously across the tunnel face. Consequently, localized variations in ground conditions can be visualized in real time rather than being inferred from average excavated face conditions. The development of the proposed system consisted of laboratory testing, sensitivity verification on an actual shield machine, and field application.
First, an experimental program was established using specially designed testing equipment to simulate the excavation process of a shield machine by cutter bits. Accelerometers were installed on two different types of cutter bits, and their responses were analyzed while simulating excavation in representative ground materials, including clay, sand, and RC40. The objective of these experiments was to investigate whether differences in ground composition could be identified through variations in the acceleration signals measured by accelerometers installed on the cutter bits. The experimental results demonstrated that each material exhibited distinct acceleration response characteristics, thereby establishing the fundamental concept for distinguishing ground composition based on acceleration measurements.
Next, based on the concept of distinct acceleration response characteristics, accelerometers were installed directly beneath the cutter bit (unlike previous approaches) of an actual shield machine. Prior to field application, the sensitivity of the installed accelerometers was verified through indoor testing conducted immediately after shield machine assembly, both with and without externally applied vibration. Continuous acceleration measurements were obtained by applying vibration at the outer edge of the rotating cutterhead, and the resulting data were used to evaluate measurement sensitivity and system performance.
The developed face visualization system is based on the continuous measurement of accelerometer responses generated during cutter–ground interaction. The system provides real-time transmission of data to the shield-tunneling operational control room, enabling monitoring of ground composition at the tunnel face. It also supports direct assessment of ground conditions encountered during excavation by organizing the measured acceleration data for each ring into contour diagrams aligned with the excavation direction. This paper presents a detailed case study of the system’s application in an earth-pressure-balance shield tunnel excavated using a 2.36 m diameter shield machine. Furthermore, the capabilities of the developed system for predicting changes in ground composition ahead of the tunnel face, through the analysis of previously identified ground composition patterns encountered during excavation, are also demonstrated and discussed. It should be noted that the proposed system is not intended to replace conventional geological investigations; rather, it serves as a supplementary tool that provides continuous ground-composition information to support excavation management, face stability assessment, and shield attitude control.
2. Experimental Program and Methods
2.1. Experimental Study on Acceleration Measurements Using Specially Designed Testing Equipment
2.1.1. Overview of Specially Designed Experimental Equipment
To accurately identify ground changes, a face visualization system is expected to be an effective method that can evaluate the ground composition at the tunnel face and incorporate the information into excavation management. The system utilizes accelerometers embedded directly beneath the cutter bits to characterize the ground composition based on the acceleration responses generated by cutter–ground interaction during cutterhead rotation. The concept of the system was developed based on the findings of a series of experiments conducted on newly designed and constructed equipment that simulated the shield excavation process. These experiments established the relationship between accelerometer responses and soil type, providing the fundamental framework for ground characterization. The resulting methodology was subsequently incorporated into the processing and interpretation of acceleration data acquired from accelerometers installed on an operational shield machine.
A schematic illustration of experimental equipment is presented in Figure 2, and its specifications are summarized in Table 1. The apparatus was designed to simulate the shield tunneling process through cutter rotation and soil excavation using a cutter bit. Here, the vertical velocity (z-direction) corresponds to the shield jack extension rate (shield advance rate), whereas the horizontal velocity (x-direction) corresponds to the peripheral velocity associated with cutterhead rotation. To accommodate variations in shield machine scale and operational performance, the apparatus was designed to operate at vertical velocities ranging from 20 to 50 mm/min and horizontal velocities ranging from 150 to 300 mm/s, enabling the simulation of experimental conditions representative of actual tunneling operations. The soil tank was constructed with dimensions of 300 mm in height, 300 mm in width, and 1500 mm in length. These dimensions were selected to minimize boundary effects associated with tank-size constraints while maintaining a soil layer depth exceeding three times the height of the cutter bit.
Figure 2.
Schematic illustration of experimental equipment for acceleration measurement.
Table 1.
Overview of experimental equipment.
2.1.2. Experimental Testing Program
Based on previous shield tunneling experience, the acceleration responses measured on shield machines are generally influenced by factors such as soil type, soil density, cutting speed, and cutter-bit geometry. To quantitatively evaluate the effects of these parameters, a series of acceleration measurement experiments was conducted by varying the soil type, density, cutter rotation speed, and cutter-bit geometry. Three representative soil materials—sand, clay, and gravelly material—were used in the experimental program (Table 2). The sandy material consisted of standard concrete aggregate sand, while clay was obtained from the tunnel shaft construction site and adjacent excavation areas. To represent gravelly ground, recycled crushed stone (RC40) was employed. RC40 possesses a controlled particle-size distribution ranging from 0 to 40 mm and conforms to the quality specifications for pavement base-course materials established in Japan. Accordingly, it was selected as a representative and reproducible gravelly material for evaluating cutter-bit acceleration responses under coarse-grained ground conditions. For each soil type, test specimens with different wet densities were prepared to represent varying degrees of compaction, representing loose, medium-dense, and dense conditions. In total, 54 experimental cases were conducted in accordance with the testing program summarized in Table 3.
Table 2.
Properties of soil materials used in the experiments.
Table 3.
Summary of experimental work.
To investigate the influence of cutter-bit geometry on acceleration responses, two types of cutter bits were used (Figure 3). Bit-1 is a reinforced cutter bit (Figure 3a), designed for excavation in gravelly ground, whereas Bit-2 is a conventional cutter bit (Figure 3b) primarily used in silty sand and clayey soils. The geometric characteristics and dimensions of both cutter bits are presented in Figure 3.
Figure 3.
Cutter bits schematic illustration (dimensions in mm).
2.2. Experimental Study on Actual Shield Machine
2.2.1. Acceleration Data Collection and Measurement Method
Prior to application at the actual construction site, a full-scale validation test was conducted to verify the installation method of the accelerometers on the shield machine and to confirm the operation and sensitivity of the measurement system.
Previous studies on acceleration measurement in shield tunneling have reported limitations associated with shield geometry and machine size. Therefore, the present study aimed to establish a measurement methodology applicable to shield machines of various diameters, with particular emphasis on small- and medium-diameter machines. Primary objectives were to evaluate the feasibility of characterizing ground composition at the tunnel face using accelerometers installed beneath cutter bits mounted on the cutterhead faceplate.
To accurately characterize ground composition, it is necessary to determine an appropriate measurement frequency and sampling interval in relation to the cutterhead rotational speed. When acceleration is measured at the outer periphery of a rotating cutterhead, the angular measurement interval (Δθ) is determined by the data collection time interval (Δt) and the cutterhead rotational speed r (rotations/min (rpm)). Since small- and medium-diameter shield machines typically operate at relatively high rotational speeds, a shorter sampling interval is required to obtain a sufficient number of measurements over one cutterhead rotation. Accordingly, the data collection interval was set to 0.1 s. To determine the angular position (θ°) of the accelerometer during cutterhead rotation, a contact switch was installed on the central shaft. The switch resets the angular reference position once per rotation, with the top of the shield defined as 0°.
The data collection interval is calculated according to the following equation:
With the maximum allowable cutter’s rotation speed of r = 6 rpm for the current shield machine setting, the measurement interval is set as follows:
Acceleration data can be acquired using either alternating-current (AC) or direct-current (DC) outputs. The appropriate output mode must be selected according to the measurement objectives and the specifications of the shield machine. AC output records raw acceleration signals, enabling measurement of both acceleration magnitude and waveform characteristics to be analyzed. In contrast, DC output provides a smoothed acceleration magnitude (cm/s2) obtained through a moving-average filtering process. Smoothing effect of DC output is controlled by the time constant, which determines the degree of temporal averaging applied to the measured signal. The selection of an appropriate time constant is critical because it directly influences the balance between measurement stability and responsiveness. A shorter time constant increases the sensitivity of the system to rapid acceleration fluctuations but may also increase susceptibility to high-frequency noise and instantaneous impact effects. Conversely, a longer time constant improves signal stability by suppressing short-term fluctuations, although it may delay the detection of abrupt changes in ground conditions. Therefore, considering both noise reduction and sensitivity to meaningful variations in ground composition, DC output with a smoothing time constant of 2τ = 0.1 s (τ denotes the filter time constant) was adopted as a practical compromise between signal stability and responsiveness.
The measurement procedure is illustrated in Figure 4. Signals generated by the accelerometers are first transmitted to a dedicated amplifier and subsequently processed through the control and sequencer panel configured for DC output acquisition. The processed signals are then transmitted to the operation control room through the shield machine communication system. There, the measured acceleration data are synchronized with excavation management data, organized according to measurement time, and stored in a database linked to the corresponding excavation ring number.
Figure 4.
Overview of the acceleration data acquisition and visualization system (dotted and solid arrows indicate the flow of raw and analyzed data, respectively).
2.2.2. Accelerometer Installation and Measurement Conditions
The accelerometers were installed at different locations on the shield machine beneath cutter bits located near the outer periphery of the cutterhead. Therefore, the measured acceleration responses were expected to be influenced by both the cutterhead rotational speed and the shield jack extension rate. An accelerometer aligned with the circumferential direction (x-axis) was mounted beneath a cutter bit located near the outer periphery of the cutterhead to capture acceleration responses generated by cutter–ground interaction during cutterhead rotation. A second accelerometer was installed on the bulkhead and oriented in the axial direction of the shield machine (y-axis) to evaluate the influence of shield advance conditions, including jack extension rate and thrust pressure acting on the cutter face. In addition, the bulkhead-mounted accelerometer was used to monitor mechanical accelerations and background noise generated by the shield machine itself. To quantify the effects of these operational parameters, acceleration measurements were conducted in two orthogonal directions (x- and y-axes), as illustrated in Figure 5.
Figure 5.
Accelerometer sensor mounting position.
Acceleration measurements were performed during cutterhead rotation under two operational conditions: without external vibration application (Case 1—no impact) and with continuous vibration generated by a high-frequency vibrator (Case 2—continuous impact). The measurement conditions were defined as follows.
- (a)
- Measurement startAutomatic data acquisition was initiated when the shield jack stroke reached 100 mm from the start of excavation. This threshold was adopted to ensure stable excavation conditions and to minimize the influence of transient effects occurring immediately after excavation startup.
- (b)
- Number of measurements, N (applied to field measurements presented in Section 4)The excavation length corresponding to one segment ring was 750 mm, which is equivalent to the segment width. During the excavation of each ring, acceleration data corresponding to five cutterhead rotations were automatically recorded. The number of measurements, N, within one ring was determined from the shield jack extension rate and the cutterhead rotational speed according to the following equation:where s is a jack extension rate (mm/min) and r is a cutterhead rotation speed (rpm). In typical shield tunneling operations, the shield jack extension rate ranges from 10 to 50 mm/min. For the shield machine presented in this study, the maximum cutterhead rotational speed during excavation was 2.3 rpm. Under these operating conditions, the number of measurements approximately ranged between 50 to 150.
- (c)
- Measurement itemsFor each ring, acceleration data obtained over five cutterhead rotations were automatically recorded at both the cutterhead and the bulkhead in two orthogonal directions: the circumferential direction (x-axis) and the axial direction (y-axis). The cutterhead measurements represent the dynamic response generated by cutter–ground interaction at the tunnel face, whereas the bulkhead measurements primarily reflect machine-induced accelerations and operational noise. The acceleration data acquired during five rotations were subsequently processed to determine mean acceleration values for both the x- and y-axis directions. These mean values were then visualized graphically by the face visualization system, providing a basis for evaluating ground composition during shield excavation.
3. Experimental Results and Discussions
3.1. Acceleration Measurement Results on Specially Designed Testing Equipment
The first part of the experimental program focused on evaluating the sensitivity of the accelerometers installed beneath the cutter bit. Figure 6 illustrates the experimental equipment setup during testing, with clayey soil shown as an example. The sensitivity of the accelerometers was assessed by examining differences in the measured acceleration responses associated with differences in soil type and soil physical properties, including moisture content and density. However, the effect of wet density is not discussed further in this paper, as measured acceleration responses showed only limited variation among the tested wet-density levels.
Figure 6.
Photograph of experimental equipment for acceleration measurement (example of clayey soil).
Figure 7 presents acceleration-time dependency obtained during cutter-bit excavation performed on three different soils—clay, sand, and gravel material (RC40)—using a reinforced cutter bit (Bit-1) under the high-speed condition (v = 300 mm/s). The red circles in the figure indicate the reversal points of the reciprocating bit motion, where temporary reductions in acceleration were observed due to the change in movement direction. During excavation of the clay specimen, the acceleration response exhibited a relatively stable waveform, with values ranging from approximately 70 to 120 cm/s2. Under the same cutting conditions, the sandy specimen showed slightly greater fluctuations in acceleration. In contrast, gravelly material (RC40) produced significantly larger and more irregular acceleration responses, with peak values reaching approximately 600–700 cm/s2. The experimental results obtained under all test conditions are summarized in Table 4. Based on these data, the standard deviation (σ) and coefficient of variation (CV) were calculated to evaluate the variability of the measured responses. The coefficient of variation obtained for RC40 was substantially greater than those observed for clay and sand, indicating the highly heterogeneous nature of the gravelly material and its associated cutting resistance.
Figure 7.
Example of acceleration response profiles obtained during cutter-bit excavation of different soil types by reinforced type bit (Bit-1): red circles denote reciprocating bit reversal points.
Table 4.
Summary of experimental results.
Figure 8 represents the mean acceleration in the x-direction based on the experimental results summarized in Table 4. Two velocity conditions were considered: a low-speed condition (v = 150 mm/s) and a high-speed condition (v = 300 mm/s). These velocities correspond to the horizontal motion in the x-direction and were selected to simulate cutter sliding velocities representative of shield machines with different diameters. Results indicate that irrespective of cutter-bit type, the gravelly material (RC40) consistently produced higher acceleration responses than the sand and clay specimens. In contrast, the mean acceleration values obtained for clay and sand were relatively similar, with no pronounced difference observed between the two materials. The measured acceleration generally increased with increasing horizontal velocity for all soil types, demonstrating that cutter-bit sliding velocity significantly influences the magnitude of the acceleration response.
Figure 8.
Horizontal acceleration due to differences in soil type (medium density).
Figure 9 presents the relationship between mean acceleration response and horizontal velocity for all soil types considered in this study. The results are shown for both the x-direction and z-direction measurements under different cutter-bit configurations. For all soil types and cutter-bit geometries, acceleration increased with increasing horizontal velocity. For the clay specimens (Figure 9a), the acceleration measured in the x-direction was approximately twice that measured in the z-direction. A similar tendency was observed for the sand specimens (Figure 9b), indicating that the acceleration response is primarily governed by the horizontal sliding motion of the cutter bit. In contrast, the results obtained for RC40 (Figure 9c) reveal a more pronounced influence of cutter-bit geometry on the measured acceleration response. Furthermore, unlike the clay and sand specimens, only minor differences were observed between the acceleration responses measured in the x- and z-directions.
Figure 9.
Dependency of acceleration and horizontal velocity for different soil types.
The experimental results demonstrated that the acceleration response of the cutter bit is particularly sensitive to gravelly material (RC40), whereas the differences in acceleration magnitude between sand and clay are relatively small. To further investigate the distinction between these two soil types, Fourier spectrum analysis was applied to the measured acceleration time histories. The analysis was performed using datasets consisting of 60,000 data points sampled at fs = 1000 Hz, corresponding to a measurement duration of 60 s.
Figure 10 shows representative Fourier spectra obtained for the clay and sand specimens. The results reveal differences in the dominant frequency characteristics of the two materials, with sandy soil (granular particles) exhibiting more pronounced frequency components than clay (cohesive soil consisting of colloidal particles). These findings suggest that frequency-domain analysis can provide supplementary information for distinguishing between sandy and cohesive soils when the measured acceleration magnitudes are relatively similar.
Figure 10.
Fourier spectrum analysis performed on acceleration measurements of sandy and clayey materials.
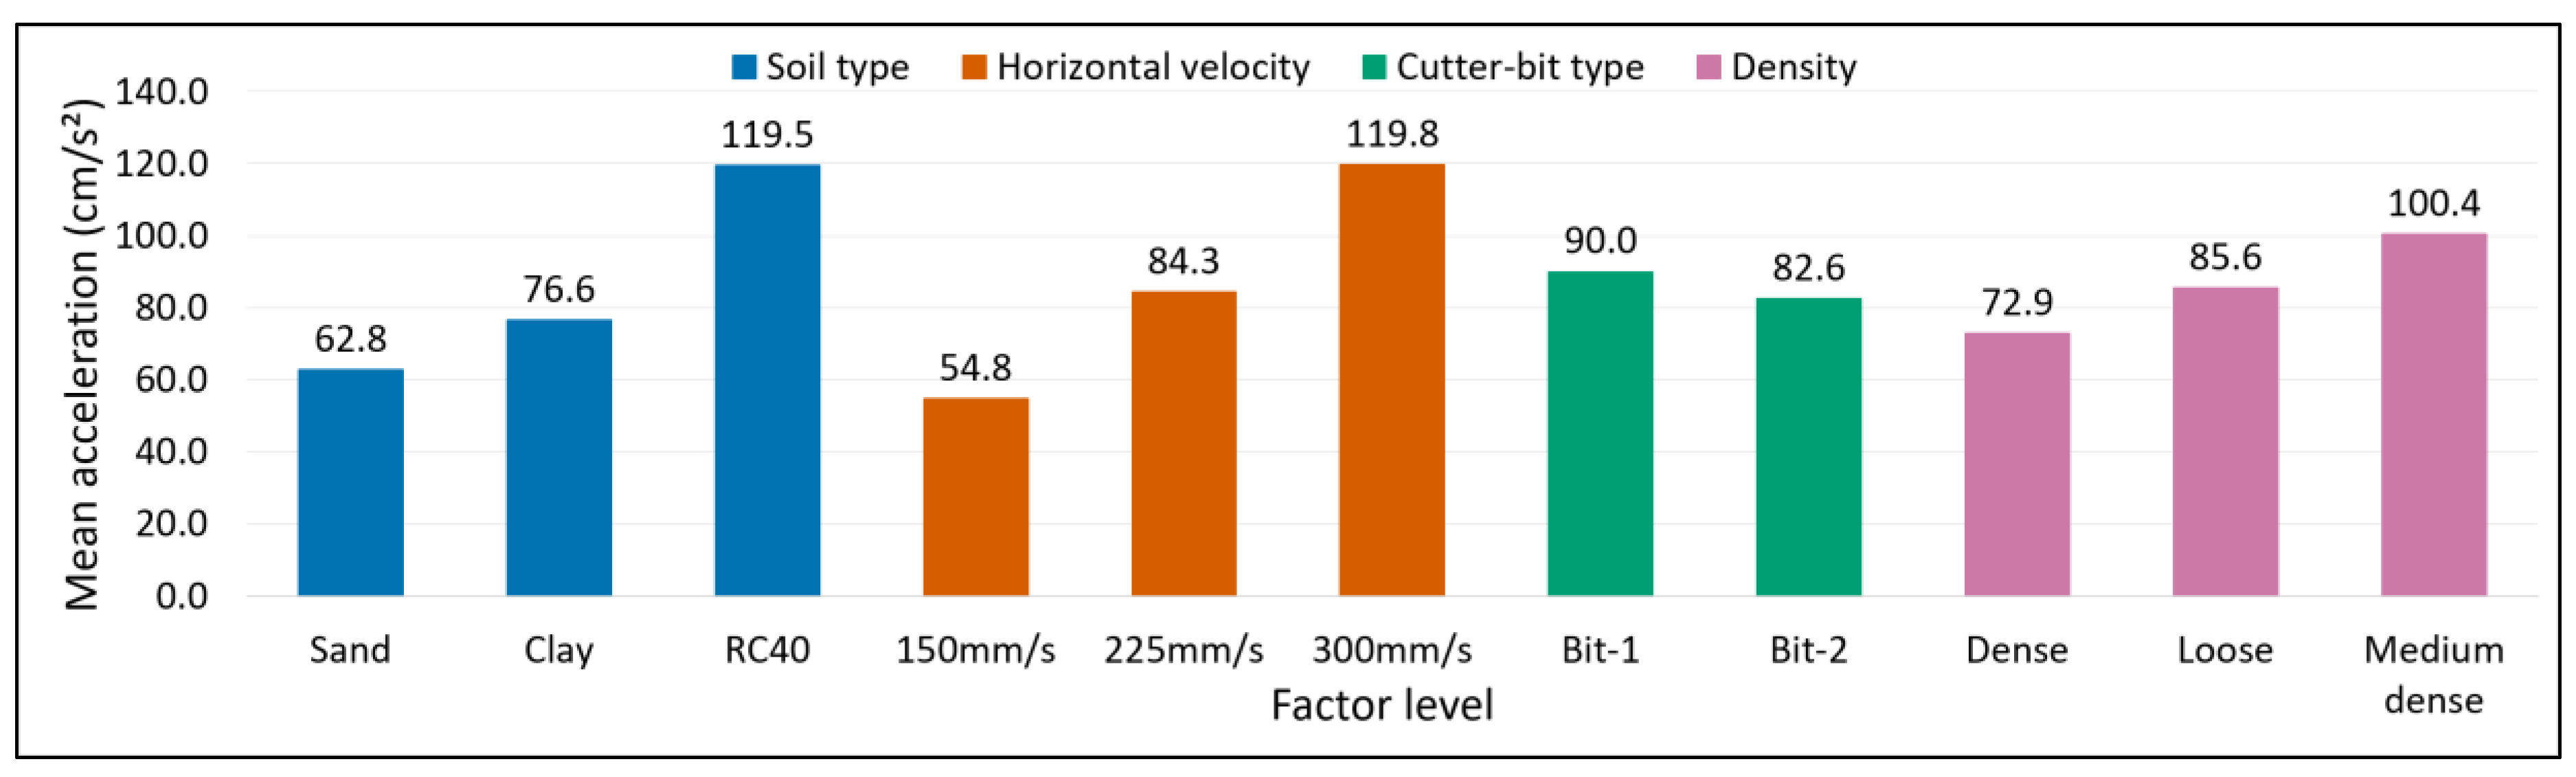
Additionally, a three-way analysis of variance (ANOVA) was performed to quantitatively evaluate the effects of soil type, cutter-bit type, and horizontal velocity on the mean acceleration. The results are presented in Table 5 and Figure 11. Soil type comprised three levels: clay, sand, and RC40; cutter-bit type comprised two levels: Bit 1 and Bit 2; and horizontal velocity comprised three levels: 150, 225, and 300 mm/s. Density condition was included in the model as an additive blocking factor. The main effects of soil type, cutter-bit type, and horizontal velocity, together with all two-way and three-way interactions, were evaluated at a significance level of 5% (see Appendix A.1).
Table 5.
Three-way ANOVA of mean acceleration.
Figure 11.
Main-effect plots for (a) soil type, (b) horizontal velocity, (c) cutter-bit type, and (d) density condition. Each value represents the marginal mean value over the remaining factors.
The ANOVA results indicated that soil type and horizontal velocity had statistically significant effects on the mean acceleration (soil type: F(2,34) = 28.93, p < 0.001; horizontal velocity: F(2,34) = 34.97, p < 0.001). The mean acceleration values for sand, clay, and RC40 were 62.8, 76.6, and 119.5 cm/s2, respectively, with RC40 exhibiting the highest value. The corresponding mean acceleration values at horizontal velocities of 150, 225, and 300 mm/s were 54.8, 84.3, and 119.8 cm/s2, respectively, indicating an increase in acceleration response with increasing horizontal velocity. In contrast, the main effect of cutter-bit type was not statistically significant (F(1,34) = 1.35, p = 0.253). Density condition had a statistically significant additive blocking effect (F(2,34) = 6.26, p = 0.0049); however, the acceleration response did not vary monotonically with density. None of the two-way or three-way interactions among soil type, cutter-bit type, and horizontal velocity were statistically significant (p > 0.05). The overall model yielded R2 = 0.812, an adjusted R2 = 0.707, and a residual standard deviation of 23.34 cm/s2. Thus, the model explained approximately 81% of the variability in mean acceleration (R2 = 0.812), while the adjusted R2 value indicated that approximately 71% of the variability remained explained after accounting for model complexity (Appendix A.1, Table A2).
Overall, the experimental program confirmed that acceleration responses are influenced by both soil type and cutter sliding velocity. For each soil type, a generally linear relationship was observed between horizontal velocity and measured acceleration. In addition, the magnitude and variability of the measured acceleration differed among the tested materials, demonstrating the feasibility of using acceleration measurements to identify differences in ground composition. Although the differences in acceleration magnitude between sand and clay were relatively small, Fourier spectrum analysis revealed distinguishable frequency characteristics and may therefore serve as a supplementary tool for soil identification. Nevertheless, frequency-domain analysis was not incorporated into the development of the face visualization system and was not applied during field implementation. Rather, it is regarded as one effective interpretation method for acceleration data. In practical applications, reliable assessment of ground conditions was performed by comparing measured acceleration responses with geological longitudinal profiles, pre-construction boring surveys and other geotechnical information.
Compared with the horizontal velocity component (x-direction), the influence of the vertical velocity component (z-direction), corresponding to shield advancement, was found to be negligible. The resulting acceleration responses were considerably smaller, and no significant differences were observed among specimens of the same soil type prepared at different wet densities. These findings indicate that acceleration responses associated with cutter-bit sliding motion are substantially more sensitive to variations in ground composition than those associated with shield advancement. Consequently, the influence of vertical velocity was not incorporated into the development of the face visualization system.
3.2. Accelerometer Measurement Results on an Actual Shield Machine
Acceleration measurements were conducted during cutterhead rotation under two operating conditions: without externally applied vibration (Case 1: no impact) and with continuous vibration generated by a high-frequency vibrator (Case 2: continuous impact), as shown in Figure 12.
Figure 12.
Photograph of vibration application condition.
Case 1: Measurement without external vibration
In Case 1, acceleration measurements were performed at both the cutterhead and the bulkhead under three cutterhead rotational speeds representative of actual operating conditions. The measured acceleration values are summarized in Table 6.
Table 6.
Acceleration without external impact.
Figure 13 shows the relationship between cutterhead rotational speed and measured acceleration. A clear positive correlation was observed at the bulkhead, particularly in the x-direction, indicating that the measured response was strongly influenced by vibrations generated by the cutter drive system. This tendency is attributed to the close proximity of the bulkhead accelerometer to the cutter motor and other mechanical components. In contrast, the cutterhead accelerometer exhibited a weaker dependence on rotational speed, and the measured acceleration remained relatively low. Under all operating conditions, the acceleration recorded at the cutterhead generally ranged from approximately 50 to 100 cm/s2. These results indicate that machine-induced vibrations have only a limited influence on the acceleration response measured at the cutter bit.
Figure 13.
Acceleration measurements on actual shield machine without external impact.
Case 2: Measurement under continuous vibration
In Case 2, acceleration measurements were conducted while continuously applying vibration using a high-frequency vibrator mounted at a fixed position on the outer edge of the cutterhead faceplate (Figure 12). The objective of this test was to evaluate how cutting vibrations transmitted through the faceplate affect both the mounting position of accelerometers and the magnitude of their readings. During testing, the cutterhead was rotated at a constant speed of 3.6 rpm while acceleration data were continuously recorded.
Figure 14 illustrates the relationship between acceleration and cutterhead rotation angle during the test. The red dotted lines indicate the fixed position of the vibrator. Continuous vibration was applied between 430° and 790°, corresponding to the second rotation of the cutterhead. The first (70–430°) and third (790–1150°) rotations represent periods without vibration. During these intervals, the recorded acceleration remained approximately 70–80 cm/s2, which is consistent with the baseline measurements obtained in Case 1. The maximum measured acceleration, approximately 2000 cm/s2, occurred when the accelerometer passed directly above the vibrator at rotation angles of approximately 430° and 790°. In contrast, when the accelerometer was positioned approximately 180° from the vibrator position (610°), the measured acceleration decreased to approximately 300 cm/s2. These results indicate that vibration transmitted through the cutterhead faceplate contributes only about 15% of the peak acceleration recorded directly above the vibration source. Furthermore, the machine-induced acceleration level determined from Case 1 was approximately 50–100 cm/s2, which is considerably smaller than the acceleration generated under direct impact conditions. Therefore, although vibration propagation through the faceplate influences the measured response to some extent, particularly at locations opposite the vibration source, its effect is insufficient to mask the pronounced acceleration variations associated with cutter–ground interaction. Consequently, continuous circumferential acceleration measurements can be effectively utilized for distinguishing differences in ground composition during excavation.
Figure 14.
Acceleration measurements on actual shield machine under continuous impact.
These experimental findings provided the basis for interpreting acceleration responses measured on an actual shield machine and were subsequently applied to the field implementation presented in Section 4.
4. Face Visualization System and Its Practical Implementation in Tunnel Boring
4.1. Construction Site Overview
To date, the developed face visualization system has been successfully implemented in more than ten shield tunneling projects. The characteristics of selected projects, including tunnel purpose, shield type, tunnel length, shield diameter, and geological conditions, are summarized in Table 7. This data is presented to demonstrate practical implementation of the system under various construction conditions rather than to claim validation performance for all projects. The applications include both earth-pressure balance (EPB) and slurry shield tunneling projects with shield diameters ranging from 1.93 m to 11.60 m. However, detailed excavation records, acceleration measurements, and geological verification data from most projects cannot be disclosed because of confidentiality restrictions imposed by the project owners. Therefore, the present study provides a detailed evaluation of the system using data from a sewer tunnel construction project (Project 3 in Table 7), while an additional field application involving Project 5 is presented in Appendix A.2.
Table 7.
Summary of shield tunneling projects utilizing the face visualization system.
Table 8 summarizes the principal characteristics of Project 3. The tunnel was excavated using a 2.36 m diameter earth-pressure-balance shield machine over a total length of 1266.5 m. The cutterhead of the shield machine used in this project is shown in Figure 15. The accelerometer was installed beneath the cutter bit at Position A, located near the outer periphery of the cutterhead.
Table 8.
Overview of the sewer tunnel construction project.
Figure 15.
Cutterhead of the shield machine used in the present study, showing the accelerometer installation position (A).
Figure 16 presents the geological profile along the tunnel alignment based on the results of the pre-construction boring surveys. As shown in the figure, the tunnel alignment begins in gravelly ground near the launching shaft, transitions into weathered granite in the central section, and reaches granite bedrock toward the arrival shaft.
Figure 16.
Geological longitudinal profile along the tunnel alignment based on the pre-construction boring surveys (Fill: embankment fill).
4.2. Face Visualization System Based on Field Measurements
The measurement specifications applied at this construction site were established based on the verification tests conducted on the actual shield machine, as described in Section 3.2. The measurement range of accelerometers was set from 0 to 2100 cm/s2, with a resolution of 0.5 cm/s2. Since acceleration responses varied according to the ground composition encountered at the tunnel face, ground characterization was performed on a ring-by-ring basis throughout the excavation process.
Figure 17 presents the acceleration measurements obtained at representative Cross Section A shown in Figure 16. The measured data are displayed as a function of both acceleration magnitude and cutterhead position and are arranged in a circular diagram representing the tunnel face cross section. The measured acceleration values were relatively low, ranging from approximately 33 to 50 cm/s2. Although the geological profile at Cross Section A indicates gravelly ground (Figure 16), particle-size analysis of the discharged material revealed that the excavated soil consisted predominantly of sand, with only 23% of particles larger than 2.0 mm. The relatively low acceleration values are therefore consistent with the actual composition of the excavated ground.
Figure 17.
Accelerometer measurements at representative Cross Section A (Figure 16).
The acceleration measurements obtained at representative Cross Section B (Figure 16) are shown in Figure 18. In this section, the measured acceleration values ranged from approximately 77 to 2085 cm/s2, indicating substantially larger acceleration responses than those observed at Cross Section A. Particle-size analysis of the discharged material demonstrated that the excavated soil contained approximately 67% particles larger than 2.0 mm, confirming the predominance of gravelly material. The significantly higher acceleration responses observed at Cross Section B are therefore consistent with both the particle-size distribution of the excavated material and the laboratory findings presented in Section 3.1. These results demonstrate a clear correspondence between measured acceleration and actual ground composition.
Figure 18.
Accelerometer measurements at representative Cross Section B (Figure 16).
One of the primary objectives of the developed system is to identify changes in ground composition at the tunnel face during excavation. This capability is illustrated using measurements obtained between Ring 95 and Ring 135, as shown in Figure 19. At Ring 95 (Figure 19a), the measured acceleration values ranged from approximately 33 to 350 cm/s2 over the entire tunnel face. The discharged material exhibited predominantly sandy characteristics, indicating relatively uniform ground composition ahead of the shield machine. After approximately 40 rings of excavation, the measurements obtained at Ring 135 (Figure 19c) revealed acceleration values exceeding 2000 cm/s2 within approximately the upper 30% of the tunnel face. Evaluation of the discharged material confirmed the presence of gravelly ground in the corresponding excavation zone. Comparing Figure 19a to Figure 19c, it is evident that the system successfully captured the gradual transition from predominantly sandy ground to mixed sandy and gravelly ground conditions.
Figure 19.
Measured acceleration at different rings.
Furthermore, as the difference in acceleration can be confirmed for each angle on the outer periphery of the cross section, differences in ground composition can be evaluated at different angular positions across the tunnel face.
Based on the measured acceleration distribution, the face visualization system generates a simplified representation of the ground composition by connecting regions exhibiting similar acceleration characteristics and assuming comparable ground composition within the enclosed areas. Figure 20 presents a representative visualization result obtained at Ring 1077. The visualization indicates relatively low acceleration values in the upper part of the tunnel face, suggesting the presence of sandy gravel, whereas substantially higher acceleration values are observed in the lower part, indicating the presence of gravelly ground.
Figure 20.
Tunnel-face visualization generated by the developed face visualization system at Ring 1077.
A cutter-bit replacement was performed at Ring 1077, during which the material inside the bulkhead was removed, allowing direct observation of the tunnel face (Figure 21). The exposed ground was found to consist of sandy gravel, weathered rock, and granite. Comparison of the observed ground composition with the visualization shown in Figure 20 indicates good agreement between the interpreted and observed locations of the soil-rock boundary. These results demonstrate that the developed system can effectively identify transitions between soil and rock within the tunnel face. However, although the system effectively identifies boundaries between different ground compositions, its ability to distinguish variations in rock strength remains limited. In particular, differences associated with the degree of rock weathering could not be reliably evaluated using acceleration measurements alone. Nevertheless, this example demonstrates the capability of the system to visualize the spatial distribution of ground composition across the tunnel face in real time during shield excavation.
Figure 21.
Observed ground composition at the tunnel face during cutter-bit replacement (Ring 1077).
The face visualization system continuously collects acceleration data for each excavation ring during shield tunneling. By arranging these measurements along the tunnel alignment, changes in acceleration response can be tracked throughout the excavation process. Figure 22 presents mean acceleration values obtained from five cutterhead rotations at the upper and lower parts of the tunnel face for each excavation ring. Several intervals exhibit noticeable differences between the accelerations measured at the top of the tunnel face (blue line) and those measured at the bottom (red line), indicating changes in ground composition within the same excavation ring. Representative examples can be observed around Rings 120, 250, and 1050. In particular, within the interval between Rings 95 and 135 discussed previously, the acceleration values gradually increase at the upper part of the tunnel face, while the corresponding increase at the lower part occurs later. During excavation, the shield advance rate was maintained between 25 and 30 mm/min, while the cutterhead rotational speed remained constant at 2.3 rpm. Therefore, the influence of operational parameters on the measured acceleration responses was considered negligible, and the variations observed in the figure were primarily attributed to changes in ground composition. This behavior suggests a progressive transition in ground composition across the tunnel face and demonstrates the ability of the system to identify localized geological changes during excavation.
Figure 22.
Variation in measured acceleration with excavation ring number.
To visualize the distribution of ground composition along the tunnel alignment, the measured acceleration data were converted into a contour diagram representing the vertical distribution of acceleration within the tunnel cross section. The visualization procedure was performed as follows. The measured acceleration values for each ring were divided into 15 segments across the vertical direction of the shield cross section (D = 2.36 m). For each segment, mean acceleration values measured on the left and right sides of the tunnel face were calculated and projected onto the excavation alignment. The resulting values were then superimposed on the geological longitudinal profile obtained from pre-construction boring investigations to generate a contour representation of the measured acceleration responses.
Figure 23 presents the distribution of ground composition along the tunnel alignment expressed as an acceleration contour diagram. A detailed examination reveals considerable variation in acceleration response within the same cross sections. These variations correspond well with changes in ground composition, particularly in zones containing gravelly material, where substantially higher acceleration values were recorded. In contrast, relatively small variations in acceleration are observed within Section (1), despite the presence of a gravelly layer. This behavior is considered to reflect local differences in gravel distribution within the deposit. In fluvial depositional environments, coarse particles tend to accumulate preferentially within former channel and valley sections, whereas finer materials are deposited in relatively elevated areas. Since the gravel encountered in this project is interpreted as fluvial in origin, the relatively uniform acceleration response observed in Section (1) suggests that the tunnel alignment passes through a more uniformly deposited gravelly zone, resulting in relatively small spatial variations in measured acceleration.
Figure 23.
Geological longitudinal profile overlaid with an acceleration contour map generated from field measurements (Fill: embankment fill).
These observations are consistent with the laboratory results presented in Section 3.1, which demonstrated that gravelly soils generate larger acceleration responses than sandy or clayey soils. In the present case study, the generated contour maps were compared with geological longitudinal profiles, borehole records, and excavation observations, allowing changes in ground composition along the tunnel alignment to be identified and incorporated into excavation management. This capability contributes to maintaining safe and efficient excavation operations. It should be noted, however, that although the laboratory experiments confirmed that different soil types exhibit distinct acceleration response characteristics, establishing a universal quantitative relationship between acceleration magnitude and soil type remains difficult. This is because shield machine characteristics, including machine diameter, cutterhead configuration, operational conditions, and cutter torque, vary from project to project. Furthermore, cutter-bit wear may also influence the measured acceleration response, although this effect was not considered in the present study. Therefore, in practical applications, the developed system is most effectively utilized as a qualitative ground characterization tool. Ground composition is evaluated by comparing measured acceleration responses with available geological and geotechnical information, including boring survey data, geological longitudinal profiles, and excavation observations. Through such integrated interpretation, the system provides valuable supplementary information for assessing changes in ground composition and supporting excavation management during shield tunneling operations.
4.3. Forward Prediction of Ground Composition
In the proposed system, a specified number of previously excavated rings are utilized to identify regions exhibiting similar acceleration responses, which are interpreted as boundaries between different ground compositions. By connecting these regions sequentially along the tunnel alignment, a continuous subsurface model can be generated and used for forward prediction of ground composition ahead of the excavation face. The prediction is based on a simple linear extrapolation approach. First, regions exhibiting similar acceleration values are identified from the circumferential acceleration distribution obtained for each excavation ring. These regions are represented by coordinates defined by the circumferential angle and the measured acceleration magnitude. The corresponding regions are then connected between successive rings, and the slopes of the resulting trajectories are calculated. The average slope obtained from the selected rings is subsequently extrapolated to the prediction distance, and the extrapolated position is interpreted as the predicted boundary of the ground composition.
Figure 24 illustrates an example of ground composition determination and forward prediction at Point (2) in Figure 23, corresponding to the transition zone between gravelly soil and weathered rock. Beginning from Ring 1074, weathered granite progressively appears in the lower right portion of the tunnel face. By Ring 1077, approximately one-third of the face area consists of weathered rock, indicating a gradual transition in ground composition. The predicted cross section shown on the right side of figure represents the estimated ground composition approximately 5 m ahead of the current excavation face. The prediction distance of 5 m was selected with reference to previous studies on forward ground-condition prediction in tunneling [38], which reported that this range provides practical predictive capability while minimizing excessive extrapolation. To establish a stable trend for linear extrapolation, acceleration data from a longer preceding interval of approximately 6 m (corresponding to about eight excavation rings) were used to define the prediction trend. Ground boundaries exhibiting similar acceleration-response patterns were identified and connected between successive rings, and the average slope of the resulting trajectories was extrapolated forward. The prediction indicates that approximately 50% of the tunnel face will be occupied by weathered rock, suggesting that the proportion of rock will increase as excavation progresses.
Figure 24.
Ground composition determination and 5 m-ahead prediction based on face visualization data.
Due to the transition from gravelly ground to weathered rock and the associated increase in cutterhead wear, maintenance of the shield machine was required. Consequently, an intermediate shaft was constructed approximately 5 m ahead of Ring 1077, providing a rare opportunity for direct observation of the ground conditions ahead of the tunnel face (Figure 25). The exposed ground profile confirmed the presence and general distribution of the predicted weathered rock zone. Comparison between the observed ground profile and the predicted ground composition shown in Figure 24 demonstrated good agreement, indicating that the proposed system was capable of successfully identifying the location and extent of the major ground transition. Although the verification was limited to a single observation point, the results demonstrate the potential of the developed system for predicting changes in ground composition ahead of the excavation face. However, prediction accuracy and uncertainty of the proposed extrapolation method have not been quantitatively evaluated. Consequently, the prediction function should be regarded as a qualitative support tool, and further investigation is required to establish quantitative prediction performance and uncertainty bounds.
Figure 25.
Ground profile exposed in the intermediate shaft approximately 5 m ahead of Ring 1077, used to validate the predicted ground composition shown in Figure 24.
Predicting ground composition ahead of the excavation face can provide valuable information for excavation management and shield operation control. As tunnel length increases, the likelihood of encountering changes in ground composition also increases, potentially affecting excavation performance and shield attitude control. Consequently, the capability to identify such changes in advance can support more effective operational decision-making.
For example, when hard ground begins to appear from the lower part of the tunnel cross section and the prediction indicates that approximately half of the face will consist of hard material several meters ahead, maintaining the longitudinal alignment of the shield machine may become difficult due to upward deviation or climbing of the machine. If such changes can be predicted in advance, preventive measures can be implemented proactively, such as adjusting shield attitude control parameters before the machine enters the transition zone.
Verification of forward prediction accuracy in closed-type shield tunneling is generally difficult because direct observation of the ground ahead of the excavation face is rarely possible. In the present project, however, the construction of an intermediate shaft approximately 5 m ahead of Ring 1077 provided a valuable opportunity to directly observe the ground profile and compare it with the predicted ground composition. The comparison demonstrated good agreement between the predicted and observed locations of the major ground boundaries, confirming the capability of the proposed system to identify significant changes in ground composition ahead of the excavation face. Nevertheless, the verification was limited to a single observation point. Therefore, additional validation using data obtained from future tunneling projects is required to further assess the reliability, prediction accuracy, and applicability of the proposed methodology under different geological and operational conditions.
5. Conclusions
This study presented the development and evaluation of an acceleration-based face visualization system for real-time visualization of ground composition at the tunnel face during shield tunneling. The system was developed to support excavation management in closed-type shield tunneling, where direct observation of the tunnel face is not possible. Unlike previous approaches that primarily relied on averaged TBM operational parameters, internal machine measurements, or additional geophysical prospecting equipment, the proposed system directly measures acceleration responses at the cutter–ground interaction locations and visualizes their spatial distribution across the tunnel face in real time.
A series of laboratory experiments was first conducted using specially designed testing equipment that simulated the cutter–ground interaction process. Accelerometers installed beneath two different cutter-bit types were used to measure acceleration responses generated during excavation of representative materials, including clay, sand, and recycled crushed stone (RC40). The results demonstrated that different ground materials exhibit distinct acceleration response characteristics, particularly in terms of acceleration magnitude and variability. These findings established the fundamental concept for evaluating ground composition based on acceleration measurements. Although the difference in acceleration magnitude between clay and sand was relatively small, Fourier spectrum analysis revealed differences in their dominant frequency characteristics. However, Fourier spectrum analysis was not incorporated into the practical ground-composition evaluation system and was not applied during field implementation. Rather, it should be regarded as a supplementary interpretation method that may assist in distinguishing between clay and sand under controlled conditions.
Based on the proposed concept, accelerometers were installed beneath cutter bits on an actual shield machine, and the measurement system was verified through full-scale testing. The results confirmed that machine-induced accelerations and vibration propagation through the cutterhead had only a limited influence on the measured acceleration responses, demonstrating the feasibility of measuring acceleration generated primarily by cutter–ground interaction during excavation.
The developed face visualization system was subsequently implemented in a 2.36 m diameter shield tunneling project and successfully applied throughout the excavation process. The measured acceleration data enabled the visualization of ground composition at the tunnel face and along the tunnel alignment. Comparison with geological longitudinal profiles, boring data, and discharged soil observations showed that variations in acceleration were generally consistent with changes in the encountered ground composition. In particular, gravelly soils produced significantly higher acceleration responses than sandy soils, allowing transitions in ground composition to be identified during excavation.
Furthermore, the measured acceleration data were organized into contour diagrams and tunnel-face visualizations, enabling the spatial distribution of ground composition within the tunnel face to be evaluated. The results demonstrated the capability of the system to identify localized changes in ground composition and transitions between soil and rock layers along the tunnel alignment. A forward prediction method based on the analysis of acceleration patterns from previously excavated rings was also proposed. Application of the method enabled prediction of ground composition up to 5 m ahead of the excavation face. Verification conducted during cutter-bit replacement operations showed good agreement between the predicted and observed positions of the soil-rock boundary, demonstrating the potential of the system as a practical tool for anticipating changes in ground composition during excavation.
The authors acknowledge that the detailed field validation presented in this paper is limited primarily to the investigated tunnel projects and that quantitative discrimination and prediction performance metrics have not yet been established. In addition, the uncertainty associated with the proposed prediction method has not been quantified. These limitations represent important topics for future research and further field validation.
Additionally, although the proposed system cannot currently distinguish variations in rock strength or the degree of weathering, it effectively identifies boundaries between different ground compositions and provides continuous information on changes encountered during excavation. Therefore, the developed face visualization system represents a practical supplementary tool for ground visualization, excavation management, and shield attitude control, with the potential to improve the safety, efficiency, and reliability of shield tunneling operations. Nevertheless, the proposed system is not intended to replace conventional geological investigations; rather, it complements existing geological and geotechnical information by providing continuous ground-composition data to support shield operation and excavation management.
Author Contributions
Conceptualization, S.K. and J.G.; methodology, S.K., H.T. and M.S.; formal analysis, S.K. and J.G.; investigation, S.K. and J.G.; data curation, S.K. and J.G.; writing—original draft preparation, S.K. and J.G.; writing—review and editing, S.K., H.T. and M.S.; supervision, H.T. and M.S. All authors have read and agreed to the published version of the manuscript.
Funding
This research received no external funding.
Data Availability Statement
The data are not publicly available due to project confidentiality agreements.
Conflicts of Interest
The authors S.K and J.G. are employed by the Okumura Corporation. Okumura Corporation holds a granted patent related to the system presented in this study, and S.K. is listed as one of the inventors. The remaining authors declare that the research was conducted in the absence of any commercial or financial relationships that could be construed as a potential conflict of interest.
Appendix A
Appendix A.1. Three-Way ANOVA and Main-Effect Plots
A total of 54 laboratory tests were conducted by varying the soil type, cutter-bit type, and horizontal velocity. To quantitatively evaluate the effects of these parameters on the mean acceleration response, a three-way analysis of variance (ANOVA) was performed. Table A1 summarizes the mean acceleration values obtained from the 54 experimental cases.
The factors considered in the ANOVA were as follows: factor A, soil type (clay, sand, and RC40); factor B, cutter-bit type (Bit-1 and Bit-2); and factor C, horizontal velocity (150, 225, and 300 mm/s). Density condition was incorporated as a blocking factor to account for variability associated with differences in specimen density.
The ANOVA model is expressed as:
where
Yijkl = μ + Dl + Si + Bj + Vk + (SB)ij + (SV)ik + (BV)jk + (SBV)ijk + εijkl
- Yijkl is the measured mean acceleration;
- μ is the overall mean of the measured acceleration response;
- Dl is the effect of the l-th density condition (blocking factor);
- Si is the effect of the i-th soil type;
- Bj is the effect of the j-th cutter-bit type;
- Vk is the effect of the k-th horizontal velocity;
- (SB)ij is the interaction effect between soil type and cutter-bit type;
- (SV)ik is the interaction effect between soil type and horizontal velocity;
- (BV)jk is the interaction effect between cutter-bit type and horizontal velocity;
- (SBV)ijk is the three-way interaction effect among soil type, cutter-bit type, and horizontal velocity;
- εijkl is the residual error term, assumed to be independently and normally distributed with zero mean and constant variance.
Table A1.
Mean acceleration values obtained under each experimental condition.
The residual error term εijkl represents the variation in the measured acceleration response that cannot be explained by the factors included in the model. This term incorporates measurement uncertainty, specimen variability, experimental noise, and other uncontrolled sources of variation. The residuals are assumed to be independently and normally distributed with a mean of zero and constant variance:
εijkl∼N(0, σ2)
The significance of the main effects and interaction effects was evaluated using F-tests at a significance level of 5%. The coefficient of determination (R2), adjusted coefficient of determination (adjusted R2), and residual standard deviation were also calculated to assess the goodness-of-fit of the model. Table A2 summarizes the overall goodness-of-fit statistics of the ANOVA model, including the coefficient of determination (R2), adjusted coefficient of determination (adjusted R2), and residual standard deviation. Table A3 summarizes the estimated effects of the considered factors, and Figure A1 presents the corresponding main-effect plots.
Table A2.
Summary statistics of ANOVA model.
Table A3.
Mean acceleration values for each factor level considered in ANOVA.
Figure A1.
Main effects of soil type, cutter-bit type, horizontal velocity, and density on mean acceleration.
Appendix A.2. Field Application of the Excavation-Face Visualization System
This section presents the implementation of the developed system at an additional construction site to further demonstrate its practical applicability. Table A4 summarizes the project overview, while Figure A2 shows the accelerometer installation location. The project involved the construction of a power cable tunnel using the earth-pressure-balance (EPB) shield tunneling method.
Table A4.
Overview of the power cable tunnel project.
Figure A2.
Accelerometer installation position.
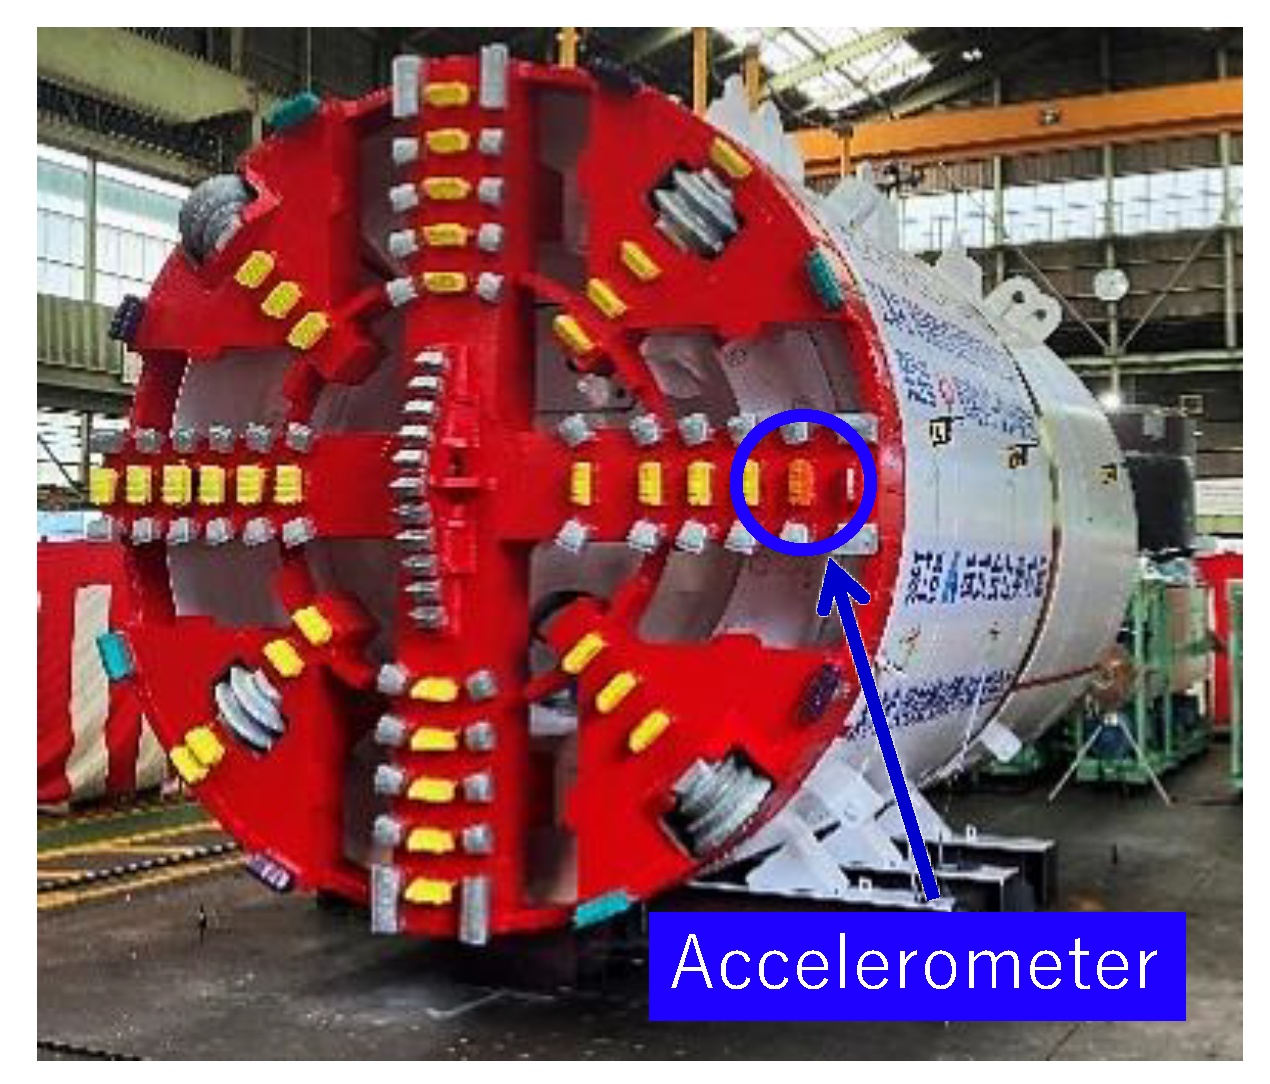
Figure A3 presents the geological profile along the tunnel alignment determined from the pre-construction boring surveys. Table A5 summarizes physical properties and particle-size composition of the identified soil strata. The shield machine encountered, in sequence, Pleistocene gravel, sand, clay, sand, and gravel strata. The Tg gravel stratum, which accounted for most of the excavated ground, had a gravel content of 59.2%. In response to the presence of cobbles up to approximately 400 mm in diameter, as observed during excavation of the launch shaft, roller cutters were installed on the shield machine to facilitate excavation through the gravel stratum.
Figure A3.
Geological longitudinal profile along the tunnel alignment based on the pre-construction boring surveys.
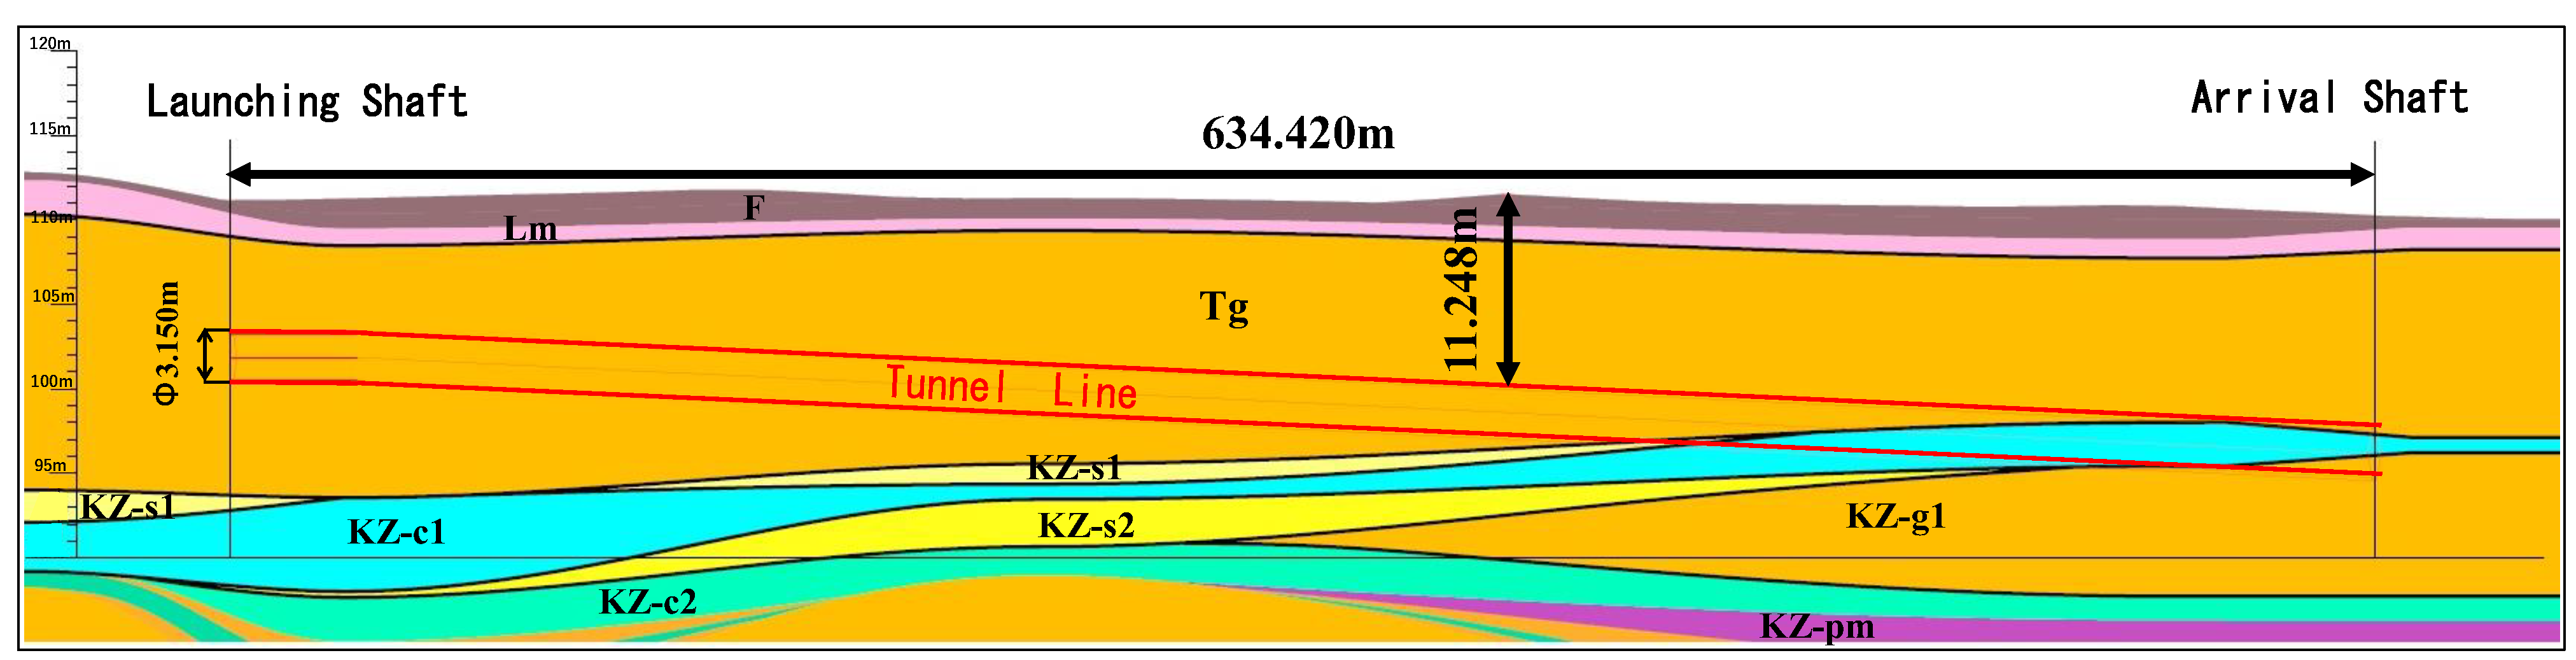
Table A5.
Physical properties and particle-size composition of the soil strata.
Figure A4 presents the longitudinal geological profile along the tunnel alignment together with the mean acceleration measured for each excavated cross section. From the launch shaft to approximately Ring 540, the shield machine advanced predominantly through the Tg gravel stratum, with mean acceleration values generally ranging from approximately 500 to 2400 cm/s2. Beyond Ring 540, the mean acceleration decreased markedly as the shield machine transitioned from the Tg gravel stratum into the KZ-c1 Pleistocene clay stratum.
Figure A4.
Geological longitudinal profile and mean acceleration along the tunnel alignment.
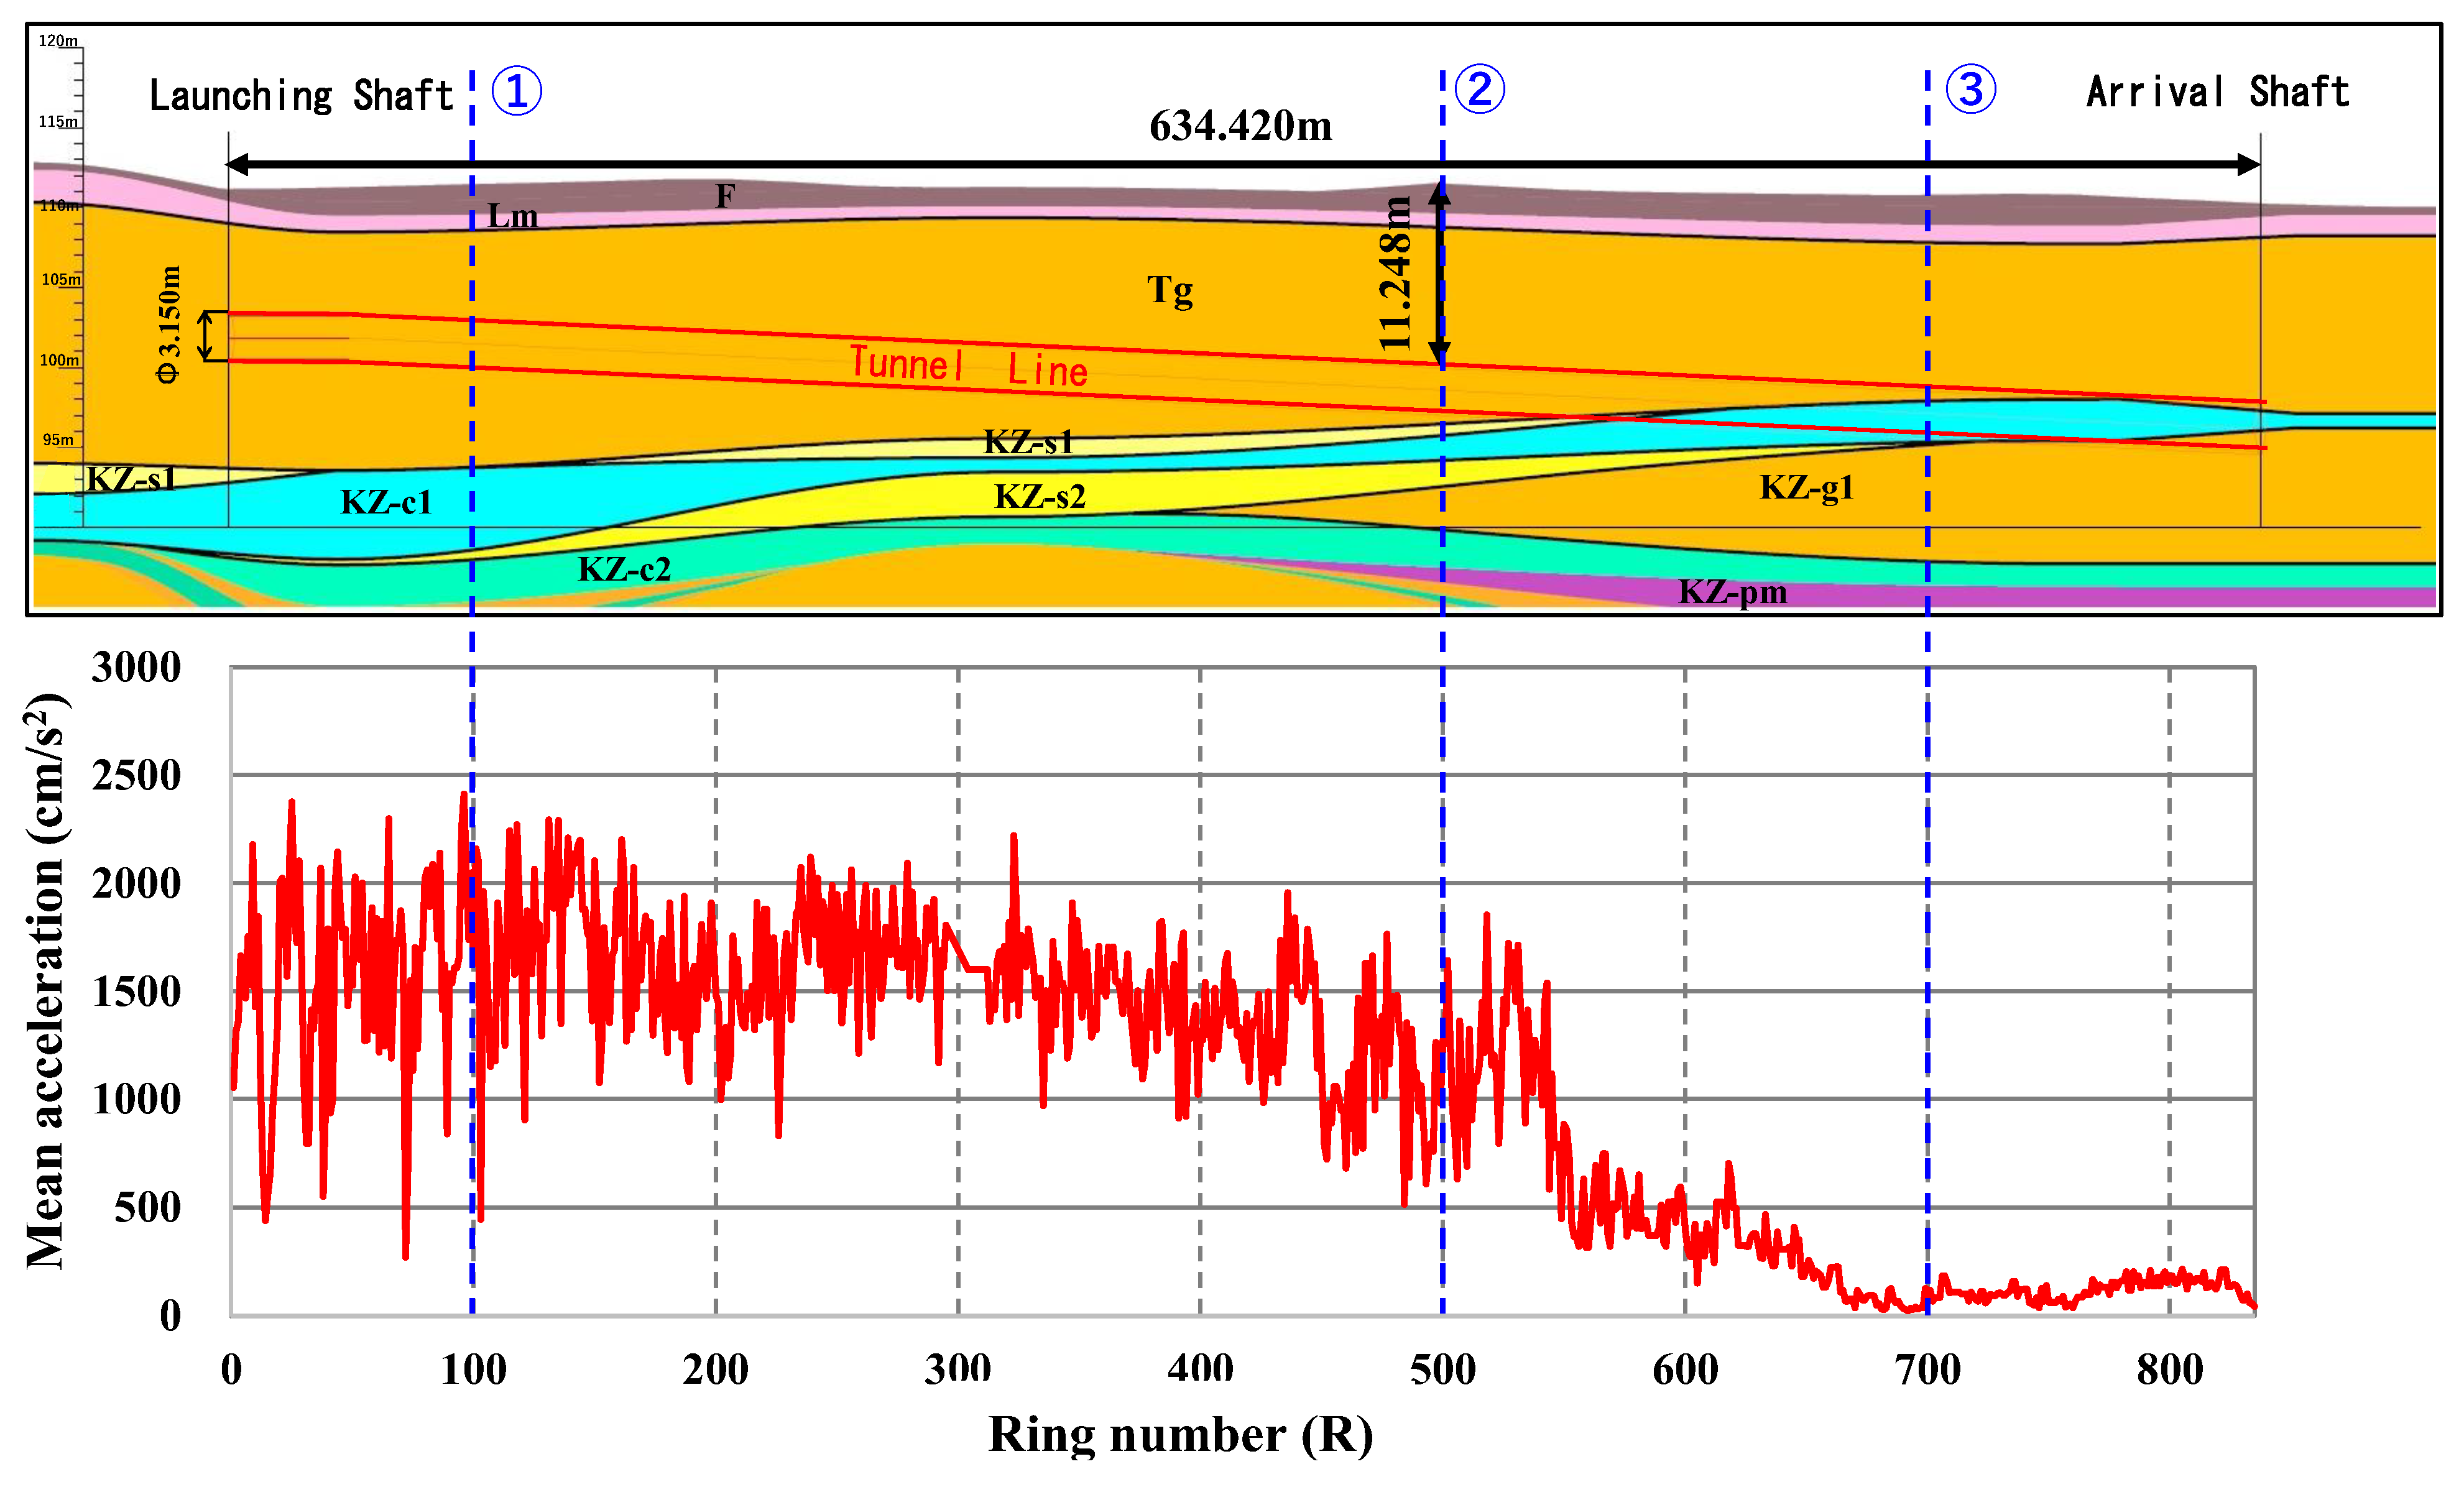
Figure A5 presents the acceleration distributions across the excavated cross sections at Locations ①, ②, and ③ indicated in Figure A4. At Ring 100 (Location ①), where the shield machine excavated predominantly through the Tg gravel stratum, high acceleration values ranging from 1500 to 4000 cm/s2 were measured around the entire circumference. A similar circumferential distribution was observed at Ring 500 (Location ②), although the magnitude and circumferential extent of the high-acceleration response were smaller. At Ring 700 (Location ③), the excavated cross section included the KZ-c1 Pleistocene clay stratum, in which acceleration values ranged from only 10 to 50 cm/s2. In contrast, acceleration values ranging from 150 to 300 cm/s2 were measured in the underlying KZ-g1 Pleistocene gravel stratum. These acceleration distributions were consistent with the longitudinal geological profile established from the pre-construction borehole investigation.
Figure A5.
Acceleration distributions over the excavated cross sections. Colored regions indicate geological units delineated from acceleration responses.
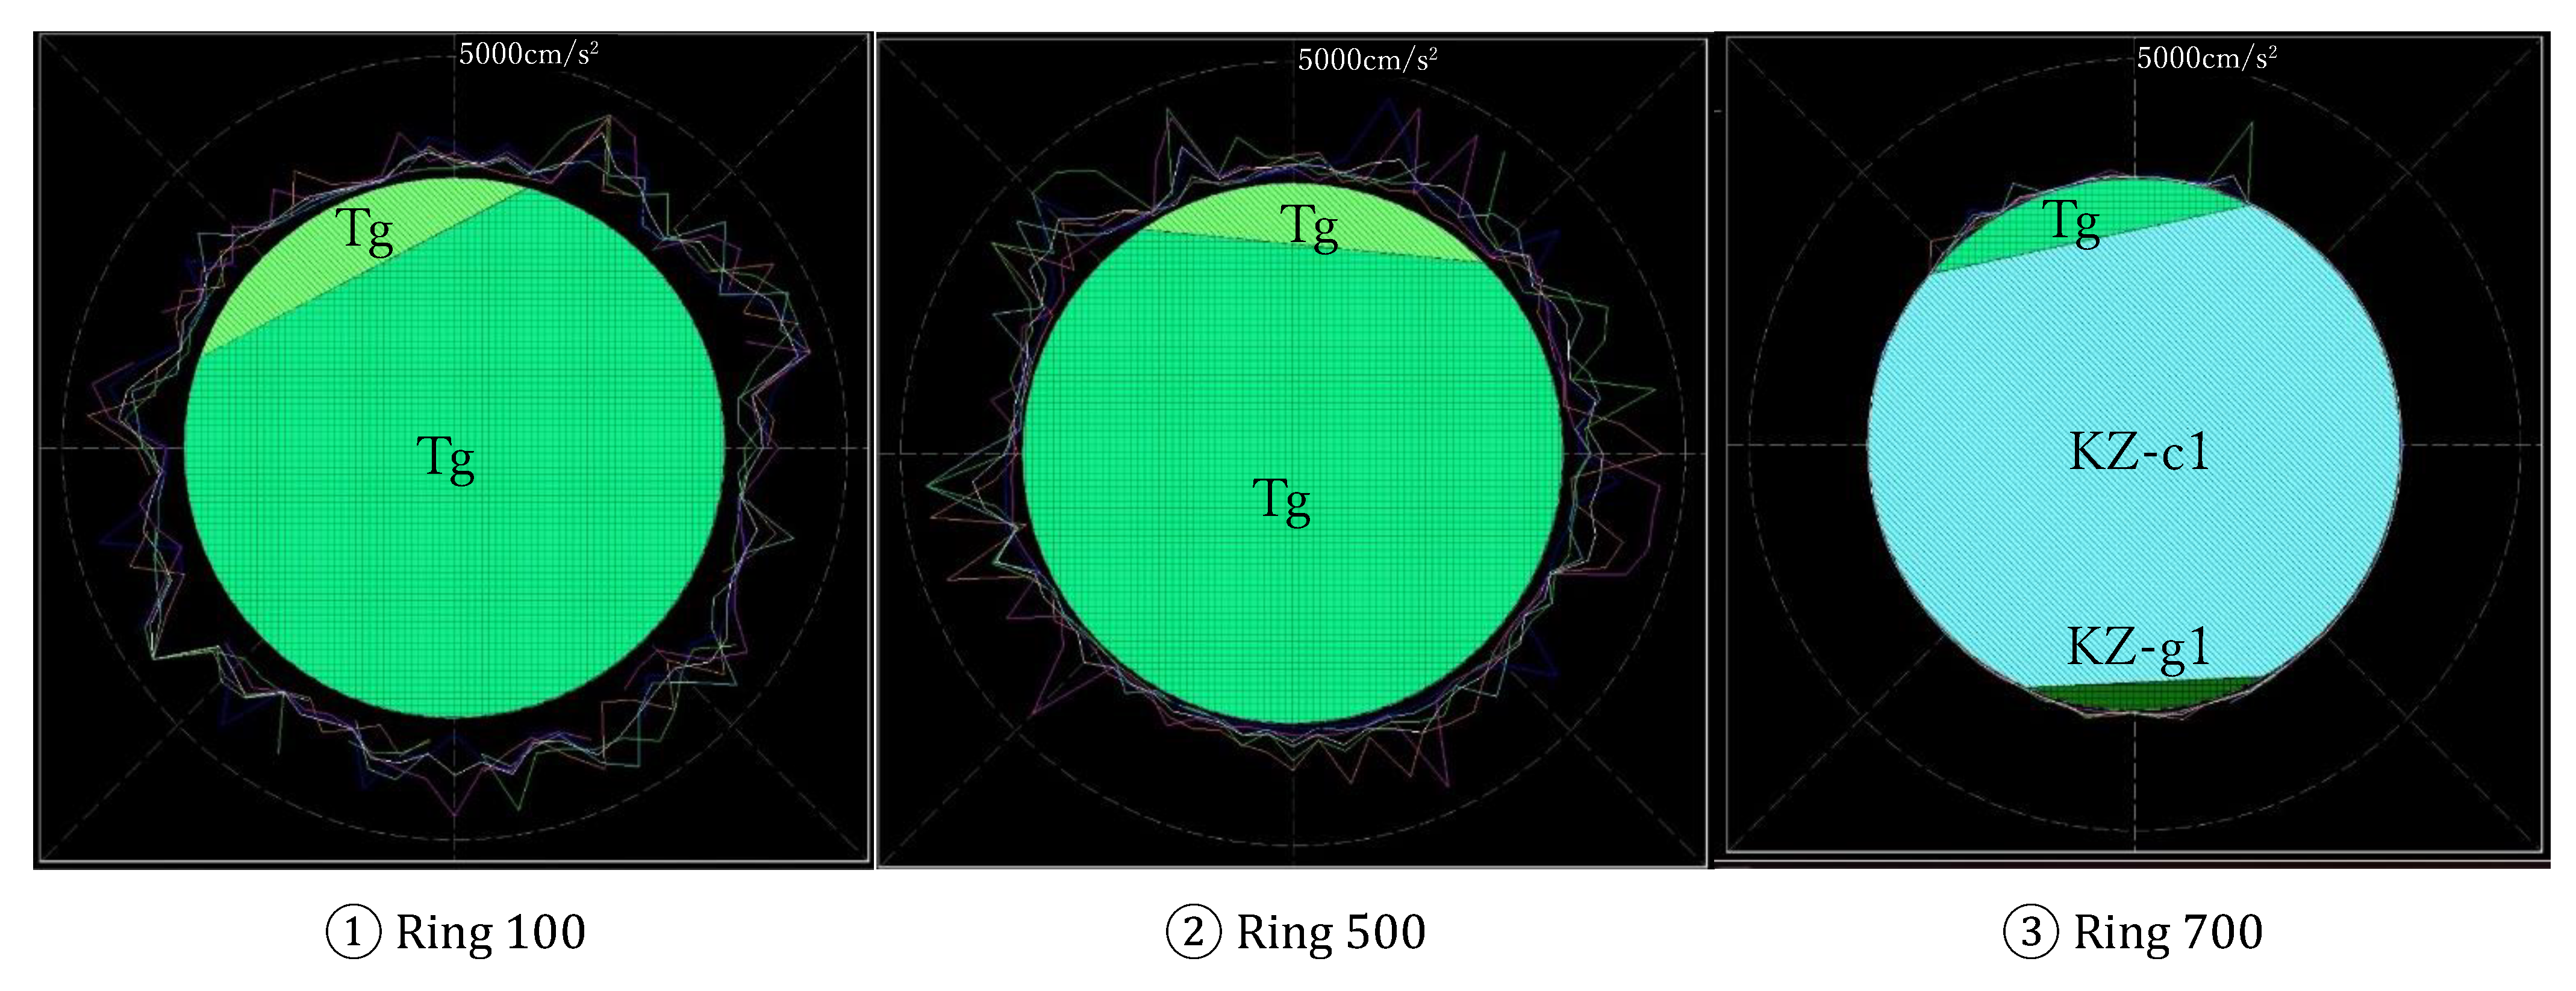
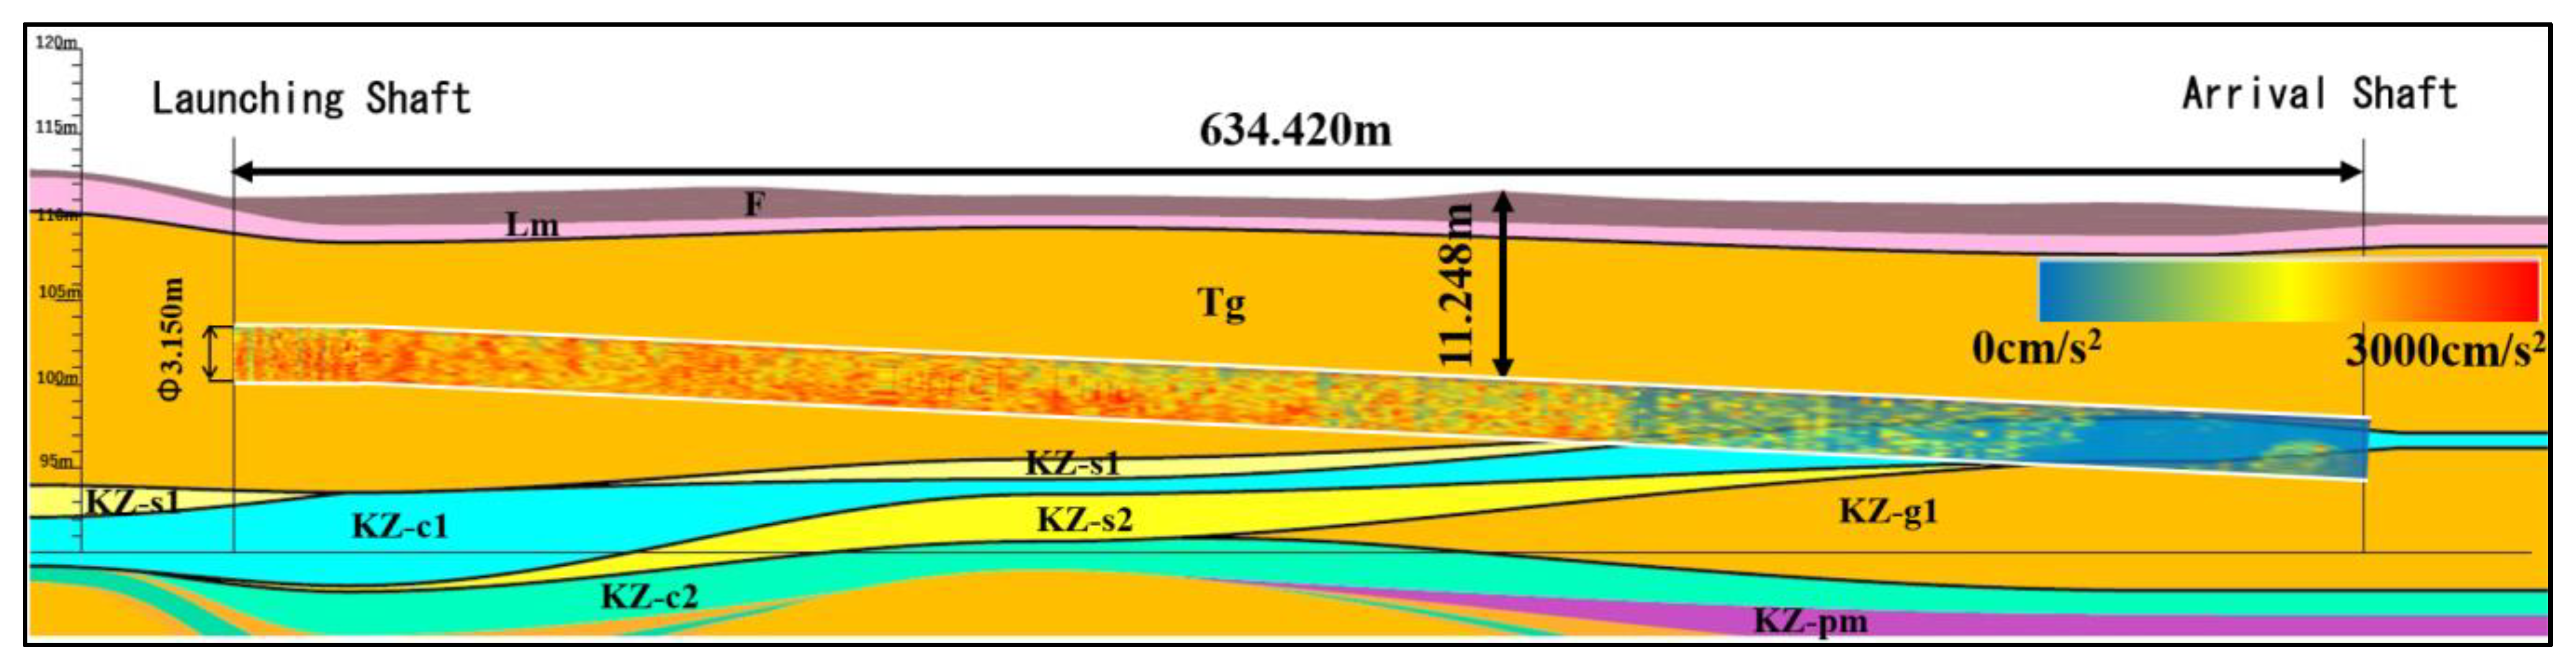
Figure A6 presents the longitudinal acceleration contour map derived from the cross-sectional measurements and overlaid on the geological profile along the tunnel alignment. High acceleration values, represented predominantly by red and orange contours, were observed within the Tg gravel stratum. As the shield machine approached and entered the KZ-s1 sand and KZ-c1 clay strata, the acceleration values decreased, and the contours gradually transitioned from red and orange to green and blue. This transition initially appeared in the lower part of the excavated cross section and progressively expanded upward as excavation advanced. The observed acceleration distribution was consistent with the changes in ground composition indicated by the pre-construction geological profile.
Figure A6.
Longitudinal acceleration contour map overlaid on the geological profile along the tunnel alignment.
References
- Kazuya, F.; Nishio, M.; Myoujin, K.; Fujii, S. The shield tunnel technology for long distance and rapid construction: Inspection and maintenance of shield machine at Ishioka tunnel. Tunn. Eng. Rep. JSCE 2000, 10, 325–330. (In Japanese) [Google Scholar]
- Koyama, Y. Present status and technology of shield tunneling method in Japan. Tunn. Undergr. Space Technol. 2003, 18, 145–159. [Google Scholar] [CrossRef] [Scilit]
- Han, J.; Wang, J.; Cheng, C.; Zhang, C.; Liang, E.; Wang, Z.; Song, J.; Leem, J. Mechanical response and parametric analysis of a deep excavation structure overlying an existing subway station: A case study of the Beijing subway station expansion. Front. Earth Sci. 2023, 10, 1079837. [Google Scholar] [CrossRef] [Scilit]
- Halim, I.S.; Tang, W.H. Site exploration strategy for geologic anomaly characterization. J. Geotech. Eng. 1993, 119, 195–213. [Google Scholar] [CrossRef] [Scilit]
- Li, X.Y.; Zhang, L.M.; Zhu, H.; Li, J.H. Modeling geologic profiles incorporating interlayer and intralayer variabilities. J. Geotech. Geoenvironmental Eng. 2018, 144, 04018047. [Google Scholar] [CrossRef] [Scilit]
- Jin, D.; Zhang, Z.; Yuan, D. Effect of dynamic cutterhead on face stability in EPB shield tunneling. Tunn. Undergr. Space Technol. 2021, 110, 103827. [Google Scholar] [CrossRef] [Scilit]
- Li, Y.; Zhang, W.; Zhang, R. Numerical investigation on performance of braced excavation considering soil stress-induced anisotropy. Acta Geotech. 2022, 17, 563–575. [Google Scholar] [CrossRef] [Scilit]
- Yan, T.; Shen, S.L.; Zhou, A. Identification of geological characteristics from construction parameters during shield tunnelling. Acta Geotech. 2023, 18, 535–551. [Google Scholar] [CrossRef] [Scilit]
- Anagnostou, G.; Kovári, K. The face stability of slurry-shield-driven tunnels. Tunn. Undergr. Space Technol. 1994, 9, 165–174. [Google Scholar] [CrossRef] [Scilit]
- Anagnostou, G.; Kovári, K. Face stability conditions with earth-pressure-balanced shields. Tunn. Undergr. Space Technol. 1996, 11, 165–173. [Google Scholar] [CrossRef] [Scilit]
- Xue, F.; Zhang, M. Excavation face stability of shield tunneling closely under existing tunnels: Particle flow simulation. Iran. J. Sci. Technol. Trans. Civ. Eng. 2020, 44, 497–506. [Google Scholar] [CrossRef] [Scilit]
- Cheng, C.; Jia, P.; Zhao, W.; Ni, P.; Bai, Q.; Wang, Z.; Lu, B. Experimental and analytical study of shield tunnel face in dense sand strata considering different longitudinal inclination. Tunn. Undergr. Space Technol. 2021, 113, 103950. [Google Scholar] [CrossRef] [Scilit]
- Niu, Y.; Ren, T.; Zhou, Q.; Jiao, X.; Shi, J.; Xiang, K.; Tao, J.; Zhai, Q.; Satyanaga, A. Analysis of excavation parameters on face stability in small curvature shield tunnels. Sustainability 2023, 15, 6797. [Google Scholar] [CrossRef] [Scilit]
- Qiang, S.; Zhao, L.; Wang, X.; Li, X.; Wang, F. Analysis of face stability for shallow shield tunnels in sand. Front. Earth Sci. 2023, 11, 1287151. [Google Scholar] [CrossRef] [Scilit]
- Zhang, M.; Gu, S. Stability analysis of the longitudinal slope linear shield tunnel excavation face. Appl. Sci. 2025, 15, 4083. [Google Scholar] [CrossRef] [Scilit]
- Chen, R.; Li, J.; Kong, L.; Tang, L. Experimental study on face instability of shield tunnel in sand. Tunn. Undergr. Space Technol. 2013, 33, 12–21. [Google Scholar] [CrossRef] [Scilit]
- Ding, X.; Li, K.; Xie, Y.; Liu, S. Face stability analysis of large shield-driven tunnel in rock-soil interface composite formations. Undergr. Space 2022, 7, 1021–1035. [Google Scholar] [CrossRef] [Scilit]
- Huo, M.; Chen, W.; Yuan, J.; Wu, G.; Li, Y.; Liu, Y. Experimental investigation and limit analysis of shield tunnel face failure mechanism in sand. Undergr. Space 2025, 22, 137–152. [Google Scholar] [CrossRef] [Scilit]
- Kang, T.H.; Choi, S.W.; Lee, C.; Chang, S.H. Soil classification by machine learning using a tunnel boring machine’s operating parameters. Appl. Sci. 2022, 12, 11480. [Google Scholar] [CrossRef] [Scilit]
- Liu, M.; Liao, S.; Yang, Y.; Men, Y.; He, J.; Huang, Y. Tunnel boring machine vibration-based deep learning for the ground identification of working faces. J. Rock Mech. Geotech. Eng. 2021, 13, 1340–1357. [Google Scholar] [CrossRef] [Scilit]
- Qiu, D.; Fu, K.; Xue, Y.; Tao, Y.; Kong, F.; Bai, C. TBM tunnel surrounding rock classification method and real-time identification model based on tunneling performance. J. Geotech. Geoenvironmental Eng. 2022, 22, 04022070. [Google Scholar] [CrossRef] [Scilit]
- Gao, Z.; Rong, X.; Wang, W.; Huang, B.; Liu, J. TBM advanced geological prediction via ellipsoidal positioning velocity analysis. Buildings 2024, 14, 3126. [Google Scholar] [CrossRef] [Scilit]
- Liu, L.; Liu, B.; Chen, L. Chronicles and prospects of tunnel seismic prognosis. J. Geophys. Eng. 2026, 23, 587–602. [Google Scholar] [CrossRef] [Scilit]
- Huang, X.; Liu, Q.; Liu, H.; Zhang, P.; Pan, S.; Zhang, X.; Fang, J. Development and in-situ application of a real-time monitoring system for the interaction between TBM and surrounding rock. Tunn. Undergr. Space Technol. 2018, 81, 187–208. [Google Scholar] [CrossRef] [Scilit]
- Ling, J.; Sun, W.; Yang, X.; Tong, X.; Zhang, N. Vibration response and parameter influence of TBM cutterhead system under extreme conditions. J. Mech. Sci. Technol. 2018, 32, 4959–4969. [Google Scholar] [CrossRef] [Scilit]
- Yang, Z.; Pan, D.; Zhou, J.; Chen, J.; Sun, Z.; Liu, H. Vibration characteristics of cutter-head in soft-hard mixed stratum: An experimental case study on Su’ai tunnel. KSCE J. Civ. Eng. 2020, 24, 1338–1347. [Google Scholar] [CrossRef] [Scilit]
- Wu, F.; Gong, Q.; Li, Z.; Qiu, H.; Jin, C.; Huang, L.; Yin, L. Development and application of cutterhead vibration monitoring system for TBM tunneling. Int. J. Rock Mech. Min. Sci. 2021, 146, 104887. [Google Scholar] [CrossRef] [Scilit]
- Kawano, K.; Liu, W.; Nagatani, H. Experimental research on visualization technology ahead cutterhead and inside EPB TBM shield tunnelling chamber using new sensing technology. In Proceedings of the 3rd Asian Conference on Physical Modelling in Geotechnics (Asiafuge 2021), Singapore, 18–19 November 2021; pp. 56–62. [Google Scholar]
- Liu, W.; Kawano, K.; Nagatani, H.; Mooney, M. Experimental research on the development of a new visualization system on EPB TBM and soil conditioning inside the chamber. In Proceedings of the 5th International Conference on Tunnel Boring Machines in Difficult Grounds (TBM DIGS 2022), Leoben, Austria, 23–25 November 2022. [Google Scholar]
- Kawano, K.; Liu, W.; Obayashi, Y.; Takahashi, F.; Nagatani, H. Experimental study on visualization technology around shield machines and evaluation of plastic flowability of excavated soil using new sensing technology. In Proceedings of the 5th European Conference on Physical Modelling in Geotechnics 2024, Delft, The Netherlands, 2–4 October 2024; pp. 1–6. [Google Scholar]
- Elshafie, M.Z.E.B. General report: Smart monitoring and visualization technologies for tunnelling and underground construction. In Proceedings of the 11th International Symposium on Geotechnical Aspects of Underground Construction in Soft Ground (IS-Macao 2024); Zhou, W.H., Guan, Z., Li, X., Eds.; Taylor & Francis: London, UK, 2024; pp. 347–356. [Google Scholar]
- Cheng, Q.; Wang, X.; Sun, J.; Zhao, H.; Liu, X. Research on BIM-based visualization, simulation, and early warning system for shield tunnel construction. Buildings 2025, 15, 746. [Google Scholar] [CrossRef] [Scilit]
- Liu, S.; Yang, K.; Cai, J.; Zhou, S.; Zhang, Q. Prediction of geological parameters during tunneling by time series analysis on in situ data. Comput. Intell. Neurosci. 2021, 1, 3904273. [Google Scholar] [CrossRef] [Scilit]
- Liu, M.B.; Liao, S.M.; Men, Y.Q.; Xing, H.T.; Liu, H.; Sun, L.Y. Field monitoring of TBM vibration during excavating changing stratum: Patterns and ground identification. Rock Mech. Rock Eng. 2022, 55, 1481–1498. [Google Scholar] [CrossRef] [Scilit]
- Fang, Y.; Li, X.; Liu, H.; Hao, S.; Yi, Y.; Guo, Y.; Li, H. Intelligent real-time identification technology of stratum characteristics during slurry TBM tunneling. Tunn. Undergr. Space Technol. 2023, 139, 105216. [Google Scholar] [CrossRef] [Scilit]
- Shen, S.L.; Yan, T.; Zhou, A. Estimating locations of soil-rock interfaces based on vibration data during shield tunnelling. Autom. Constr. 2023, 150, 104813. [Google Scholar] [CrossRef] [Scilit]
- Shinohara, S.; Hatayama, E.; Okubo, K.; Takemoto, N.; Kasai, T. Distinction of shield-tunnel face geology during excavation. Tunn. Eng. Rep. JSCE 2000, 10, 337–342. (In Japanese) [Google Scholar]
- Sakai, K.; Tani, T.; Aoki, T.; Kishida, K. Applicability range of inclination monitoring method for prediction of geotechnical condition ahead of tunnel face and its quantitative evaluation. J. JSCE F1 (Tunn. Eng.) 2021, 77, 76–91. (In Japanese) [Google Scholar]
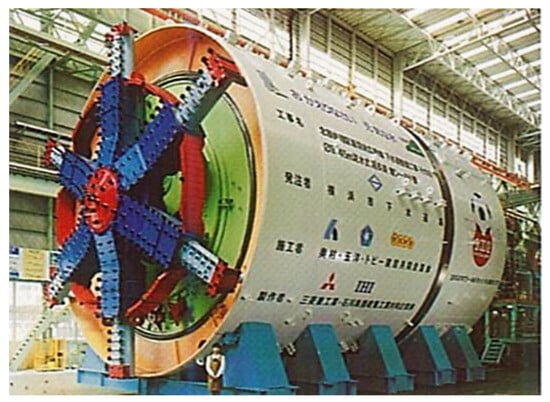
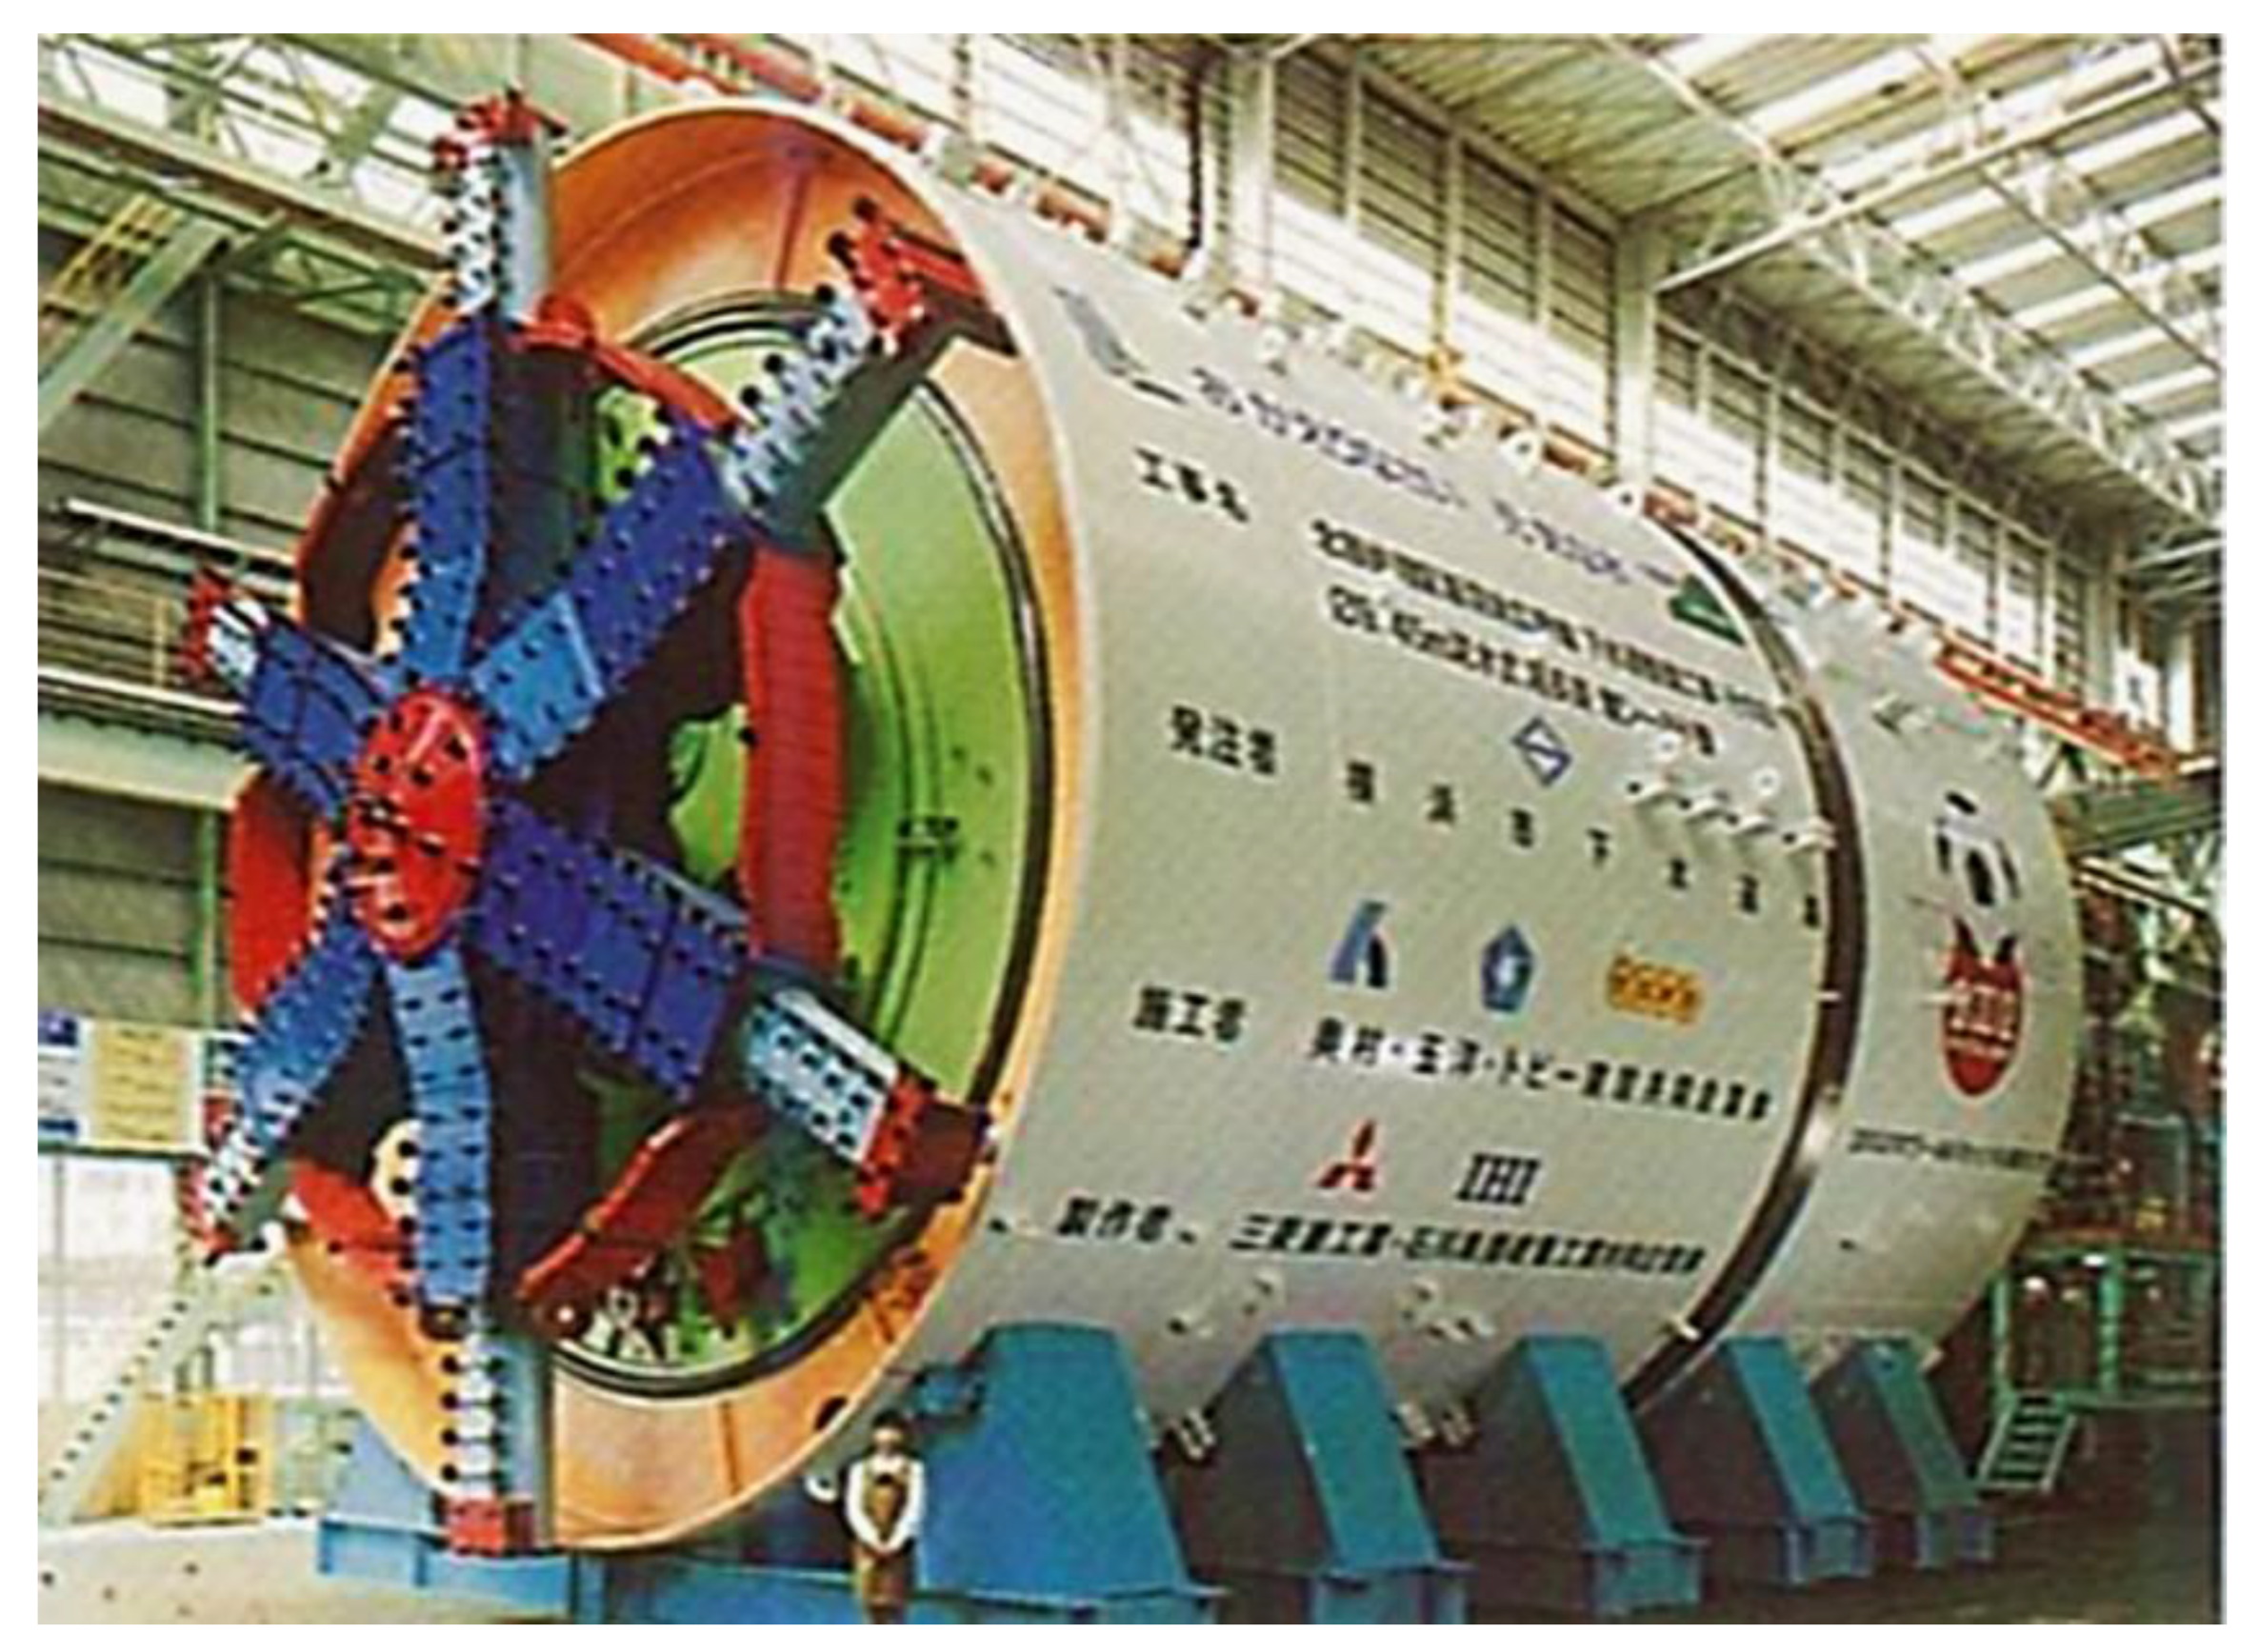
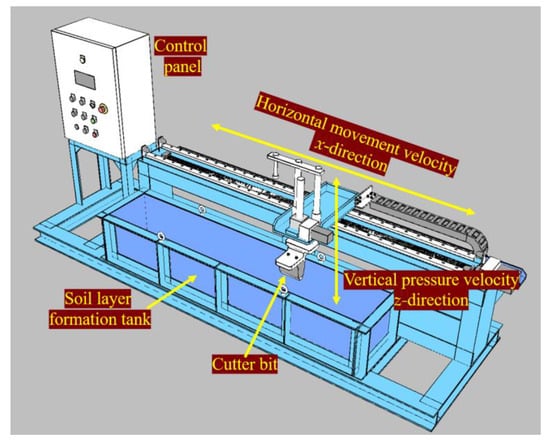
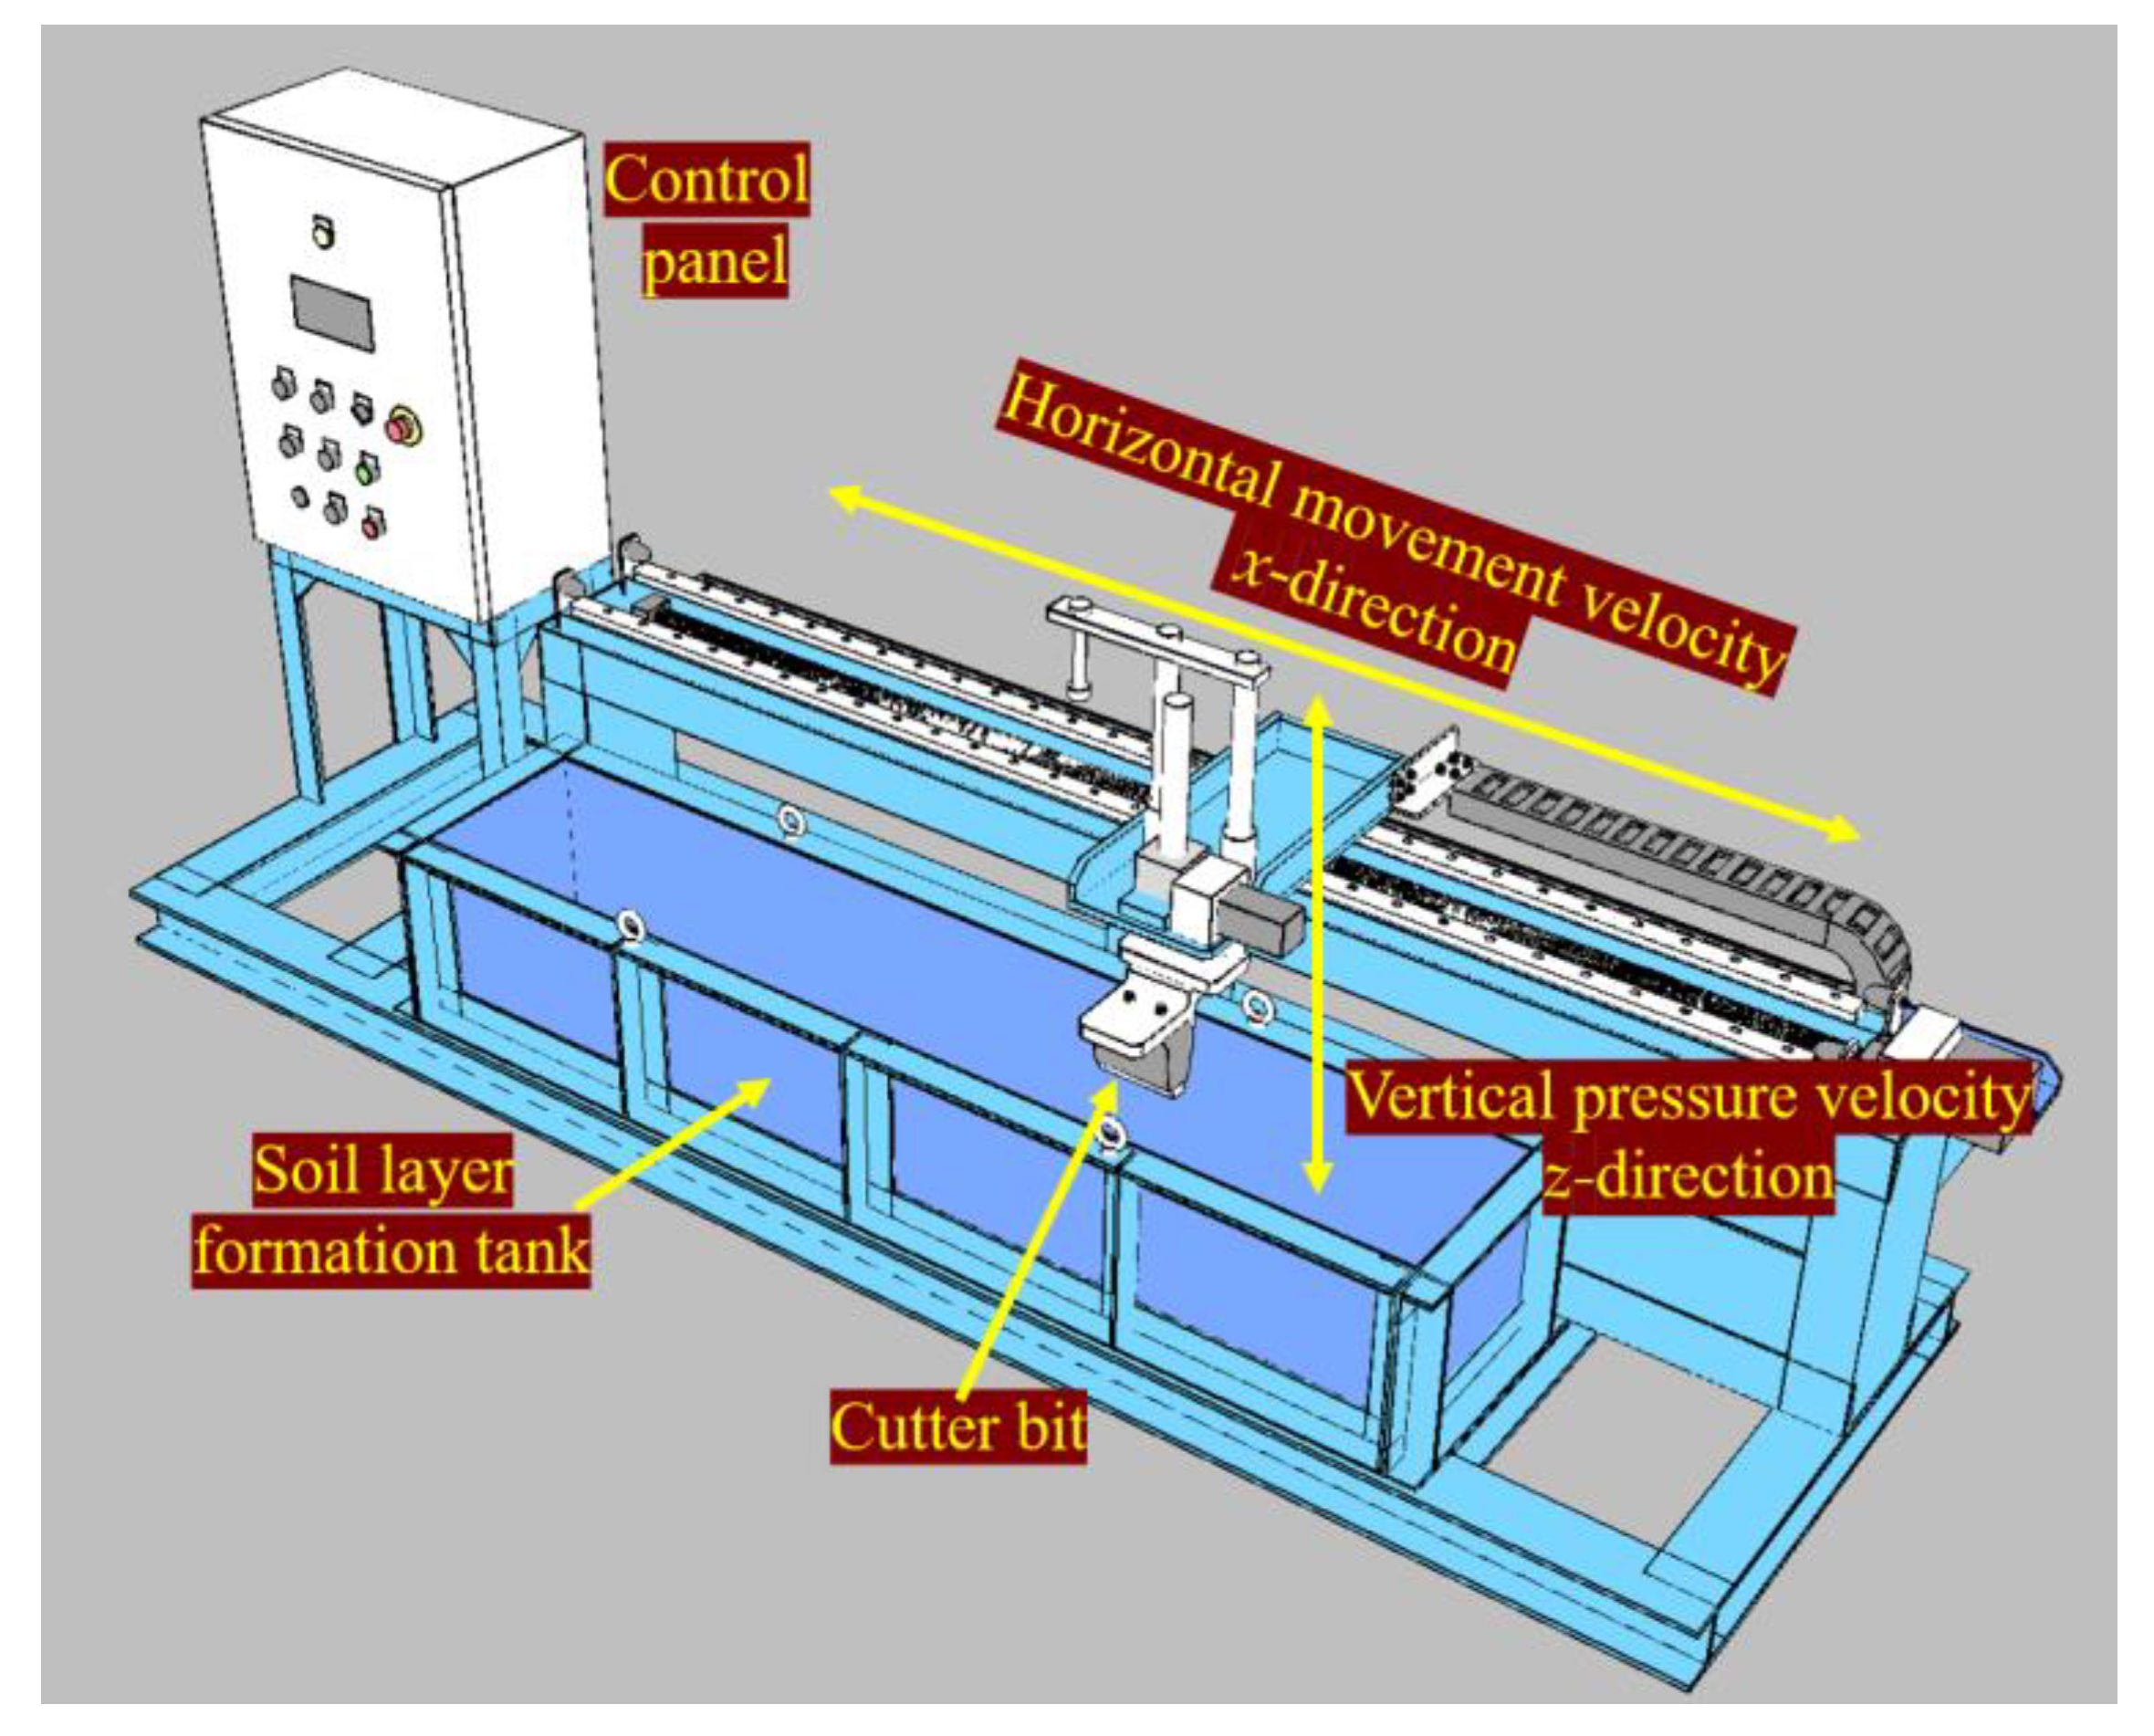
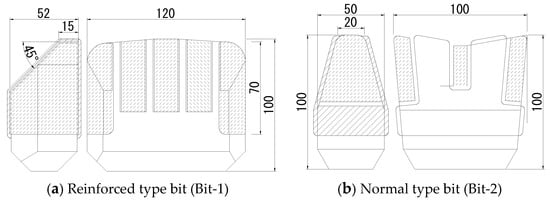
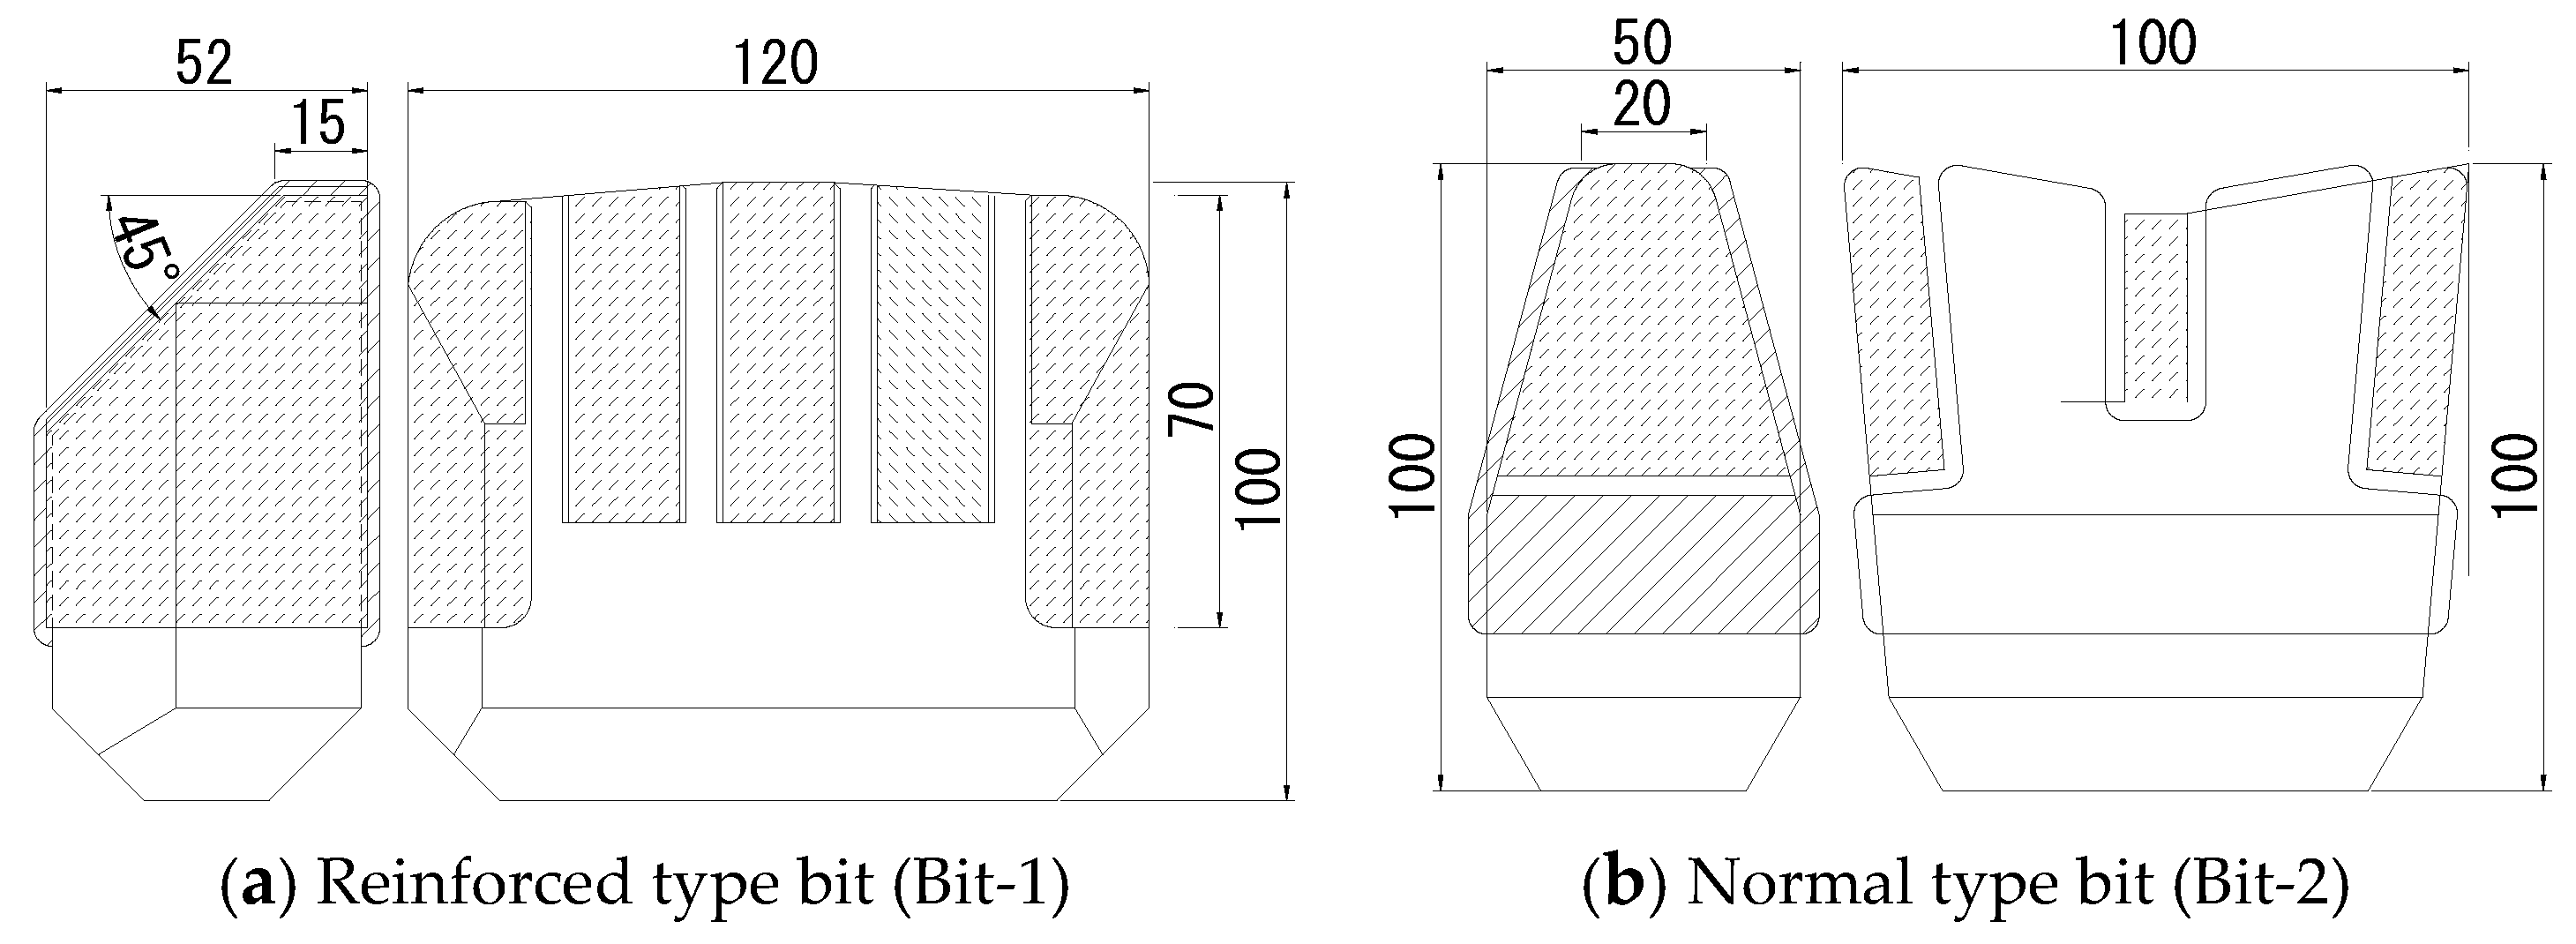
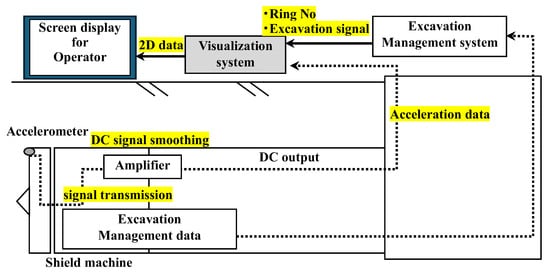
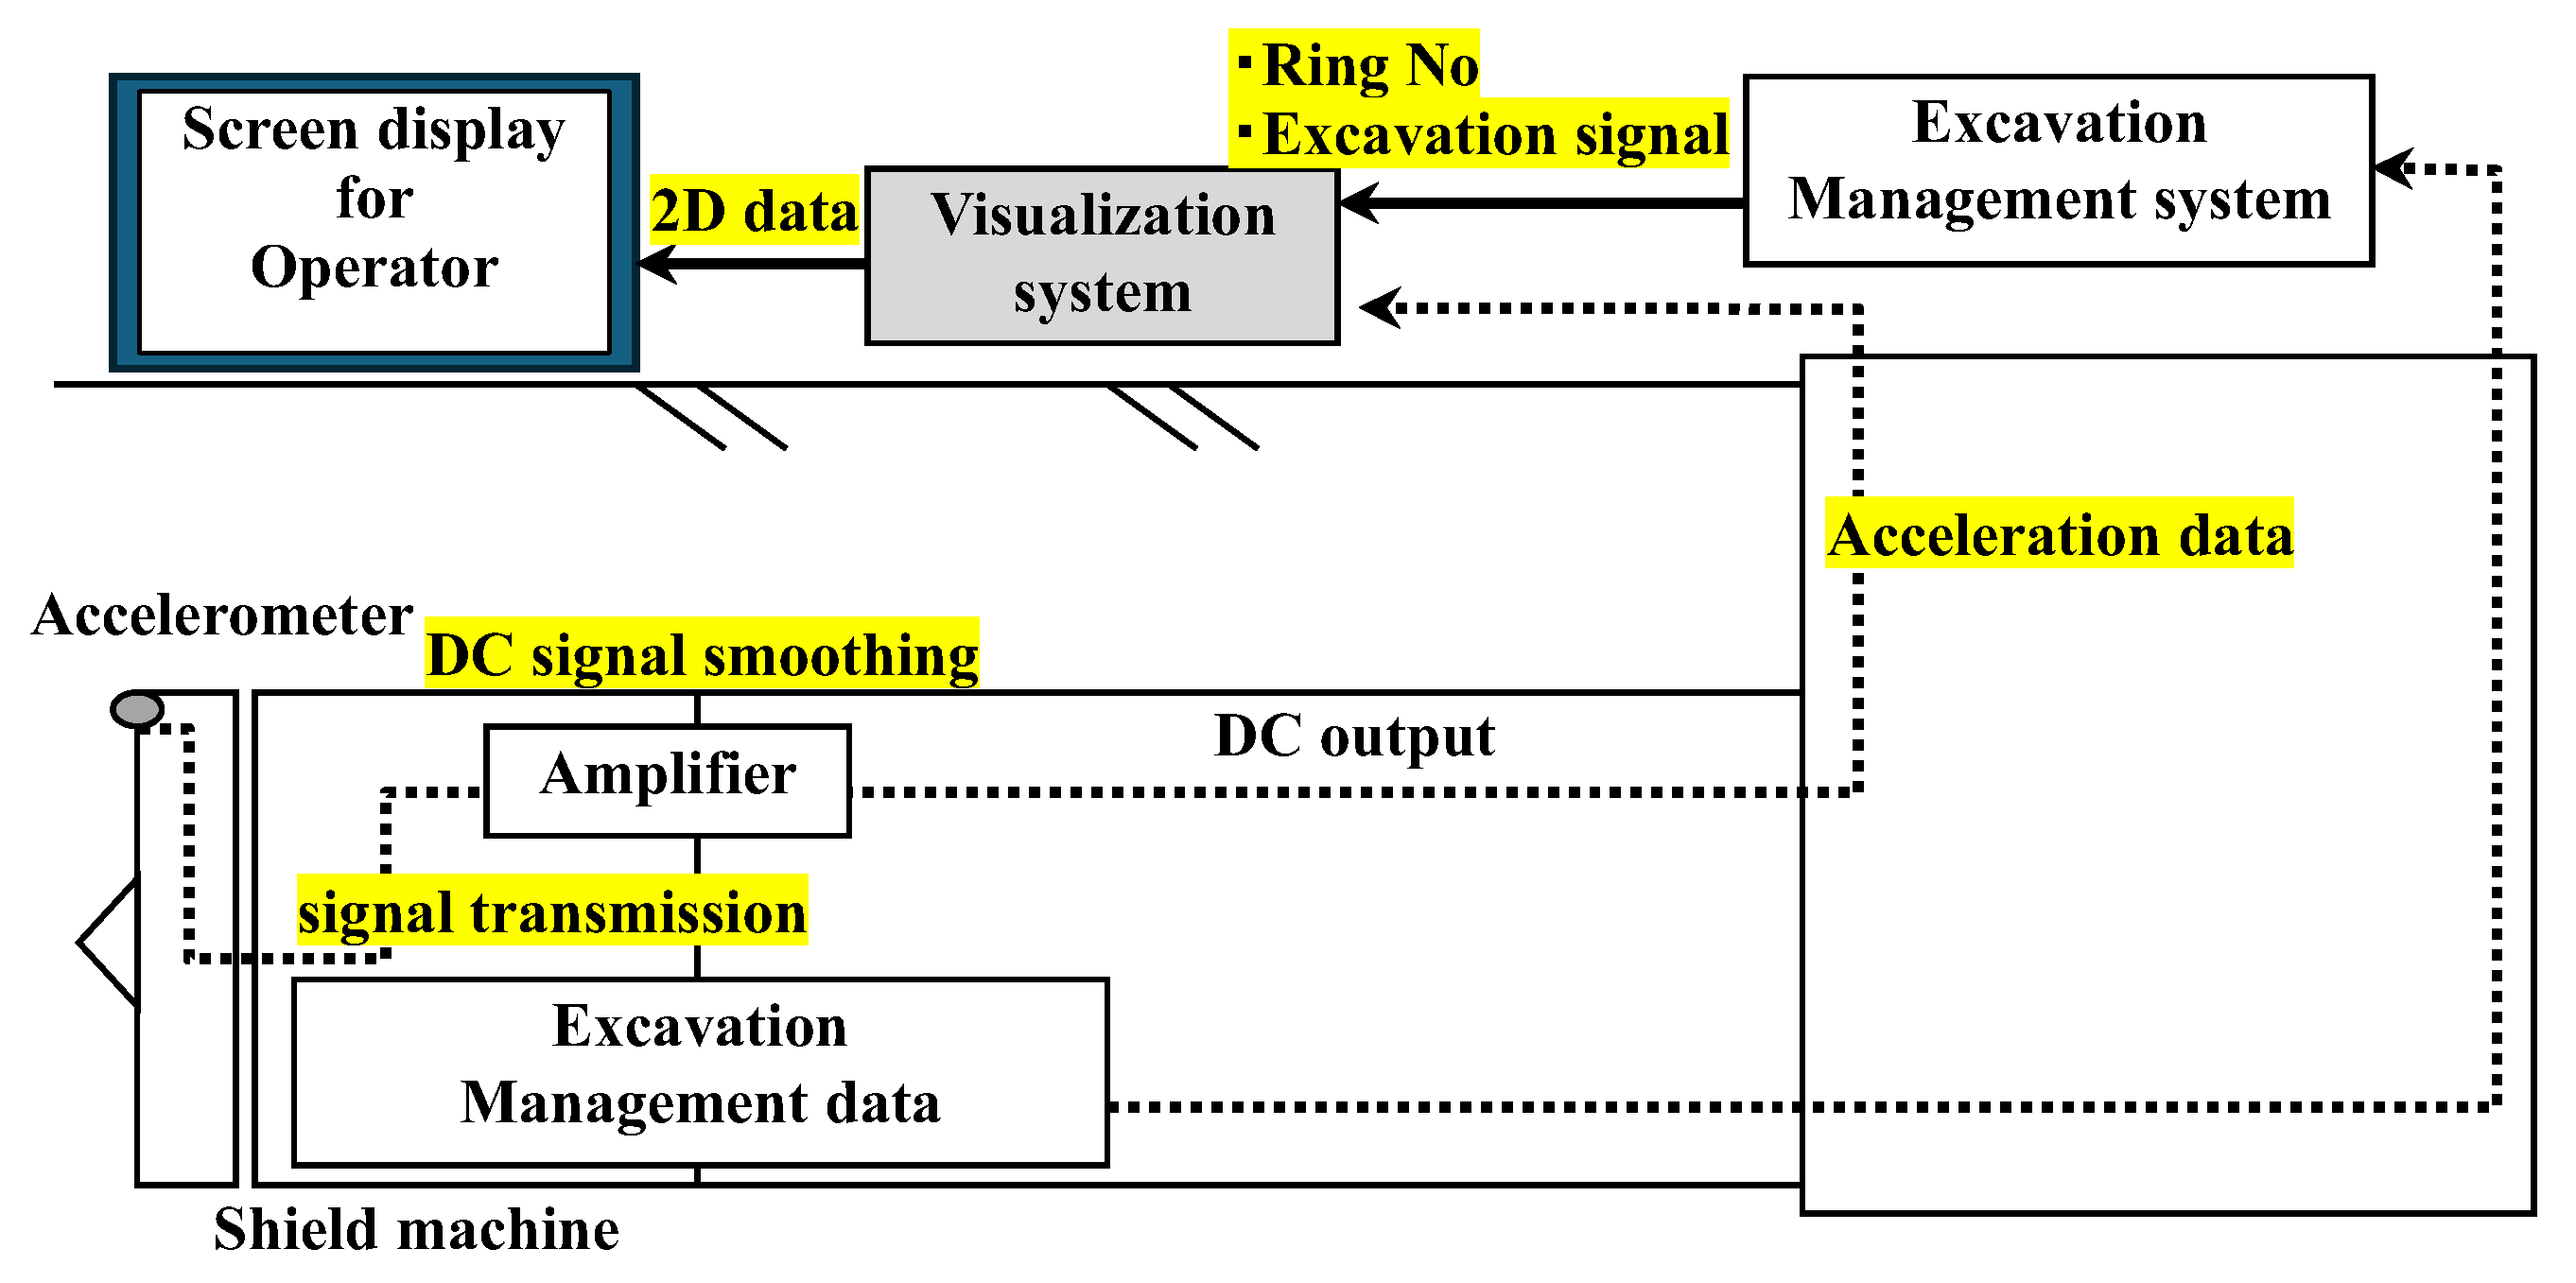
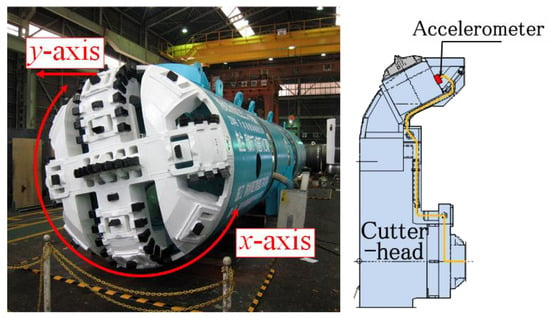
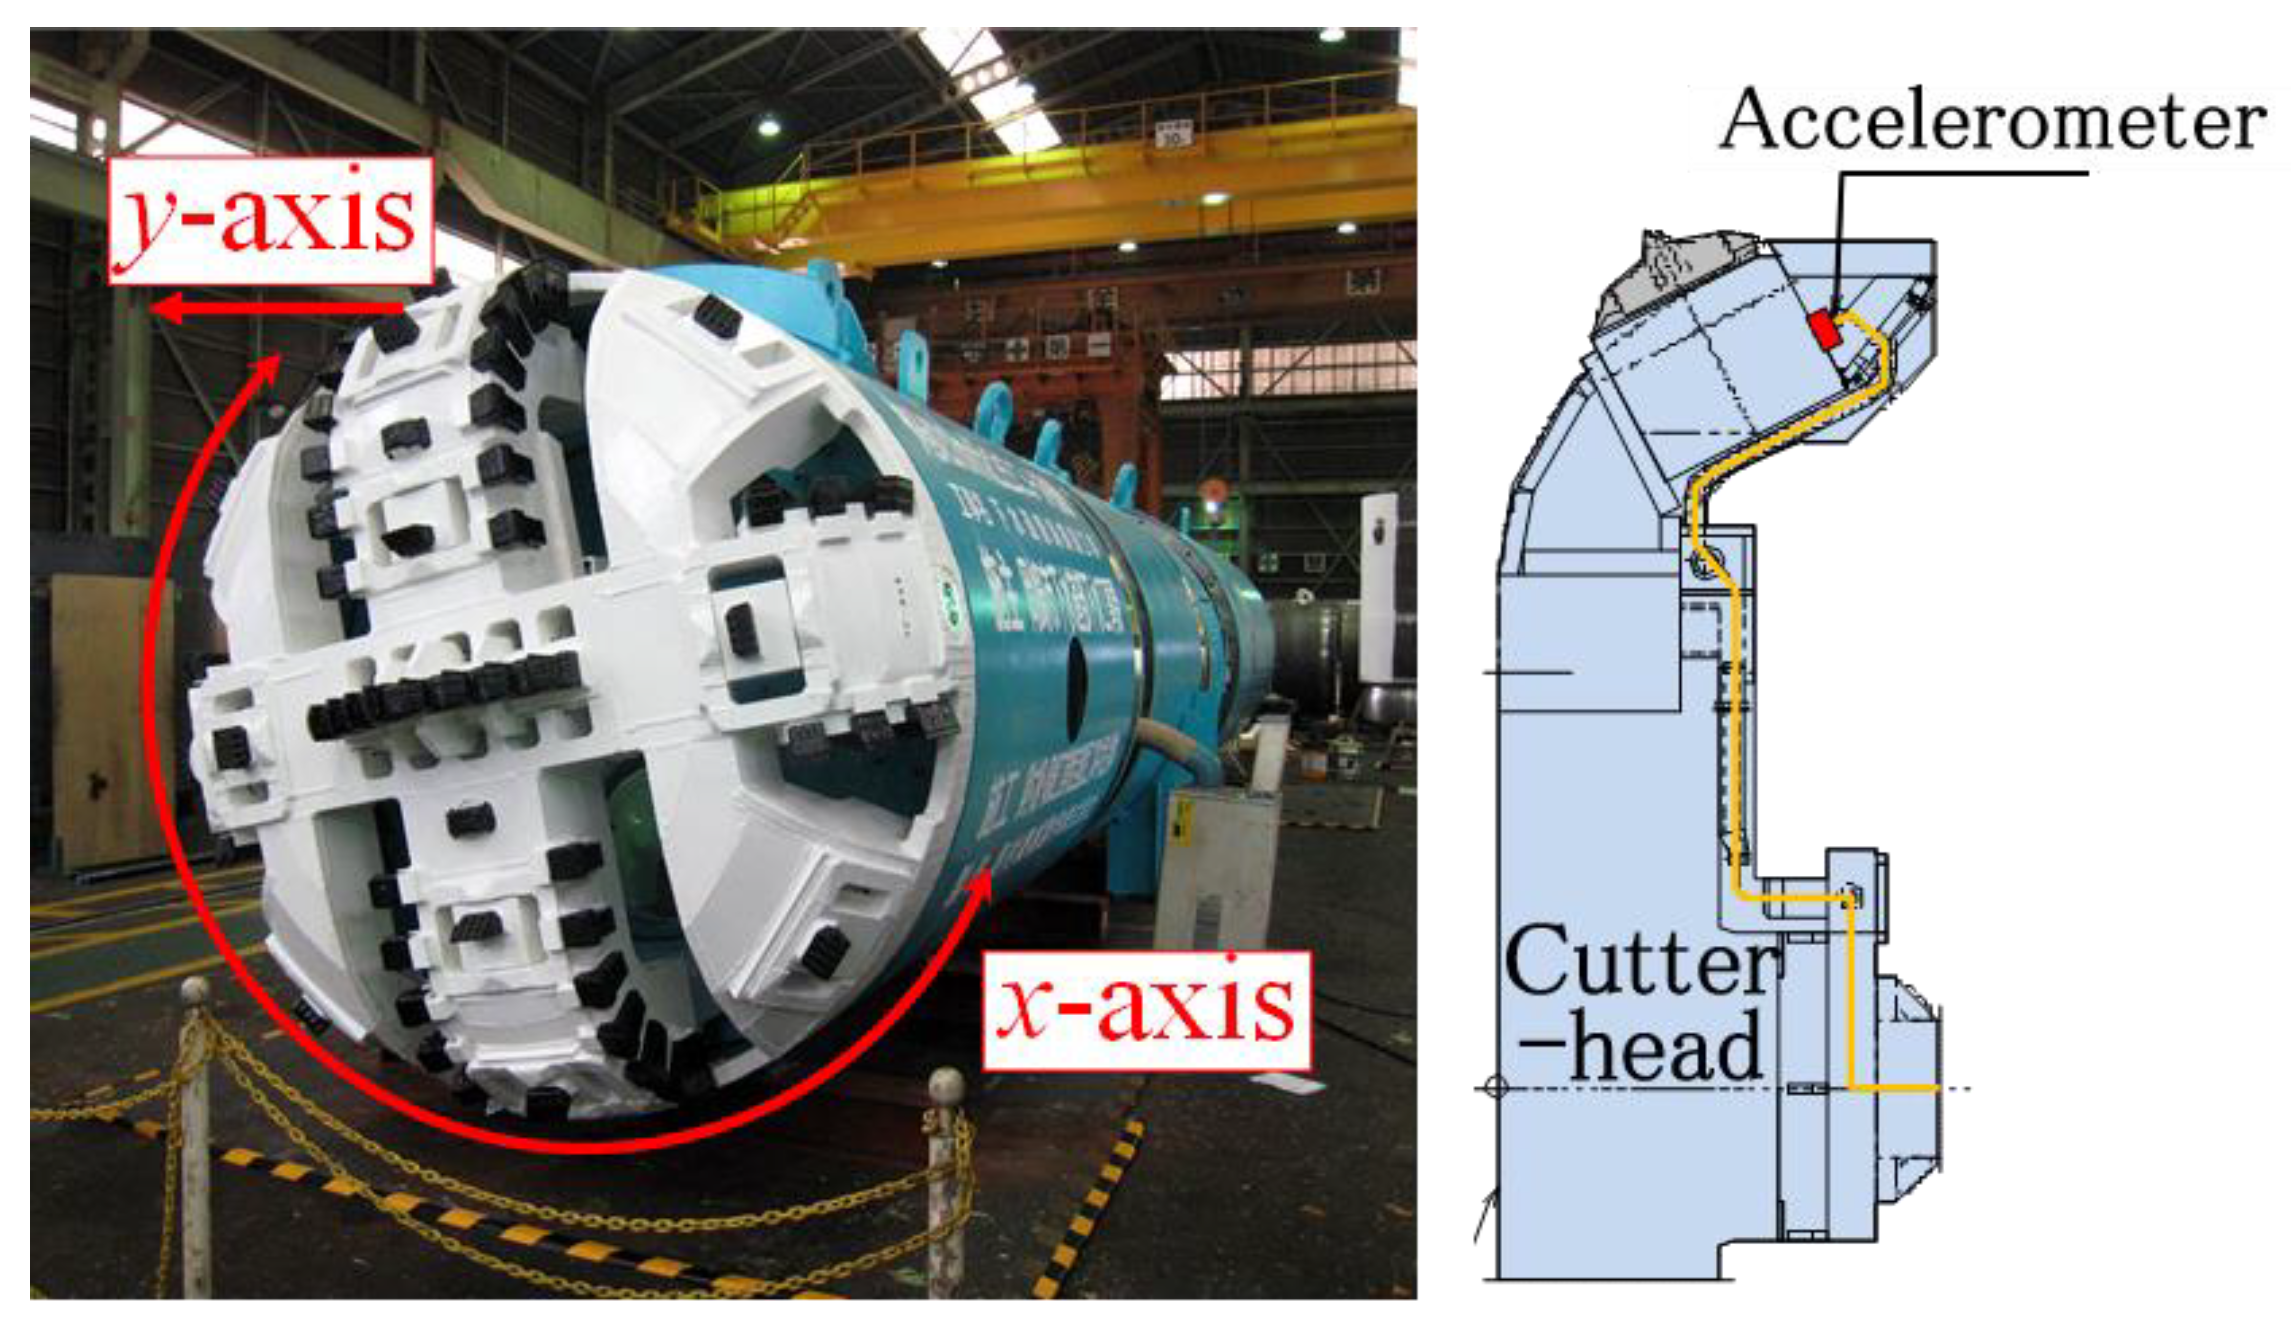
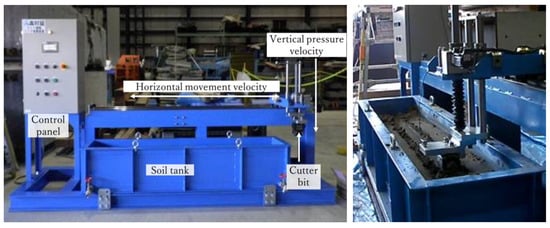
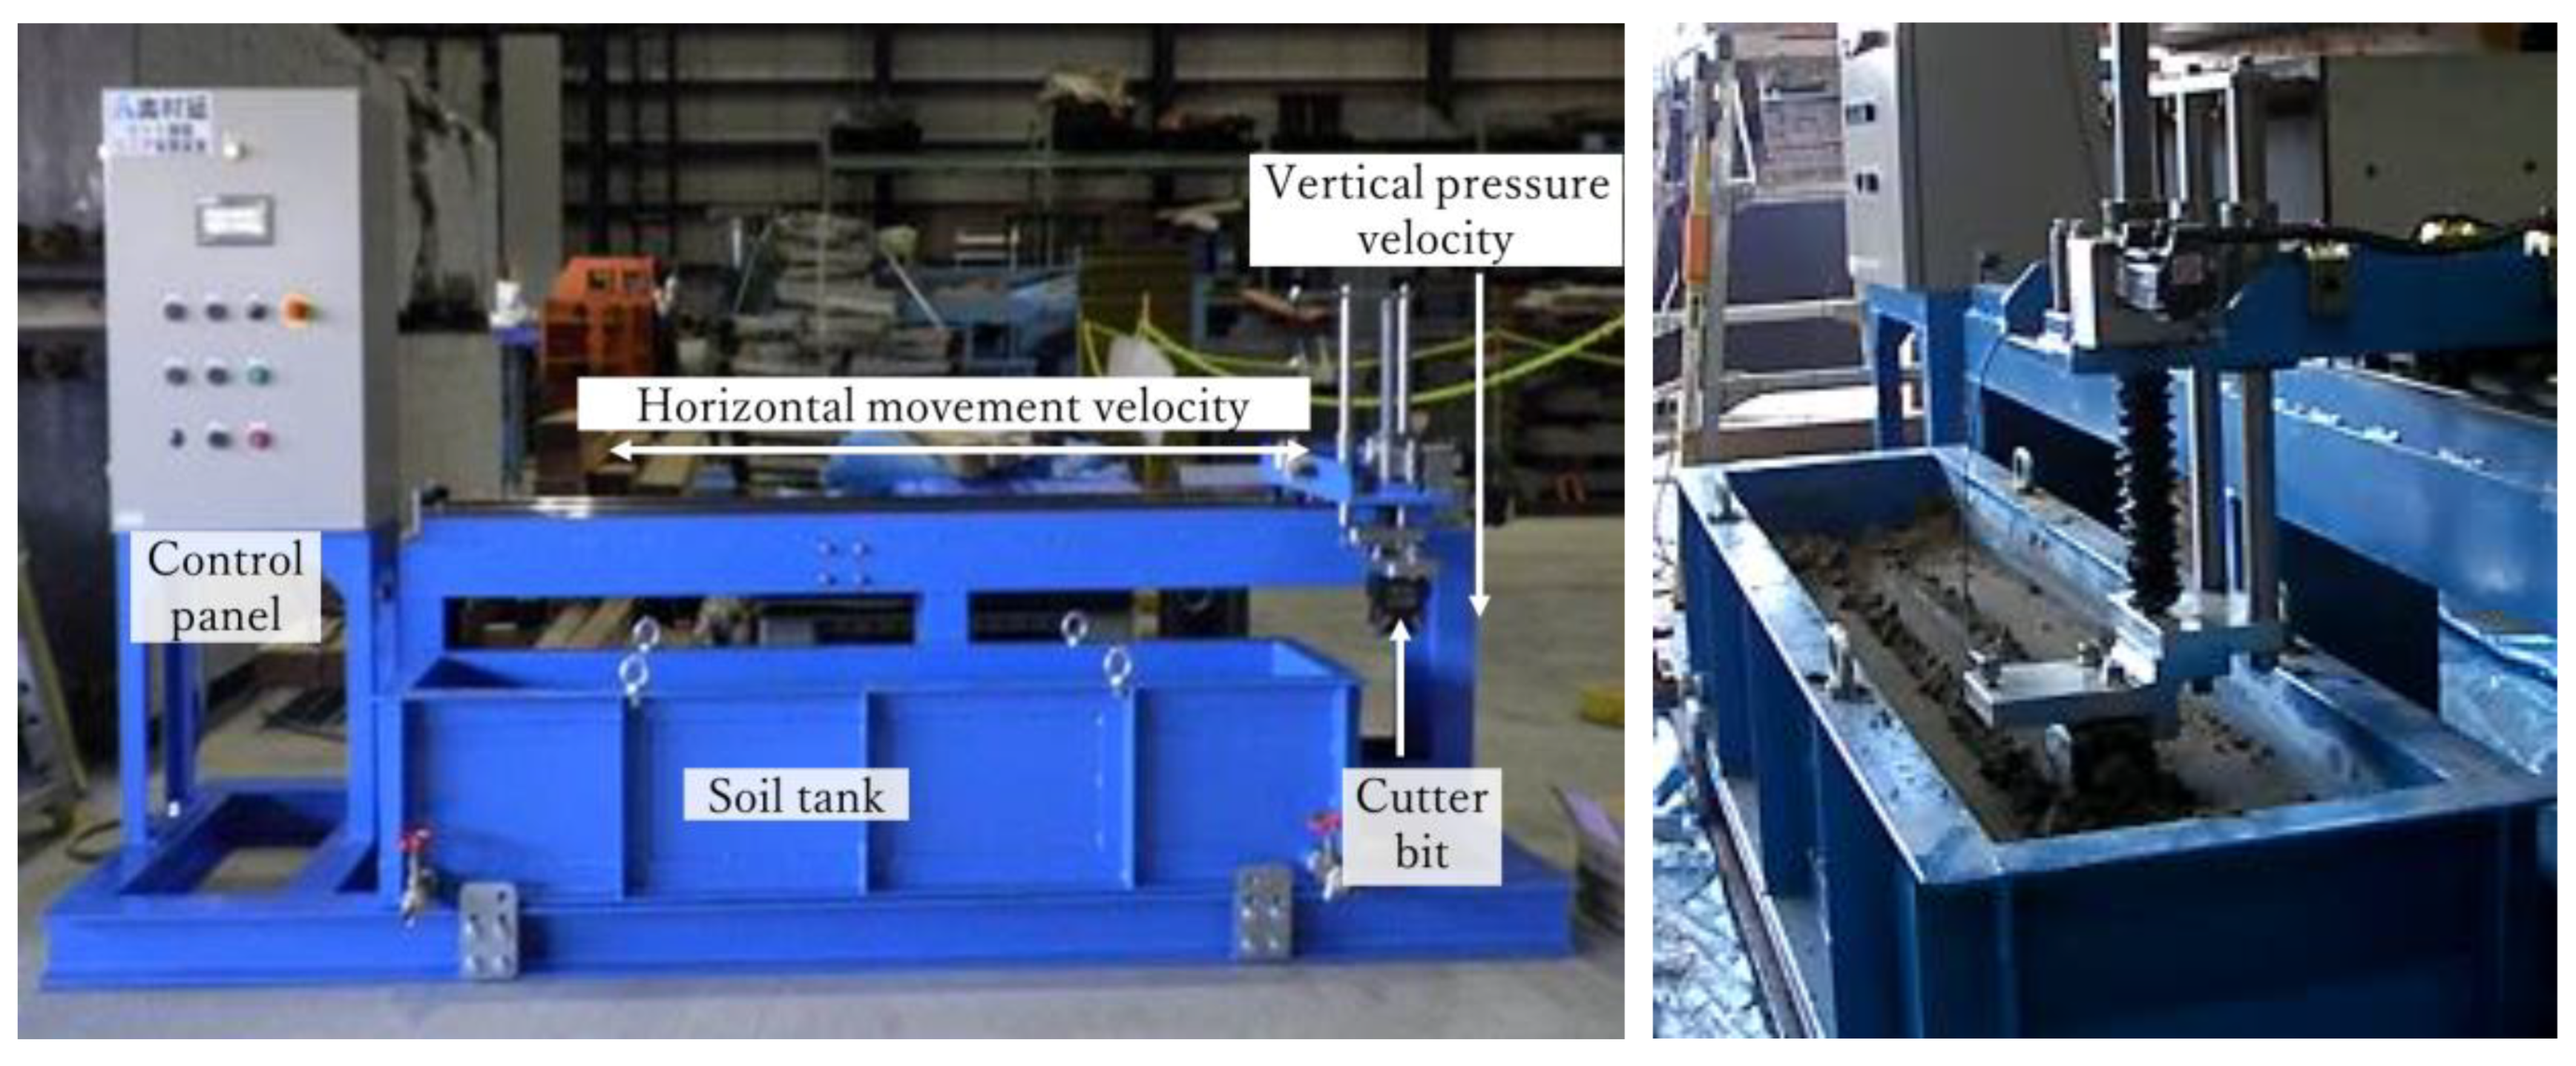
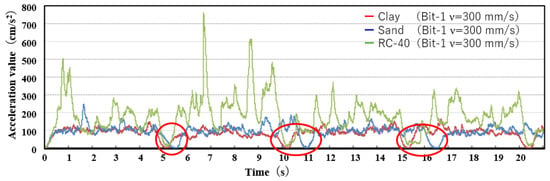
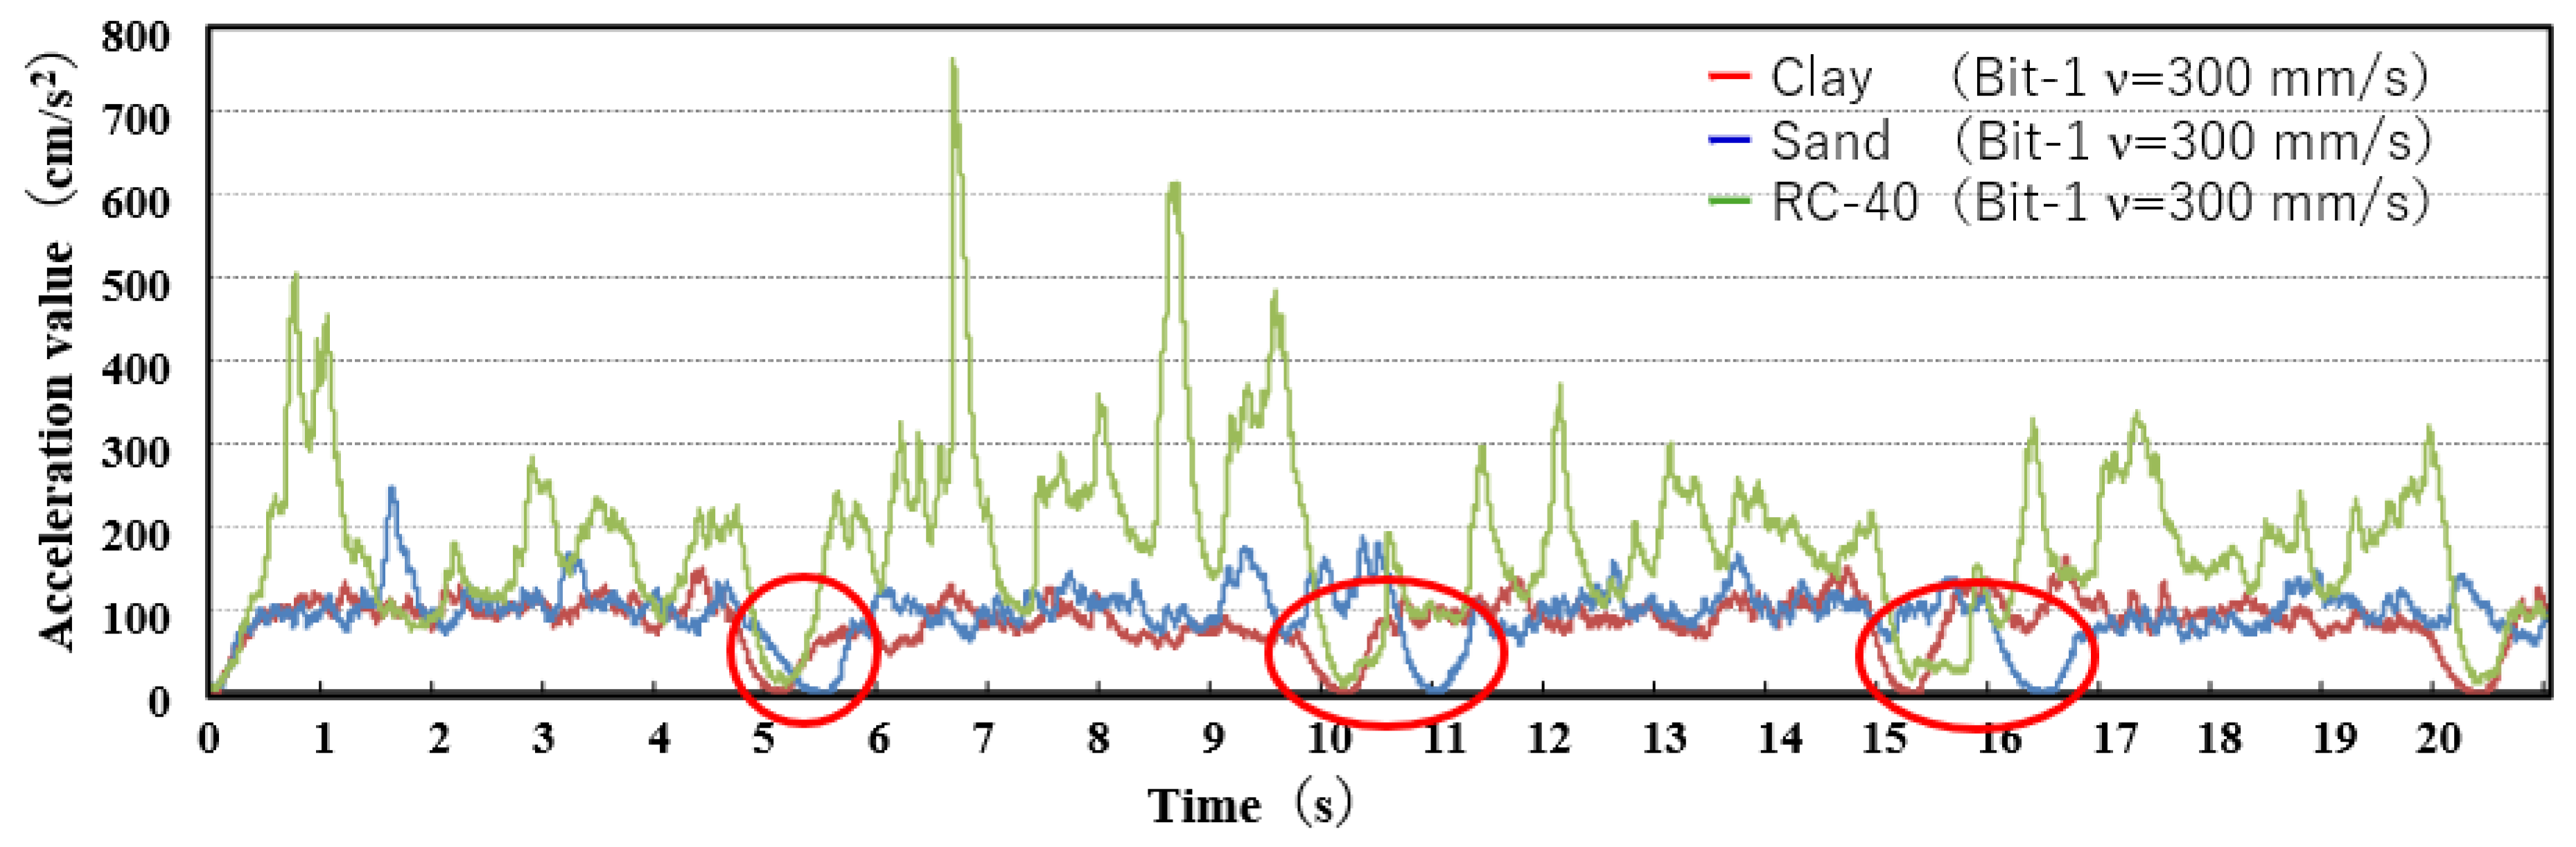
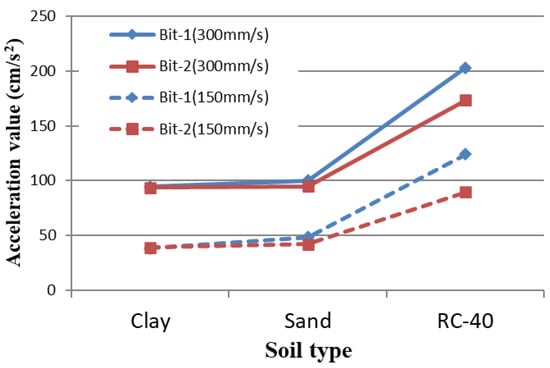
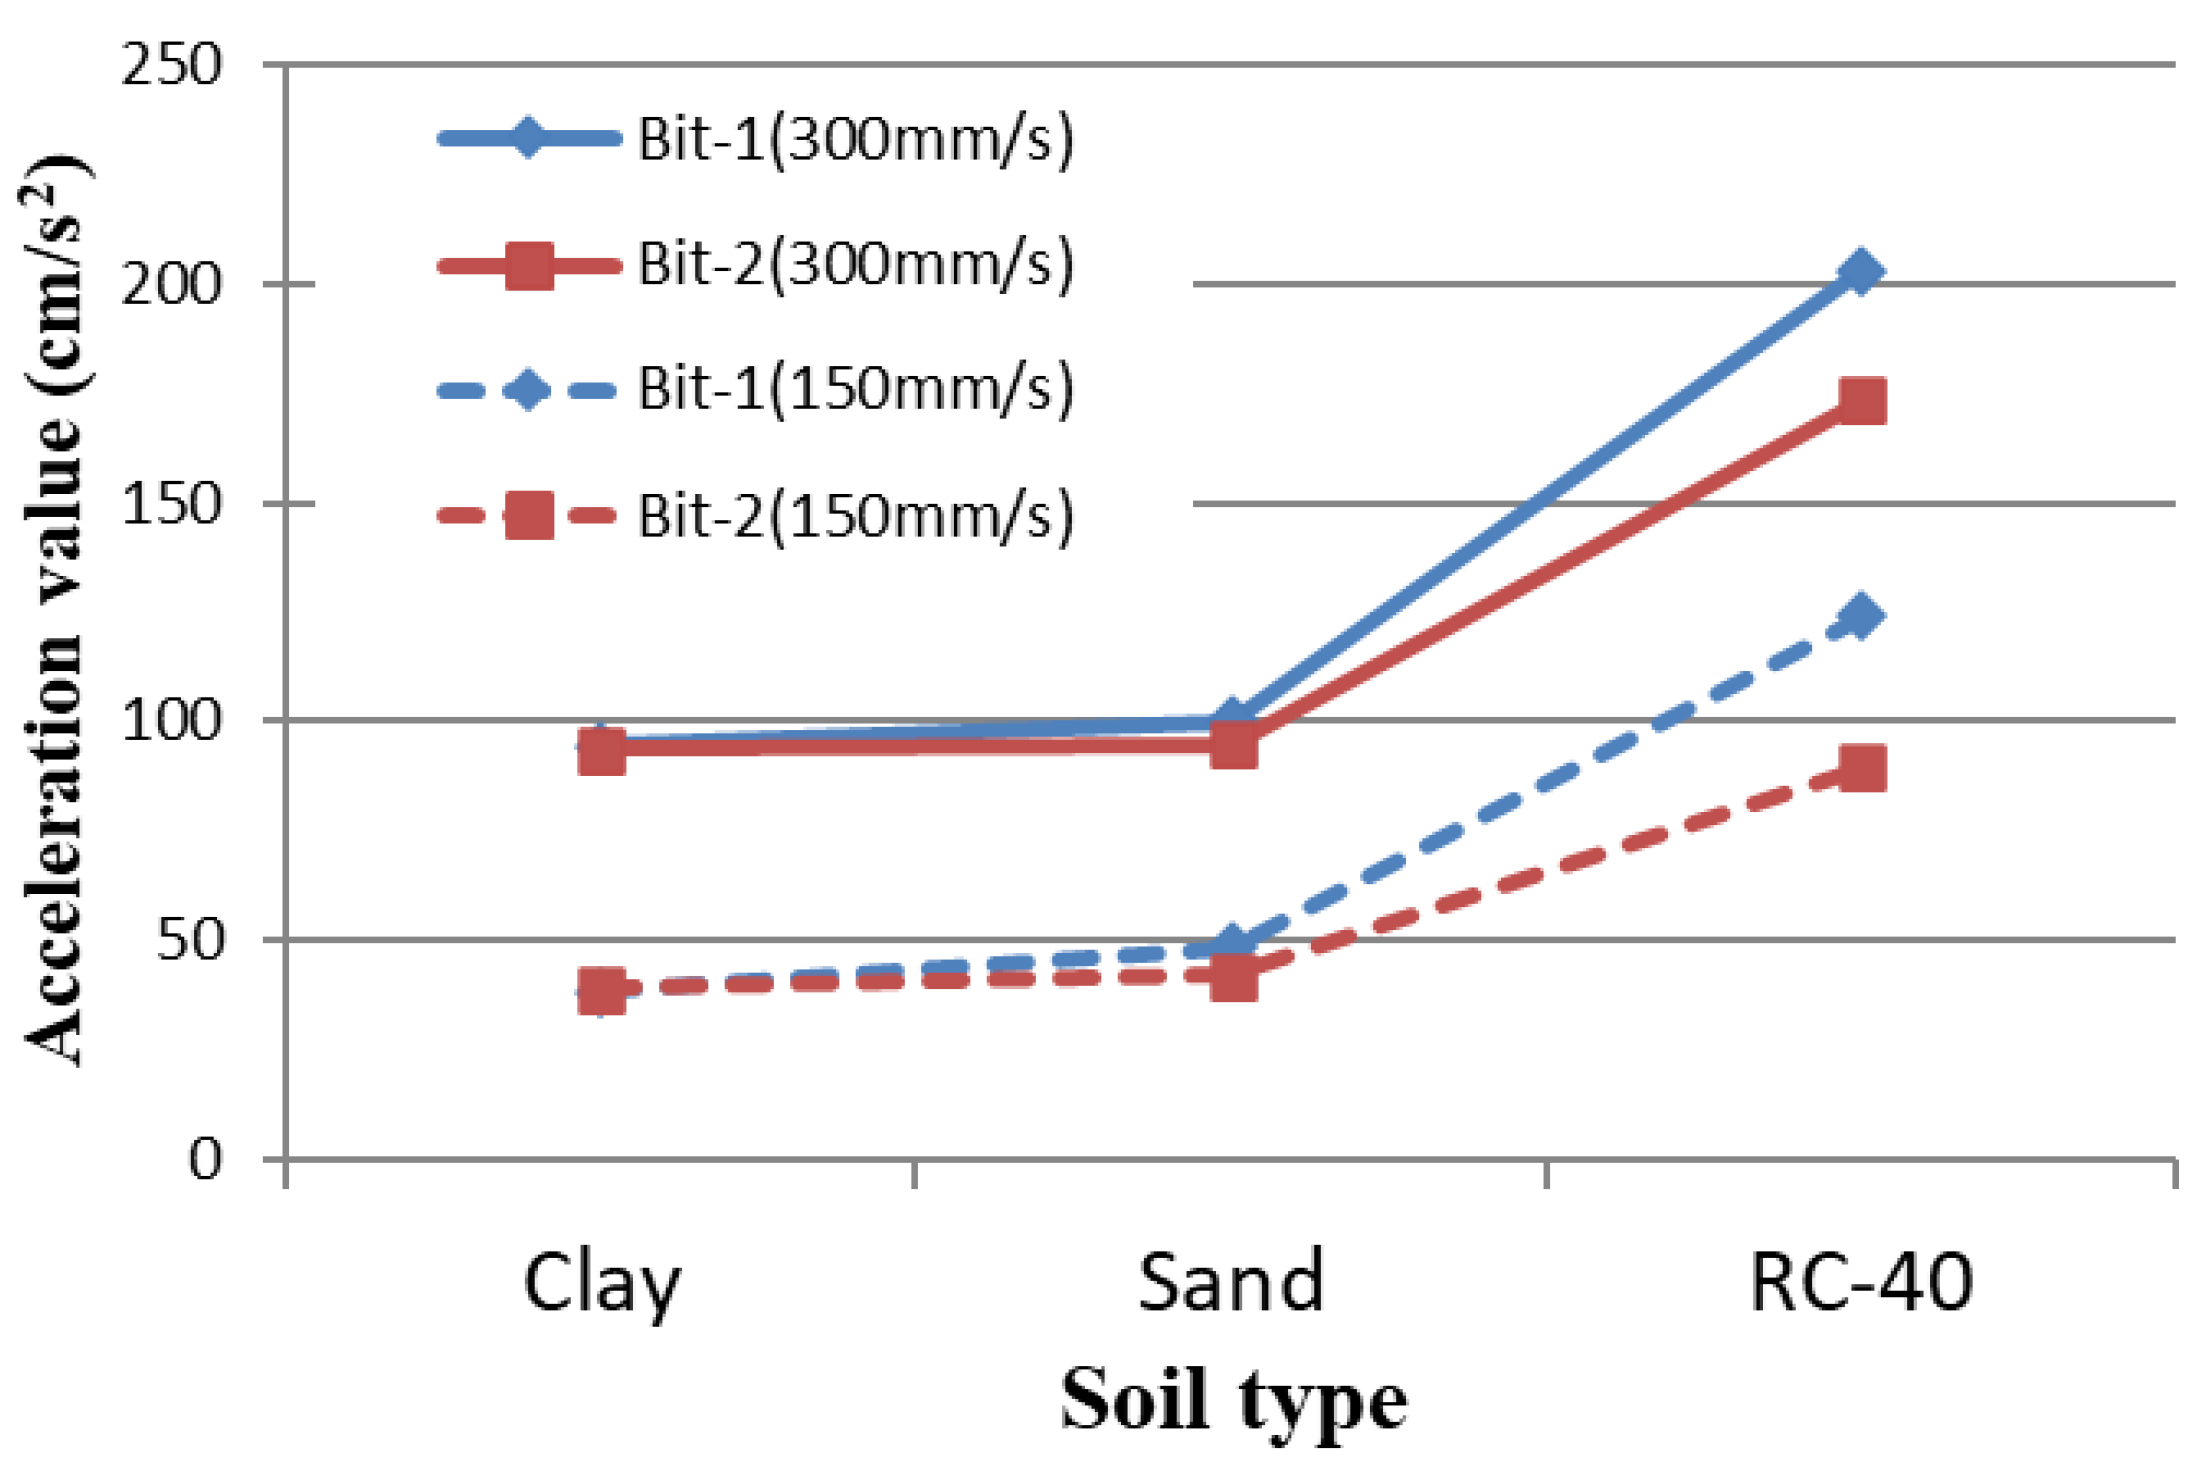
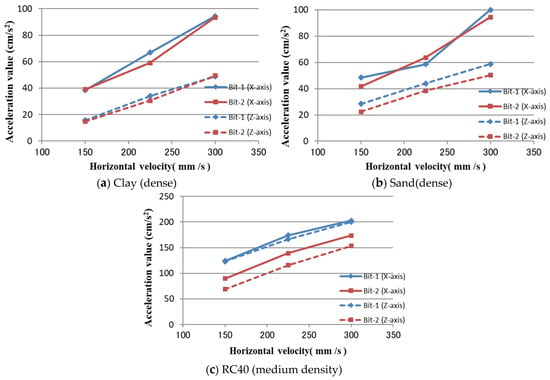
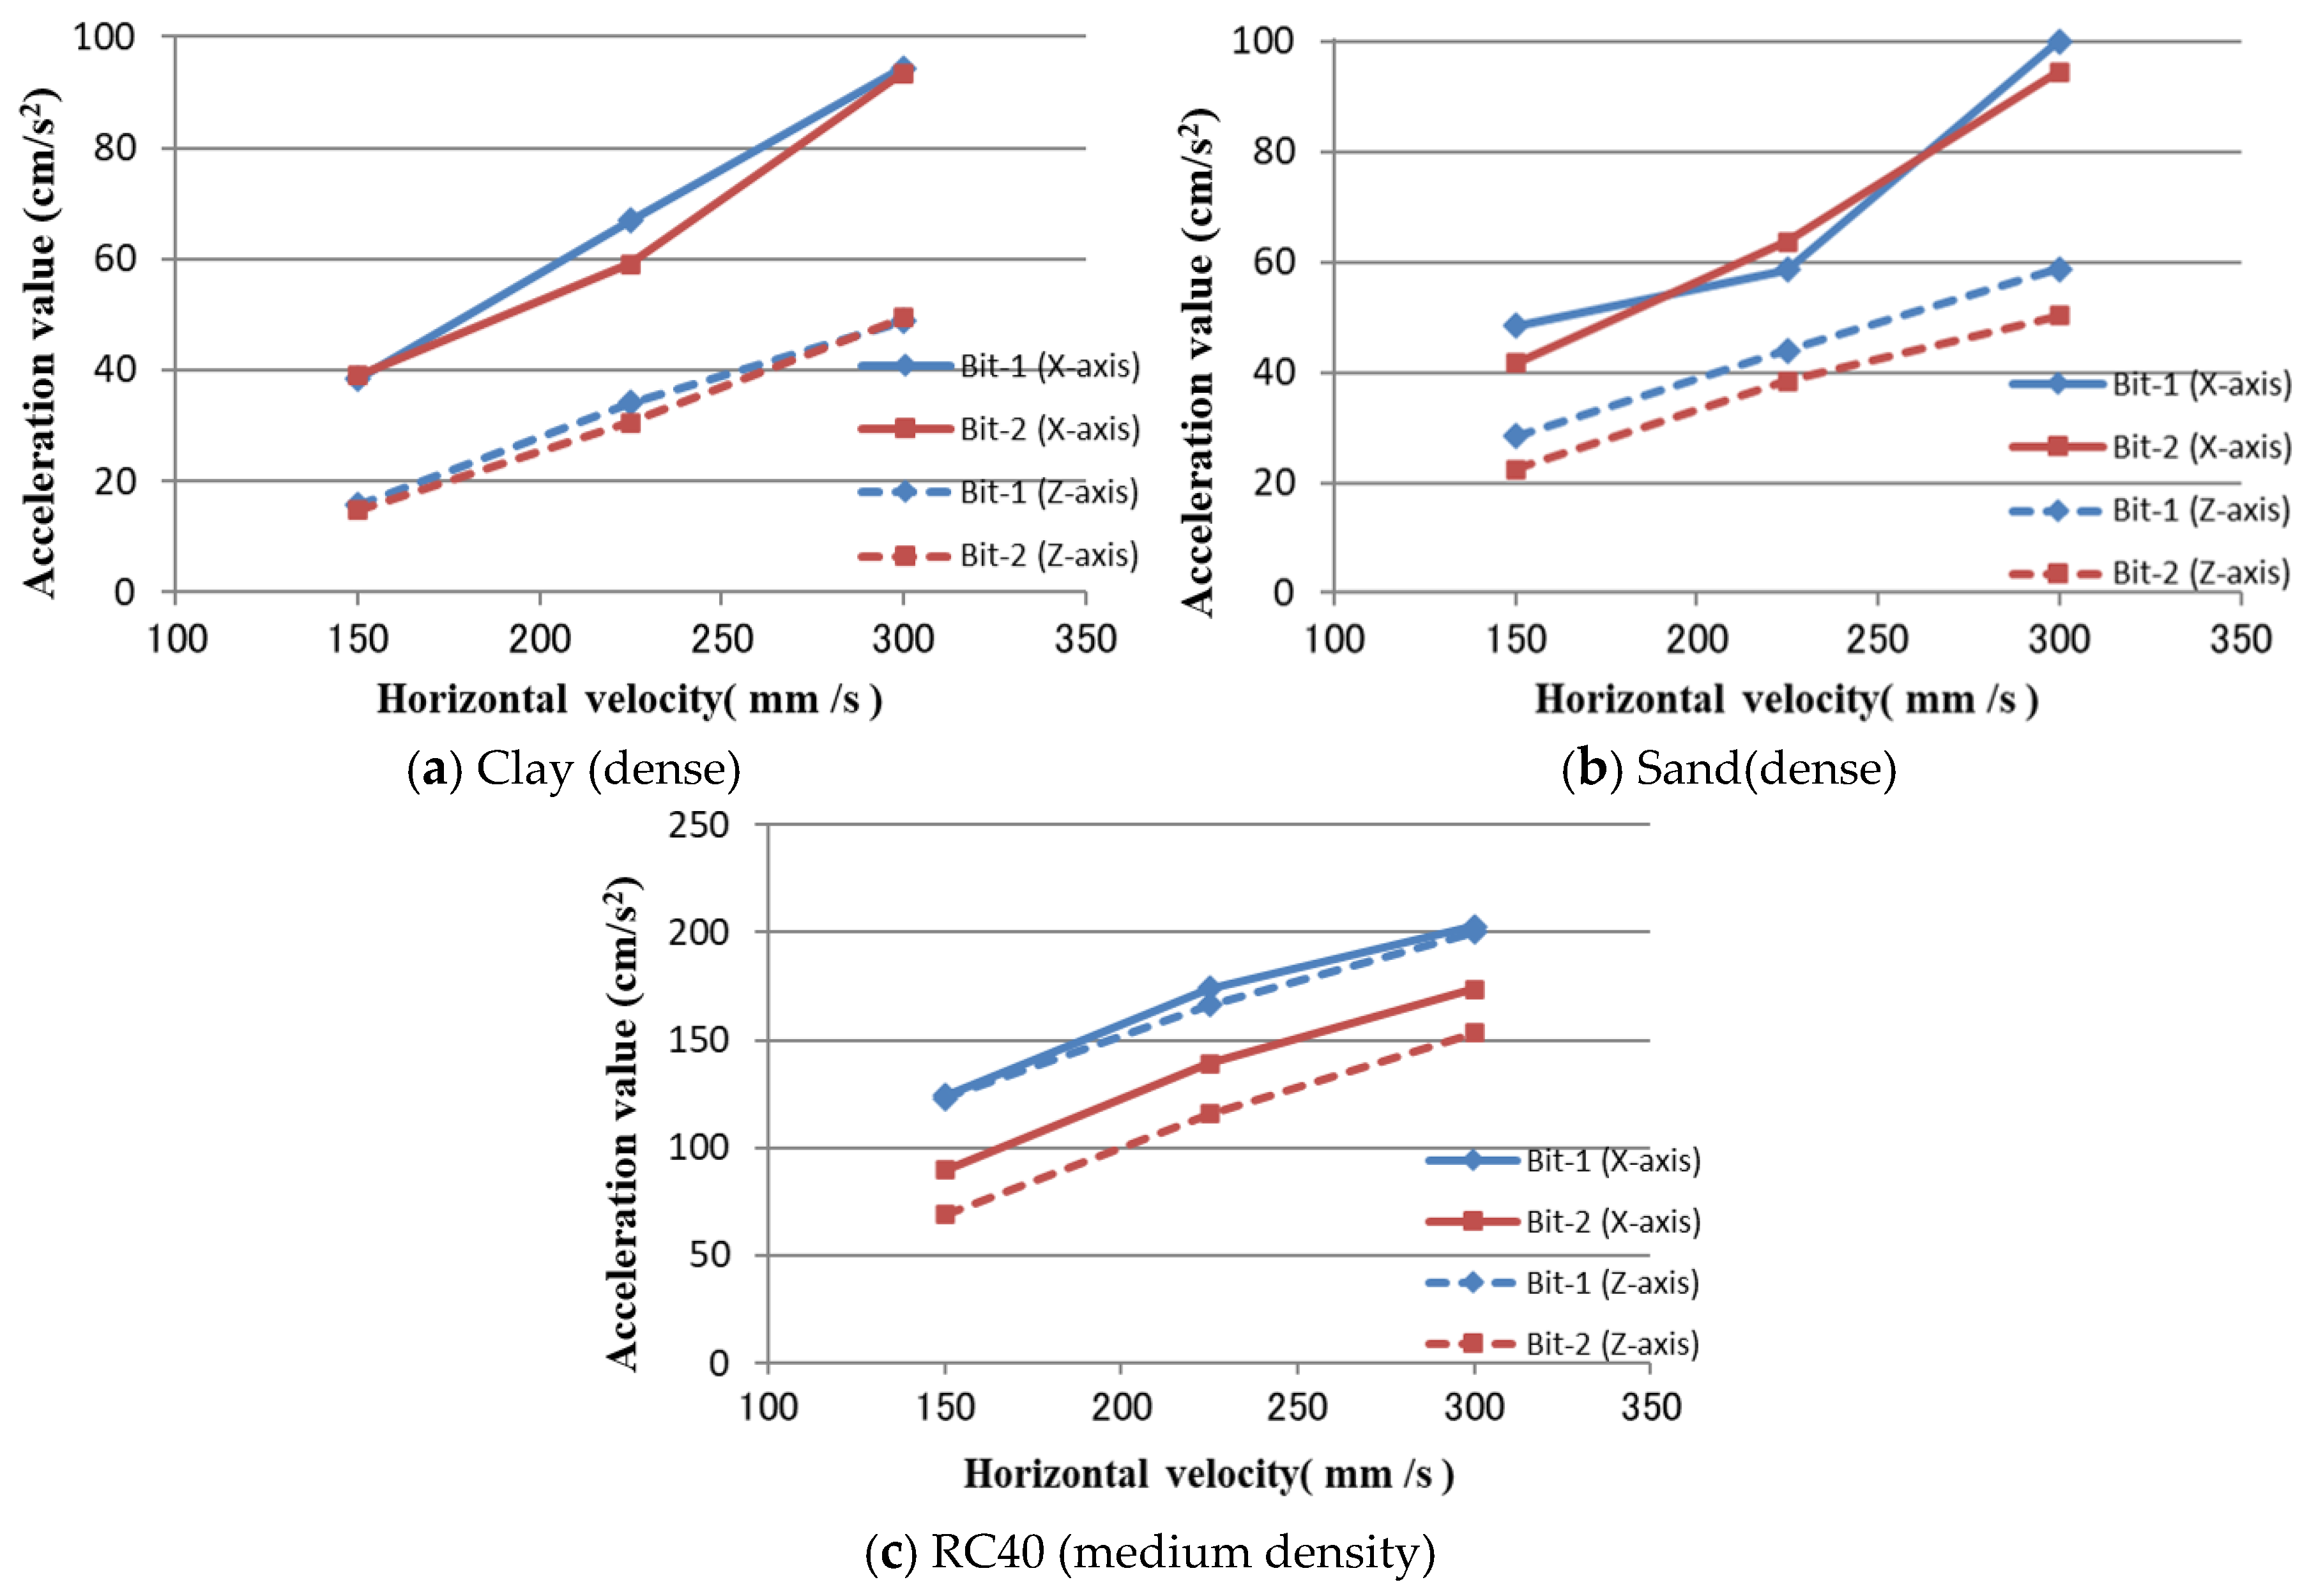
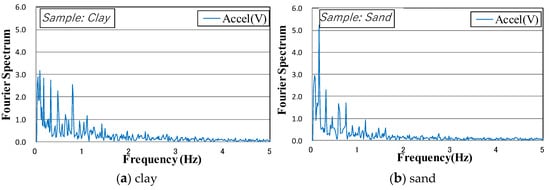
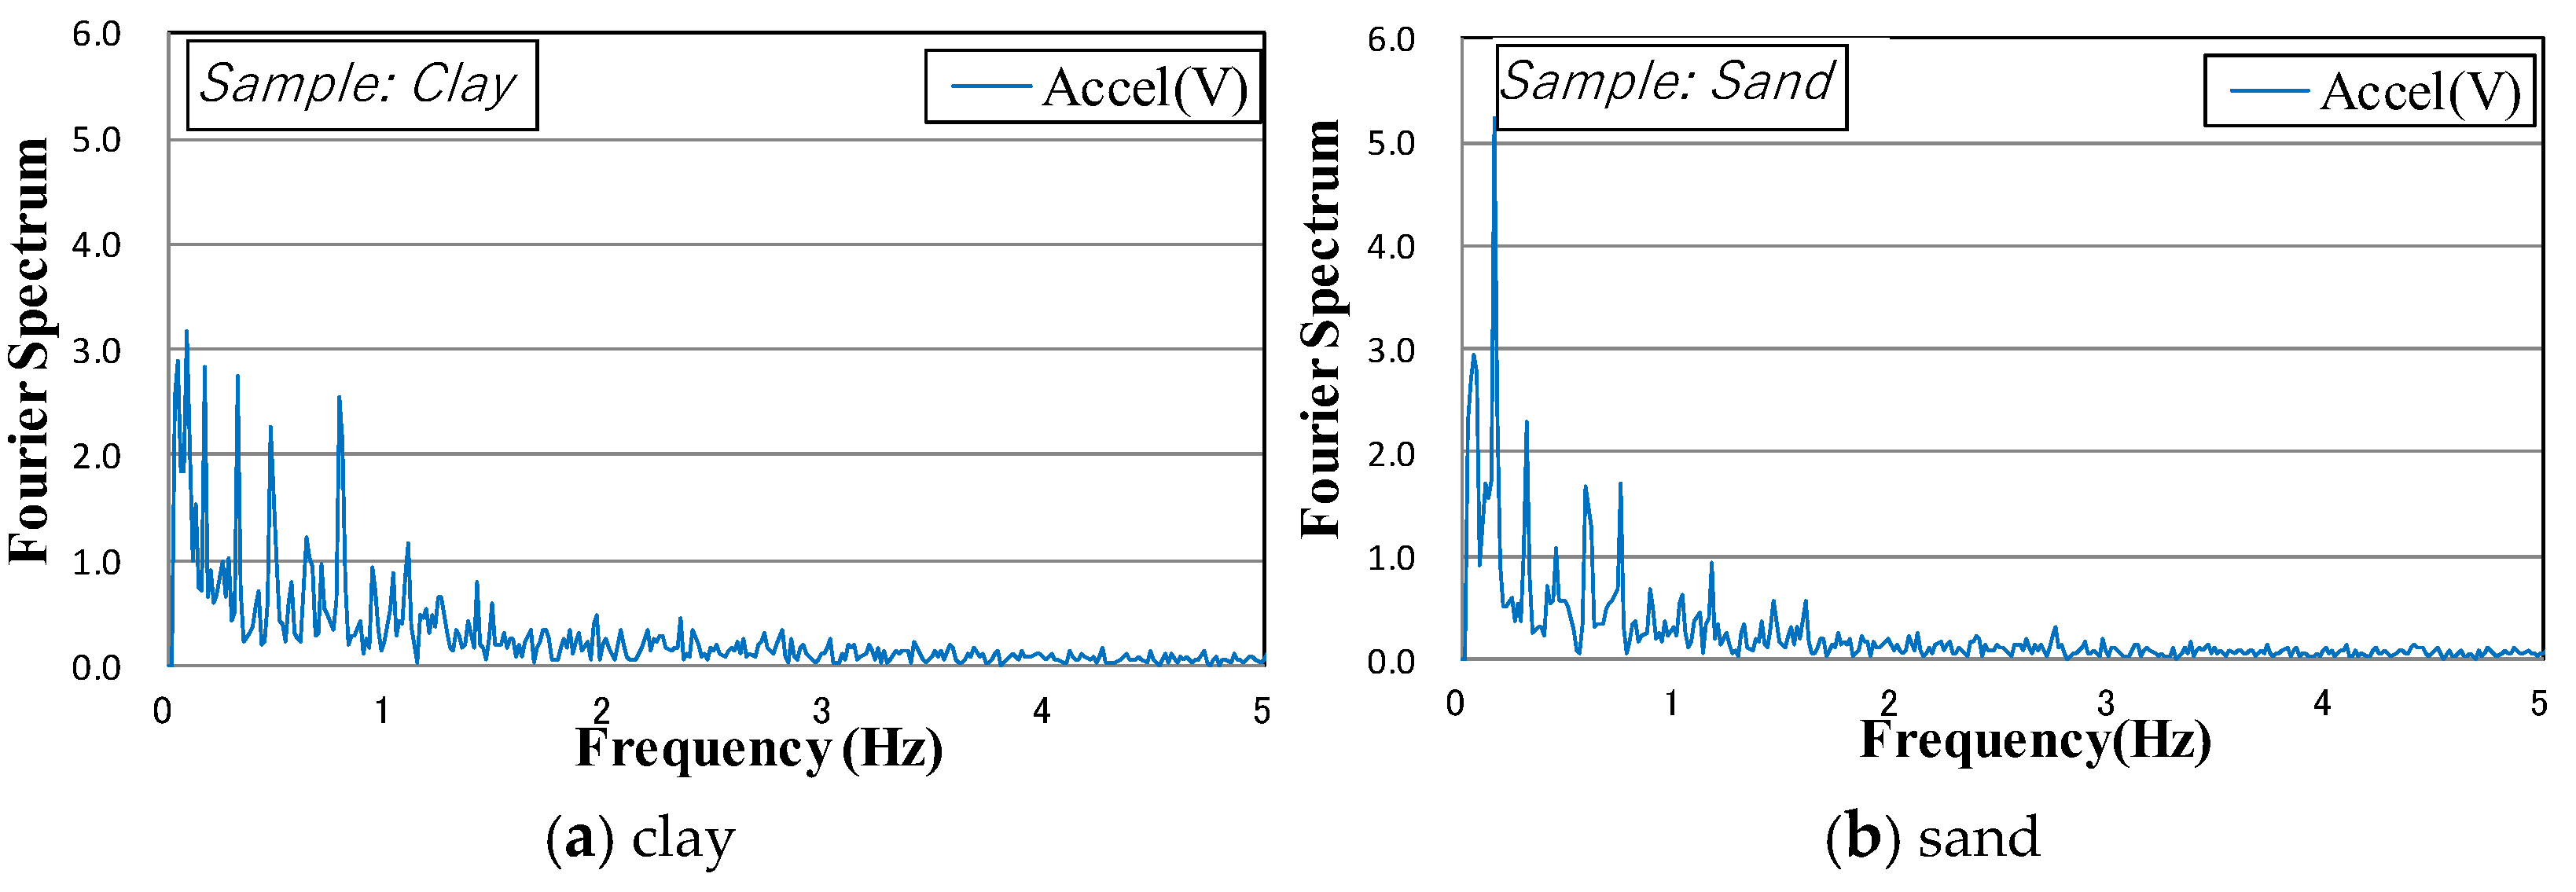
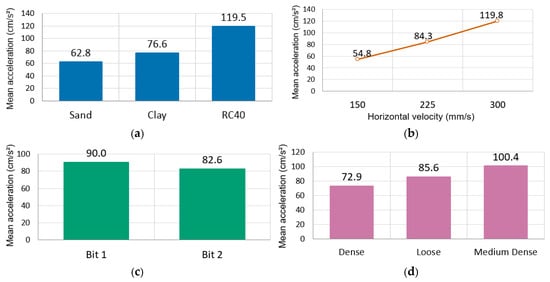
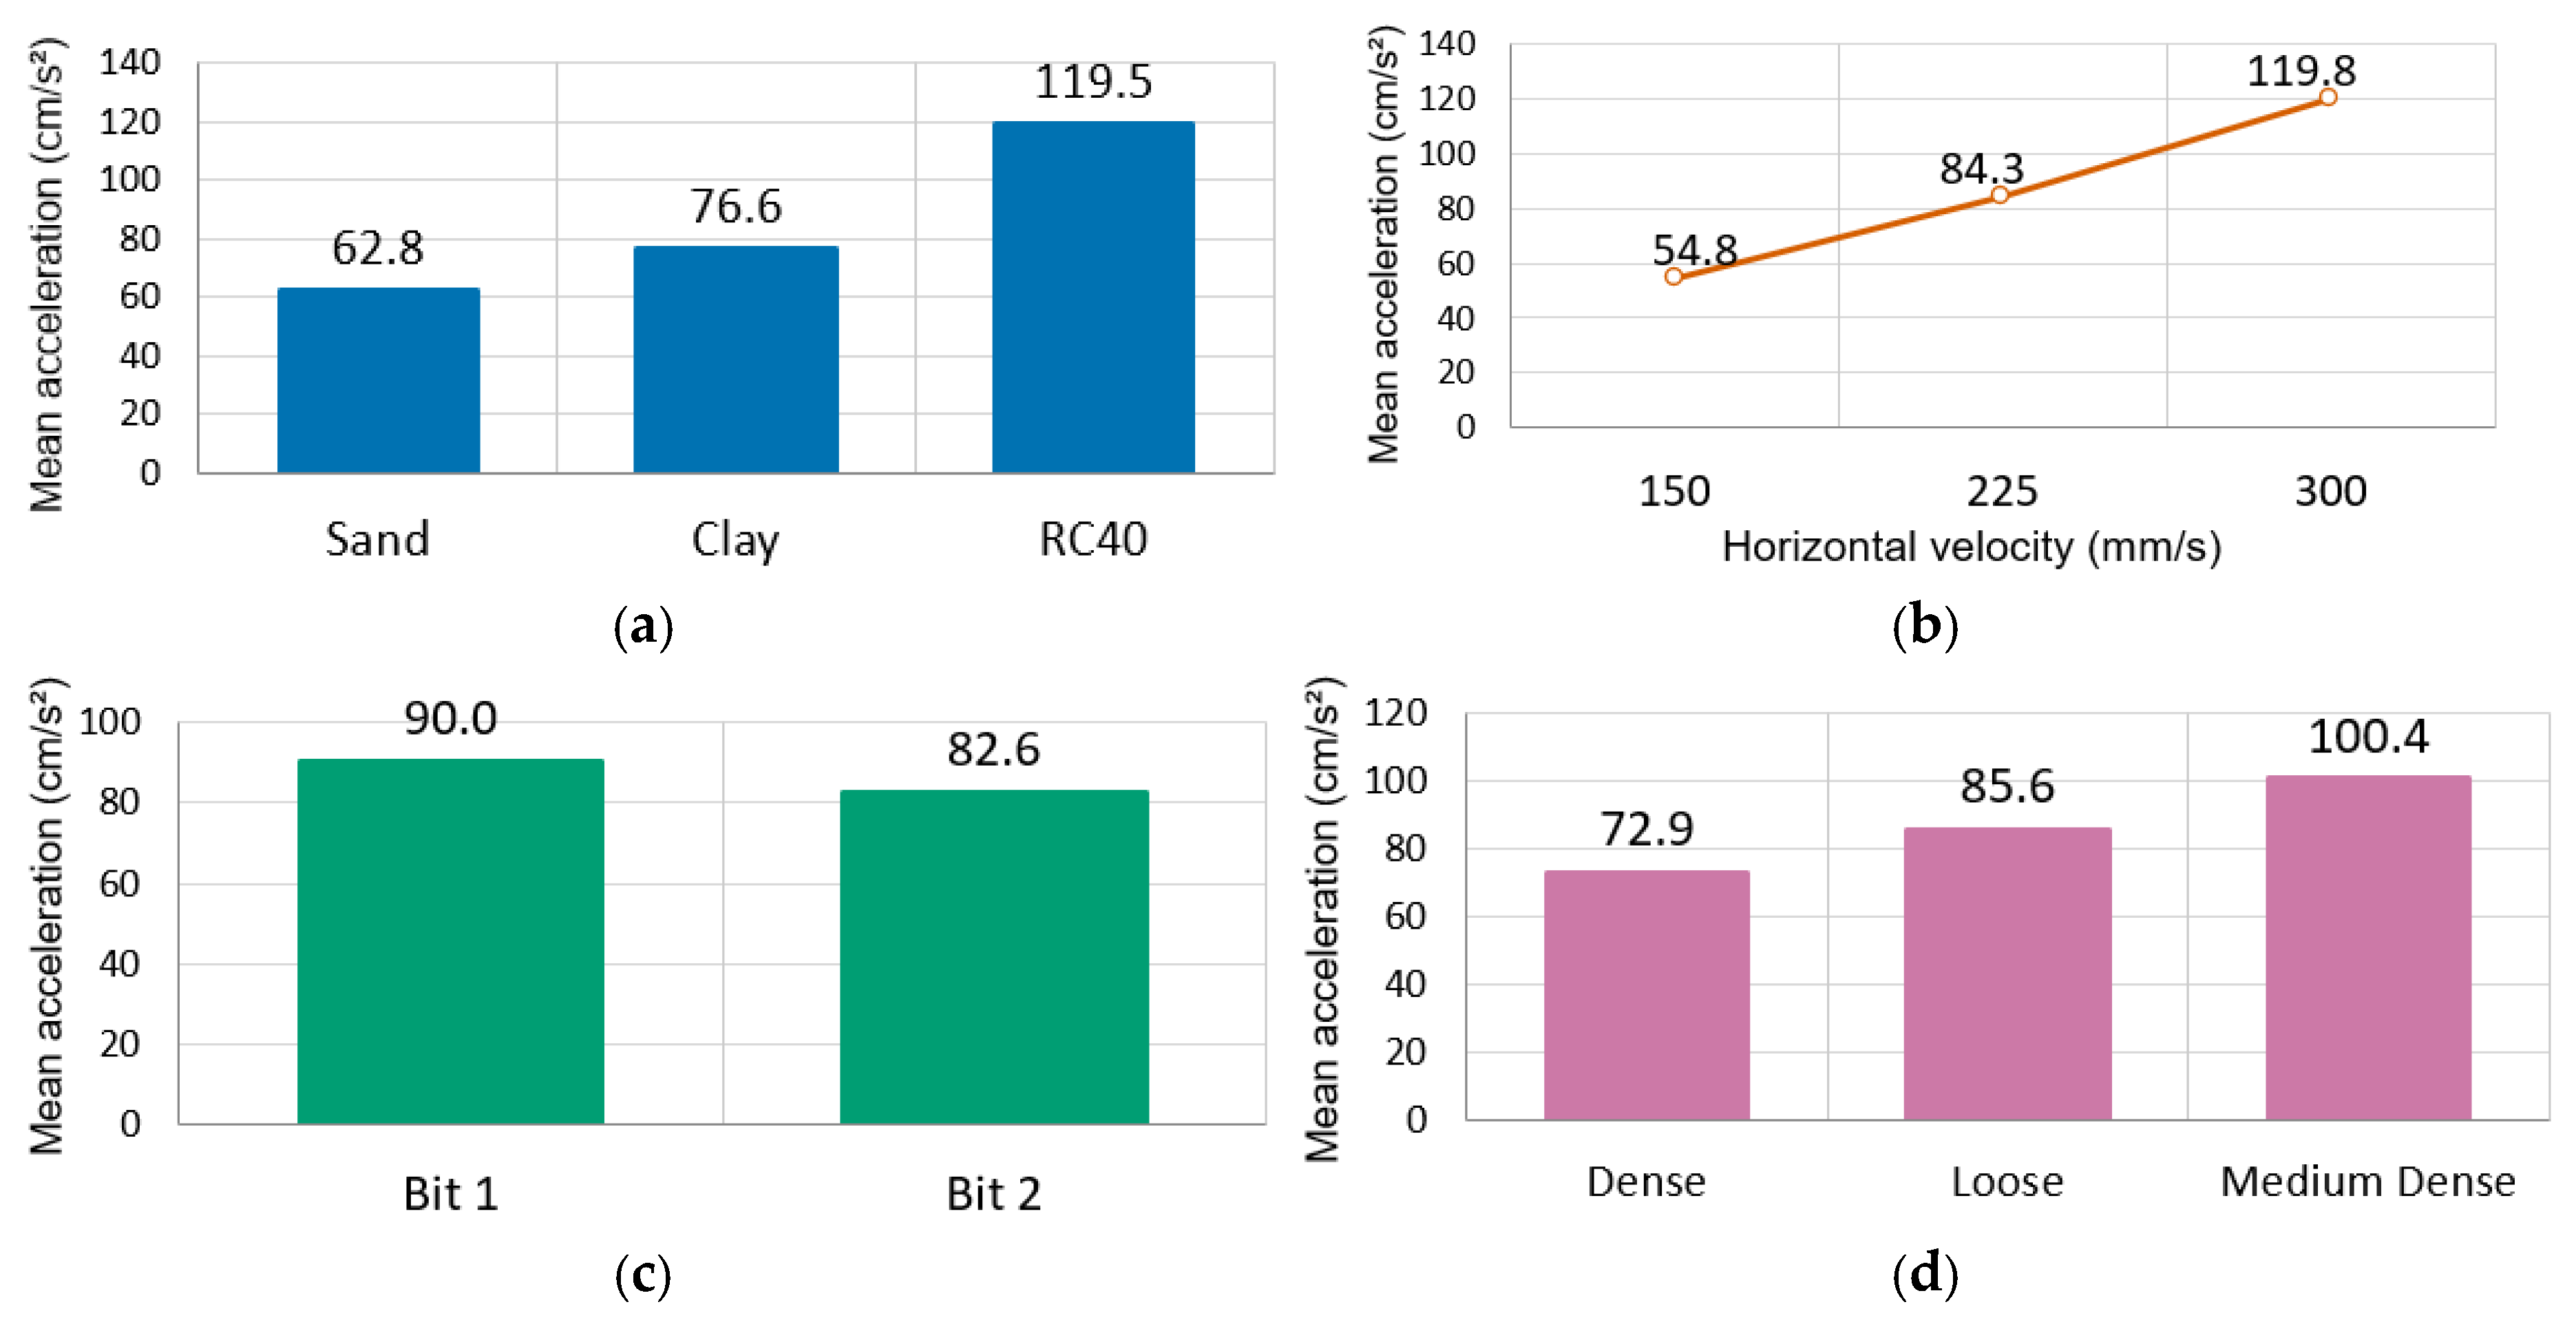
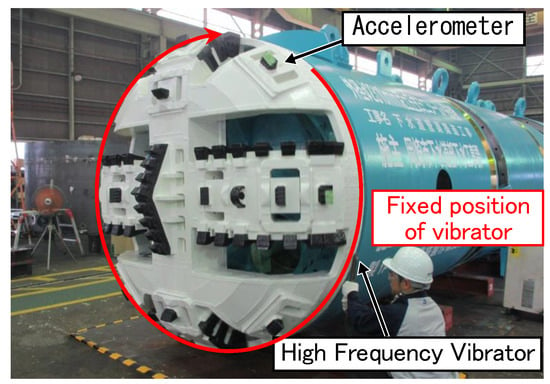
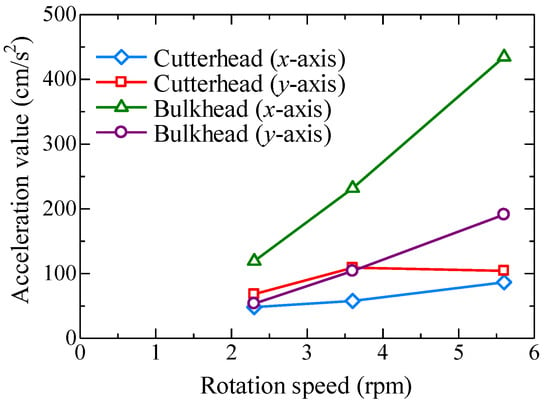
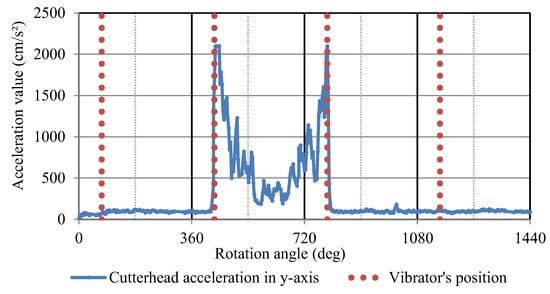
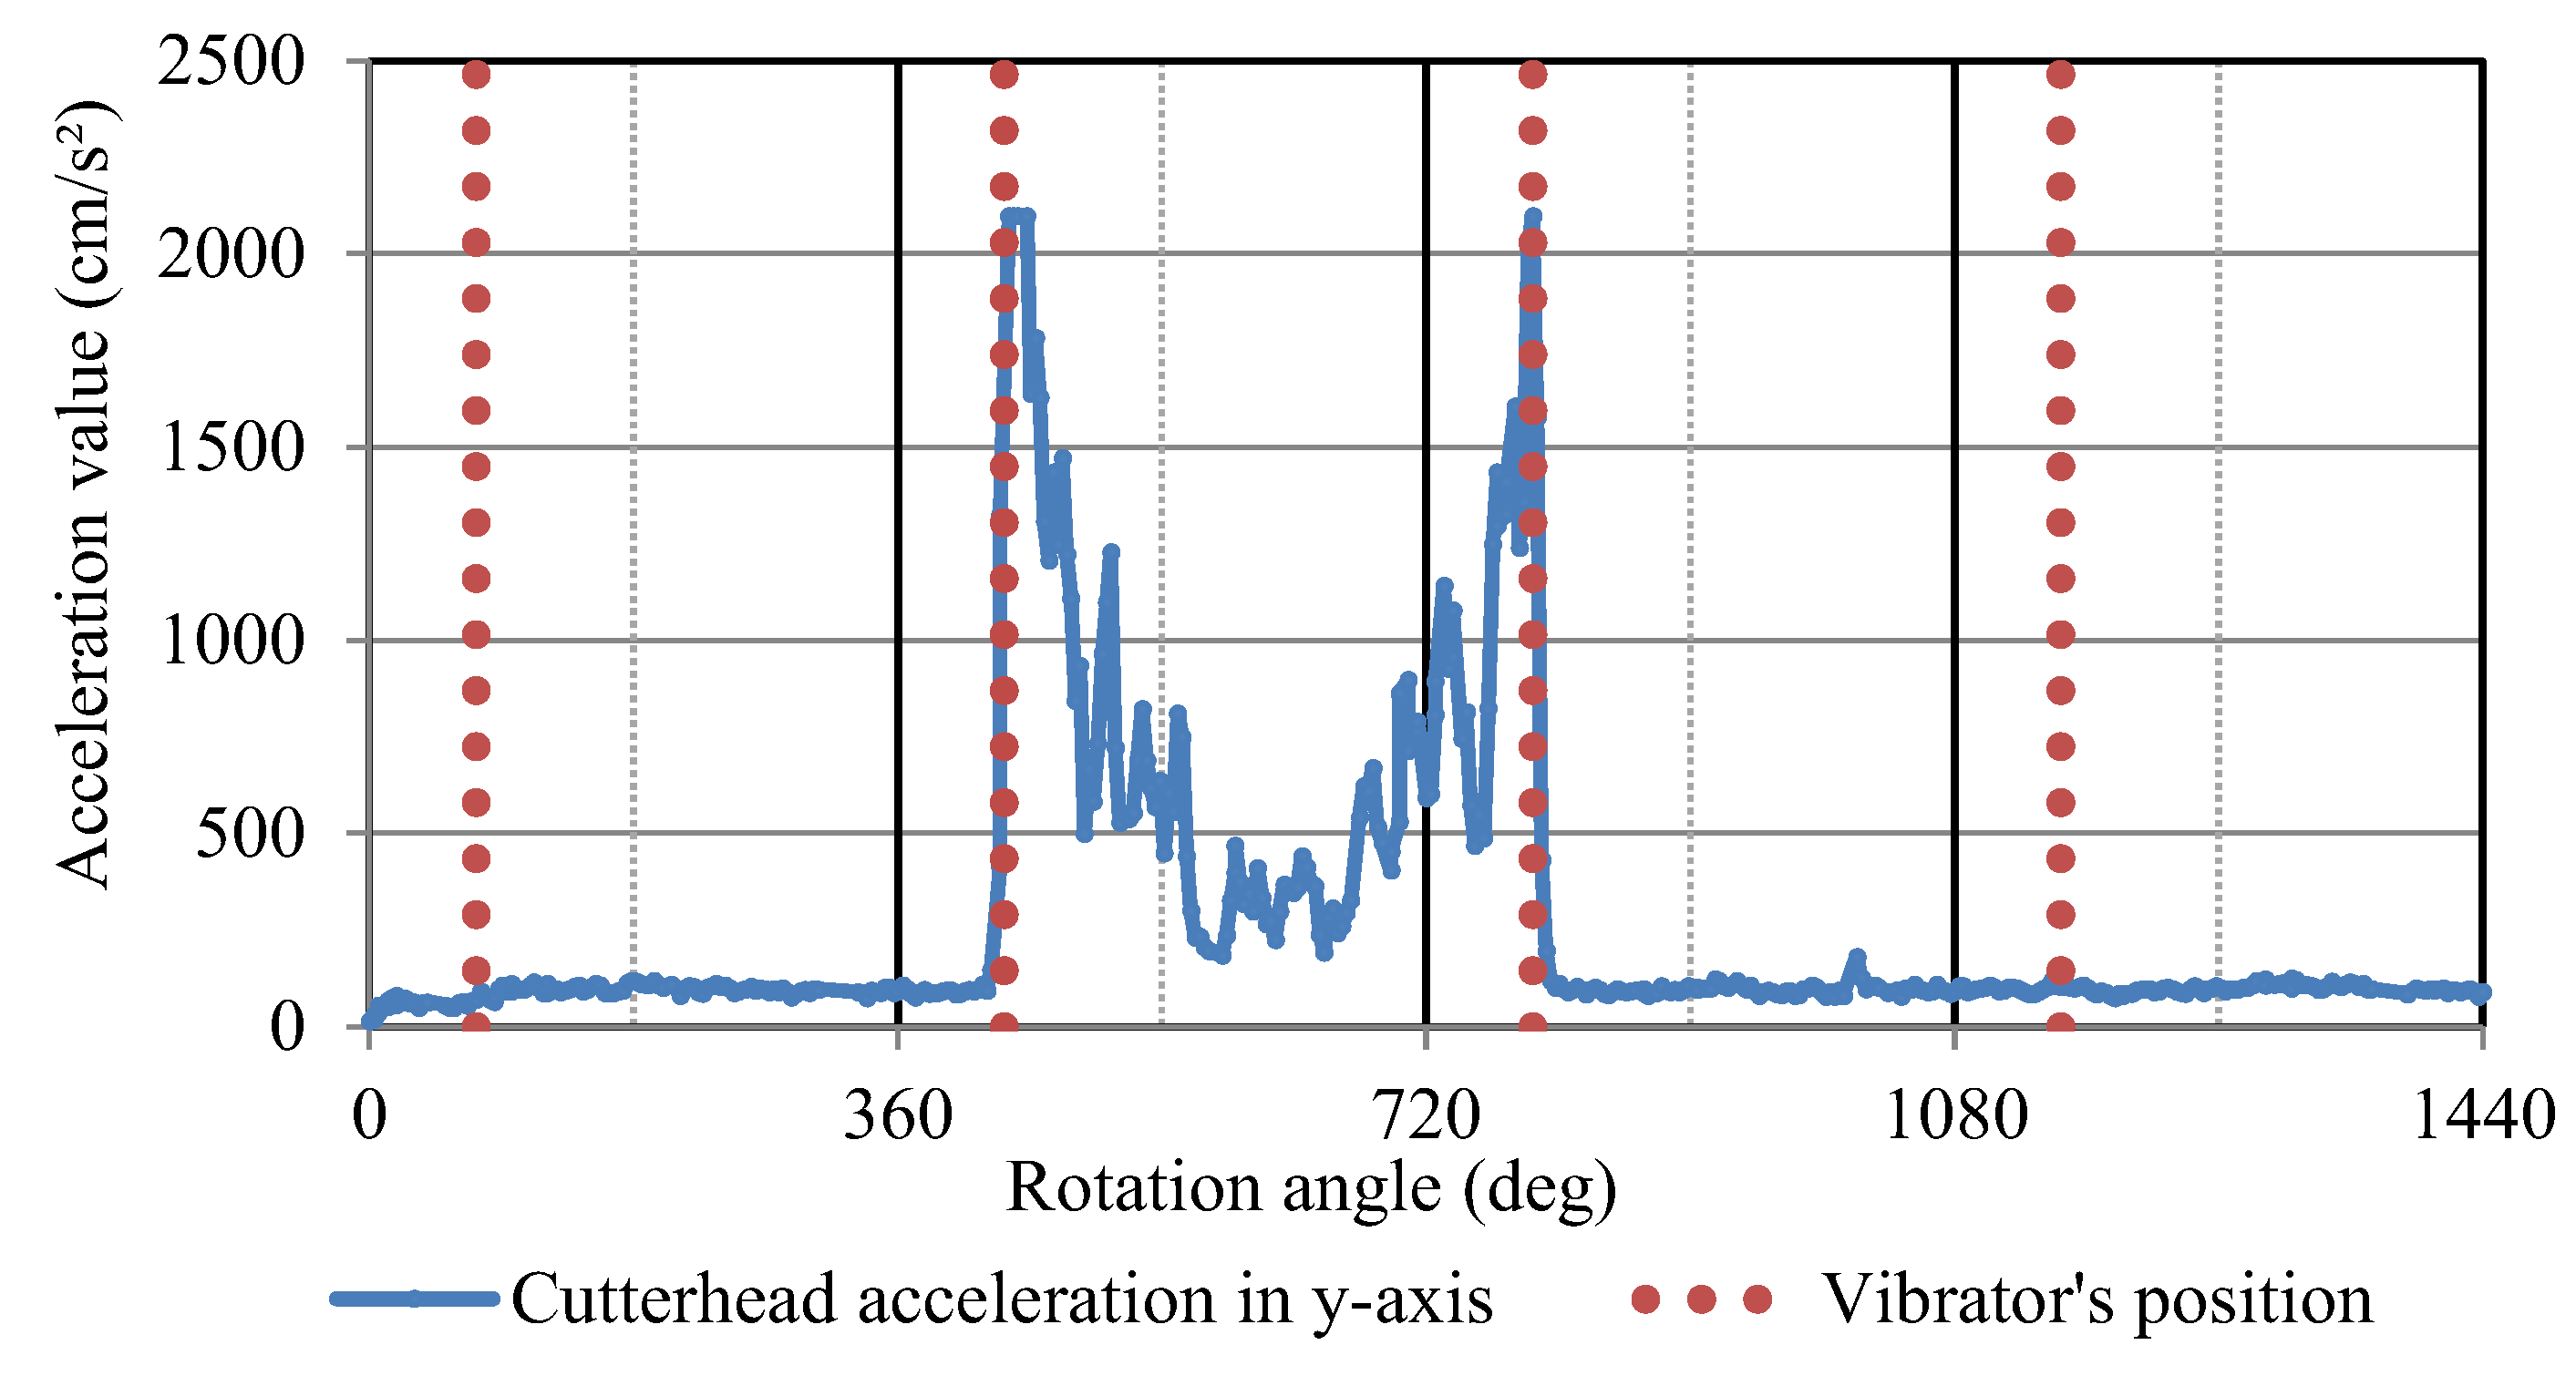
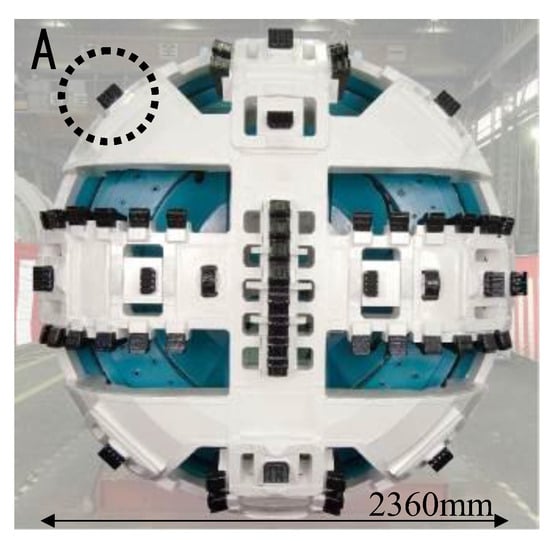
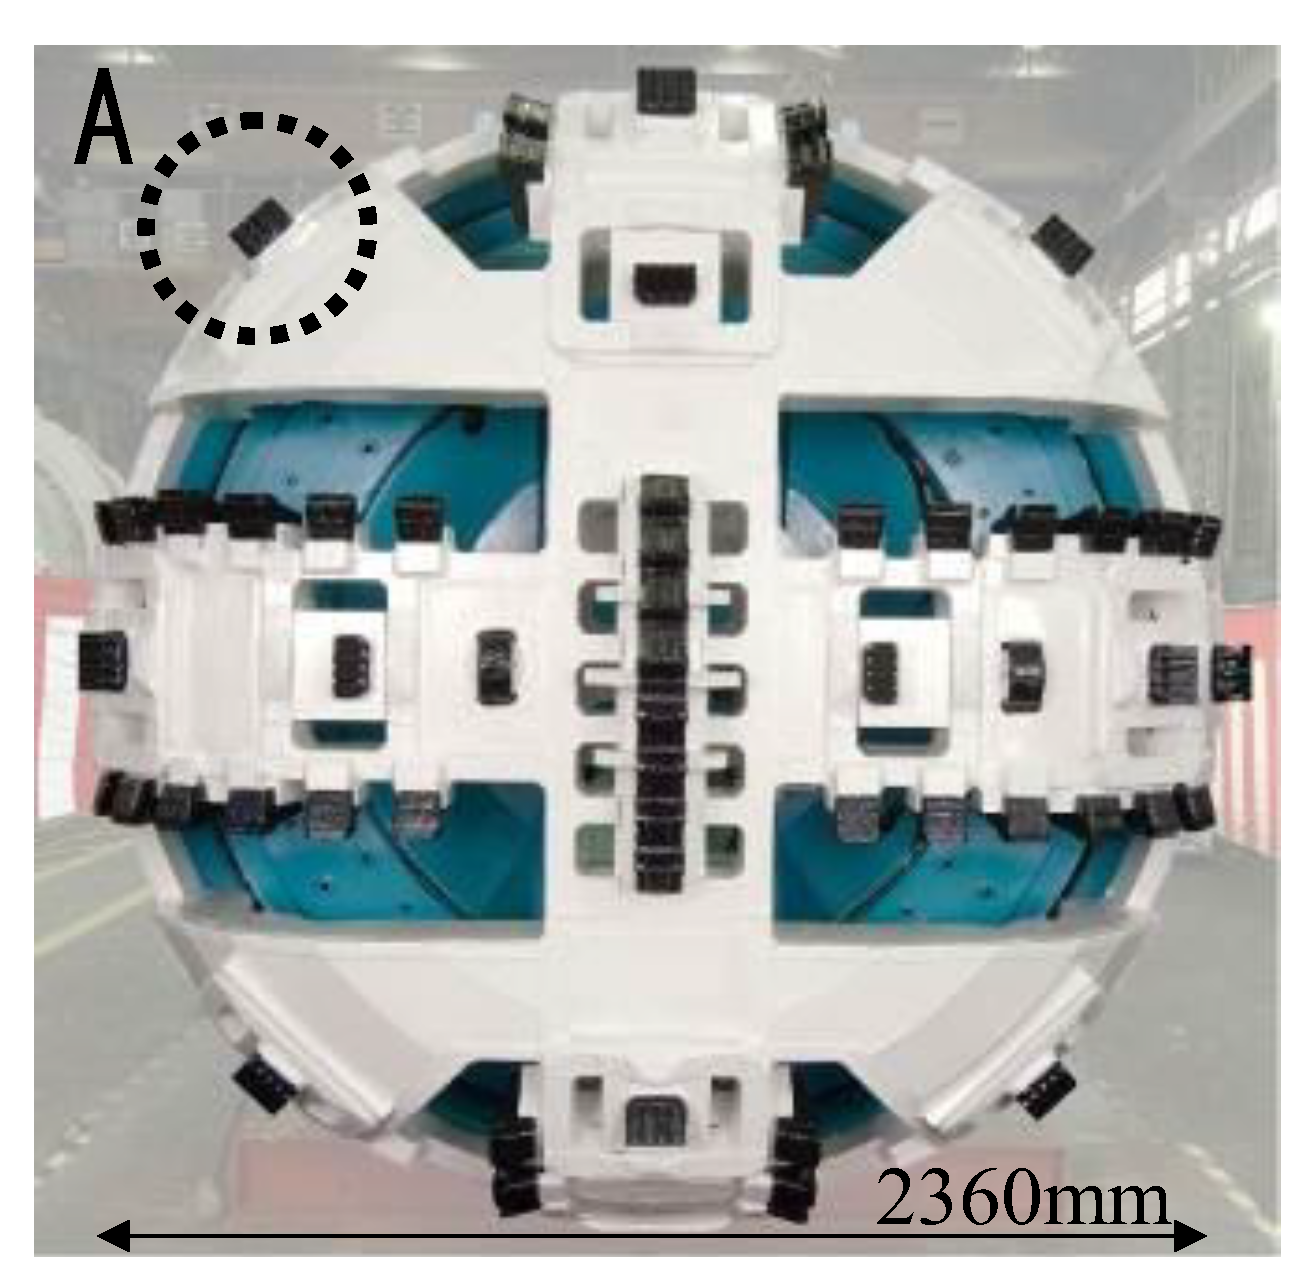
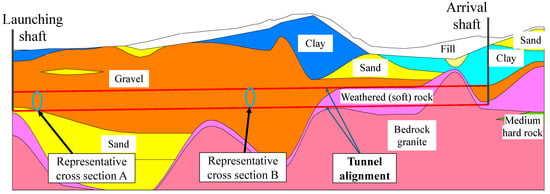
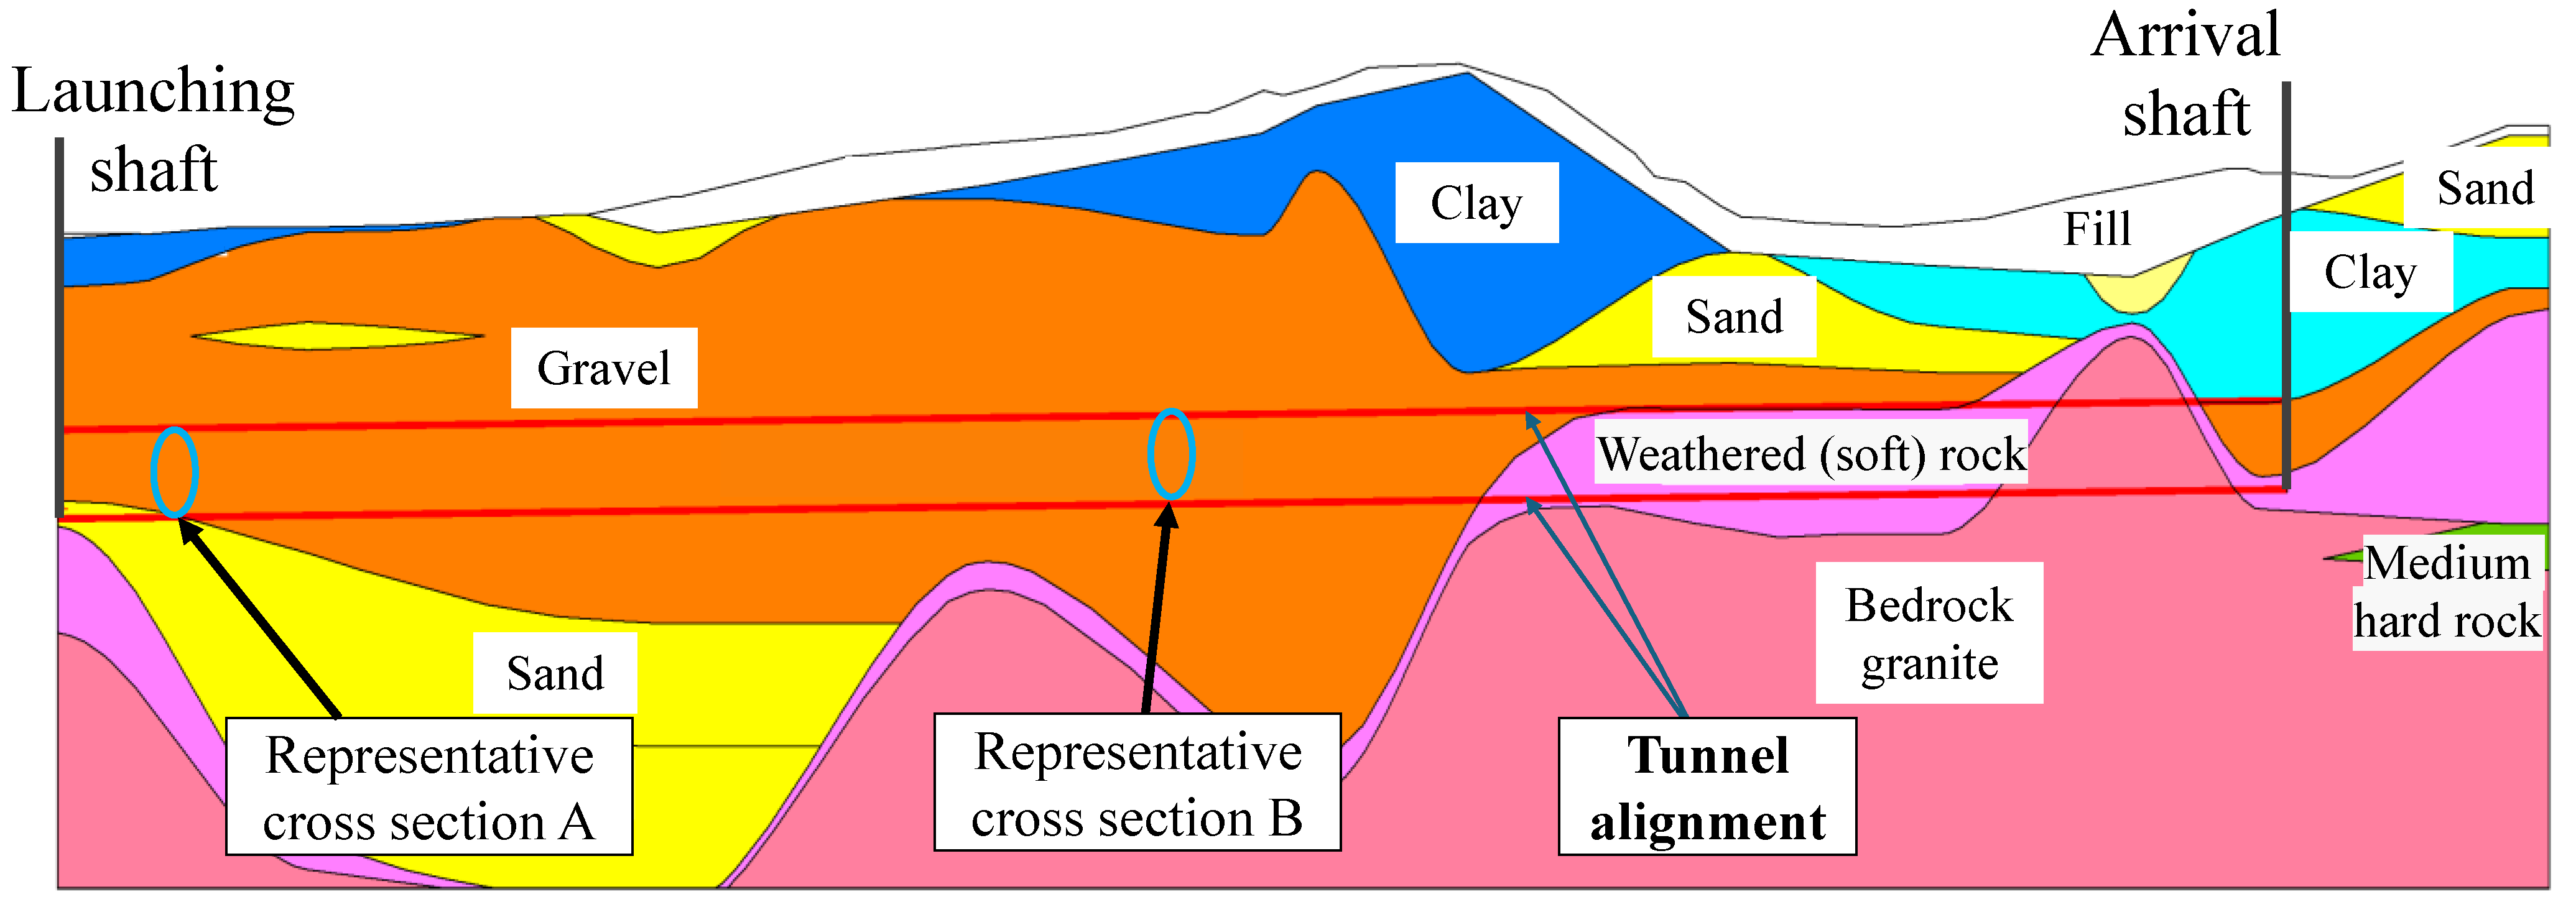
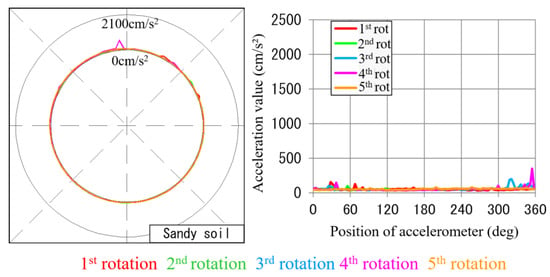
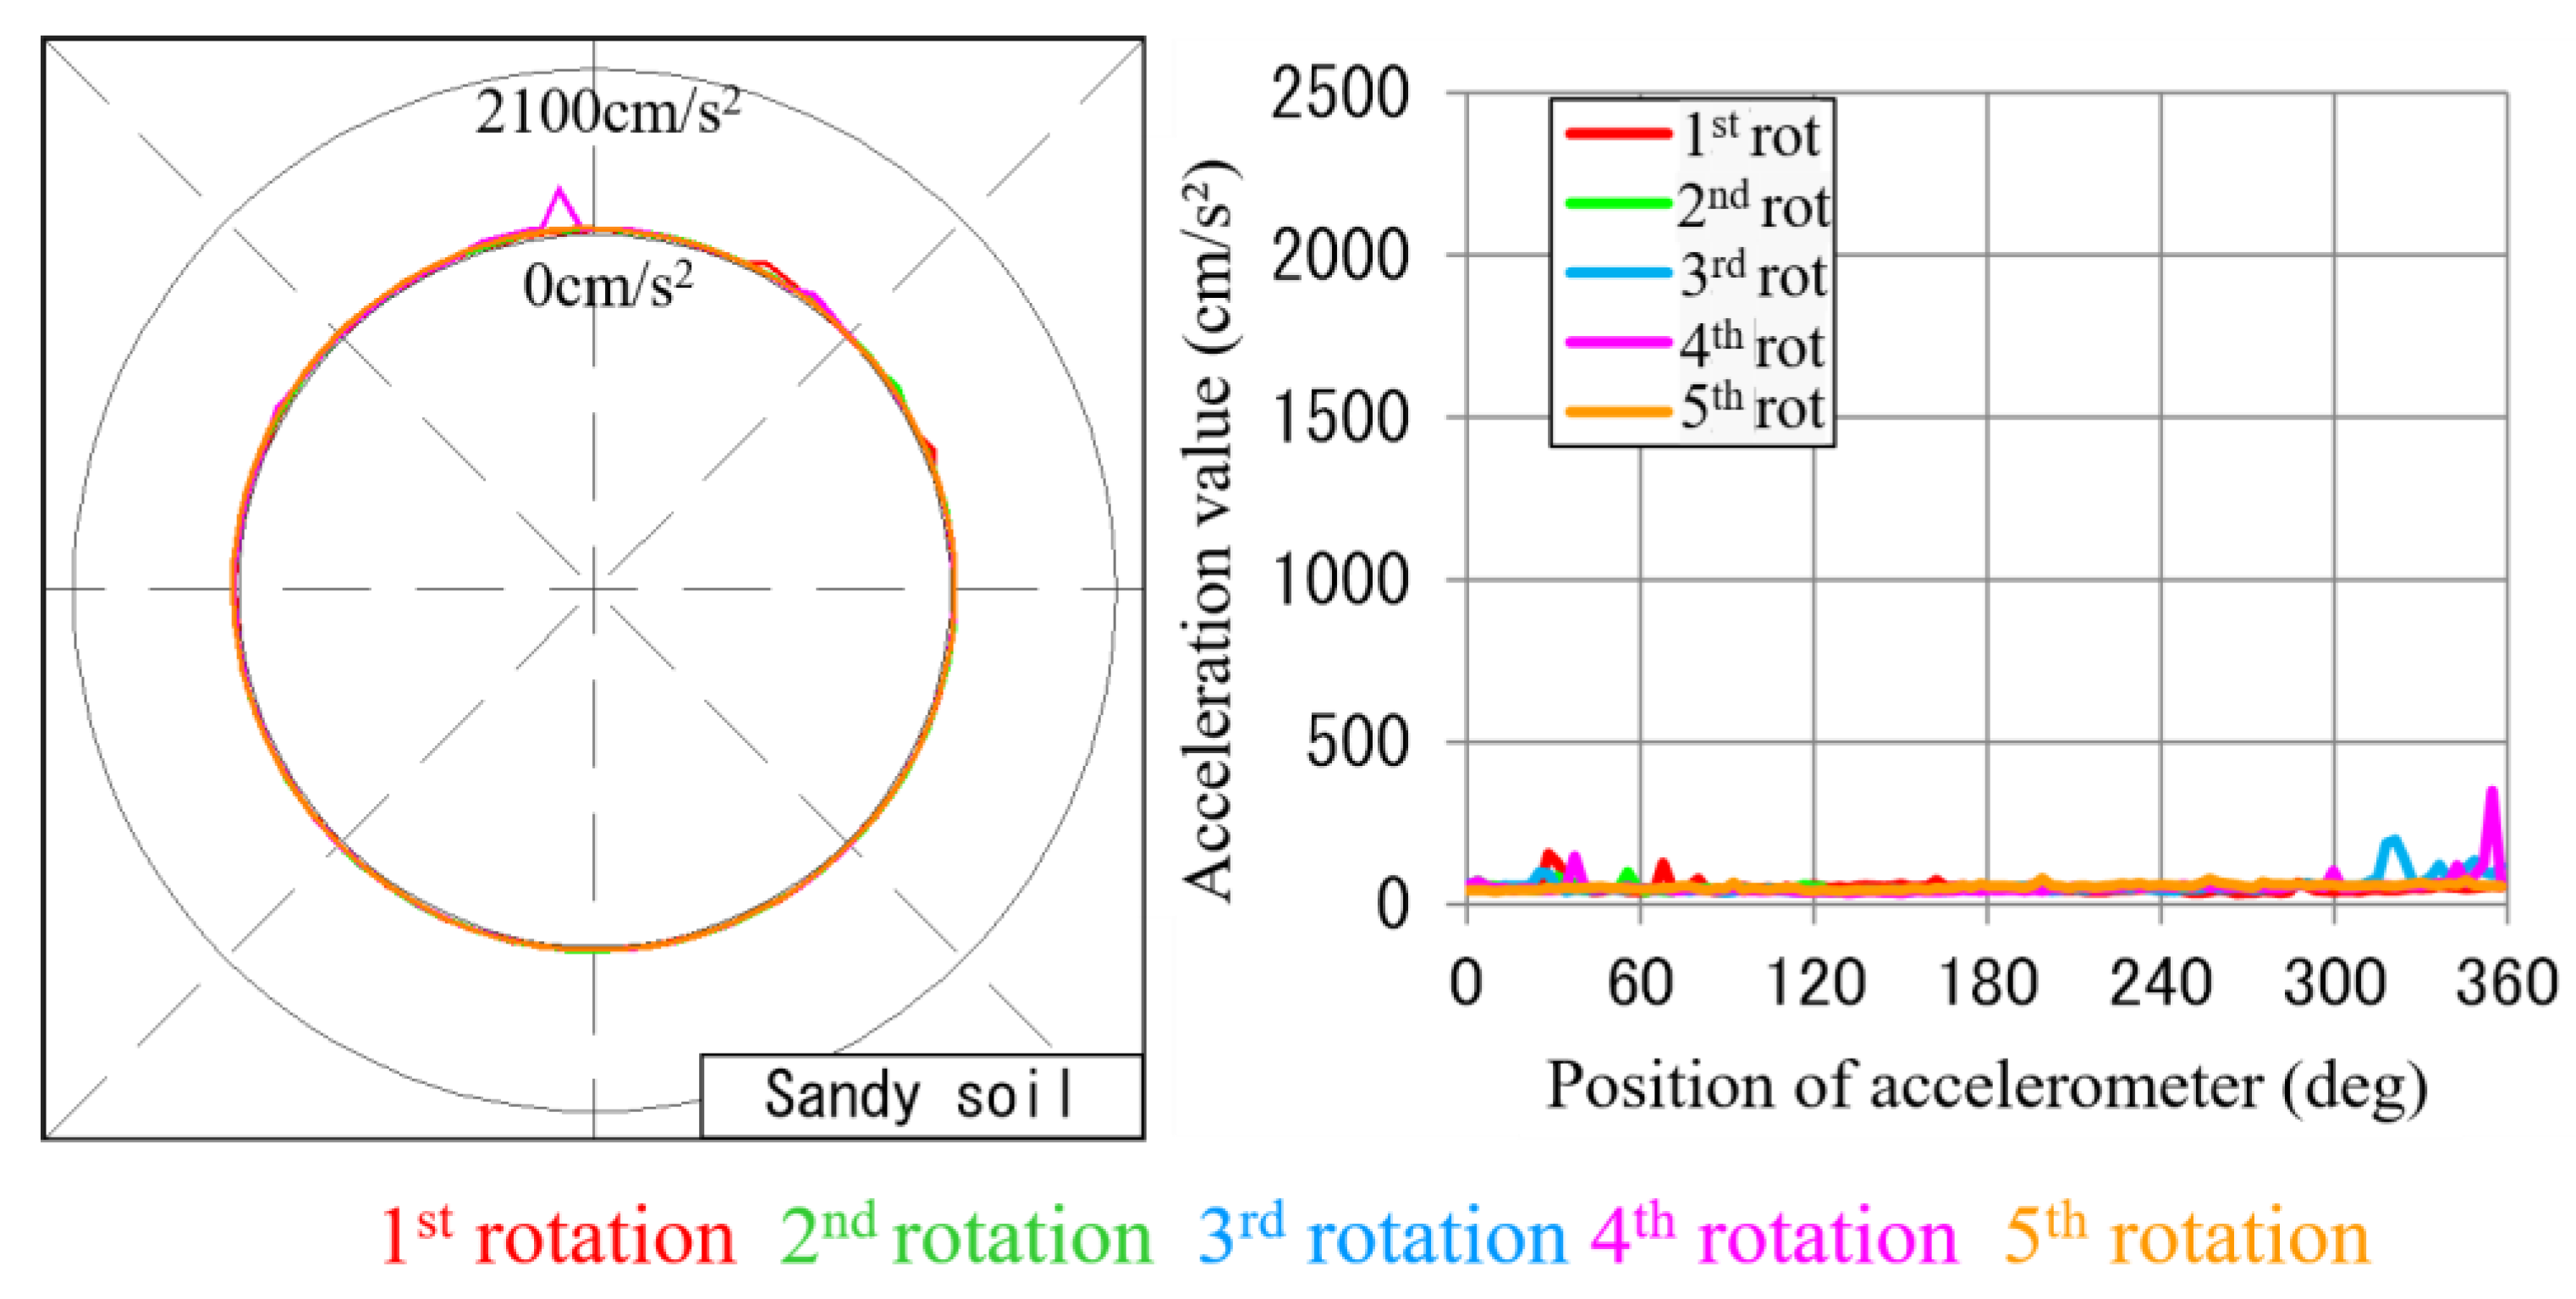
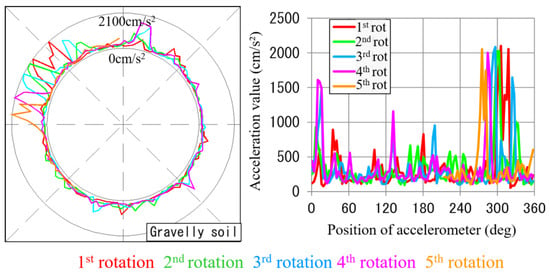
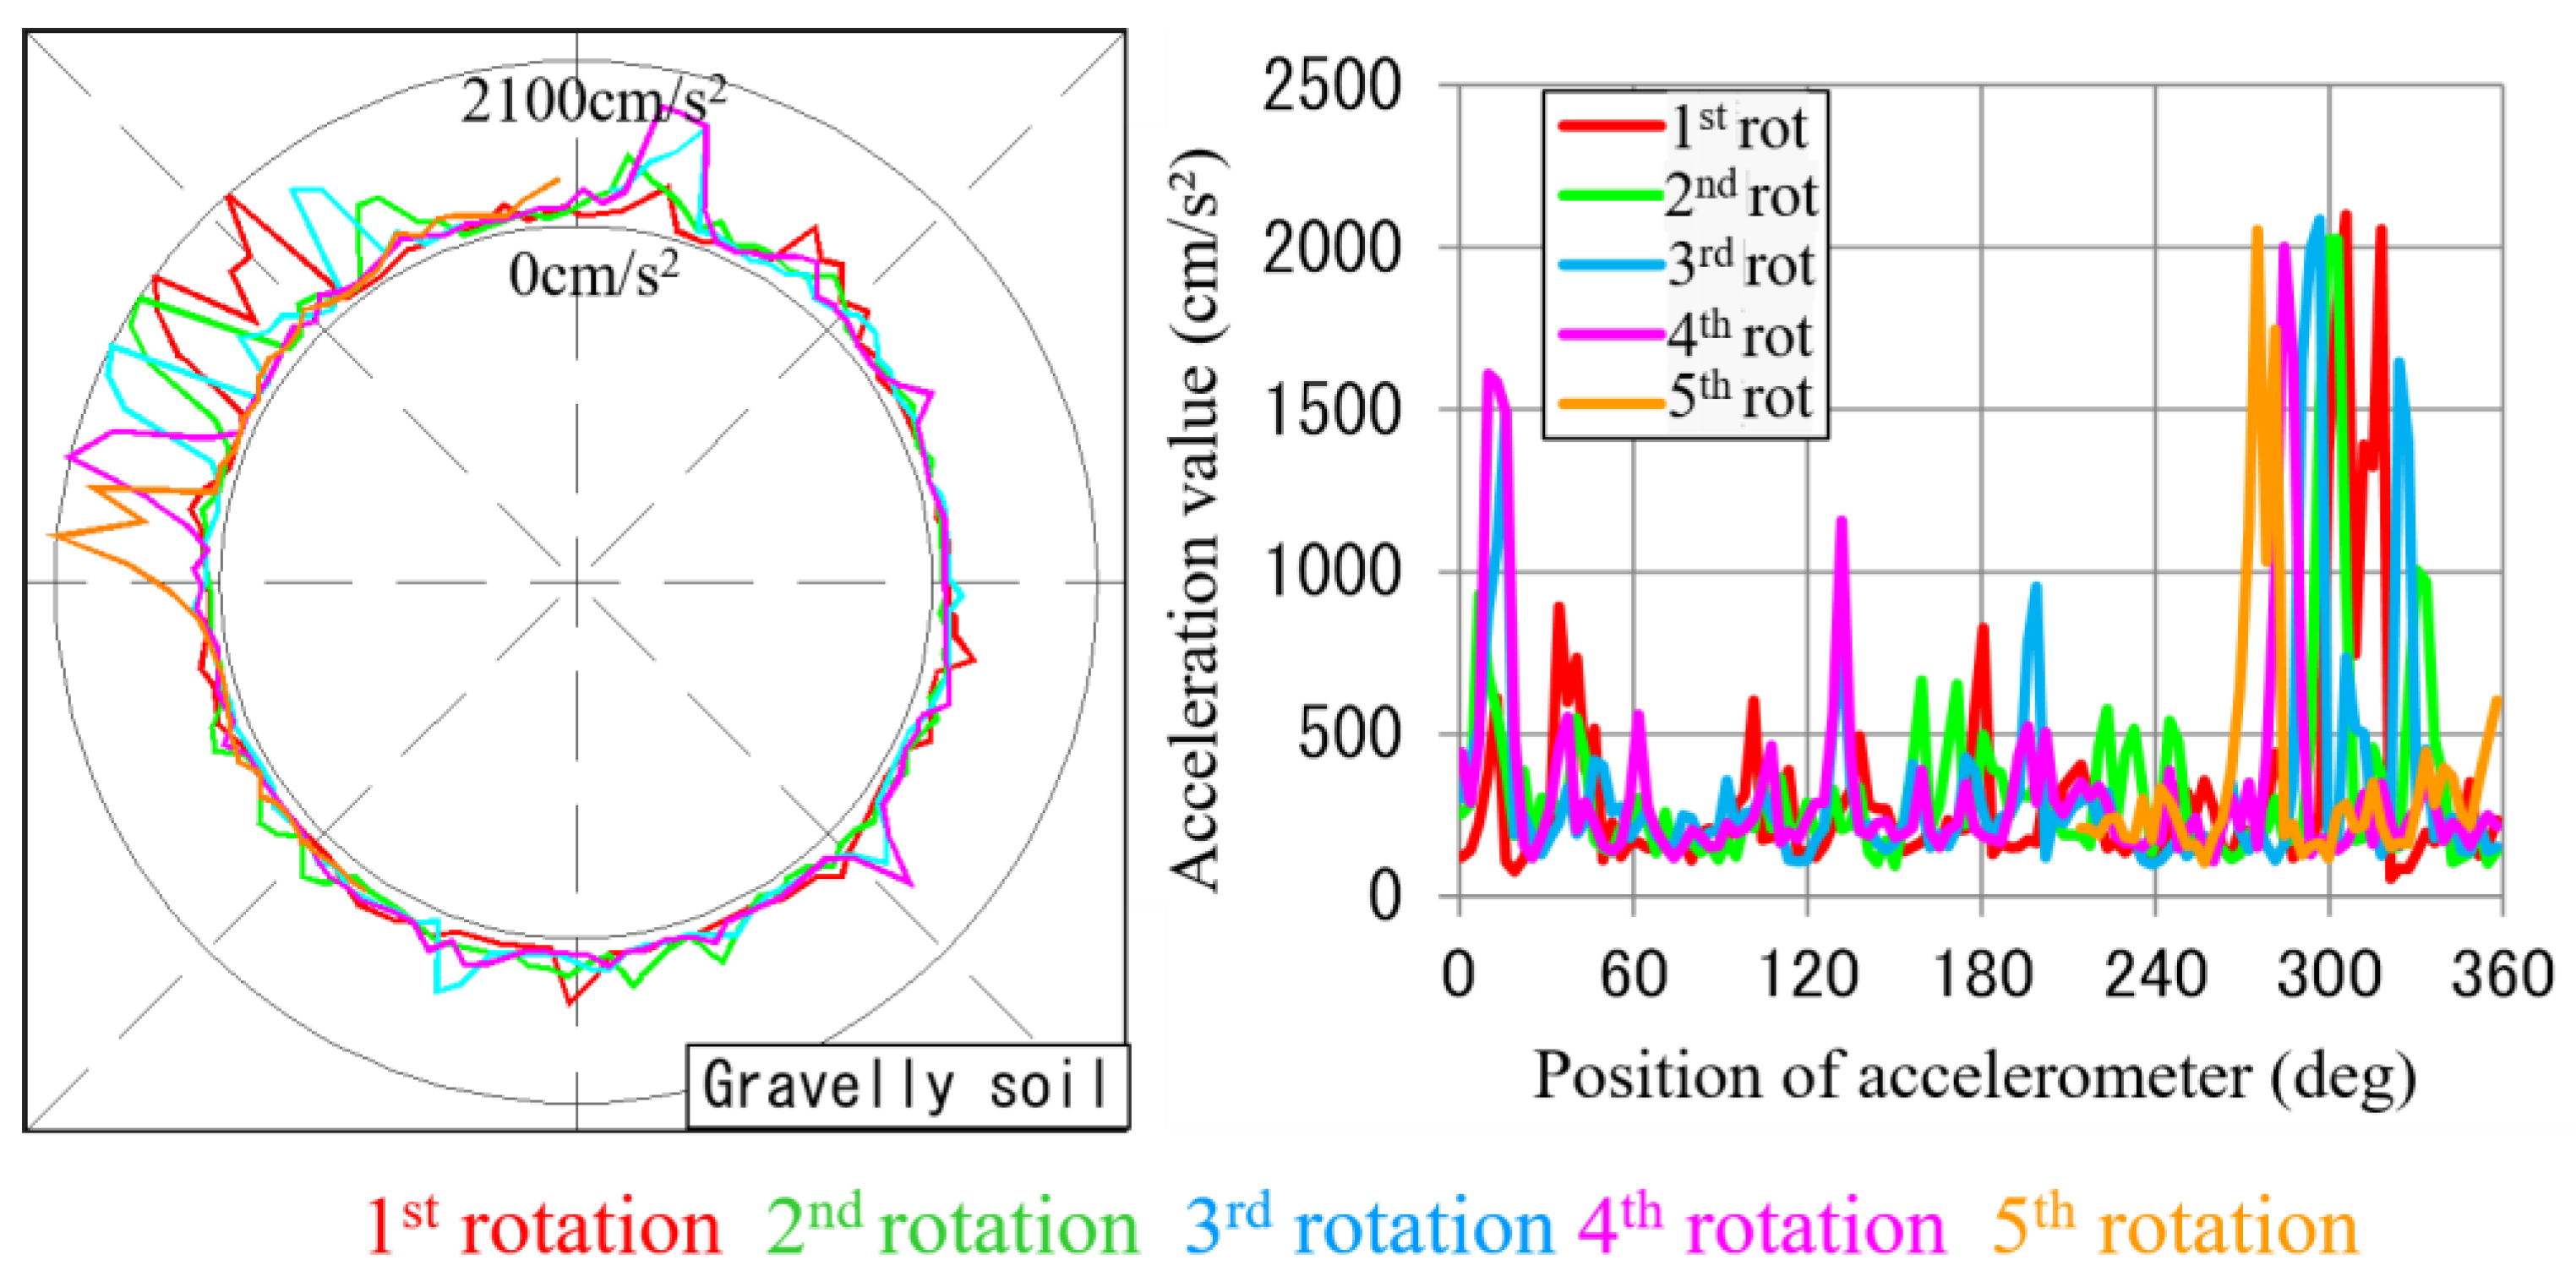
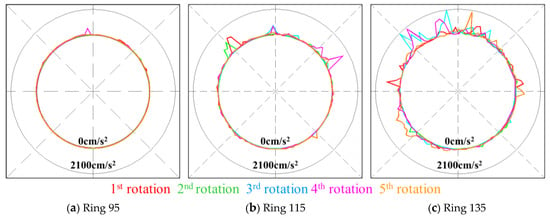
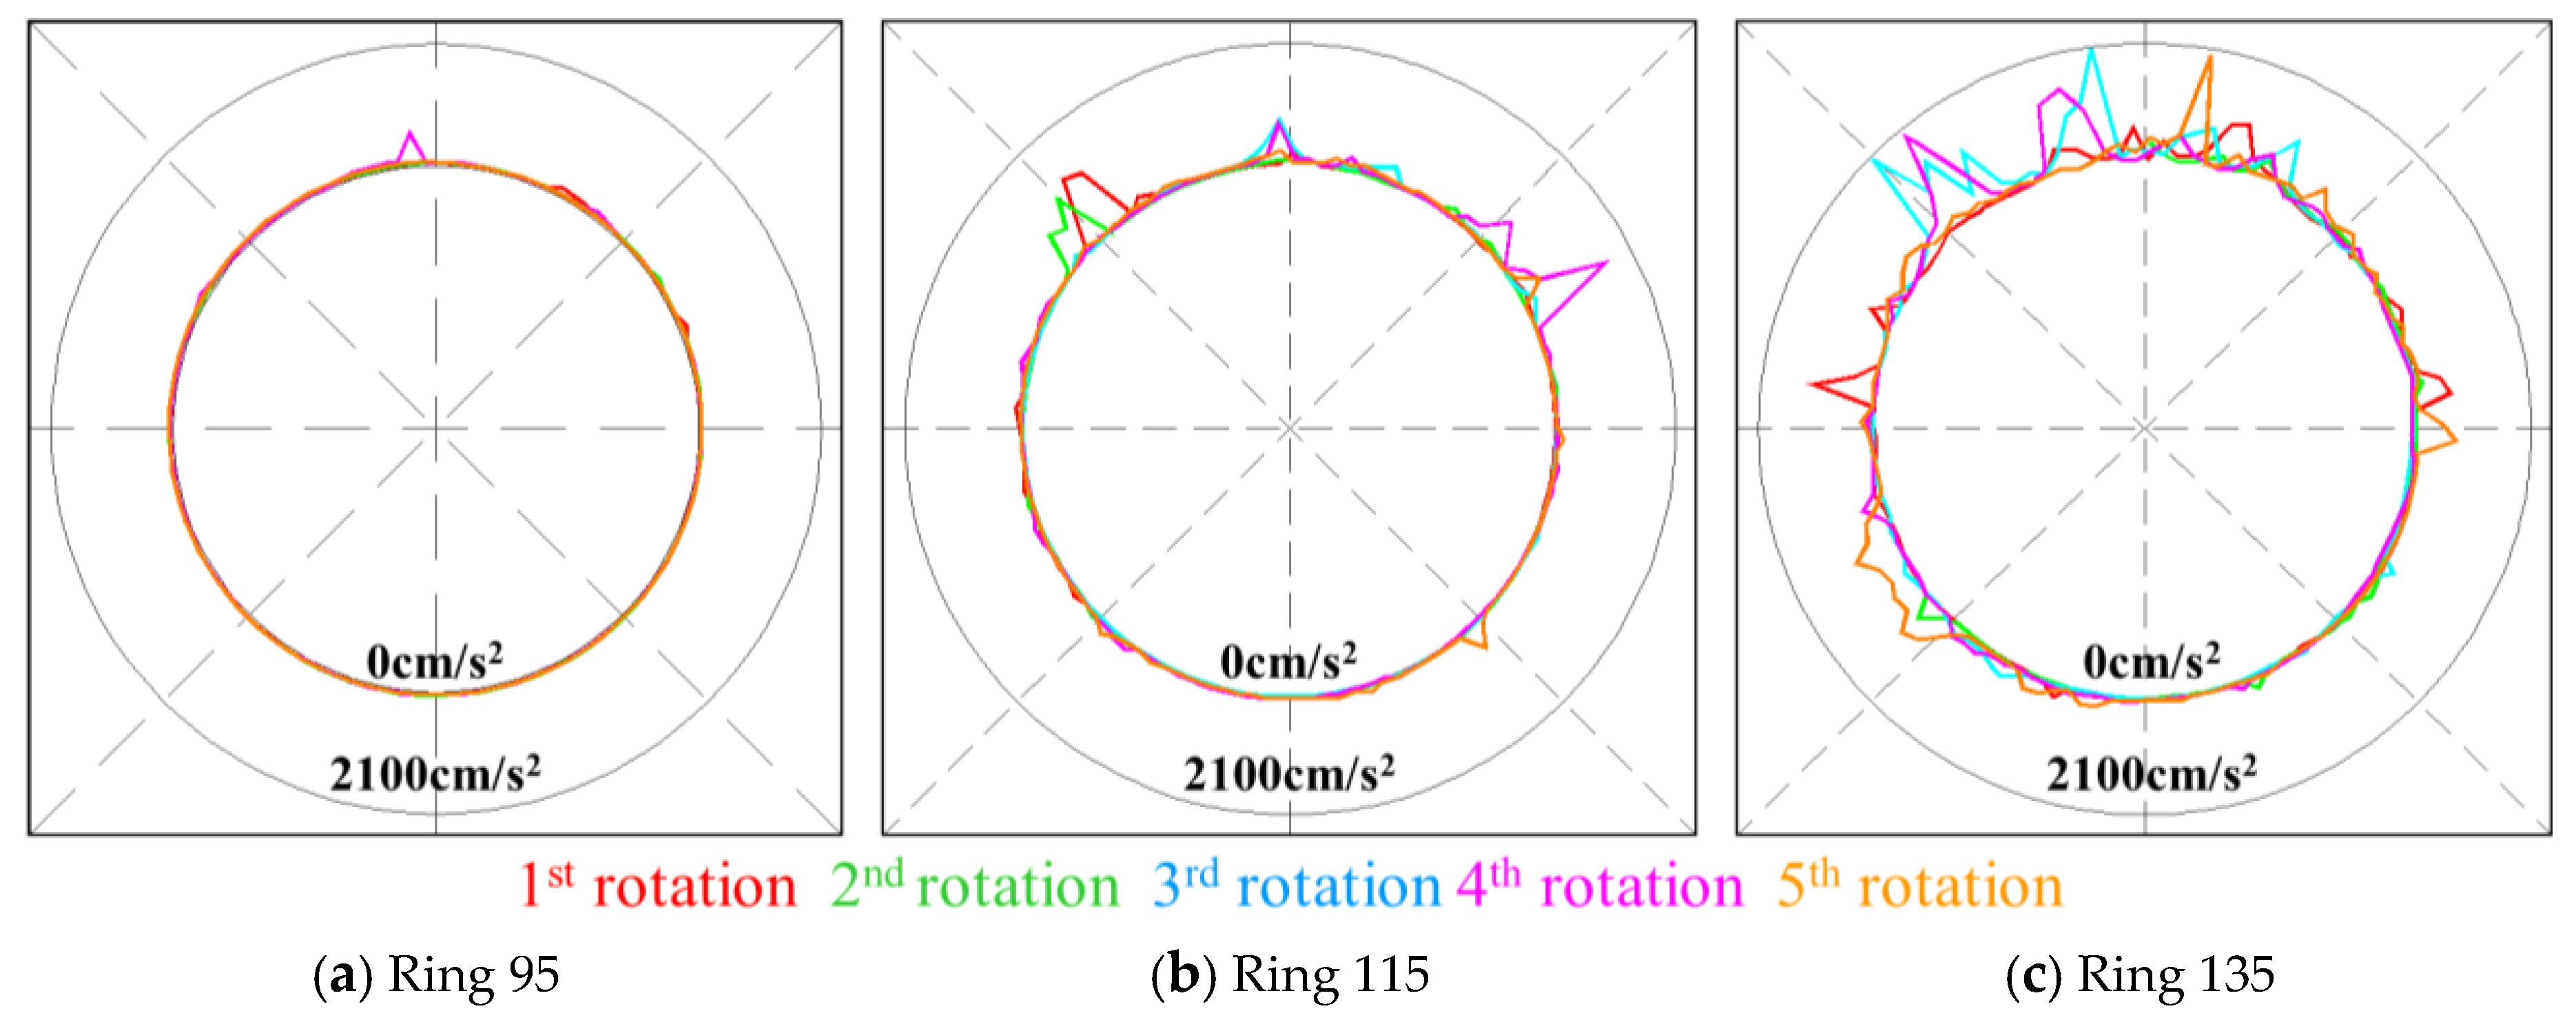
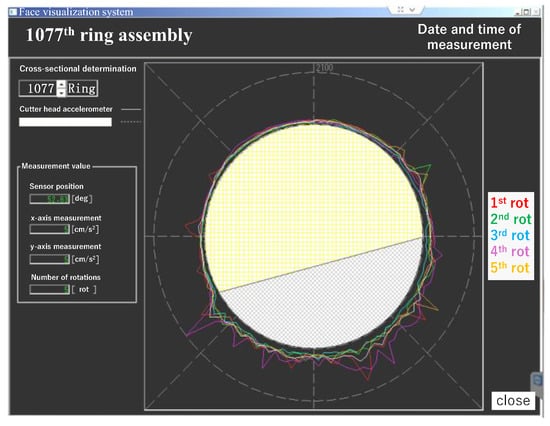
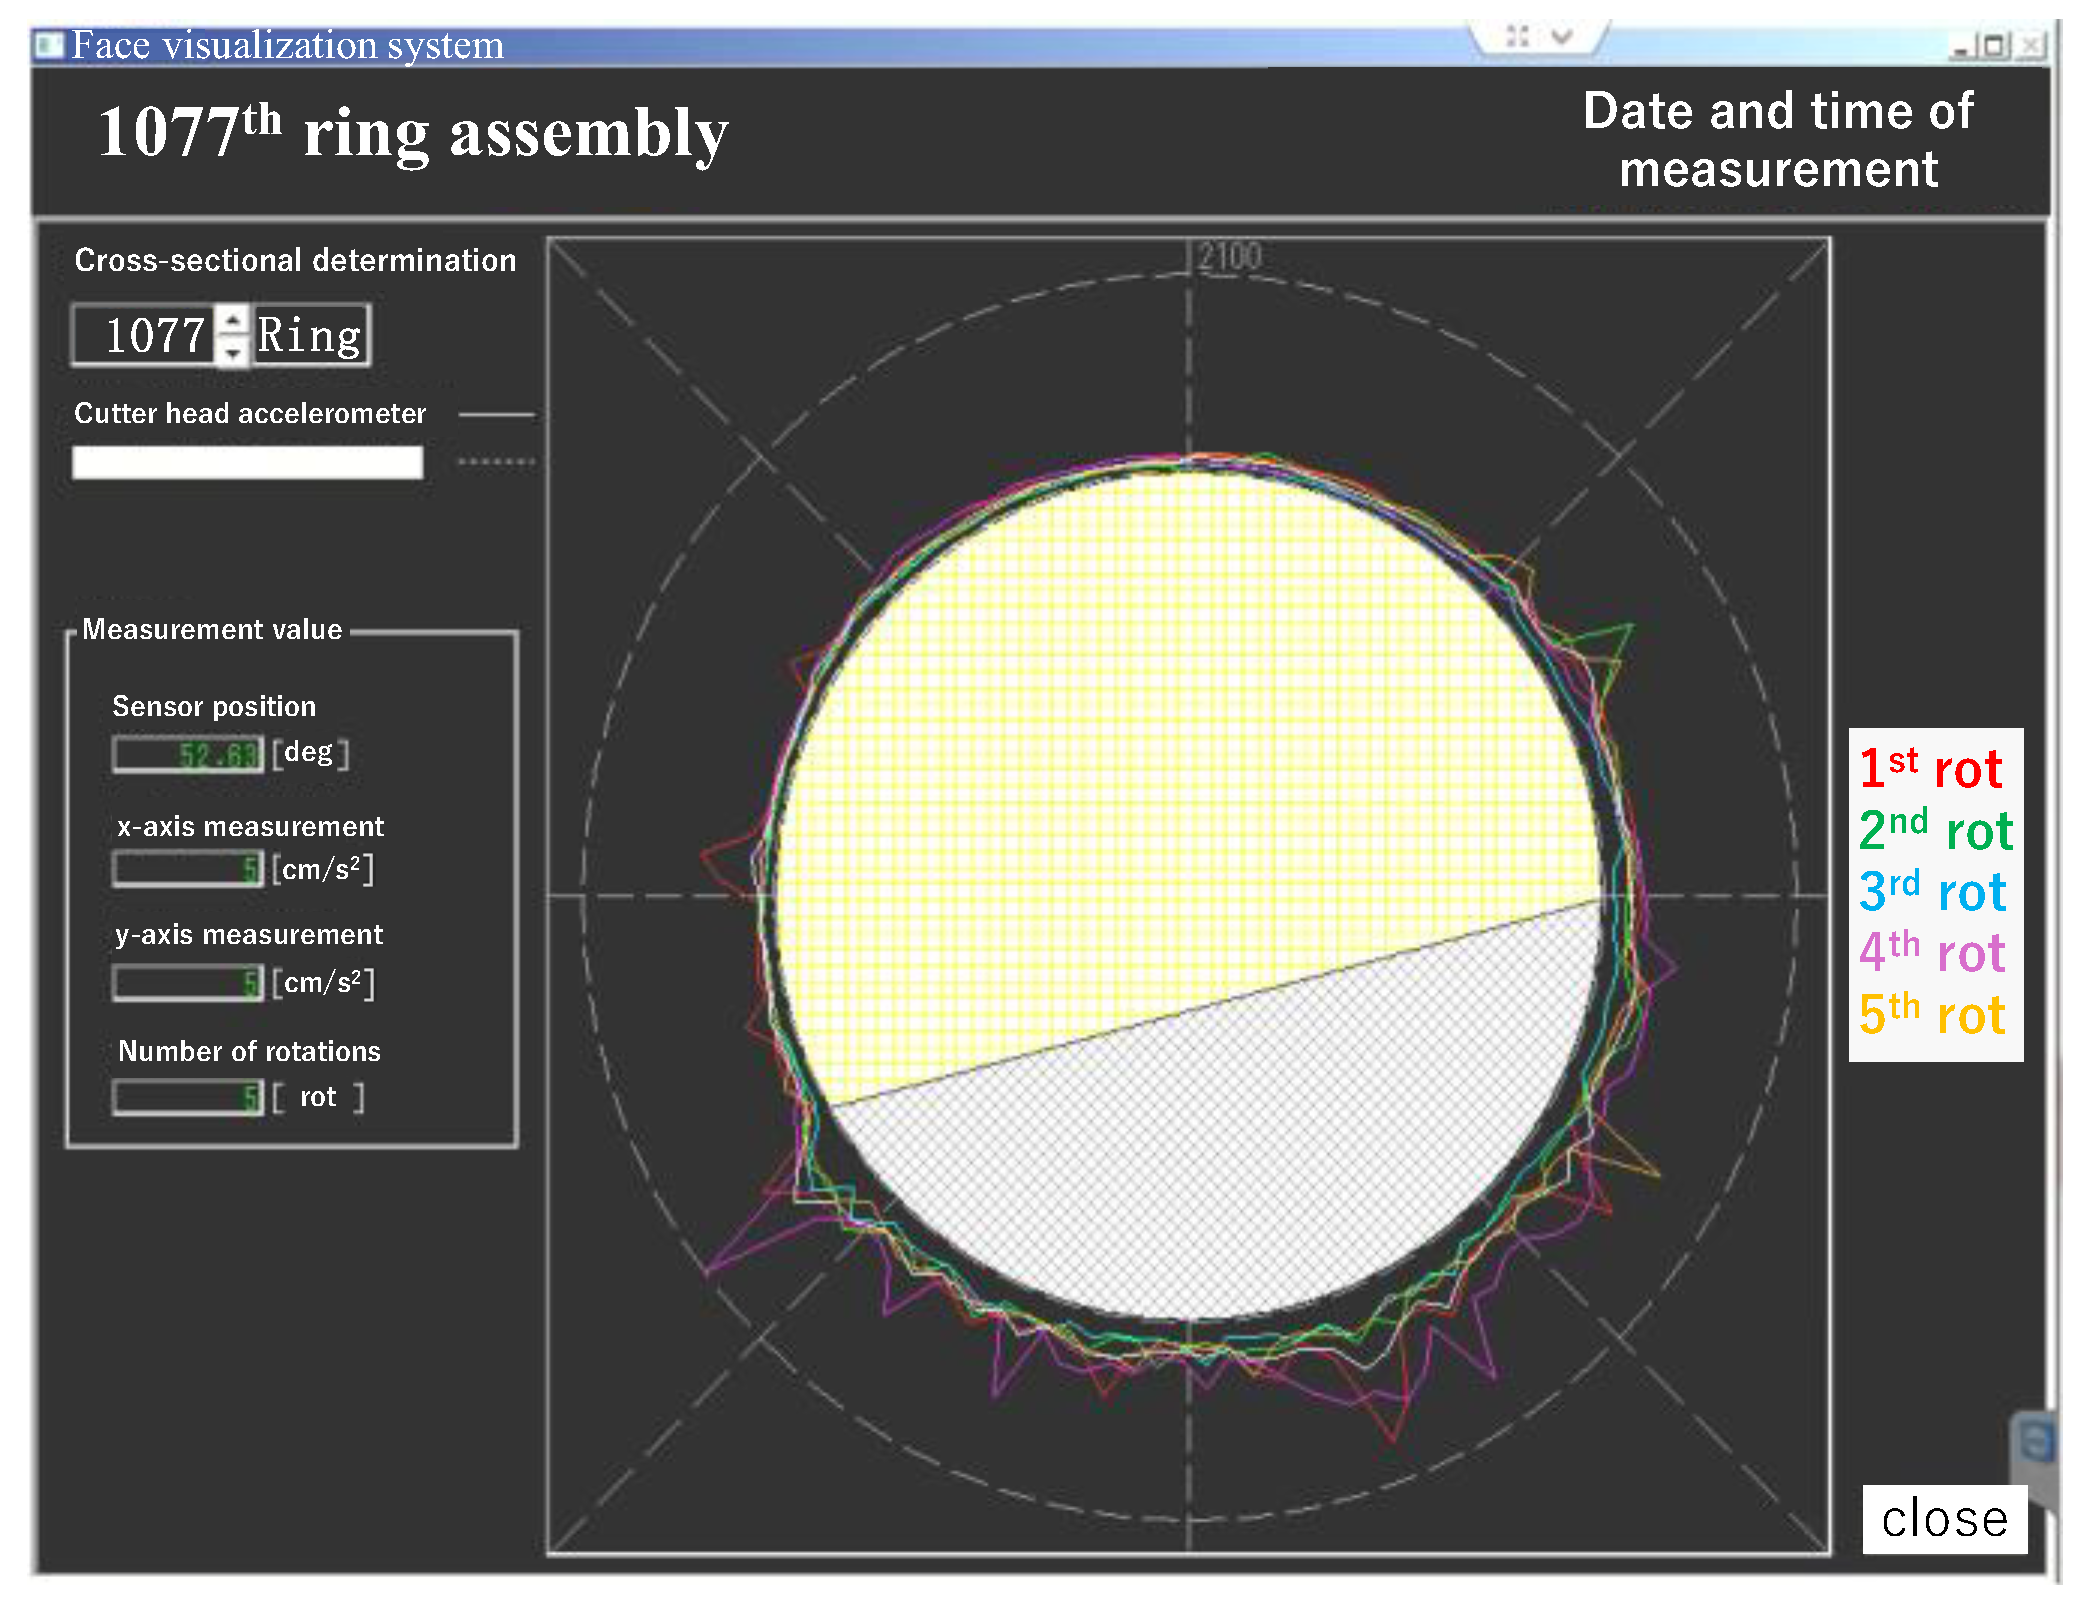
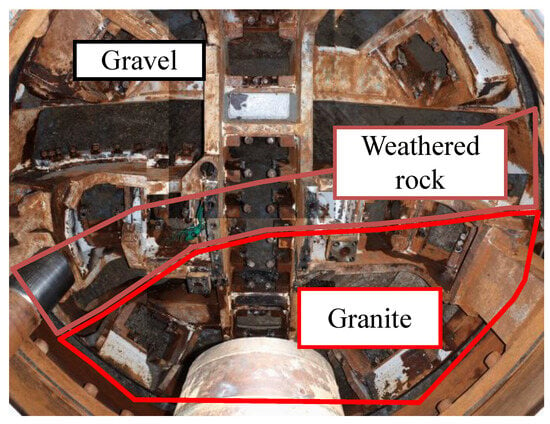
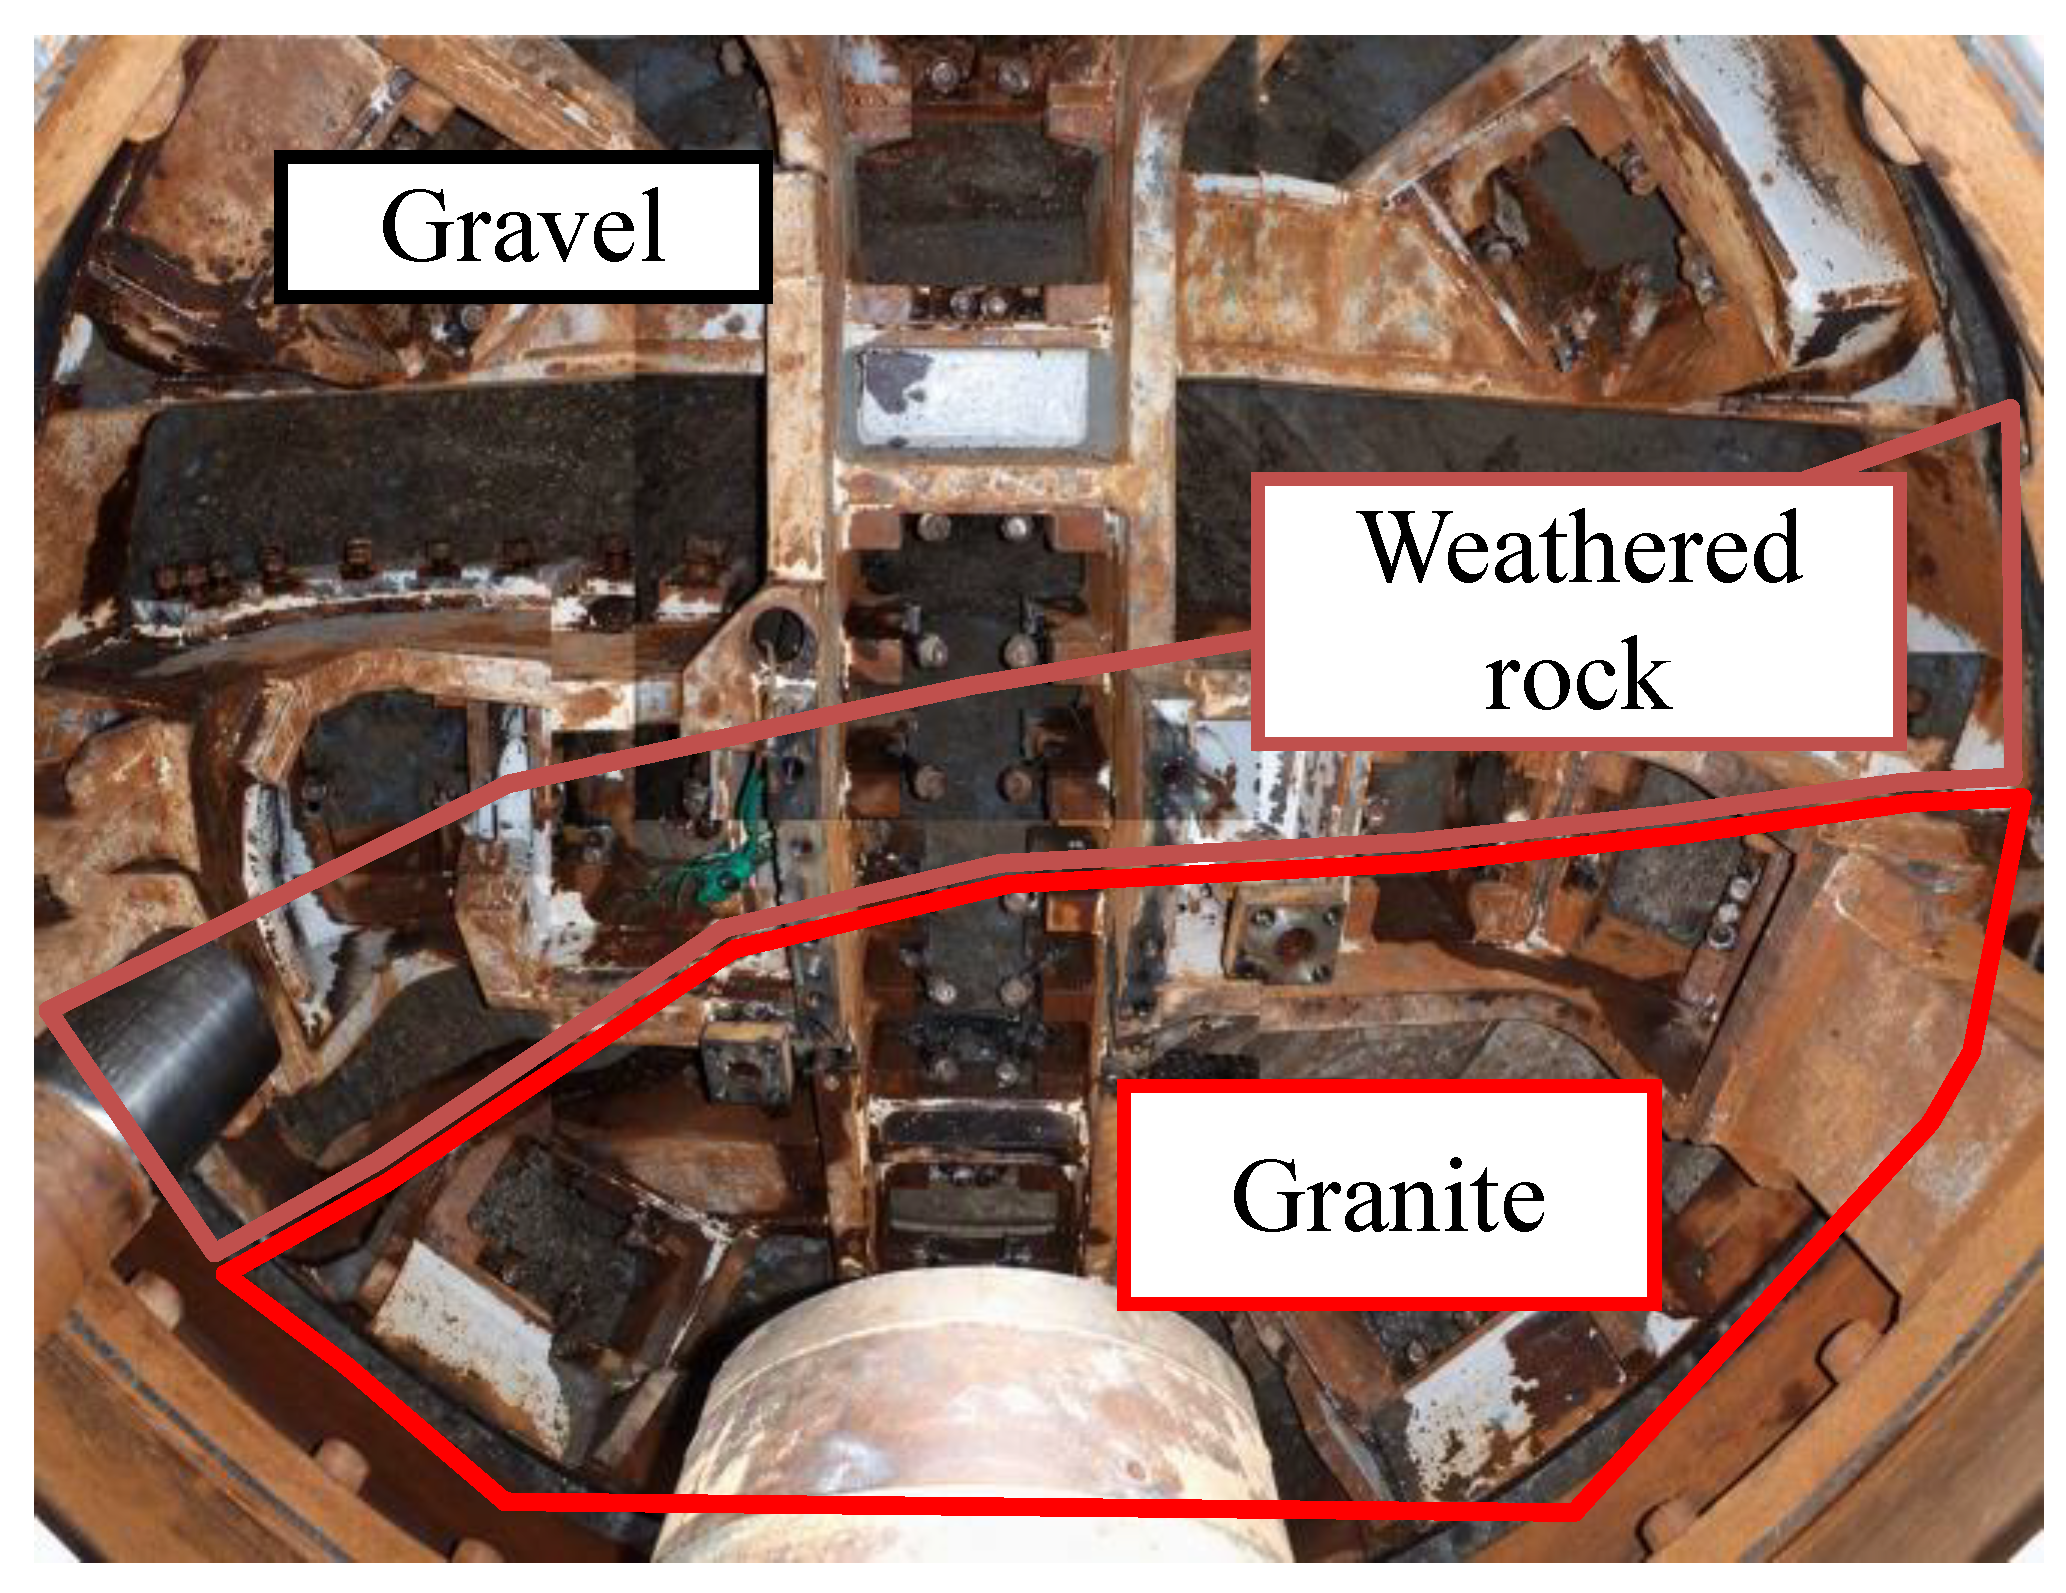
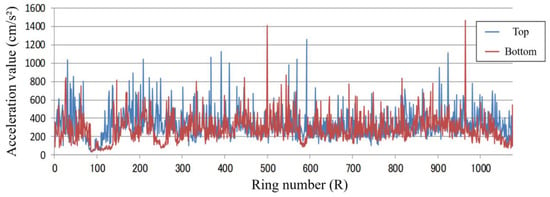
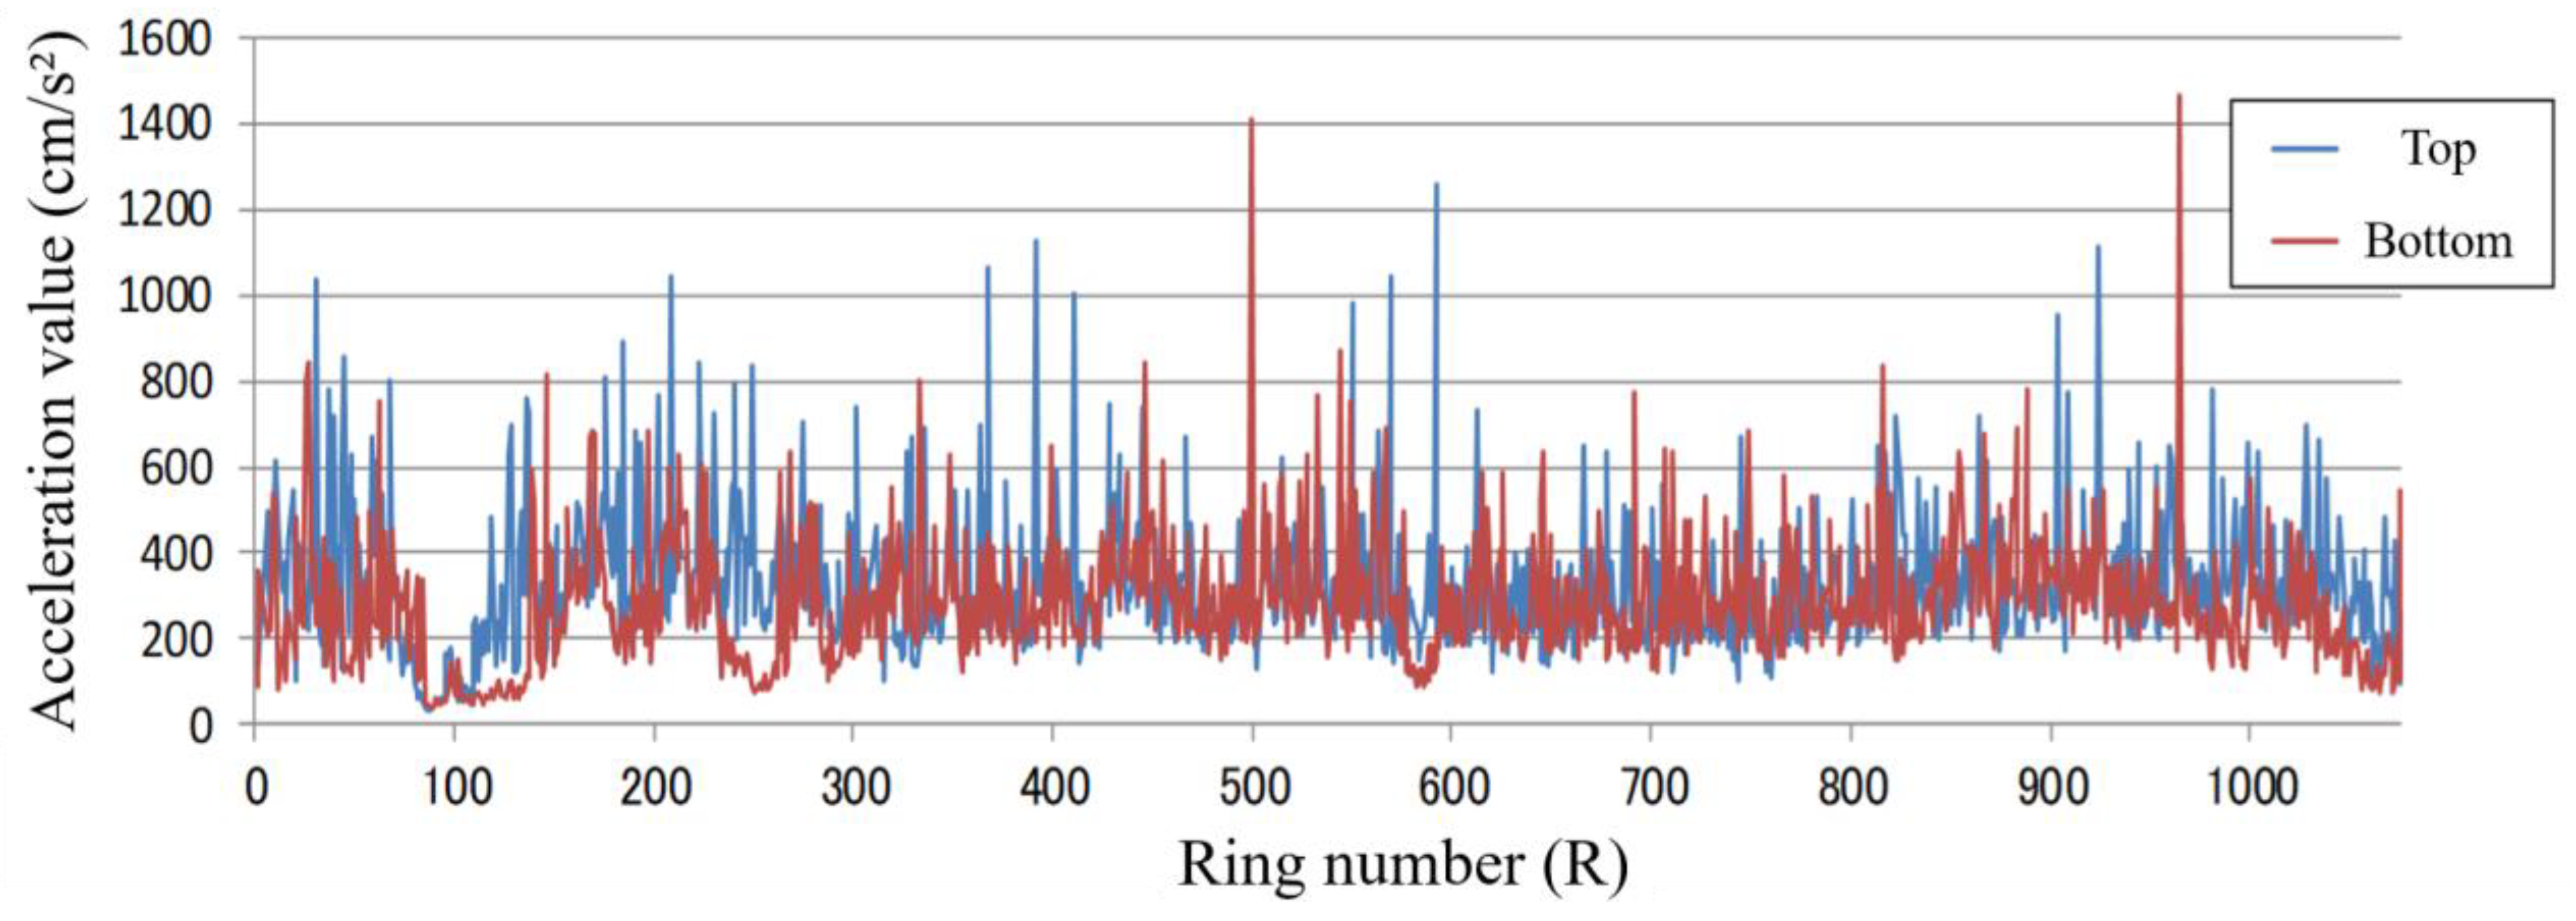
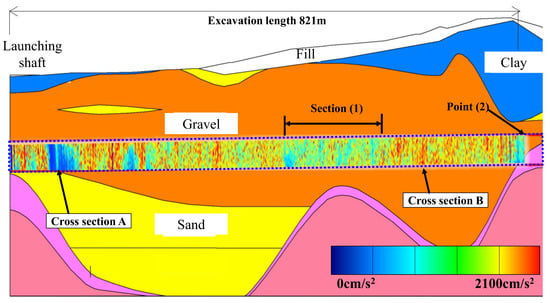
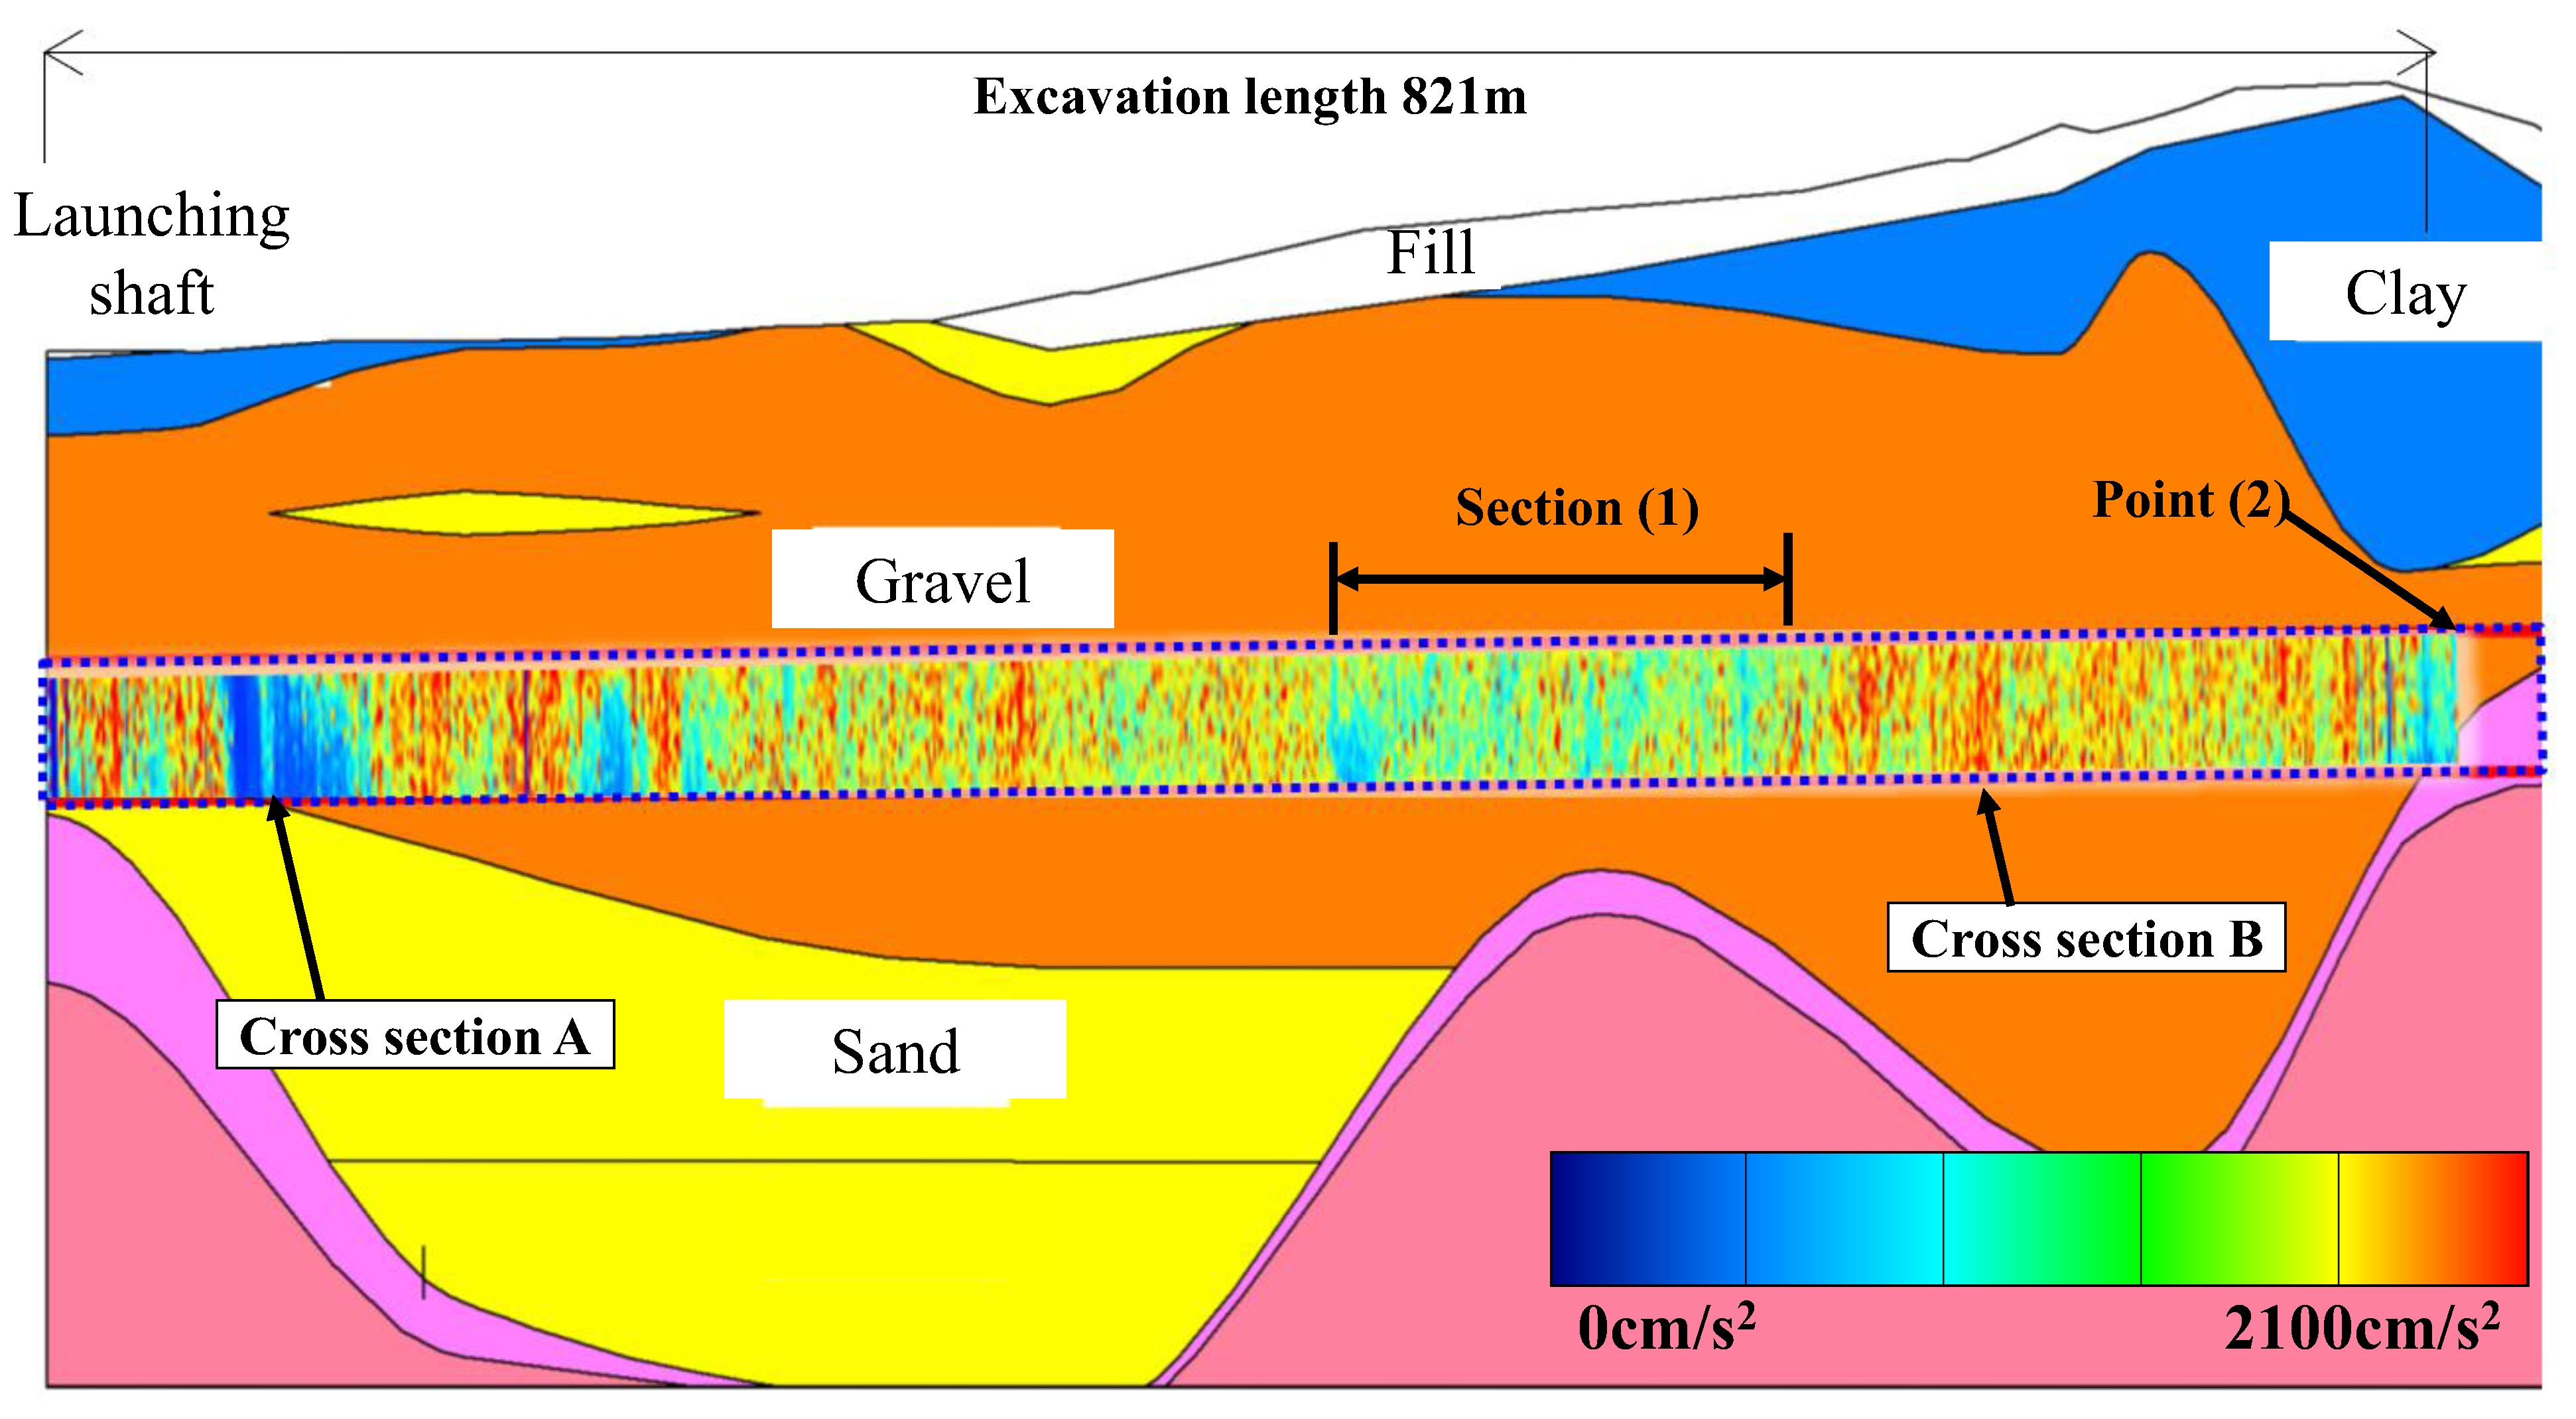
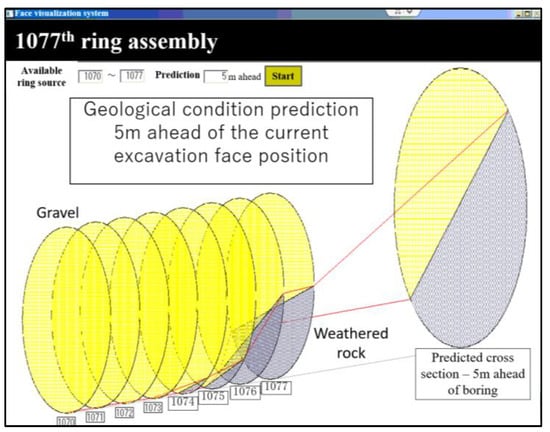
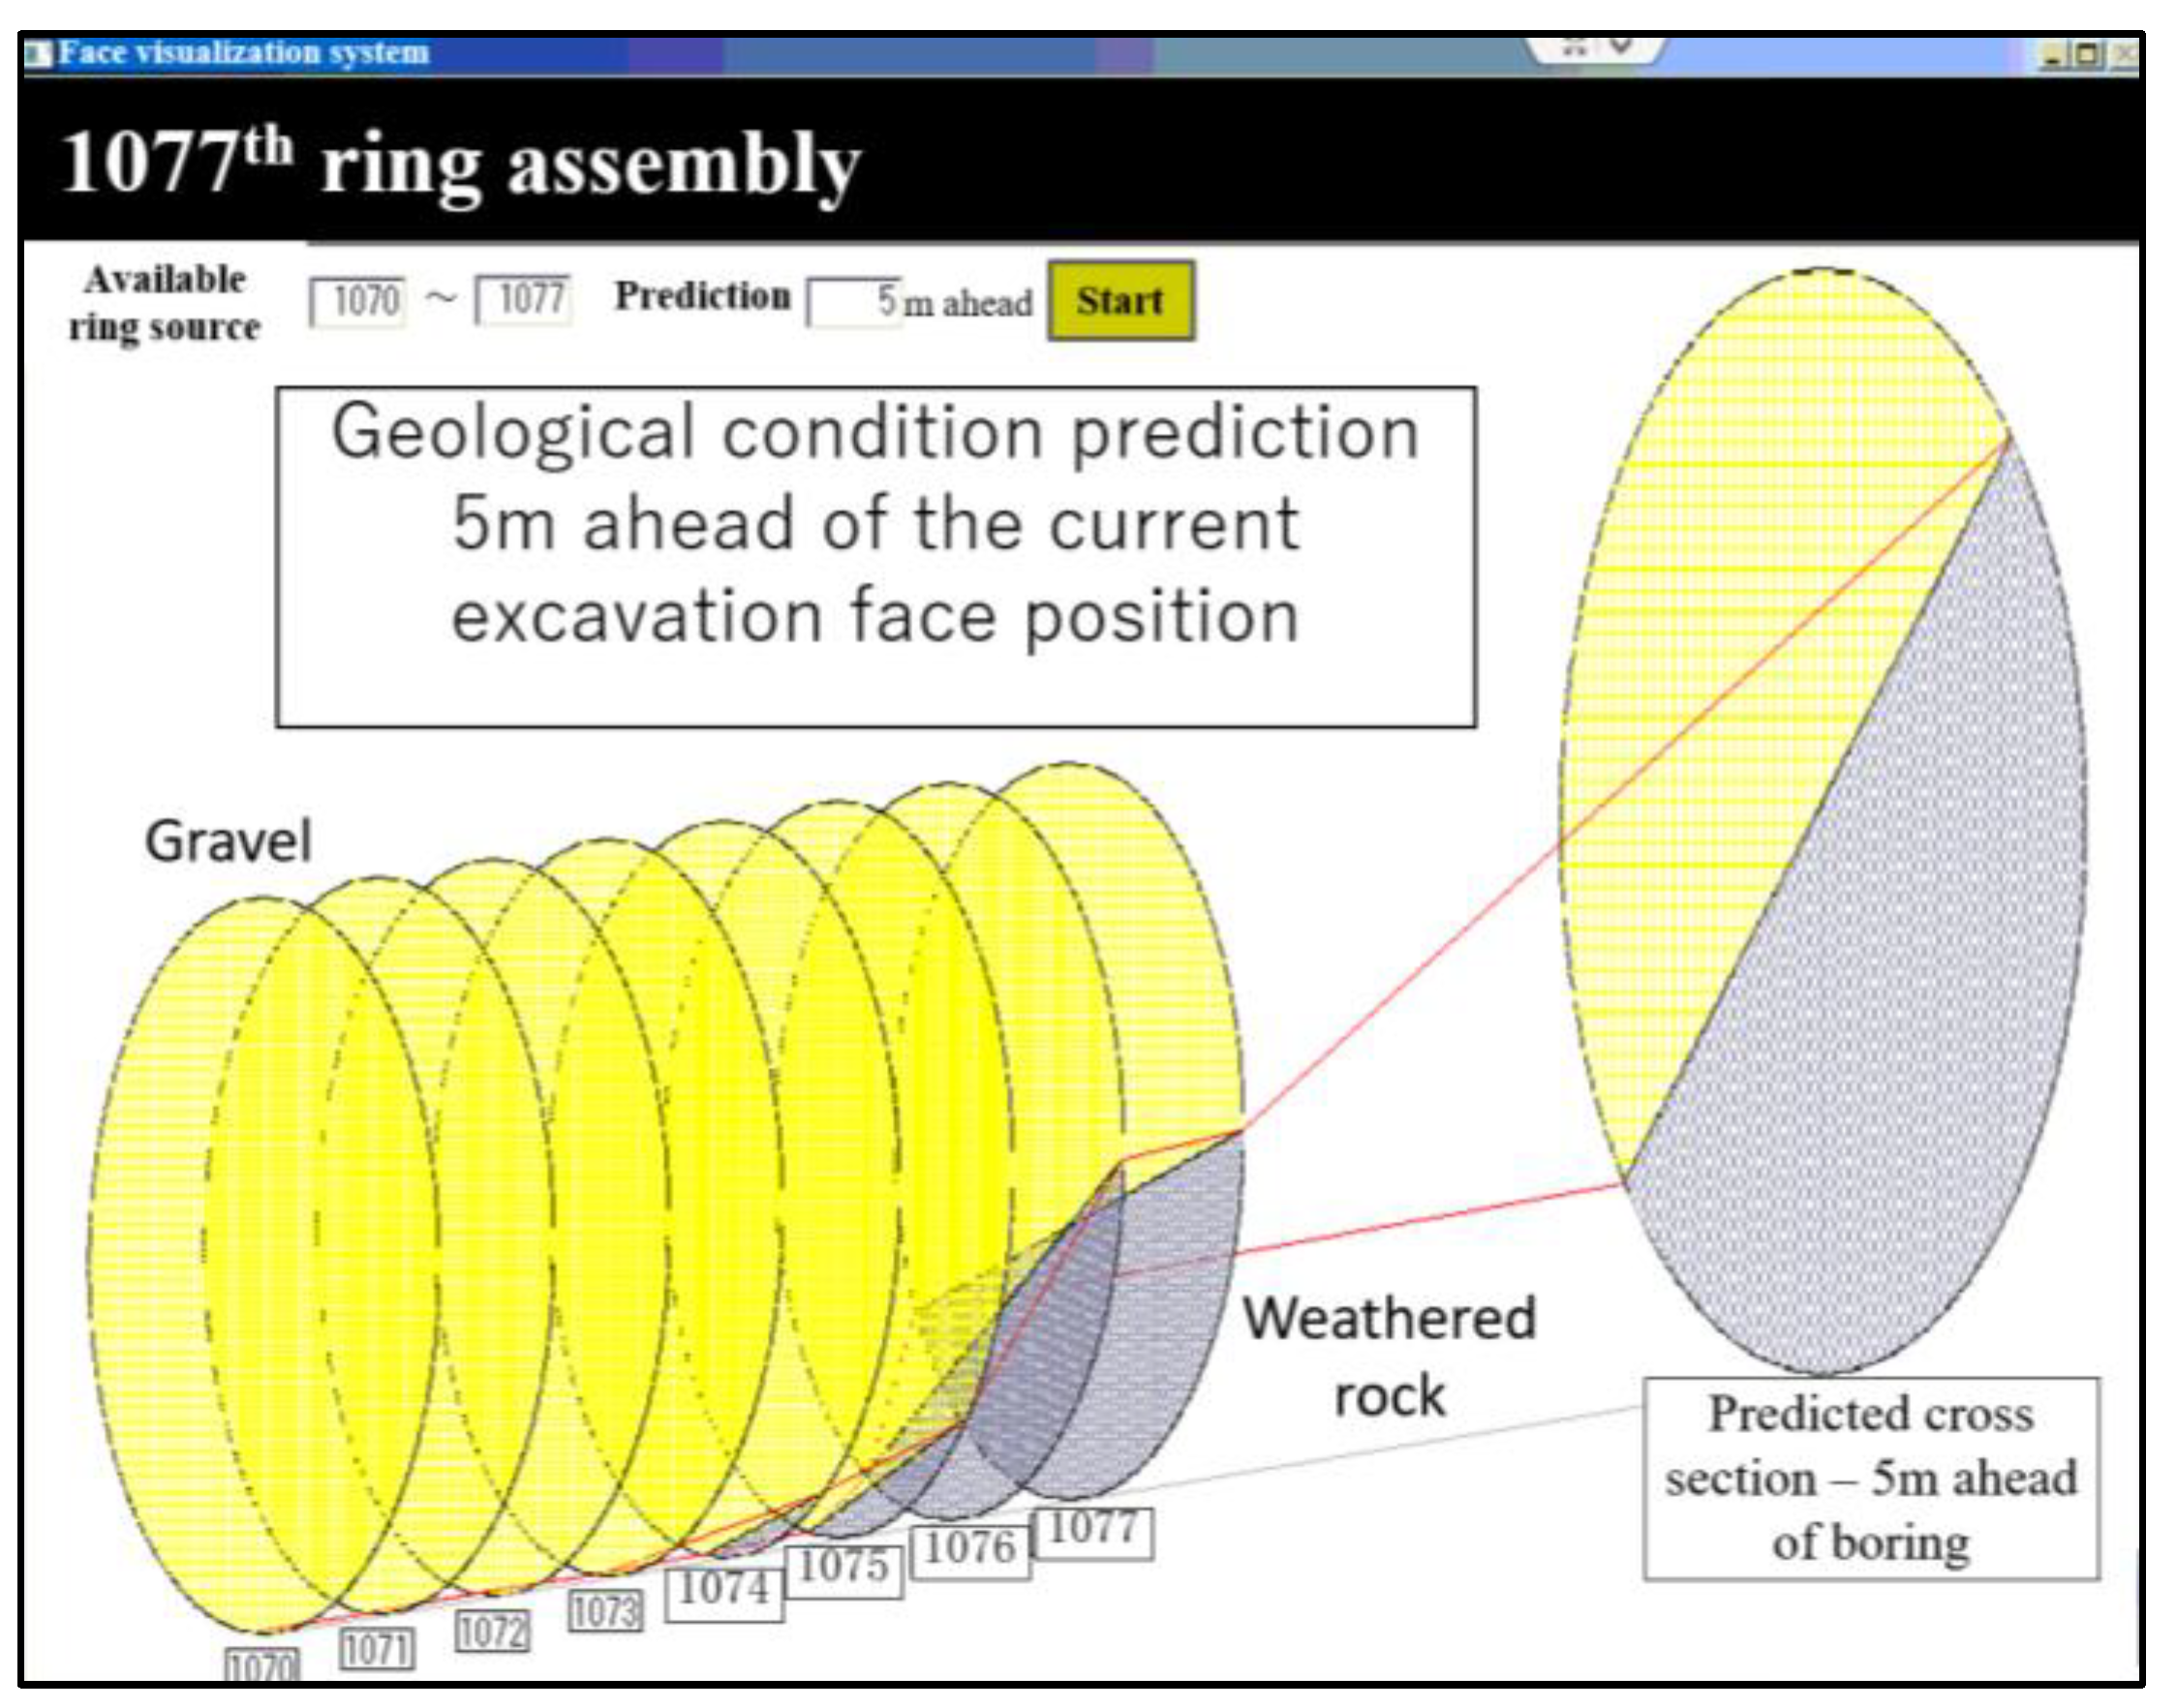
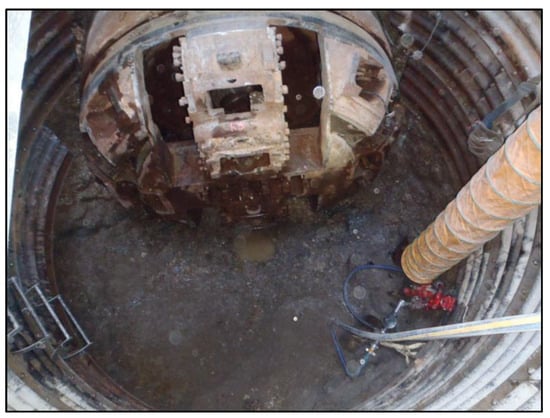
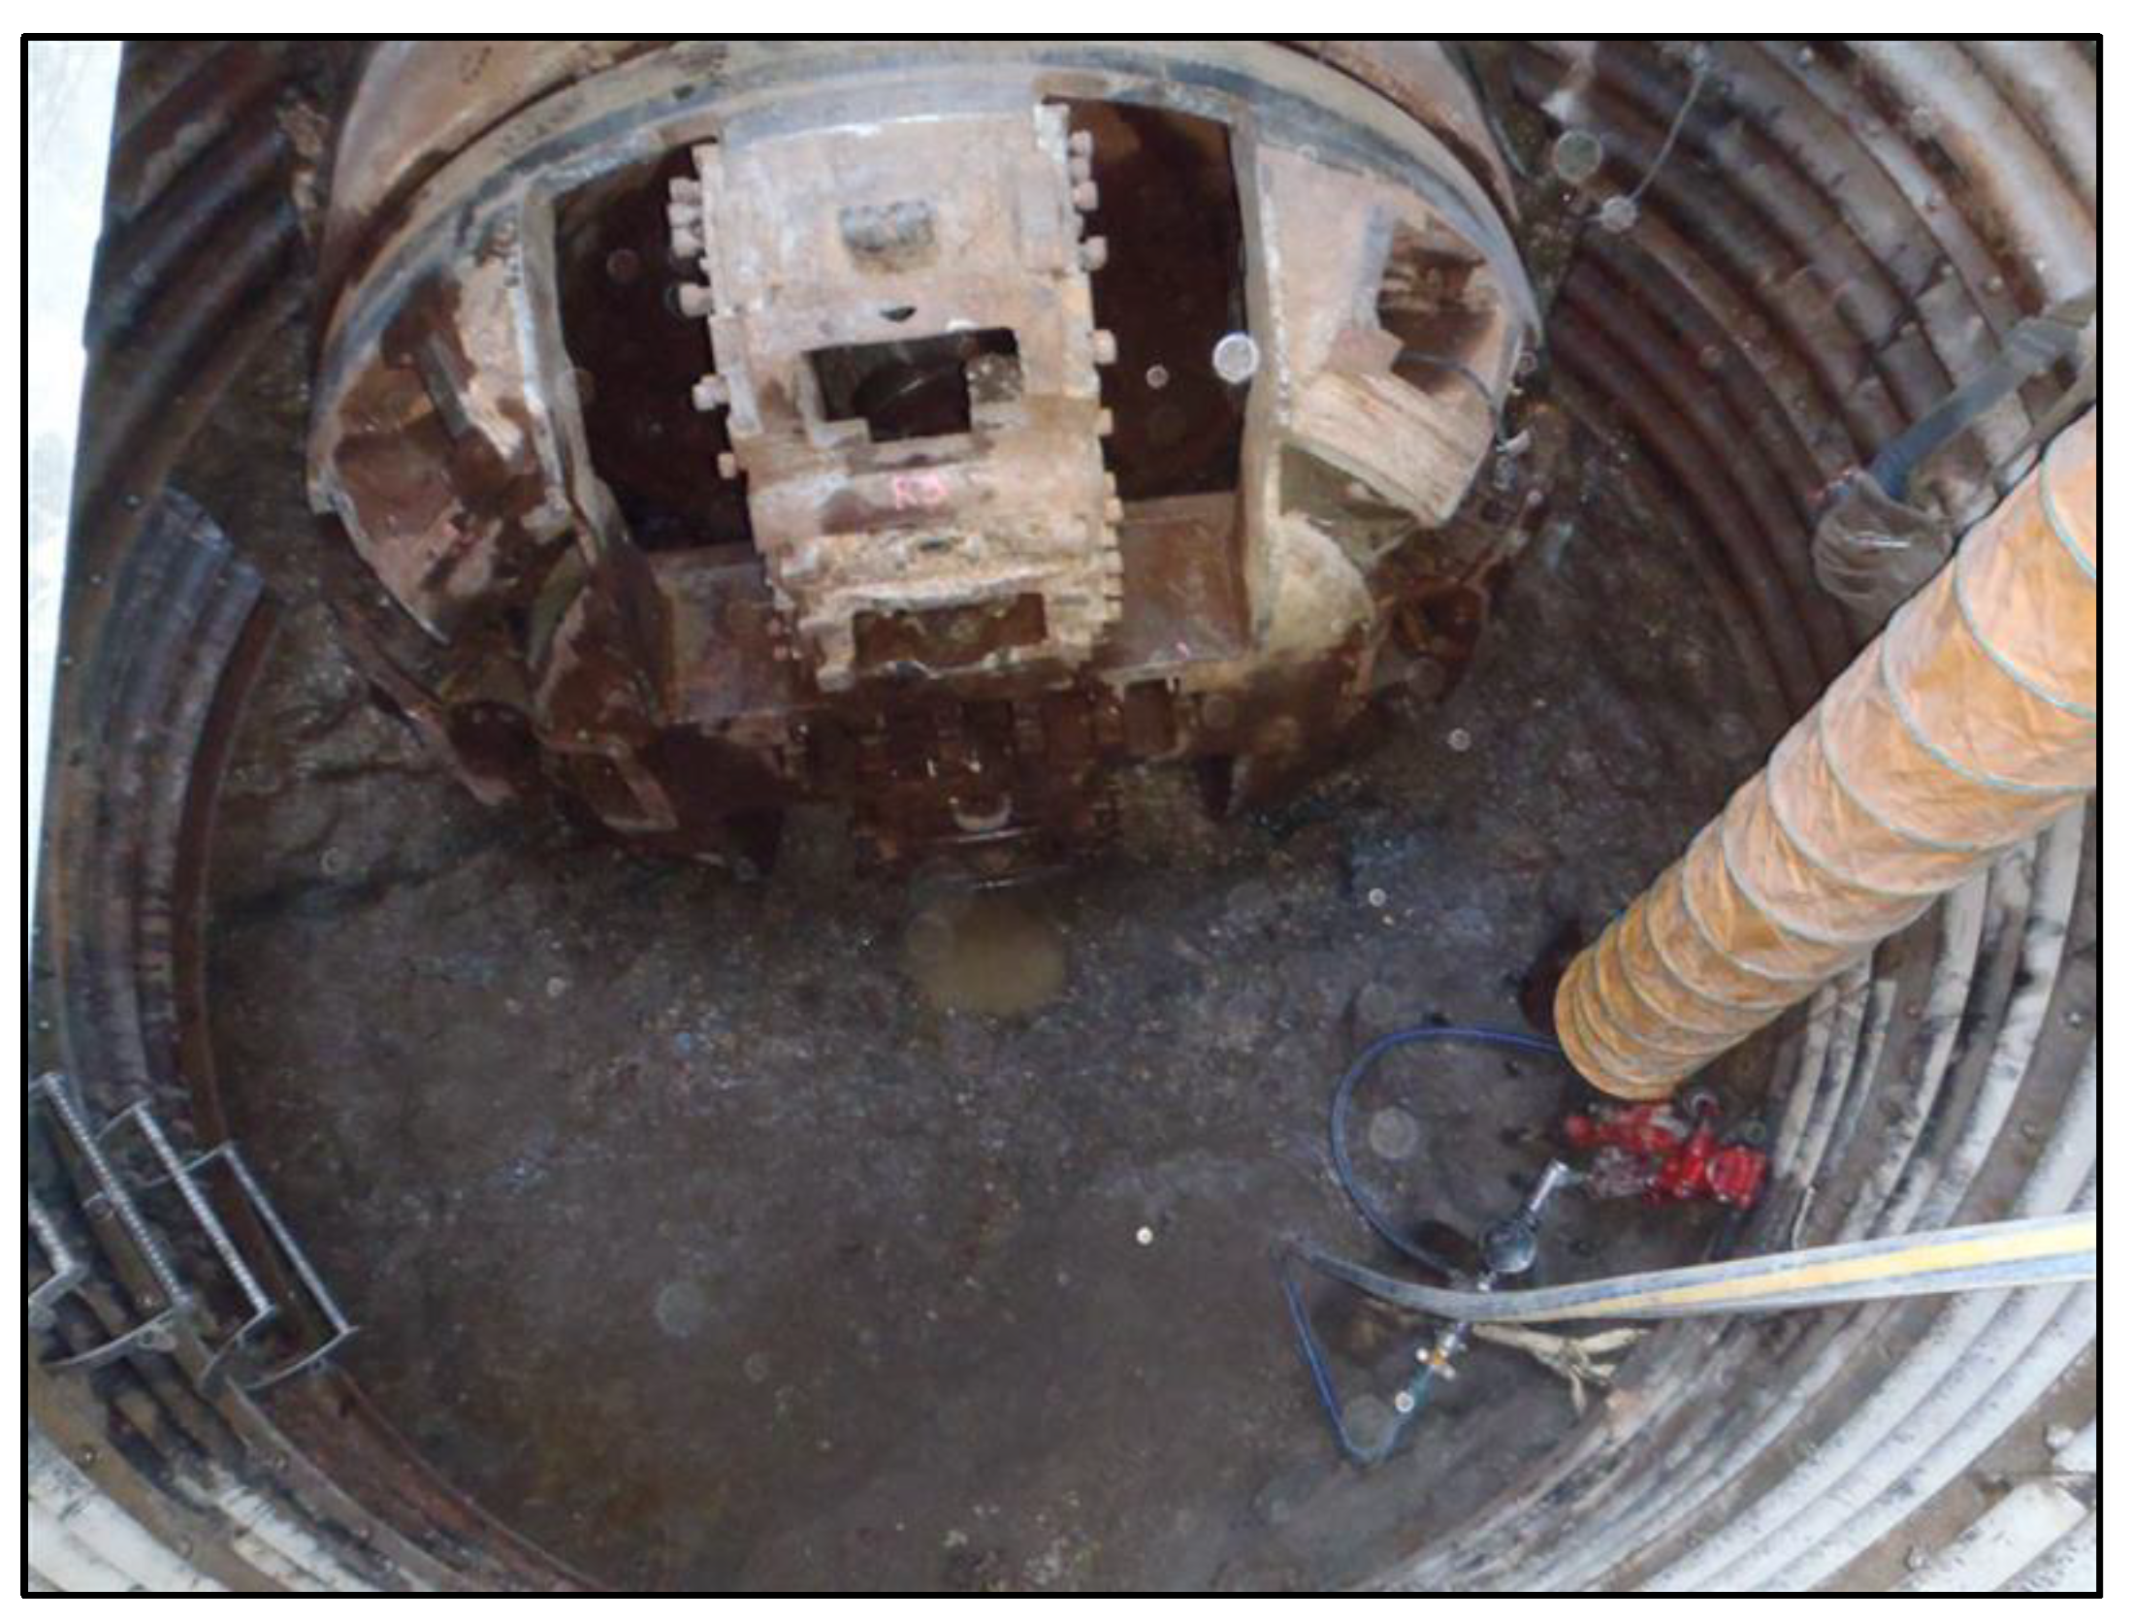

Disclaimer/Publisher’s Note: The statements, opinions and data contained in all publications are solely those of the individual author(s) and contributor(s) and not of MDPI and/or the editor(s). MDPI and/or the editor(s) disclaim responsibility for any injury to people or property resulting from any ideas, methods, instructions or products referred to in the content. |
© 2026 by the authors. Licensee MDPI, Basel, Switzerland. This article is an open access article distributed under the terms and conditions of the Creative Commons Attribution (CC BY) license.