


Abstract
Artificial ground freezing is widely adopted for shaft construction in thick alluvium, yet the mechanical and microstructural responses of surrounding deep clay to freeze–thaw under high pressure remain poorly understood, and the assessment of shaft stability lacks a reliable foundation. Deep clay specimens collected from the Longgu Coal Mine in Shandong Province, China, were subjected to freeze–thaw (FT) under high-pressure and triaxial shear tests under varied initial liquidity indices, confining pressures and freezing temperatures. Particle-size distribution and pore structure were further characterized. Unfrozen specimens show strain-softening behavior and localized shear failure, whereas most FT specimens exhibit strain-hardening responses with bulging-dominated plastic failure, accompanied by a 29–69% reduction in shear strength. A predominant pore-size range remains 2–10 nm, whereas the specific surface area decreases and the average pore diameter increases. Under high stress, freeze–thaw induced particle refinement and pore reconstruction, which is proposed as a key mechanism contributing to strength loss of deep clay. The microstructural evolution and performance degradation of deep clay under the tested conditions correlate strongly with its initial physico-mechanical state. These findings provide a theoretical basis for evaluating shaft-wall stability and mitigating freeze–thaw damage during shaft construction using artificial ground freezing in deep alluvial strata.
1. Introduction
In the central-eastern mining areas of China, vertical shafts are required to pass through Quaternary and Neogene alluvial strata with thicknesses up to hundreds of meters. The artificial ground freezing (AGF) technique is widely used for the construction of vertical shafts. When the alluvial overburden is 500–800 m thick, the frozen wall is generally designed to exceed 10 m in thickness, and its temperature is often maintained below −15 °C to ensure sufficient strength and stability under the high ground pressure [1]. After the frozen wall thaws, stratum settlement induces compressive loading on the shaft lining, often causing instability of shaft equipment, such as pipelines and guide rails, and may even result in cracking or rupture of the shaft lining. These failures pose a serious threat to the safe operation of the mine [2,3].
Thick alluvium often contains multiple, relatively thick clay layers. During shaft sinking, deep clay is subjected to a single freeze–thaw cycle (FTC) under high-stress conditions. Even this single cycle can degrade its mechanical properties and intensify deformation, making it a potential trigger for subsequent stratum settlement [4]. The physico-mechanical properties of deep clay differ markedly from those of shallow clay. Deep clay possesses a dense structure. For clay located at depths greater than 100 m, the void ratio is generally below 0.8 and decreases with increasing depth. For instance, the void ratio of clay at a depth of 566 m in southwestern Shandong Province is as low as 0.4. Furthermore, deep clay has relatively high liquid and plastic limits. The maximum liquidity index under saturated conditions is no greater than 0.25 and is generally negative for clay deeper than 100 m. According to the relevant soil mechanics classification criteria, deep clay is generally in a semi-solid to solid state [5,6,7]. In contrast to shallow soils, the freeze–thaw process in deep clay occurs under sustained high-stress conditions. The stress levels are typically one to two orders of magnitude higher than those in shallow soils. Field measurements indicate that the initial in situ stress in clay strata at depths of 180–550 m ranges from 1.21 to 6.13 MPa in the Juye mining area of Shandong Province and the Huainan mining area of Anhui Province. Following the formation of the frozen wall, the maximum horizontal earth pressure induced by frost heave can reach approximately twice the initial horizontal in situ stress [8,9].
The effect of freeze–thaw on the mechanical properties of fine-grained soils has been widely investigated. Many studies have demonstrated that FTCs can significantly alter the physical and mechanical properties of soils. In general, the elastic modulus and peak strength of fine-grained soils decrease after FTCs, and some fine-grained soils exhibit a transition from strain softening to strain hardening [10,11,12,13]. The freeze–thaw effect is governed by soil mineral composition, initial water content, natural density, and freezing conditions [14,15]. The number of FTCs is a critical parameter for the geotechnical properties of soils in cold regions. Several studies have conducted freeze–thaw tests on fine-grained soils under closed-system conditions. The elastic modulus and peak strength generally decrease during the initial freeze–thaw cycles, after which their reductions become less pronounced and both properties tend to stabilize after approximately 7–10 cycles. After multiple freeze–thaw cycles, cohesion decreases while the internal friction angle tends to increase [16,17,18].
The changes in soil geotechnical properties induced by freeze–thaw cycling are primarily attributed to microstructural alterations caused by ice–water phase transitions. Numerous studies have investigated freeze–thaw-induced microstructural evolution and its underlying microscale mechanical mechanisms [19,20,21,22,23,24]. Relevant findings reveal three primary forms of microstructural disturbance. First, freeze–thaw changes the particle-size distribution. This process does not simply fragment and refine soil particles. Instead, particle breakage and aggregation occur simultaneously. Namely, coarse particle breakage occurs synchronously with fine particle aggregation, and the soil gradually evolves toward a new structural equilibrium through repeated freeze–thaw cycling [25,26]. Second, freeze–thaw cycling induces particle migration and rearrangement. Repeated cycling can increase the degree of particle ordering and consequently modify interparticle contacts and fabric anisotropy [27,28,29]. Third, freeze–thaw treatment changes the proportion of pores at different scales. Zhou et al. [20] reported that freeze–thaw further differentiates inter-aggregate and intra-aggregate pores in soft clay, resulting in a more pronounced dual-porosity structure. The degree of this pore-scale differentiation is governed by the freezing temperature and freezing duration. Fan et al. [30] reported that freeze–thaw affects macropores substantially more than mesopores and micropores, with the freezing temperature regulating the magnitude of the response across different pore-size ranges. Gao et al. [31] investigated two types of fine-grained loess and found that freeze–thaw cycling promoted the redistribution of pores from sizes below 0.4 μm to sizes above 0.4 μm. They also reported that the relationship between saturated hydraulic conductivity and the proportion of pores larger than 0.4 μm was more consistent than that between saturated hydraulic conductivity and pore tortuosity.
Available research has mainly focused on freeze–thaw-induced damages in cold-region engineering or shallow AGF projects, and relatively few studies have reported the response of deep clay to freeze–thaw under high pressure. In particular, quantitative data characterizing intra-particle nanopores following high-pressure freeze–thaw are limited. Deep clay is characterized by a dense fabric, a low liquidity index, and significantly higher in situ stress than shallow soils. Nevertheless, the freeze–thaw response of deep clay and its underlying mechanisms remain poorly understood. The objective of this study is therefore to quantify the effects of initial consistency state, confining pressure, and freezing temperature on the post-freeze–thaw deformation, total-stress strength, particle-size distribution, and intra-particle nanopores. To this end, deep clay specimens with three different initial consistency states were subjected to one freeze–thaw cycle under high isotropic pressure, followed by triaxial shear tests, particle-size characterization and nitrogen-adsorption porosity analysis to reveal the underlying microparticle and pore structural variation responsible for the observed mechanical changes in deep clay after a single freeze–thaw cycle.
2. Materials and Methods
2.1. Soil Material
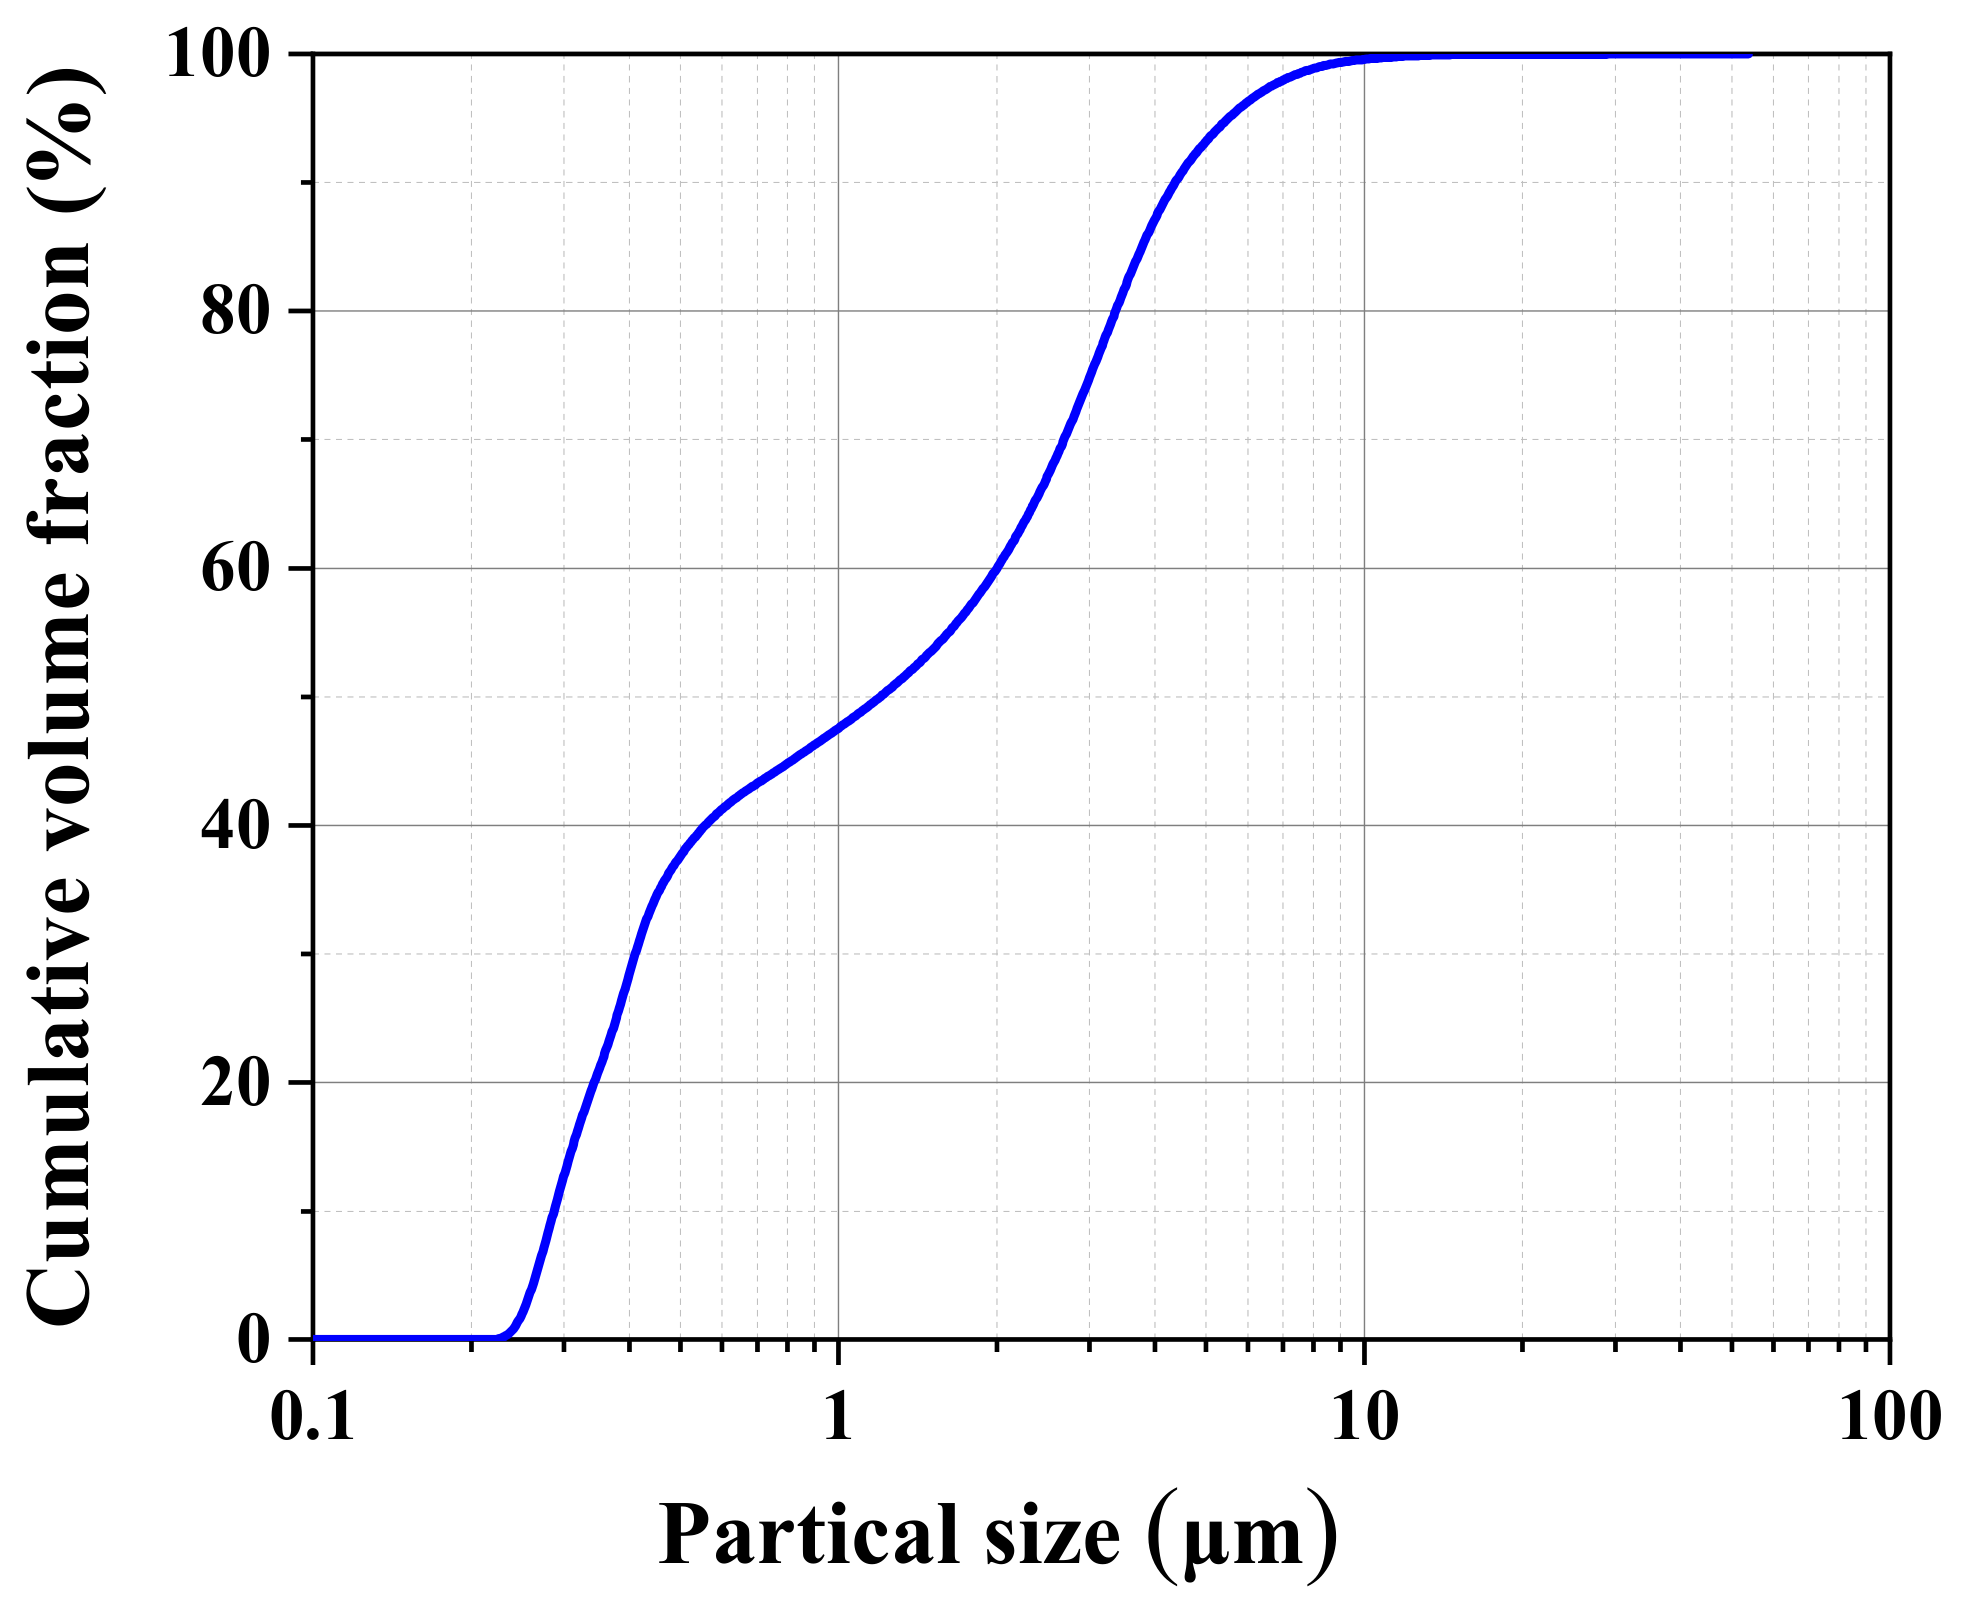
The soil was collected from a representative deep clay layer at the Longgu Coal Mine, Shandong Province, China. The basic physical properties of the soil were determined in accordance with the Chinese standard GB/T 50123–2019 (Standard for Geotechnical Testing Method) [32]. The grain size distribution of the soil is shown in Figure 1. The fine-grained fraction was divided into silt (>5 µm) and clay-sized particles (<5 µm), while particles finer than 2 µm were further considered as the colloidal-sized fraction [33,34]. Particle-size analysis showed that the colloidal particles, clay, and silt fractions of the specimen are 59.3%, 34.5%, and 6.2%, respectively.
Figure 1.
Cumulative particle-size distribution of the deep clay.
The liquid limit and plastic limit were determined using a combined liquid–plastic limit apparatus. The liquid limit, plastic limit, plasticity index and specific gravity were 57.0%, 26.4%, 30.6 and 2.75, respectively.
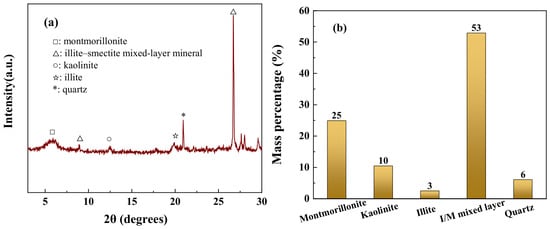
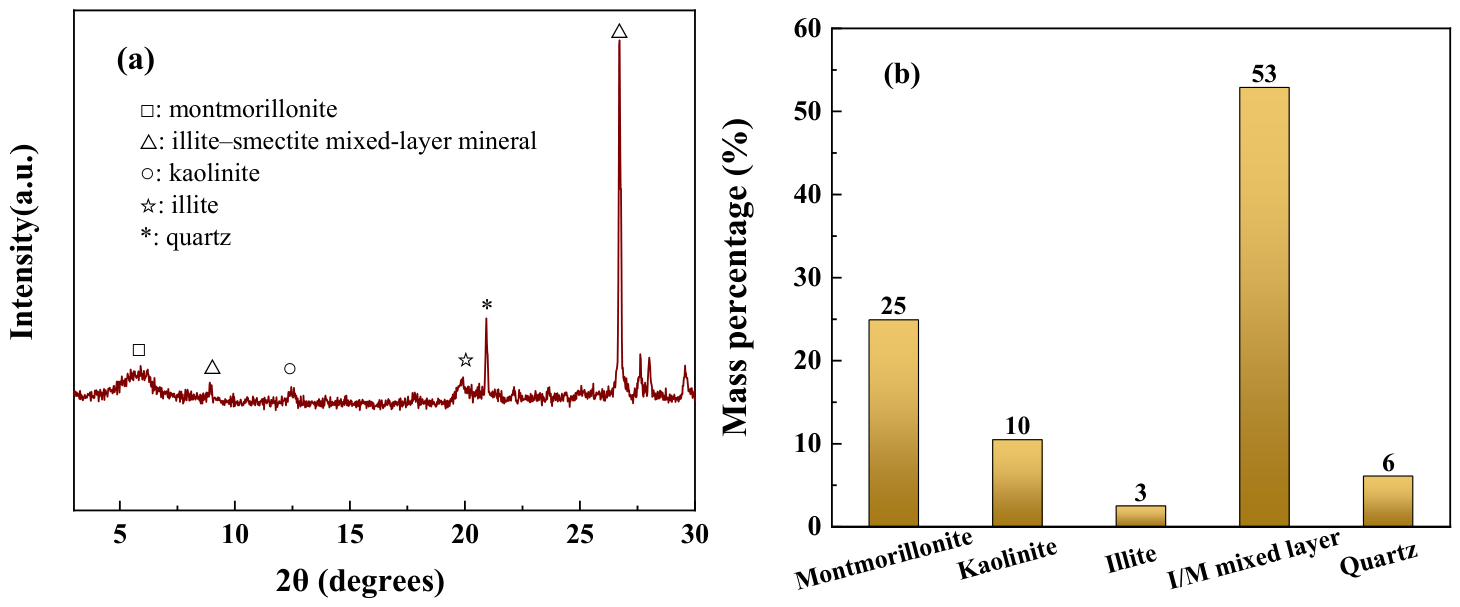
X-ray diffraction (XRD) analysis was performed using a Bruker D8 Advance diffractometer (Bruker, Karlsruhe, Germany). Full-range diffraction patterns were collected from 2θ = 3° to 70° for general mineral screening. The diagnostic basal reflections of clay minerals (illite, kaolinite, montmorillonite, and illite–smectite mixed-layer mineral) are primarily located within the low-to-medium angle range below 30°, while high-angle peaks mostly originate from higher-order diffraction and non-clay accessory minerals with limited diagnostic value for clay identification. Accordingly, clay mineral identification and analysis were restricted to the 2θ range of 3–30° (Figure 2a), covering all necessary basal reflections for reliable clay mineral characterization. Quantitative mineral analysis was performed using Jade 6 software based on the reference intensity ratio (RIR, K-value) method. After phase identification, the peak areas of characteristic diffraction reflections for each mineral were fitted. The intrinsic RIR values of standard minerals embedded in Jade 6 were used to calculate the relative mass fractions of all detected mineral components. The mineral phase contents are shown in Figure 2b. The XRD pattern reveals the main mineral components of deep clay, including illite–smectite mixed-layer mineral, montmorillonite, kaolinite, illite, and quartz. The broad diffraction peak at ~6° corresponds to the (001) reflection of montmorillonite. The illite–smectite mixed-layer mineral exhibits characteristic peaks at ~9° and ~26°. Kaolinite shows its diagnostic (001) peak at approximately 12°. The characteristic peak near 20° is assigned to the (002) reflection of illite. Quartz presents a sharp diffraction peak at ~21°.
Figure 2.
(a) X-ray diffraction pattern of the deep clay specimen. (b) The mineral content of the soil determined by X-ray diffraction.
Illite–smectite mixed-layer minerals and montmorillonite together account for approximately 78% of the identified mineral content. These swelling clay minerals have high specific surface area, strong water retention, and pronounced exchangeable-cation and double-layer activity. During freezing, the temperature gradient and suction generated at the ice–water interface drive water migration toward the freezing zone. The strong water-retention capacity of expansive minerals helps sustain this water supply, thereby promoting frost heave and causing disturbance to the soil structure that consequently reduces the mechanical performance of the soil.
2.2. Specimen Preparation
Clay specimens with different consistency states were prepared, and their dry density, water content, void ratio, and liquidity index are shown in Table 1. The initial degrees of saturation were approximately 95%. The liquidity indices (IL) were 0, −0.2 and −0.4 for group DC1, group DC2 and group DC3, respectively. The soil was crushed, oven-dried, and sieved, after which the water content of the dried soil was measured. Based on the target water content of each specimen, the required amounts of dry soil and distilled water were thoroughly mixed. The specimens were sealed with plastic film and stored in a chamber with controlled temperature and humidity for at least 12 h to promote moisture equilibration.
Table 1.
Specimen preparation parameters.
Subsequently, specimens were prepared using a self-made vacuum preparation device, as detailed in the Supplementary Materials and Figure S1. Special specimen preparation measures were adopted to minimize air effects. The soil was loaded into the specimen cylinder in three portions. After each portion was loaded, the vacuum pump was turned on for air extraction, followed by static compaction of the soil specimen, with vacuum maintained throughout the compaction process. Once the specimens reached the target density and dimensions, the base plate was removed and the specimens were extruded. The finished specimens had a diameter of 61.8 mm and a height of 125 mm. After vacuum-assisted static compaction, the specimen water content was not adjusted further. The specimen was sealed and stored before installation, so no post-compaction saturation, consolidation, or water-exchange step was performed before freezing. The degree of saturation (Sr) was estimated from the measured water content (w), void ratio (e), and specific gravity (Gs) using Sr = wGs/e, giving approximately 94.3%, 94.6%, and 95.2% for groups DC1, DC2, and DC3, respectively. It should be noted that these values represent the state of the specimens prior to the application of high pressure.
2.3. Testing Methods
Triaxial shear tests were carried out on unfrozen soil and freeze–thawed soil specimens. Particle size and pore structure of the specimens were also characterized before and after freeze–thaw. The specimens were subjected to one freeze–thaw cycle with high pressure. The freezing temperatures were −15 °C and −30 °C, and the thawing temperature was 20 °C. Triaxial shear tests were carried out on unfrozen soil and freeze–thawed soil specimens. Particle size and pore structure of the specimens were also characterized before and after freeze–thaw. The specimens were subjected to one freeze–thaw cycle with high pressure. The freezing temperatures were −15 °C and −30 °C, and the thawing temperature was 20 °C. The specimens were collected from the Longgu Coal Mine at depths of 600–645 m. The initial horizontal ground pressure (Ph) was calculated as 7.8–8.4 MPa using the heavy-liquid formula [35]. As reported in reference [8], the horizontal pressure inside the frozen wall can reach up to 2.4 times this initial value. Thus, the maximum horizontal ground pressure may attain 20.1 MPa. Accordingly, confining pressures of 10, 15, and 20 MPa were adopted in this study. The confining pressure was maintained constant throughout the freezing and thawing stages. The specimens were denoted as DCx-y-z, where x represents the initial clay group (1, 2, 3), and y denotes the confining pressure. The third segment indicates the temperature: UF denotes the unfrozen state, whereas F15 and F30 denote freezing temperatures of −15 °C and −30 °C, respectively. The specimens were denoted as DCx-y-z, where x represents the initial clay group (1, 2, 3), and y denotes the confining pressure. The third segment indicates the temperature: UF denotes the unfrozen state, whereas F15 and F30 denote freezing temperatures of −15 °C and −30 °C, respectively.
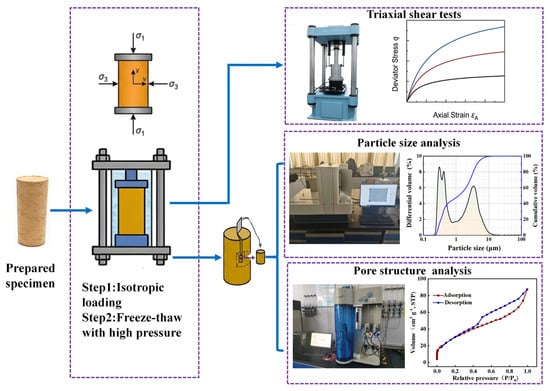
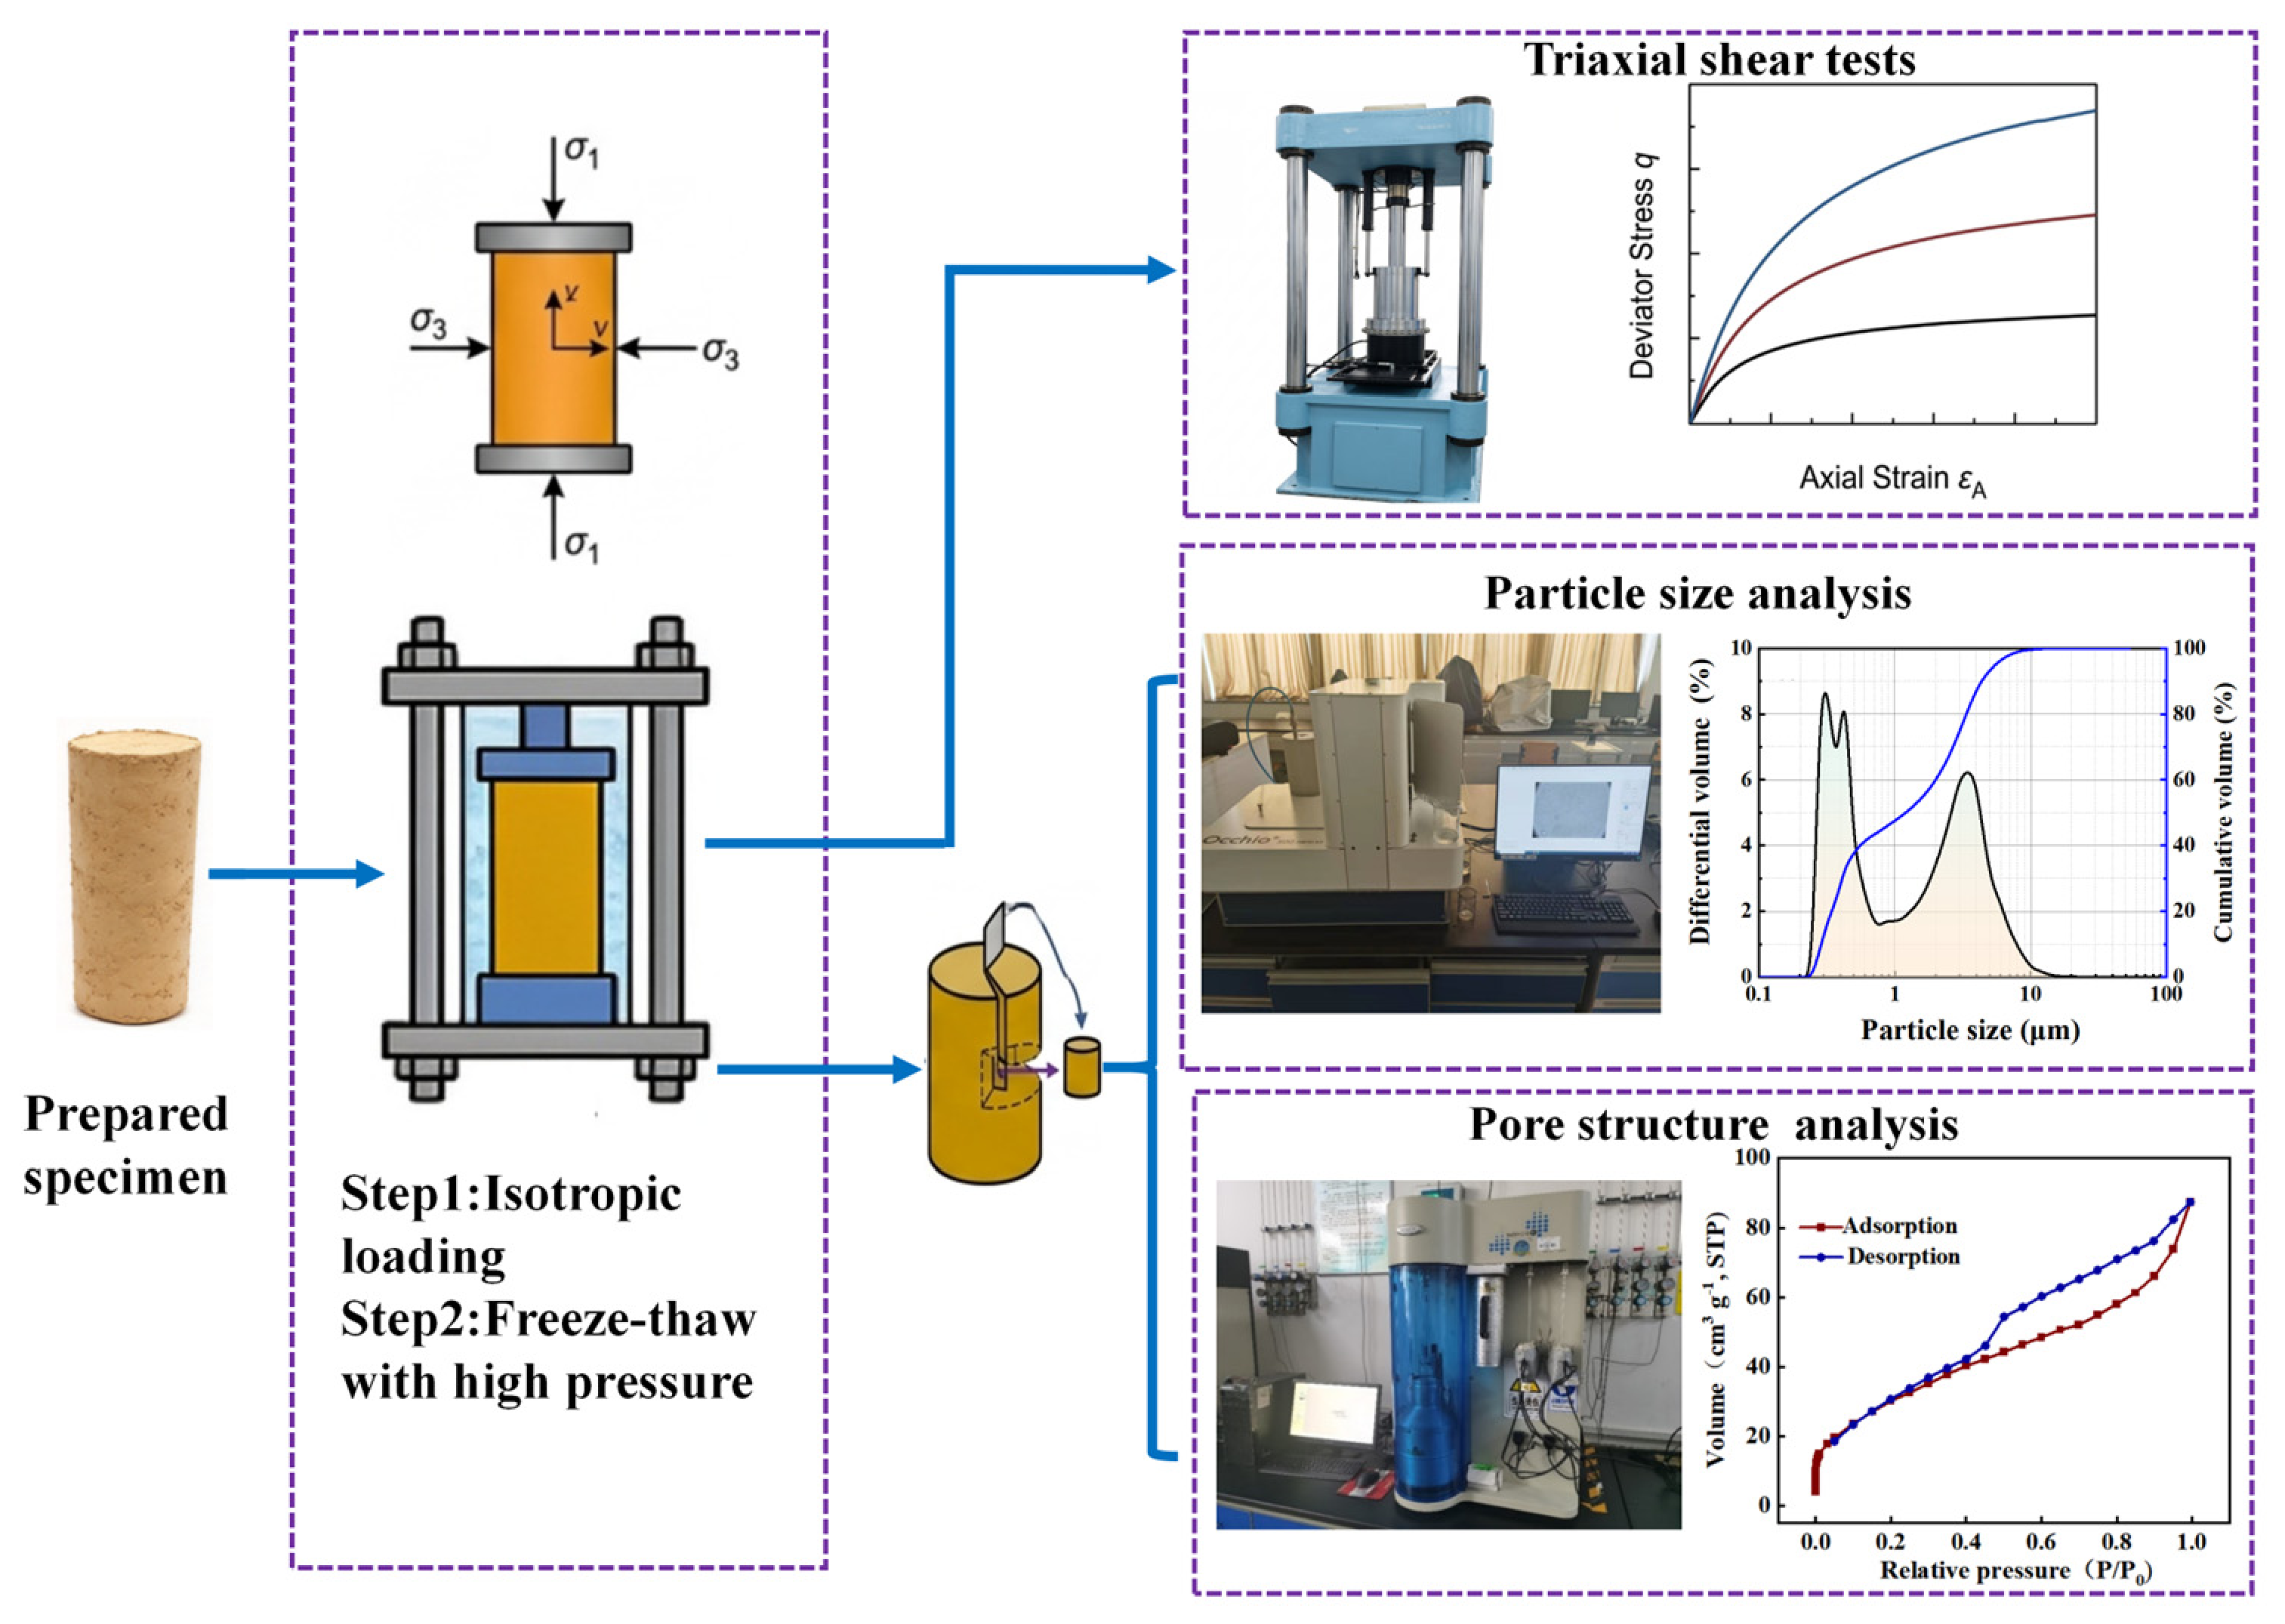
The experimental procedure was as follows (Figure 3). Isotropic loading was first performed at a positive temperature. Subsequently, freeze–thaw tests were conducted under the same pressure. After completion of the freeze−thaw tests, macroscopic mechanical behavior was evaluated through triaxial shear tests, while microscopic characterization of the freeze−thawed specimens was performed using laser particle-size analysis and liquid-nitrogen adsorption tests.
Figure 3.
Procedures for the testing program.
2.3.1. Loaded Freeze–Thaw and Triaxial Shear Tests
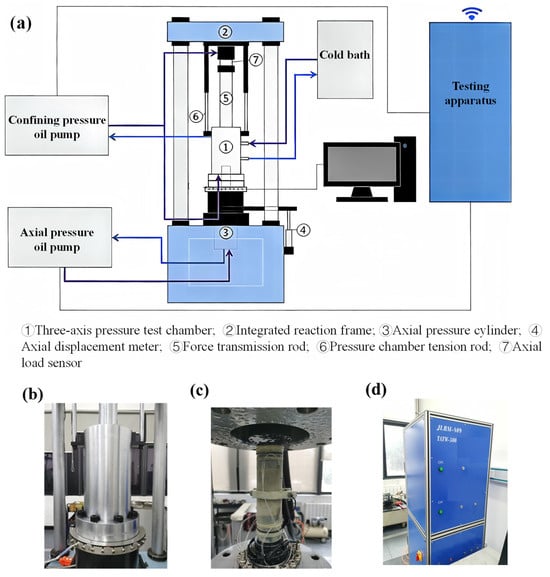
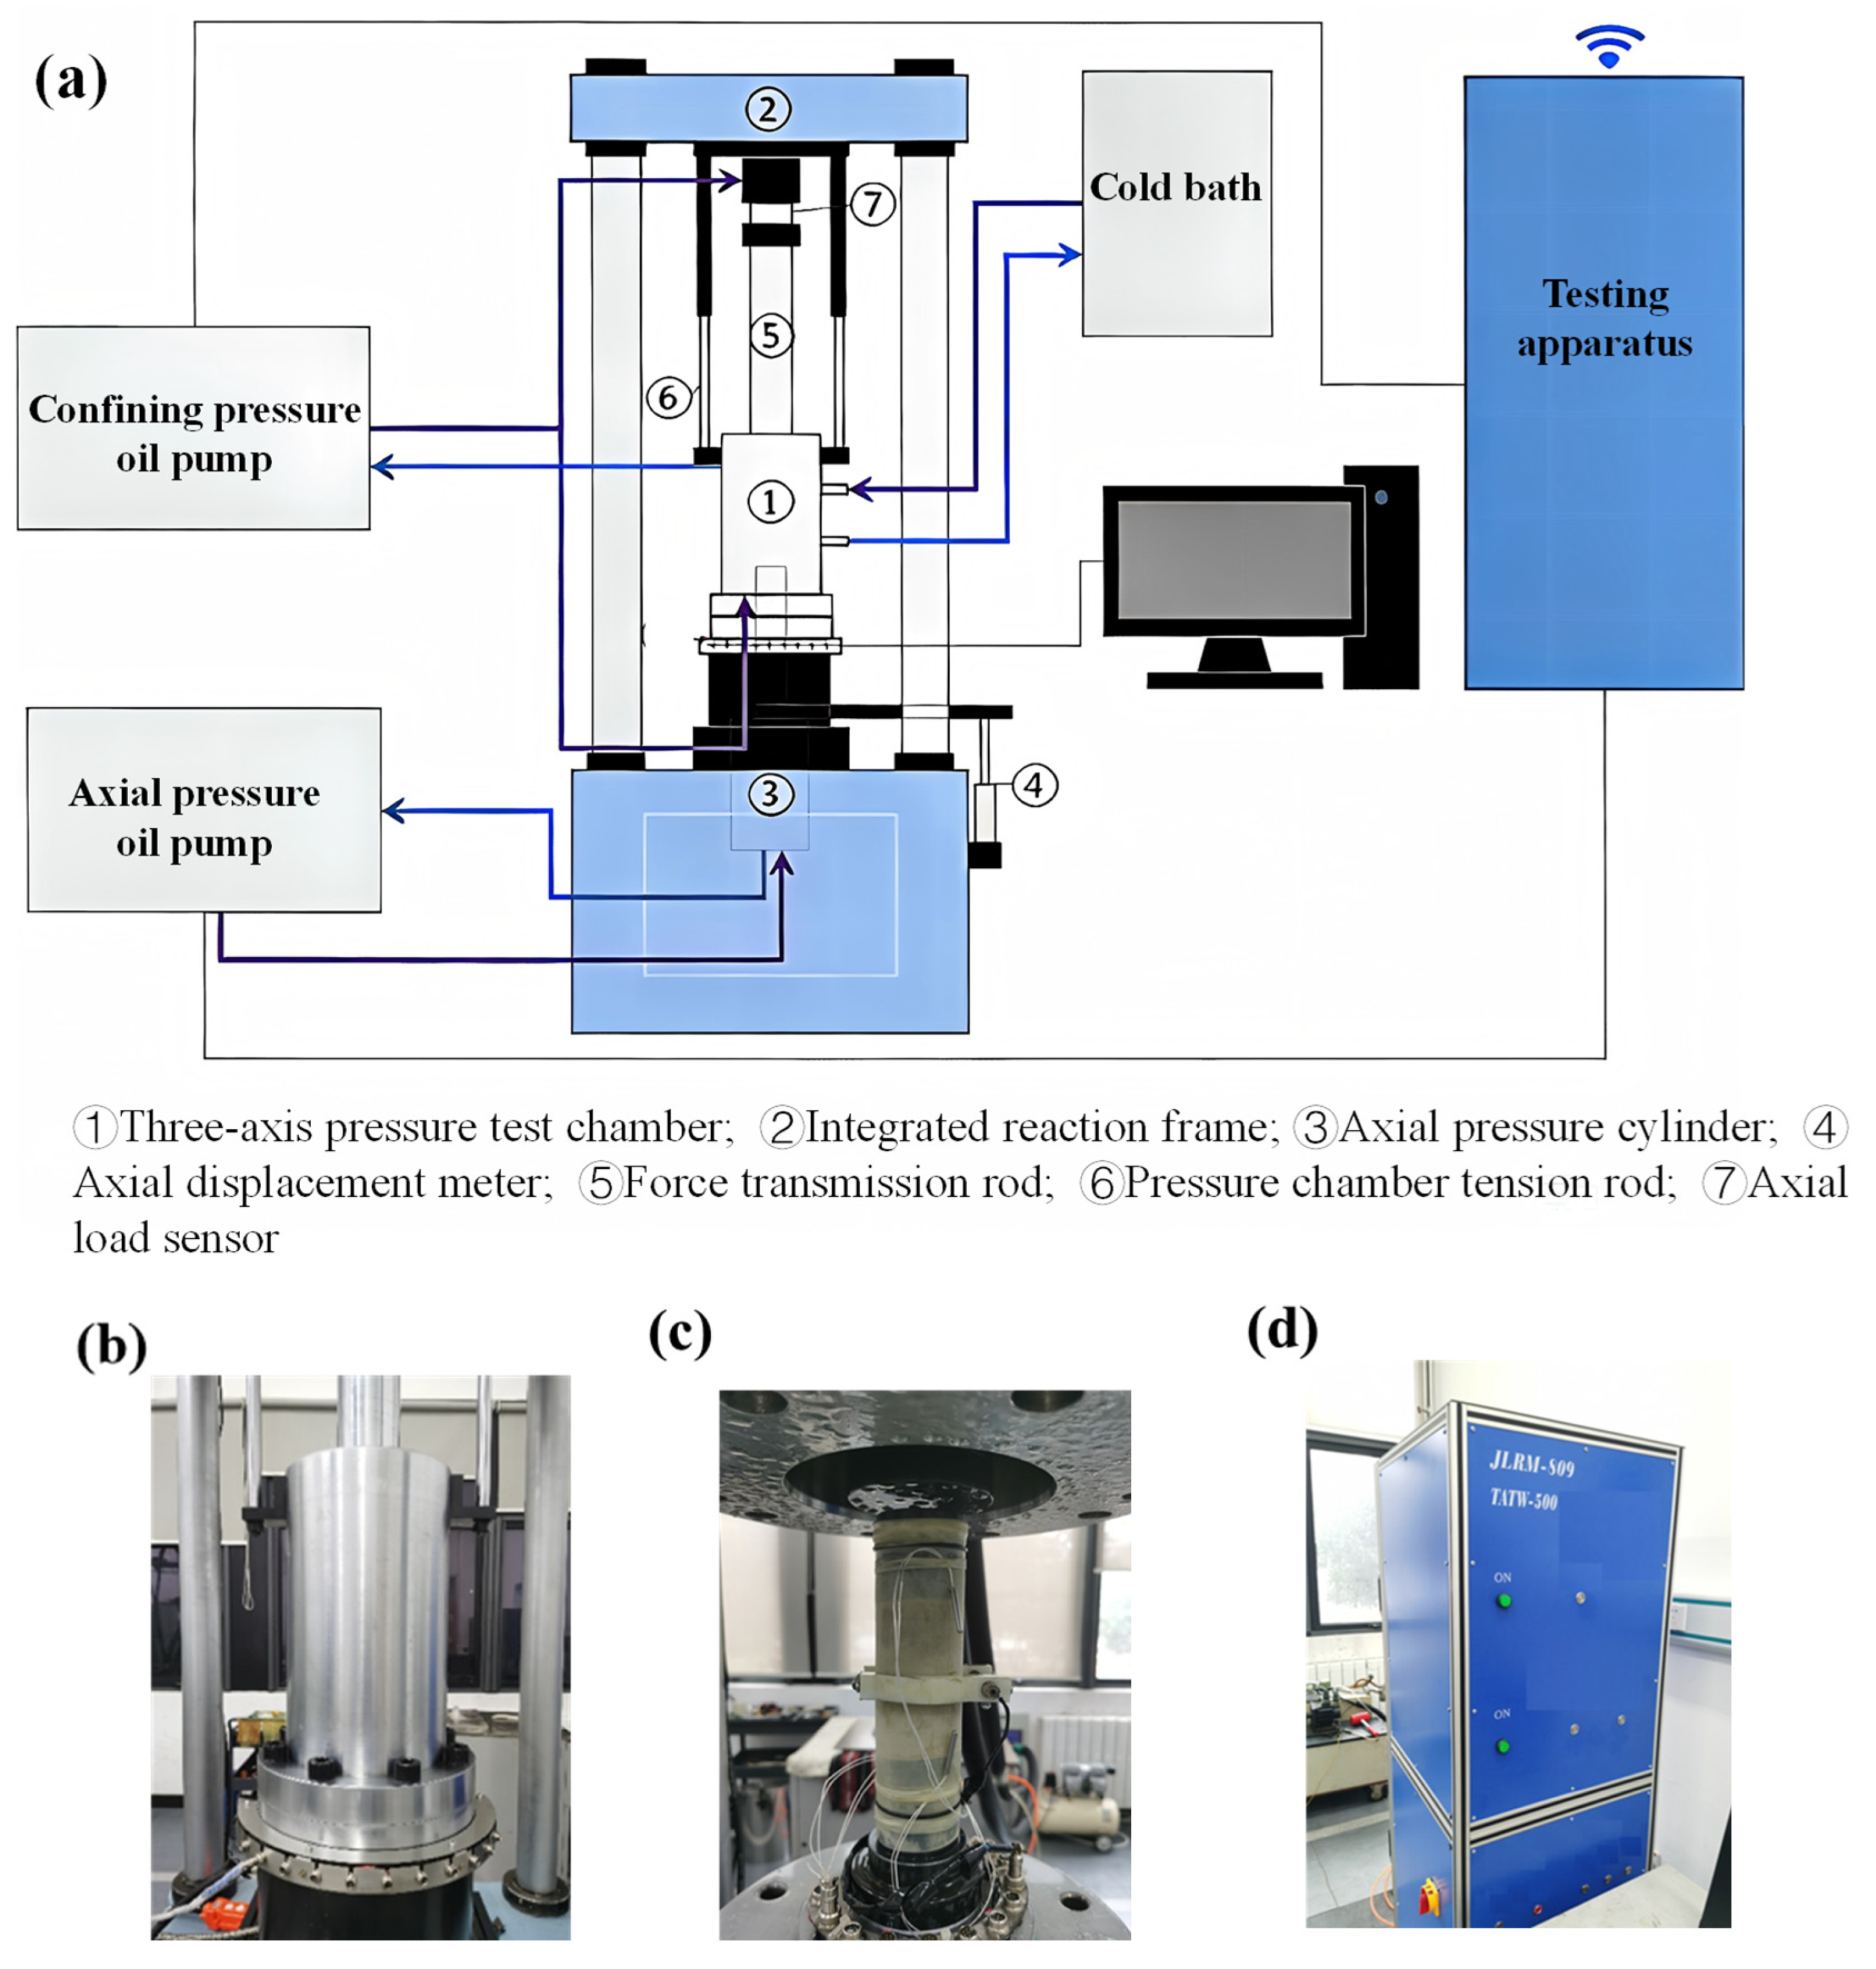
The TATW-500 low-temperature triaxial test system was adopted (Changchun Chaoyang Test Instrument Co., Ltd., Changchun, China). It consists of a triaxial pressure cell, a confining pressure loading system, an axial-loading system, a temperature control system, and a data acquisition system (Figure 4). Ethanol was used as the circulating coolant within the temperature control system to regulate specimen temperature during triaxial compression tests. The system achieves high-precision low-temperature control, servo-controlled loading of axial pressure, confining pressure, and deformation, as well as synchronized multi-parameter data acquisition. This testing system is primarily designed for deep underground artificial ground freezing projects. It is capable of simulating the temperature–pressure conditions of deep soils and conducting strength and rheological tests on deep artificially frozen soil. Its technical specifications are as follows: a maximum loading capacity of ±500 kN with an accuracy of 0.05%; a maximum confining pressure of 30 MPa with a resolution of 0.001 MPa and an accuracy of 0.25%; an axial displacement range of 150 mm with an accuracy of 0.25%; and a temperature control range from −30 °C to 80 °C with a temperature fluctuation of ±0.1 °C.
Figure 4.
Schematic diagram of the triaxial testing system: (a) triaxial testing system; (b) external view of the triaxial chamber; (c) internal view of the triaxial chamber; (d) loading control system.
The specimen was first covered with a latex membrane, followed by installation of the loading cap and temperature probe. The membrane was sealed around the specimen, and no external drainage, water-supply, or back-pressure line was connected. After placing the specimen into the triaxial cell, the temperature control system was activated to maintain a constant temperature of 20 °C inside the cell. Isotropic loading was applied by controlling axial and confining pressures via the loading system. Once the target confining pressure was reached, it was maintained for 12 h. This period was an isobaric stabilization stage under a hydraulically closed boundary and was not a drained consolidation stage, which is not expected to produce drained pre-consolidation. The same stage was applied to the unfrozen reference specimens, so the freeze–thaw and unfrozen groups are compared under identical pre-loading history. Under high pressure, pore air can be compressed, accompanied by deformation and rearrangement of the soil skeleton. However, for densely structured deep clay, such volume change is limited.
The temperature control system was then adjusted to cool the specimen to −15 °C or −30 °C and subsequently thaw it to 20 °C. Throughout the freeze–thaw stage, the loading remained isotropic: the axial and confining pressures were kept constant, with σ1 = σ3 and q = 0. Because the deep clay specimens were dense, their liquidity index did not exceed 0. Given that the migration of free water is relatively limited, no drainage was performed during freezing and thawing. The external boundary remained sealed during thermal cycling, although internal water migration and ice–water phase change could still occur.
Upon completion of the loaded freeze–thaw process, triaxial shear tests were conducted on the freeze-thawed clay. The triaxial shear tests were loaded under displacement control at an axial displacement rate of 1 mm min−1, while the confining pressure was maintained constant. Stress and deformation data were recorded during loading. For specimens exhibiting post-peak softening, loading was continued until the axial strain increased by an additional 3–5% after the peak stress was reached. For specimens showing no clear post-peak stress decrease, loading was continued until the axial strain reached 20%.
2.3.2. Particle Characteristic Test of Deep Clay
The particle-size distributions of the specimens were analyzed using an Occhio 500Nano XY (Occhio SA, Angleur, Belgium) fully automatic particle size and shape analyzer. Following the laser particle-size analysis procedure of Scott et al. [36], representative soil subsamples were oven-dried at 80 °C, crushed using a grinder, and transferred to labeled, sealed sample tubes. Approximately 0.1 g of soil was dispersed in 10 mL of distilled water. For the unfrozen and freeze–thaw samples, the suspension was sonicated for approximately 1 min to uniformly disperse soil particles in water.
Before testing, the lens of the instrument was rinsed with an appropriate amount of alcohol. The pipette of the analyzer was immersed in the beaker, and alcohol was aspirated for repeated cleaning about ten times. After focusing, no obvious residual particles were observed in the computer display window, indicating that the instrument was sufficiently cleaned. Prior to measurement, key instrumental parameters, including the refractive index, ultrasonic end displacement, sample mass concentration, and pump speed, were preset according to the actual properties of the soil samples. Subsequently, the pipette of the particle size analyzer was placed into the beaker containing the soil suspension to initiate the formal test.
2.3.3. Pore Structure Analysis of Deep Clay
N2 adsorption–desorption was used to evaluate the pore structure using an Auto-sorb-IQ2-MP-XR instrument (Quantachrome, Boynton Beach, FL, USA). Subsamples with dimensions not exceeding 5 mm were collected from the central regions of the unfrozen and freeze–thaw-treated specimens, followed by oven drying. The subsamples were then loaded into adsorption cells and degassed at 120 °C under vacuum for 12 h to remove physically adsorbed water and volatile contaminants. The pore characteristics obtained via BET represent the pore structure of dehydrated specimens after outgassing, which is an inherent limitation of nitrogen adsorption for clay. The adsorption cells were transferred into the analysis chamber, and then nitrogen adsorption and desorption measurements were conducted at –196 °C. The specific surface area was estimated via the Brunauer–Emmet–Teller (BET) method, while the pore-size distribution was determined using the density functional theory (DFT) model.
3. Results and Discussion
3.1. Stress–Strain Response
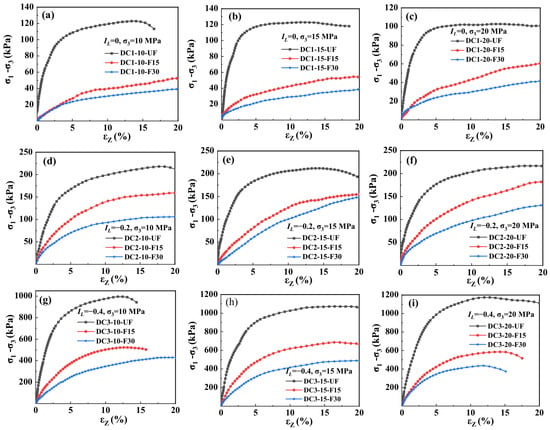
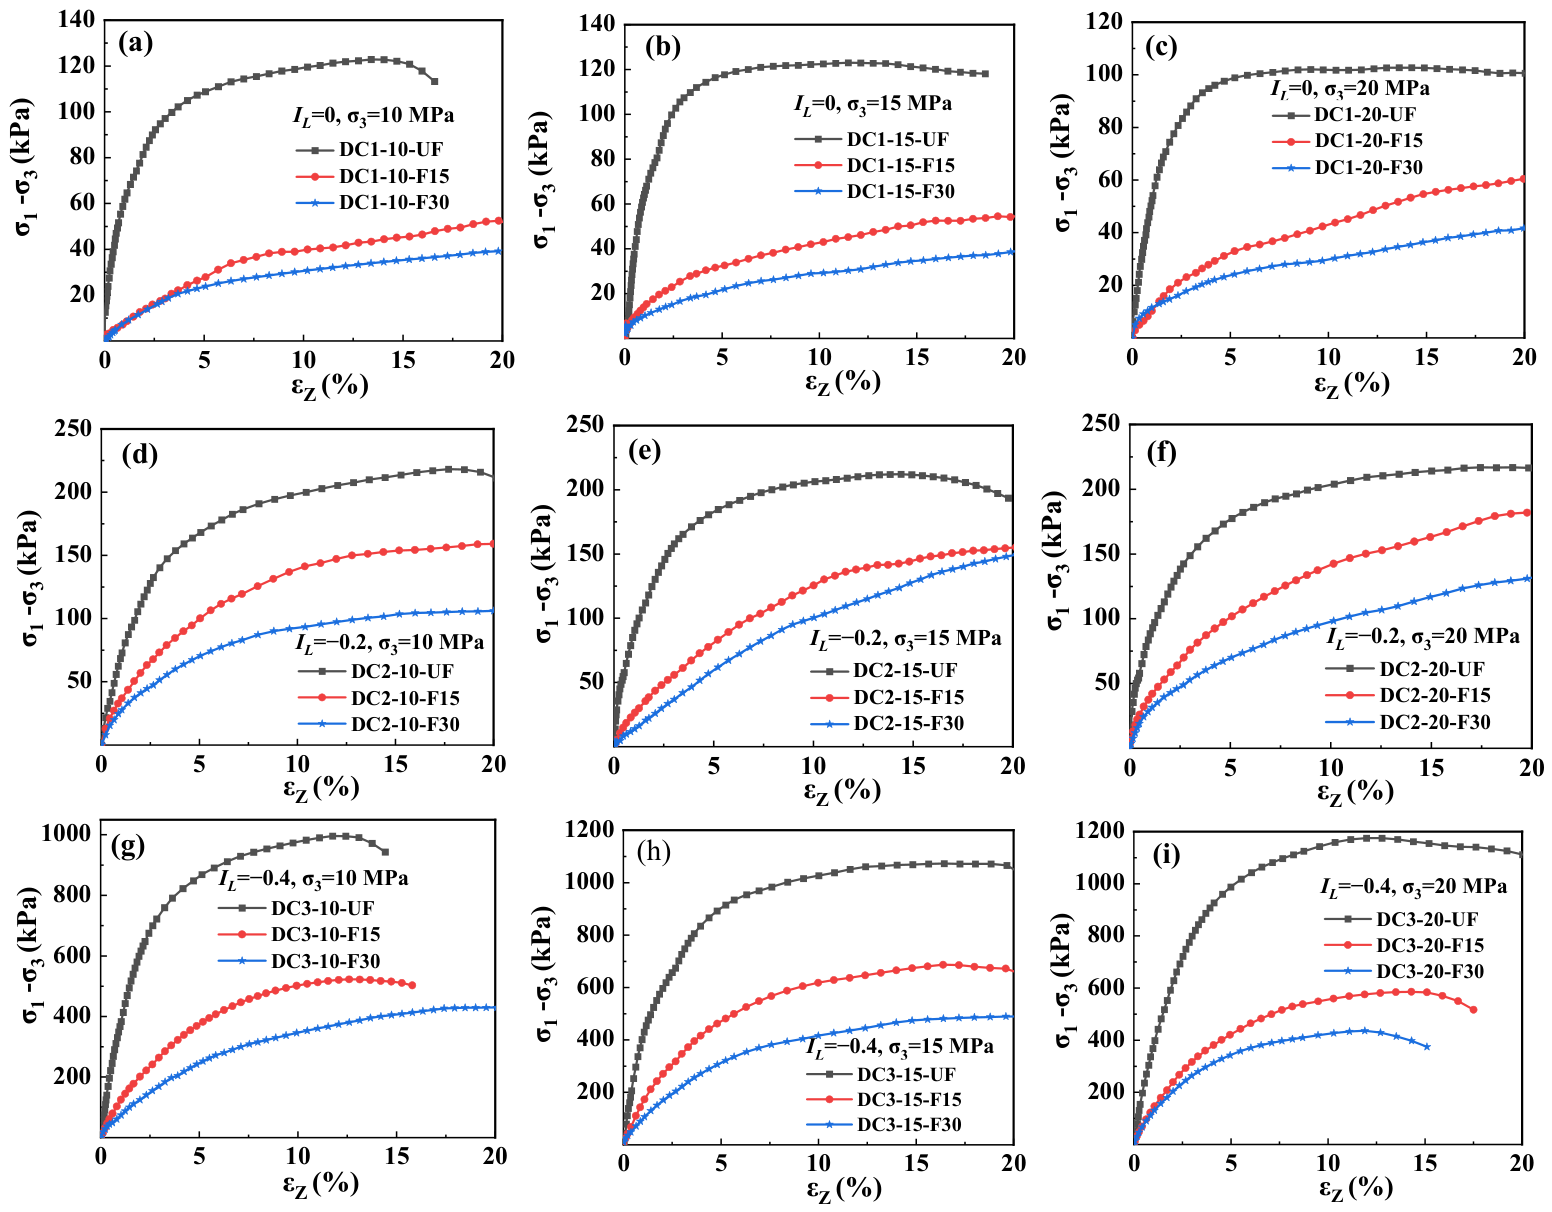
The deviatoric stress–strain curves of the deep clay specimens before and after freeze–thaw treatment are shown in Figure 5. All unfrozen specimens exhibited strain-softening behavior under the tested conditions. For group DC1, the peak stress ranges from 102.7 kPa to 123.1 kPa with failure strains of 11.5–13.6%. For group DC2, the peak stress varies between 212.1 kPa and 218.2 kPa, and the failure strain ranges from 14.4% to 17.7%. Group DC3 shows peak stresses of 995.8–1175.1 kPa and failure strains of 11.8–16.4%. After high-pressure freeze–thaw treatment, the stress–strain curves of deep clay decrease markedly. The freeze–thawed clay specimens in groups DC1 and DC2 show strain-hardening behavior, whereas group DC3 remains predominantly strain-softening. The order-of-magnitude difference between group DC3 and group DC1 reflects their physical states: DC1 has a water content of 26.4%, a dry density of 1.56 g cm−3, and a void ratio of 0.8, whereas DC3 has a water content of 14.2%, a dry density of 1.95 g cm−3, and a void ratio of 0.4. The lowest water content and the highest dry density of DC3 produce a denser skeleton and stronger interparticle contacts, which is consistent with its substantially higher peak stress and its less ductile post-freeze–tha w response.
Figure 5.
Triaxial shear stress–strain curves of the deep freeze–thaw clay: (a–c) group DC1 at confining pressures of 10, 15, and 20 MPa; (d–f) group DC2 at 10, 15, and 20 MPa; (g–i) group DC3 at 10, 15, and 20 MPa. (a) group DC1,σ3 = 10 MPa; (b) group DC1,3 = 15 MPa; (c) group DC1,s3 = 20 MPa; (d) group DC2,s3 = 10 MPa; (e) group DC2,s3 = 15 MPa; (f) Group DC2,s3 = 20 MPa; (g) group DC3,s3 = 10 MPa; (h) group DC3,s3 = 15 MPa; (i) group DC3,s3 = 20 MPa.
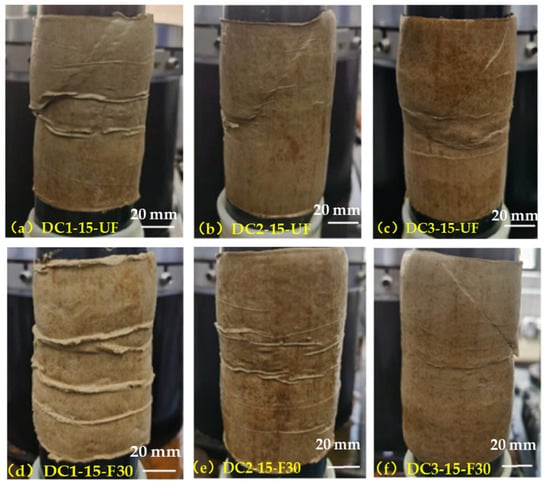
Figure 6 shows the failure patterns of the tested specimens before and after freeze–thaw treatment. The specimens without freeze–thaw treatment predominantly exhibit localized shear failure, characterized by a continuous, inclined fracture that traverses each specimen and defines a distinct, steeply dipping shear plane. This morphology suggests that plastic deformation is concentrated within a narrow shear band, consistent with the strain-softening behavior observed in the corresponding stress–strain curves. Following freeze–thaw treatment, no continuous, through-going shear plane is discernible. Instead, lateral expansion develops primarily in the middle and upper portions of the specimens, producing a barrel-shaped profile. These features suggest that deformation in most freeze–thaw-treated specimens is more broadly distributed rather than concentrated along a single shear band. The observed transition from localized shear failure to diffuse bulging is consistent with the shift from strain-softening to strain-hardening behavior.
Figure 6.
Specimens exhibiting partial shear failure.
3.2. Shear Strength
In this study, the peak shear stress was taken as the shear strength (qu) for strain-softening specimens, whereas the shear stress at 15% axial strain was defined as the peak strength. It should be noted that the tests were conducted without drainage; the shear strength reported in this study is expressed in terms of total stress rather than effective stress.
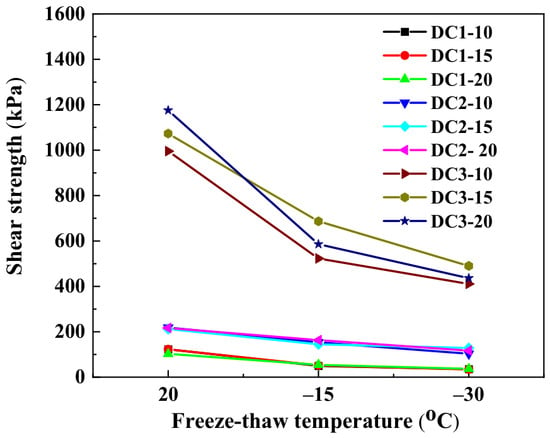
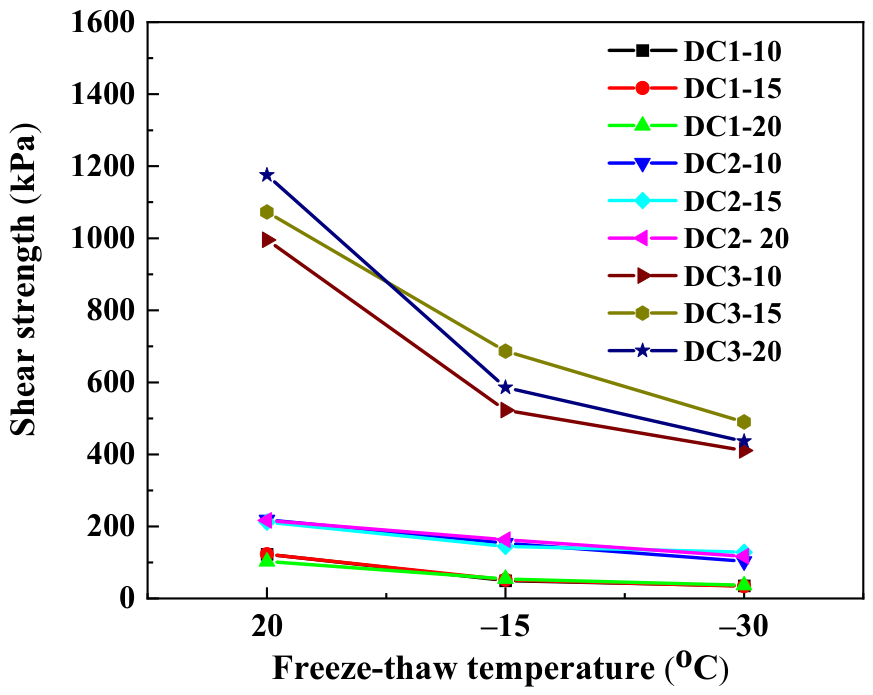
Figure 7 presents the shear strength of deep clay before and after freeze–thaw under different confining pressures. In this figure, 20 °C denotes tests conducted on unfrozen soil at 20 °C, whereas −15 °C and −30 °C denote the freezing temperatures used during treatment. It is noted that the shear strength of deep clay decreases significantly after freeze–thaw treatment. A lower freezing temperature leads to a greater reduction in shear strength, whereas no clear effect of confining pressure on the strength-reduction ratio was observed under the tested conditions. Statistical results show that at a freezing temperature of −15 °C, the shear strength of groups DC1, DC2 and DC3 decreases by 55%, 29% and 45%, respectively, compared with the unfrozen soil. At a freezing temperature of −30 °C, the shear strength of groups DC1, DC2 and DC3 is reduced by 69%, 46% and 59%, respectively. Under the experimental conditions, the high IL clay exhibits the greatest reduction in shear strength, followed by the low IL clay, whereas the medium IL clay shows the smallest reduction.
Figure 7.
Effect of high-pressure freeze–thaw on shear strength.
For the same group of specimens subjected to identical freeze–thaw cycles, the shear strength shows no obvious increasing trend with the rise in confining pressure, according to the Mohr–Coulomb failure criterion written in terms of principal stresses for triaxial compression.
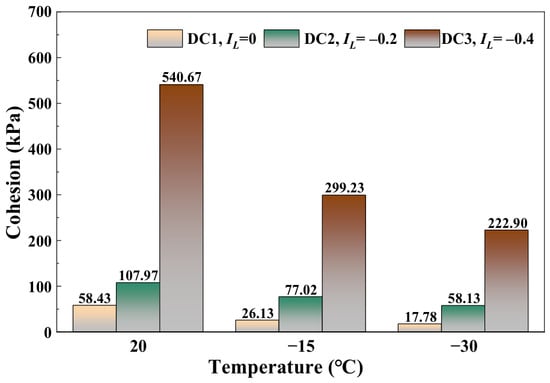
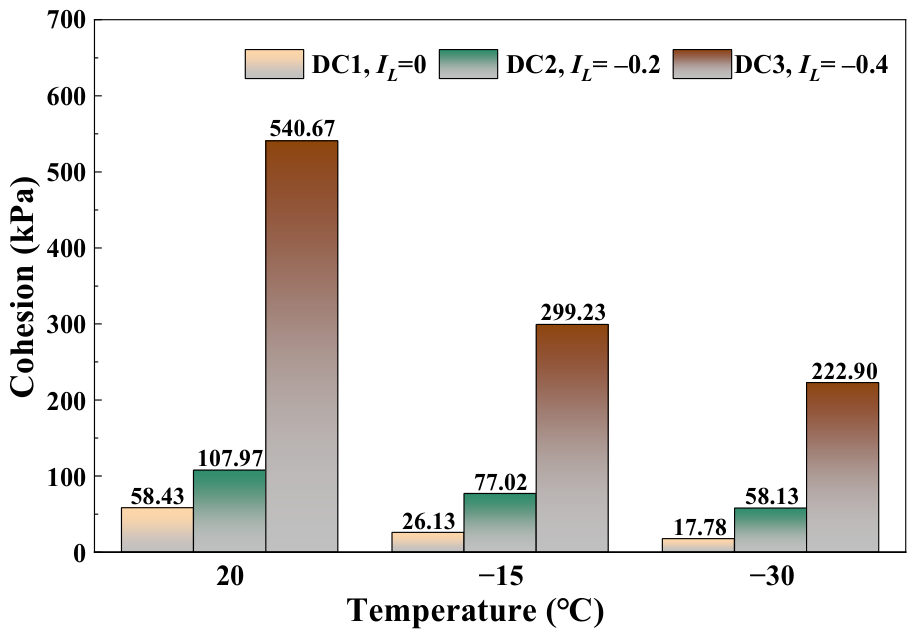
Here, σ1 is the major principal stress at failure; σ3 is the minor principal; c is cohesion; and φ is the internal friction angle. Based on the results of triaxial shear tests, the axial stress and confining pressure at failure were fitted, and the internal friction angle under each test condition was calculated using Equation (1), as summarized in Table S1 of the Supplementary Materials. As shown in this table, the internal friction angle is approximately zero. The value qu/2 is reported as a total-stress undrained cohesion index (cu). Figure 8 shows this index cu for deep clay before and after freeze–thaw. The reduction in cu indicates weakening under the specified total-stress and thermal histories. Lower freezing temperatures and higher initial water contents generally correspond to a greater reduction in cu.
Figure 8.
Variation in cohesion with freezing temperature and liquidity index.
The results provide a quantitative basis for frozen-wall design and for evaluating shaft stability after frozen-wall thawing. Under the condition that the bearing capacity and stability of the frozen wall are satisfied, the freezing temperature should be reasonably regulated to reduce the disturbance to the deep clay and limit the post-thaw loss of shear strength, especially in high-liquidity-index clay layers.
3.3. Elastic Modulus
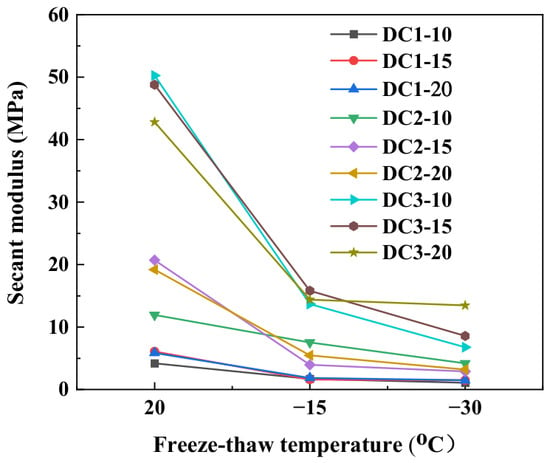
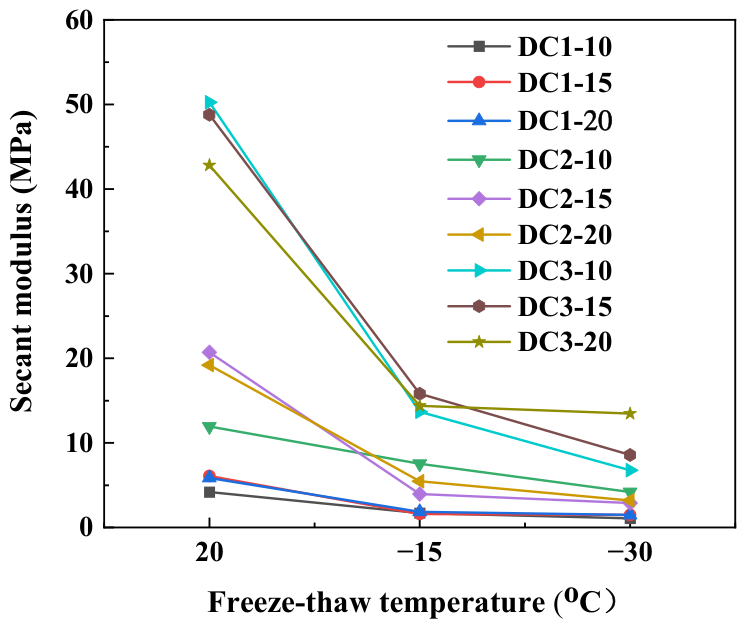
In this study, the elastic modulus is defined as the ratio of stress increment to strain increment at 1% strain. Figure 9 shows the elastic modulus of deep clay before and after freeze–thaw treatment. The elastic modulus decreases remarkably after freeze–thaw treatment. The elastic modulus drops by 0.58–0.93 at a freezing temperature of −15 °C, and to 0.68–0.94 at −30 °C. Even a single freeze–thaw cycle can induce substantial structural damage to the deep clay, leading to considerable degradation of its cohesion and bearing capacity.
Figure 9.
Effect of high-pressure freeze–thaw treatment on the elastic modulus of the deep clay.
Therefore, the stability assessment of the shaft wall should not rely solely on a single macroscopic indicator, such as total porosity. Instead, it should fully account for freeze–thaw-induced particle contact damage and cohesion degradation [37]. In engineering design, lower freezing temperatures, clay with a high liquidity index, and a single-thaw condition should be regarded as relatively unfavorable scenarios. The minimum temperature of the frozen wall should be reasonably controlled to mitigate the freeze–thaw-induced structural damage in deep clay layers. These considerations can provide a reference for predicting ground deformation during the thawing stage and for the optimization of shaft wall support parameters.
3.4. Particle Size Variation
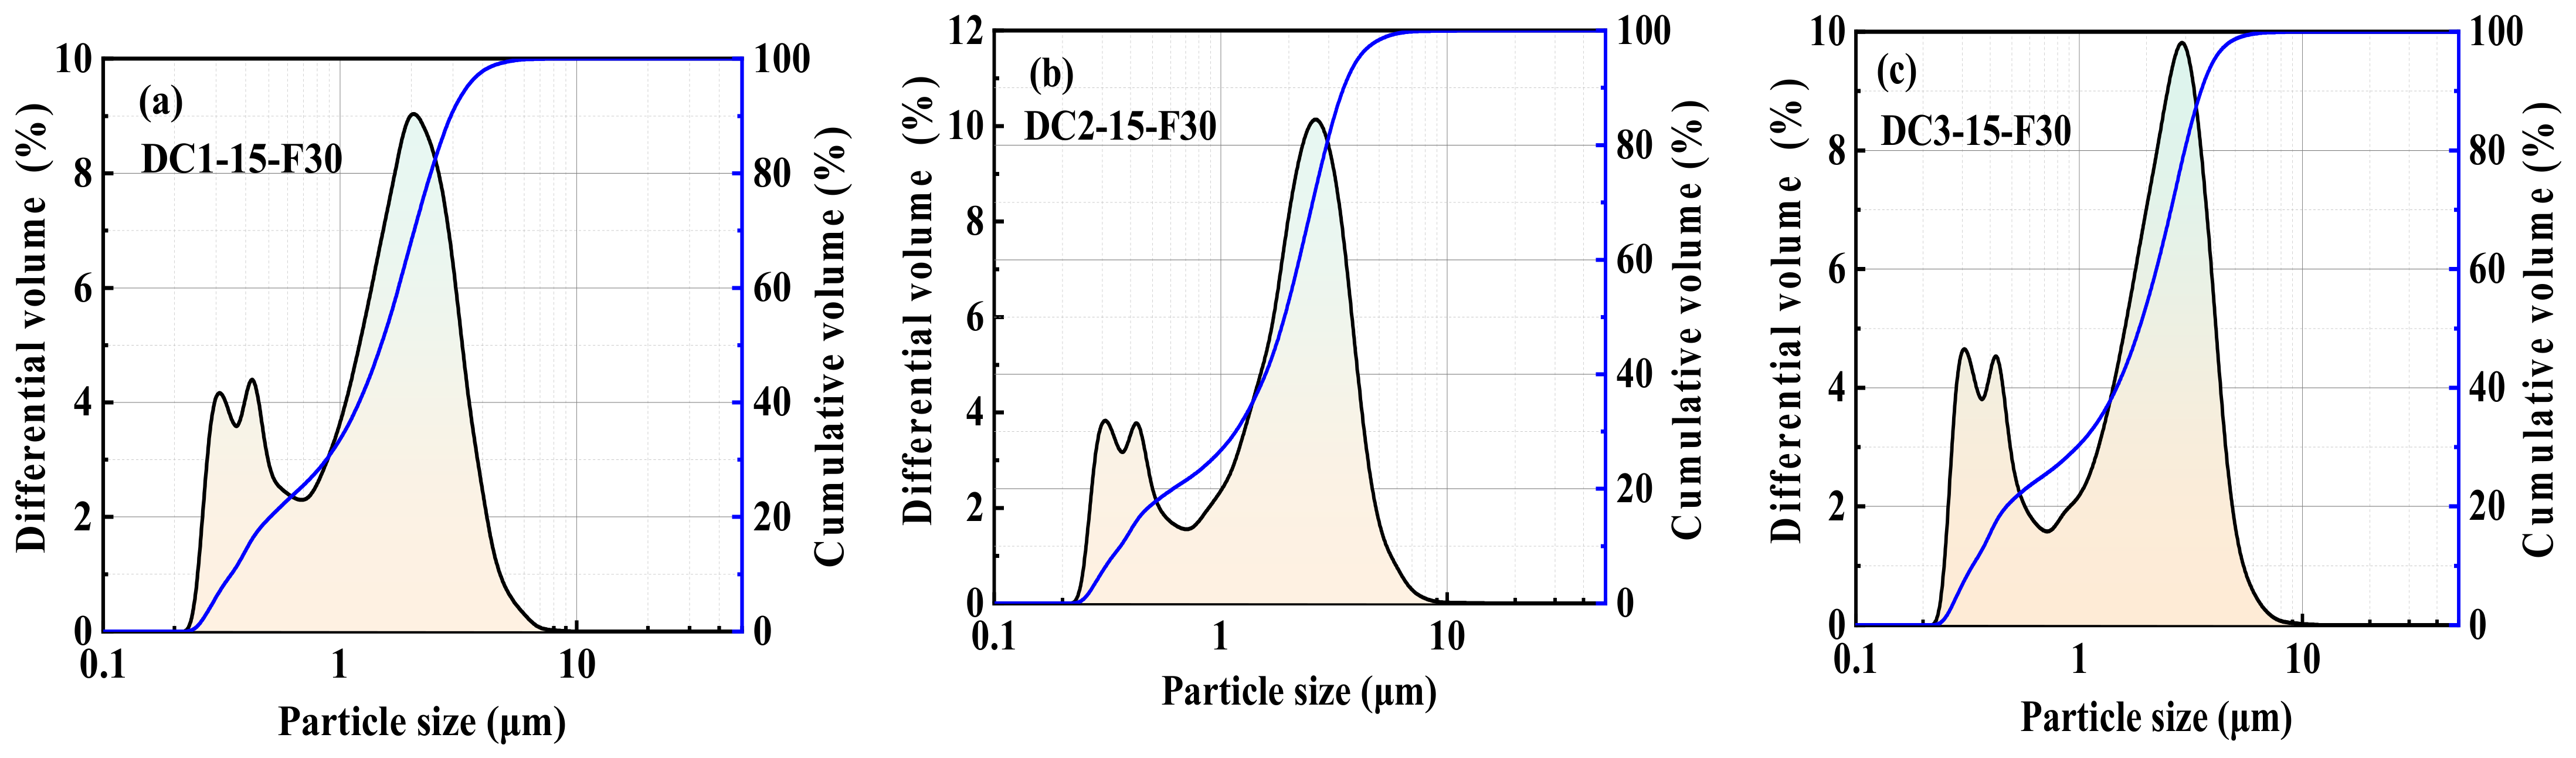
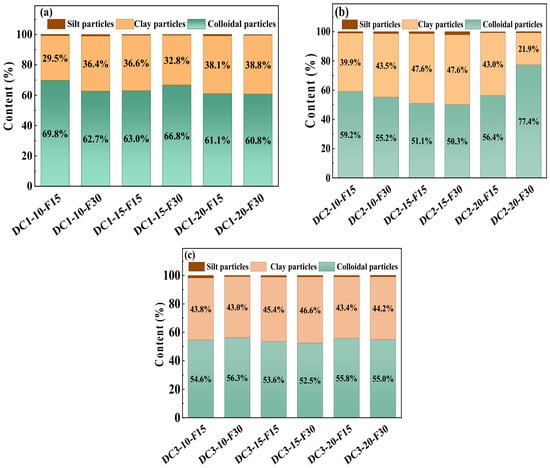
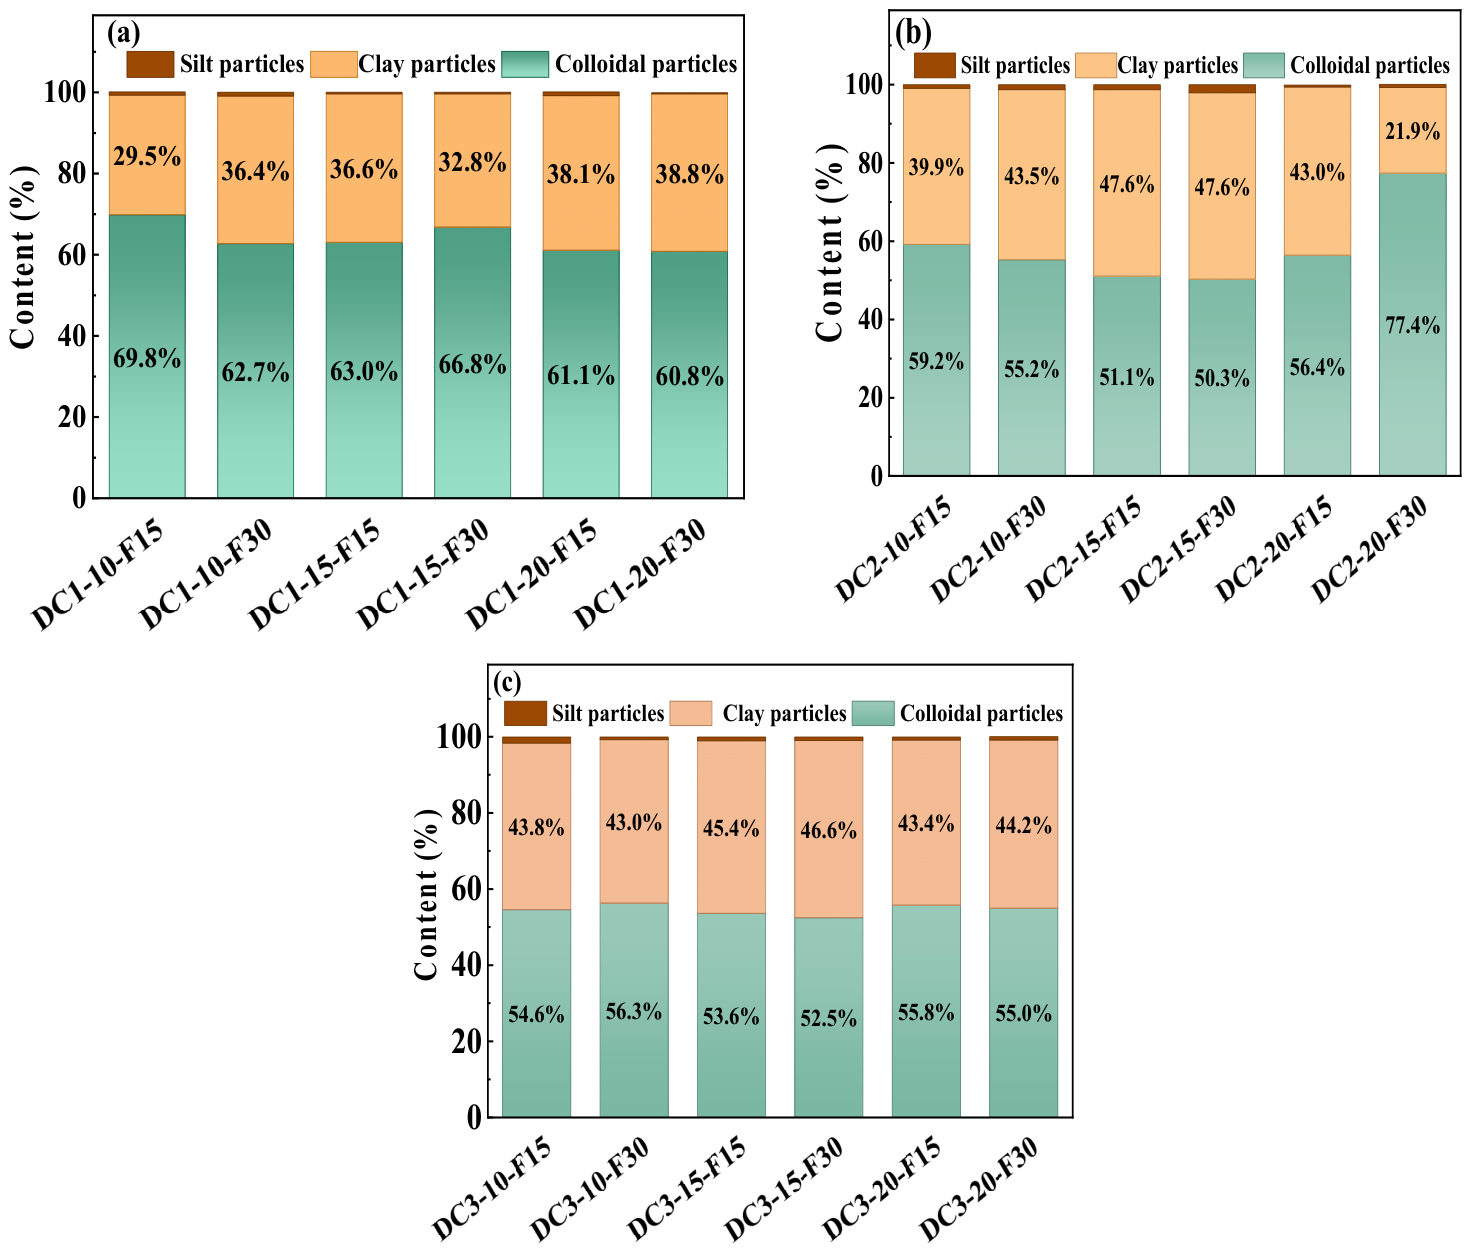
The typical particle-size distribution curves of deep clay after freeze–thaw treatment are presented in Figure 10, and curves for the remaining specimens are shown in Figure S2. The particle-size distributions range from 0.2 μm to 11 μm, and three peaks can be observed in the distribution curves. Figure 11 displays the volumetric fractions of colloidal, clay and silt particles after freeze–thaw. No consistent dependence of the particle fraction on freezing temperature or confining pressure was observed within the tested range.
Figure 10.
Particle-size distribution curves of representative specimens after freeze–thaw treatment.
Figure 11.
Particle-size distribution of the deep clay after high-pressure freeze–thaw: (a) group DC1; (b) group DC2; (c) group DC3.
In the initial state, the deep clay contains 59.3% colloidal fraction, 34.5% clay fraction and 6.2% silt fraction. Statistical results show that after freeze–thaw treatment, the average contents of colloidal particles, clay particles, and silt particles in the low IL clay (group DC3) are 54.6%, 44.3%, and 1.0%, respectively. Those of the three particle fractions in the middle IL clay (group DC2) are 58.3%, 40.6%, and 1.1%, respectively. In the high IL clay (group DC1) after freeze–thaw, the contents of the three particle fractions are 64.0%, 35.4%, and 0.62%, respectively. It is evident that the silt fraction decreases markedly while the clay fraction increases after freeze–thaw.
3.5. Porous Structure Analysis
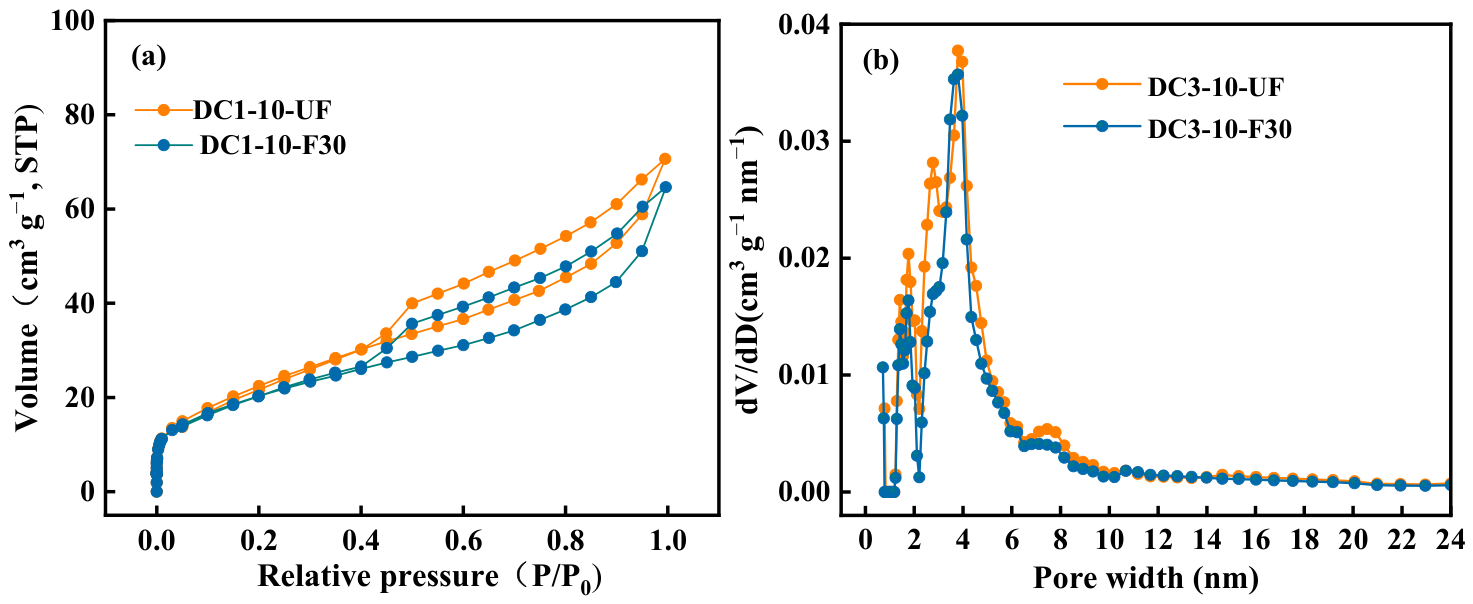
The representative adsorption–desorption isotherms of deep clay before and after freeze–thaw treatment are shown in Figure 12, and those for the remaining specimens are presented in Figure S3. The adsorption isotherm exhibits an S-shaped profile. At low relative pressures (p/p0 < 0.05), the adsorption capacity increases rapidly and the adsorption curve is slightly convex upward. In the transitional range (p/p0 = 0.05–0.80), the adsorption capacity increases gradually, whereas in the high-pressure range (p/p0 > 0.80), the adsorption capacity rises sharply. The adsorption and desorption branches begin to diverge at a relative pressure of approximately 0.45, forming a distinct hysteresis loop. The desorption branch exhibits a pronounced drop in adsorbed volume as the relative pressure approaches approximately 0.50. According to the classification of adsorption–desorption isotherms proposed by IUPAC [38], the adsorption–desorption isotherms of the clay obtained in this study belong to Type H3, which is associated with aggregates of platy particles and corresponds to a network of slit-shaped pores formed by the stacking of numerous particles [27].
Figure 12.
Pore structure changes in representative specimens before and after freeze–thaw treatment. (a) N2 adsorption–desorption isotherms; (b) pore-size distribution curves.
Previous studies have shown that freeze–thaw treatment can modify clay pore-size distributions (PSDs) through particle rearrangement, pore closure, and the development or enlargement of micro-voids [19,39]. The PSD of the representative specimens before and after freeze–thaw treatment was analyzed using the DFT model (Figure 12b). The results indicate that the PSD of the deep clay presents a multimodal and skewed distribution. The pore sizes are mainly concentrated in the range of 2–10 nm, with the primary peak located in the 3–5 nm range, representing the dominant pore size interval. Freeze–thaw action primarily affects the mesopore structure within the 2–10 nm range, as evidenced by changes in the proportion of pore volume in this interval, whereas mesopores larger than 20 nm remain nearly unchanged. This suggests that freeze–thaw treatment does not substantially change the dominant slit-shaped pore morphology under the present test conditions.
Table 2 summarizes the pore structure parameters of the groups before and after freeze–thaw treatment. Under loaded freeze–thaw conditions, the specific surface area of the deep clay decreases while the average pore size increases. The specific surface areas of DC1-10-F30, DC2-10-F30, and DC3-10-F30 decrease by 12.9%, 9.9%, and 22.8%, respectively. In addition, the average pore sizes of DC1-10-F30, DC2-10-F30, and DC3-10-F30 increase by 5.8%, 13.7%, and 6.3%, respectively. Compared with DC1-10-UF, DC1-10-F30 exhibits a 20.0% increase in micropore volume and an 11.6% decrease in mesopore volume. Compared with DC2-10-UF, DC2-10-F30 shows an 8.3% decrease in micropore volume and a 2.5% increase in mesopore volume. Compared with DC3-10-UF, the micropore and mesopore volumes of DC3-10-F30 decrease by 20.0% and 16.3%, respectively. Freeze-induced expansive stress may alter the pre-existing interparticle voids and generate microcracks, thereby modifying the pore volume [40].
Table 2.
Statistical table of pore microparameters of each specimen.
3.6. Mechanism of Freeze–Thaw-Induced Structural Damage
By combining the particle size and pore structure observations before and after freeze–thaw, the deep clay generally displays particle refinement and an increase in mean pore diameter after high-pressure freeze–thaw. However, specimens with different initial liquidity indices and densities exhibit distinct microstructural evolution behaviors. These results indicate that the effect of high-pressure freeze–thaw on deep clay cannot be attributed simply to pore and fracture expansion.
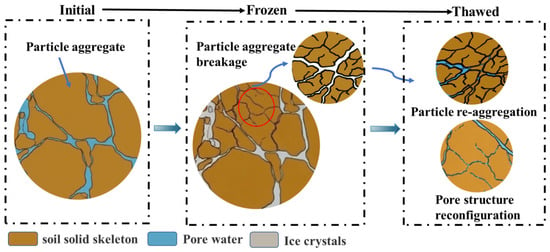
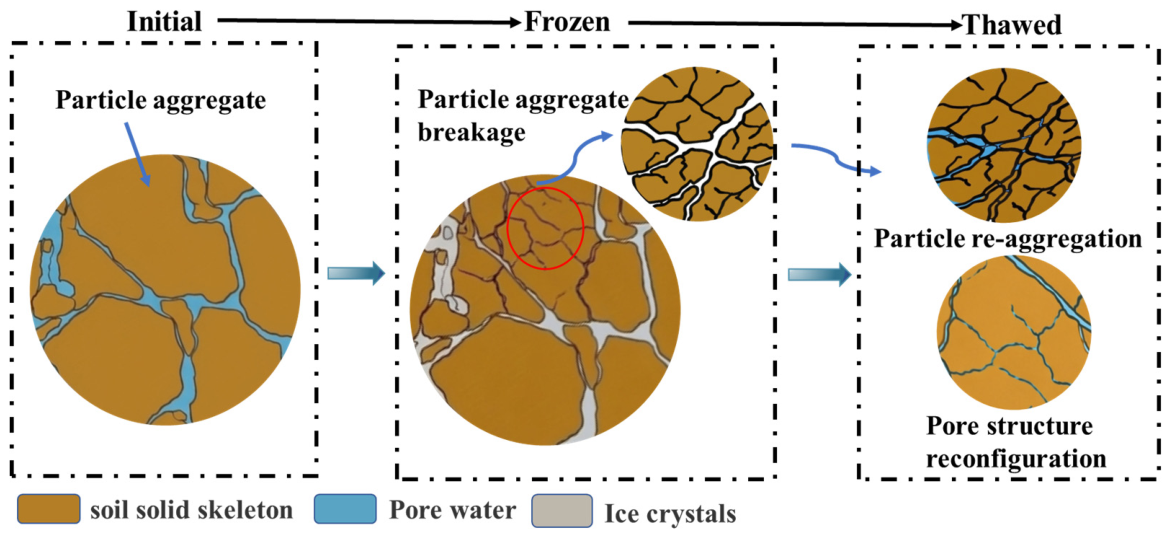
From a thermodynamic perspective, high pressure affects the ice–water phase transition of deep clay and depresses its freezing temperature at a rate of 0.0775 °C/MPa [41]. It also influences water migration and segregated-ice formation [42]. From a macromechanical perspective, although high pressure mitigates frost-heave deformation, it can nevertheless cause non-uniform densification and deformation of the soil skeleton under frost-heave pressure [43]. Zhou et al. [44] conducted loaded freeze–thaw cycle tests on saturated silt. They found that freeze–thaw action causes the breakage of 60–200 μm particles and the aggregation of clay particles, and argued that pore-water phase change produces ice-wedging force, which dominates particle breakage–aggregation during soil freezing. As shown in Figure 13, under high stress, the overburden pressure may exceed the maximum frost-heave pressure, thereby inhibiting the initiation of segregated ice lenses and suppressing the volumetric expansion of pores and fractures. Ice crystal growth triggers local stress concentration and weakens the inherent interparticle cementation, and the resulting ice-induced splitting disintegrates and refines particle aggregates [45,46]. After thawing, the loss of ice cementation allows particles to rearrange and the pore structure to reorganize [47].
Figure 13.
High-pressure freeze–thaw damage mechanism in the deep clay.
Among the three deep-clay specimens examined in this study, group DC1 has the highest void ratio and liquidity index. Following a single freeze–thaw cycle, the silt fraction decreases by 5.6 percentage points, while the colloidal fraction increases by 4.7 percentage points. These changes may be consistent with particle fragmentation and pore-structure reorganization, and ice-induced splitting is hypothesized as a possible dominant mechanism in group DC1. Group DC3 has the lowest water content and the densest fabric. Following a freeze–thaw cycle, its clay fraction increases by 9.8 percentage points, while both the micropore and mesopore volumes decrease markedly. The particle-size redistribution could reflect the fragmentation of silt-sized particles and the aggregation of colloidal particles, while the reduction in measured pore volumes may be associated with local compaction or changes in pore accessibility. Taken together, these observations suggest that ice-induced splitting and local compaction may have concurrently operated in group DC3. Group DC2, which has intermediate density and water content, exhibits comparatively small changes in particle-size distribution, which may imply less extensive particle fragmentation and aggregation.
The observed changes in particle-size distribution and pore structure during high-pressure freeze–thaw may be associated with modifications to interparticle contacts and bonding, which could potentially contribute to the loss of soil strength. Group DC1 exhibits the greatest strength reduction, ranging from 55% to 69%, together with a shift toward finer particle sizes and an increase in micropore volume. This combination supports the hypothesis that ice-induced splitting may contribute to particle fragmentation and disruption of the load-bearing soil skeleton. Group DC3 exhibits strength reductions of 45–59%. Its particle-size redistribution and decreases in micropore and mesopore volumes may reflect the combined effects of splitting and local compaction. Group DC2 shows comparatively limited changes in particle-size distribution and pore structure, accompanied by the smallest strength reductions of 29–46%.
4. Conclusions
Taking deep remolded clay from the Juye mining area in Shandong Province as the research object, a low-temperature triaxial testing system was employed to simulate the high in situ stress environment. High-pressure freeze–thaw tests under different liquidity indices, confining pressures, and temperatures, as well as UU triaxial shear tests, were conducted. Combined with the particle size and pore structure analyses, the macroscopic mechanical responses and microstructural damage evolution mechanisms of deep clay subjected to high-pressure freeze–thaw treatment were investigated. The main conclusions are summarized as follows:
- (1)
- The unfrozen deep clay exhibits strain-softening behavior, with a visible shear plane after failure. Following one freeze–thaw cycle under load, most specimens exhibit a transition to strain-hardening behavior, accompanied by a change in the observed failure morphology from a distinct shear plane to lateral bulging. Within the range of conditions tested, confining pressure has a relatively small effect on the deformation response, whereas freezing temperature and the initial state of the clay have more pronounced effects.
- (2)
- Freeze–thaw under loading significantly reduced the shear strength and elastic modulus of deep clay, with greater damage at lower freezing temperatures. Shear strength declined by 29–55% at −15 °C and 46–69% at −30 °C. Strength and stiffness degradation followed the order DC1 > DC3 > DC2. Within the tested conditions, no systematic effect of increasing confining pressure from 10 to 20 MPa on the strength-decay ratio was detected.
- (3)
- After freeze–thaw under high pressure, deep clay generally shows a reduction in silt fraction and an increase in clay fraction. A reduction in colloid fraction is found in clays of medium and low liquidity indices; an increase in colloid fraction occurs for high-liquidity-index clays. The variation in particle-size distribution shows no significant correlation with temperature and confining pressure.
- (4)
- Pores in deep clay are predominantly concentrated within 2–10 nm. Under 20 MPa confining pressure at −30 °C, freeze–thaw cycling reduces pore specific surface area and increases average pore diameter. This rise in average pore diameter does not merely reflect overall pore expansion but originates from freeze–thaw-induced redistribution of pore volume among different pore size intervals. Pronounced changes in pore-size distribution are observed for high IL and low IL clays.
- (5)
- The particle refinement, changes in particle-size distribution, and pore-structure reconstruction observed in this study suggest that freeze–thaw under high pressure may alter interparticle contacts and force transmission, induce weakening of interparticle bonding and interlocking, thereby degrading the mechanical properties of deep clay.
This study characterizes the evolution of total-stress strength of deep clay under high-pressure freeze–thaw. Using particle and pore characterization, we preliminarily explore how freeze–thaw modifies the mechanical properties of deep clay. Future work should examine pore-water pressure and long-term deformation of thawed deep clay under K0 conditions and different drainage regimes. SEM and NMR tests will be adopted to further uncover the influence mechanism of microstructural evolution on the macroscopic mechanical response of freeze–thaw deep clay.
Supplementary Materials
The following supporting information can be downloaded at: https://www.mdpi.com/article/10.3390/app162110486/s1, Figure S1: self-fabricated vacuum specimen preparation apparatus; Figure S2: particle-size distribution curves of the remaining specimens after freeze–thaw treatment; Figure S3: pore structure changes in the remaining specimens before and after freeze–thaw treatment. (a,b) N2 adsorption–desorption isotherms; (c,d) pore-size distribution curves; Table S1: internal friction angles fitted from the Mohr–Coulomb failure criterion.
Author Contributions
Conceptualization, H.L. and T.Z.; methodology, H.L. and Y.R.; investigation, T.Z. and C.Y.; data curation, Y.R. and C.Y.; writing—original draft preparation, T.Z. and C.Y.; writing—review and editing, H.L.; visualization, C.Y. and W.K.; funding acquisition, H.L. All authors have read and agreed to the published version of the manuscript.
Funding
This work was financially supported by the National Natural Science Foundation of China (Grant No. 41771072).
Institutional Review Board Statement
Not applicable.
Informed Consent Statement
Not applicable.
Data Availability Statement
The original contributions presented in this study are included in the article. Further inquiries can be directed to the corresponding author.
Acknowledgments
The authors extend their gratitude to the Analysis and Testing Center at China University of Mining and Technology for their assistance with the experimental testing.
Conflicts of Interest
Author Tong Zhang was employed by the company China Chemical Civil Engineering Co. The remaining authors declare that the research was conducted in the absence of any commercial or financial relationships that could be construed as a potential conflict of interest.
References
- Yang, W.; Li, W.; Wang, Y.; Meng, X.; Yang, Z.; Ren, Y.; Zhang, Y. Development and prospect of artificial ground freezing technology for vertical mine shafts in China. J. China Coal Soc. 2025, 50, 4707–4728. [Google Scholar]
- Novikov, F.Y. Pressure of thawing soils on the concrete lining of vertical mine shafts. Eng. Geol. 1979, 13, 277–286. [Google Scholar] [CrossRef] [Scilit]
- Wang, M.; Yao, X.; Zhang, J. New problem in the design of wall seats of freezing shaft lining in deep shafts—Negative friction. J. China Coal Soc. 1982, 2, 48–54. [Google Scholar]
- Fu, H. Experimental study on additional thaw-settlement force of single pile in saturated soil. Rock Soil Mech. 2004, 25, 1447–1450. [Google Scholar]
- Zhang, Y.; Qu, Y. Study on the engineering properties and engineering-environmental effects of Neogene hard clays in south-western of Shandong province. Chin. J. Geotech. Eng. 2000, 22, 445–449. [Google Scholar]
- Xu, Y. Mechanics characteristics of deep saturated clay. J. China Coal Soc. 2004, 29, 26–30. [Google Scholar]
- Lin, Y.; Huang, Z.; Jiang, Z. Investigation of physical and mechanical properties of clay soils around deep shafts. Bull. Eng. Geol. Environ. 2023, 82, 221. [Google Scholar] [CrossRef] [Scilit]
- Wang, Y.; Cheng, J.; Xue, L.; Ren, Y.; Yang, Z.; Li, J. In-situ measurements and analysis of frost-heave pressure inside and outside the ice wall during freeze sinking. J. China Univ. Min. Technol. 2009, 38, 303–308. [Google Scholar]
- Wang, R.; Zhang, R.; Li, D. Formation and thawing processes of a multi coil pipe’s frozen wall. J. Glaciol. Geocryol. 2010, 32, 538–542. [Google Scholar]
- Leroueil, S.; Tardif, J.; Roy, M.; La Rochelle, P.; Konrad, J.-M. Effects of frost on the mechanical behaviour of Champlain Sea clays. Can. Geotech. J. 1991, 28, 690–697. [Google Scholar] [CrossRef] [Scilit]
- Lee, W.; Bohra, N.; Altschaeffl, A.; White, T. Resilient modulus of cohesive soils and the effect of freeze-thaw. Can. Geotech. J. 1995, 32, 559–568. [Google Scholar] [CrossRef] [Scilit]
- Qi, J.; Ma, W.; Song, C. Influence of freeze-thaw on engineering properties of a silty soil. Cold Reg. Sci. Technol. 2008, 53, 397–404. [Google Scholar] [CrossRef] [Scilit]
- Zhou, Z.; Ma, W.; Zhang, S.; Mu, Y.; Li, G. Effect of freeze-thaw cycles in mechanical behaviors of frozen loess. Cold Reg. Sci. Technol. 2018, 146, 9–18. [Google Scholar] [CrossRef] [Scilit]
- Liu, J.K.; Peng, L.Y. Experimental study on the unconfined compression of a thawing soil. Cold Reg. Sci. Technol. 2009, 58, 92–96. [Google Scholar] [CrossRef] [Scilit]
- Guo, H.T.; Xin, S.C.; Sun, C.; Jiang, S. Experimental study and prediction of the effects of freeze-thaw times and freeze tempera tures on the mechanical characteristics of silty clays. Meas. Sci. Technol. 2026, 37, 165802. [Google Scholar] [CrossRef] [Scilit]
- Wang, D.-Y.; Ma, W.; Niu, Y.-H.; Chang, X.-X.; Wen, Z. Effects of cyclic freezing and thawing on mechanical properties of Qinghai–Tibet clay. Cold Reg. Sci. Technol. 2007, 48, 34–43. [Google Scholar] [CrossRef] [Scilit]
- Wang, M.; Meng, S.J.; Sun, Y.Q.; Fu, H.Q. Shear strength of frozen clay under freezing-thawing cycles using triaxial tests. Earthq. Eng. Eng. Vib. 2018, 17, 761–769. [Google Scholar] [CrossRef] [Scilit]
- Wu, D.; Wang, C.; Liu, H.; Liu, X. Effect of freeze-thaw cycles on mechanical properties of compacted volcanic ash. Constr. Build. Mater. 2023, 369, 130637. [Google Scholar] [CrossRef] [Scilit]
- Zhou, J.; Tang, Y. Experimental inference on dual-porosity aggravation of soft clay after freeze-thaw by fractal and probability analysis. Cold Reg. Sci. Technol. 2018, 153, 181–196. [Google Scholar] [CrossRef] [Scilit]
- Zou, W.L.; Ding, L.Q.; Han, Z.; Wang, X.Q. Effects of freeze-thaw cycles on the moisture sensitivity of a compacted clay. Eng. Geol. 2020, 278, 105832. [Google Scholar] [CrossRef] [Scilit]
- Zeinali, S.M.; Abdelaziz, S.L. Microstructural evolution of saturated normally consolidated kaolinite clay under thermal cycles. Eng. Geol. 2023, 318, 107101. [Google Scholar] [CrossRef] [Scilit]
- Liu, J.P.; Yang, P.; Yang, Z.H. Experimental study on deformation characteristics of chloride silty clay during freeze-thaw in an open system. Cold Reg. Sci. Technol. 2022, 197, 103518. [Google Scholar] [CrossRef] [Scilit]
- Dalla Santa, G.; Cola, S.; Secco, M.; Tateo, F.; Sassi, R.; Galgaro, A. Multiscale analysis of freeze–thaw effects induced by ground heat exchangers on permeability of silty clays. Géotechnique 2019, 69, 95–105. [Google Scholar] [CrossRef] [Scilit]
- Liu, B.; Ma, R.; Fan, H. Evaluation of the impact of freeze-thaw cycles on pore structure characteristics of black soil using X-ray computed tomography. Soil Tillage Res. 2021, 206, 104810. [Google Scholar] [CrossRef] [Scilit]
- Shen, J.; Wang, Q.; Chen, Y.; Han, Y.; Zhang, X.; Liu, Y. Evolution process of the microstructure of saline soil with different compaction degrees during freeze-thaw cycles. Eng. Geol. 2022, 304, 106699. [Google Scholar] [CrossRef] [Scilit]
- Han, M.; Peng, W.; Ma, B.; Yu, Q.; Kasama, K.; Furukawa, Z.; Niu, C.; Wang, Q. Micro-composition evolution of the undisturbed saline soil undergoing different freeze-thaw cycles. Cold Reg. Sci. Technol. 2023, 210, 103825. [Google Scholar] [CrossRef] [Scilit]
- Fan, W.H.; Yang, P.; Yang, Z.H. Freeze-thaw impact on macropore structure of clay by 3D X-ray computed tomography. Eng. Geol. 2021, 280, 105921. [Google Scholar] [CrossRef] [Scilit]
- Zheng, F.; Shao, S.; Wang, S. Effect of freeze-thaw cycles on the strength behaviour of recompacted loess in true triaxial tests. Cold Reg. Sci. Technol. 2021, 181, 103172. [Google Scholar] [CrossRef] [Scilit]
- Zhao, L.; Peng, J.; Ma, P.; Leng, Y.; Ma, Z. Microstructure response to shear strength deterioration in loess after freeze-thaw cycles. Eng. Geol. 2023, 323, 107229. [Google Scholar] [CrossRef] [Scilit]
- Fan, W.; Yang, P.; Wang, S.; Yang, Z.; Fan, X.; Tao, Y. Freeze-thaw effects on pore structure of clay by 3D X-ray computed tomography and mercury intrusion porosimetry. Cold Reg. Sci. Technol. 2024, 225, 104276. [Google Scholar] [CrossRef] [Scilit]
- Gao, C.; Guo, Y.; Han, Y.; Xu, L. Microstructure evolution and permeability of fine-grained loess subjected to freeze-thaw cycles. Eng. Geol. 2025, 357, 108326. [Google Scholar] [CrossRef] [Scilit]
- GB/T 50123–2019; Standard for Geotechnical Testing Method. China Planning Press: Beijing, China, 2019. (In Chinese)
- Assallay, A.M.; Rogers, C.D.F.; Smalley, I.J.; Jefferson, I.F. Silt: 2–62 μm, 9–4φ. Earth Sci. Rev. 1998, 45, 61–88. [Google Scholar] [CrossRef] [Scilit]
- Jiang, C.; Sequaris, J.-M.; Vereecken, H.; Klumpp, E. Effects of temperature and associated organic carbon on the fractionation of water-dispersible colloids from three silt loam topsoils under different land use. Geoderma 2017, 299, 43–53. [Google Scholar] [CrossRef] [Scilit]
- Cui, G. Loading of shaft lining for deep alluviam. Chin. J. Geotech. Eng. 2003, 25, 294–298. [Google Scholar]
- Scott, I.S.P.C.; Nouwakpo, K.; Bjorneberg, D.; Rogers, C.; Vitko, L. Establishing a standard protocol for soil texture analysis using the laser diffraction technique. Soil Sci. Soc. Am. J. 2024, 88, 1691–1708. [Google Scholar] [CrossRef] [Scilit]
- Chen, Q.; Ghimire, B.; Su, L.; Liu, Y. Micro-scale investigations on the mechanical properties of expansive soil subjected to freeze–thaw cycles. Cold Reg. Sci. Technol. 2024, 219, 104128. [Google Scholar] [CrossRef] [Scilit]
- Thommes, M.; Kaneko, K.; Neimark, A.V.; Olivier, J.P.; Rodriguez-Reinoso, F.; Rouquerol, J.; Sing, K.S.W. Physisorption of gases, with special reference to the evaluation of surface area and pore size distribution (IUPAC Technical Report). Pure Appl. Chem. 2015, 87, 1051–1069. [Google Scholar] [CrossRef] [Scilit]
- Lu, Y.; Liu, S.; Weng, L.; Wang, L.; Li, Z.; Xu, L. Fractal analysis of cracking in a clayey soil under freeze–thaw cycles. Eng. Geol. 2016, 208, 93–99. [Google Scholar] [CrossRef] [Scilit]
- Konrad, J.M. Physical processes during freeze–thaw cycles in clayey silts. Cold Reg. Sci. Technol. 1989, 16, 291–303. [Google Scholar] [CrossRef] [Scilit]
- Guan, H.; Wang, S.; Wang, Y.; Wang, K.; Wei, M. Experimental study on freezing point of deep clay under high external load conditions. Cold Reg. Sci. Technol. 2023, 205, 103696. [Google Scholar] [CrossRef] [Scilit]
- Ji, Y.; Zhou, G.; Hall, M.R.; Vandeginste, V.; Zhao, X. Thermal-hydraulic-mechanical coupling research on overburden pressure mitigated ice lens growth in the freezing soil. KSCE J. Civ. Eng. 2022, 26, 1606–1617. [Google Scholar] [CrossRef] [Scilit]
- Hao, X.; Ma, W.; Feng, W.; Wen, Z.; Zhang, L.; Chen, S. Investigation on the frost heave-induced pressure and hydro-thermal processes in freezing soil under rigid constraint and hydraulic pressure. Eng. Geol. 2023, 323, 107238. [Google Scholar] [CrossRef] [Scilit]
- Zhou, J.; Li, Z.; Pei, W. The Quantification and evolution of particle characteristics of saturated silt under freeze–thaw cycles. Appl. Sci. 2022, 12, 10703. [Google Scholar] [CrossRef] [Scilit]
- Rempel, A.W. Formation of ice lenses and frost heave. J. Geophys. Res. Earth Surf. 2007, 112, F02S21. [Google Scholar] [CrossRef] [Scilit]
- Wang, Z.; Zhang, Y.; Zhang, C.; Li, B. Revealing the melting mechanism of segregated ice in frozen soil based on visualizing mass transfer dynamics. Cold Reg. Sci. Technol. 2025, 239, 104558. [Google Scholar] [CrossRef] [Scilit]
- Dash, J.G.; Rempel, A.W.; Wettlaufer, J.S. The physics of premelted ice and its geophysical consequences. Rev. Mod. Phys. 2006, 78, 695–741. [Google Scholar] [CrossRef] [Scilit]


Disclaimer/Publisher’s Note: The statements, opinions and data contained in all publications are solely those of the individual author(s) and contributor(s) and not of MDPI and/or the editor(s). MDPI and/or the editor(s) disclaim responsibility for any injury to people or property resulting from any ideas, methods, instructions or products referred to in the content. |
© 2026 by the authors. Licensee MDPI, Basel, Switzerland. This article is an open access article distributed under the terms and conditions of the Creative Commons Attribution (CC BY) license.