


Abstract
Recycled nutrient fertilizers (RNFs) derived from organic and industrial waste streams offer a promising approach to nutrient recovery and sustainable agricultural production. However, their agronomic performance and the potential benefits of enrichment with biologically active, waste-derived materials remain insufficiently understood. This study evaluated two multi-component RNFs, four-ingredient pellets, first with biochar (BADSS) and second with bovine shavings (SADSS), with and without enrichment using chitosan-containing seafood waste, in a four-month greenhouse experiment with ryegrass across nitrogen application rates ranging from 20 to 370 kg N ha−1. Biomass production, nitrogen uptake, agronomic effectiveness (AE), apparent nitrogen recovery (ANR), soil chemical properties, and photosystem II efficiency were assessed. The results demonstrated that fertilizer performance depended strongly on matrix composition and nitrogen application rate. BADSS induced a stronger increase in residual soil pH, whereas SADSS maintained more balanced soil conditions. Chitosan enrichment enhanced long-term nitrogen uptake and biomass production when combined with SADSS, while its effects in the BADSS matrix were less consistent, particularly at excessive nitrogen inputs. Correcting fertilizer performance for additional nitrogen introduced with the chitosan-containing amendment substantially reduced apparent AE and ANR, highlighting the importance of complete nutrient accounting when assessing enriched fertilizers. Overall, the findings indicate that seafood-waste-derived chitosan can improve the agronomic performance of recycled nutrient fertilizers, although its effectiveness depends on the composition of the fertilizer matrix and the applied nitrogen rate. Integrating seafood-processing residues into waste-derived fertilizer systems offers a promising strategy for valorizing underutilized resources, improving nutrient management, and supporting circular bioeconomy approaches to sustainable agriculture.
1. Introduction
Chitin and its deacetylated derivative chitosan—readily recovered from seafood processing residues—have gained prominence as multifunctional boosters in plant-growth studies: they act as biostimulants (promoting root growth and nutrient uptake), elicitors of defense responses, carriers for nutrient slow-release, and soil conditioners that modify rhizosphere chemistry and microbial activity [1]. Applied as raw seafood waste, processed chitin/chitosan, or nano-/encapsulated formulations, these materials can accelerate mineralization of organic N sources, improve plant N and P acquisition when co-applied with waste-derived fertilizers, and reduce nutrient losses via controlled release or improved retention [2]. Recent mechanistic work shows that chitooligosaccharides and chitosan fragments function as plant elicitors and modulators of microbial communities—explaining observed yield and resilience gains in pot and field trials using recycled nutrient matrices. Concurrently, advances in green extraction and biorefinery processing of shrimp/crab shells are making high-quality chitin/chitosan from seafood waste more scalable and compatible with circular fertilizer strategies [3]. Reviews [4] of seafood-waste valorization highlight both agronomic promise and practical limits (process losses, heterogeneity, dosing, and potential salt/EC effects), underscoring the need to pair chitin/chitosan boosters with rigorous accounting of total nutrient inputs in RNF studies [5].
Studies that directly apply purified chitin/chitosan (commercial or lab-extracted) as plant biostimulants, seed coatings, or nanoparticle formulations far outnumber investigations that use raw seafood waste (e.g., ground shrimp/crab shells) as a direct donor of chitin/chitosan in plant-growth experiments. Reviews and meta-analyses show an extensive and growing literature on chitosan’s modes of action, formulation options, and agronomic trials [6]. By contrast, work on using unextracted shell waste as a soil amendment or compost ingredient is fewer, often case studies or valorization reports that focus on biorefinery pathways or safety (heavy metals/microbes) and not on the controlled agronomic trials [7,8]. There are two practical reasons for this skew. First, purified chitosan gives reproducible chemistry (defined MW, degree of deacetylation) needed in mechanistic and agronomic studies—so more researchers use it (see chitosan application reviews: [6]. Second, extraction/additional processing of shells adds cost, time, chemical wastes, and logistics (demineralization/deproteinization/deacetylation), which limits large-scale, standardized trials and commercial adoption (see [9], on extraction steps and drawbacks).
From a circular-economy perspective, this argues for more field trials and policy support for direct valorization routes (e.g., hygienized grinding, co-composting, in situ fermentation, or simple pelletization) that keep processing minimal while capturing the shells’ nutrient and chitin-related biostimulant value [7,8].
Most existing plant-growth studies investigating the biostimulatory effects of chitin and chitosan rely on purified or chemically extracted products, despite the fact that these polymers originate almost exclusively from seafood-processing waste. This methodological preference has produced a strong mechanistic knowledge base, but it has also created a disconnect between experimental research and realistic circular-economy implementation. Chemical extraction of chitin/chitosan requires multiple energy- and reagent-intensive steps (demineralization, deproteinization, deacetylation), generates secondary waste streams, and introduces substantial logistical and economic costs that limit scalability in agricultural systems. Consequently, many “effective” chitosan-based solutions remain technologically successful yet economically and environmentally fragile.
Soil microbiomes are rich in chitin-degrading organisms and enzymatic capacity, making raw seafood waste (shrimp/crab shells) a pragmatic, low-processing source of plant-active chitin derivatives when co-applied with recycled nutrient fertilizers (RNFs). Chitosan and chitooligosaccharides are well documented as plant biostimulants—promoting root growth, nutrient uptake, and stress resilience—when applied in purified or formulated forms (e.g., reviews on chitosan in cereals and crops: [10]. Instead of relying on energy- and reagent-intensive extraction chains, a circular-economy approach can exploit in situ microbial depolymerization: ubiquitous soil chitinases and chitinolytic bacteria/fungi rapidly hydrolyze shell chitin to bioactive oligomers that trigger plant responses and enhance rhizosphere nutrient cycling [11,12]. Recent applied work has explored direct uses of shrimp-shell residues as matrices for slow-release fertilizers and as substrates amenable to enzymatic/one-step microbial degradation, demonstrating feasible agronomic benefits while markedly reducing upstream processing costs and emissions compared with conventional chitin/chitosan production [13,14]. Life-cycle and technology assessments further highlight that conventional chitin/chitosan extraction is energy- and wastewater-intensive, constraining scalability, whereas low-processing valorization routes align better with decentralized RNF deployment and value-retention strategies [15,16]. Taken together, these lines of evidence justify testing shrimp-shell waste as a cost-efficient, microbiome-activated booster for ryegrass fertilized with multi-ingredient RNFs.
The present study is motivated by the premise that raw seafood waste can function as a biologically active carrier of chitin/chitosan, rather than merely a feedstock for extraction. Shrimp shells contain high concentrations of chitin embedded in a protein–mineral matrix that is naturally biodegradable in soil environments. Numerous soil microorganisms—including chitinolytic bacteria and fungi—possess enzymatic systems capable of depolymerizing chitin and converting it into chitooligosaccharides and glucosamine, which are the very compounds responsible for plant biostimulation and defense elicitation. Trusting this soil-microbiome-driven pre-degradation aligns with ecological nutrient-cycling principles and avoids the need to industrially “pre-digest” the material before field application. Coupling seafood waste with multi-ingredient recycled nutrient fertilizers (RNFs) further strengthens this rationale. RNFs already rely on microbial mineralization to synchronize nutrient release with plant demand; Introducing chitin-rich seafood waste is expected to stimulate chitinolytic and rhizosphere-associated microbial communities, enhance nutrient mineralization processes, and indirectly improve nitrogen and phosphorus use efficiency through intensified microbial activity and nutrient turnover [17,18,19,20]. In this context, shrimp shells act simultaneously as a waste-derived biostimulant source, a microbial substrate, and a structural carrier within recycled fertilizer matrices.
From a circular-economy perspective, this approach prioritizes maximum value retention with minimal processing, reduces dependence on chemical extraction chains, lowers costs and emissions, and promotes decentralized nutrient recycling. Scientifically, it challenges the assumption that purified inputs are necessary to achieve biological efficacy and instead tests whether soil biological complexity itself can unlock chitin/chitosan functionality. Demonstrating agronomic benefits under these conditions would provide strong evidence that raw seafood waste can be directly integrated into sustainable fertilization strategies, accelerating the transition from laboratory-optimized products to field-relevant circular solutions.
The aim of this study was to evaluate the agronomic performance and apparent nutrient recovery of pelleted multi-ingredient recycled nutrient fertilizers (RNFs), with and without shrimp-shell-derived chitosan enrichment, in a ryegrass pot experiment, and to assess their effects on biomass production, nitrogen uptake, fertilizer efficiency indicators, photosynthetic parameters, and selected soil chemical properties.
2. Materials and Methods
2.1. Experimental Design and Site Description
The effects of pelleted waste-based fertilizers and their chitosan enrichments on ryegrass growth were investigated in a pot-scale experiment carried out in a greenhouse located in Gdynia Wiczlino, Pomerania, northern Poland, over a four-month period from mid-April to mid-August 2025. Two based recycled nutrient fertilizers (RNFs), BADSS and SADSS [21], were tested together with chitosan-enriched variants (BADSS + Ch and SADSS + Ch) and a commercially available organic NPK fertilizer (cow manure granulated, CMG) used as a reference. In total, five fertilizer treatments were evaluated at seven nitrogen application rates ranging from 20 to 370 kg N ha−1. Each treatment was conducted in triplicate in a completely randomized design. Fertilizer application rates and corresponding amounts per pot are presented in subpoint 2.4. For the chitosan-enriched variants, the enrichment was applied as a 1:1 aqueous suspension of blended shrimp shells fresh mass. The suspension was added to each pot in two applications (5.43 g on 27.04.2025 and 1.39 g on 08.05.2025), corresponding to a total of 6.82 g fresh shrimp shell mass per pot. This introduced an additional 0.092 g N per pot originating from the enrichment. Plants were cultivated in the <2 mm sieved fraction of sandy soil mixed with peat at a sand-to-peat ratio of 5:1, equivalent to a volume ratio of 1:1.5 (v/v). Approximately 1.85 kg of the prepared substrate was placed in plastic pots with an internal diameter of 14.5 cm (surface area 0.0165 m2). To avoid nutrient limitations other than nitrogen, each pot received supplementary nutrient solutions containing K2SO4 (42 g L−1); CaCl2·2H2O (90 g L−1); MgSO4·7H2O (24 g L−1); MnSO4·H2O (6 g L−1); ZnSO4·7H2O (5.4 g L−1); CuSO4·5H2O (1.2 g L−1); H3BO3 (0.42 g L−1); CoSO4·7H2O (0.16 g L−1); Na2Mo4·2H2O (0.12 g L−1). Prior to sowing, the soil in each pot was pre-watered with 120 mL of tap water, and fertilizers were thoroughly mixed into the upper 5 cm soil layer. Eighty seeds of annual ryegrass (0.5 g seed mixture containing Lolium perenne 40%, Lolium multiflorum var. Estanzuela 20%, Festuca rubra 25%, and Lolium hybridum 15%) were sown on the soil surface and covered with an additional 80 g of soil. The choice of ryegrass was due to its high pollutant tolerance and stress tolerance, fast-growing nature, and safety aspects for potential end-users (rather than urban green areas or non-edible crops). Pots were re-randomized weekly to ensure uniform light exposure and maintained at a constant moisture level at field capacity (ca. 65%) thanks to an automatic irrigation system. Plants were harvested monthly (after 30, 60, 90, and 120 days) during the four-month experimental period by cutting the aboveground biomass approximately 1 cm above the soil surface. The harvested biomass was dried at 105 °C to constant weight and used for further analyses.
2.2. Recycled Nutrient Fertilizers (RNFs)
2.2.1. Fertilizer Formulation and Production
Recycled nutrient fertilizers were produced by Rendben Ltd., Gdynia, Poland, using locally available organic and mineral waste streams through a process involving mixing, pelleting, and controlled drying. Two base fertilizers were prepared: BADSS and SADSS. Briefly, BADSS consisted of 17.5–22.5% fishcake processing waste, 17.5–22.5% digested sewage sludge, 32.5–37.5% biomass ash, and 22.5–27.5% biochar. SADSS has an analogous formulation but contains chromium-free cattle shavings from a leather car upholstery plant (22.5–27.5%). Both fertilizers were designed to provide stable pellets with high nutrient content and low heavy-metal concentrations. In addition, chitosan-enriched variants (BADSS + Ch and SADSS + Ch) were produced by combining the base pellets with a chitosan-based enrichment derived from seafood waste, which we applied before and during plant growth. The production technologies for BADSS, SADSS, BADSS + Ch and SADSS + Ch have been submitted as patent applications to the Polish Patent Office (WIPO ST 10/C PL453720, PL453721, PL453724 and PL453725).
2.2.2. Fertilizers and Enrichments Characteristics
Table 1 shows the basic characteristics of the materials used. Both SADSS and BADSS pellets contained substantial amounts of macronutrients and organic carbon, with total solids of 88.2% and 78.1%, respectively. Nitrogen, phosphorus, and potassium concentrations, as well as organic carbon and heavy metal contents, are presented in Table S1 (Supplement). All measured heavy metal concentrations were within the limits defined by EU fertilizing product regulations [22].
Table 1.
Basic characteristics of fertilizer materials applied. 3 replicates were used. Data provided thanks to the CiNURGi project partner: Institute of Soil Science and Plant Cultivation State Research Institute, Puławy, Poland.
The basic physicochemical characteristics of the shrimp-shell-based enrichment used for BADSS and SADSS fertilizers are presented in Table 2.
Table 2.
Basic characteristics of chitosan enrichments applied to both BADSS and SADSS. 3 replicates were used. Original author’s data.
Some papers [23,24,25,26] report chitin (the natural polymer in shells) as the fraction you measure on a dry-weight basis; chitosan is made from that chitin by chemical/enzymatic deacetylation and so its final yield is necessarily ≤ the chitin fraction and depends on process losses and deacetylation efficiency. Because (a) chitin in shrimp shells is commonly reported between 15 and 30% dry weight, and (b) chitosan extraction yields reported in the literature commonly fall in the ~10–25% band (with examples at ~18% chitin and ~23% chitosan), a conservative working average for chitosan content (as extracted product per dry shrimp shell mass) is ≈20% (±~7–10%). Thus, this number was placed in Table 2 under “Chitosan from booster addition”.
2.3. Soil Characteristics and Preparation
The soil used in the pot experiment consisted of a sand–peat mixture. Its physicochemical properties, including organic matter content, nutrient concentrations (N, P, and K), pH, redox potential, and electrical conductivity, are summarized in Table 3. These characteristics indicate that the soil represented a moderately fertile substrate with balanced macronutrient availability, an alkaline pH, and low salinity, providing suitable conditions for controlled pot experiments assessing plant growth and nutrient dynamics.
Table 3.
Basic characteristics of soil used. Three replicates were used. Original author’s data.
Before planting, soil samples were analyzed for pH and electrical conductivity (EC; 1:5 H2O), along with total soil nitrogen, phosphorus (both Olsen and total), and potassium (both Olsen and total). After the final harvest, samples were again tested for pH, EC, and total nitrogen. Phosphorus concentration in liquid samples (soil extracts) was measured using a portable spectrophotometer (Hach DR3900, Hach Company, Wrocław, Poland) with Hach Method 8048, including a mineralization step. Prior to analysis, soil-water samples were filtered through a paper filter followed by a 0.45 µm syringe filter. Total K was measured on solid, ground samples using an Energy Dispersive X-Ray Fluorescence EDX 7000 spectrometer (Shimadzu Corporation, Kyoto, Japan). Available phosphorus using the Olsen method (P-Olsen) was determined by phosphorus extraction using a 4.2% NaHCO aqueous solution with the addition of 0.05% polyacrylamide solution adjusted with 50% sodium hydroxide to pH 8.5. The content of total nitrogen was determined for all fertilizers by the Kjeldahl method in order to calculate the right amount of fertilizer. Samples were digested in concentrated sulphuric acid in the presence of a copper-based catalyst with titanium; the next step was steam distillation into a boric acid solution with Tashiro indicator, then titrated with hydrochloric acid to measure the released ammonia.
2.4. Fertilization Treatments and Nitrogen Application Rates
Nitrogen application rates ranged from 20 to 370 kg N ha−1. The initial rate (20 kg N ha−1) corresponded to the standard recommendation for ryegrass fertilization, and subsequent rates were increased in 50 kg N ha−1 increments up to 170 kg N ha−1, which represents the maximum annual limit for nitrogen from natural fertilizers on agricultural land in Poland [27]. Two additional higher rates (270 and 370 kg N ha−1) were included to evaluate plant response under over-fertilization conditions. The corresponding nitrogen and fertilizer amounts applied per pot are presented in Table S1 in the Supplement.
2.5. Plant and Soil Analyses
Plant physiological status was evaluated at the end of the growth period (after 60, 90, and 120 days), prior to harvest, using chlorophyll fluorescence measurements. Analyses were performed with portable modulated fluorimeters (OSI-YII-MTR and OSI-FV-MTR; Opti-Sciences, Hudson, NH, USA). The maximum quantum efficiency of photosystem II (Fv/Fm) and the ratio of maximal to minimal fluorescence after dark adaptation (Fm/Fo) were recorded. Measurements were conducted according to the standardized protocols recommended by the manufacturer and according to the methods developed by [28].
After each of the four harvests, ryegrass tops were dried, ground, and analyzed for Total Kjeldahl Nitrogen (TKN). Samples were digested in concentrated H2SO4 with a titanium-based catalyst using a SpeedDigester K-436 (Büchi Labortechnik AG, Flawil, Switzerland), then steam-distilled (K-355 distillation unit, Büchi Labortechnik AG) into boric acid solution with a Tashiro indicator before titration with HCl to determine ammonia content. Before and after the finalization of the experiment, soil samples were analyzed for pH and electrical conductivity EC (1:5 H2O), along with total soil nitrogen, phosphorus (both Olsen and total), and potassium (both Olsen and total) [29]. The methodology was coherent with [30,31,32].
All the reactants used in the analyses were supplied by Avantor Performance Materials Poland S.A., Gliwice, Poland, as analytical grade. Treatments were run in three replicates, followed by chemical analyses also having three replicates from each treatment replicate.
3. Theory and Calculation
3.1. Efficiency Metrics
The agronomic efficiency of nitrogen fertilization was evaluated using two commonly applied agronomic indicators: agronomic efficiency (AE) and apparent nitrogen recovery (ANR) [33,34,35].
Agronomic efficiency (AE) was calculated as (1):
where is the biomass yield obtained in the fertilized treatment, is the biomass yield in the CMG control, and represents the amount of nitrogen applied.
Apparent nitrogen recovery (ANR, %) was calculated as (2):
where and denote the nitrogen uptake in fertilized and control treatments, respectively.
3.2. Chlorophyll Fluorescence and Photochemical Stress Indicators
The physiological status of the forage grass mixture was assessed using chlorophyll fluorescence parameters, including the maximum quantum efficiency of photosystem II (Fv/Fm) and the effective quantum yield of PSII (Y(II)). Measurements were performed immediately prior to the harvests scheduled at 60, 90, and 120 days using portable modulated fluorometers (OSI-YII-MTR and OSI-FV-MTR; Opti-Sciences, Hudson, NH, USA). Fv/Fm was determined after 30 min of dark adaptation using dark-adaptation clips, with minimum (F0) and maximum (Fm) fluorescence yields recorded following a saturating light pulse. All measurements followed standardized procedures described by [28]. The maximum quantum efficiency of PSII was calculated as (3):
where the Fv/Fm ratio represents the maximum proportion of absorbed light energy that can be used by PSII reaction centers. The effective quantum yield of PSII, Y(II), was measured under light-adapted, steady-state conditions as a normalized efficiency index of PSII photochemistry [36]. Y(II) was calculated as (4):
where Fs is the steady-state fluorescence under actinic illumination, and Fm’ is the maximum fluorescence in the light-adapted state obtained using a saturating pulse.
Plant nutritional status and physiological responses were assessed using complementary methods: nitrogen concentration in plant tissues was determined following laboratory mineralization, while chlorophyll fluorescence parameters were measured using portable OSI-YII-MTR and OSI-FV-MTR (Opti-Sciences, Hudson, NH, USA) devices to evaluate photosystem II performance and photochemical stress; these measurements provided direct information on tissue nitrogen status and complementary insights into plant physiological condition.
3.3. Sensitivity Analysis Calculations
To evaluate the response of nitrogen recovery to increasing nitrogen input, a sensitivity index (SI) was calculated based on changes in apparent nitrogen recovery (ANR) across the applied nitrogen gradient. The following parameters were defined:
- ANR0 = mean ANR across the four harvests at the lowest N rate (20 kg N ha−1)
- ΔANR = difference between mean ANR at highest N rate and mean ANR at 20 kg N ha−1
- ΔN = difference between highest and lowest applied N
- N0 = 20 kg N ha−1
For the chitosan-enriched treatments (BADSS + Ch and SADSS + Ch), the sensitivity index was calculated in two ways: (i) considering only nitrogen supplied by the fertilizer pellets (uncorrected), and (ii) including the additional nitrogen introduced with the shrimp-shell enrichment (corrected). This approach enabled direct evaluation of the effect of booster-derived nitrogen on recovery efficiency.
3.4. Statistical Analysis
Principal component analysis (PCA) was performed to examine the relationships among biomass production, fertilizer efficiency, nutrient recovery, and photochemical parameters, and to identify treatment patterns across consecutive harvests. Two PCA models were used. The first model included dry biomass (Dry B), agronomic effectiveness (AE), apparent nutrient recovery (ANR), and Fv/Fm, and was calculated separately for the 60-, 90-, and 120-day harvests. The second model included Dry B, AE, ANR, Y(II), and Fv/Fm and was applied to the 60- and 90-day harvests, for which the full set of physiological measurements was available. Before analysis, all variables were standardized using z-scores. Statistical analyses and figure preparation were performed using Origin 2026 (version 10.3) (OriginLab Corporation, Northampton, MA, USA).
4. Results
4.1. Response of the Ryegrass Biomass Yield to Pelleted Waste-Based Fertilizers
Ryegrass biomass yield responded differently to fertilizer type, chitosan addition, nitrogen application rate, and harvest time, as shown in Figure 1 below.
Figure 1.
Ryegrass biomass yield after four consecutive harvests (30, 60, 90 and 120 days) in response to recycled nutrient fertilizers, compared with the commercial organic fertilizer (CMG). Bars represent mean values and error bars indicate standard deviations. Different lowercase letters indicate significant differences among fertilizer treatments within the same N dose at p < 0.05; treatments sharing at least one letter are not significantly different. Each bar denotes an average from 3 replicates.
At 30 days, biomass yields were generally low across treatments, with CMG showing a gradual increase with N rate. BADSS and SADSS produced similar or slightly higher yields than CMG at low to moderate doses, while SADSS + Ch consistently achieved the highest biomass. In contrast, BADSS + Ch showed an initial increase followed by a pronounced decline at higher N rates. At 60 days, yields increased markedly, with SADSS outperforming CMG across most application rates and SADSS + Ch producing the highest biomass over nearly the entire N range. BADSS maintained moderate yields, whereas BADSS + Ch showed decreasing yields with increasing N, particularly at high doses. At 90 days, treatment differences became more pronounced: SADSS exceeded CMG at medium and high N rates, while SADSS + Ch showed a strong dose-dependent response and achieved the highest yields overall. BADSS and BADSS + Ch remained less responsive to increasing N and generally produced lower yields than SADSS, SADSS + Ch, and CMG. By 120 days, biomass declined across all treatments, but SADSS + Ch maintained the highest yields at high N rates. SADSS and CMG converged toward similar yield levels, while BADSS and BADSS + Ch remained the least productive, with limited responses to increas ing N.
4.2. Nitrogen Uptake by Ryegrass Fertilized with Pelleted Waste-Based Fertilizers
Figure 2 shows the nitrogen uptake and nitrogen use from 1 ha by ryegrass fertilized with recycled nutrient fertilizers after 4 subsequent harvests.
Figure 2.
Plant N content and N use by ryegrass after four consecutive harvests (30, 60, 90, and 120 days) in response to recycled nutrient fertilizers, compared with the commercial organic fertilizer (CMG). Bars represent mean values and error bars indicate standard deviations. Different lowercase letters indicate significant differences among fertilizer treatments within the same N dose at p < 0.05; treatments sharing at least one letter are not significantly different. Each dot/ bar denotes an average from 3 replicates.
4.2.1. Nitrogen Content in Plant Biomass
At 30 days, plant N content was highest in BADSS and SADSS and generally exceeded CMG at medium and high N rates. SADSS + Ch increased with fertilizer dose, whereas BADSS + Ch showed limited responsiveness. At 60 days, N content declined across treatments, likely due to biomass dilution, with SADSS maintaining the highest and most stable values. At 90 days, SADSS + Ch showed a strong dose-dependent increase, reaching the highest N content at high rates, while SADSS also increased and the remaining treatments stayed comparatively low. By 120 days, N content partially recovered; SADSS and BADSS showed similar values, while SADSS + Ch remained slightly higher at medium to high doses. CMG and BADSS + Ch retained lower, relatively dose-insensitive N contents.
4.2.2. Nitrogen Use (kg N ha−1)
At 30 days, N use increased with N rate across treatments, with BADSS performing best at intermediate doses and SADSS + Ch consistently exceeding CMG. BADSS + Ch peaked at low to moderate doses before declining sharply. At 60 days, N use increased substantially, with SADSS + Ch achieving the highest values across nearly all doses, followed by SADSS, while BADSS and BADSS + Ch remained lower. At 90 days, SADSS + Ch showed a pronounced increase at high N rates, and SADSS also responded positively, whereas CMG, BADSS, and BADSS + Ch showed limited dose responsiveness. By 120 days, SADSS + Ch maintained the highest N use, particularly at high doses, while SADSS showed moderate increases. CMG and BADSS remained comparatively low, and BADSS + Ch exhibited minimal N use at high N rates.
4.3. Temporal Dynamics of Biomass and Nitrogen Uptake
The temporal distribution of ryegrass dry matter yield differed markedly among treatments as shown in Figure 3.
Figure 3.
Up: Ryegrass growth (as total dry matter yield) dynamics across four harvests for 4 recycled nutrient fertilizers, mineral fertilizer, granulated cow manure, and a control: percentage of total dry matter in each harvest (left axis) and cumulative 4-month dry matter yield (bold line–right axis). Standard deviations are included; insignificant if not visible.
Down: Nitrogen use dynamics across four harvests for 4 recycled nutrient fertilizers, cow manure granulated, and a control. Percentage of total N use in each harvest (left axis) and cumulative 4-month N uptake (bold line–right axis). Standard deviations are included; insignificant if not visible. Each bar denotes an average from 3 replicates.
The control produced the lowest cumulative yield, while CMG and BADSS showed peak biomass production at 60–90 days, with BADSS achieving a lower total yield. SADSS sustained production later into the experiment, outperforming both treatments. Chitosan effects depended on the fertilizer matrix: BADSS + Ch mainly increased mid-season biomass, whereas SADSS + Ch achieved the highest cumulative yield, with particularly strong contributions at 90 and 120 days. These findings highlight the importance of sustained late-season growth and the benefits of combining chitosan with nutrient-balanced recycled fertilizers for multi-cut forage production and circular nutrient management.
Nitrogen use varied markedly among treatments in both cumulative uptake and temporal distribution (Figure 3, down). The control showed the lowest uptake, while CMG concentrated N use at 60–90 days. BADSS promoted earlier uptake, mainly at 30–60 days, whereas SADSS sustained uptake across later harvests, exceeding both treatments. BADSS + Ch showed lower cumulative N use, concentrated at 60 days, while SADSS + Ch achieved the highest uptake, with substantial contributions at 90 and 120 days, indicating sustained N acquisition throughout the experiment.
4.4. Residual Soil Properties After the Growth of Ryegrass
Residual soil pH shown in Figure 4 differed clearly among treatments.
Figure 4.
Residual soil properties after fertilization with recycled nutrient fertilizers after 4 subsequent harvests compared to cow manure granulated. Standard deviations are included; insignificant if not visible. Each dot denotes an average from three replicates.
CMG, SADSS, and SADSS + Ch maintained near-neutral to slightly alkaline pH (7.4–7.6), whereas BADSS and BADSS + Ch exceeded pH 8.5 at high N rates. Residual soil N varied by treatment, with CMG declining at the highest dose, SADSS and BADSS retaining more N at medium to high rates, and chitosan-enriched treatments showing variable patterns. SADSS exhibited the highest electrical conductivity (EC), exceeding 2000 µS cm−1, while SADSS + Ch remained below 1000 µS cm−1; CMG showed the lowest and most stable EC, whereas BADSS + Ch had sharp peaks. Redox potential increased with N rate in BADSS and BADSS + Ch (>90–110 mV), but remained lower and relatively stable in CMG, SADSS, and SADSS + Ch (≈30–50 mV).
Linking Residual Soil Properties with Yield and Nitrogen Use Dynamics
Residual soil chemistry helps explain differences in ryegrass yield and N use. SADSS and SADSS + Ch maintained more favorable soil conditions, corresponding to higher cumulative yields and sustained late-season N uptake. In contrast, the strong alkalization under BADSS and BADSS + Ch at high N rates may have restricted micronutrient availability and nutrient uptake, contributing to declining yields and N use. EC also differentiated treatments: higher EC under SADSS coincided with enhanced N uptake and biomass, whereas low EC under CMG corresponded to weaker late-season productivity. Redox potential further differentiated treatment performance.
Higher Eh values in BADSS and BADSS + Ch suggest more oxidizing conditions, which may have affected early nitrification. SADSS and SADSS + Ch maintained moderate redox conditions, supporting slower, more sustained nutrient cycling that aligned with their extended yield and N-uptake profiles. The higher redox potential observed in BADSS and BADSS + Ch may reflect differences in the chemical composition and redox-active properties of the fertilizer matrices. In contrast, the bovine-shaving-containing SADSS matrix may provide a different pool of organic compounds that supports microbial oxygen consumption and electron-donor activity, potentially maintaining a lower redox potential. However, this explanation remains hypothetical because organic carbon degradability, soil oxygen status, and redox-active mineral species were not directly assessed. The contrasting responses of the chitosan-enriched treatments further suggest that redox conditions depend on interactions between the amendment and fertilizer matrix rather than on chitosan alone.
Residual soil N patterns reinforce these interpretations. Lower residual N under CMG at high doses corresponds with its declining yields and suggests either plant exhaustion or increased N losses. Conversely, moderate residual N levels under SADSS and SADSS + Ch indicate a better balance between supply and uptake, consistent with their higher nitrogen use efficiency and stable biomass production.
Generally, the residual soil properties confirm that soil chemical conditions created by RNFs and chitosan amendment strongly regulated the temporal alignment between nutrient availability and plant demand. Treatments that generated stable pH, moderate redox potential, and sufficient soluble nutrient pools supported sustained nitrogen uptake and biomass accumulation across harvests. These findings integrate coherently with earlier yield and N-use results, demonstrating that superior agronomic performance of SADSS and especially SADSS + Ch was underpinned by favorable soil–plant feedbacks rather than by high nutrient inputs alone. In contrast, BADSS and BADSS + Ch induced a pronounced pH increase with increasing N dose, reaching strongly alkaline conditions (>8.5) at high rates, which may be beneficial for acidic soils by reducing soil acidity, improving phosphorus availability, and partially mitigating aluminum toxicity, although excessive alkalization could also alter nutrient balance and microbial community structure.
4.5. Photochemical Stress Results
The photosynthetic response (Fv/Fm) of ryegrass varied among fertilizer treatments and harvest times (shown in Figure 5). Across all treatments, Fv/Fm values remained within the 0.73–0.80 range. Under non-stress conditions, the maximum quantum efficiency of PSII typically ranges between 0.79 and 0.84, with values around 0.83 considered optimal for most plant species [37]. The observed results showed that in the early harvests (60–90 days), Fv/Fm values were generally lower and more variable across treatments, suggesting transient physiological stress or adjustment of the photosynthetic apparatus during early growth stages. By the final harvest (120 days), Fv/Fm increased in most treatments, indicating improved photosynthetic efficiency and physiological stabilization of the plants. The most stable physiological performance occurred in treatments where nutrient availability and probable microbial processes were balanced, particularly in SADSS + Ch, whereas BADSS-based treatments showed signs of physiological stress during intermediate growth stages, consistent with their weaker agronomic performance. The consistently high PSII efficiency observed for SADSS + Ch suggests that the positive physiological effect of chitosan occurred only when it was combined with a nutritionally balanced recycled fertilizer matrix, as clearly demonstrated in this study.
Figure 5.
Maximum quantum efficiency of photosystem II (Fv/Fm) in ryegrass under different fertilizer treatments (CMG, BADSS, SADSS, BADSS + Ch, SADSS + Ch) measured at 60, 90 and 120 days of growth. Boxplots show median, interquartile range, and data dispersion. Each bar denotes an average from 3 replicates.
5. Discussion
The observed yield patterns demonstrate that the agronomic effectiveness of chitosan is strongly dependent on the nutrient context provided by the recycled fertilizer matrix. The consistent superiority of SADSS + Ch across multiple harvests indicates a synergistic interaction between chitosan and a nutritionally balanced RNF, resulting in sustained biomass accumulation beyond early growth stages. Similar synergistic effects have been reported where chitin or chitosan enhanced nutrient uptake and rhizosphere activity when co-applied with organic or recycled nutrient sources [3]. In contrast, the decline in biomass observed for BADSS + Ch at higher N rates suggests that chitosan addition may probably intensify microbial nitrogen immobilization when applied with low-N carriers. Chitin-rich substrates are known to stimulate chitinolytic microbial communities, which can temporarily sequester mineral nitrogen into microbial biomass, reducing short-term plant availability. This phenomenon has been observed in studies applying raw shrimp-shell residues directly to soil, where growth stimulation depended on concurrent nutrient supply [8]. The sustained response of SADSS + Ch at later harvests (90–120 days) could possibly support the hypothesis that soil microbiomes progressively depolymerize chitin from chitosan or shell-derived materials into bioactive oligomers that enhance root growth and nutrient acquisition (unverified in this study). Chitooligosaccharides produced through microbial degradation can act as plant elicitors, improving nutrient uptake efficiency and stress resilience [3]. Another research [7] similarly demonstrated that untreated crustacean shells can function as biologically active soil amendments when microbial activity is not nutrient-limited. Compared with the commercial reference fertilizer (CMG), RNFs—particularly SADSS and SADSS + Ch—exhibited delayed but more sustained biomass production, consistent with slow-release nutrient dynamics reported for recycled and organic fertilizers. This behavior contrasts with CMG, which showed earlier yield saturation and decline at high N rates. Similar temporal shifts have been reported in pot and greenhouse trials evaluating recycled nutrient products combined with biostimulants [9].
The nitrogen uptake patterns indicate that chitosan addition fundamentally altered nitrogen dynamics, but its effectiveness was strongly dependent on the nutrient composition of the recycled fertilizer matrix. The consistently high N use observed for SADSS + Ch at later harvests (60–120 days) suggests enhanced synchronization between N mineralization and plant demand. Chitosan and chitin derivatives are known to stimulate rhizosphere microbial activity and root physiology, leading to increased N uptake efficiency over time and not immediate increases in tissue N concentration [3]. In contrast, BADSS + Ch showed reduced N use at higher application rates, particularly after 60 days, indicating probable microbial immobilization of mineral N. Chitin-rich substrates could therefore stimulate chitinolytic microorganisms that temporarily sequester nitrogen into microbial biomass, reducing plant availability when total N supply is insufficient. Similar effects were reported in studies applying raw shrimp-shell waste directly to soil, where positive plant responses occurred only when adequate mineral N was co-supplied [8]. Another researcher [7] demonstrated that untreated crustacean shells can activate soil microbial processes and improve nutrient acquisition when applied as soil amendments. These findings align with the delayed but strong N uptake observed in SADSS + Ch treatments. Compared with CMG, RNFs—particularly SADSS and SADSS + Ch—exhibited delayed yet more sustained nitrogen uptake. CMG showed early increases in N use followed by plateauing, reflecting the mineralization pattern typical of manure-based fertilizers. Similar contrasts between manure and recycled organic fertilizers have been reported in ryegrass pot trials, where recycled products supported prolonged N uptake over multiple harvests [38].
The nitrogen use patterns reflect strong interactions between fertilizer composition, chitosan amendment, and time-dependent nutrient availability. CMG and BADSS showed mid-season dominance of N uptake, consistent with mineralization-driven release typical of manure and some recycled organic fertilizers, followed by declining availability at later stages. Comparable uptake trajectories have been reported for cattle manure, composts, and digestate-based fertilizers in ryegrass and grassland pot studies, where N uptake peaks during intermediate growth stages and declines thereafter [38,39]. SADSS exhibited a more even N-use distribution extending into the 90- and 120-day harvests, suggesting improved synchronization between nitrogen release and plant demand. This sustained uptake pattern aligns with studies showing that recycled nutrient fertilizers with mixed organic–mineral matrices and ash or biochar components can prolong N availability and reduce early losses [40,41]. BADSS + Ch showed reduced cumulative N use and a collapse of late-season uptake. This phenomenon has been widely documented for chitin- and cellulose-rich organic amendments, where microbial growth temporarily outcompetes plants for mineral nitrogen [8]. In contrast, SADSS + Ch showed the highest cumulative N use, with a pronounced shift toward late-season uptake.
Other studies proved that progressive microbial depolymerization of chitin/chitosan into chitooligosaccharides may stimulate root development, enhance rhizosphere activity, and increase nutrient acquisition capacity over time [1,3]. Similar long-term stimulation of N uptake has been observed when crustacean shell residues were applied directly to soil or composted fertilizers, provided that sufficient nitrogen was present to sustain microbial turnover [7,9]. Treatments exhibiting sustained late-season N uptake (SADSS and especially SADSS + Ch) also produced the highest cumulative dry matter yields and the most stable biomass distribution across harvests. Conversely, treatments with mid-season-restricted N uptake (CMG, BADSS, BADSS + Ch) showed reduced late-harvest biomass contributions. This confirms that temporal synchronization between nitrogen availability and plant demand—instead of total nitrogen input alone—is the key driver of cumulative yield and nitrogen use efficiency, a conclusion consistent with broader analyses of NUE–yield relationships in forage and cereal systems [42].
These results demonstrate that chitosan acts primarily as a nitrogen-use amplifier instead of a direct nitrogen source. When combined with a nutritionally balanced RNF (SADSS), chitosan enhanced long-term N uptake and cumulative N use. When paired with a low-N matrix (BADSS), however, chitosan may intensify microbial competition for nitrogen, reducing plant N acquisition. These findings reinforce the need to match chitin/chitosan-based boosters with adequate nutrient supply and support the use of raw seafood waste as a chitin carrier in circular fertilization systems, provided that fertilizer formulation ensures sufficient nitrogen availability.
5.1. Agronomic Effectiveness (AE)
Agronomic Effectiveness (AE) expressed on Figure 6, expressed in grams of ryegrass total solids (TS) produced per kg of N applied per hectare, revealed big differences among fertilizer types, nitrogen rates, and harvest times.
Figure 6.
AE calculated for each dose at each scenario and harvest time. Note that AE for BADSS + Ch and SADSS + Ch was displayed as a function of pellets + Ch enrichment (booster) N content applied. Each dot denotes an average from 3 replicates.
Across all treatments, AE declined with increasing N dose, confirming diminishing marginal productivity of nitrogen. However, the magnitude and temporal distribution of AE varied substantially among fertilizer systems. The reference fertilizer, CMG, exhibited moderate AE at the lowest dose, with a clear peak at 60 days (13.09 g TS kg−1 N at 20 kg N ha−1), consistent with the delayed mineralization typical of manure-based fertilizers. At higher N rates, AE declined sharply across all harvests, indicating limited efficiency under surplus N supply.
Among recycled nutrient fertilizers without chitosan, BADSS showed high early- and mid-season AE at low doses (up to 10.87 g TS kg−1 N at 90 days), but performance declined rapidly with increasing N input, especially at later harvests. SADSS displayed lower peak AE than BADSS at early harvests but demonstrated more stable performance across doses and time, particularly at 90 and 120 days. This stability reflects improved synchronization between N release and plant demand, consistent with previously observed NUE patterns. Chitosan-enriched treatments substantially altered AE dynamics. Uncorrected BADSS + Ch and SADSS + Ch values showed pronounced increases in AE at low and moderate N doses, especially at 60 days, where SADSS + Ch reached 17.66 g TS kg−1 N at 20 kg N ha−1. These values indicate strong mid-season stimulation of biomass production per unit of applied pellet N. However, at higher doses, BADSS + Ch exhibited negative or near-zero AE values at early harvests, reflecting efficiency collapse and likely microbial immobilization or nutrient imbalance. Critically, correcting AE values for total N input (pellet + chitosan N) substantially reduced apparent effectiveness in both BADSS + Ch and SADSS + Ch. After correction, AE values declined across all doses and harvests, particularly at higher N rates. For BADSS + Ch, corrected AE became very low or negative at high inputs, confirming that earlier high values were partly attributable to unaccounted N from chitosan. In contrast, SADSS + Ch retained moderate corrected AE, particularly at 60 days, indicating genuine biological enhancement beyond simple N addition.
Overall, AE analysis confirms that recycled fertilizers outperform CMG at low to moderate N inputs, but efficiency declines with increasing dose. Chitosan enrichment enhances agronomic response primarily at low to intermediate N rates and during mid-season growth. Importantly, correcting for actual N input is essential to avoid overestimating the agronomic benefit of biologically enriched fertilizers and to accurately assess their true nutrient-use performance and sustainability.
5.2. Apparent Nutrient Recovery
Apparent Nutrient Recovery (ANR), displayed in Figure 7 below, showed pronounced variation among fertilizer types, nitrogen doses, and harvest times, reflecting differences in nitrogen uptake efficiency relative to applied N.
Figure 7.
ANR calculated for each dose at each scenario and harvest time. Note that AE for BADSS + Ch and SADSS + Ch was displayed as a function of pellets + Ch enrichment (booster) N content applied. Each bar denotes an average from 3 replicates.
Across all treatments, ANR generally declined with increasing N application rate, confirming reduced proportional recovery under higher N supply and reinforcing the diminishing-returns pattern observed for NUE and AE. The reference fertilizer (CMG) exhibited relatively low ANR values across most doses and harvests, with a pronounced peak at 60 days at the lowest N rate (54.78%). Thereafter, ANR declined sharply with increasing N input and over time, occasionally reaching negative values (e.g., −1.36% at 70 kg N ha−1 at 120 days), indicating either limited plant uptake or potential N losses exceeding net recovery at higher doses.
Among recycled nutrient fertilizers without chitosan, BADSS showed substantially higher ANR at low doses, particularly at 30 days (59.75%) and sustained moderate recovery at 90–120 days. However, ANR declined markedly at higher N rates, especially by 90 days, where values fell below 1% at 370 kg N ha−1. SADSS displayed a more balanced and stable recovery pattern, maintaining moderate ANR across harvests and doses, particularly at 60 and 90 days. This stability suggests improved synchronization between nitrogen release and plant demand compared to BADSS and CMG. Chitosan-enriched treatments substantially modified ANR dynamics. Uncorrected BADSS + Ch showed strong recovery at low doses (e.g., 55.27% at 60 days at 20 kg N ha−1), but ANR declined rapidly at higher N inputs and even became negative at some doses and harvests (e.g., −1.24% at 270 kg N ha−1 at 30 days). This indicates that apparent stimulation at low rates was not sustained under elevated N supply. SADSS + Ch demonstrated consistently higher ANR than its non-amended counterpart across most doses and harvests, particularly at 30 and 60 days (up to 73.08% and 68.50% at 20 kg N ha−1). Importantly, SADSS + Ch maintained moderate recovery even at higher doses and later harvests, confirming enhanced nitrogen uptake capacity when chitosan was combined with a balanced nutrient matrix. Crucially, correcting ANR values for total nitrogen input (pellet + chitosan N) significantly reduced recovery percentages in both BADSS + Ch and SADSS + Ch treatments. After correction, ANR values declined across all doses and harvests, particularly at higher N inputs, demonstrating that uncorrected data overestimate recovery by excluding booster N contribution. For BADSS + Ch, corrected ANR values were low or negative at high N rates, confirming poor net recovery when total N supply was considered. In contrast, SADSS + Ch retained moderate corrected ANR values, especially at 60 days, indicating that part of the improvement was attributable to genuine enhancement of nitrogen uptake rather than merely increased N supply.
Overall, ANR analysis confirms that recycled fertilizers outperform CMG in terms of nitrogen recovery at low to moderate N rates. However, recovery efficiency declines with increasing N input across all systems. Chitosan enrichment enhances apparent N recovery primarily at lower doses and early growth stages, but accurate assessment requires correction for total N input to avoid overestimating agronomic performance. Proper accounting is therefore essential for realistic evaluation of nutrient recovery and sustainability in biologically enhanced recycled fertilizer systems. Find more information on the integration of AE and ANR results in the Supplement.
5.3. Integration of AE and ANR Metrics
The joint evaluation of Agronomic Effectiveness (AE) and Apparent Nutrient Recovery (ANR) provides a coherent picture of how nitrogen inputs were translated into biomass production and plant uptake efficiency across harvests. Although both indicators declined with increasing N application rate, their temporal dynamics differed among treatments, revealing important contrasts in nutrient synchrony and biological stimulation.
For the reference CMG, AE peaked at 60 days at low N rates, reflecting delayed mineralization typical of manure-based fertilizers. However, ANR remained relatively low and unstable across harvests, particularly at later stages, indicating that moderate biomass production was not accompanied by sustained N recovery. This pattern confirms limited synchronization between N release and plant demand.
Among non-enriched recycled fertilizers, BADSS exhibited high AE and ANR at early harvests (30–60 days), especially at low N rates, indicating strong initial nitrogen mobilization. However, both AE and ANR declined sharply at higher doses and later harvests, demonstrating sensitivity to N over-application. SADSS showed a more balanced pattern: AE remained moderate but stable across harvests, while ANR maintained relatively consistent values at 60–90 days. This stability reflects improved synchronization between nutrient release and plant uptake and aligns with previously observed lower sensitivity indices. Chitosan enrichment substantially altered the relationship between AE and ANR. In BADSS + Ch (uncorrected basis), AE increased markedly at 60 days at low doses, accompanied by elevated ANR, indicating strong mid-season stimulation of nitrogen turnover. However, at higher N rates and early harvests, AE became negative, and ANR approached or fell below zero, demonstrating destabilization of nutrient recovery. After correcting for total N input (pellet + chitosan N), both AE and ANR values decreased substantially, confirming that apparent improvements were partly driven by additional N supply and not enhanced intrinsic efficiency.
In contrast, SADSS + Ch showed a more integrated response. Uncorrected data revealed high AE and ANR at 30–60 days, and importantly, the boosting effect remained positive at later harvests and moderate N rates. When corrected for total N input, AE and ANR values declined but remained positive and relatively stable, particularly at 60 days. The isolated chitosan boosting factors further demonstrate that, under comparable N inputs, SADSS + Ch maintained consistent positive effects across harvests, whereas BADSS + Ch showed fluctuating or negative responses, especially at high N loads. Across growth months, 60 days emerged as the phase where AE and ANR were most closely aligned, reflecting optimal synchronization between nitrogen availability and plant demand. At 90 and 120 days, divergence between biomass production (AE) and proportional recovery (ANR) became more pronounced, especially under excessive N supply.
Overall, integrated AE and ANR analysis confirms that chitosan acts as a biological amplifier only when combined with a balanced nutrient matrix. SADSS + Ch maintained positive coupling between biomass production and nitrogen recovery across harvests, while BADSS + Ch exhibited unstable dynamics and efficiency collapse under high N inputs. These findings highlight that both nutrient formulation and accurate N accounting are essential for achieving sustainable improvements in productivity and recovery efficiency.
5.4. Sensitivity Analysis
Integration of Sensitivity Analysis into AE/ ANR Discussion
The Sensitivity Index (SI) derived from Apparent Nutrient Recovery (ANR) collected in Table 4 provides a quantitative measure of how strongly nitrogen recovery declines with increasing N application rates. Across all treatments, SI values were negative, confirming that ANR decreases as nitrogen supply increases. However, the magnitude of SI differed markedly among fertilizer systems, revealing differences in stability and resilience to N over-application. Among pellet-only treatments (Table 4), SADSS exhibited the lowest sensitivity (SI = −4.29), followed by CMG (−4.61), BADSS (−5.13), and BADSS + Ch (−5.38). These values indicate that SADSS was the most stable system in terms of ANR decline when N input increased, maintaining relatively higher proportional nutrient recovery across the tested range. In contrast, BADSS and BADSS + Ch showed the strongest sensitivity among pellet-based systems, reflecting rapid deterioration of recovery efficiency at higher N loads.
Table 4.
Sensitivity analysis of Apparent Nutrient Recovery (ANR). Sensitivity Index (SI) calculated as: SI = 100 × (ΔANR/ANR0)/(ΔN/N0), where ANR0 is ANR at 20 kg N ha−1.
SADSS + Ch (pellet N basis) demonstrated the lowest absolute sensitivity (SI = −3.31), suggesting improved buffering capacity against ANR decline when chitosan was combined with a balanced nutrient matrix. However, this apparent stability must be interpreted cautiously because it does not account for additional nitrogen supplied via the booster. When ANR was recalculated based on total N input (pellet + booster N), sensitivity patterns changed substantially. BADSS + Ch showed the highest sensitivity of all treatments (SI = −10.98), indicating extreme instability in nutrient recovery once full nitrogen accounting was applied. This confirms that the uncorrected values substantially overestimated performance and that ANR in BADSS + Ch collapsed sharply under increasing total N input. In contrast, corrected SADSS + Ch maintained the lowest sensitivity overall (SI = −2.28), demonstrating the greatest stability in nutrient recovery across increasing N loads, even after accounting for booster nitrogen.
The SI analysis confirms that SADSS-based systems, particularly SADSS + Ch after correction, are the most stable in terms of ANR response to increasing nitrogen supply. BADSS-based systems, especially when corrected for total N input, are highly sensitive to N over-application and show rapid efficiency collapse. These findings reinforce the importance of balanced nutrient formulation and full nitrogen accounting when evaluating biologically enhanced recycled fertilizers. From a sustainability perspective, SADSS + Ch (corrected basis) represents the most resilient treatment, combining relatively high recovery with the lowest sensitivity to increasing N inputs.
5.5. Isolating the Chitosan Effect
The chitosan boosting factor, calculated by dividing the N use for the +Ch treatment by the N use for the basal pellet treatment (BADSS and SADSS separately) at comparable total nitrogen inputs (e.g., 70 vs. 76; 170 vs. 184; 270 vs. 284; 370 vs. 384 kg N ha−1), reveals clear matrix-dependent and time-dependent effects on nutrient recovery stability. Overall, SADSS + Ch exhibited a more consistent and positive boosting response across growth stages, whereas BADSS + Ch showed greater variability and occasional negative impacts.
According to Table 5 in BADSS + Ch, the boosting effect was unstable and highly dependent on both dose and harvest time. At 30 days, values were mostly below 1.0 and even negative at the highest dose (−0.13 at 370 vs. 384 kg N ha−1), indicating that chitosan reduced apparent nutrient recovery under early high-N conditions. This suggests intensified microbial immobilization or competitive N uptake shortly after application. At 60 days, moderate positive effects were observed (1.04–1.24), indicating transient mid-season stimulation. However, at 90 days the boosting effect weakened again (0.55–0.90), and although some recovery occurred at 120 days (1.26–1.81), the overall pattern remained inconsistent. These fluctuations demonstrate limited stability of the chitosan effect in the BADSS matrix, particularly at higher N loads. In contrast, SADSS + Ch displayed a more stable and predominantly positive response. At 30 days, boosting factors were consistently above 1.3 and reached 2.03 at the lowest dose, indicating strong early enhancement of nutrient recovery. The positive effect persisted at 60 days (1.36–2.34), reflecting sustained mid-season stimulation. Although a temporary reduction below 1.0 occurred at 90 days at some doses (e.g., 0.42–0.89), the effect generally recovered by 120 days (1.00–1.54), demonstrating greater resilience compared to BADSS + Ch. Importantly, the presence of negative or sub-unit values (<1.0) indicates that chitosan does not universally enhance nutrient recovery and may even impair it under certain nutrient-supply conditions. These negative responses were more frequent and pronounced in BADSS + Ch, particularly at higher N rates and early harvests, suggesting that microbial activation without sufficient nutrient balance can destabilize nitrogen availability.
Table 5.
EM boosting factor for BADSS and SADSS calculated by dividing ANR after using the Ch booster by ANR without a booster for the comparative N application loads. Colors in the table from red to green follow the increasing pattern of the EM boosting factor.
The boosting factor analysis shows that chitosan exerts a more stable and beneficial influence when combined with the balanced SADSS matrix, whereas its effect in BADSS is inconsistent and occasionally detrimental. Stability of the boosting effect therefore depends strongly on the underlying nutrient composition and the synchronization between microbial activation and plant nitrogen demand.
5.6. Integration of Photochemical Stress and Agronomic Parameters
Principal component analysis showed on the Figure 8 (below) revealed that the relationships between biomass production, fertilizer performance, nutrient recovery, and PSII functioning changed during successive regrowth stages. In the PCA based on Dry B, AE, ANR, and Fv/Fm, the 60-day harvest was defined mainly by AE and ANR, which explained most of the separation among treatments. Dry B and Fv/Fm were oriented in different directions, which shows that biomass production was not directly associated with the same response pattern as fertilizer efficiency and nutrient recovery at this stage. This means that the first regrowth period was controlled mainly by treatment effects on nutrient use and agronomic response. At the 90-day harvest, Dry B was positioned closer to ANR, indicating a direct link between biomass formation and nutrient recovery. AE remained associated with the same general treatment gradient, but it still described a separate part of the response. At the 120-day harvest, Dry B and Fv/Fm became more closely aligned, while AE and ANR remained grouped on another axis. This shows that in the later stage of regrowth, biomass production was directly connected with PSII condition, whereas AE and ANR continued to represent the agronomic efficiency of the treatments. Analysis including Y(II) clarified these relationships further. At the 60-day harvest, Fv/Fm and Y(II) were located close to each other and separated from AE and ANR, while Dry B was positioned along another direction. This shows a clear division between photochemical status and agronomic response in the initial regrowth phase. In this period, treatment differences were expressed mainly through fertilizer effectiveness and nutrient recovery, while the PSII-related parameters described a separate physiological component. At the 90-day harvest, Dry B, ANR, Fv/Fm, and Y(II) were aligned on the same side of the main component. This indicates that biomass production, nutrient recovery, and photochemical performance formed one consistent response pattern during the later regrowth stage. AE still occupied a partially separate direction, which means that this index captured an additional aspect of fertilizer action not fully covered by the remaining variables.
Figure 8.
Principal component analysis (PCA) biplots illustrating multivariate relationships among regrowth biomass, agronomic effectiveness, apparent nutrient recovery, and photochemical performance of ryegrass under different fertilizer treatments (CMG, BADSS, SADSS, BADSS + Ch, SADSS + Ch) (a) PCA based on dry biomass (Dry B), agronomic effectiveness (AE), apparent nutrient recovery (ANR), and the maximum quantum efficiency of photosystem II (Fv/Fm), shown separately for the 60-, 90-, and 120-day harvests and (b) PCA including dry biomass (Dry B), agronomic effectiveness (AE), apparent nutrient recovery (ANR), the effective quantum yield of PSII (Y(II)), and Fv/Fm, shown for the 60- and 90-day harvests. Legend at subfigure (a) applies also for the subfigure (b). Each bar denotes an average from 3 replicates.
Overall, both PCA approaches show that treatment differentiation at the early harvest was driven mainly by AE and ANR. At later harvests, the response became more integrated, and biomass production was directly associated with both nutrient recovery and PSII functioning. Treatments containing Ch were consistently positioned toward the vectors associated with dry biomass and photochemical parameters, particularly in the later stages of regrowth. This pattern indicates that the presence of Ch promoted a stronger coupling between nutrient recovery, PSII performance, and biomass production compared with treatments without Ch.
The multivariate pattern therefore indicates that the productivity of the grass mixture depended initially on agronomic efficiency and nutrient acquisition, and subsequently on the combined action of nutrient recovery and photochemical performance during continued regrowth.
6. Conclusions
This study demonstrates that pelleted recycled nutrient fertilizers (RNFs) derived from organic and mineral waste streams can match or exceed the agronomic performance of conventional cow manure granulate (CMG), provided that nitrogen (N) supply is properly balanced. Across increasing N application rates, agronomic effectiveness (AE) and apparent nutrient recovery (ANR) declined consistently, confirming a clear yield–efficiency trade-off and highlighting the necessity of dose optimization. Among the evaluated systems, SADSS exhibited the most stable performance across harvests, reflecting improved synchronization between N release and plant demand. Chitosan enrichment enhanced cumulative biomass production and late-season N uptake, particularly in the SADSS matrix, and reduced the sensitivity of ANR to increasing N loads. This treatment also maintained high and stable PSII efficiency (Fv/Fm), indicating favorable physiological status of the plants and confirming that chitosan-supported stimulation of plant performance occurred only when sufficient nutrient supply was provided. However, once total N input (pellet + booster N) was fully accounted for, part of the apparent efficiency gains diminished, underlining the importance of comprehensive nutrient accounting in biologically enriched fertilizers. BADSS + Ch showed greater variability and stronger efficiency collapse at high N rates, indicating that microbial or biopolymer stimulation cannot compensate for imbalanced nutrient composition. Overall, integrating productivity (AE), recovery (ANR), sensitivity indices, and soil physical responses provides a robust framework for assessing RNF sustainability. Properly formulated and dose-optimized recycled fertilizers, especially nutrient-balanced systems combined with functional organic amendments, represent a viable pathway toward circular nutrient management while maintaining agronomic efficiency and environmental resilience.
Supplementary Materials
The following supporting information can be downloaded at: https://www.mdpi.com/article/10.3390/app162110478/s1, Table S1: Nitrogen application rates and corresponding fertilizer amounts applied per pot in the greenhouse experiment.
Author Contributions
Conceptualization, K.K.; methodology, K.K., J.S. and A.W.; software, J.S. validation, N.N., J.S. and A.W.; formal analysis, K.K.; investigation, K.K., A.W., J.S. and N.N.; resources, A.W., J.S. and K.K.; data curation, K.K. and J.S.; writing—original draft preparation, K.K.; writing—review and editing, N.N., J.S. and A.W.; visualization, K.K., J.S. and N.N.; supervision, K.K.; project administration, K.K.; funding acquisition, K.K. All authors have read and agreed to the published version of the manuscript.
Funding
This research was co-funded under the project. This research was also co-funded by Ministerstwo Nauki i Szkolnictwa Wyższego (Ministry of Science and Higher Education of Poland) within the “Projekty Międzynarodowe Współfinansowane” (International Projects Co-financed) Program. This research was also co-funded by #049 INTERREG Baltic Sea Region “Circular Nutrients for the Baltic Sea Region” CiNURGi Project. This article is based upon work from COST Action FoodWaStop, CA22134, supported by COST (European Cooperation in Science and Technology).
Institutional Review Board Statement
Not applicable.
Informed Consent Statement
Not applicable.
Data Availability Statement
The data for this study were obtained by the team themselves, and the archived data set was not disclosed due to privacy.
Acknowledgments
The Authors would like to express their gratitude to Piotr Skowron and Damian Wach from the Institute of Soil Science and Plant Cultivation State Research Institute, Puławy, Poland, for providing the analysis of the BADSS and SADSS pellets displayed in Table 1; the lab technician Sabina Szymańska for her contribution to harvest assistance, sample preparation, and analyses (dry matter and N contents); and Assistant Izabela Konkol for the validation and critical comments during the manuscript preparation. During the preparation of this work, the authors used ChatGPT 6-for linguistic support and text refinement only. The tool was not used for data analysis, interpretation, or generation of scientific results. The authors reviewed and edited the content as needed and take full responsibility for the content of the published article.
Conflicts of Interest
Author Adrian Woźniak was employed by the company Rendben Ltd. The remaining authors declare that the research was conducted in the absence of any commercial or financial relationships that could be construed as a potential conflict of interest.
References
- Malerba, M.; Cerana, R. Chitosan Effects on Plant Systems. Int. J. Mol. Sci. 2016, 17, 996. [Google Scholar] [CrossRef] [Scilit]
- Abd-Elrahman, S.H.; El-Gabry, Y.A.E.G.; Hashem, F.A.; Ibrahim, M.F.M.; El-Hallous, E.I.; Abbas, Z.K.; Darwish, D.B.E.; Al-Harbi, N.A.; Al-Qahtani, S.M.; Taha, N.M. Influence of Nano-Chitosan Loaded with Potassium on Potassium Fractionation in Sandy Soil and Strawberry Productivity and Quality. Agronomy 2023, 13, 1126. [Google Scholar] [CrossRef] [Scilit]
- Li, K.; Xing, R.; Liu, S.; Li, P. Chitin and Chitosan Fragments Responsible for Plant Elicitor and Growth Stimulator. J. Agric. Food Chem. 2020, 68, 12203–12211. [Google Scholar] [CrossRef] [Scilit]
- Ruangwicha, J.; Cheirsilp, B.; Suyotha, W. Green Biorefinery of Shrimp Shell Waste for α-Chitin and High-Value Co-Products through Successive Fermentation by Co-Lactic Acid Bacteria and Proteolytic Fungus. Bioresour. Technol. 2024, 393, 130106. [Google Scholar] [CrossRef] [Scilit]
- Iñiguez-Moreno, M.; Santiesteban-Romero, B.; Melchor-Martínez, E.M.; Parra-Saldívar, R.; González-González, R.B. Valorization of Fishery Industry Waste: Chitosan Extraction and Its Application in the Industry. MethodsX 2024, 13, 102892. [Google Scholar] [CrossRef] [Scilit]
- Román-Doval, R.; Torres-Arellanes, S.P.; Tenorio-Barajas, A.Y.; Gómez-Sánchez, A.; Valencia-Lazcano, A.A. Chitosan: Properties and Its Application in Agriculture in Context of Molecular Weight. Polymers 2023, 15, 2867. [Google Scholar] [CrossRef] [Scilit]
- Nekvapil, F.; Ganea, I.V.; Ciorîță, A.; Hirian, R.; Ogresta, L.; Glamuzina, B.; Roba, C.; Pinzaru, S.C. Wasted Biomaterials from Crustaceans as a Compliant Natural Product Regarding Microbiological, Antibacterial Properties and Heavy Metal Content for Reuse in Blue Bioeconomy: A Preliminary Study. Materials 2021, 14, 4558. [Google Scholar] [CrossRef] [Scilit]
- Mathew, G.M.; Mathew, D.C.; Sukumaran, R.K.; Sindhu, R.; Huang, C.C.; Binod, P.; Sirohi, R.; Kim, S.H.; Pandey, A. Sustainable and Eco-Friendly Strategies for Shrimp Shell Valorization. Environ. Pollut. 2020, 267, 115656. [Google Scholar] [CrossRef] [Scilit]
- Hosney, A.; Ullah, S.; Barčauskaitė, K. A Review of the Chemical Extraction of Chitosan from Shrimp Wastes and Prediction of Factors Affecting Chitosan Yield by Using an Artificial Neural Network. Mar. Drugs 2022, 20, 675. [Google Scholar] [CrossRef] [Scilit]
- Kocięcka, J.; Liberacki, D. The Potential of Using Chitosan on Cereal Crops in the Face of Climate Change. Plants 2021, 10, 1160. [Google Scholar] [CrossRef] [Scilit]
- Gonfa, T.G.; Negessa, A.K.; Bulto, A.O. Isolation, Screening, and Identification of Chitinase-Producing Bacterial Strains from Riverbank Soils at Ambo, Western Ethiopia. Heliyon 2023, 9, e21643. [Google Scholar] [CrossRef] [Scilit]
- Veliz, E.A.; Martínez-Hidalgo, P.; Hirsch, A.M. Chitinase-Producing Bacteria and Their Role in Biocontrol. AIMS Microbiol. 2017, 3, 689–705. [Google Scholar] [CrossRef] [Scilit]
- Wang, Z.; Cai, Y.; Li, M.; Wan, X.; Mi, L.; Yang, W.; Hu, Y. Boosting One-Step Degradation of Shrimp Shell Waste to Produce Chitin Oligosaccharides at Smart Nanoscale Enzyme Reactor with Liquid-Solid System. Int. J. Biol. Macromol. 2024, 268, 131787. [Google Scholar] [CrossRef] [Scilit]
- Rengga, W.D.P.; Mubarok, M.A.; Cahyarini, N.S. Utilization of Shrimp Shell Waste as Matrix Controller by Using Ionotropic Gelation Method in Slow Release Fertilizer Based on Environmental Conservation. IOP Conf. Ser. Earth Environ. Sci. 2018, 171, 012036. [Google Scholar] [CrossRef] [Scilit]
- Shetranjiwalla, S.; Ononiwu, A. Identifying Barriers to Scaled-up Production and Commercialization of Chitin and Chitosan Using Green Technologies: A Review and Quantitative Green Chemistry Assessment. Int. J. Biol. Macromol. 2025, 305, 141062. [Google Scholar] [CrossRef] [Scilit]
- Bashiri, B.; Pinheiro, A.C.D.A.S.; Tappi, S.; Rocculi, P.; Kaleda, A.; Vilu, R. Life Cycle Assessment of Laboratory-Scale Chitosan Production: Comparison of High-Pressure Processing-Assisted and Conventional Methods. Proc. Est. Acad. Sci. 2025, 74, 1–14. [Google Scholar] [CrossRef] [Scilit]
- Sharp, R.G. A Review of the Applications of Chitin and Its Derivatives in Agriculture to Modify Plant-Microbial Interactions and Improve Crop Yields. Agronomy 2013, 3, 757–793. [Google Scholar] [CrossRef] [Scilit]
- Santos, V.P.; Marques, N.S.S.; Maia, P.C.S.V.; de Lima, M.A.B.; de Oliveira Franco, L.; de Campos-Takaki, G.M. Seafood Waste as Attractive Source of Chitin and Chitosan Production and Their Applications. Int. J. Mol. Sci. 2020, 21, 4290. [Google Scholar] [CrossRef] [Scilit]
- Ngasotter, S.; Xavier, K.A.M.; Meitei, M.M.; Waikhom, D.; Madhulika; Pathak, J.; Singh, S.K. Crustacean Shell Waste Derived Chitin and Chitin Nanomaterials for Application in Agriculture, Food, and Health—A Review. Carbohydr. Polym. Technol. Appl. 2023, 6, 100349. [Google Scholar] [CrossRef] [Scilit]
- Tang, Y.; Zhan, T.; Fan, G.; Huang, J.; Zhou, Y.; Yuan, X.; Li, K.; Chen, S.; Zhao, X.; Hu, C. Selenium Combined with Chitin Reduced Phosphorus Leaching in Soil with Pomelo by Driving Soil Phosphorus Cycle via Microbial Community. J. Environ. Chem. Eng. 2022, 10, 107060. [Google Scholar] [CrossRef] [Scilit]
- Kuligowski, K.; Woźniak, A.; Strycharz, J.; Nawrot, N.; Wojciechowska, E.; Cordeiro, C.M.; Erik Sindhøj, A.P. Yield-Efficiency Trade-Offs for Pelleted Recycled Nutrient Fertilizers with a Fermented Microbial Amendment: Integrating Nitrogen Use Efficiency and Agronomic Effectiveness. J. Environ. Qual. 2026; in press.
- Publications Office of the European Union. Regulation (EU) 2019/1009 of the European Parliament and of the Council of 5 June 2019 Laying Down Rules on the Making Available on the Market of EU Fertilising Products; Publications Office of the European Union: Luxembourg, 2019. [Google Scholar]
- Verardi, A.; Sangiorgio, P.; Moliterni, S.; Errico, S.; Spagnoletta, A.; Dimatteo, S. Advanced Technologies for Chitin Recovery from Crustacean Waste. Clean Technol. Recycl. 2023, 3, 4–43. [Google Scholar] [CrossRef] [Scilit]
- Ahmed, H.A.; El-Maradny, Y.A.; Shalaby, M.A.; El-Menshawy, H.; Abd EL-Wahab, A.E. Isolation and Characterization of Chitosan from Shrimp Shell Waste and the Sustainable Preparation of Salicylic Acid-Loaded Chitosan Nanoparticles for Antibiofilm Applications. Sci. Rep. 2025, 15, 19263. [Google Scholar] [CrossRef] [Scilit]
- Antonino, R.S.C.M.D.Q.; Fook, B.R.P.L.; Lima, V.A.D.O.; Rached, R.Í.D.F.; Lima, E.P.N.; Lima, R.J.D.S.; Covas, C.A.P.; Fook, M.V.L. Preparation and Characterization of Chitosan Obtained from Shells of Shrimp (Litopenaeus Vannamei Boone). Mar. Drugs 2017, 15, 141. [Google Scholar] [CrossRef] [Scilit]
- Hu, X.; Tian, Z.; Li, X.; Wang, S.; Pei, H.; Sun, H.; Zhang, Z. Green, Simple, and Effective Process for the Comprehensive Utilization of Shrimp Shell Waste. ACS Omega 2020, 5, 19227–19235. [Google Scholar] [CrossRef] [Scilit]
- Polskiej, R.; Za, M.; Ejmu, Ł.K.A.S.; Zypo, R.Z.E.C.; Li, S.P.O.; Po, T.E.J.; Ki, L.S. Dziennik Ustaw; Government Legislation Centre: Warszawa, Poland, 2024. [Google Scholar] [CrossRef] [Scilit]
- Kuligowski, K.; Strycharz, J.; Nawrot, N.; Kluska, J.; Konkol, I.; Wojciechowska, E.; Cenian, A. Recycling Organic Waste to Biochar Amended Soils Stabilizes Miscanthus x Giganteus Growth. Renew. Sustain. Energy Rev. 2025, 215, 115581. [Google Scholar] [CrossRef] [Scilit]
- Rayment, G.E.; Higginson, F.R. Australian Laboratory Handbook of Soil and Water Chemical Methods; Inkata Press: Melbourne, Australia, 1992. [Google Scholar]
- Kuligowski, K.; Konkol, I.; Świerczek, L.; Chojnacka, K.; Cenian, A.; Szufa, S. Evaluation of Kitchen Waste Recycling as Organic N-Fertiliser for Sustainable Agriculture under Cool and Warm Seasons. Sustainability 2023, 15, 7997. [Google Scholar] [CrossRef] [Scilit]
- Kuligowski, K.; Konkol, I.; Świerczek, L.; Woźniak, A.; Cenian, A. Conversion of Kitchen Waste into Sustainable Fertilizers: Comparative Effectiveness of Biological, Microbial, and Thermal Treatments in a Ryegrass Growth Trial. Appl. Sci. 2025, 15, 5281. [Google Scholar] [CrossRef] [Scilit]
- Kuligowski, K.; Cenian, A.; Konkol, I.; Świerczek, L.; Chojnacka, K.; Izydorczyk, G.; Skrzypczak, D.; Bandrów, P. Application of Leather Waste Fractions and Their Biochars as Organic Fertilisers for Ryegrass Growth: Agri-Environmental Aspects and Plants Response Modelling. Energies 2023, 16, 3883. [Google Scholar] [CrossRef] [Scilit]
- Congreves, K.A.; Otchere, O.; Ferland, D.; Farzadfar, S.; Williams, S.; Arcand, M.M. Nitrogen Use Efficiency Definitions of Today and Tomorrow. Front. Plant Sci. 2021, 12, 637108. [Google Scholar] [CrossRef] [Scilit]
- Antille, D.L.; Moody, P.W. Nitrogen Use Efficiency Indicators for the Australian Cotton, Grains, Sugar, Dairy and Horticulture Industries. Environ. Sustain. Indic. 2021, 10, 100099. [Google Scholar] [CrossRef] [Scilit]
- Dobermann, A. Fertilizer Best Management Practices General Principles; Krauss, A., Isherwood, K., Heffer, P., Eds.; International Fertilizer Industry Association: Paris, France, 2007; ISBN 295231392X. [Google Scholar]
- Genty, B.; Briantais, J.-M.; Baker, N.R. The Relationship between the Quantum Yield of Photosynthetic Electron Transport and Quenching of Chlorophyll Fluorescence. Biochim. Biophys. Acta-Gen. Subj. 1989, 990, 87–92. [Google Scholar] [CrossRef] [Scilit]
- Björkman, O.; Demmig, B. Photon Yield of O2 Evolution and Chlorophyll Fluorescence Characteristics at 77 K among Vascular Plants of Diverse Origins. Planta 1987, 170, 489–504. [Google Scholar] [CrossRef] [Scilit]
- Rossi, G.; Beni, C.; Benedetti, A.; Felici, B.; Neri, U. Effect of Mineral or OFMSW Digestate Fertilization on Ryegrass and Nitrogen Leaching. Agronomy 2023, 13, 1316. [Google Scholar] [CrossRef] [Scilit]
- Bergstrand, K.J. Organic Fertilizers in Greenhouse Production Systems—A Review. Sci. Hortic. 2022, 295, 110855. [Google Scholar] [CrossRef] [Scilit]
- Bach, I.M.; Essich, L.; Bauerle, A.; Müller, T. Efficiency of Phosphorus Fertilizers Derived from Recycled Biogas Digestate as Applied to Maize and Ryegrass in Soils with Different PH. Agriculture 2022, 12, 325. [Google Scholar] [CrossRef] [Scilit]
- Westerik, D.; Hoffland, E.; Hijbeek, R. Nitrogen Fertilizer Replacement Values of Organic Amendments: Determination and Prediction. Nutr. Cycl. Agroecosystems 2024, 129, 445–458. [Google Scholar] [CrossRef] [Scilit]
- Hirel, B.; Tétu, T.; Lea, P.J.; Dubois, F. Improving Nitrogen Use Efficiency in Crops for Sustainable Agriculture. Sustainability 2011, 3, 1452–1485. [Google Scholar] [CrossRef] [Scilit]
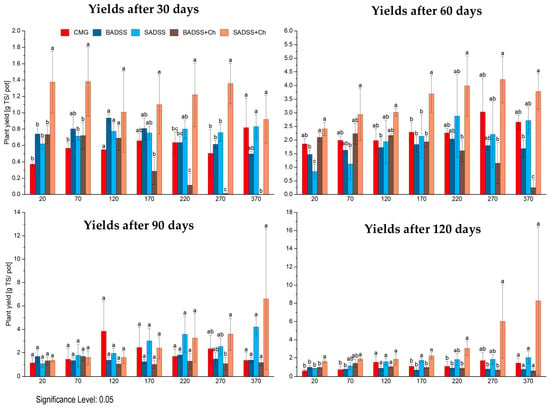
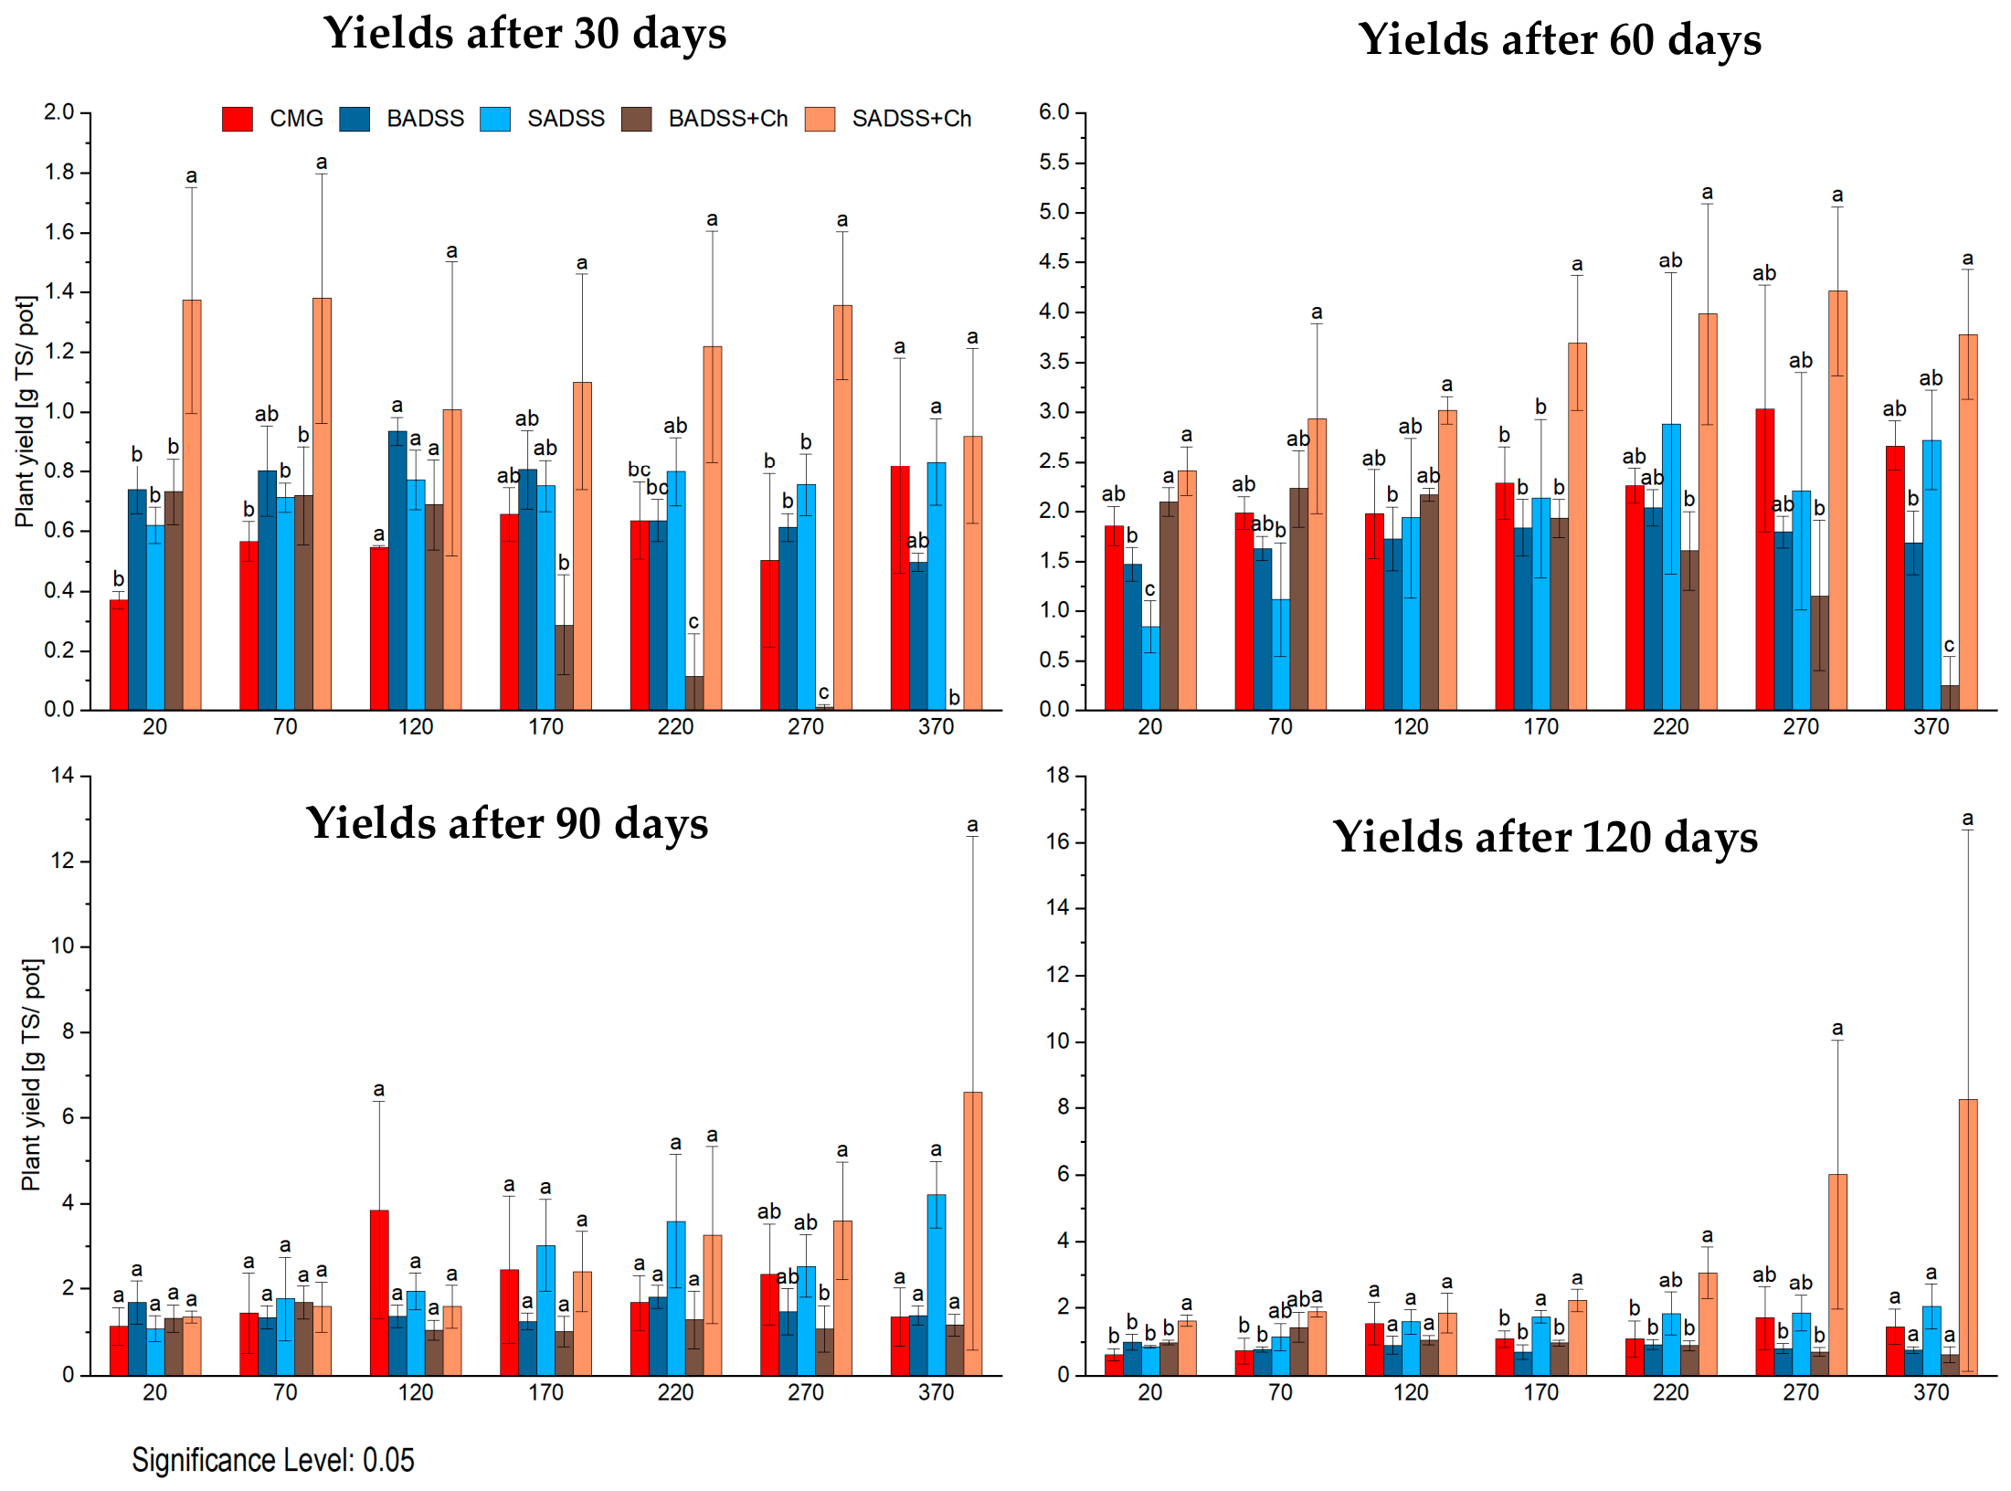
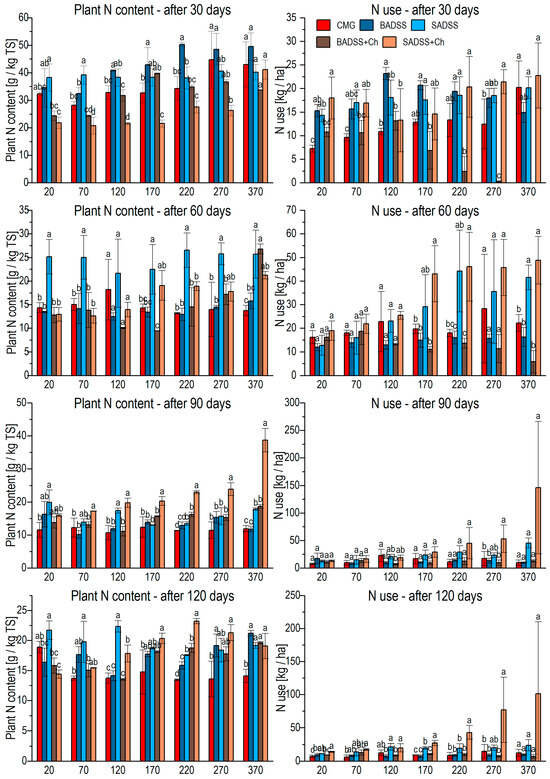
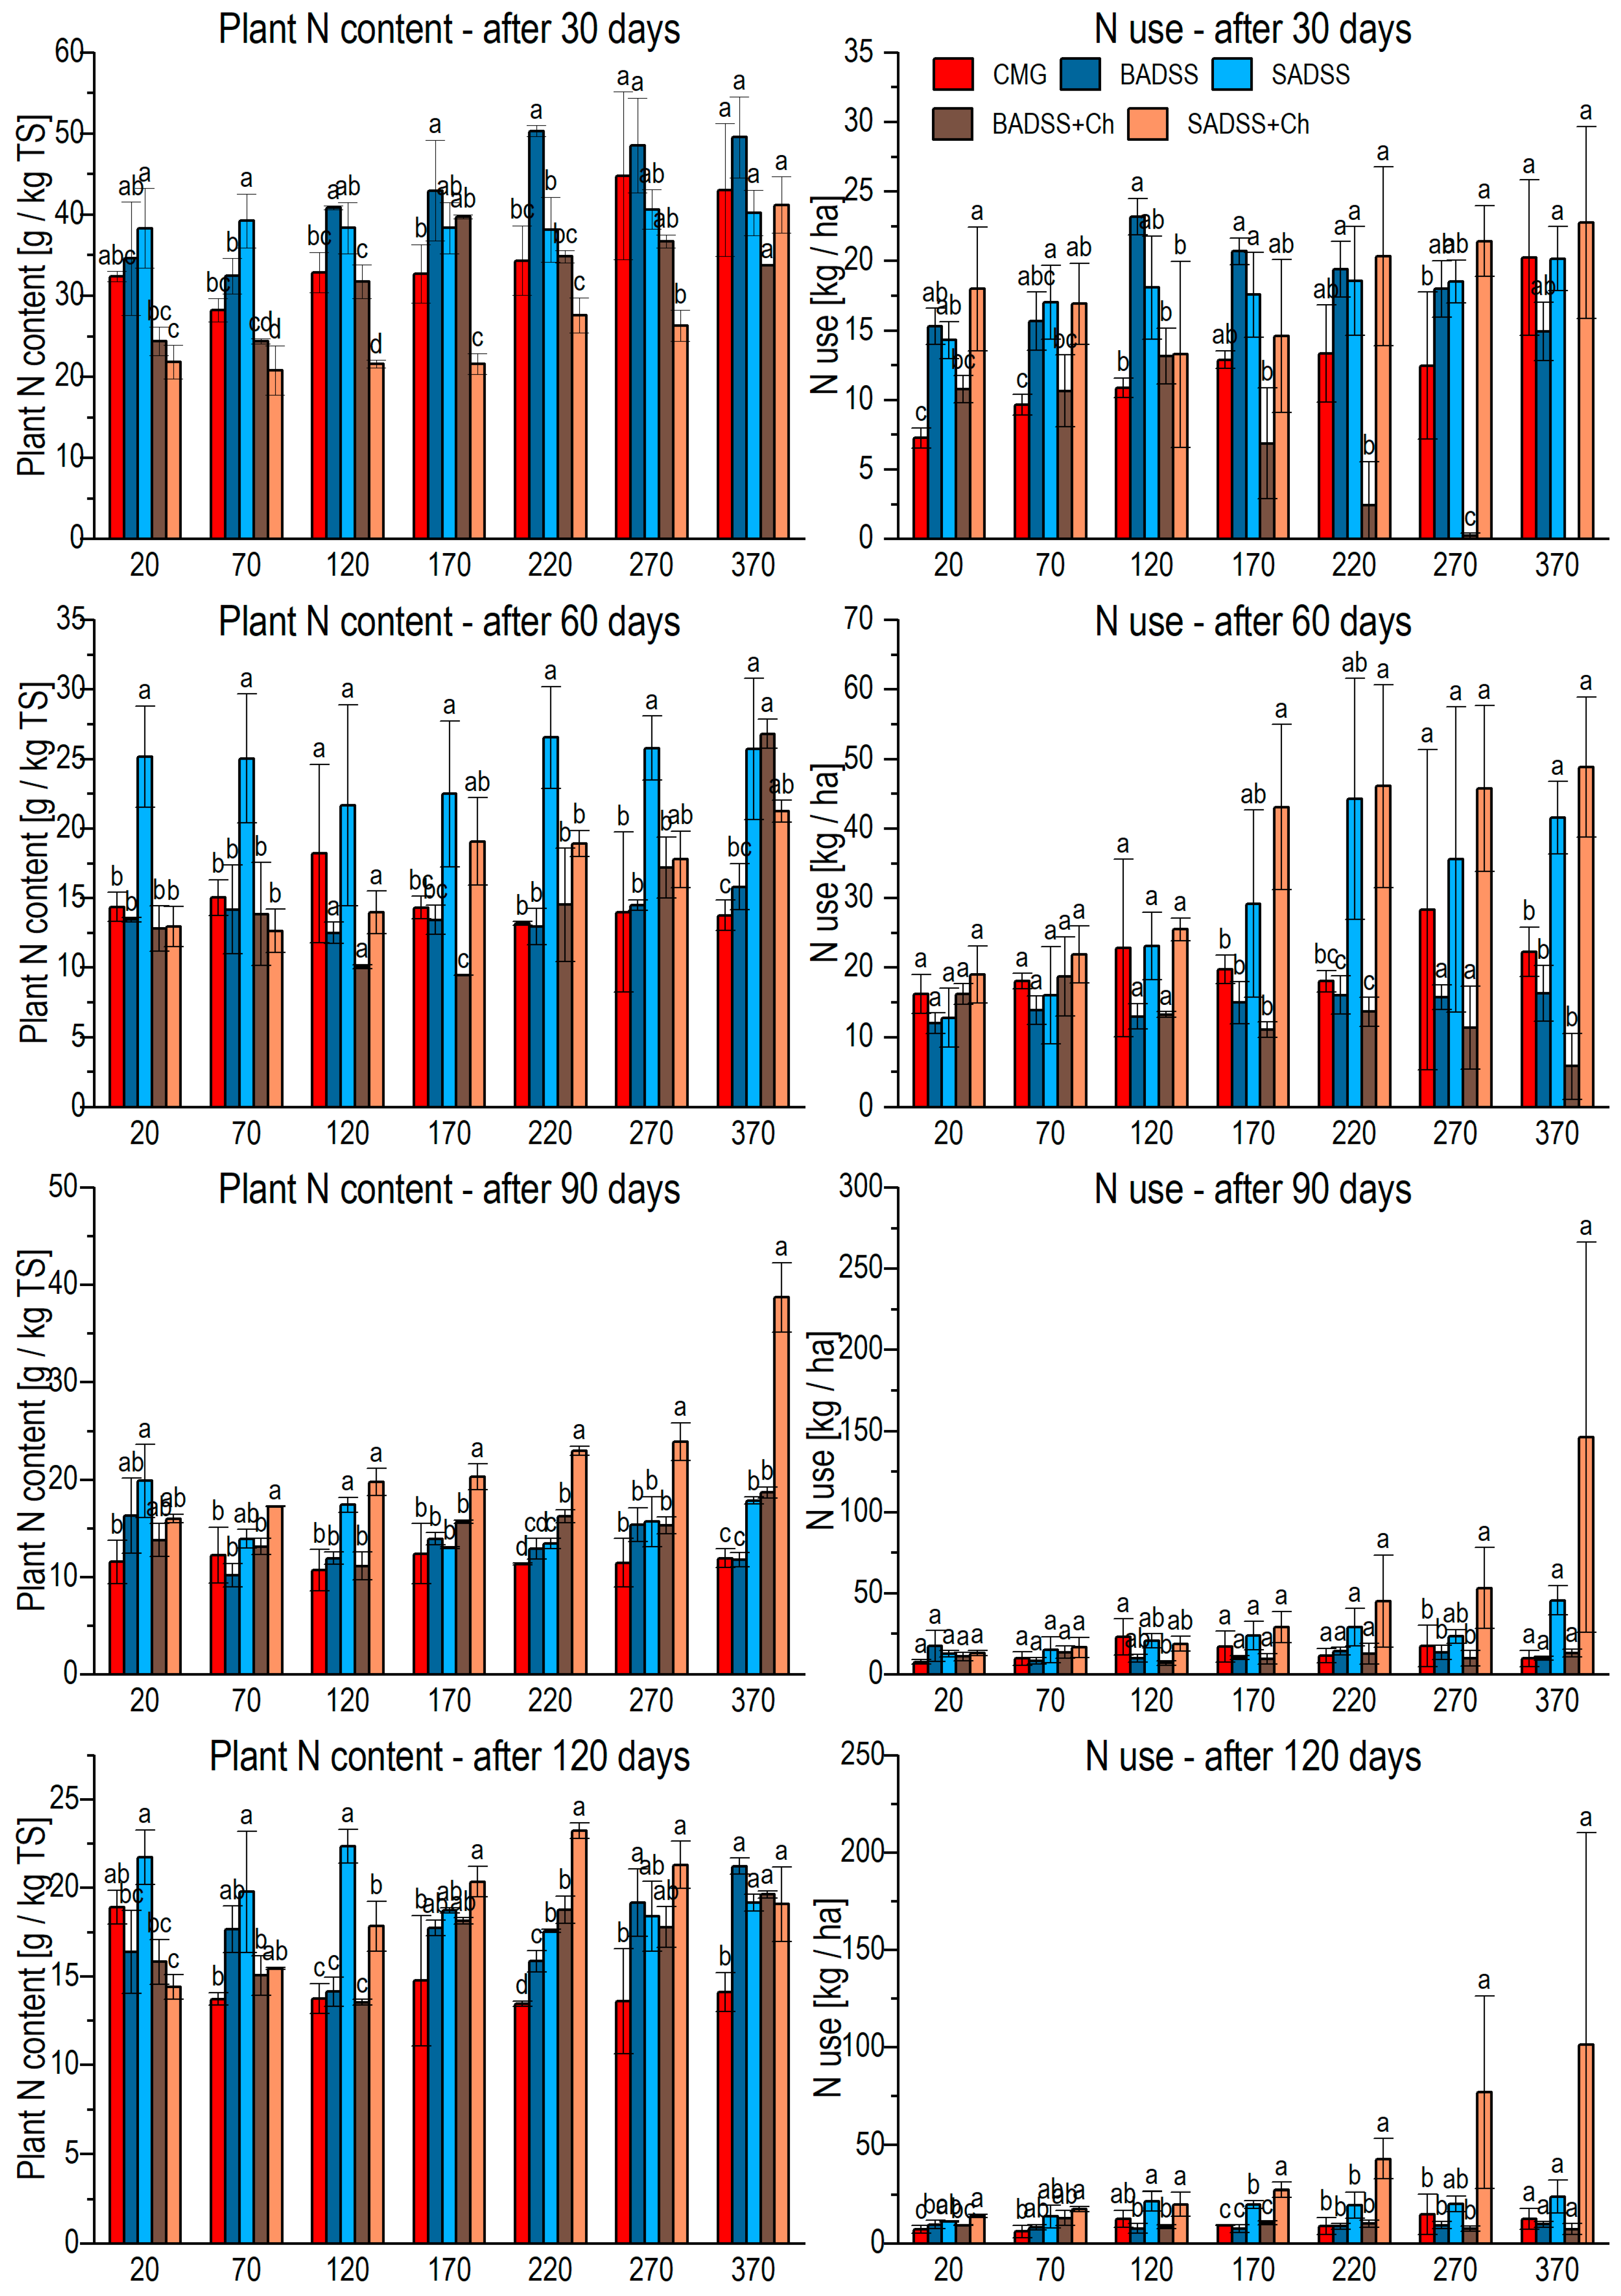
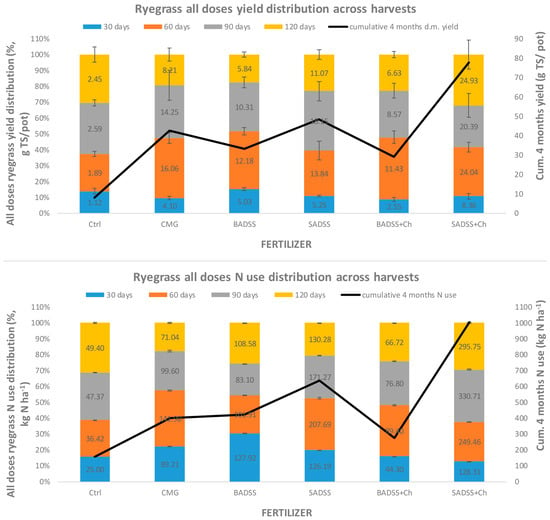
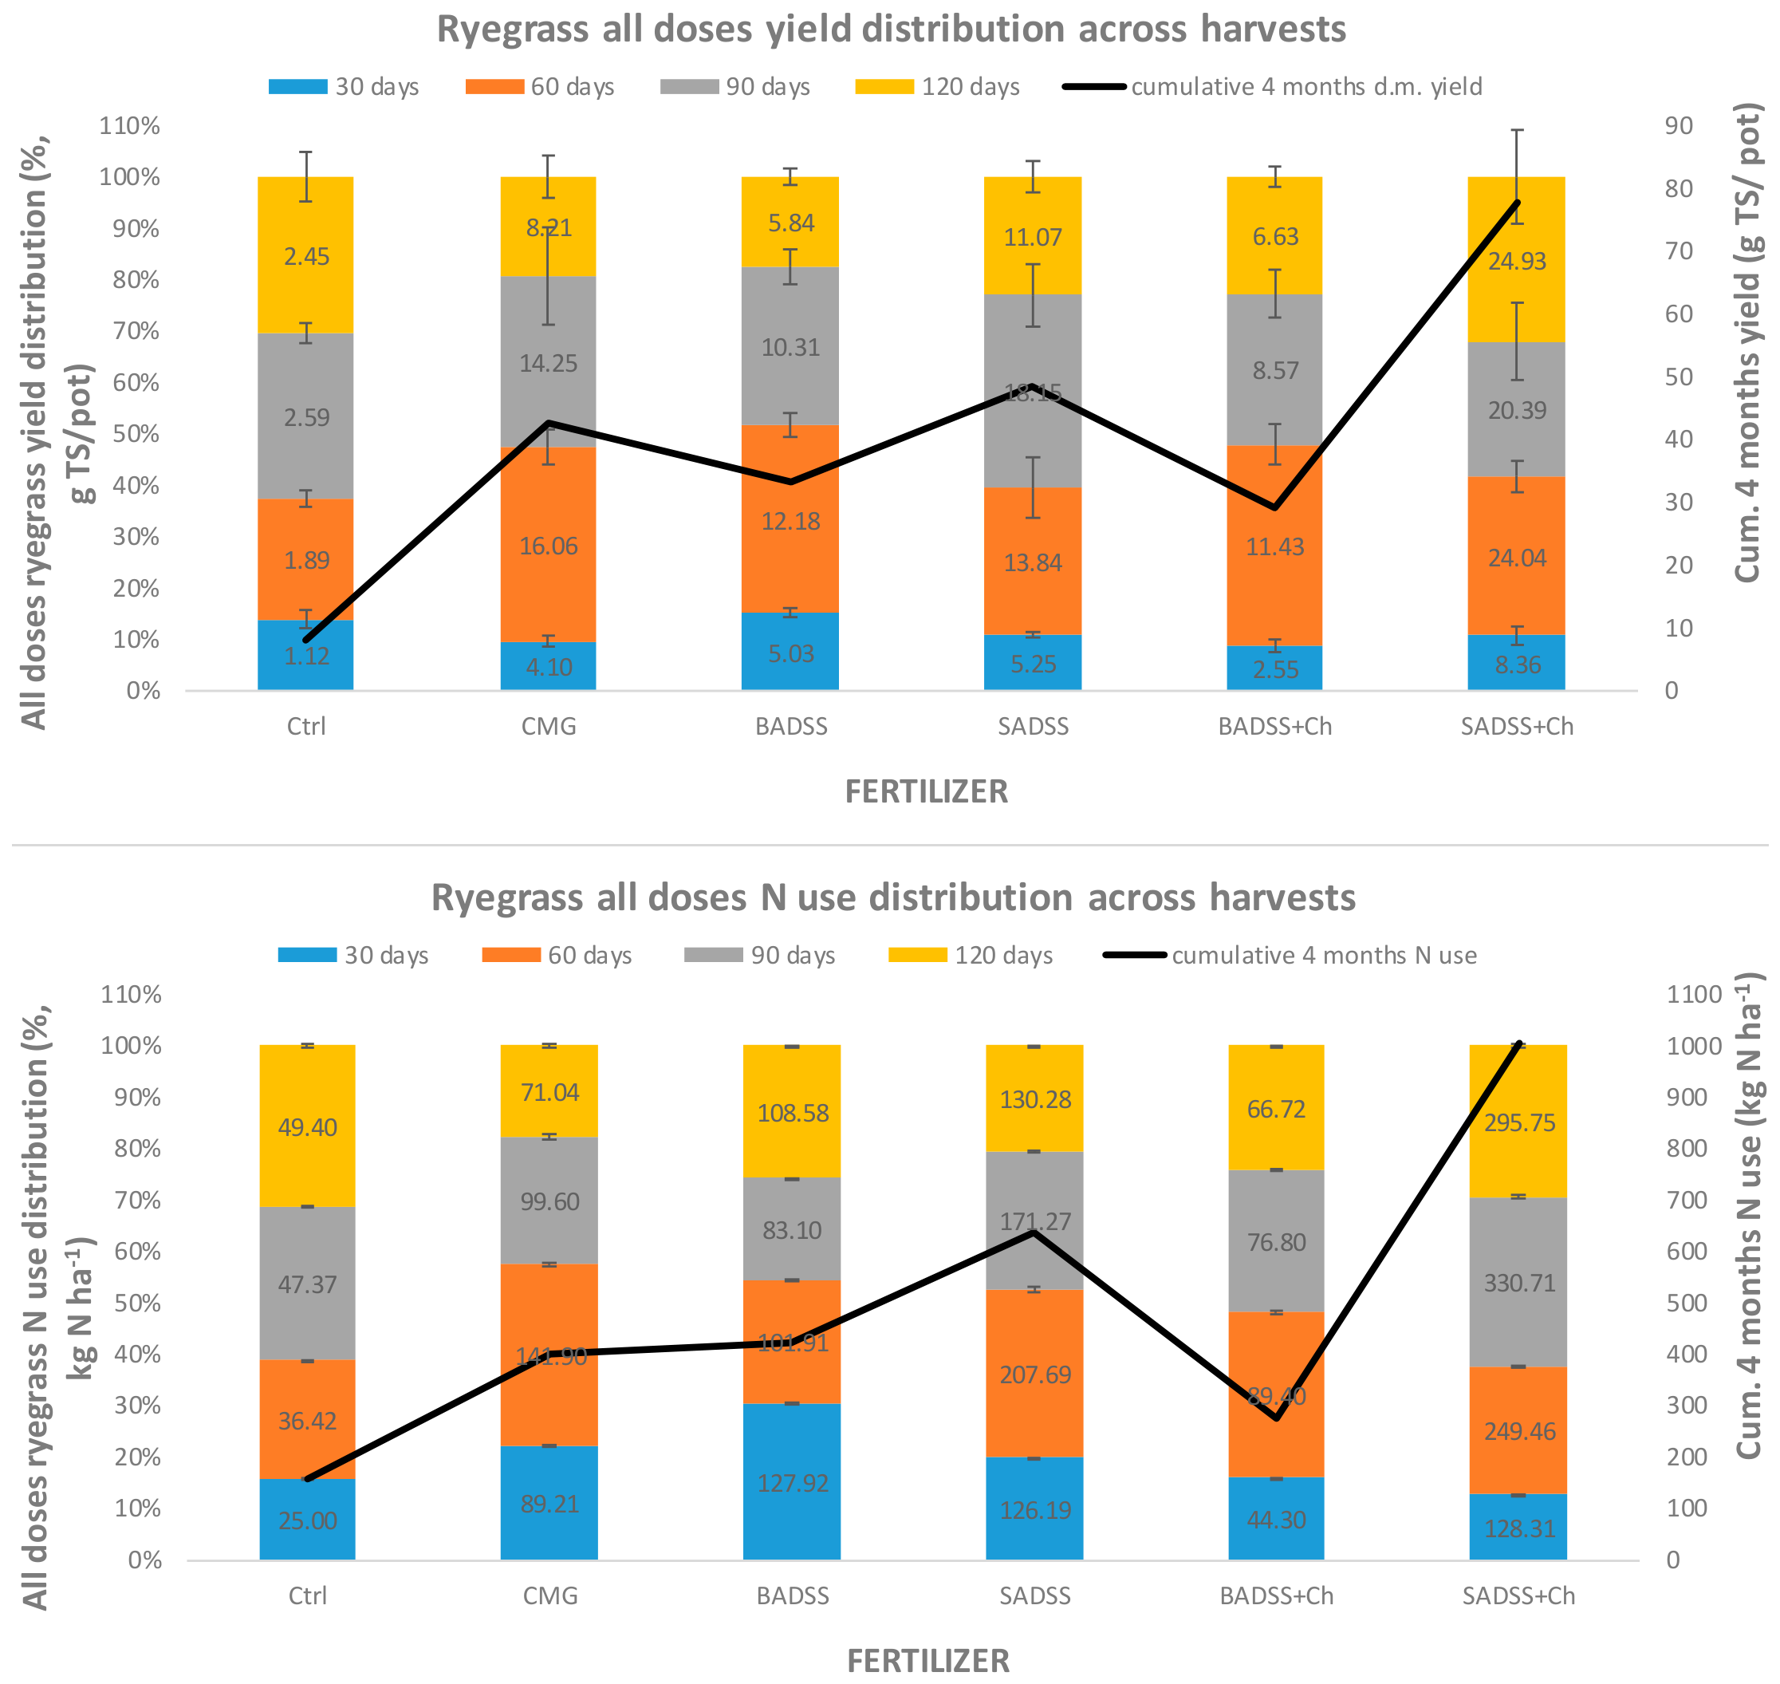
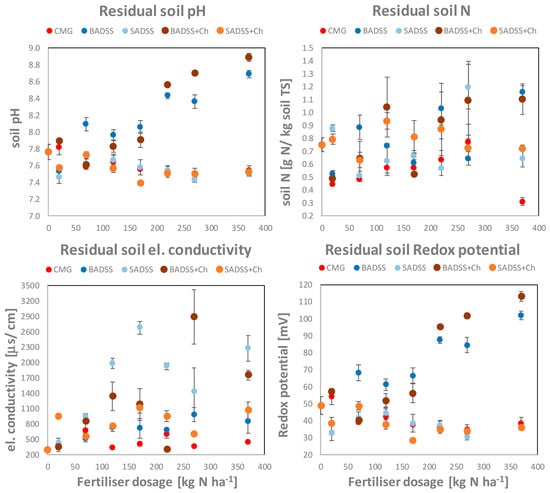
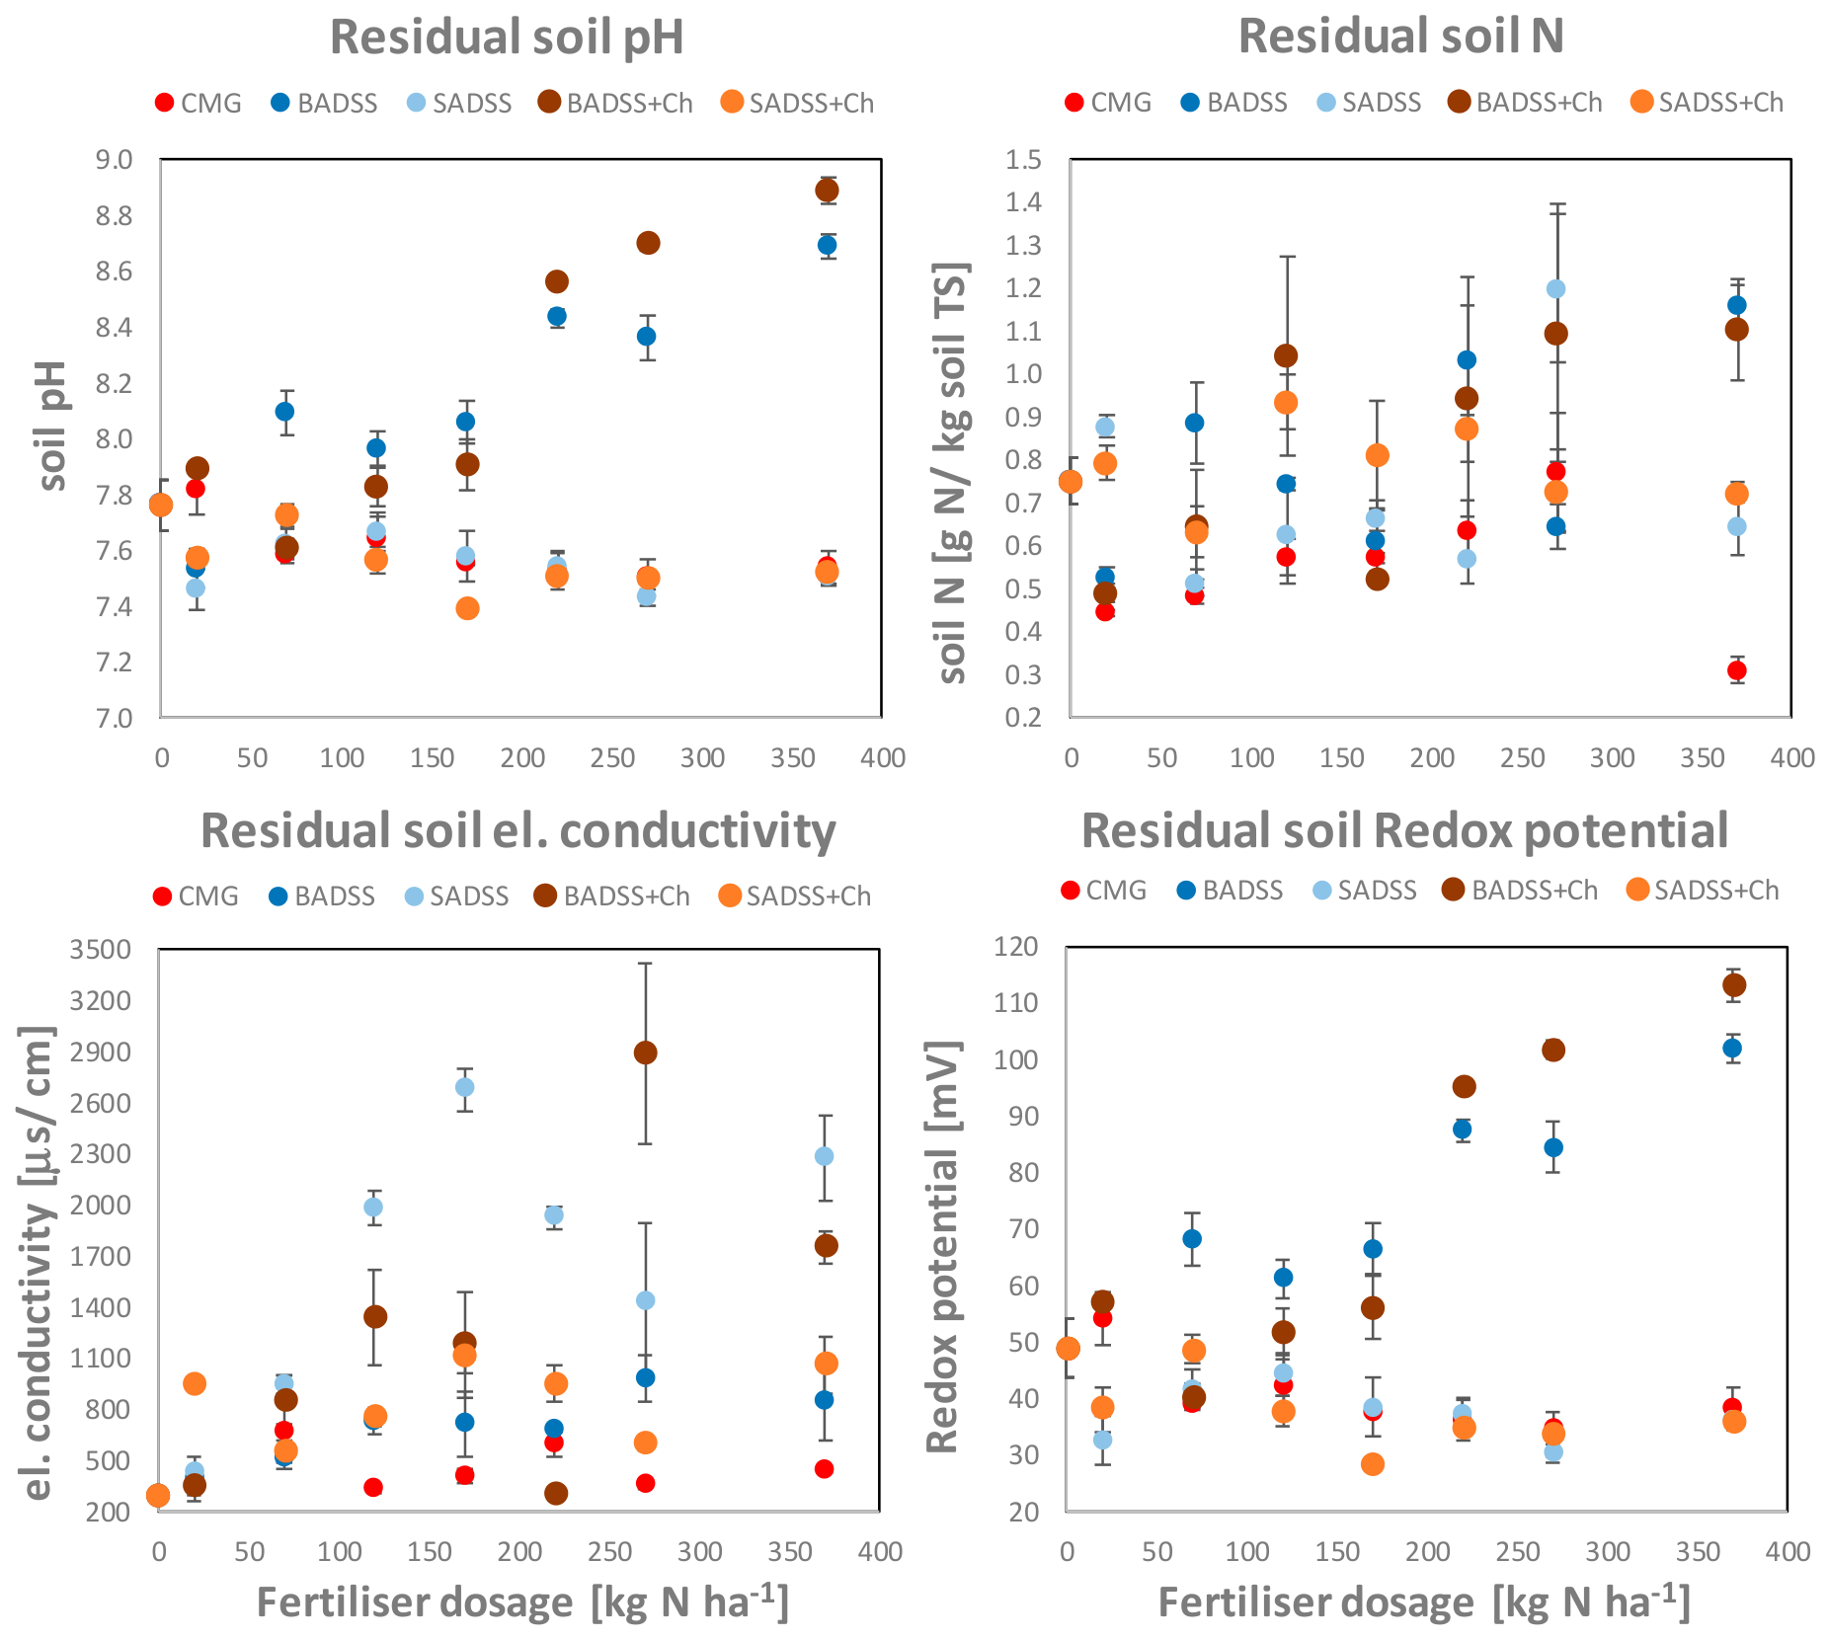
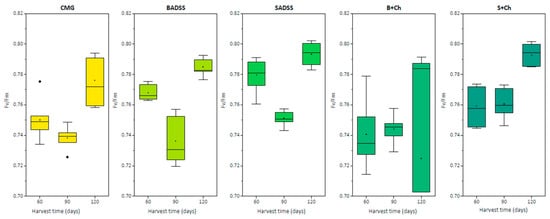
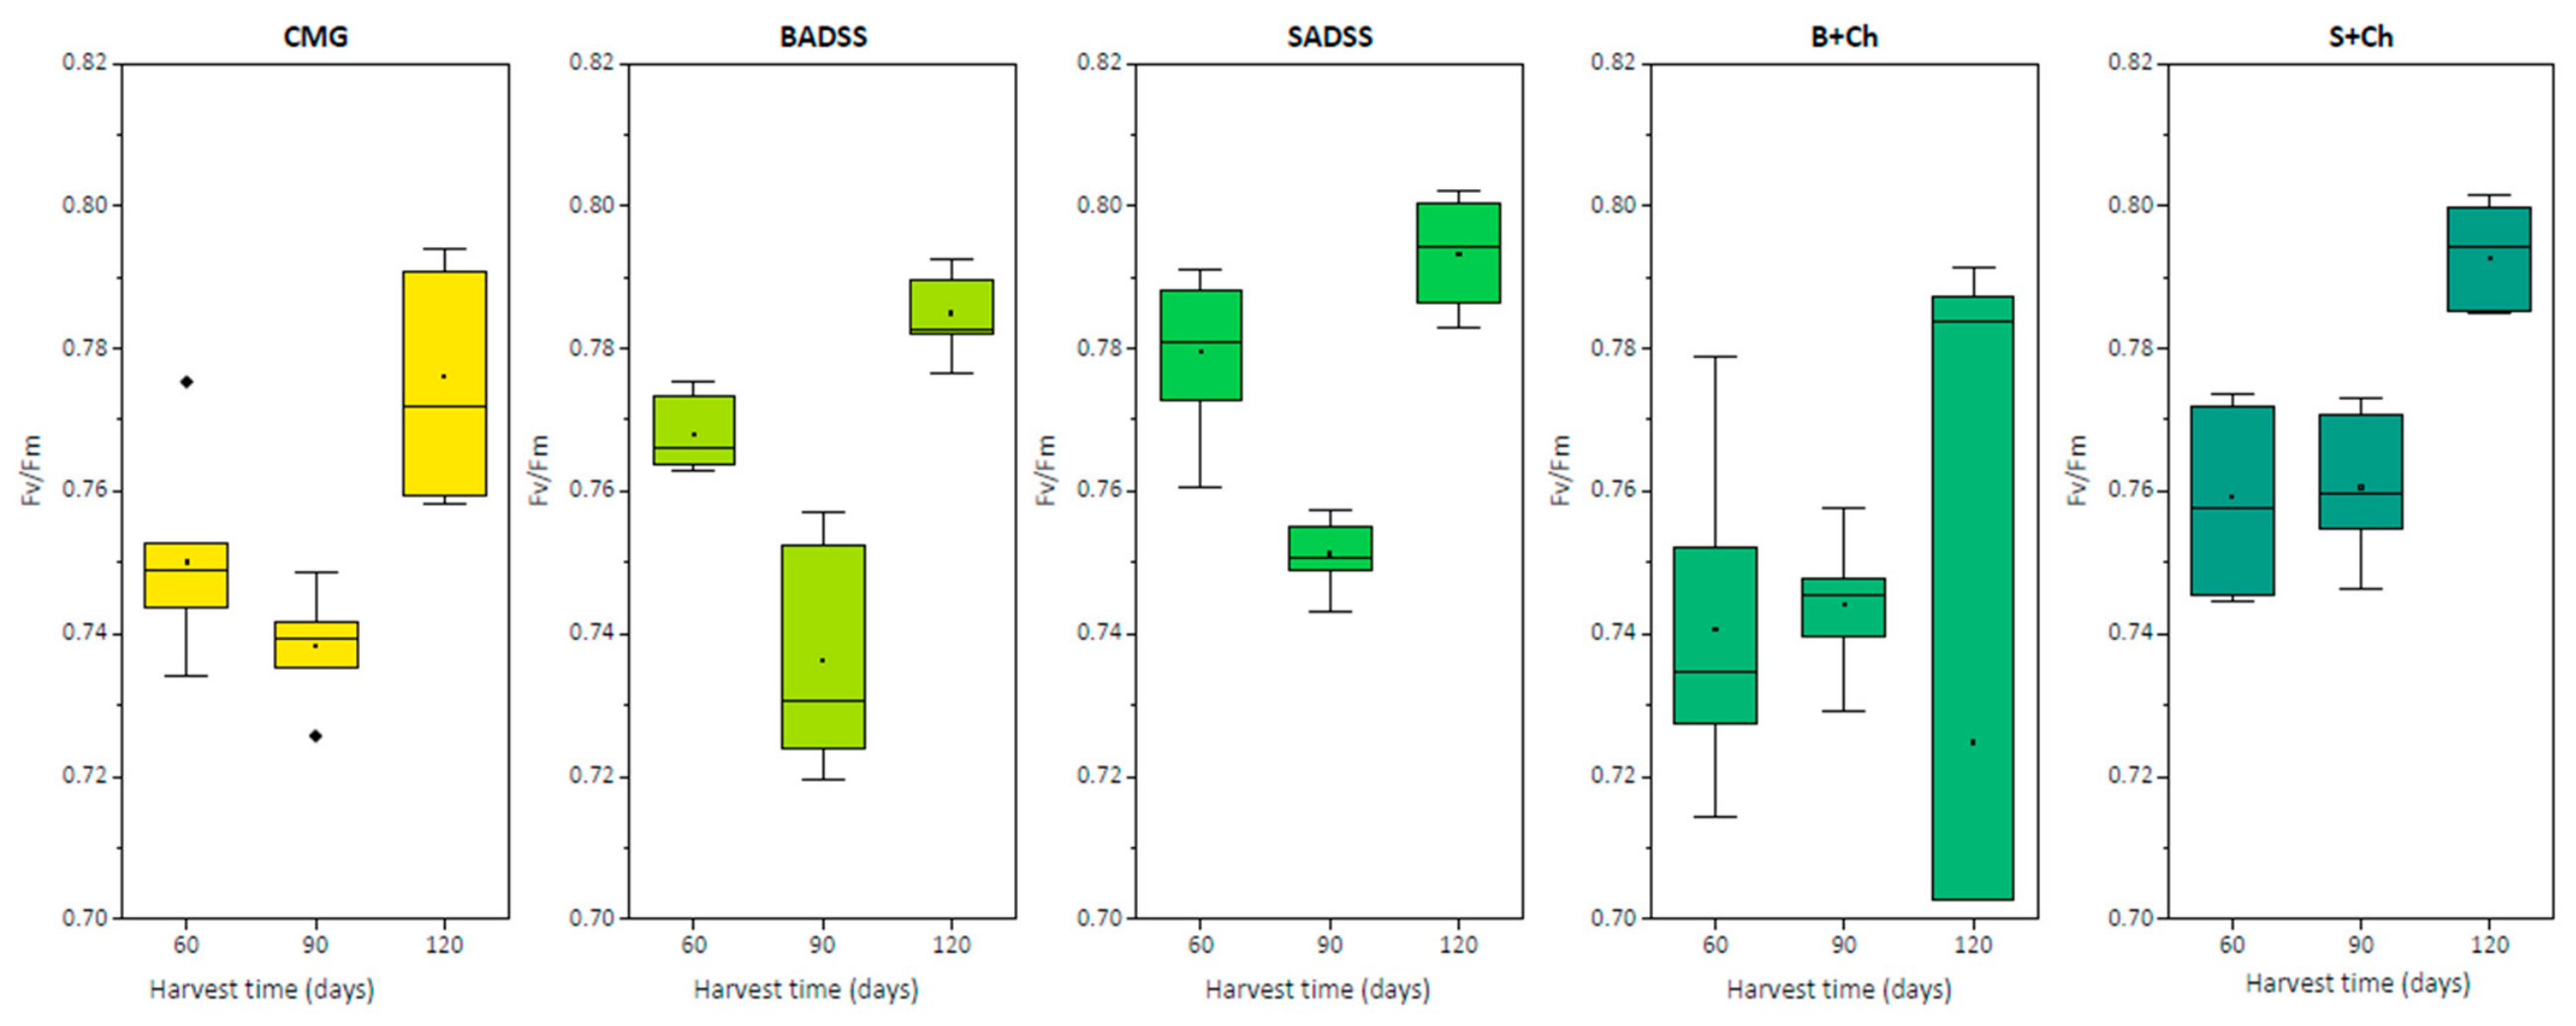
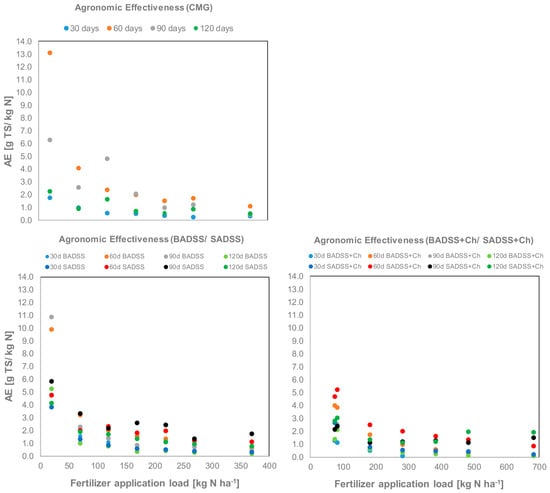
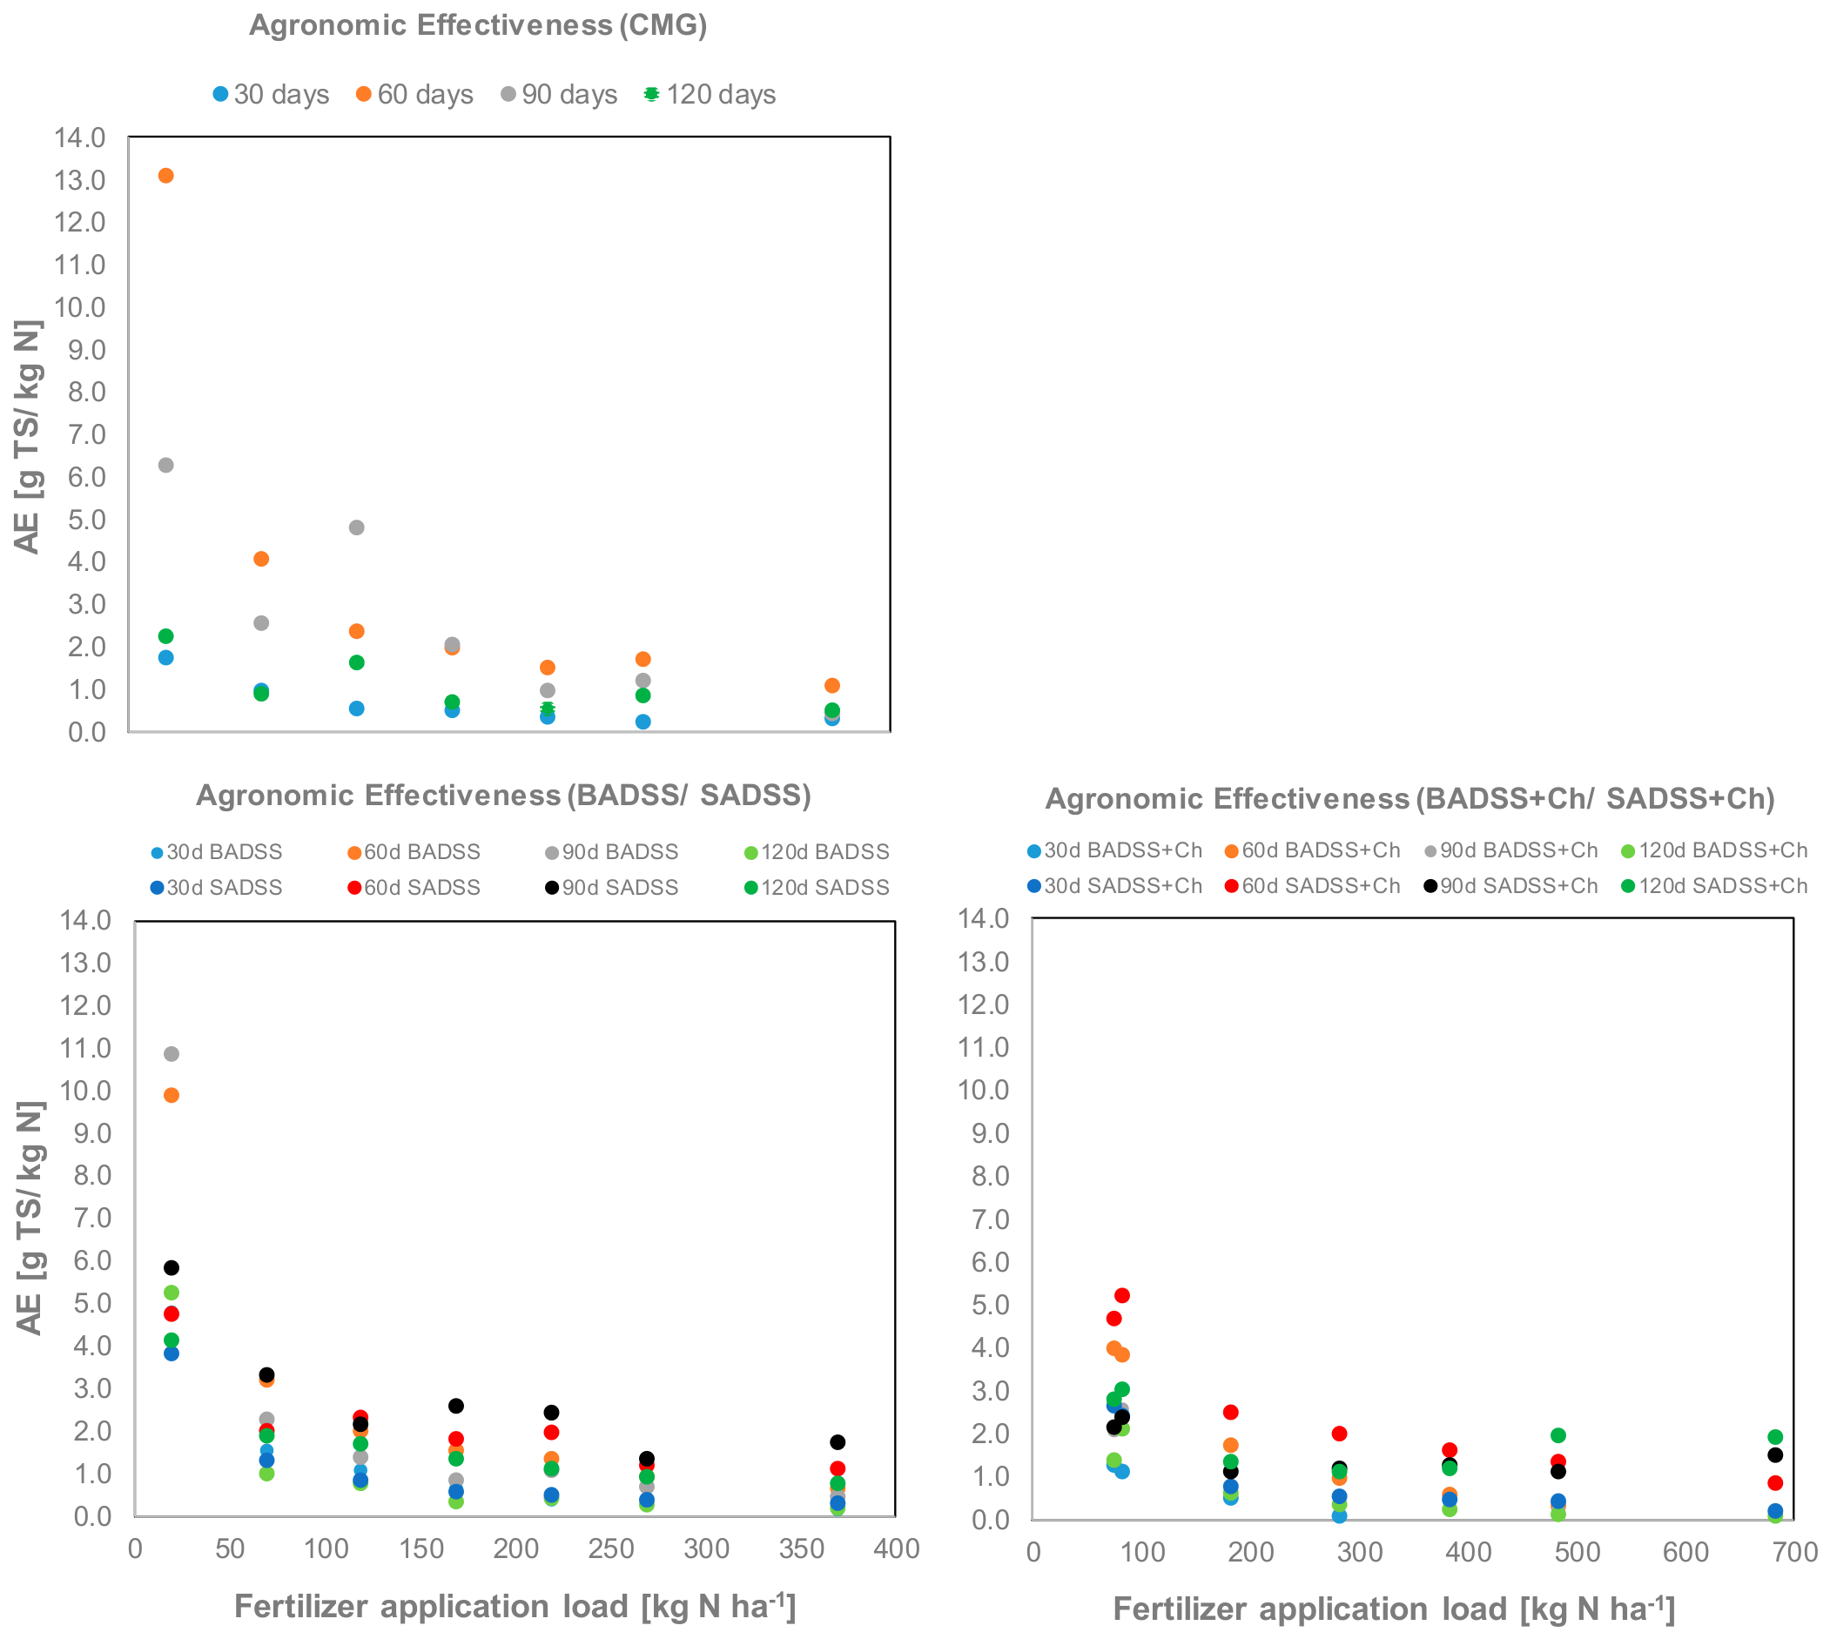
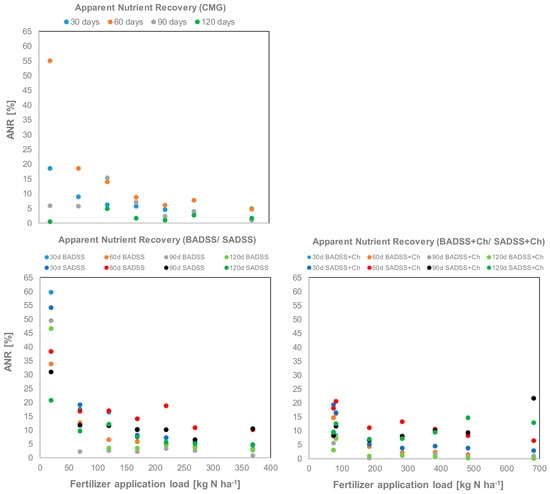
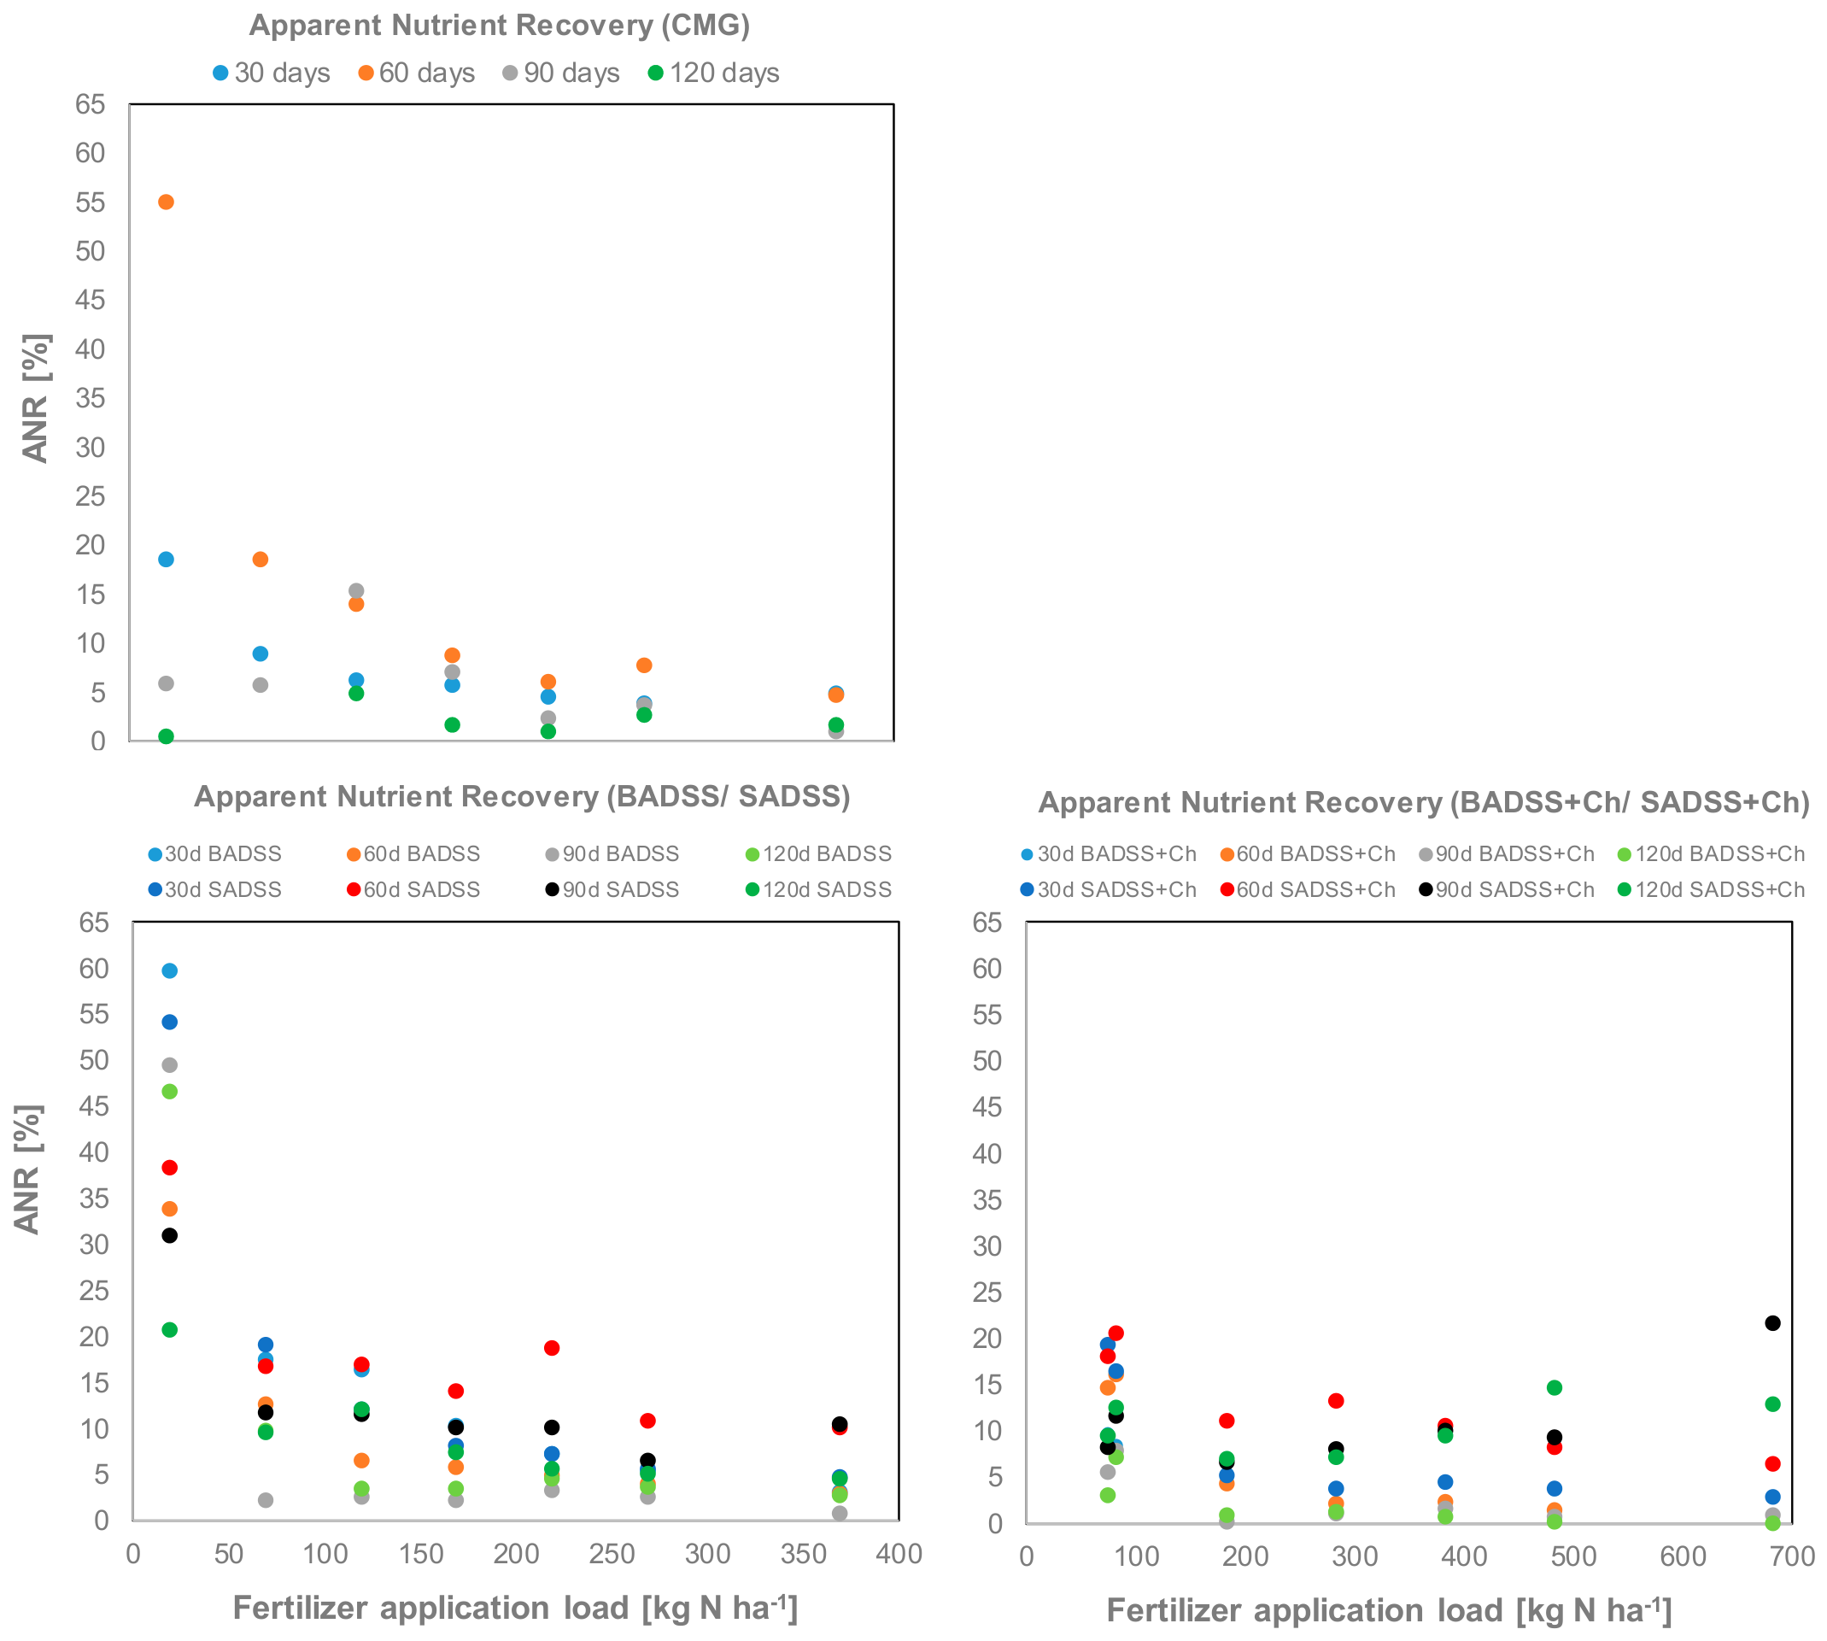
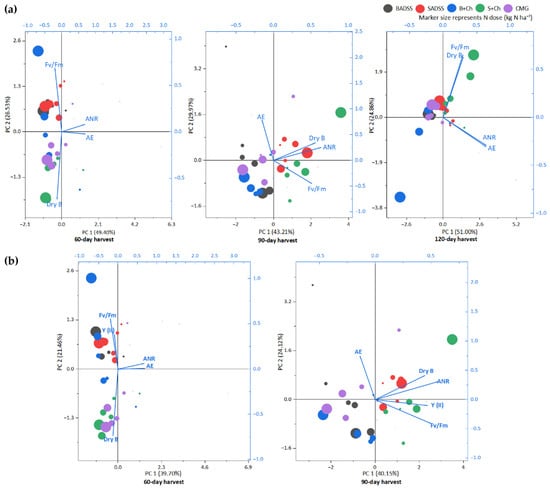
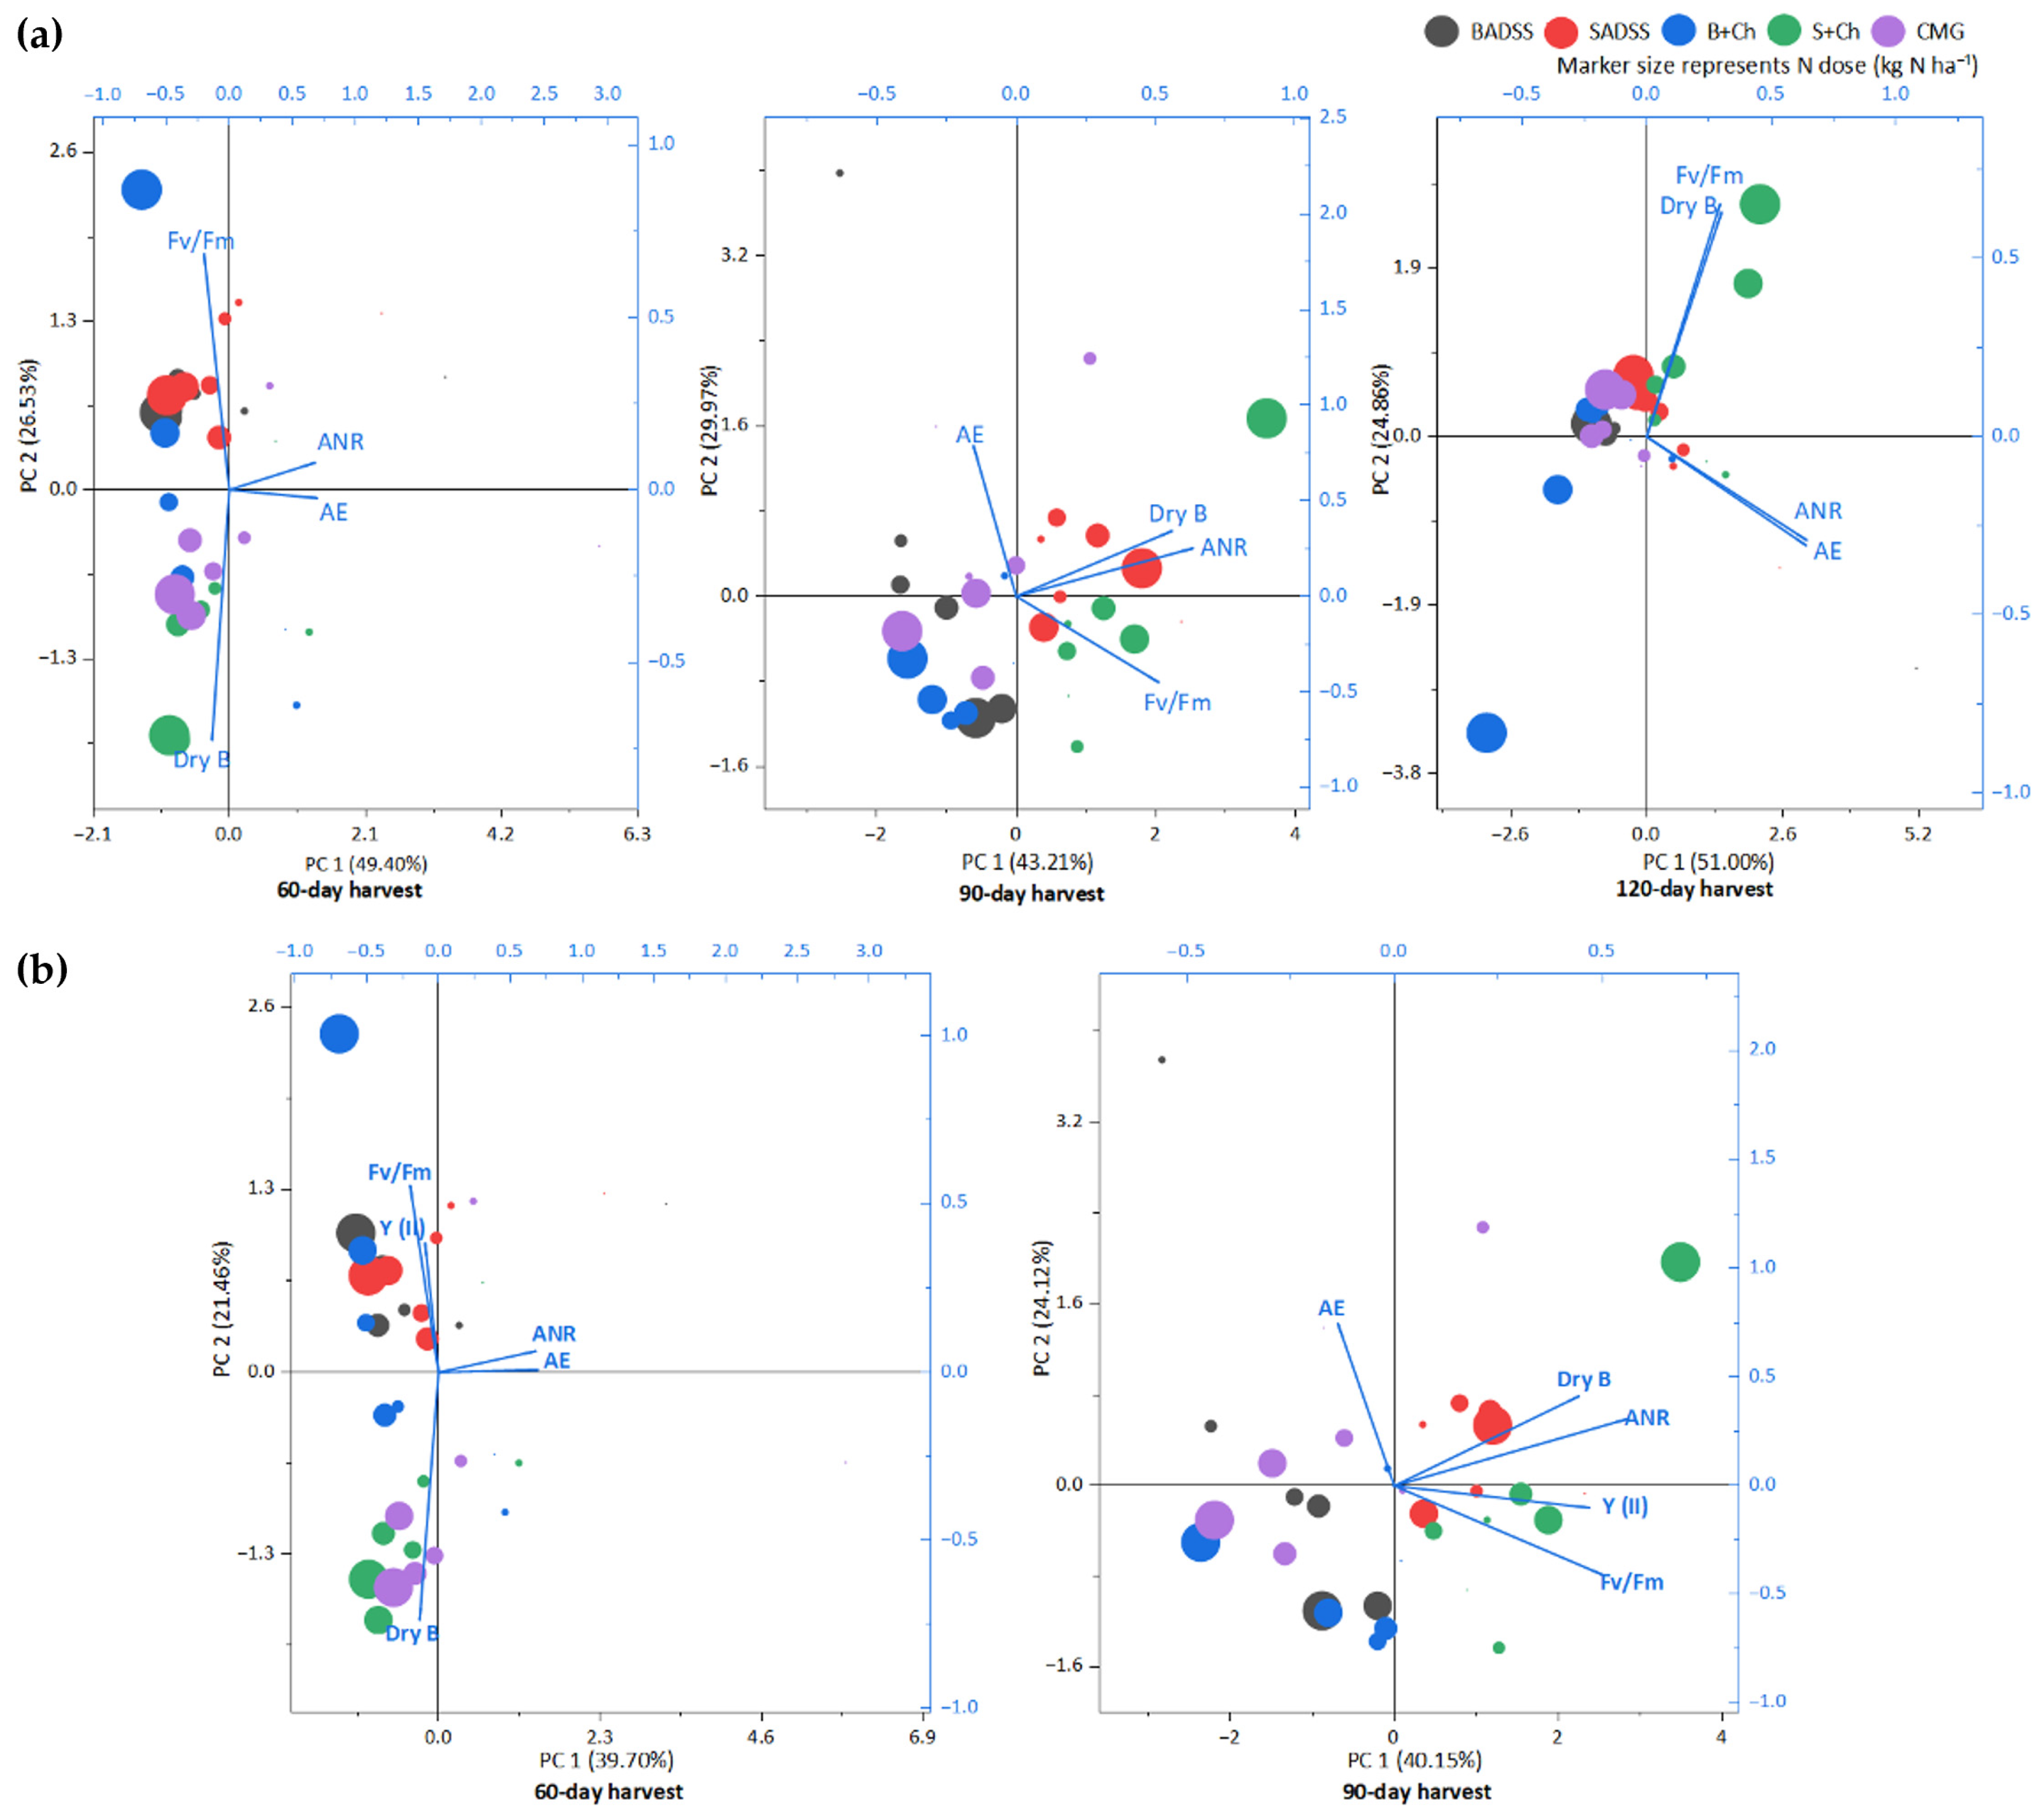

Disclaimer/Publisher’s Note: The statements, opinions and data contained in all publications are solely those of the individual author(s) and contributor(s) and not of MDPI and/or the editor(s). MDPI and/or the editor(s) disclaim responsibility for any injury to people or property resulting from any ideas, methods, instructions or products referred to in the content. |
© 2026 by the authors. Licensee MDPI, Basel, Switzerland. This article is an open access article distributed under the terms and conditions of the Creative Commons Attribution (CC BY) license.