


Abstract
Excavation-induced unloading alters the stress distribution and support demand in high and steep rock slopes. This study investigates a rock slope near the mainline toll station of the Xiangyang–Yichang Expressway. A FLAC3D model simulates seven-stage excavation. Displacement, plastic-zone distribution, factor of safety, and bolt axial force are presented for unsupported and sequentially supported conditions. Rock-bolt support reduces the final maximum total displacement from 2.895 to 1.442 mm, a reduction of 50.2%. It also increases the factor of safety from 1.129 to 1.316, an increase of 16.6%. The factor of safety reaches a temporary peak at Stage 3 without support and at Stage 4 with support. It then decreases. The maximum bolt force increases sharply at Stage 6. This indicates increased support demand during the later excavation stages. Comparisons with field measurements yield a mean absolute relative error of 11.6% for slope-surface displacement. The monitoring points lie near the heads of the bolts carrying the stage-wise maximum axial forces. The mean absolute relative error of the computed maximum bolt axial force is 9.7%. Five fixed monitoring locations further characterize the spatial distribution and temporal evolution of local responses. Sensitivity analyses examine bolt length, inclination, and horizontal and vertical spacing. They quantify the effects of these parameters on the factor of safety. The results clarify the relationship between excavation sequence, reinforcement mobilization, and slope stability for the investigated slope.
1. Introduction
High and steep rock slopes are common in highway, railway, water resources, hydropower, and open-pit mining projects. Excavation-induced unloading alters the initial stress path and may trigger sliding of high slopes. Slope instability can threaten safety during construction and operation. It can also cause traffic disruption and substantial economic losses. Slope heights are increasing, geological conditions are becoming more complex, and safety requirements are becoming more stringent. Accordingly, stability assessment in modern rock-slope engineering has gradually moved beyond calculating a single factor of safety. It now includes a comprehensive evaluation of deformation, failure mechanisms, and risk [1,2].
Research on rock-slope stability has long emphasized the influence of geological structures on failure modes. Conventional kinematic analysis and limit-equilibrium methods are suitable for discontinuity-controlled failures. These include planar sliding, wedge sliding, and toppling. However, the rigid-body assumption has limitations for complex slopes involving rock-bridge fracture, internal plastic deformation, and progressive failure. Stead et al. [3] classified rock-slope analysis approaches into conventional, continuum/discontinuum, and hybrid continuum–discontinuum methods. They emphasized that the analytical tool should be selected according to the potential failure mechanism. A back-analysis of the Randa rockslide by Eberhardt et al. [4] showed that local crack propagation and strength degradation jointly govern global instability. More recently, Dai et al. [5] used a continuum–discontinuum framework to investigate damage evolution and potential impact areas in an unstable slope. This approach links progressive failure to its spatial consequences and complements assessments based solely on a global factor of safety.
Rock bolts cross potential sliding surfaces to connect shallow unstable rock masses to deeper stable rock. They improve slope integrity through axial tension, interface bonding, and shear resistance across discontinuities. Jalalifar and Aziz [6] used experiments and 3D numerical analyses to investigate reinforced joints. They found that bolt diameter, installation angle, and grout strength affect joint shear capacity and bolt bending. Chen [7] examined rock-bolt anchorage performance through experimental testing and stress analysis. Recent reviews indicate that research on rock-bolt shear performance has progressed from simplified beam models to refined simulations. These simulations incorporate bolt–grout–rock interfaces and nonlinear material behavior [8]. Fu et al. [9] combined physical testing and numerical analysis to study rock-bolt shear failure in bedded rock. They examined the effects of bedding cohesion and loading conditions. These investigations extend the analysis of bolt–rock interaction to layered geological settings. Nevertheless, the onset of rock-bolt loading during multistage excavation requires further investigation in the context of the actual construction process. Its relationship with the evolution of slope stability also requires further investigation.
Slope stability depends on slope height and angle, rock-mass strength, and discontinuity orientation and persistence. Groundwater, rainfall, weathering-induced degradation, and construction disturbance also affect stability. Hencher et al. [10] found that discontinuity geometry, roughness, and infilling conditions determine shear strength and deformation characteristics. Low [11] studied parametric sensitivity. The study showed that the dominant parameters governing the stability margin vary with failure mode and engineering context. In reinforced slopes, rock-bolt length, inclination, spacing, and material properties further change load-transfer paths and the reliability of the reinforced system. Parameter optimization should therefore consider stability improvement, rational load distribution, and economic efficiency together [12]. Peng et al. [13] adopted an improved smoothed particle hydrodynamics method to model a coupled rock slope–pile–anchor reinforcement system. The system contained weak bedding zones. Their results showed that anchoring parameters influence failure modes.
Numerical simulation can reproduce staged excavation, stress redistribution, plastic-zone propagation, and interactions between support structures and rock masses. It is therefore an important tool for rock-slope investigation. Continuum methods describe the overall stress–strain response. Discontinuum and hybrid methods are more effective in simulating block movement and crack propagation [14]. The strength-reduction method determines the global factor of safety by simultaneously reducing cohesion and the tangent of the internal friction angle. Failure criteria include abrupt displacement growth and the formation of a continuous plastic zone. Reliability analysis and field monitoring can reflect parameter uncertainty and assess model credibility [15]. Li et al. [16] integrated deformation monitoring, FLAC3D stability analysis, and landslide-induced wave modeling for the Sejiang deformable body. Their study illustrates the role of observation-constrained numerical analysis in slope design and hazard assessment. Shi et al. [17] combined field measurements of lateral displacement and reinforcement forces with FLAC3D analysis for staged excavation. They examined the effects of anchorage-force loss on stability. Comparing construction-stage monitoring responses with 3D numerical results is therefore essential for validating the engineering applicability of the model.
Recent developments also seek to link local damage to engineering-scale responses. Wei et al. [18] reviewed multiscale numerical modeling in rock mechanics and rock engineering. Stead and Wolter [19] studied the importance of structural geology in rock-slope failure mechanisms. These studies support linking construction-stage deformation to reinforcement mobilization. They also support explicitly distinguishing the averaged continuum response from discontinuity-controlled failure. The latter requires structural characterization. Related computational studies also address nonlinear deformation and fracture in engineered structures. Hamad et al. [20] analyzed nonlinear bending of sandwich Timoshenko beams using the generalized differential quadrature method. Their model incorporated carbon nanotube-reinforced face sheets and an auxetic re-entrant core. Faqihi et al. [21] developed a three-dimensional thermoelastic phase-field model for dynamic crack propagation and branching in brittle structures. These studies illustrate the importance of matching numerical formulations to the governing deformation and failure processes.
This study identifies the excavation stage at which the stability response of a sequentially supported slope differs from that of an unsupported slope. It relates this transition to the mobilization of bolt axial force. Seven excavation stages are analyzed in terms of displacement, plastic-zone distribution, factor of safety, and system maximum bolt force. Stage-wise maximum bolt forces are compared with field measurements. Displacements at slope-surface monitoring points near the heads of the corresponding bolts are also compared with field measurements. These comparisons assess the calculated response. Four support-layout variables are then examined through sensitivity analyses. The study links the construction sequence to stability changes and reinforcement mobilization. It thereby provides a stage-specific basis for interpreting rock-bolt performance in this engineering case.
2. Fundamental Theory and Computational Methods
2.1. Mechanisms of Rock-Bolt Support
Rock-bolt support reinforces a rock mass by installing tensile structural members within it [22,23,24,25]. The principal support mechanisms of rock bolts in rock slopes are as follows:
- (1)
- Suspension action. Rock bolts suspend shallow unstable rock masses from deeper stable rock layers. They directly resist downslope forces through axial tension. Effective suspension requires the anchorage section to extend sufficiently far into stable rock below the potential sliding surface.
- (2)
- Composite-beam action. In layered rock masses, rock bolts connect thin rock layers and increase interlayer friction. The connected layers form a thicker composite beam. This substantially improves the overall flexural stiffness and load-bearing capacity of the rock mass.
- (3)
- Compression reinforcement. Systematically installed groups of rock bolts create a compressed zone within the reinforced region. They increase rock-mass confinement and enhance both peak and residual strengths. They also inhibit the initiation and propagation of plastic zones.
2.2. Mohr–Coulomb Strength Criterion
Rock-mass yielding and failure are evaluated using the Mohr–Coulomb strength criterion. Shear failure occurs on a plane when the shear stress reaches the material shear strength. The criterion is expressed as follows [26]:
Here, τ is the shear stress on the failure plane. σn is the normal stress on the failure plane. c is the cohesion of the rock mass. φ is the internal friction angle of the rock mass.
|τ| = c + σntanφ
The shear and tensile yield criteria of the Mohr–Coulomb model are expressed in terms of principal stresses as follows:
Here, fs is the shear yield function. ft is the tensile yield function. σ1 and σ3 are the maximum compressive and minimum compressive principal stresses, respectively. Compression is negative in Equations (2) and (3). . σt is the tensile strength of the rock mass [27]. The principal stresses are ordered as σ1 ≤ σ2 ≤ σ3.
2.3. Fundamentals of the Strength Reduction Method
The slope factor of safety is calculated using the strength-reduction method. This method progressively reduces the rock-mass strength parameters until the slope reaches a limit-equilibrium state from an initially stable state. The strength-reduction factor at onset of failure is taken as the slope factor of safety [28,29,30,31].
The strength-reduction method is expressed as follows:
Here, F is the strength-reduction factor. c and φ are the original cohesion and internal friction angle of the rock mass, respectively. cF and φF are the reduced cohesion and internal friction angle, respectively.
The factor of safety is calculated using the built-in FLAC3D strength-reduction procedure. The “model factor-of-safety” command invokes this procedure. The procedure brackets stable and unstable trial states to estimate the critical reduction factor [32]. Numerical equilibrium distinguishes these states. Displacement and shear-strain-increment distributions characterize the associated deformation pattern.
Table 3.7.7 of the Specifications for Design of Highway Subgrades (JTG D30—2015) [33] provides the reference for engineering interpretation. It gives a normal-condition factor-of-safety range of 1.20–1.30 for expressway and first-class highway cut slopes. The selected value depends on geological complexity and failure consequences. The lower limit, 1.20, is used as a reference for comparing the analyzed cases. The final supported value is also compared with the upper limit of 1.30. These comparisons apply to the modeled dry, static conditions.
3. Project Overview and Geological Conditions
3.1. Project Background
The investigated cutting slope lies in Yiling District, Yichang. It is near the mainline toll station of the Xiangyang–Yichang Expressway. Its maximum height is 47 m, and its slope angle is approximately 50°. Construction proceeds from the top downward. Excavation and support are completed bench by bench. The reference support layout consists of fully grouted PSB1080 threaded steel bars. Their nominal diameter is 50 mm, and their cross-sectional area is 1.963 × 10⁻³ m2. The bolt length, inclination, and spacing are 25 m, 30°, and 3.0 m × 3.0 m, respectively. No faults are present in the investigated slope. Groundwater occurs at great depths below the pavement. The calculations assume dry conditions without pore-water pressure. Possible fissure water and rainfall infiltration are not represented.
3.2. Geological Conditions
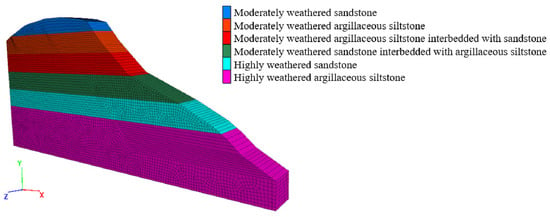
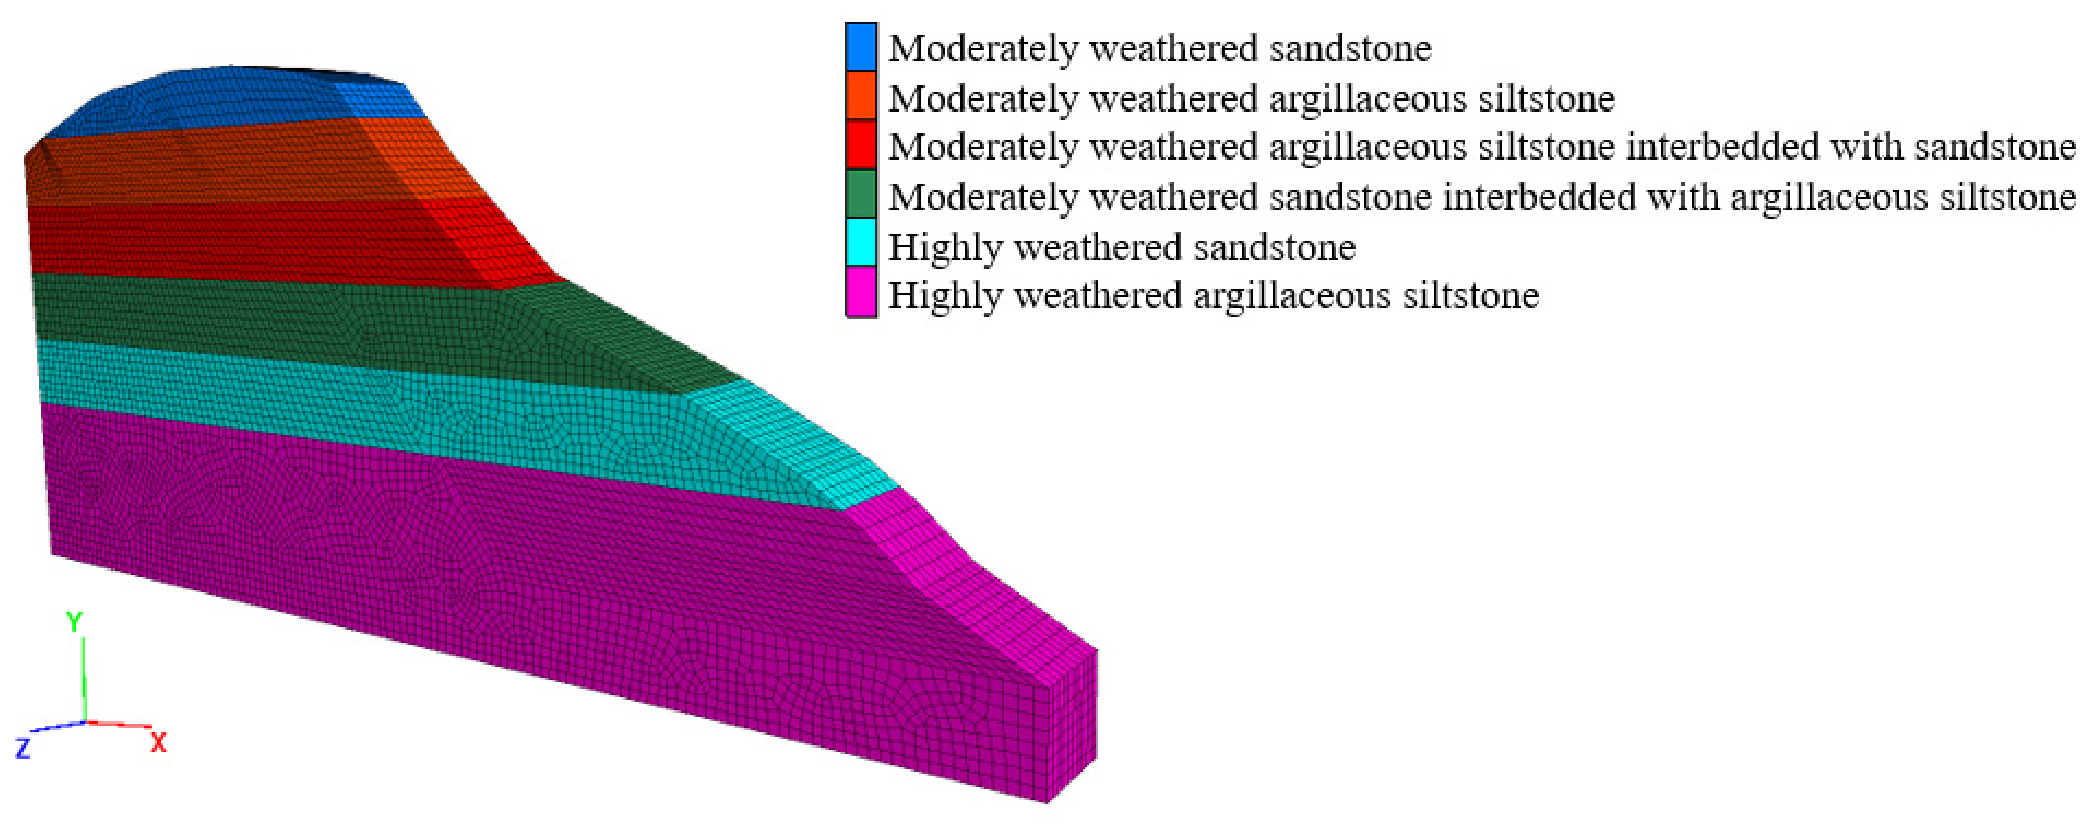
Figure 1 shows the pre-excavation stratigraphy established from the field geological investigation. The high and steep slope comprises six rock layers. From top to bottom, the first two are moderately weathered sandstone and moderately weathered argillaceous siltstone. The third is moderately weathered argillaceous siltstone interbedded with sandstone. The fourth is moderately weathered sandstone interbedded with argillaceous siltstone. The fifth and sixth are highly weathered sandstone and highly weathered argillaceous siltstone, respectively. Table 1 lists each layer’s thickness and the physical and mechanical parameters adopted for the slope rock masses. Parameter selection considers the field geological conditions. It also considers the guidance in Clause 3.7.3 of the Specifications for Design of Highway Subgrades (JTG D30—2015). The six lithological units are assigned separate material domains to represent the mapped stratigraphic variation. Each unit is modeled as an equivalent continuum. Bedding planes and joints have no independent interface properties.
Figure 1.
Stratigraphic distribution of the initial slope.
Table 1.
Rock-mass physical and mechanical parameters.
4. Numerical Model
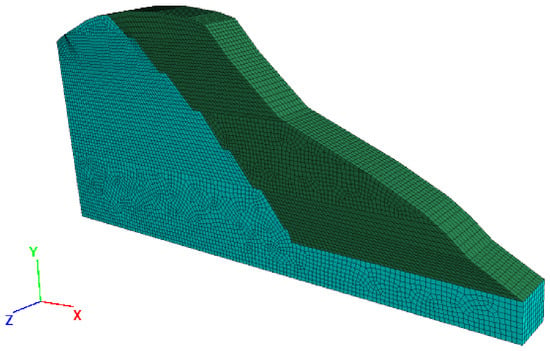
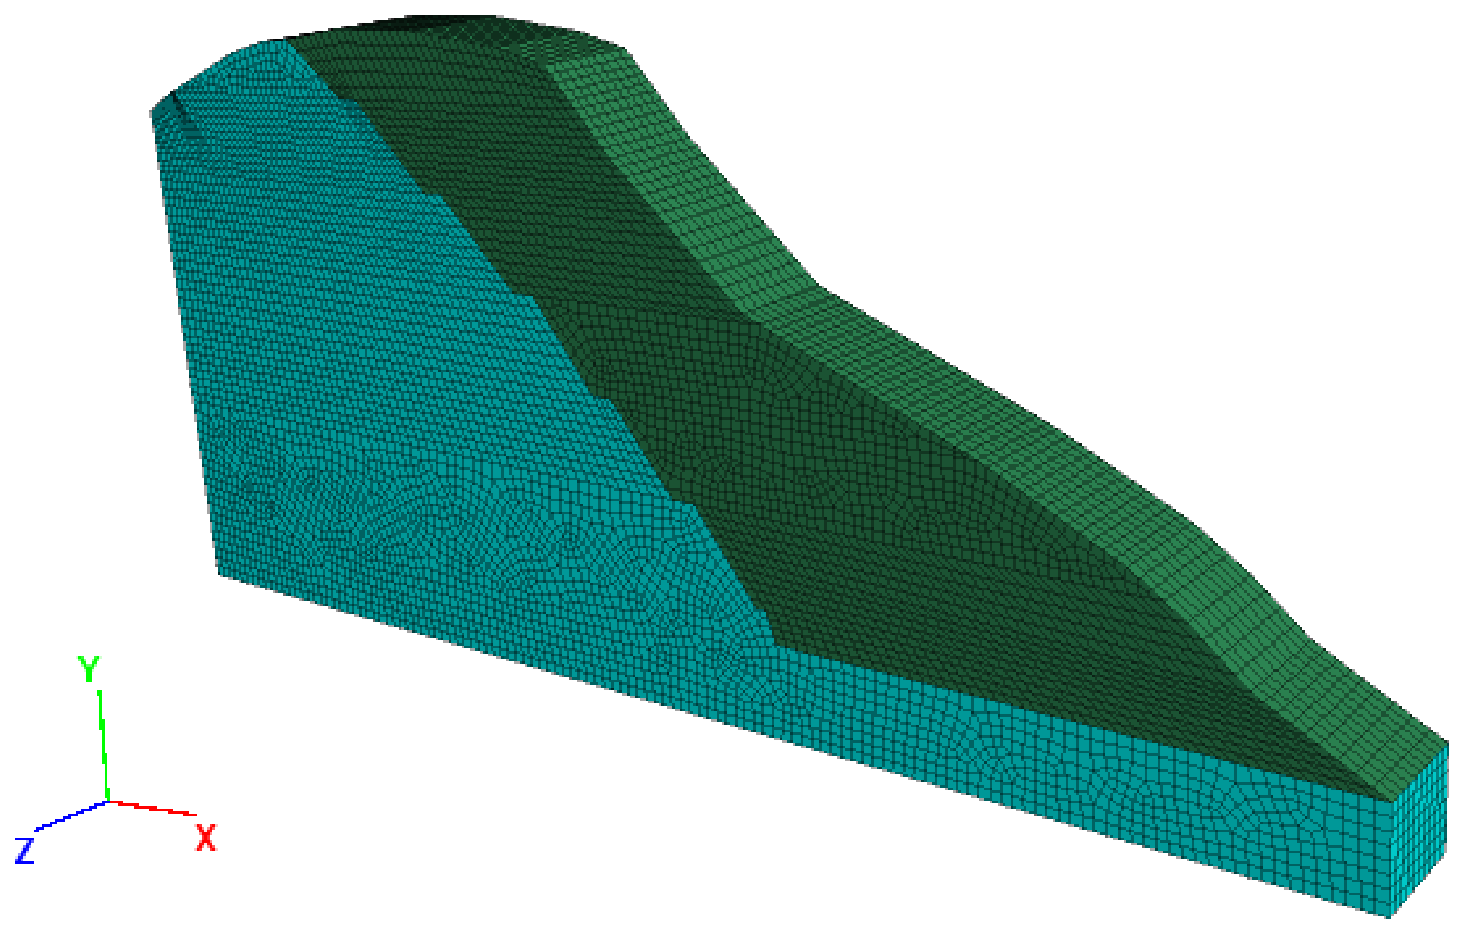
A 3D finite-difference model is developed in FLAC3D 7.0 to simulate the seven excavation stages. ABAQUS is used to construct the geometry and generate the mesh. The mesh is then imported to FLAC3D for mechanical analysis. The reference domain measures 125 m in the X direction, 57 m in the vertical Y direction, and 10 m in the Z direction. Its base lies 10 m below the excavation depth. The global mesh seed size for preprocessing is 1 m. The resulting mesh contains 67,727 nodes and 59,900 zones. Figure 2 shows that the green and blue regions represent the excavated and retained rock, respectively. Isotropic elastic and Mohr–Coulomb plastic properties are assigned separately to the six material domains using the parameters in Table 1. Section 4.1 examines the effects of mesh size and domain dimensions. The 3D discretization represents spatial stress redistribution induced by excavation [34,35].
Figure 2.
Numerical model of the slope.
The slope is represented as a layered equivalent continuum. This representation enables consistent comparisons of slope-scale deformation, plastic yielding, and support demand during staged excavation. The analysis focuses on the overall rock-mass response and the interaction between the reinforced region and the surrounding rock.
The rock bolts are modeled using cable structural elements. Figure 3 shows these elements carry axial loads and transfer shear forces through coupling with the surrounding rock [36,37]. All modeled bolts are PSB1080 threaded steel bars. Young’s modulus is E = 200 GPa. Published properties for this steel give a nominal yield stress of 1080 MPa. The nominal tensile strength is 1230 MPa [38]. Multiplication by the cross-sectional area gives a reference yield load of approximately 2120 kN. The corresponding reference ultimate tensile load is approximately 2414 kN. The 2120 kN value is used for the steel-demand comparison in Section 5.2.4. The adopted bond shear stiffness per unit area is Ks = 1.75 × 10⁷ N/m3. The cohesive shear strength is τc = 200 kPa. The friction angle is 20°. For the cable formulation, the equivalent stiffness and cohesive force per unit length are Kg = Kspg and cg = τcpg. Here, pg is the effective bonded perimeter. Kg and cg have units of N/m2 and N/m, respectively. The reference length and inclination are 25 m and 30°, respectively. Both horizontal and vertical spacings are 3 m.
Figure 3.
Cable structural elements representing the rock bolts.
Displacements in all directions are fixed at the bottom of the model. Normal displacements are fixed on the four lateral boundaries. The primary load is rock-mass weight. The rock mass is assumed to be in equilibrium under gravity. Geostatic equilibrium is established, and the resulting initial displacements are reset to zero. The corresponding rock-mass zones are then removed according to the actual excavation sequence. This simulates staged excavation.
Two simulation cases are considered. (1) Unsupported condition: no support is installed after excavation of each bench. Slope stability is calculated directly. (2) Rock-bolt-supported condition: rock bolts are installed immediately after excavation of each bench. Slope stability is then calculated. This excavation-and-support sequence is repeated until the design excavation height is reached.
Table 2 lists the variations in each layout parameter. The reference case uses a bolt length of 25 m and an inclination angle of 30°. Both horizontal and vertical spacings are 3 m. These four variables govern the reinforcement extent, orientation, and density within the prescribed excavation geometry. Each variable is varied independently to examine the effects of rock-bolt support parameters. The remaining inputs, including bolt diameter and bond properties, are kept at their reference values. The comparisons quantify the individual effect of each layout parameter on the slope factor of safety.
Table 2.
Key rock-bolt parameters and their variations.
4.1. Mesh and Domain Sensitivity
4.1.1. Mesh Size
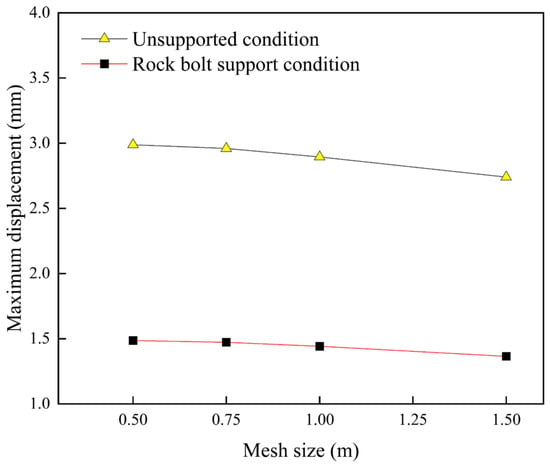
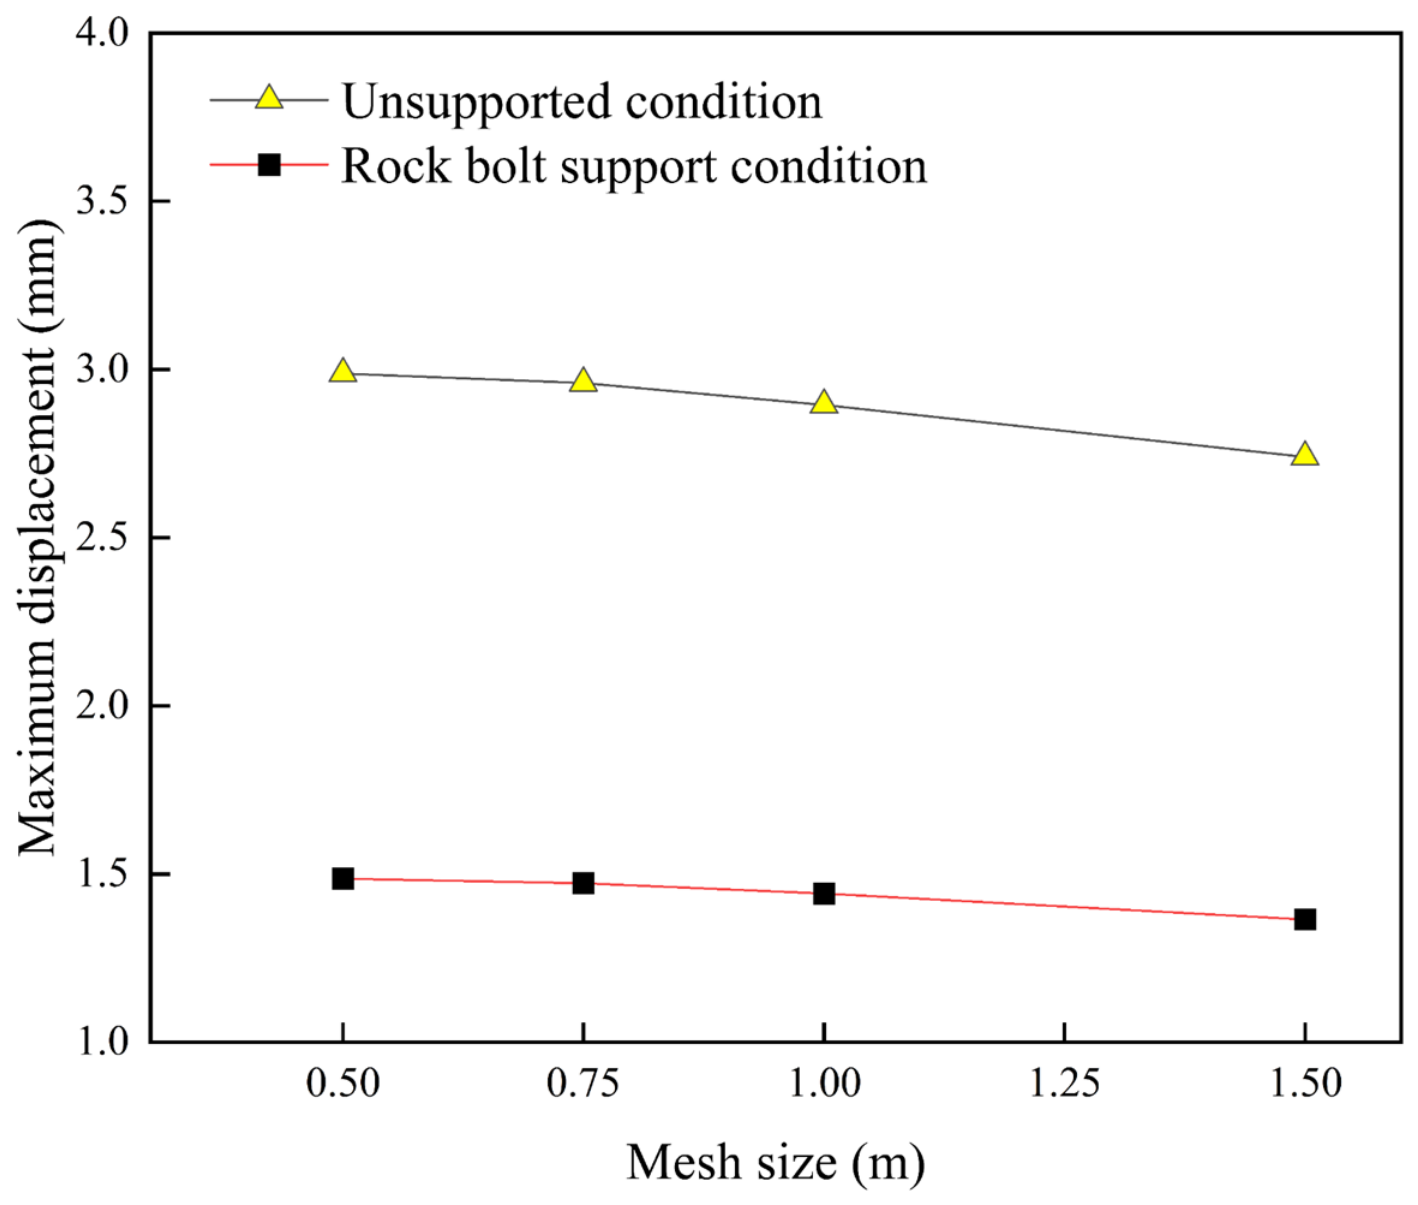
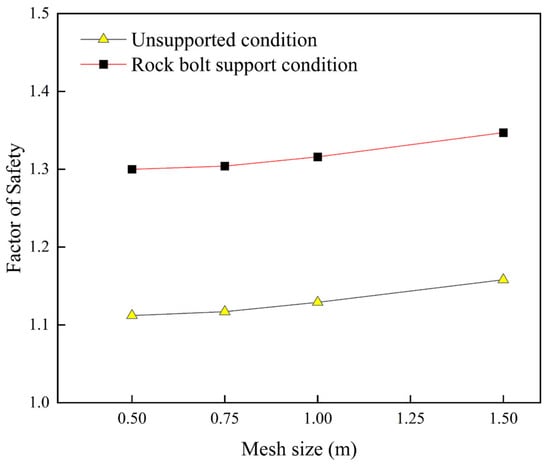
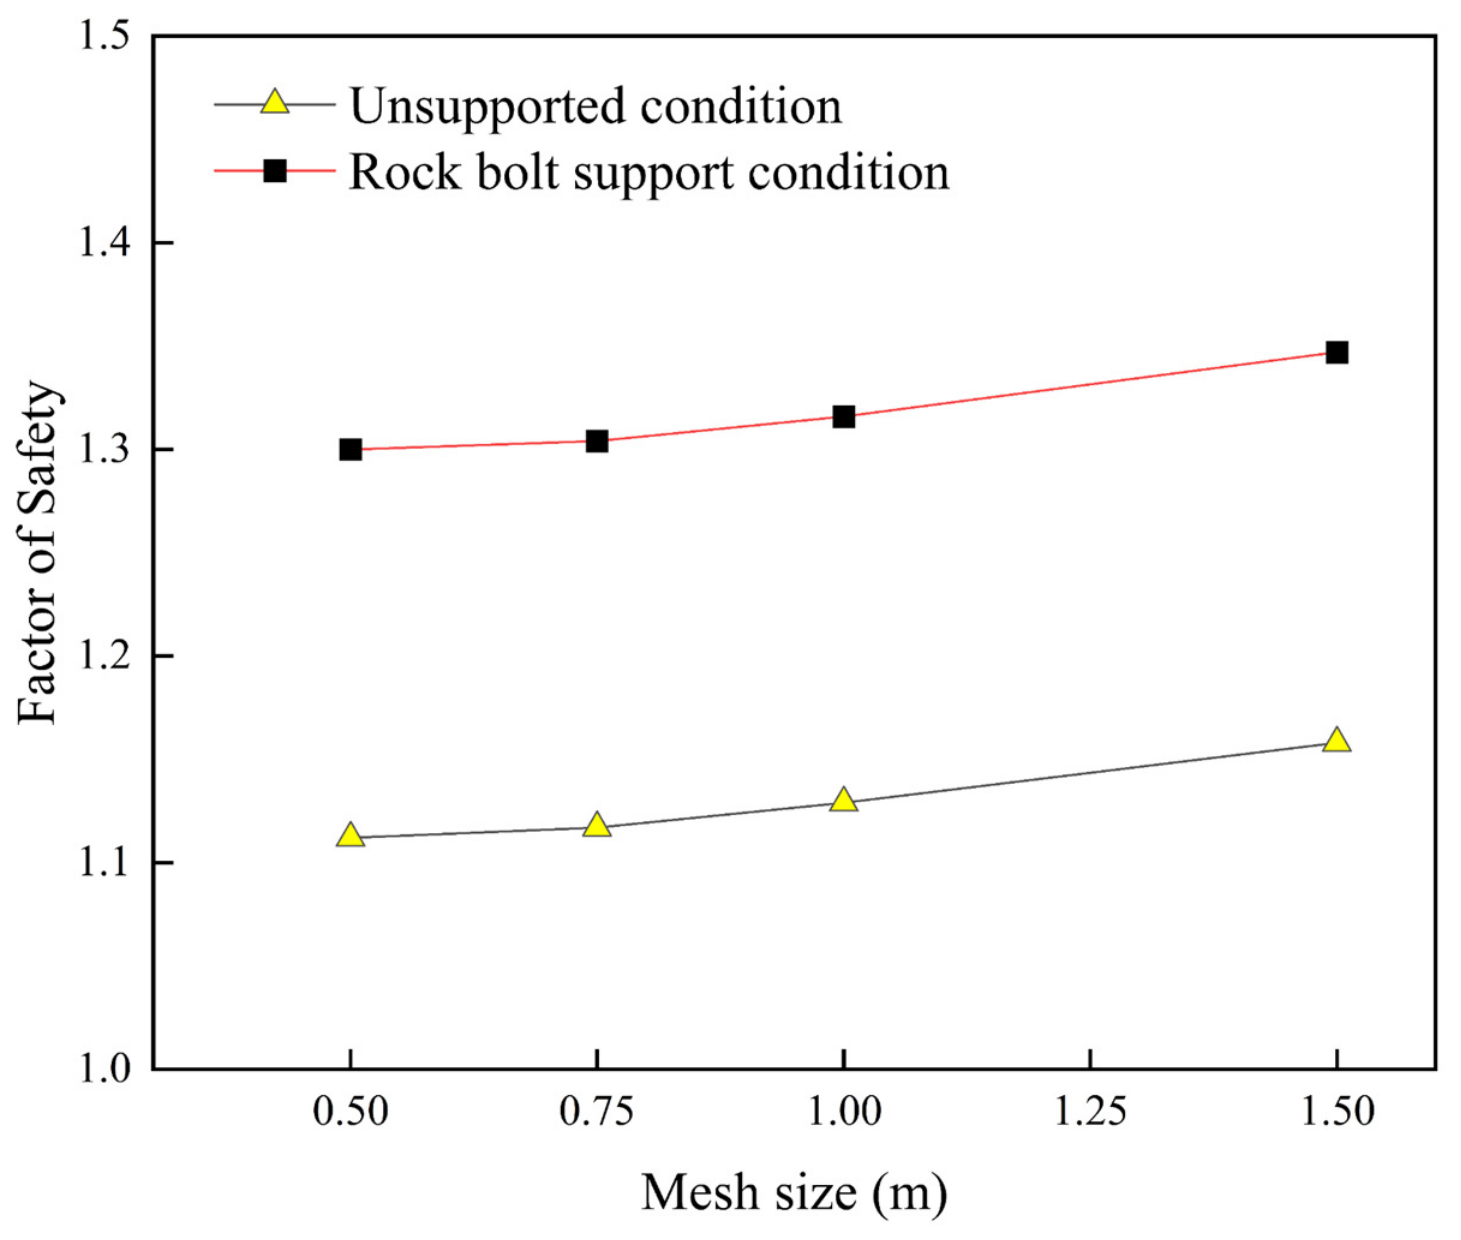
Four mesh seed sizes, 0.50, 0.75, 1.00, and 1.50 m, are compared under unsupported and rock-bolt-supported conditions. Figure 4 shows the displacement changes as the seed size decreases from 1.00 to 0.50 m. Without support, the maximum displacement increases from 2.90 to 2.99 mm. With support, it increases from 1.44 to 1.49 mm. The corresponding factors of safety decreases from 1.129 to 1.112 without support and from 1.316 to 1.300 with support (Figure 5). The reductions are approximately 1.5% and 1.2%, respectively. Between the 0.75 and 0.50 m cases, displacement differences are 1%. Factor-of-safety differences are below 0.5%. These variations diminish with mesh refinement, indicating convergence of the global response. A global seed size of 1 m is adopted for the subsequent analyses. Compared with the finest mesh, displacement differences are approximately 3%, and factor-of-safety differences are below 2%.
Figure 4.
Maximum displacement versus mesh size.
Figure 5.
Factor-of-safety versus mesh size.
4.1.2. Bottom Boundary Distance
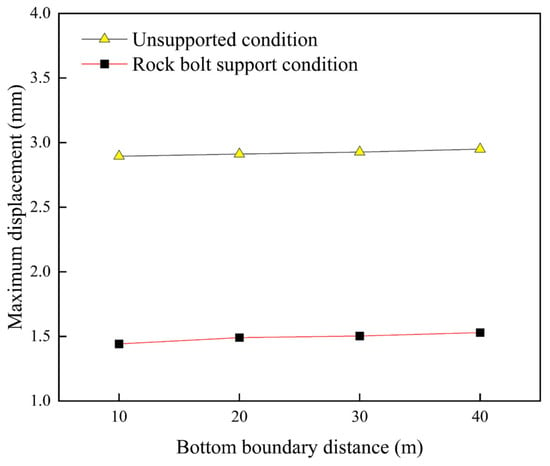
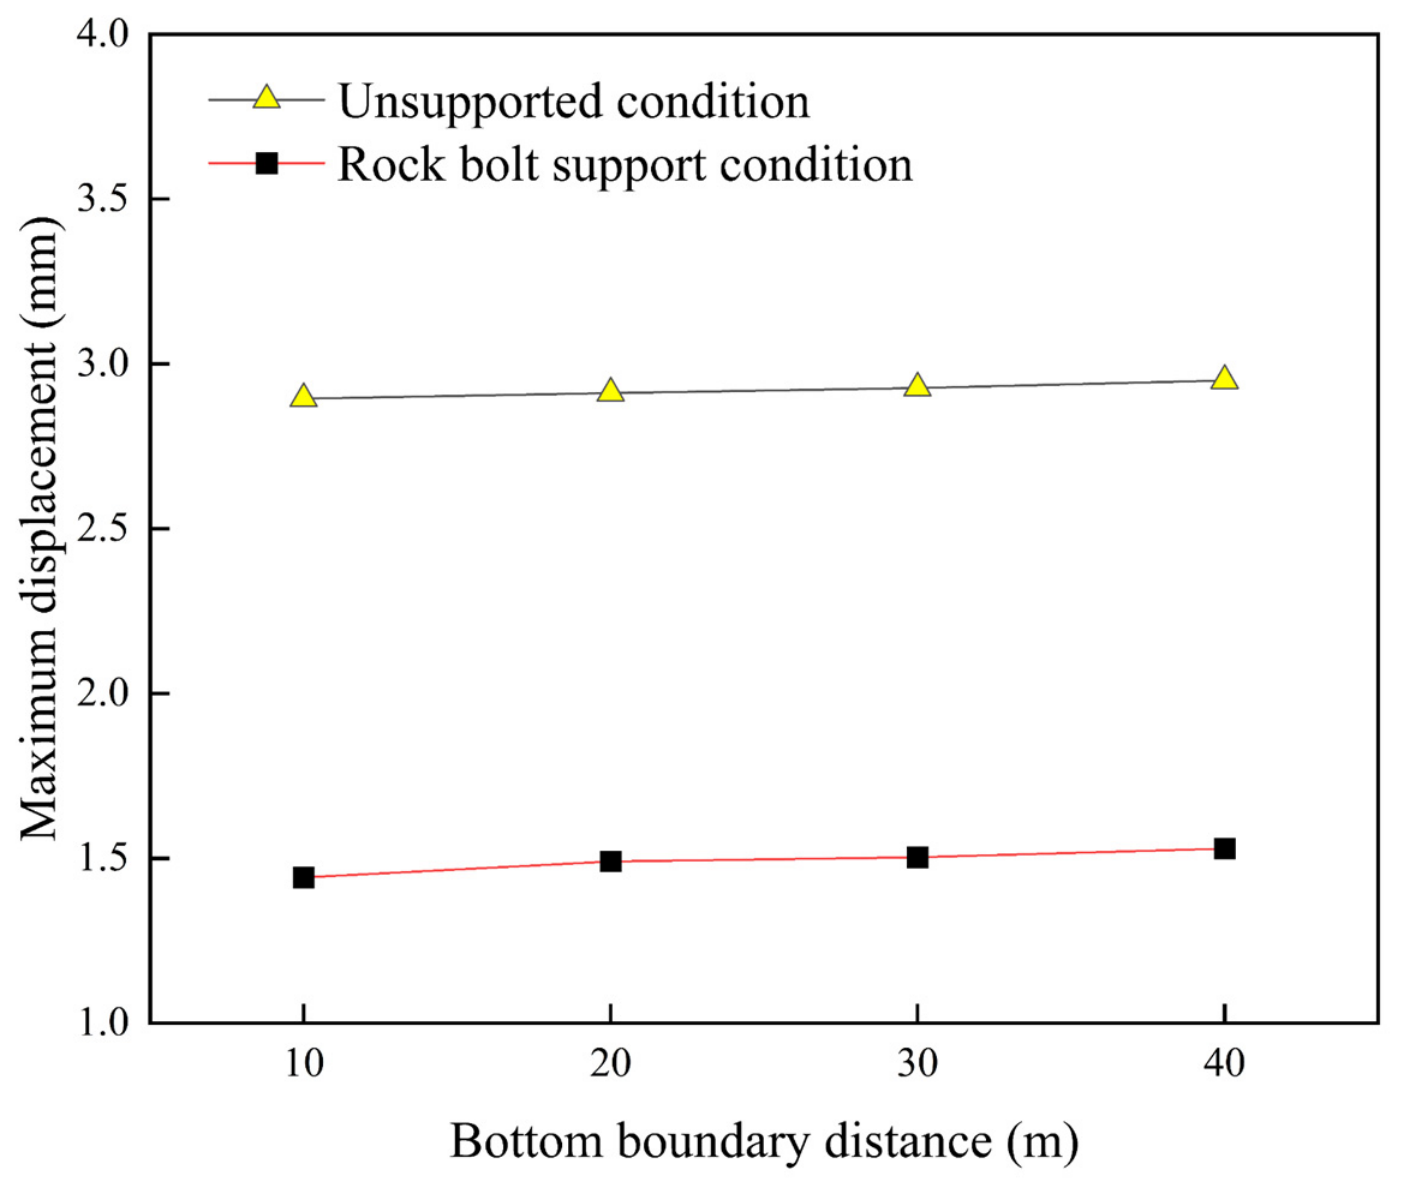
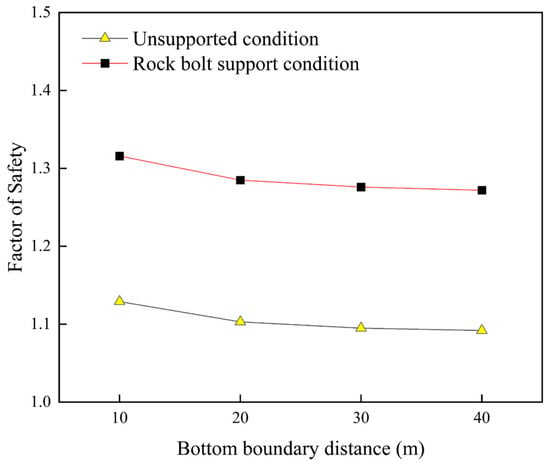
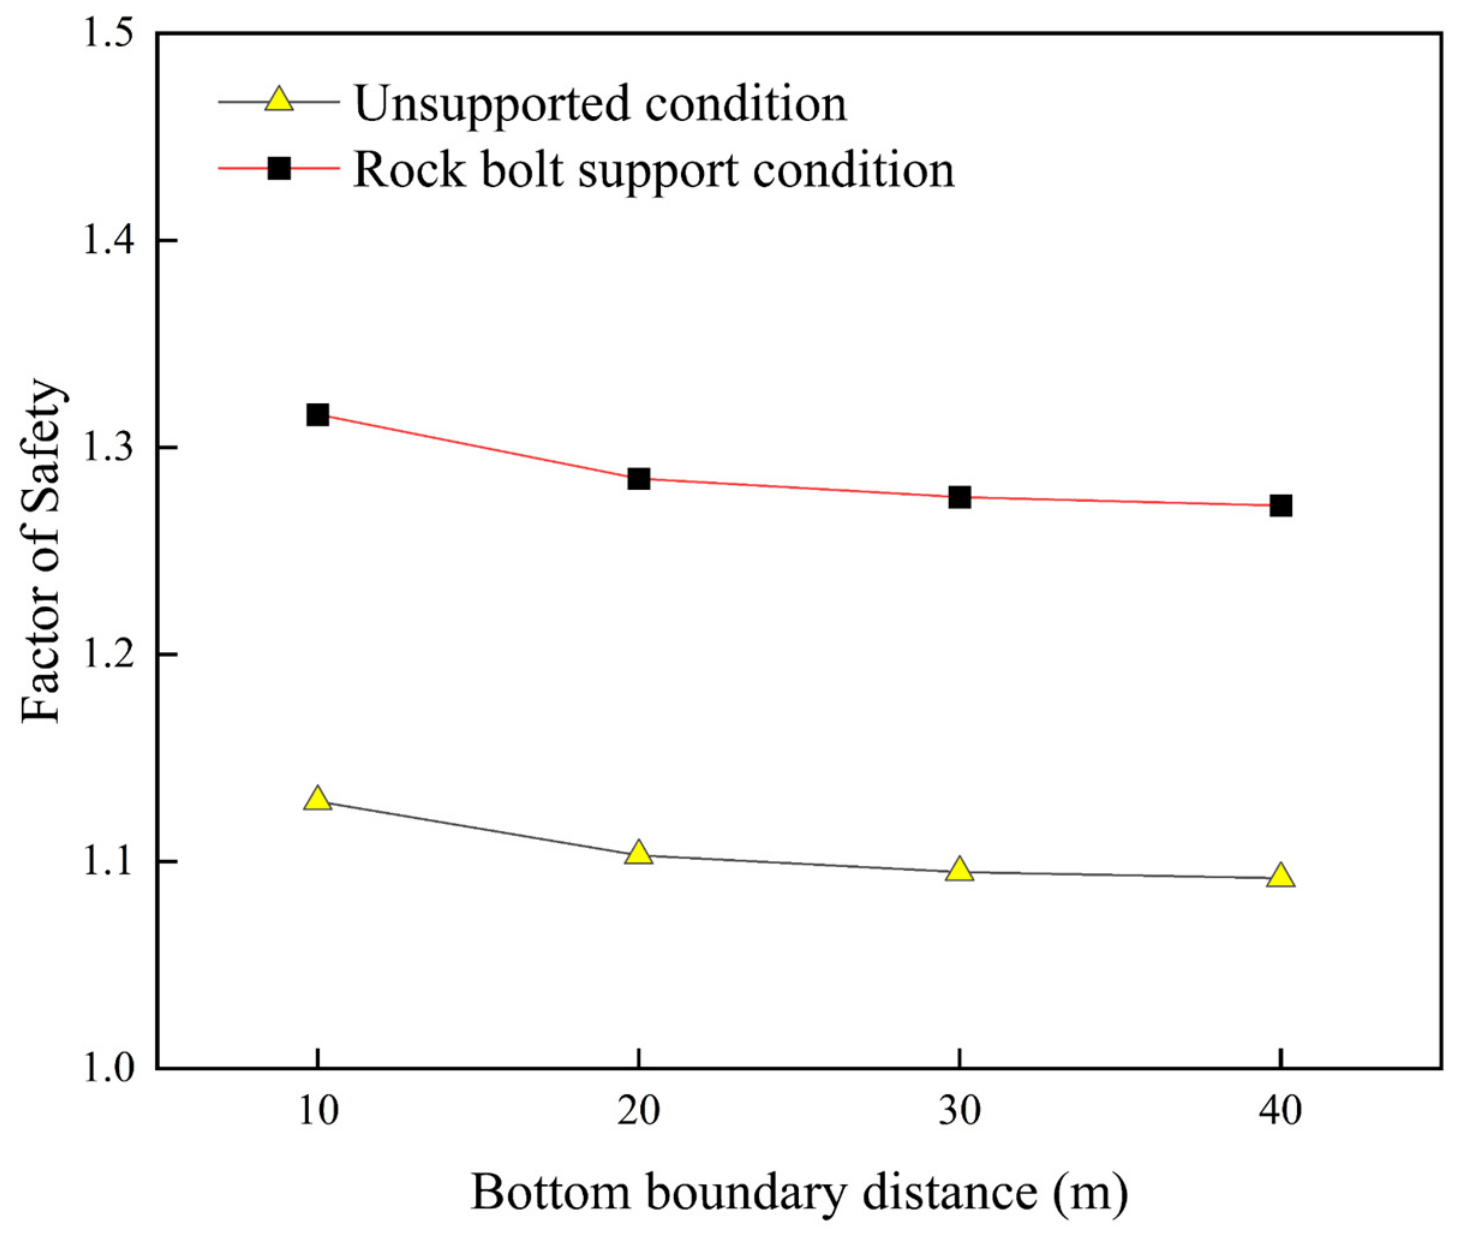
Bottom boundary distances of 10, 20, 30, and 40 m below the excavation base are examined. Figure 6 and Figure 7 show the displacement and factor-of-safety results. Increasing this distance from 10 to 40 m reduces the unsupported factor of safety from 1.129 to 1.092. The supported factor of safety decreases from 1.316 to 1.272. Both reductions are approximately 3.3%. The changes between 30 and 40 m are below 0.4%, indicating progressively lower boundary sensitivity. Over the full 10–40 m interval, the unsupported maximum displacement increases from 2.90 to 2.95 mm. The supported maximum displacement increases from 1.44 to 1.53 mm. These increases are approximately 2% and 6%, respectively. Throughout the investigated range, rock-bolt support reduces displacement and increases the factor of safety. This indicates a consistent reinforcement effect across the tested bottom boundary positions.
Figure 6.
Maximum displacement versus bottom boundary distance.
Figure 7.
Factor of safety versus bottom boundary distance.
4.1.3. Model Width
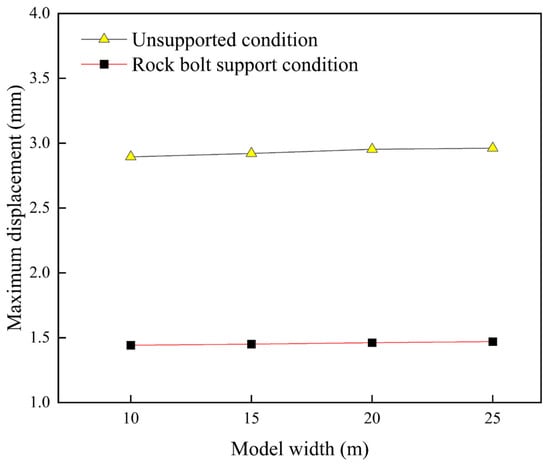
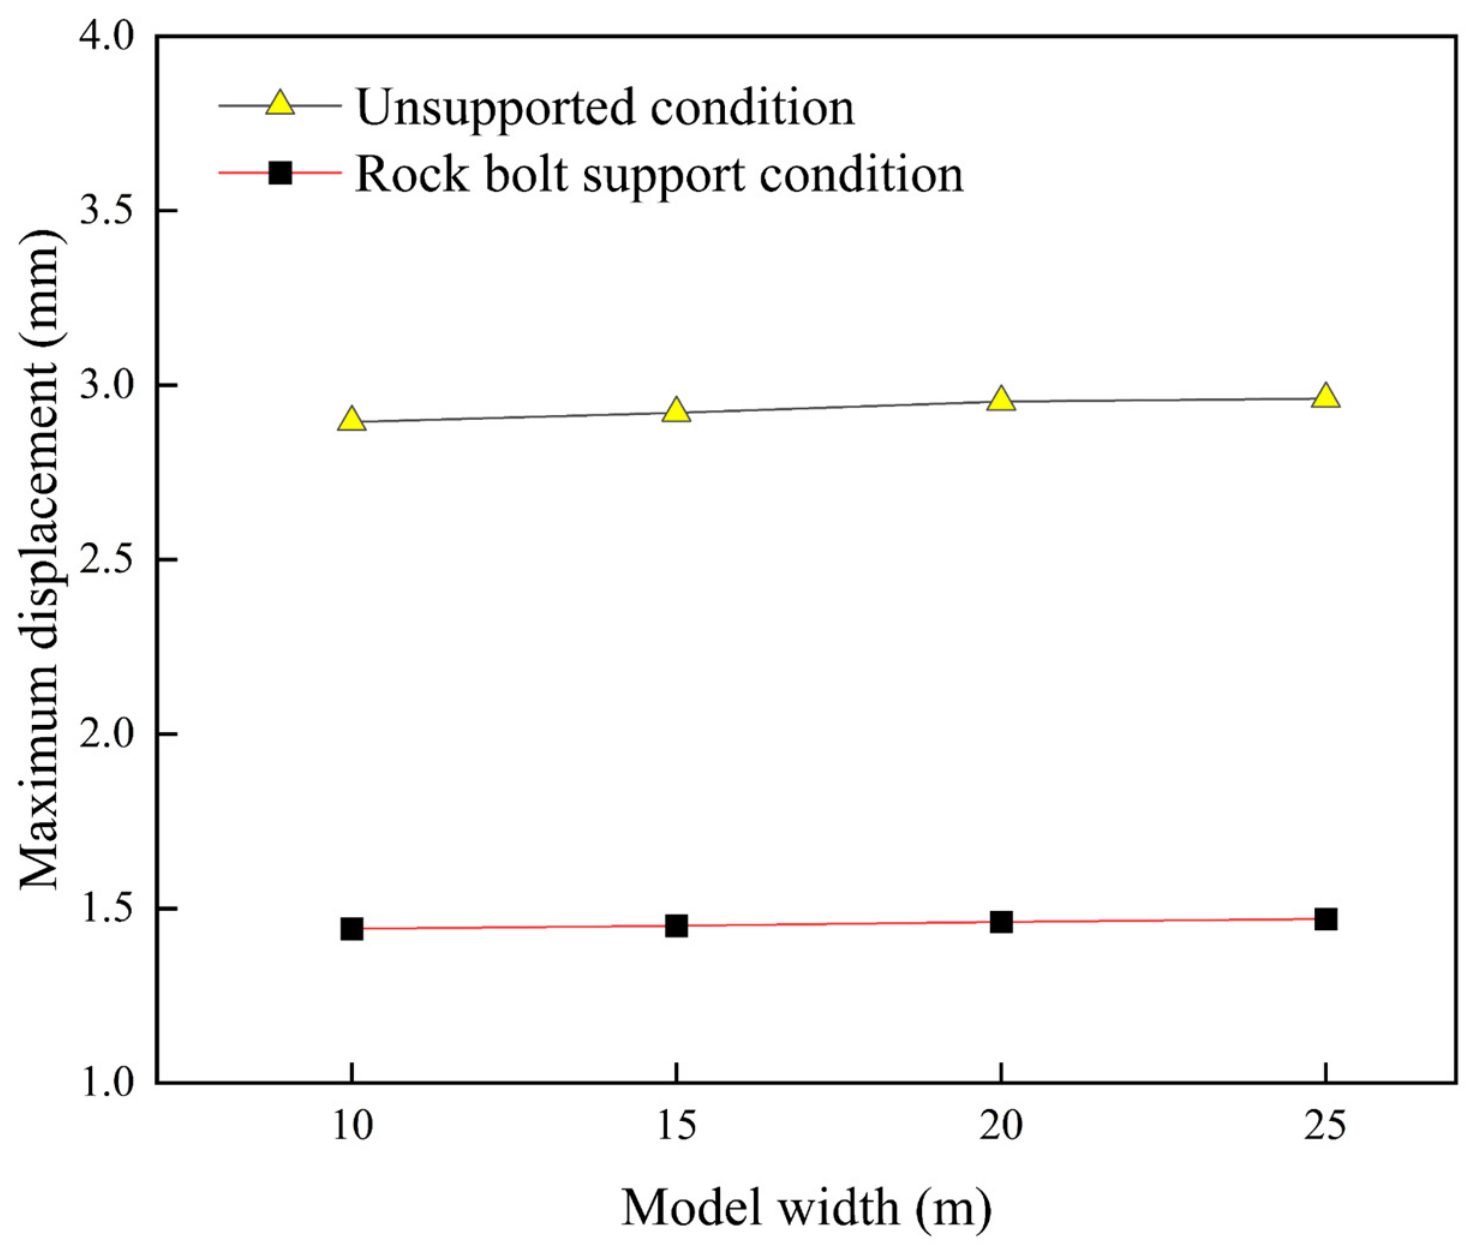
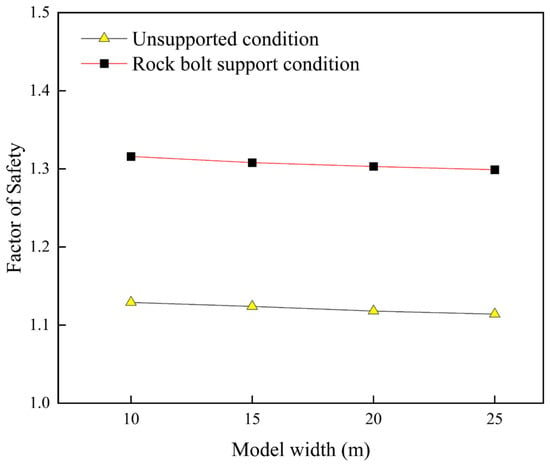
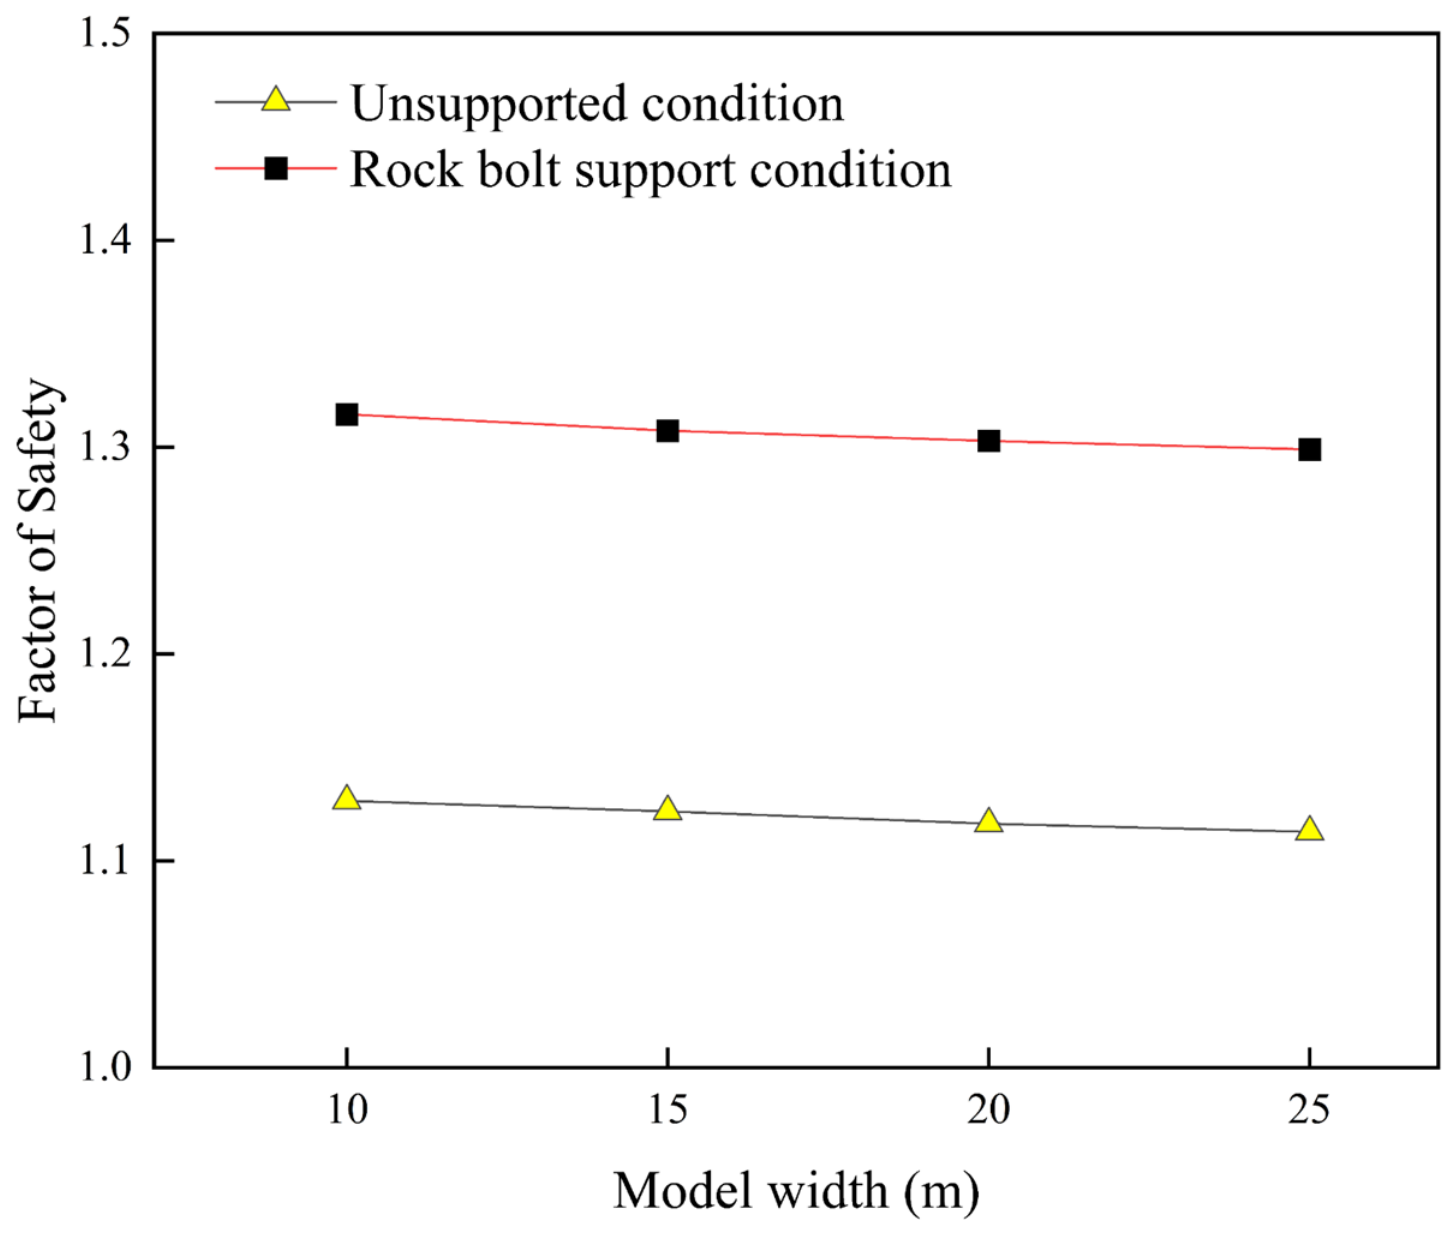
Results for model widths of 10, 15, 20, and 25 m are compared. As the width increases, the maximum displacement increases slightly under both support conditions as shown in Figure 8. The factor of safety gradually decreases as shown in Figure 9. Over the investigated range, displacement variation remains within approximately 3%, and factor-of-safety variation remains within approximately 2%. The progressively smaller changes at greater widths indicate reduced sensitivity to lateral domain extent. Across all four widths, the supported slope consistently exhibits smaller displacement and a higher factor of safety than the unsupported slope.
Figure 8.
Maximum displacement versus model width.
Figure 9.
Factor-of-safety versus model width.
5. Analysis of the Numerical Simulation Results
5.1. Initial Stress Field
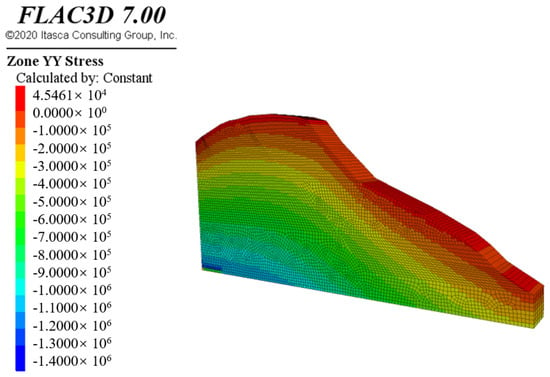
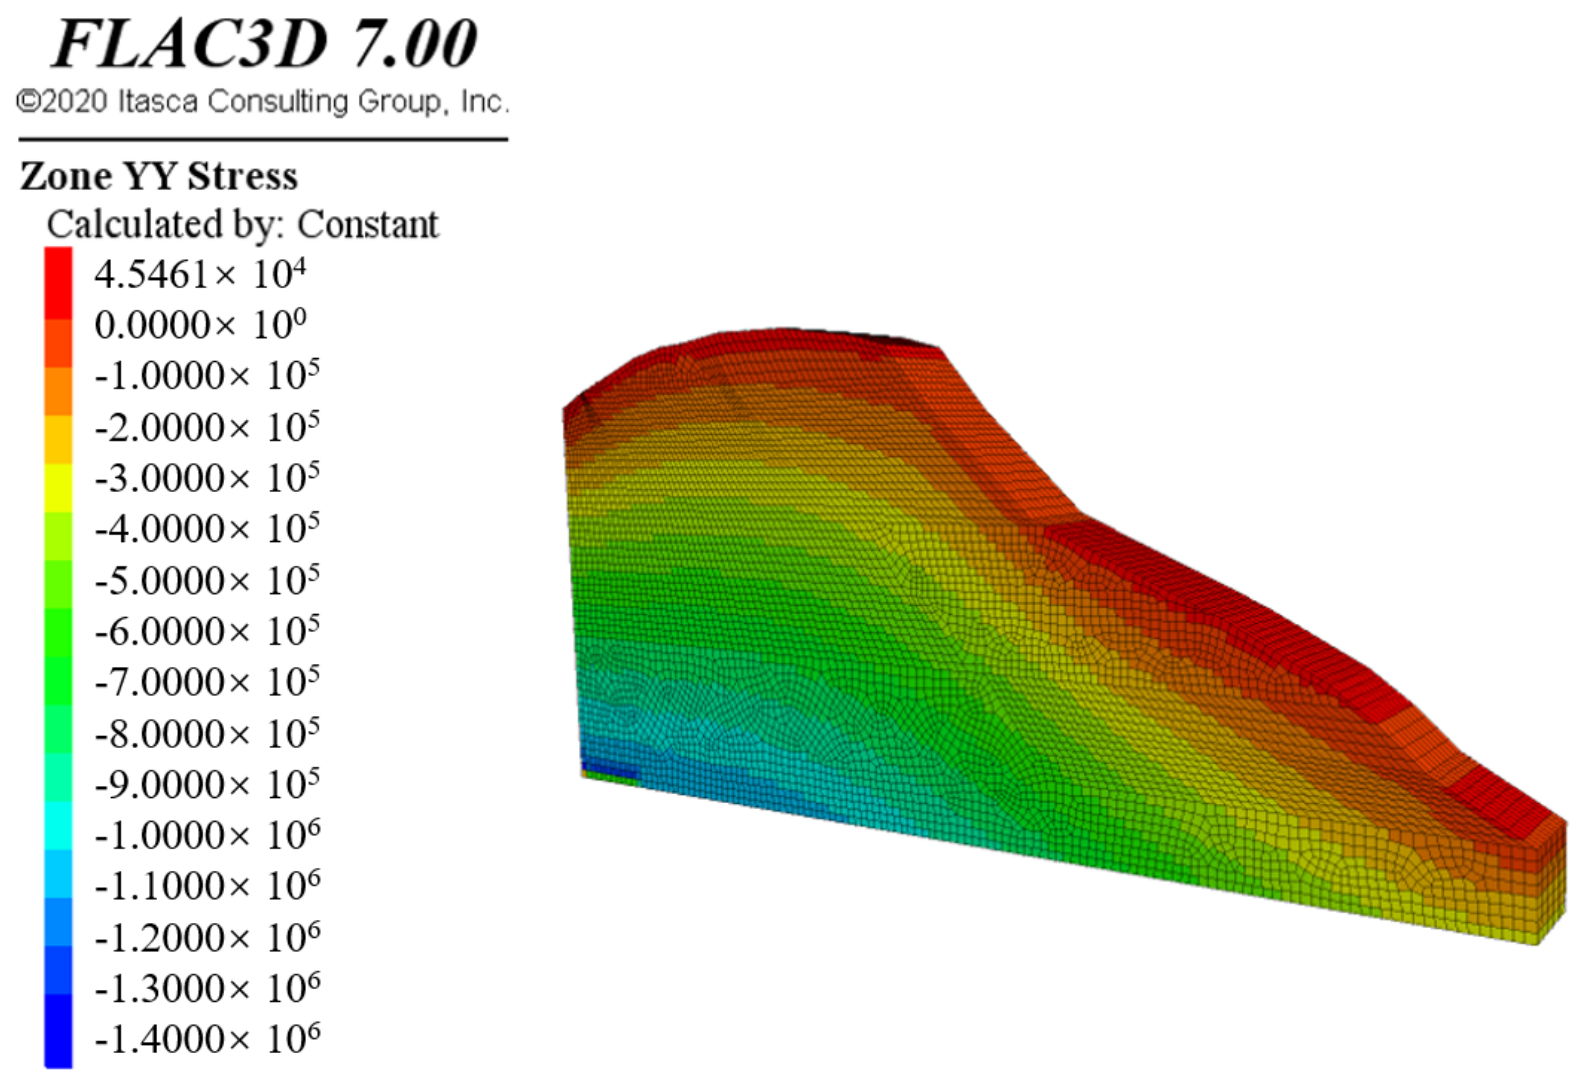
The pre-excavation stress field is obtained by iterating the model to equilibrium under gravity. Figure 10 shows the initial vertical-stress contours of the unexcavated slope. The magnitude of vertical compressive stress increases approximately linearly with depth, consistent with a self-weight stress field. In steeper regions, the contour bands are more shallow, indicating larger vertical-stress gradients.
Figure 10.
Vertical-stress contours of the slope under the initial condition.
5.2. Comparison Between Unsupported and Rock-Bolt-Supported Conditions
5.2.1. Comparison of Displacement-Field Characteristics
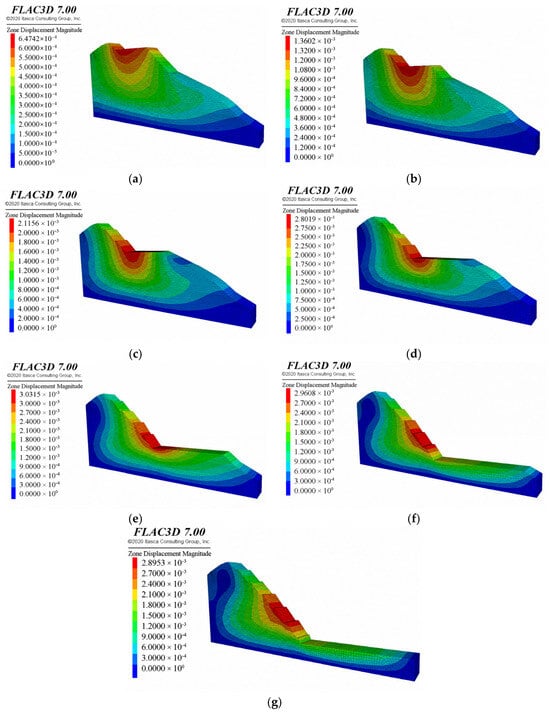
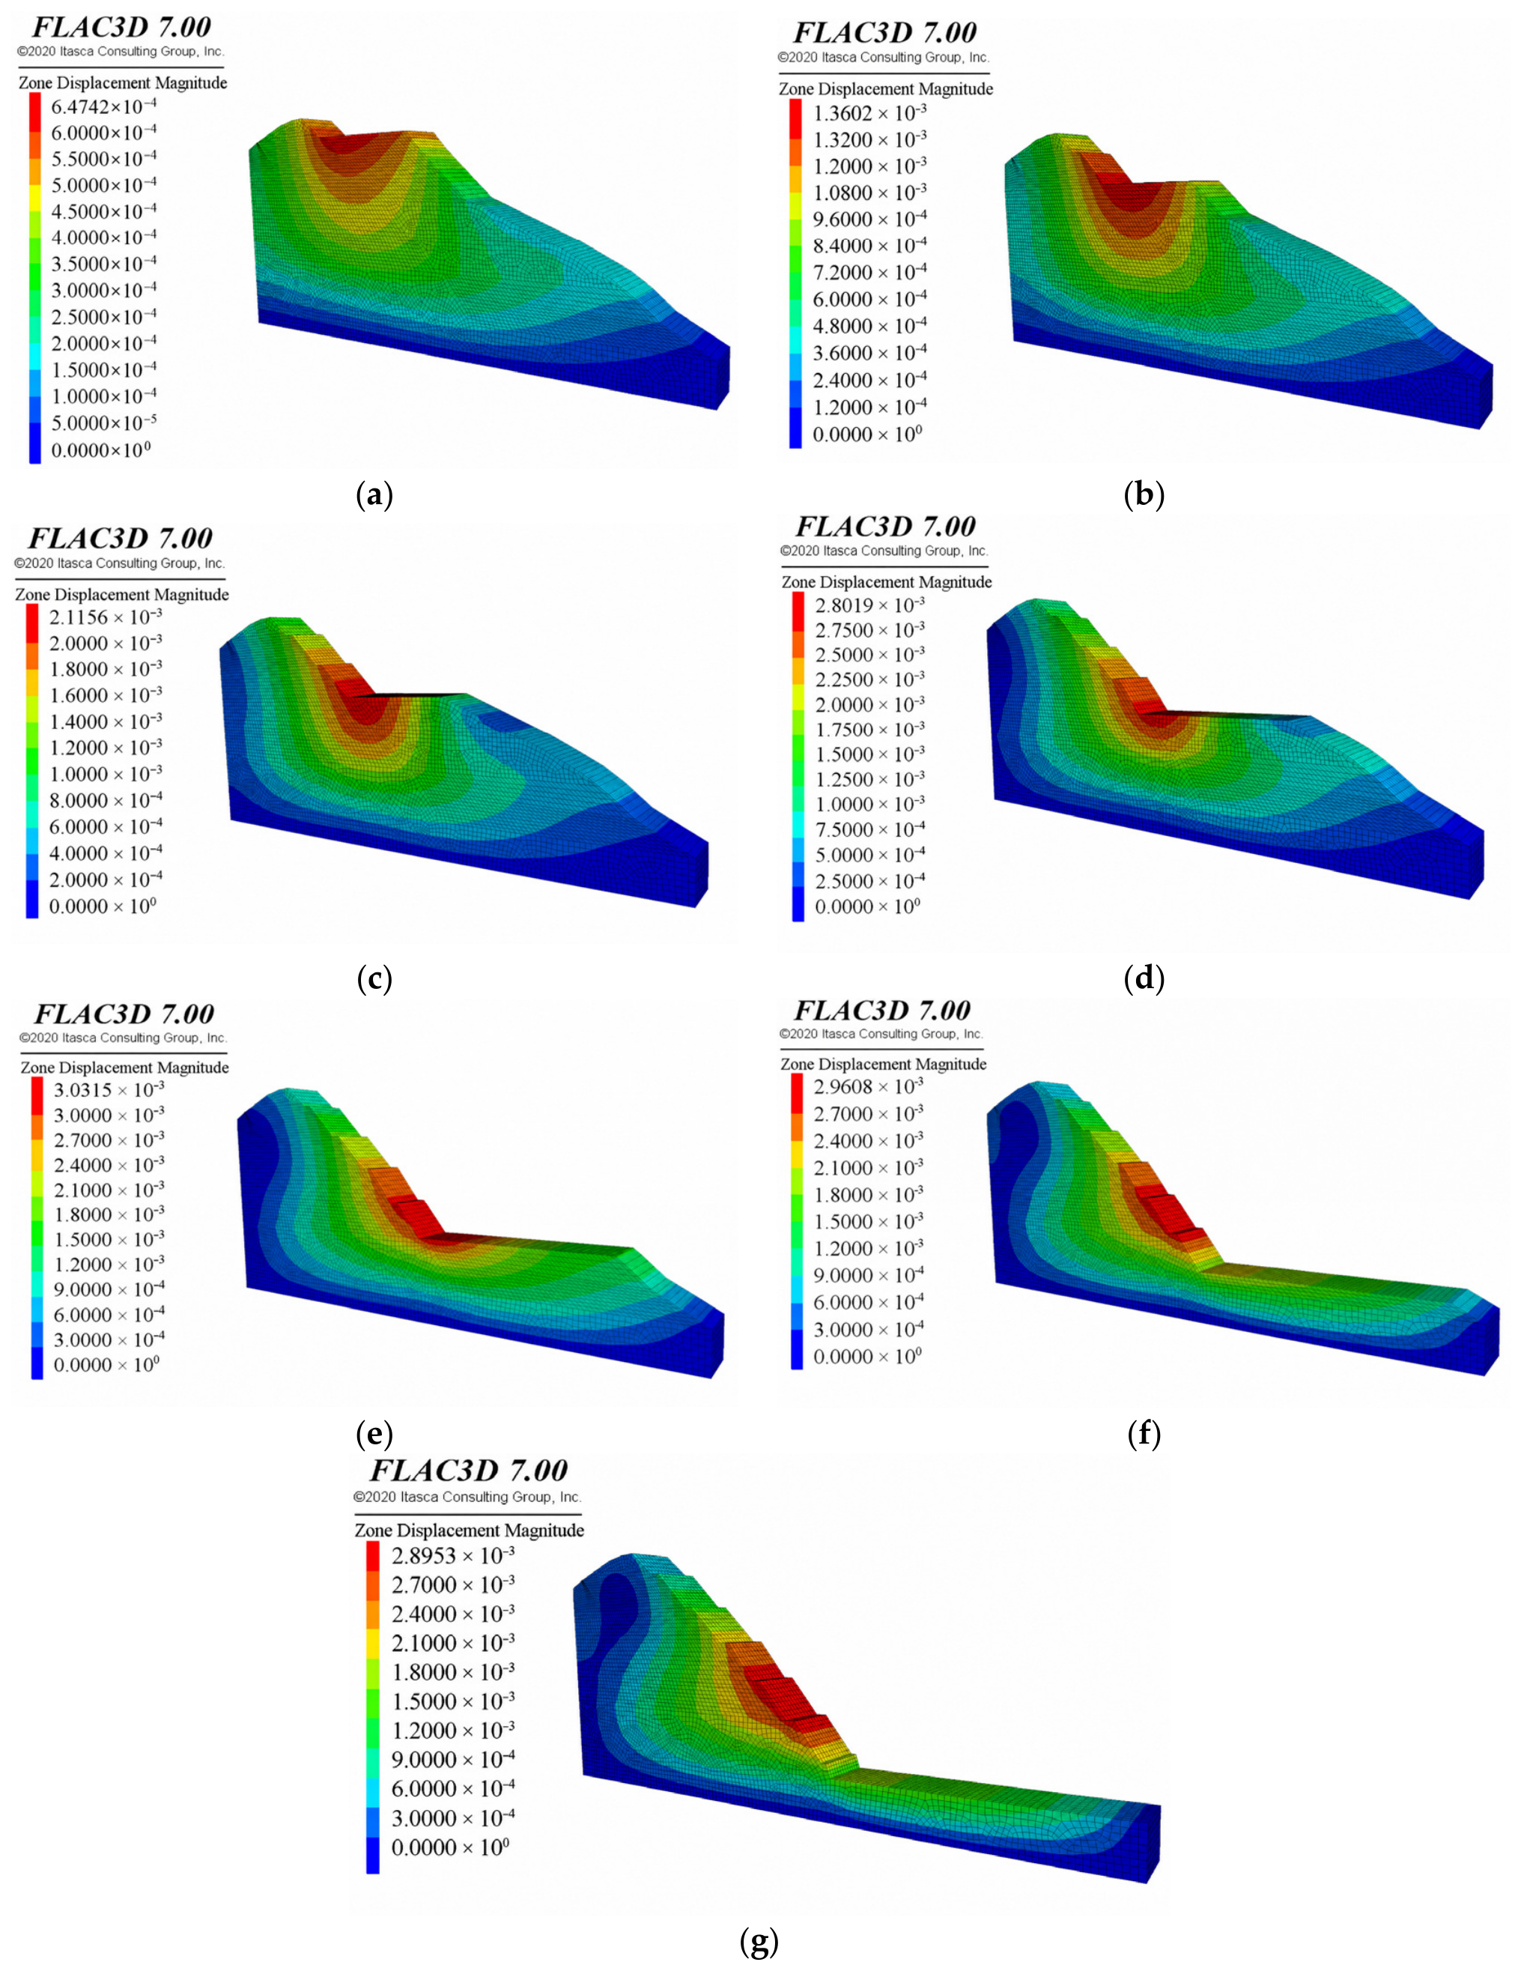
Figure 11 shows the total-displacement contours after excavation of each bench under unsupported conditions. The displacement field evolves as excavation progresses. The maximum total displacement increases during the early stages and decreases slightly during the final stages. After excavation is complete, the maximum total displacement occurs mainly in the middle portion of the slope and reaches 2.895 mm. A distinct displacement concentration band extends along the dip direction in the middle of the slope. This band is interpreted as a zone of concentrated deformation that may be associated with potential sliding.
Figure 11.
Total-displacement contours of the slope after excavation of each bench under unsupported conditions. (a) Bench 1; (b) Bench 2; (c) Bench 3; (d) Bench 4; (e) Bench 5; (f) Bench 6; and (g) Bench 7.
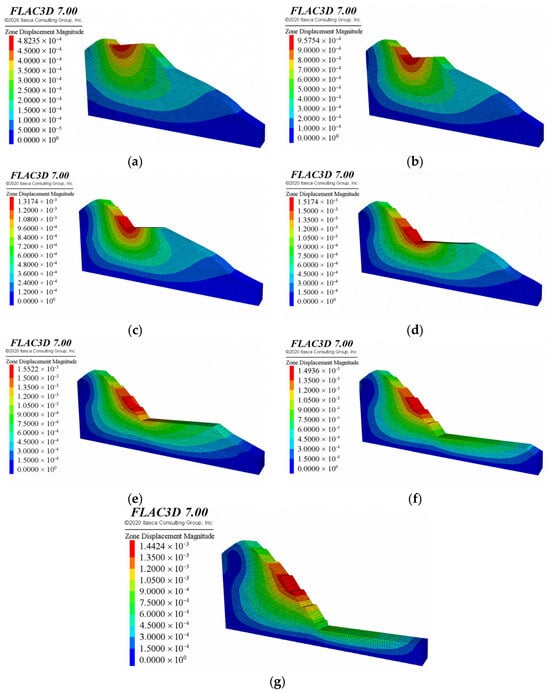
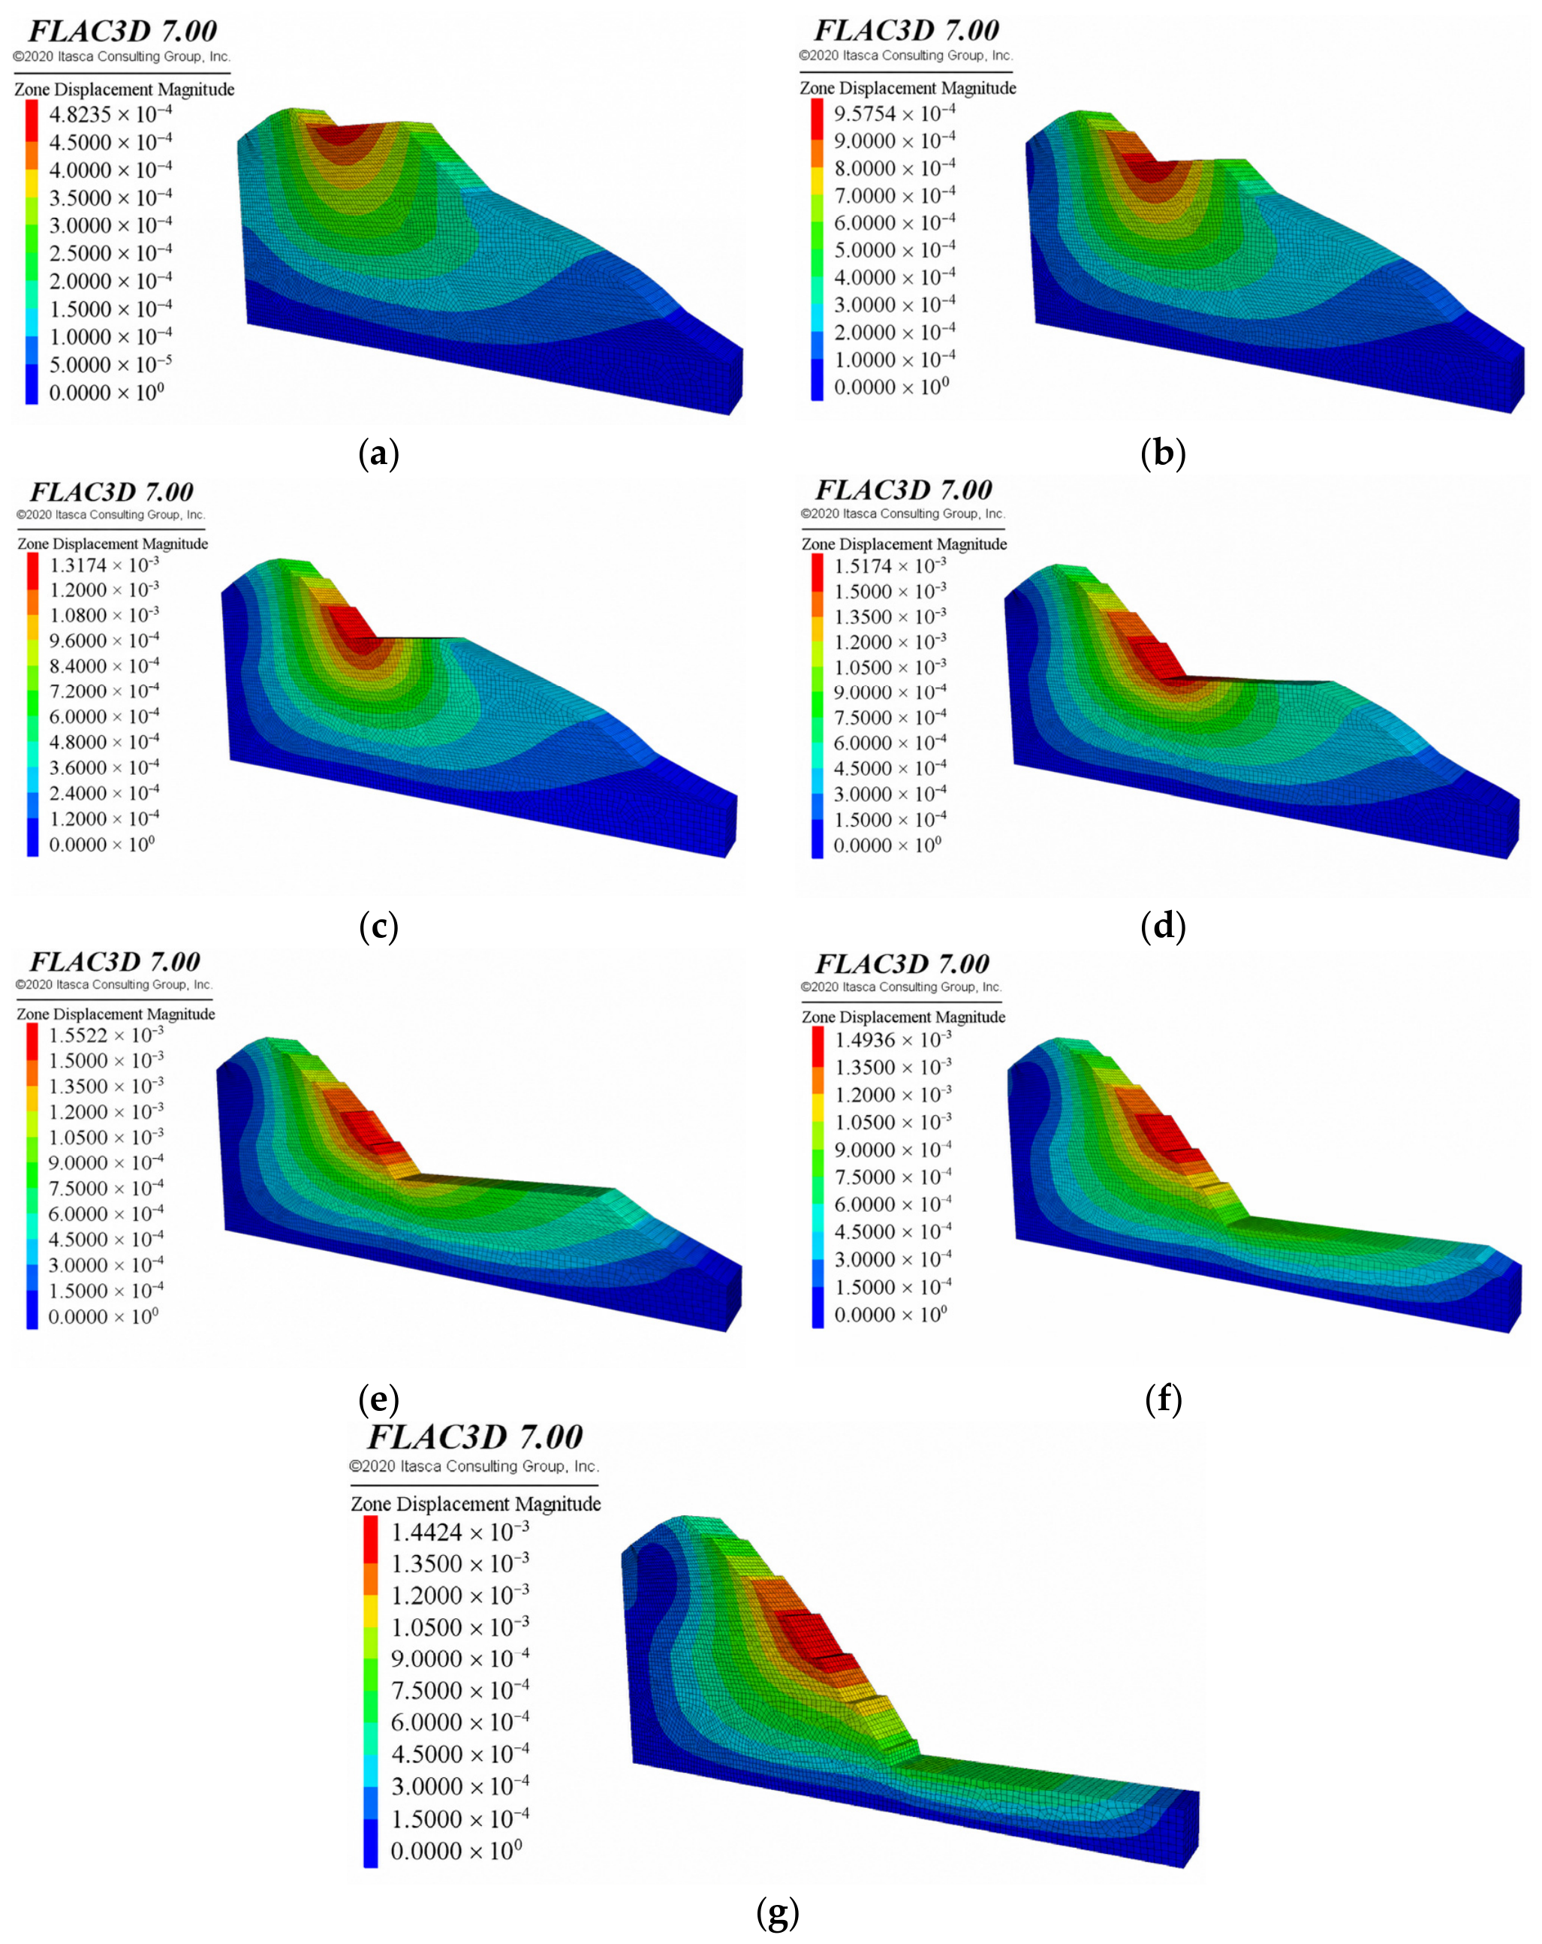
Figure 12 shows the total-displacement contours after excavation of each bench with sequential rock-bolt support. Compared with the unsupported case, sequential bolt installation substantially reduces the overall slope-face displacement at the end of each stage. After excavation is complete, the maximum total displacement decreases from 2.895 mm without support to 1.442 mm with support. The reduction is approximately 50.2%.
Figure 12.
Total-displacement contours of the slope after excavation of each bench with sequential rock-bolt support. (a) Bench 1; (b) Bench 2; (c) Bench 3; (d) Bench 4; (e) Bench 5; (f) Bench 6; and (g) Bench 7.
5.2.2. Comparison of Plastic-Zone Distributions
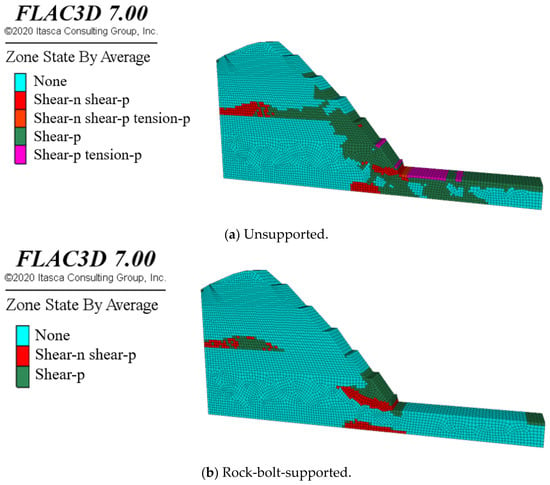
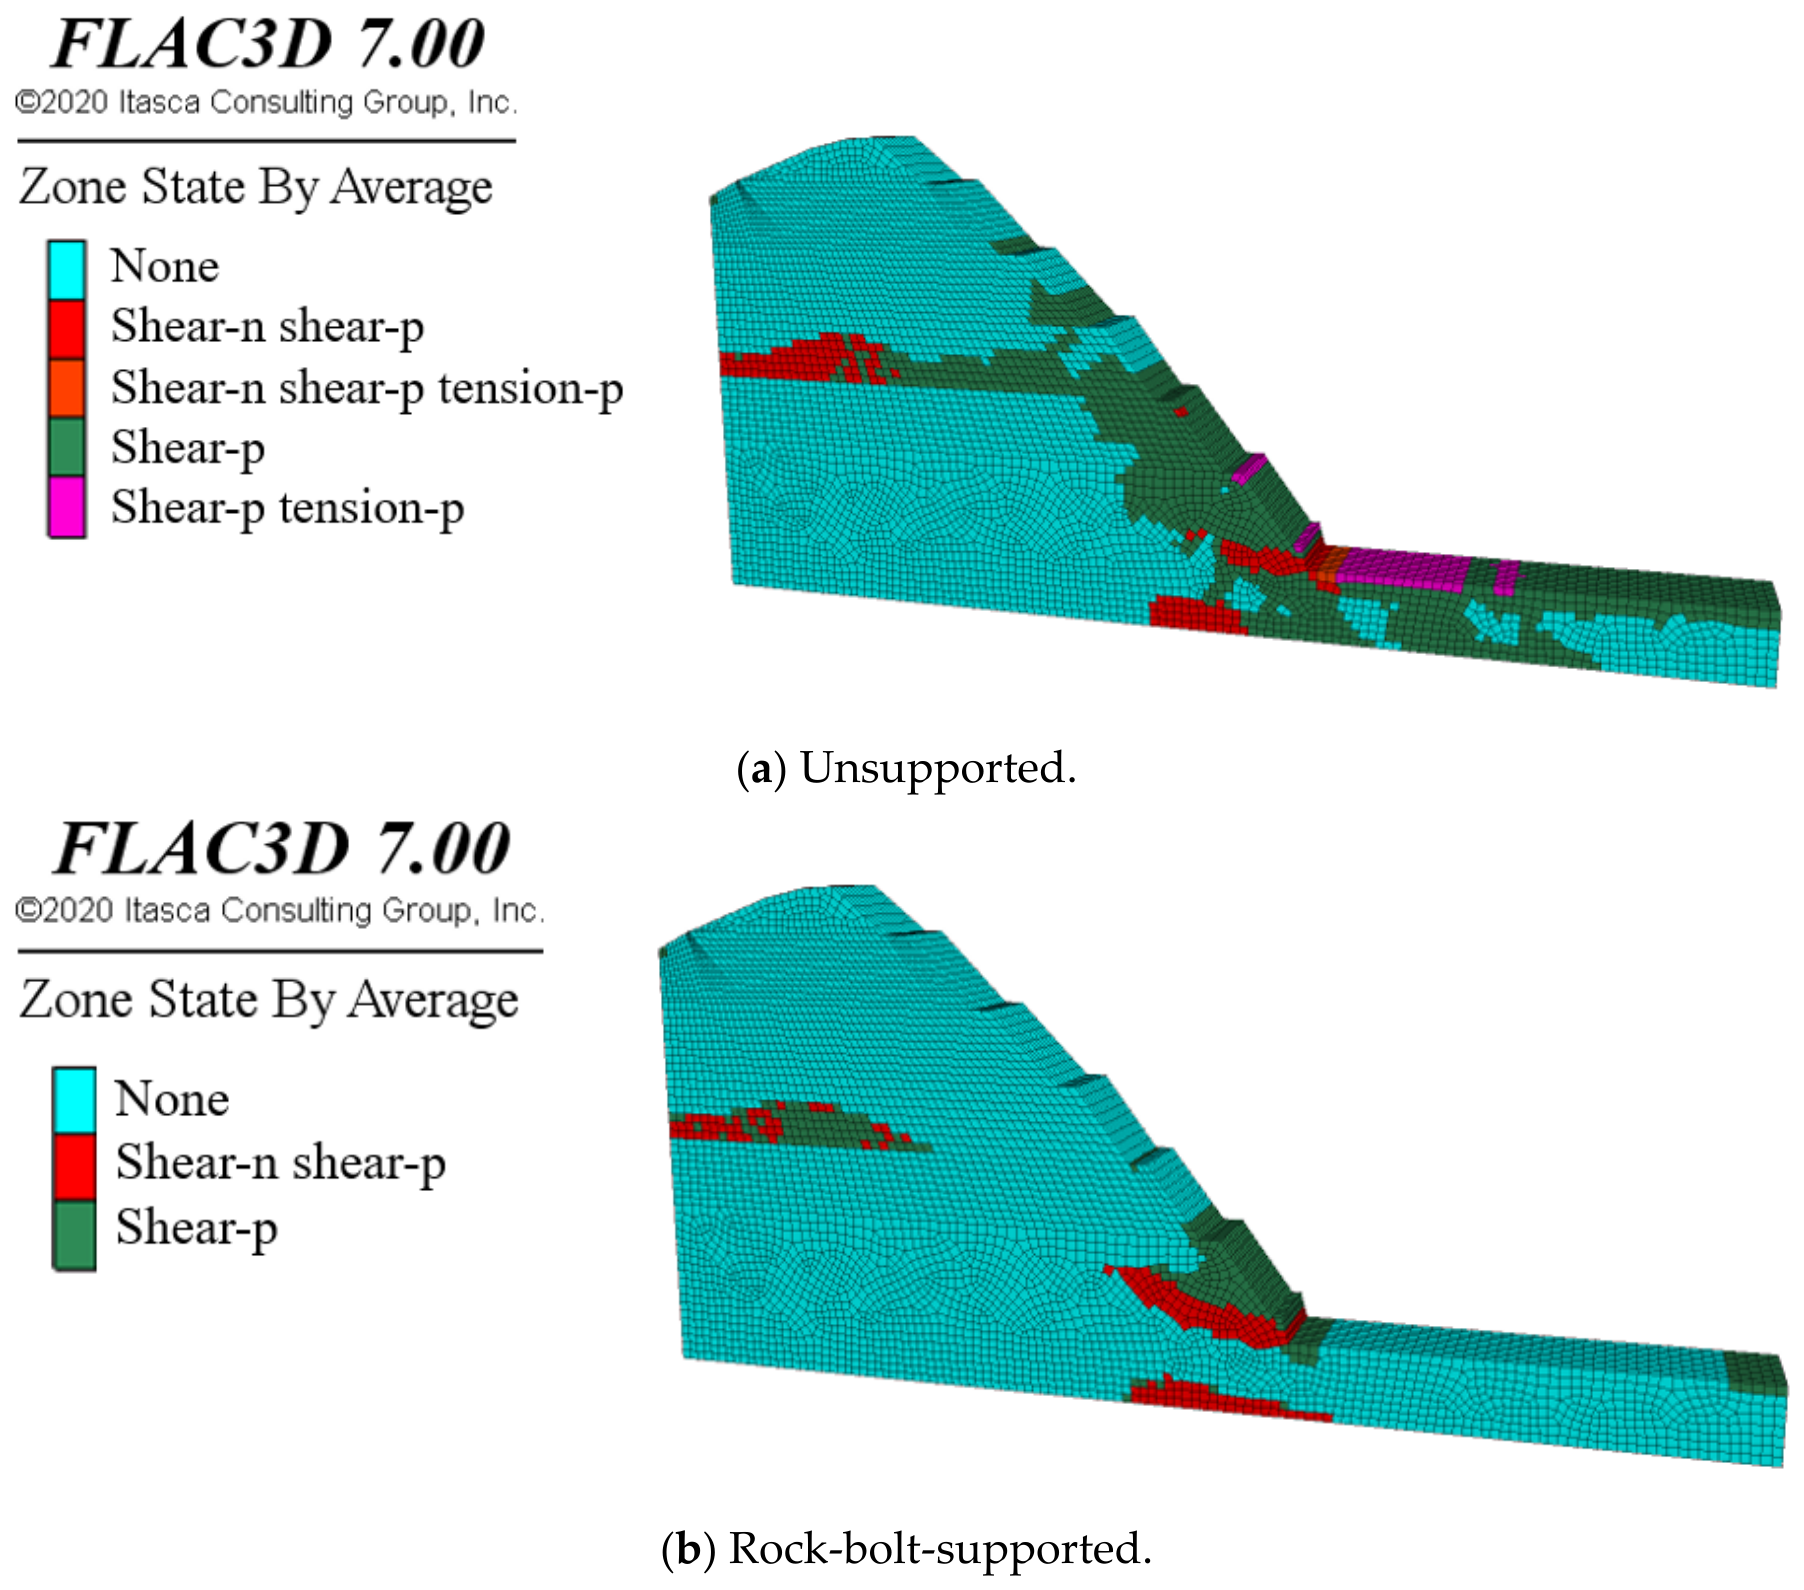
Figure 13 compares the plastic-zone distributions after excavation of the seventh bench. For unsupported conditions, a relatively extensive shear-plastic zone develops within the slope, including the region near the slope toe.
Figure 13.
Plastic-zone distributions after excavation of the seventh bench.
For the case with rock-bolt support, the final plastic zone is more localized and is concentrated mainly near the excavated face. Local shear yielding remains near the slope toe, but the extent of the plastic zone is smaller than that in the unsupported case. This comparison indicates that reinforcement limits the spatial extent of plastic deformation at the final excavation stage.
5.2.3. Comparison of Factors of Safety and Deformation Localization
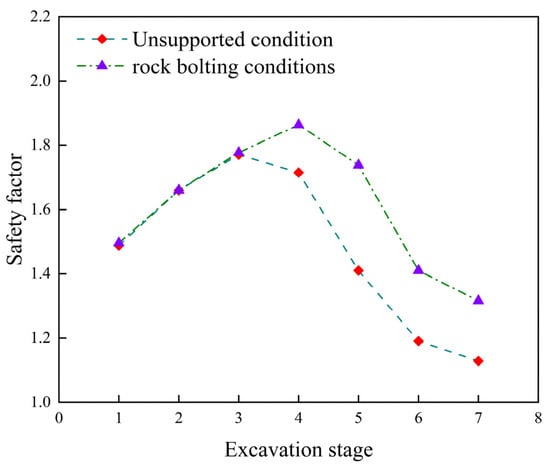
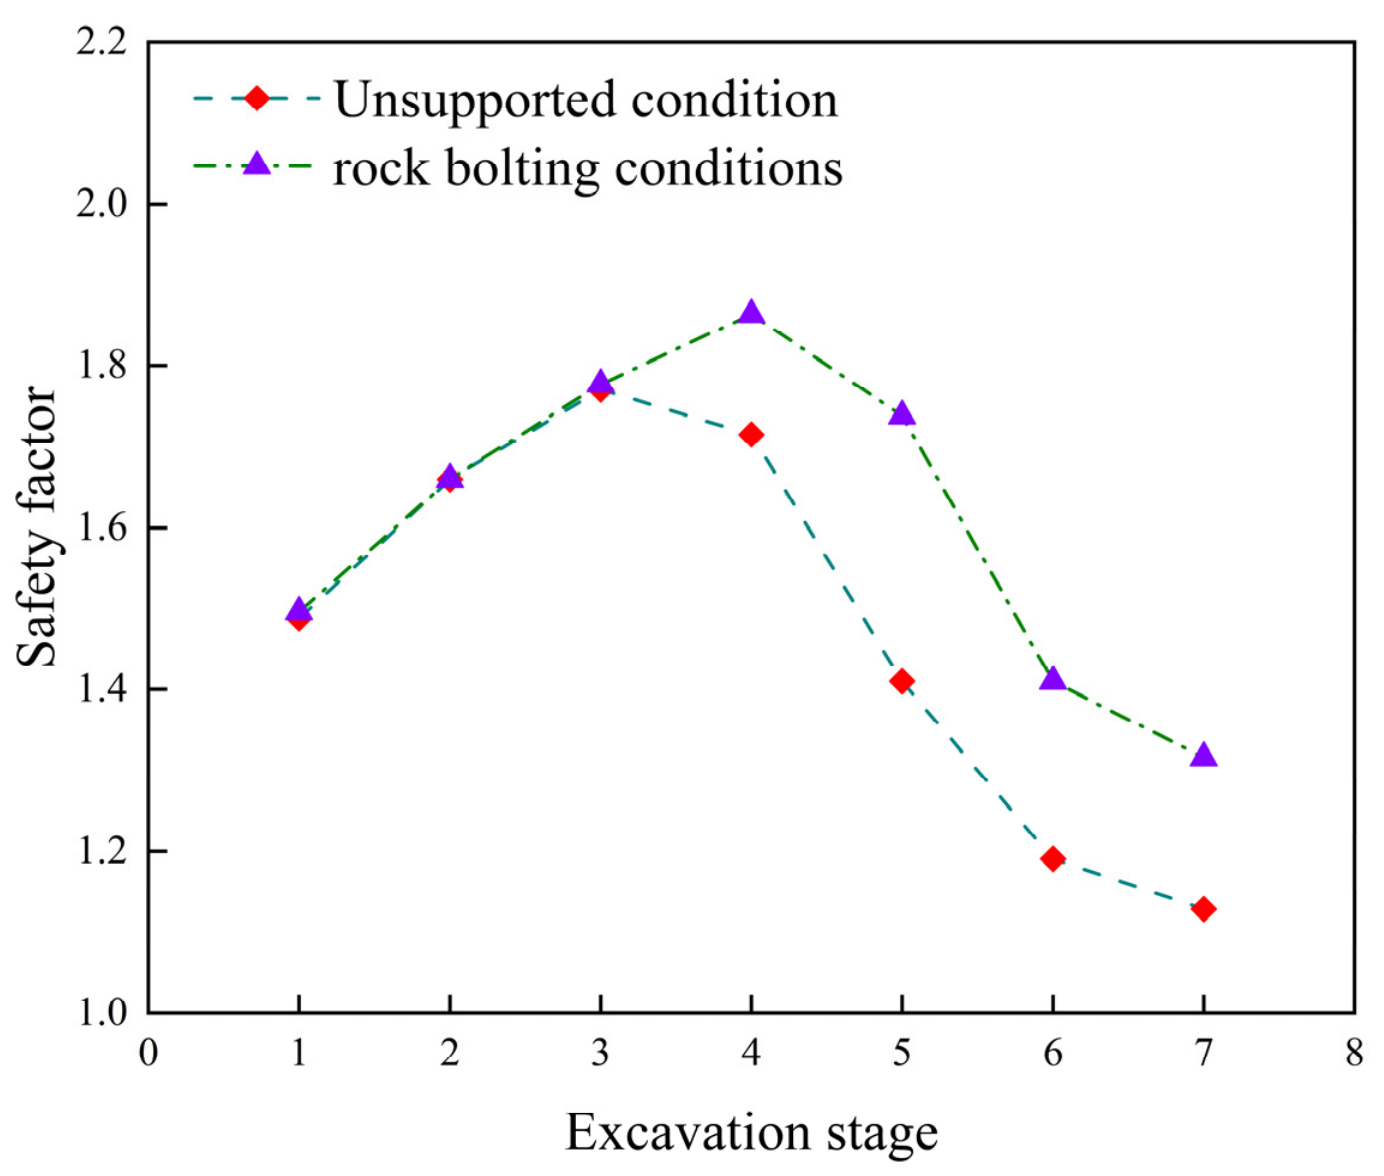
Slope stability is evaluated using the strength-reduction method built into FLAC3D. Table 3 and Figure 14 present the factors of safety after excavation of each bench. Both unsupported and sequentially rock-bolt-supported conditions are considered. As shown in Figure 14, the factor of safety varies non-monotonically during excavation. Without support, it increases from 1.488 after the first bench to a temporary peak of 1.770 after the third bench. This early increase may be associated with excavation-induced changes in geometry, unloading, and stress redistribution. From the fourth bench onward, the factor of safety decreases continuously. It reaches 1.129 after excavation of the seventh bench. This value is below the lower normal-condition reference value of 1.20 in JTG D30—2015. With sequential rock-bolt support, the factors of safety after excavation of the first three benches are 1.496, 1.660, and 1.777, respectively. These values are close to the unsupported values. The reinforcement effect becomes pronounced from the fourth bench onward. The maximum factor of safety reaches 1.863, which is 8.6% higher than the unsupported value. This result suggests a greater relative contribution from reinforcement at this stage. The difference in factors of safety alone does not establish the location of a critical sliding surface. From the fourth to the seventh excavation stages, the factor of safety gradually decreases but remains at or above 1.316. It exceeds the upper value of 1.30 in the normal-condition reference range. The final factor of safety increases from 1.129 without support to 1.316 with support. The relative increase is 16.6%.
Table 3.
Factors of safety after excavation of each bench.
Figure 14.
Factors of safety for different numbers of excavated benches.
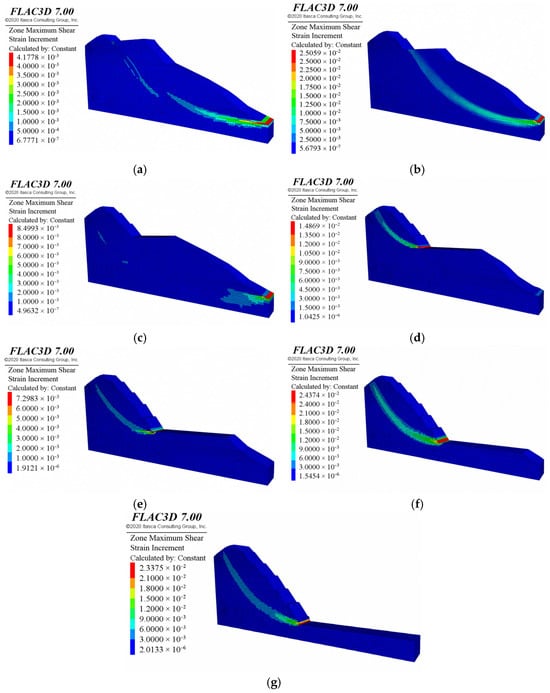
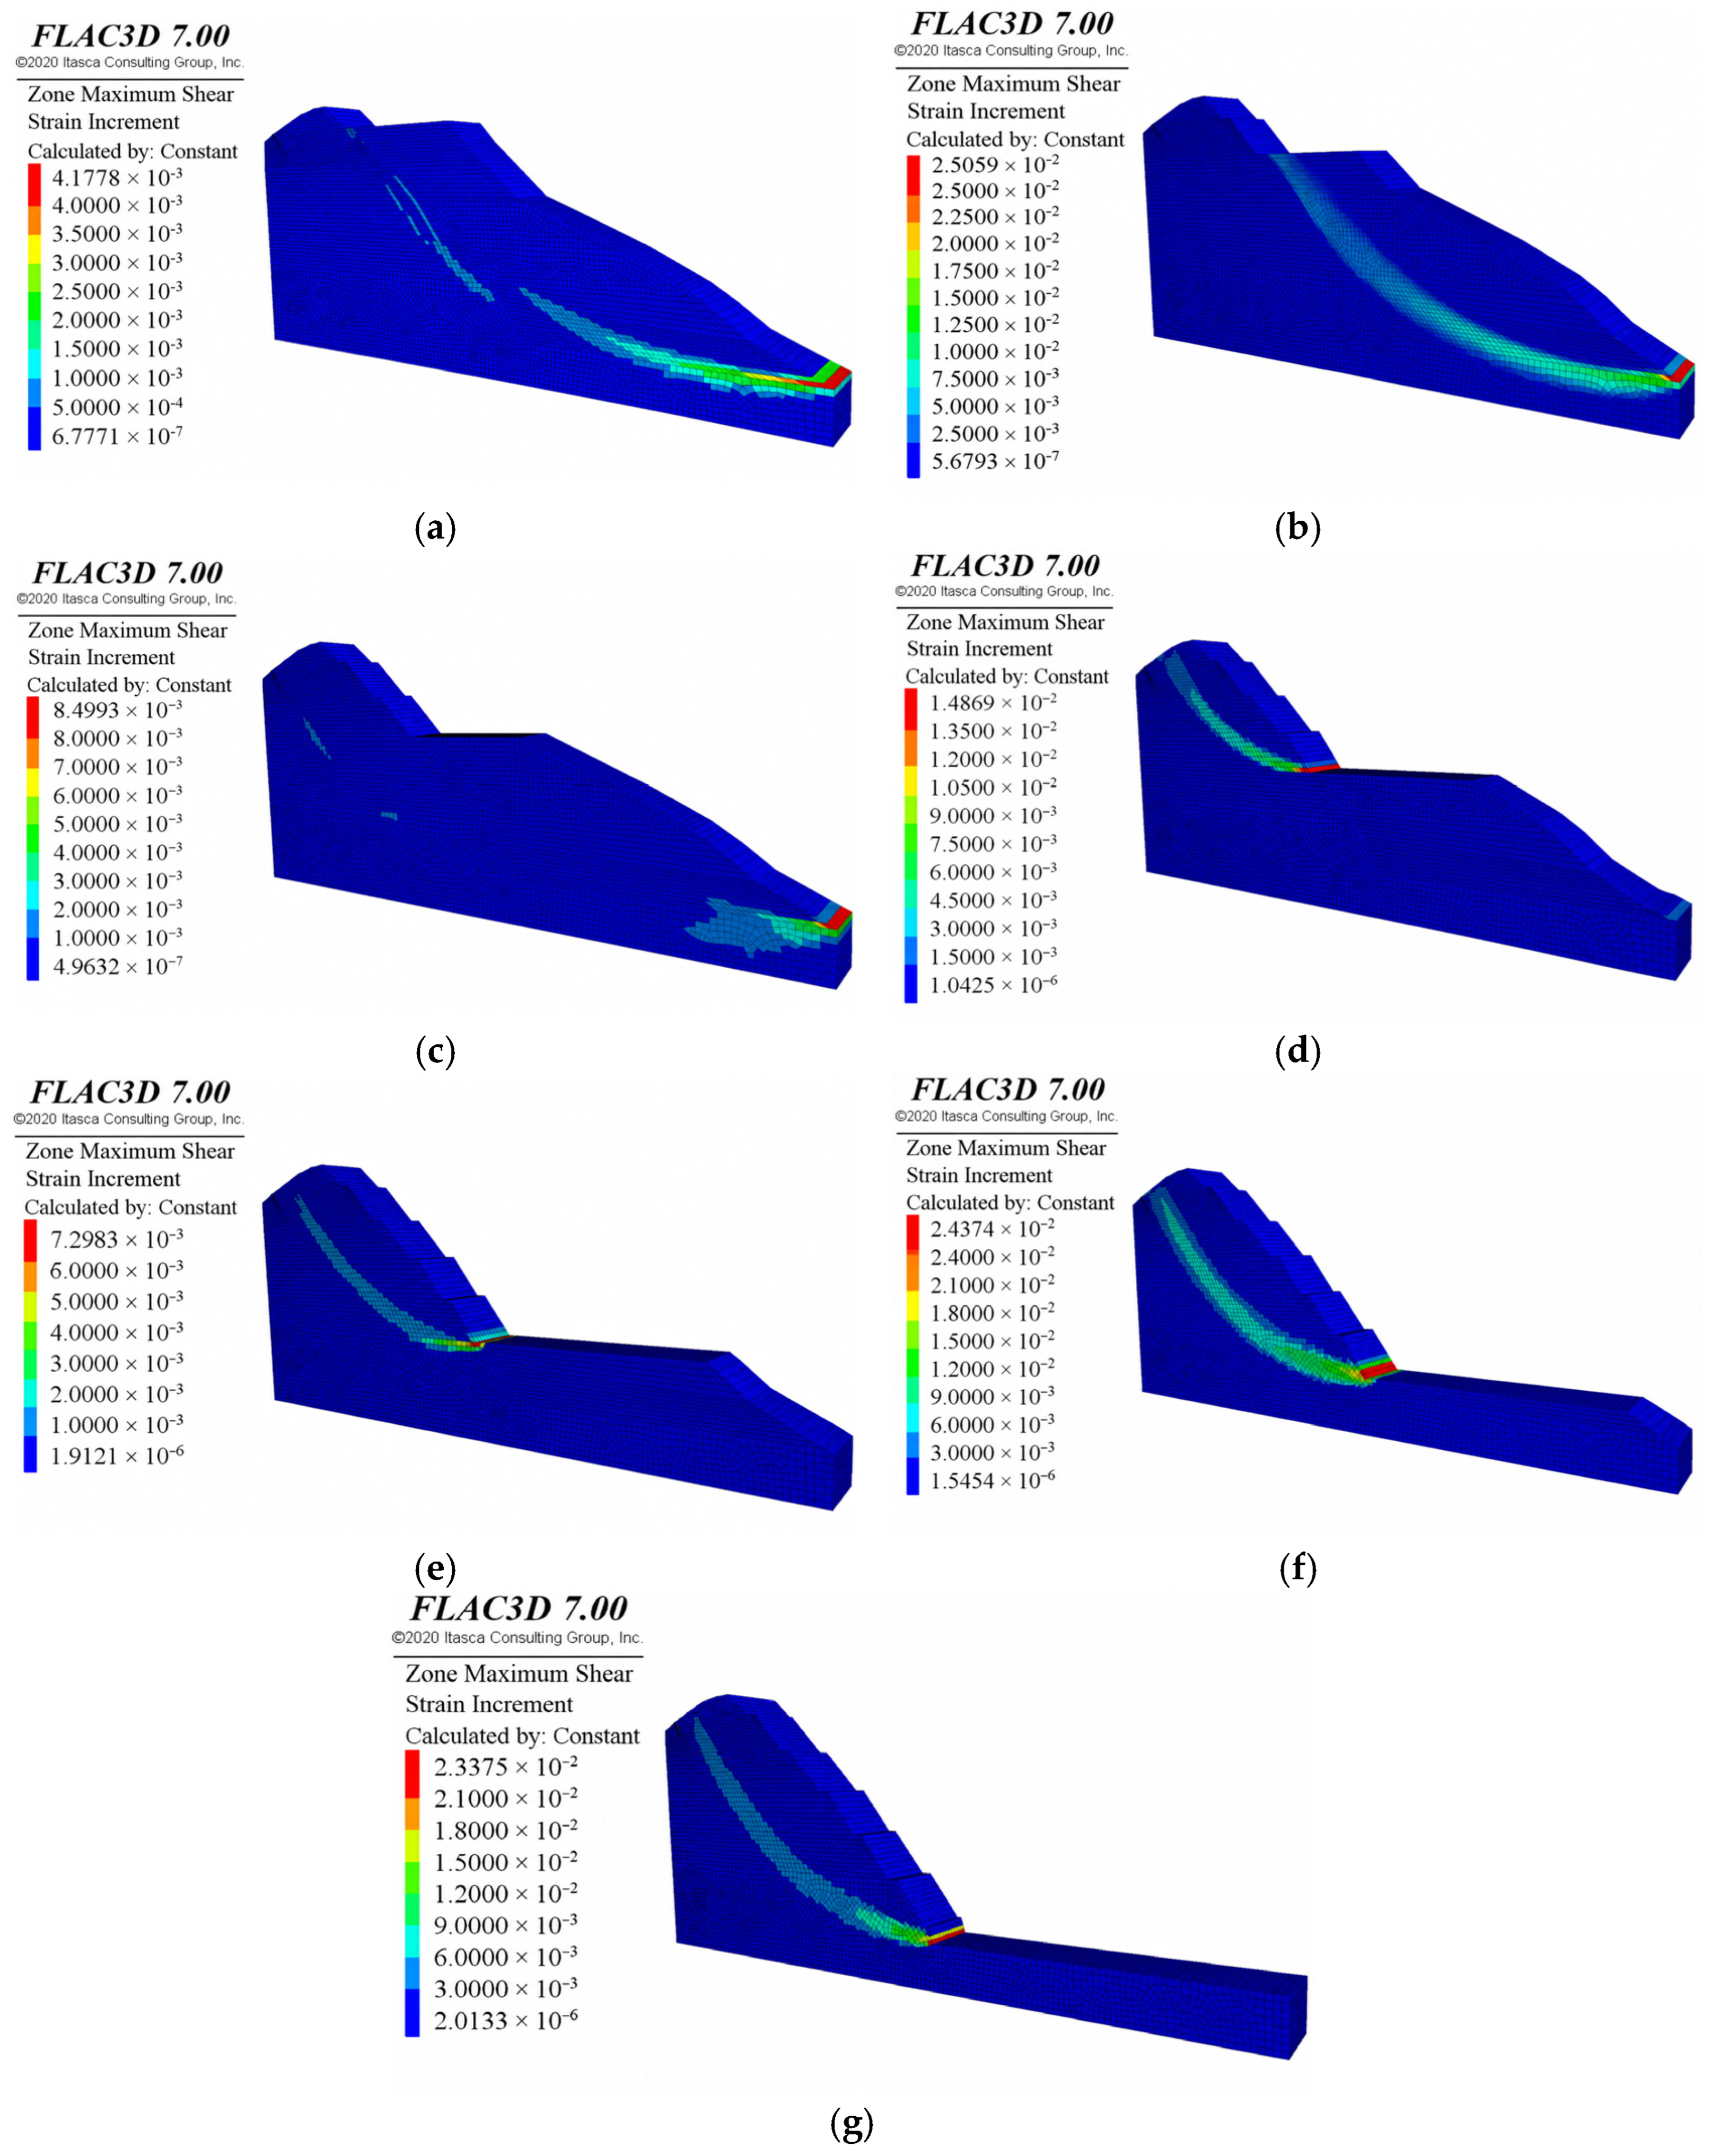
Figure 15 shows the maximum shear-strain-increment contours. They characterize the spatial distribution of localized deformation during staged excavation. Regions with higher shear-strain increments than the surrounding rock are interpreted as deformation concentration zones. Their locations and extents are examined together with the displacement patterns in Figure 11 and Figure 12. This comparison describes the development of potential deformation bands. These bands qualitatively represent strain localization rather than uniquely delineating a sliding surface. Excavation-induced unloading and stress redistribution may contribute to the non-monotonic factor-of-safety response. The contours provide complementary information on the associated deformation. At Stage 2, the reported factors of safety for the unsupported and sequentially supported slopes are both 1.660 at three-decimal precision. Meanwhile, the maximum bolt axial force reaches 241.5 kN (Table 4), indicating that the reinforcement bear load. Thus, identical reported factors of safety coexist with nonzero bolt axial forces. This reflects the distinction between local reinforcement loading and global stability. The influence of reinforcement on the factor of safety becomes more pronounced from Stage 4 onward.
Figure 15.
Maximum shear-strain-increment contours after each excavation stage. (a) Bench 1; (b) Bench 2; (c) Bench 3; (d) Bench 4; (e) Bench 5; (f) Bench 6; and (g) Bench 7.
Table 4.
Maximum axial force in the rock bolts after each excavation stage.
5.2.4. Analysis of Rock-Bolt Force Characteristics
Rock-bolt axial force indicates support demand during sequential excavation. Table 4 lists the maximum axial force in the rock-bolt system after excavation of each bench. The bolt or segment carrying the maximum force may change between stages. Therefore, this series should not automatically be interpreted as the loading history of a single bolt.
Table 4 shows that the stage-wise maximum bolt force increases from 175.5 to 241.5 kN during Stages 1–2. It then decreases by 5.1% to 229.1 kN at Stage 3. This small decrease may reflect excavation-induced stress redistribution or a change in the bolt segment carrying the system maximum force. The maximum force subsequently rises to 368.5 kN at Stage 4 and 462.9 kN at Stage 5. It then increases sharply by 187.1% to 1329.1 kN at Stage 6. At Stage 7, it reaches 1586.5 kN, a further increase of 19.4%. The pronounced increases during Stages 6–7 indicate elevated axial demand in the support system during the later excavation stages.
The evolution of rock-bolt axial force should be distinguished from changes in the factor of safety. During Stages 1–3, the difference in factors of safety between the supported and unsupported cases is small. From Stage 4 onward, bolt force increases while the supported factor of safety decreases from its Stage-4 peak. The sharp force increase at Stage 6 indicates increased support demand when the unsupported factor of safety is low.
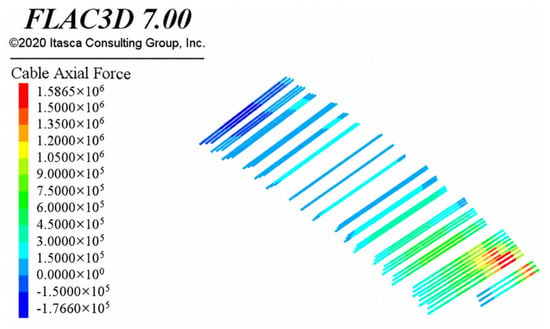
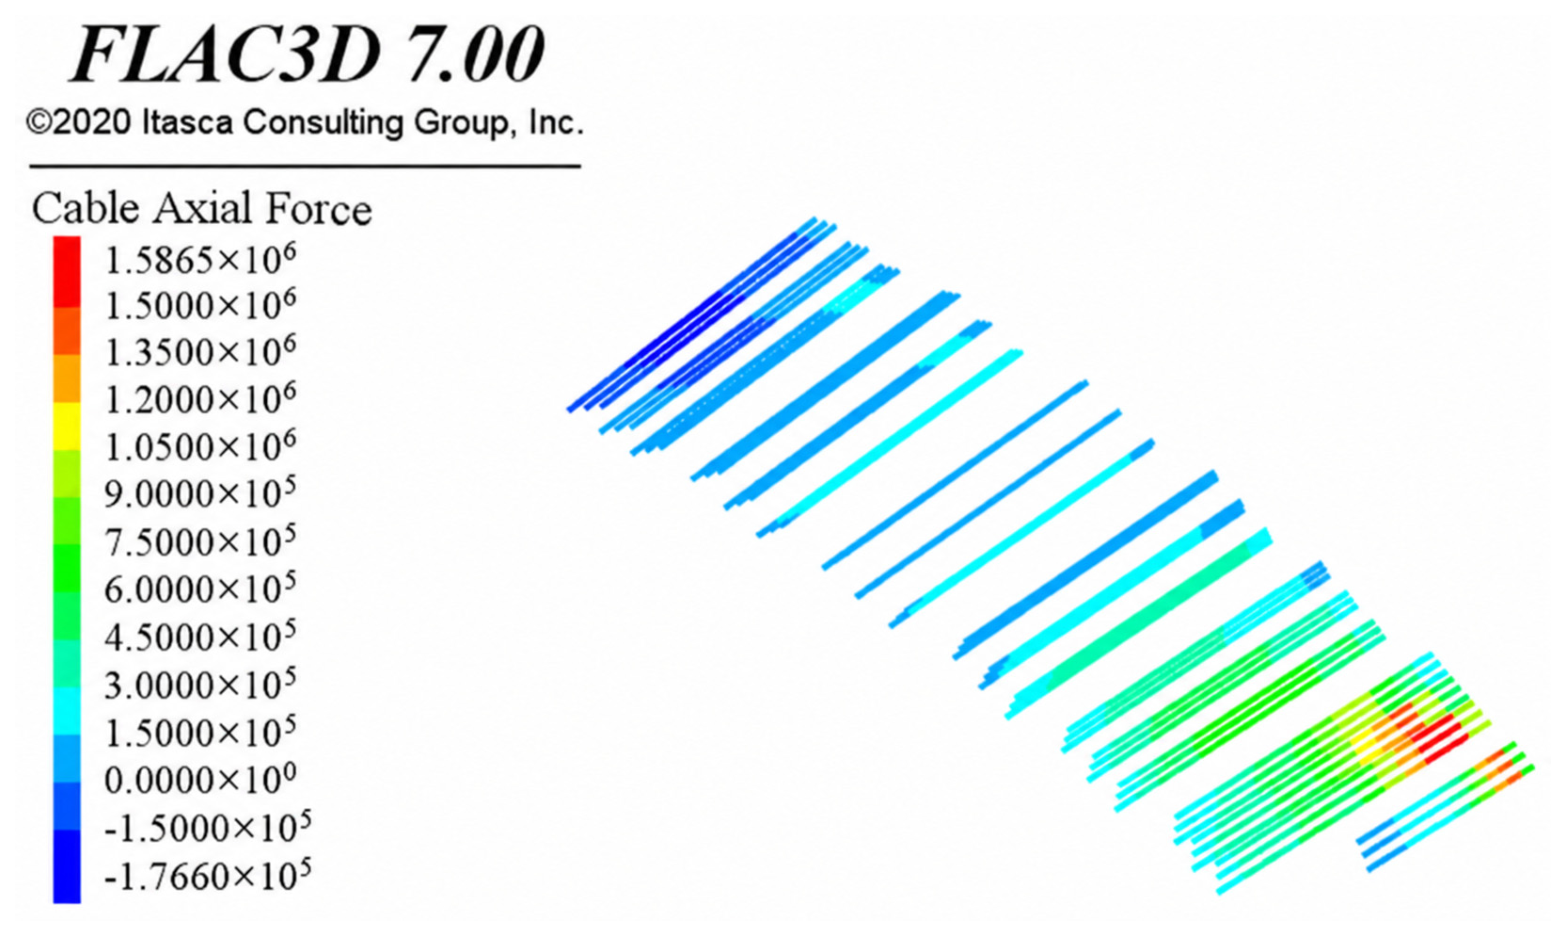
Figure 16 shows the rock-bolt axial-force distribution after excavation of the seventh bench. Axial force is distributed nonuniformly among the bolt rows and along individual bolts. The upper rows are predominantly blue to cyan. Green, yellow, and red segments are concentrated in the lower rows. This pattern indicates greater axial demand in the lower part of the support system after the final excavation stage. Localized high-value segments also indicate that demand varies along the bolt length. Table 4 quantifies the maximum axial force at each excavation stage.
Figure 16.
Distribution of rock-bolt axial force after excavation of the seventh bench.
Steel demand is assessed using the ratio of positive axial force to the reference yield load of 2120 kN. Based on Table 4, the ratios for Stages 1–7 are 8.3%, 11.4%, 10.8%, 17.4%, 21.8%, 62.7%, and 74.8%, respectively. For A = 1.963 × 10⁻³ m2, the final simulated maximum of 1586.5 kN corresponds to an average cross-sectional stress of 808.2 MPa. The monitored maximum of 1710.0 kN in Table 5 corresponds to a ratio of 80.7% and a stress of 871.1 MPa. Both stresses are below the nominal yield stress of 1080 MPa. These ratios indicate relatively low steel demand compared with nominal yielding. Design verification additionally requires the applicable resistance factors and assessment of the anchorage and bond resistance.
Table 5.
Comparison of simulated and monitored maximum bolt axial forces and associated slope-surface displacements at each excavation stage. The displacements refer to monitoring points near the heads of the bolts carrying the maximum axial forces.
Steel yielding and bond failure are distinct limit states. In the cable-element formulation, load transfer along the grouted length is represented by shear coupling with the surrounding rock. Assessment of bond resistance requires the mobilized interface shear force, effective bonded perimeter, confinement, anchorage length, and interface slip or yield state. The axial-force results presented here characterize steel demand, whereas bond performance depends on these additional interface quantities.
5.2.5. Comparison Between Monitoring Data and Numerical Results
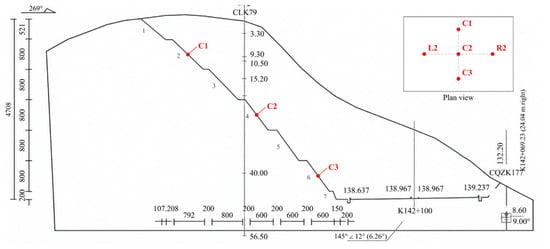
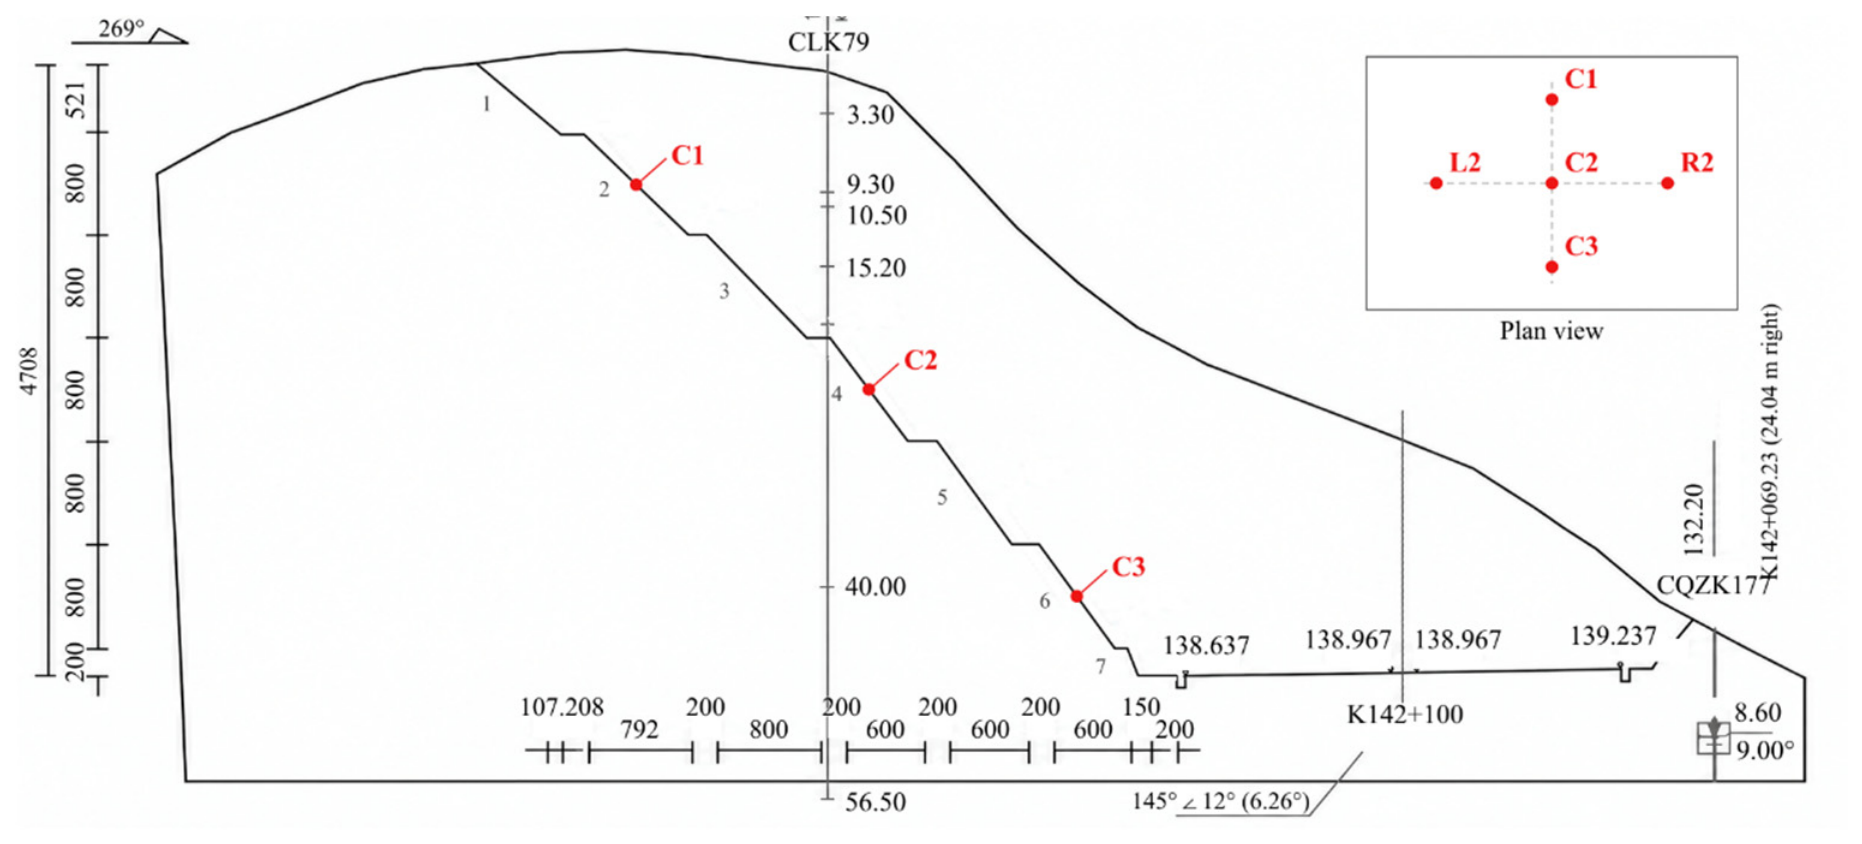
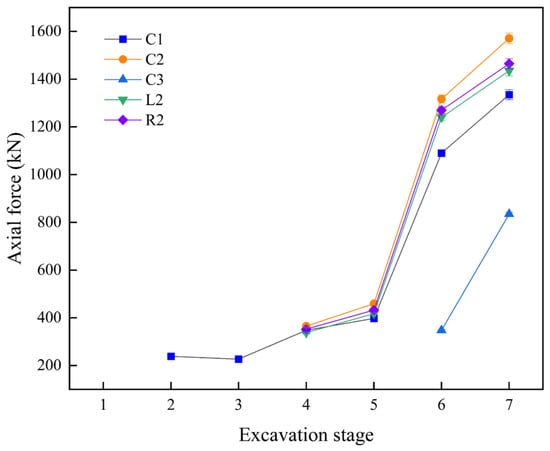
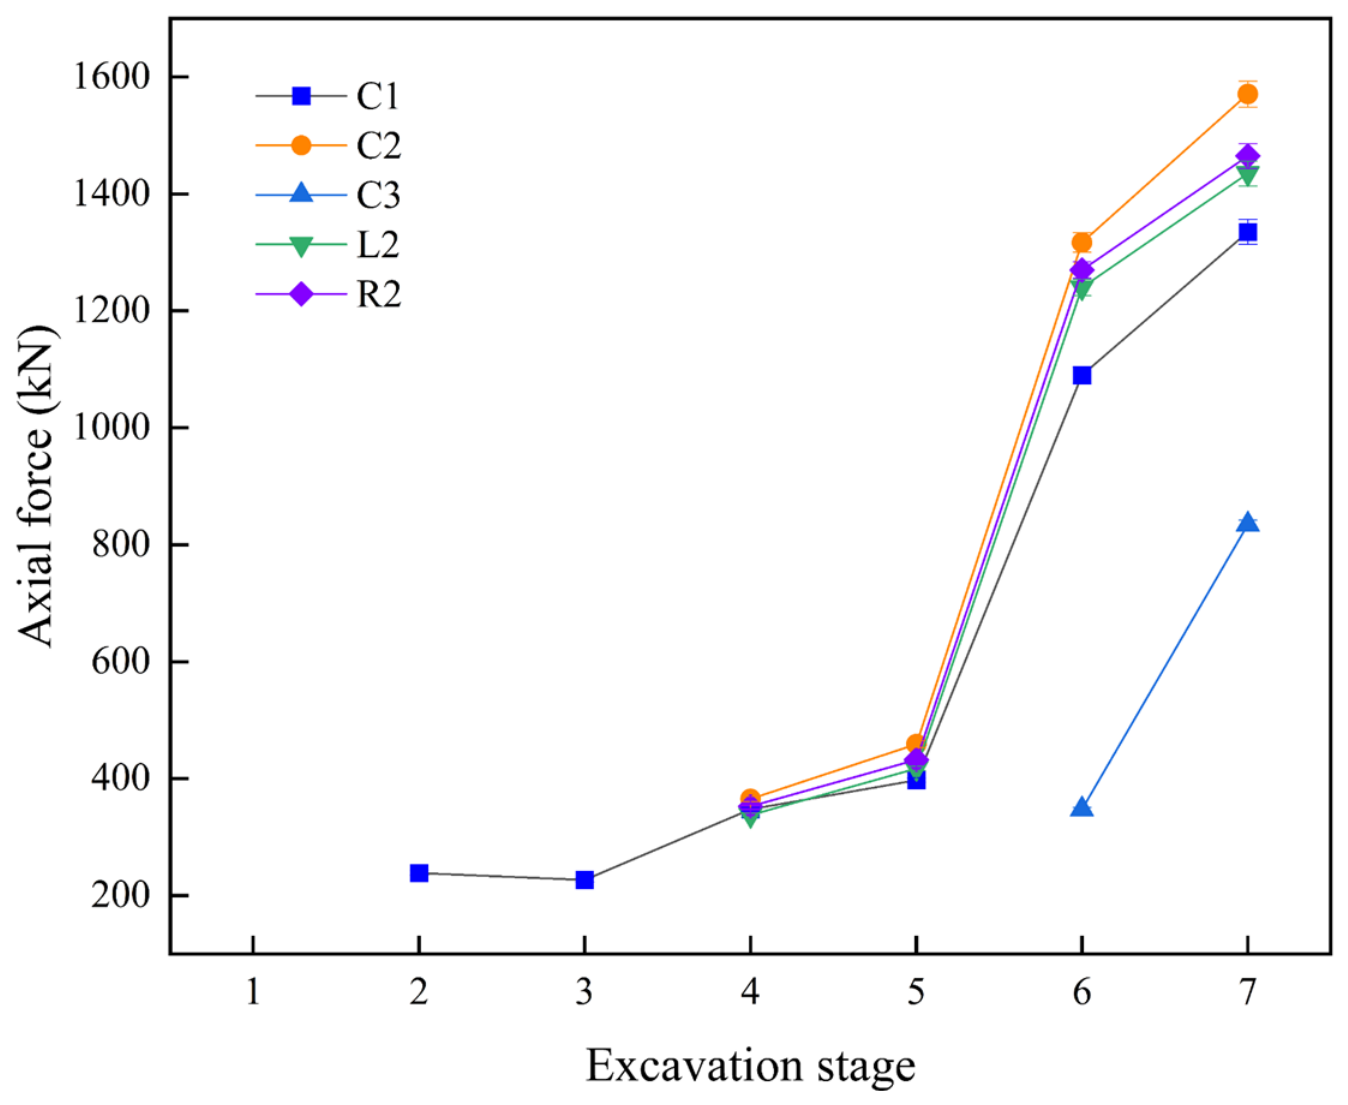
Field monitoring is used to assess the calculated deformation and reinforcement-loading responses during staged excavation. Monitoring-based assessments provide a link between calculated slope behavior and field observations [39,40]. The monitoring layout comprises five locations: C1, C2, C3, L2, and R2, as shown in Figure 17. In the cross-section, C1, C2, and C3 are located on the second, fourth, and sixth bench faces, respectively. L2 and R2 lie on either side of C2 in plan view. Displacement monitoring employs GEOKON Model 4430 vibrating-wire deformation meters. The manufacturer specifies a nominal resolution of 0.025% of full scale (F.S.). The specified accuracy under laboratory conditions is ±0.1% F.S. [41]. Field displacement accuracy also depends on repeatability and reference-point stability. Instrument orientation relative to the displacement component, calibration, and data-processing procedures also affect accuracy. Bolt axial force is measured using GEOKON Model 4900 vibrating-wire load cells [42]. For stage-wise comparisons, numerical and measured results are paired by completed excavation stage. Representative field measurements are taken after the corresponding stage is complete and the response stabilizes.
Figure 17.
Layout of five monitoring points.
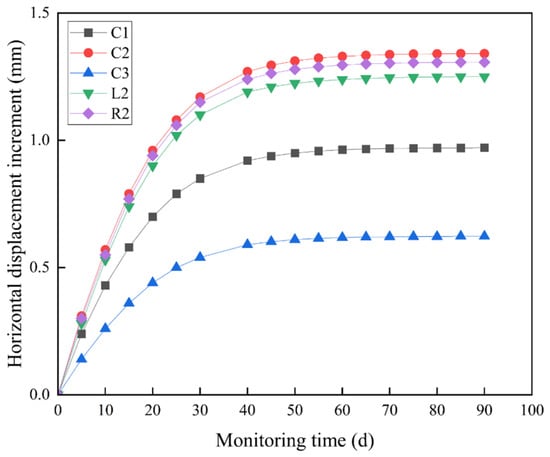
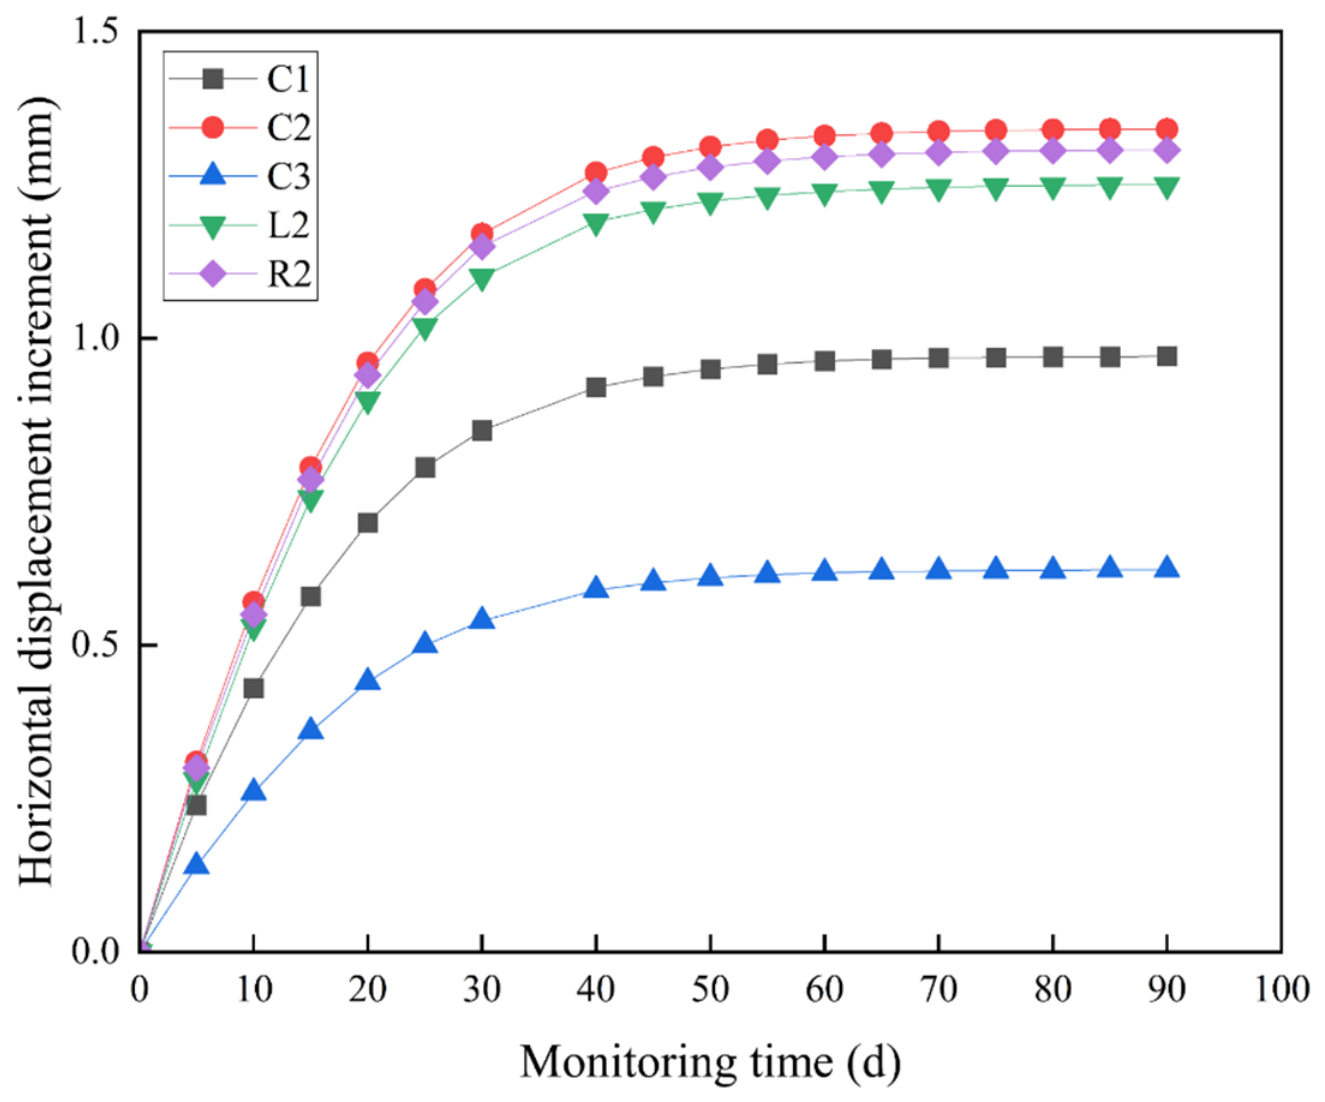
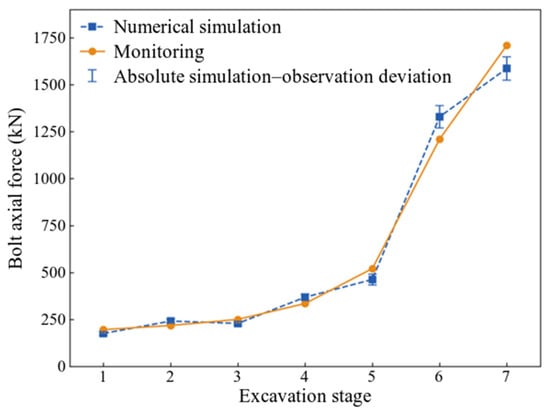
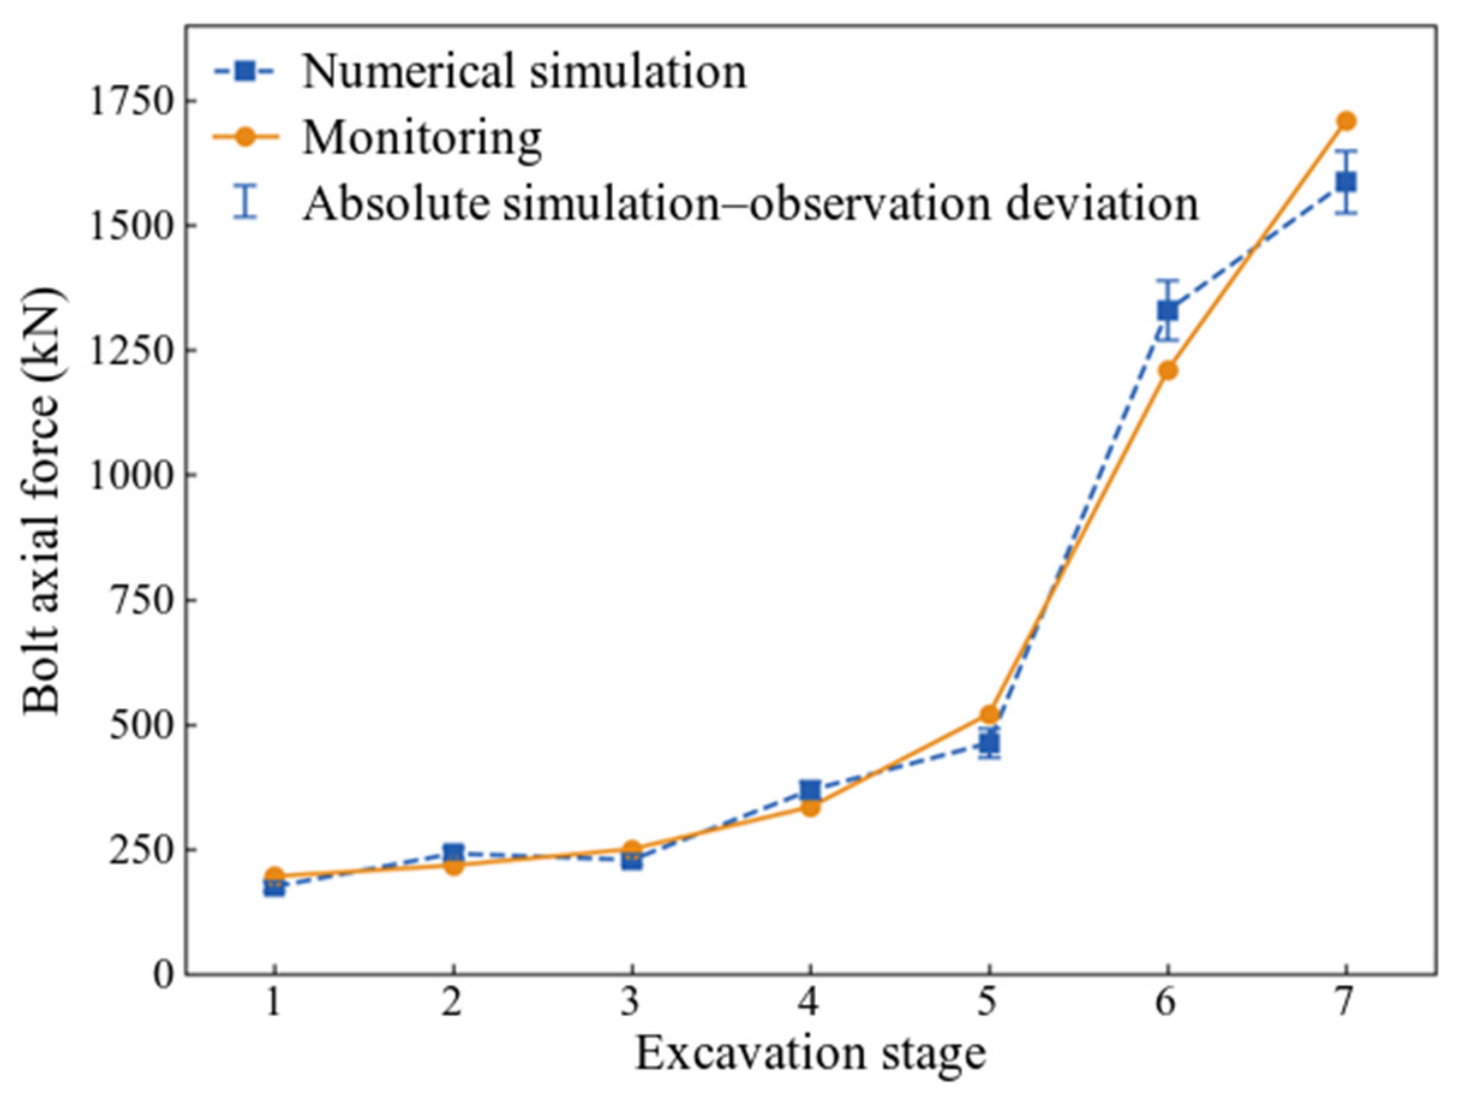
Figure 18 presents the horizontal-displacement increments at the five locations over a 90-day monitoring period. The increments increase rapidly early in the monitoring period and subsequently approach a plateau. C2 exhibits the largest increment, followed by R2, L2, C1, and C3. This indicates spatial variation in slope deformation. Figure 19 presents the simulated local bolt axial forces at these five locations during staged excavation. The central values of the plotted curves are simulated forces. Each error bar is centered on the simulated value. Its total end-to-end length equals the absolute simulation–observation difference at the same location and excavation stage. Table 5 separately compares the stage-wise maximum bolt axial forces and the associated slope-surface displacements. These displacements are measured near the heads of the bolts carrying the maximum axial forces. Simulated displacements are extracted at the corresponding monitoring-point locations for the same excavation stages. The bolt carrying the maximum axial force may change between stages. Consequently, the associated slope-surface monitoring point may also change.
Figure 18.
Horizontal-displacement increments at C1, C2, C3, L2, and R2 over the 90-day monitoring period.
Figure 19.
Simulated bolt axial forces at the five monitoring locations during staged excavation. The central values are simulated results. Each error bar is centered on the simulated value. Its total length equals the absolute simulation–observation difference at the same location and excavation stage.
The displacement and axial-force errors in Table 5 are calculated as absolute relative errors, using the measured value as the reference:
Here, i denotes the excavation stage. umax and Nmax denote the associated slope-surface displacement and the maximum bolt axial force, respectively. The displacement refers to the monitoring point near the head of the bolt carrying the stage-wise maximum axial force. For displacement, the superscript “max” identifies the monitoring point associated with the bolt carrying the maximum axial force. The subscripts “sim” and “obs” denote numerical and measured values. The mean error for each quantity is the arithmetic average of the seven stage-wise errors. It is calculated before rounding. The individual errors and their means are reported to one decimal place.
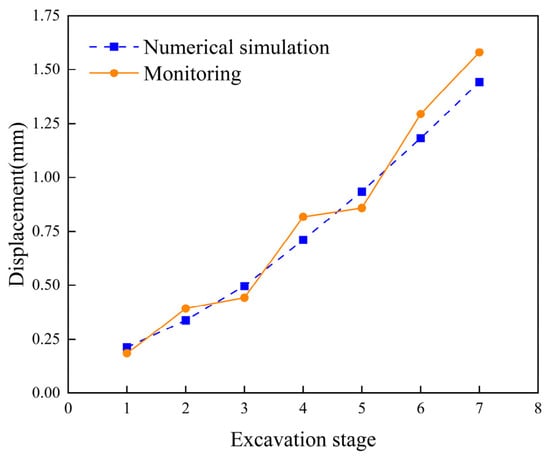
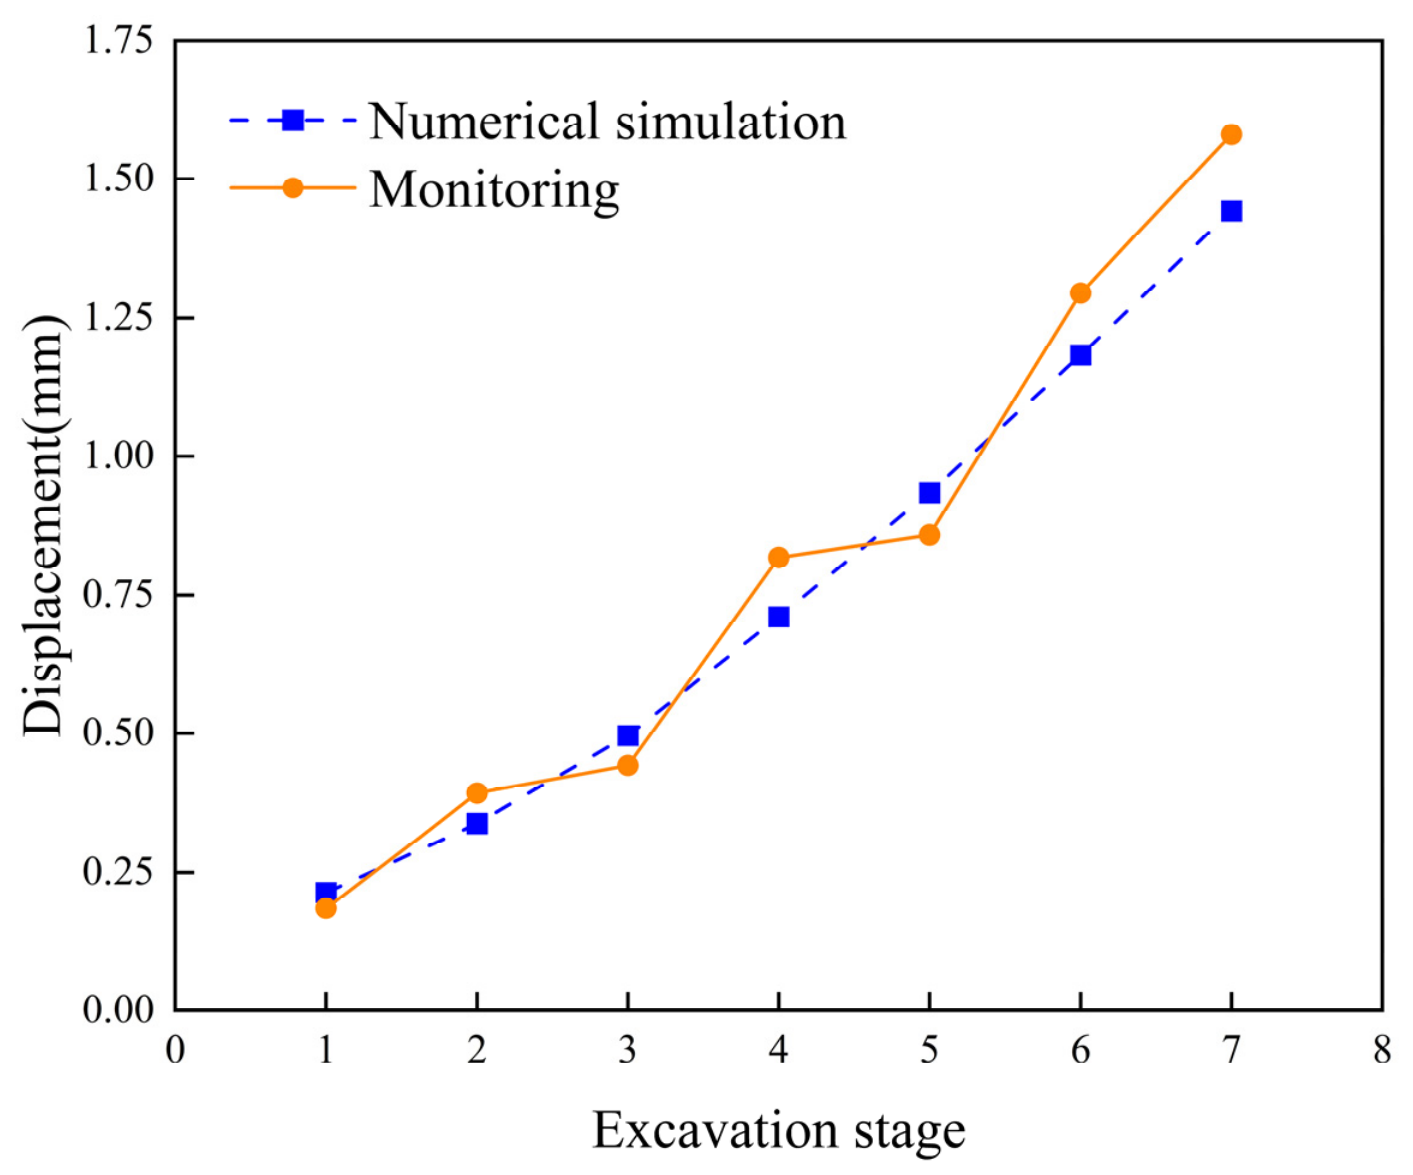
Table 5 and Figure 20 and Figure 21 compare simulated and monitored responses. Displacements at the selected slope-surface monitoring points increase as excavation progresses. Both maximum axial-force series increase sharply at Stage 6. At Stage 3, however, the simulated maximum decreases from 241.5 to 229.1 kN. The monitored maximum increases from 218.0 to 250.5 kN. Across the seven stages, the displacement error ranges from 8.6% to 15.7%, with a mean of 11.6%. The axial-force error ranges from 7.2% to 11.2%, with a mean of 9.7%. At Stage 7, the monitored slope-surface displacement near the head of the bolt carrying the maximum axial force is 1.580 mm. The corresponding simulated displacement is 1.442 mm. The monitored and simulated maximum axial forces are 1710.0 and 1586.5 kN, respectively. The comparisons show agreement in the overall trends and magnitudes of the evaluated displacement and reinforcement-loading responses. This assessment concerns the measured response quantities. The factors of safety and deformation-localization patterns are numerical interpretations.
Figure 20.
Comparison of simulated and monitored slope-surface displacements. Monitoring points lie near the heads of the bolts carrying the stage-wise maximum axial forces.
Figure 21.
Comparison between simulated and monitored axial forces at each excavation stage.
5.3. Effect of Rock-Bolt Length
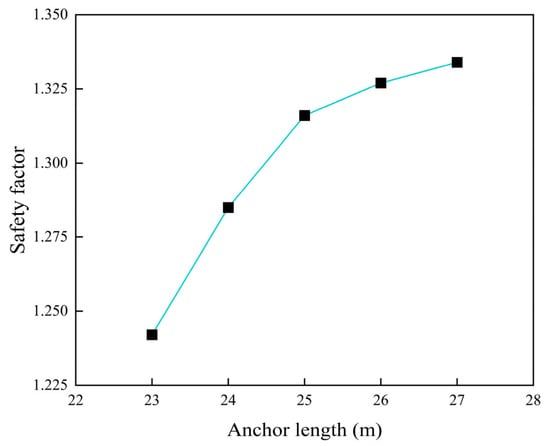
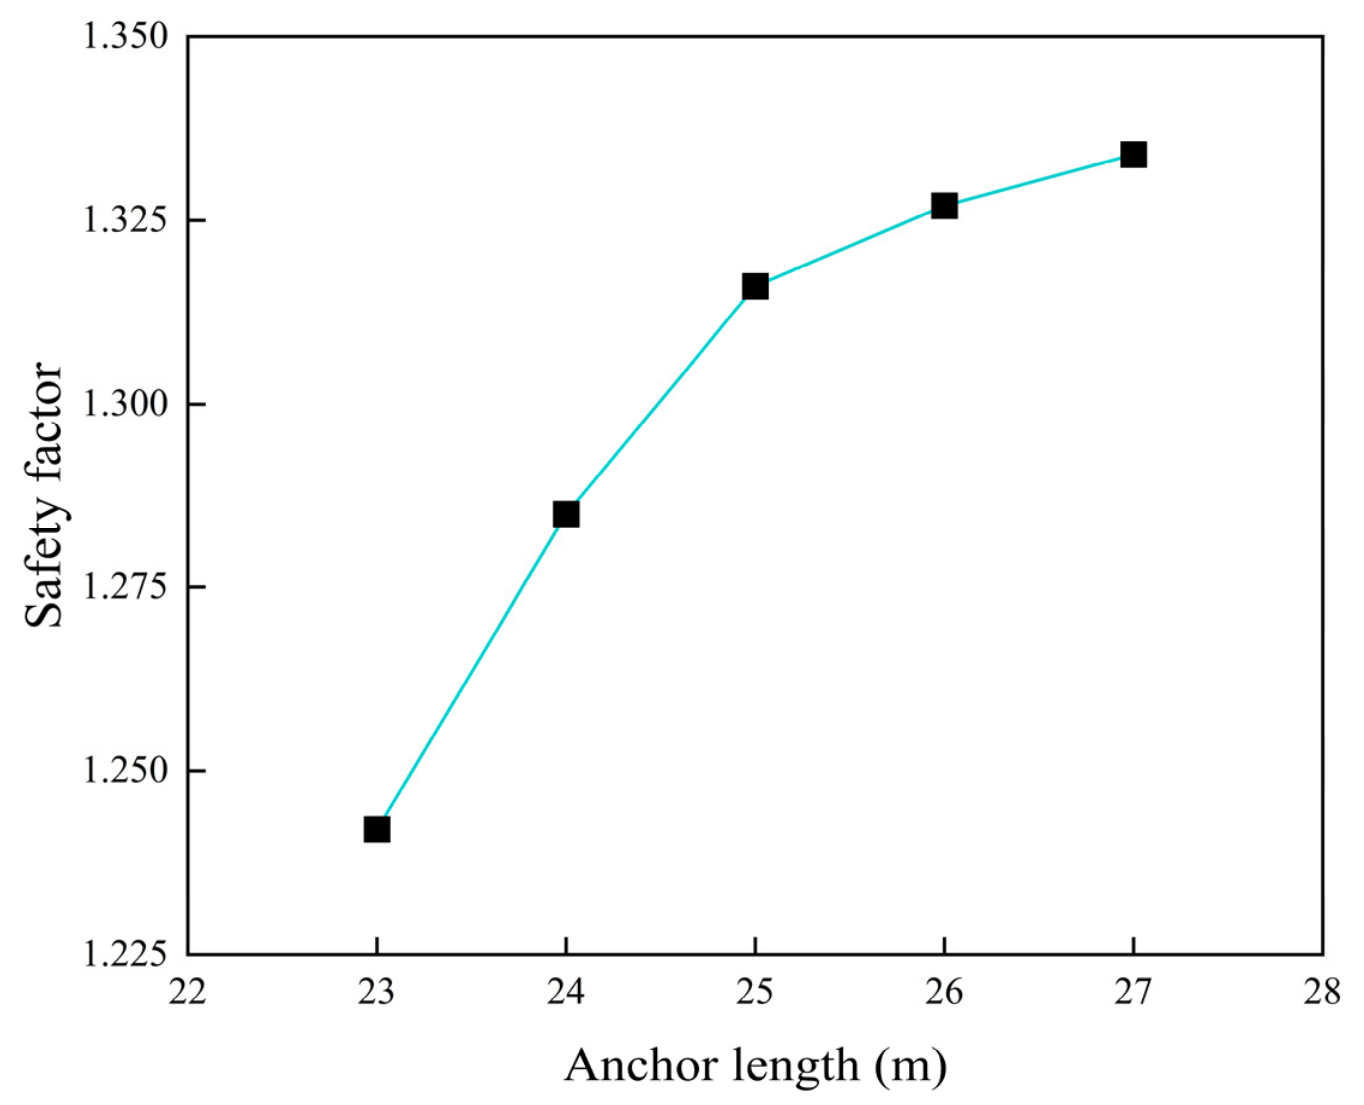
Rock-bolt lengths of 23, 24, 25, 26, and 27 m are analyzed. The inclination angle is fixed at 30°, and both horizontal and vertical spacings are fixed at 3 m. Numerical results after the final excavation stage are extracted for analysis. Table 6 and Figure 22 show the relationship between the final factor of safety and rock-bolt length. The factor of safety increases nonlinearly with bolt length, at a progressively smaller rate. Increasing the length from 23 to 25 m raises the factor of safety from 1.242 to 1.316. This is an increase of approximately 6.0%. Beyond 25 m, the increase in the factor of safety becomes substantially smaller. These results indicate diminishing incremental benefits beyond 25 m within the analyzed range of 23–27 m. A length of 25 m is retained for the reference case. This narrow range alone does not establish a universally applicable effective anchorage length or an economically optimal design.
Table 6.
Factors of safety for different rock-bolt lengths.
Figure 22.
Variation in the slope factor of safety with rock-bolt length after final excavation.
5.4. Effect of Rock-Bolt Inclination Angle
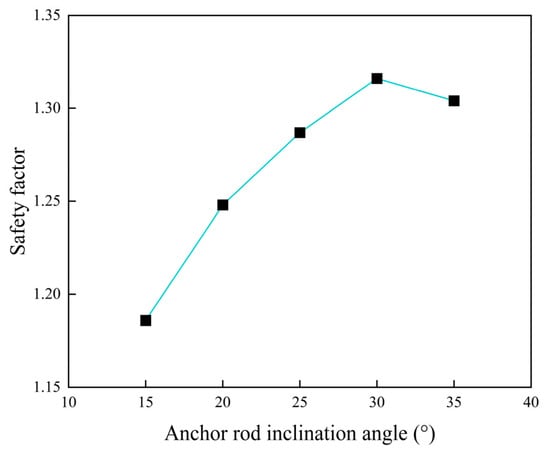
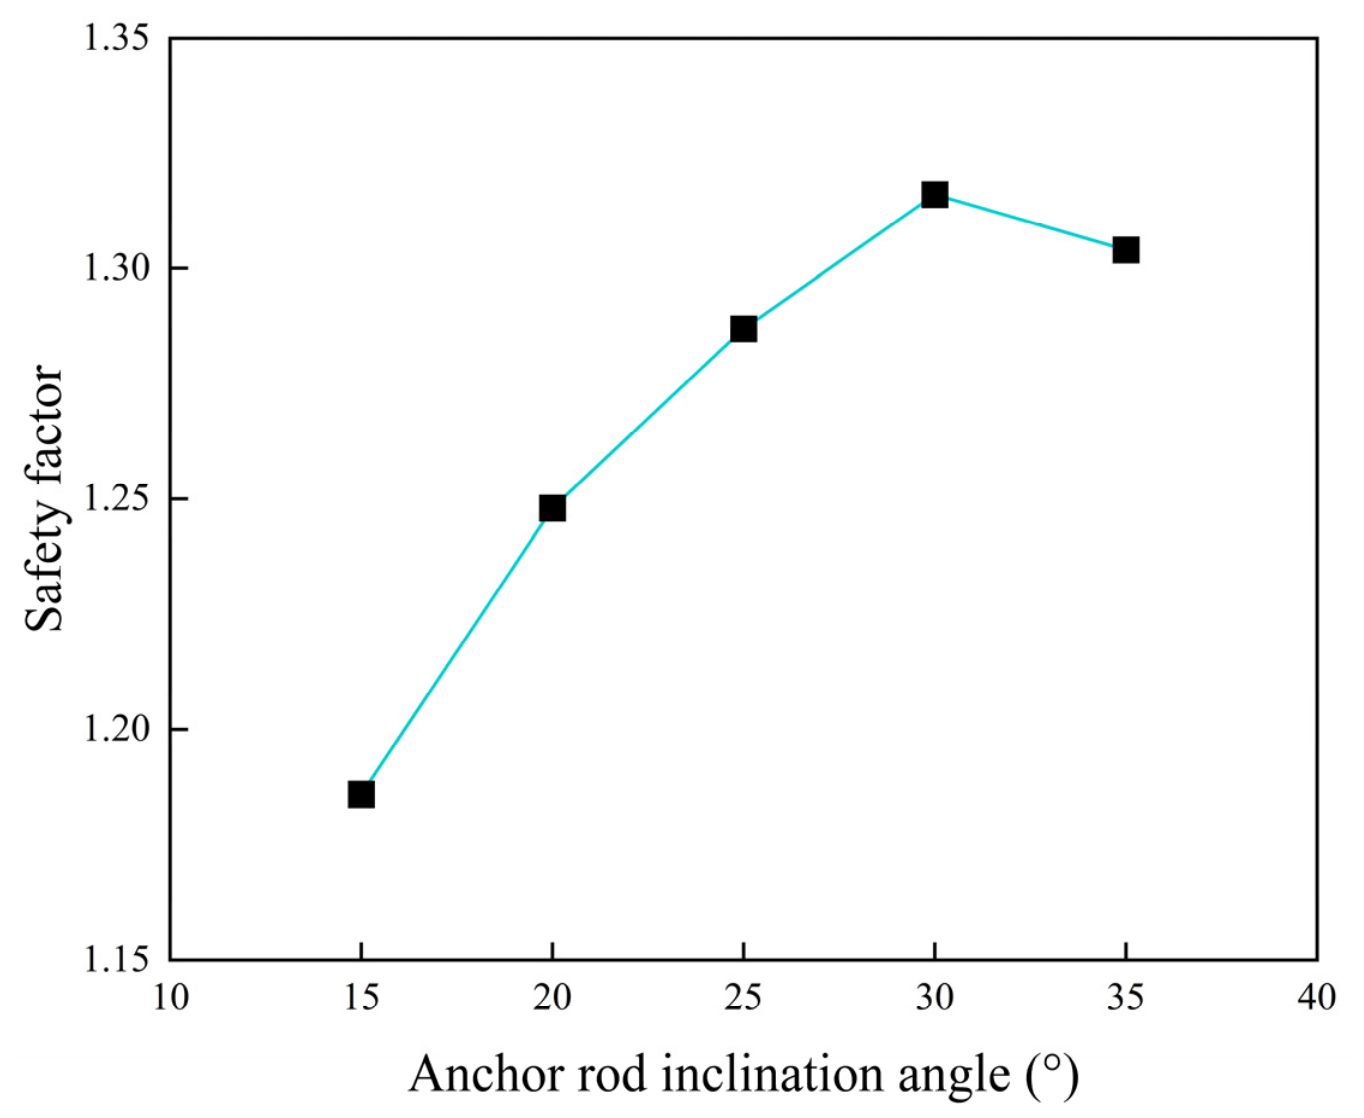
Five inclination angles, 15°, 20°, 25°, 30°, and 35°, are analyzed. The bolt length is fixed at 25 m, and both horizontal and vertical spacings are fixed at 3 m. Table 7 and Figure 23 show the relationship between the factor of safety and bolt inclination after final excavation. At a fixed bolt length and spacing, the factor of safety first increases and then decreases as inclination increases. At 30°, the factor of safety reaches its peak value of 1.316. This exceeds the upper value of 1.30 in the normal-condition reference range of JTG D30—2015. Thus, the 30° case yields the highest factor of safety among the five sampled inclinations under the fixed reference conditions.
Table 7.
Factors of safety for different rock-bolt inclination angles.
Figure 23.
Variation in the slope factor of safety with rock-bolt inclination after final excavation.
5.5. Effect of Horizontal Rock-Bolt Spacing
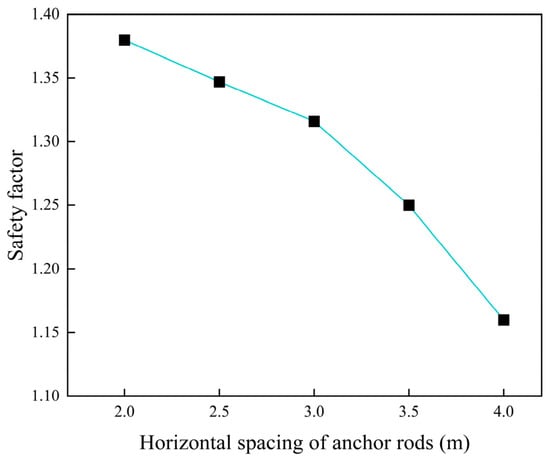
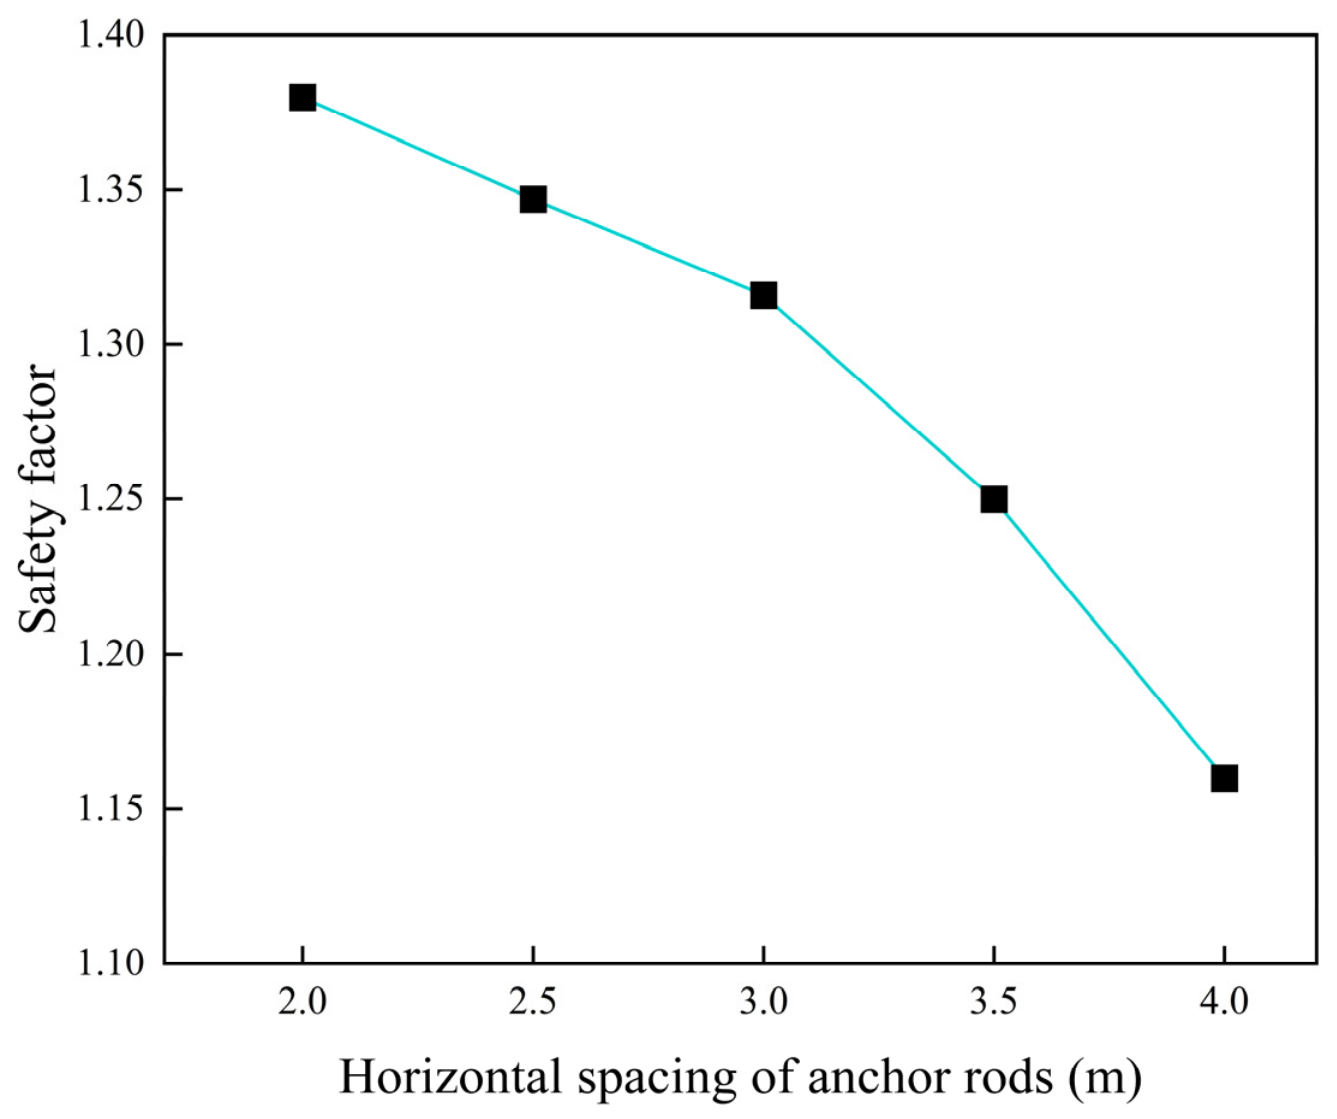
Five horizontal spacings, 2.0, 2.5, 3.0, 3.5, and 4.0 m, are analyzed. The bolt length is fixed at 25 m, the inclination at 30°, and the vertical spacing at 3 m. Table 8 and Figure 24 show the relationship between the factor of safety and horizontal spacing after final excavation. The factor of safety decreases as horizontal spacing increases, with greater reductions at larger spacings. Increasing the horizontal spacing from 2.0 to 4.0 m reduces the factor of safety from 1.38 to 1.16. This is a decrease of approximately 15.9%. A horizontal spacing of 3.0 m is used for the reference case in this comparison. No economic optimum is inferred from the factors of safety alone.
Table 8.
Factors of safety for different horizontal spacings.
Figure 24.
Variation in the slope factor of safety with horizontal rock-bolt spacing after final excavation.
5.6. Effect of Vertical Rock-Bolt Spacing
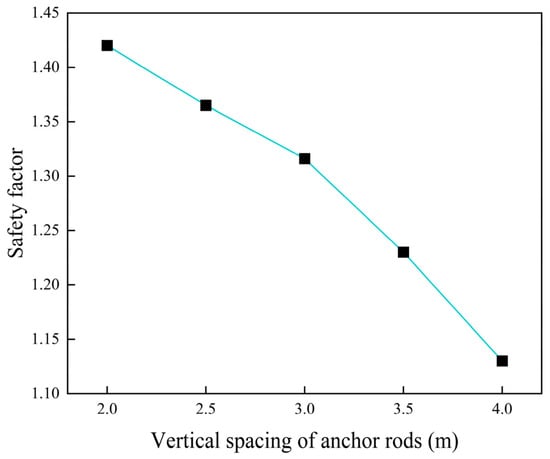
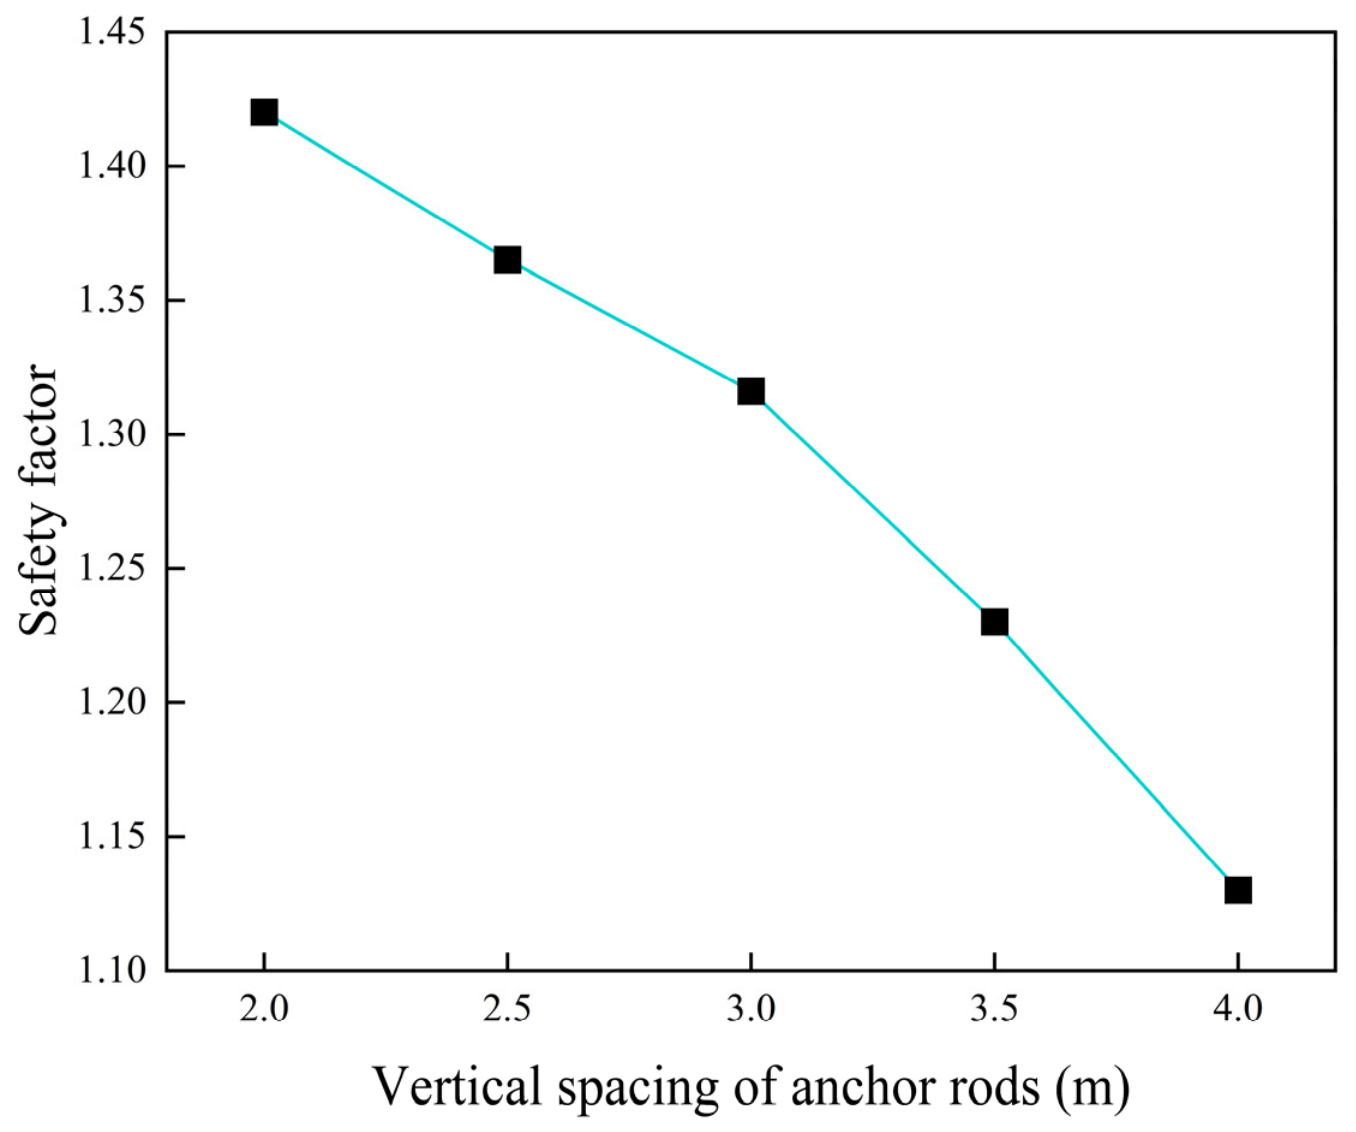
Five vertical spacings, 2.0, 2.5, 3.0, 3.5, and 4.0 m, are analyzed. The bolt length is fixed at 25 m, the inclination at 30°, and the horizontal spacing at 3 m. Table 9 and Figure 25 show the relationship between the factor of safety and vertical spacing after final excavation. The factor of safety decreases more rapidly with increasing vertical spacing than with increasing horizontal spacing. Increasing the vertical spacing from 2.0 to 4.0 m reduces the factor of safety from 1.42 to 1.13. This is a decrease of approximately 20.4%. This result indicates greater sensitivity of the factor of safety to vertical spacing. A vertical spacing of 3.0 m is used for the reference case. The comparison is limited to the analyzed interval. It does not establish the economic optimality of a 3.0 m × 3.0 m layout.
Table 9.
Factors of safety for different vertical spacings.
Figure 25.
Variation in the slope factor of safety with vertical rock-bolt spacing after final excavation.
6. Conclusions
FLAC3D 7.0 simulates the sequential excavation of seven benches in a high and steep rock slope. The analysis uses the Mohr–Coulomb constitutive model and the strength-reduction method. Displacement fields, plastic-zone distributions, and factors of safety are systematically compared between unsupported and rock-bolt-supported conditions. The effects of bolt length, inclination angle, horizontal spacing, and vertical spacing on the factor of safety are also investigated. The main conclusions are as follows:
- (1)
- Sequential rock-bolt support reduces the final maximum total displacement from 2.895 to 1.442 mm, a reduction of 50.2%. It also decreases the final extent of the plastic zone.
- (2)
- The final unsupported factor of safety is 1.129, below the lower normal-condition reference value of 1.20 in JTG D30—2015. Sequential rock-bolt installation raises it to 1.316, exceeding the upper reference value of 1.30. The final factor of safety increases by 16.6% under the modeled dry, static condition.
- (3)
- The stage-wise maximum rock-bolt force decreases by 5.1% at Stage 3 and increases sharply at Stage 6. The small Stage-3 decrease may reflect stress redistribution or a change in the location of the system maximum rock-bolt axial force. It is not reproduced by the selected monitoring series. Increasing bolt force during the later stages indicates increasing support demand. Meanwhile, the supported factor of safety decreases from its Stage-4 peak.
- (4)
- Within the analyzed bolt-length range of 23–27 m, increasing length improves the factor of safety. Incremental gains diminish beyond 25 m. This result is specific to the analyzed cases and does not define a universally applicable effective anchorage length.
- (5)
- For the five sampled bolt inclinations within 15–35°, the factor of safety first increases and then decreases. The highest sampled value occurs at 30° under the fixed reference conditions.
- (6)
- Increasing either horizontal or vertical bolt spacing reduces the factor of safety within the analyzed ranges. Over the same interval of 2–4 m, the relative decrease is greater for vertical spacing. The 3 m × 3 m arrangement serves as the reference configuration for these comparisons rather than an economically optimized recommendation.
Author Contributions
Conceptualization, L.J. and H.F.; Methodology, L.J. and H.F.; Validation, H.F.; Formal analysis, X.W.; Investigation, F.Z.; Resources, Q.S. and F.X.; Data curation, X.W., B.W. and Q.S.; Writing—original draft, L.J.; Writing—review and editing, F.X. and F.T.; Visualization, F.Z. and B.W.; Supervision, F.T. All authors have read and agreed to the published version of the manuscript.
Funding
This work is supported by the Hubei Provincial Department of Science and Technology through the Science and Technology Plan Project of Hubei Province, grant number 2025BCB118. This support is gratefully acknowledged.
Institutional Review Board Statement
Not applicable.
Informed Consent Statement
Not applicable.
Data Availability Statement
The data that support the findings of this study are available from the authors upon reasonable request.
Conflicts of Interest
Author Liqing Jiang declares employment with Wuhan Engineering Co., Ltd. of China Railway Seventh Group. The remaining authors declare that the research involves no commercial or financial relationships that could be construed as a potential conflict of interest.
References
- Froude, M.J.; Petley, D.N. Global fatal landslide occurrence from 2004 to 2016. Nat. Hazards Earth Syst. Sci. 2018, 18, 2161–2181. [Google Scholar] [CrossRef] [Scilit]
- Feng, X.T.; Zhou, Y.Y.; Jiang, Q. Rock mechanics contributions to recent hydroelectric developments in China. J. Rock Mech. Geotech. Eng. 2019, 11, 511–526. [Google Scholar] [CrossRef] [Scilit]
- Stead, D.; Eberhardt, E.; Coggan, J.S. Developments in the characterization of complex rock slope deformation and failure using numerical modelling techniques. Eng. Geol. 2006, 83, 217–235. [Google Scholar] [CrossRef] [Scilit]
- Eberhardt, E.; Stead, D.; Coggan, J.S. Numerical analysis of initiation and progressive failure in natural rock slopes—The 1991 Randa rockslide. Int. J. Rock Mech. Min. Sci. 2004, 41, 69–87. [Google Scholar] [CrossRef] [Scilit]
- Dai, Y.; Li, S.; Zhang, Y.; Jiao, L.; Niu, B.; Wen, M. Continous–discontinous analysis of an unstable slope: Evolution of damage zones and potential influencing areas. npj Nat. Hazards 2025, 2, 23. [Google Scholar] [CrossRef] [Scilit]
- Jalalifar, H.; Aziz, N. Experimental and 3D numerical simulation of reinforced shear joints. Rock Mech. Rock Eng. 2010, 43, 95–103. [Google Scholar] [CrossRef] [Scilit]
- Chen, Y. Experimental study and stress analysis of rock bolt anchorage performance. J. Rock Mech. Geotech. Eng. 2014, 6, 428–437. [Google Scholar] [CrossRef] [Scilit]
- Chen, Y.; Xiao, H. State-of-the-art on the anchorage performance of rock bolts subjected to shear load. Int. J. Coal Sci. Technol. 2024, 11, 9. [Google Scholar] [CrossRef] [Scilit]
- Fu, J.; Sarfarazi, V.; Haeri, H.; Zarei, A.S.; Bahrami, R.; Imani, M.; Marji, M.F. Experimental and Numerical Analyses of Shear Failure Mechanisms of Rock Bolt Surrounded by Bedded Rock. Int. J. Geomech. 2024, 24, 04024276. [Google Scholar] [CrossRef] [Scilit]
- Hencher, S.R.; Lee, S.G.; Carter, T.G.; Richards, L.R. Sheeting joints: Characterisation, shear strength and engineering. Rock Mech. Rock Eng. 2011, 44, 1–22. [Google Scholar] [CrossRef] [Scilit]
- Low, B.K. Context-dependent parameter sensitivities in rock slope stability. Rock Mech. Rock Eng. 2022, 55, 7445–7468. [Google Scholar] [CrossRef] [Scilit]
- Low, B.K.; Boon, C.W. Probability-based design of reinforced rock slopes using coupled FORM and Monte Carlo methods. Rock Mech. Rock Eng. 2024, 57, 1195–1217. [Google Scholar] [CrossRef] [Scilit]
- Peng, M.; Guo, X.; Xia, C.; Shi, Z. Stability analysis of a rock slope-pile-anchor coupled reinforcement system with bedding weak zones using an improved SPH method. Eng. Geol. 2025, 357, 108305. [Google Scholar] [CrossRef] [Scilit]
- Wang, C.; Tannant, D.D.; Lilly, P.A. Numerical analysis of the stability of heavily jointed rock slopes using PFC2D. Int. J. Rock Mech. Min. Sci. 2003, 40, 415–424. [Google Scholar] [CrossRef] [Scilit]
- Dadashzadeh, N.; Düzgün, H.S.B.; Yesiloglu-Gultekin, N. Reliability-based stability analysis of rock slopes using numerical analysis and response surface method. Rock Mech. Rock Eng. 2017, 50, 2119–2133. [Google Scholar] [CrossRef] [Scilit]
- Li, D.; Jiang, B.; Li, G.; Zhu, C. Design and Stability Evaluation of Slopes in the Sejiang Deformable Body Region Based on Experimental Data. Designs 2025, 9, 143. [Google Scholar] [CrossRef] [Scilit]
- Shi, K.; Liu, Z.; Xu, Z. On-Site Monitoring and Numerical Simulation of Stability During Staged Excavation of Deep-Cutting Slope. Buildings 2026, 16, 241. [Google Scholar] [CrossRef] [Scilit]
- Wei, X.; Li, Z.; Zhao, G. A review of multiscale numerical modeling of rock mechanics and rock engineering. Deep Undergr. Sci. Eng. 2025, 4, 382–405. [Google Scholar] [CrossRef] [Scilit]
- Stead, D.; Wolter, A. A critical review of rock slope failure mechanisms: The importance of structural geology. J. Struct. Geol. 2015, 74, 1–23. [Google Scholar] [CrossRef] [Scilit]
- Hamad, A.G.; Aswed, K.K.; Al Rjoub, Y.; Firouzi, N.; Podulka, P. Nonlinear Deformation Analysis of Sandwich Timoshenko Beams with Carbon Nanotube Reinforced Face Sheets and Re-Entrant Core Using GDQ Method. Mathematics 2026, 14, 630. [Google Scholar] [CrossRef] [Scilit]
- Faqihi, A.A.; Nguyen Van, C.; Firouzi, N.; Khedher, K.M.; Al-Hawajreh, G. On the dynamic fracture and crack branching of brittle structures considering thermoelastic effects using phase-field method. Mech. Based Des. Struct. Mach. 2026, 54, 2710400. [Google Scholar] [CrossRef] [Scilit]
- Li, C.C. Principles of rockbolting design. J. Rock Mech. Geotech. Eng. 2017, 9, 396–414. [Google Scholar] [CrossRef] [Scilit]
- Grasselli, G. 3D behaviour of bolted rock joints: Experimental and numerical study. Int. J. Rock Mech. Min. Sci. 2005, 42, 13–24. [Google Scholar] [CrossRef] [Scilit]
- Li, X.; Aziz, N.; Mirzaghorbanali, A.; Nemcik, J. Behavior of fiber glass bolts, rock bolts and cable bolts in shear. Rock Mech. Rock Eng. 2016, 49, 2723–2735. [Google Scholar] [CrossRef] [Scilit]
- Su, C.; Cheng, Y. Stability analysis of bolts reinforced rock jointed slope by considering the transverse effects. Soil Mech. Found. Eng. 2018, 55, 223–232. [Google Scholar] [CrossRef] [Scilit]
- Labuz, J.F.; Zang, A. Mohr–Coulomb failure criterion. Rock Mech. Rock Eng. 2012, 45, 975–979. [Google Scholar] [CrossRef] [Scilit]
- Itasca Consulting Group. Mohr-Coulomb Model. FLAC3D 7.0 Documentation. Available online: https://docs.itascacg.com/flac3d700/common/models/mohr/doc/modelmohr.html (accessed on 10 October 2026).
- Matsui, T.; San, K.C. Finite element slope stability analysis by shear strength reduction technique. Soils Found. 1992, 32, 59–70. [Google Scholar] [CrossRef] [Scilit]
- Griffiths, D.V.; Lane, P.A. Slope stability analysis by finite elements. Géotechnique 1999, 49, 387–403. [Google Scholar] [CrossRef] [Scilit]
- Dawson, E.M.; Roth, W.H.; Drescher, A. Slope stability analysis by strength reduction. Géotechnique 1999, 49, 835–840. [Google Scholar] [CrossRef] [Scilit]
- Cheng, Y.M.; Lansivaara, T.; Wei, W.B. Two-dimensional slope stability analysis by limit equilibrium and strength reduction methods. Comput. Geotech. 2007, 34, 137–150. [Google Scholar] [CrossRef] [Scilit]
- Itasca Consulting Group. Model Factor-of-Safety Command. FLAC3D 7.0 Documentation. Available online: https://docs.itascasoftware.com/flac3d700/common/kernel/doc/manual/model/commands/cmd_model.factor-of-safety.html (accessed on 11 October 2026).
- JTG D30—2015; Specifications for Design of Highway Subgrades. China Communications Press: Beijing, China, 2015. (In Chinese)
- Griffiths, D.V.; Marquez, R.M. Three-dimensional slope stability analysis by elasto-plastic finite elements. Géotechnique 2007, 57, 537–546. [Google Scholar] [CrossRef] [Scilit]
- Shen, J.; Karakus, M. Three-dimensional numerical analysis for rock slope stability using shear strength reduction method. Can. Geotech. J. 2014, 51, 164–172. [Google Scholar] [CrossRef] [Scilit]
- Chen, J.; Zhao, H.; He, F.; Zhang, J.; Tao, K. Studying the performance of fully encapsulated rock bolts with modified structural elements. Int. J. Coal Sci. Technol. 2021, 8, 64–76. [Google Scholar] [CrossRef] [Scilit]
- Itasca Consulting Group. Cable Structural Elements. FLAC3D 7.0 Documentation. Available online: https://docs.itascacg.com/flac3d700/common/sel/doc/manual/sel_manual/cables/cables.html (accessed on 7 October 2026).
- Anyang General International Co., Ltd. Prestressing Bar: Mechanical Properties. Available online: https://www.high-strength-steel.com/prestressing-bar (accessed on 11 October 2026).
- Ma, K.; Tang, C.A.; Liang, Z.Z.; Zhuang, D.Y.; Zhang, Q.B. Stability analysis and reinforcement evaluation of high-steep rock slope by microseismic monitoring. Eng. Geol. 2017, 218, 22–38. [Google Scholar] [CrossRef] [Scilit]
- Crosta, G.B.; Agliardi, F. Failure forecast for large rock slides by surface displacement measurements. Can. Geotech. J. 2003, 40, 176–191. [Google Scholar] [CrossRef] [Scilit]
- GEOKON. Model 4430 Vibrating Wire Deformation Meter. Available online: https://www.geokon.com/4430 (accessed on 11 October 2026).
- GEOKON. Model 4900 Vibrating Wire Load Cell: Instruction Manual. Available online: https://www.geokon.com/content/manuals/4900_Load_Cell.pdf (accessed on 11 October 2026).

Disclaimer/Publisher’s Note: The statements, opinions and data contained in all publications are solely those of the individual author(s) and contributor(s) and not of MDPI and/or the editor(s). MDPI and/or the editor(s) disclaim responsibility for any injury to people or property resulting from any ideas, methods, instructions or products referred to in the content. |
© 2026 by the authors. Licensee MDPI, Basel, Switzerland. This article is an open access article distributed under the terms and conditions of the Creative Commons Attribution (CC BY) license.