


Abstract
All-atom molecular dynamics simulations of Methyl Orange (MO) adsorption on three hydrochar models show that mixed oxygen-containing functional groups (HC1, O/C = 0.33) and hydroxyl-enriched surfaces (HC3, O/C = 0.55) both achieve high adsorption efficiencies, whereas the oxygen-lean aromatic carbon framework (HC2, O/C = 0.03) is less efficient. Average adsorption efficiencies (mean ± standard deviation across the 14 simulated loadings) are 96.0 ± 3.7% for HC1, 95.5 ± 4.4% for HC3, and 86.8 ± 4.9% for HC2. Freundlich isotherms fit the equilibrium data best ( = 0.83–0.96), reflecting energetically heterogeneous binding driven by van der Waals contacts, - stacking, and hydrogen bonding. The simulation capacities fall within the experimental range reported for biochar and hydrochar adsorbents; within the finite, non-porous, idealized cluster models investigated, the results support a molecular-scale design hypothesis that moderate oxygen incorporation distributed among mixed functional groups favors MO adsorption.
1. Introduction
Methyl Orange (MO, C14H14N3SO3Na) is an anionic azo dye released into water by textile, paper, leather, and food-processing industries. Its toxicity and resistance to biodegradation make it harmful even at low concentrations, so effective removal is essential [1,2,3,4]. Adsorption is the most common method for dye removal because it is simple to operate and works well [2,3,5]. Activated carbon is the standard adsorbent, but its high production cost has led to interest in biomass-derived hydrochar from hydrothermal carbonization (HTC) as a cheaper, more sustainable alternative [6,7,8,9]. Hydrochar can be engineered with tailored surface chemistries, including hydroxyl (−OH), carboxyl (−COOH), and carbonyl (C=O) groups [9,10,11,12,13], which control both capacity and selectivity [9]. Reported MO uptake varies widely across adsorbent classes: unmodified biochars and hydrochars reach 39.5–163.1 mg/g [14,15], while chemically modified, activated, or composite adsorbents span 20.5–909 mg/g [16,17,18,19], with the highest uptakes reported for amine- or nitrogen-functionalized materials. This wide range shows that surface functional groups are the key controlling factor.
The molecular mechanisms that link surface chemistry to MO binding remain unclear at the atomic scale. Although van der Waals contact, - stacking, and hydrogen bonding are individually well-known interactions at carbonaceous surfaces, how these interactions compete and trade off as the oxygen-to-carbon (O/C) ratio and the composition of oxygen functional groups vary is not quantitatively established. Molecular dynamics (MD) simulations can resolve adsorbent–adsorbate interactions at atomic resolution that experiments cannot easily access [20,21,22,23], and they have been used successfully for adsorption thermodynamics [24,25,26] and water treatment [27,28]. However, most current MD adsorption studies rely on idealized single surfaces, such as graphene sheets, carbon nanotubes, or finite carbon clusters, and typically probe only a single or a few dye loadings. The adsorbent models used are often simplified and lack the porosity, chemical heterogeneity, and mass-transfer constraints of real materials, so the quantitative connection between simulation and experiment remains limited. Consequently, the combined and competing roles of −OH, −COOH, and C=O groups on a common carbon scaffold across a full loading series are still not quantified. In this study, we report all-atom MD simulations of MO adsorption on three hydrochar models with different oxygen contents: HC1 (mixed groups, O/C = 0.33), HC2 (oxygen-lean, O/C = 0.03), and HC3 (hydroxyl-enriched, O/C = 0.55). These three models were previously used in our companion MD studies of Congo Red [29] and Sunset Yellow [30] adsorption, and the same force-field setup and analysis workflow are retained here, so the present results are directly comparable across adsorbates. HC1 and HC3 share the same C99H70 carbon framework but differ in both total oxygen content (33 versus 54 oxygen atoms) and in the distribution of that oxygen among hydroxyl, carboxyl, carbonyl, and ether groups, so their pairwise comparison probes the joint role of oxygen content and functional-group composition rather than isolating either variable alone; HC2 provides the oxygen-lean reference. The present MO study adds a compact, single-sulfonate adsorbate whose behavior contrasts with the four-ring Congo Red molecule, motivating the comparison at matched methodology. The models are molecular-scale surrogates for the local surface-chemistry environment that a dye molecule contacts on hydrochar, representing an ideal-case scenario: the clusters are finite and non-porous, and all surface sites are directly accessible to the dye without intra-pore diffusion barriers. We simulated 42 systems containing 10–300 MO molecules, measured adsorption efficiency, kinetics, and equilibrium isotherms, and identified structure–property relationships at the molecular scale.
2. Materials and Methods
2.1. Simulation Models
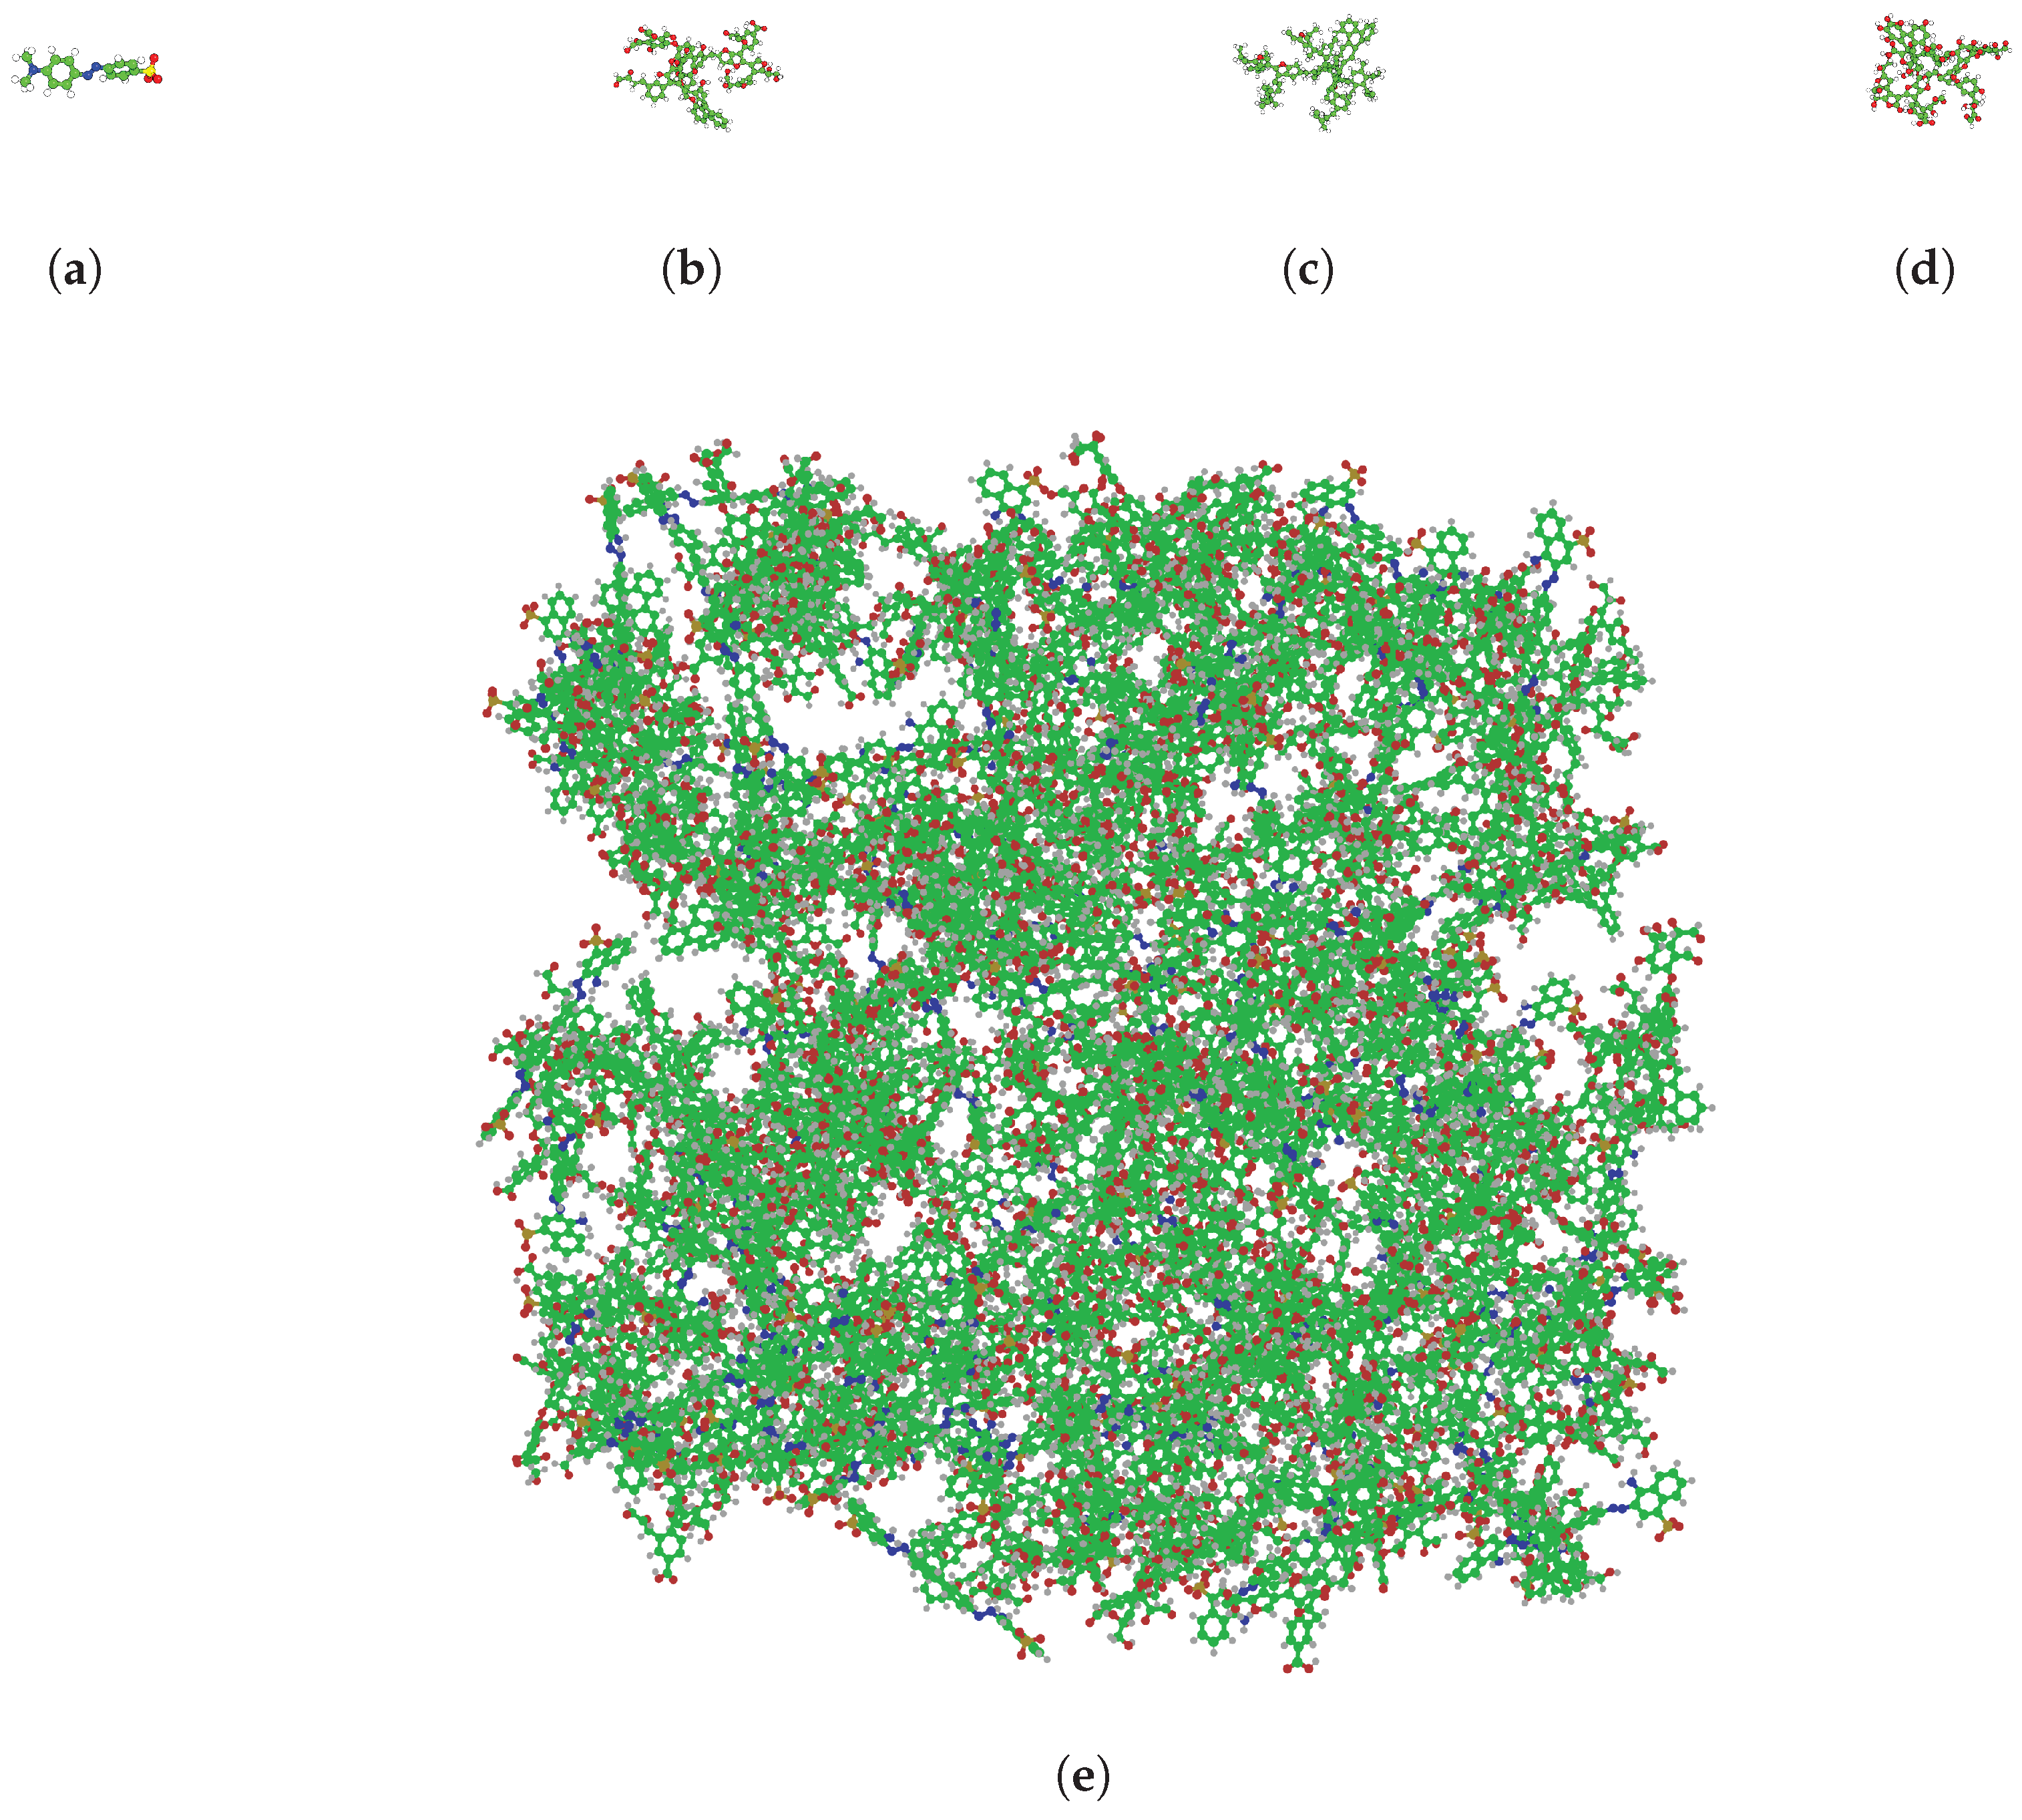
Three glucose-derived hydrochar models were built following HTC protocols [31,32,33] (Figure 1). HC1 (C99H70O33) has carboxyl, hydroxyl, and carbonyl groups (O/C = 0.33). HC2 (C128H128O4) is an oxygen-lean, predominantly aromatic carbon framework (O/C = 0.03). HC3 (C99H70O54) has 33 hydroxyl groups (O/C = 0.55). In terms of functional groups, HC1 carries 13 hydroxyl, 1 carboxyl, 9 carbonyl, and 9 ether-type oxygen groups; HC2 contains only 4 oxygen atoms, all in ether-type environments (three C−O−C linkages and one cyclic ether), with no hydroxyl, carboxyl, or carbonyl groups; and HC3 carries 33 hydroxyl, 2 carboxyl, 8 carbonyl, and 9 ether-type oxygen groups. All three hydrochar models are electrically neutral and fully protonated (AM1-BCC charges assigned at net charge zero), so adsorption of the anionic MO (charge-compensated by Na+ counter-ions) is governed by van der Waals, -, and hydrogen-bonding interactions rather than electrostatic attraction to the adsorbent. MO (C14H14N3SO3Na, MW = 327.34 g/mol) is an anionic azo dye with a sulfonate group (−SO3−) that gives it a net negative charge at neutral pH. Each simulation cell contained 100 hydrochar molecules, 10–300 MO molecules, and 37,075–70,304 SPC/E [34] water molecules with charge-compensating Na+ counter-ions. We prepared initial configurations using the in-house code PARAPACK (developed in this work) (Table 1).
Figure 1.
Molecular structures and simulation setup. (a) Methyl Orange (MO), (b–d) hydrochar variants HC1, HC2, and HC3, and (e) a representative initial configuration (water omitted for clarity). Atom colors are C (green), H (white), O (red), N (blue), S (yellow), and Na (purple).
Table 1.
Simulation system specifications for the three hydrochar models. Each system contains 100 hydrochar molecules at varying MO concentrations (10–300 molecules in 14 concentration steps) and 37,075–70,304 SPC/E water molecules (see the text for functional-group inventories of each model).
The hydrochar models are finite aromatic clusters with a defined density of oxygen functional groups and serve as molecular-scale surrogates for the local surface-chemistry environment that a dye molecule contacts on hydrochar. They represent an ideal-case scenario in which all surface sites are directly accessible to the dye, providing intrinsic molecular-scale capacities that can be compared with experimental uptake on biochar and hydrochar adsorbents.
2.2. Molecular Dynamics Simulations
All trajectories were generated with GROMACS 2024.4 [35] using the GAFF2 force field [36,37] with AM1-BCC partial charges assigned by ANTECHAMBER (AmberTools version 22) [38]. After steepest-descent energy minimization, systems underwent sequential NVT (500 ps, 298.15 K) and NPT (1 ns, 298.15 K, 1 bar) equilibration using the V-rescale thermostat [39] ( = 0.1 ps) and Parrinello–Rahman barostat [40] ( = 2.0 ps). Production runs lasted 20 ns with a 2 fs time step. Long-range electrostatics were treated by Particle Mesh Ewald [41]. Van der Waals forces were cut off at 1.0 nm. LINCS [42] constrained hydrogen bonds. The 20 ns production length is appropriate for the present finite, non-porous cluster model, where a dye molecule reaches a surface site by direct contact without traversing an intra-pore diffusion barrier; convergence and stationarity of the adsorbed populations over the second half of the trajectories are quantified in the revised Section 2.4 and the Supporting Information. Each system comprises a single production trajectory started from an independently prepared initial configuration (random placement with minimum-separation constraints via the in-house PARAPACK code); no position restraints or freeze groups were applied during equilibration or production, so all molecules diffuse freely, consistent with the MO–MO self-aggregation analyzed in the Results; no independent replicate trajectories were generated, which we acknowledge as a limitation, and uncertainties are therefore quantified by block-averaging within each trajectory (see Section 2.4).
2.3. Analysis
A dye molecule was counted as adsorbed when any atom fell within 0.35 nm of a hydrochar heavy atom. The 0.35 nm cutoff corresponds to the sum of the van der Waals radii of the heavy-atom pairs involved (C… C ≈ 0.34–0.36 nm, C… O≈ 0.32–0.34 nm), i.e., the onset of a direct contact rather than a solvent-separated encounter, and matches the criterion used in our previous simulations on the same models [29]; a sensitivity analysis over 0.30–0.45 nm is reported in the Supporting Information. Adsorption efficiency (Equation (1)), pseudo-first-order (PFO, Equation (2)) and pseudo-second-order (PSO, Equation (3)) kinetic models, and Langmuir (Equation (4)) and Freundlich (Equation (5)) isotherms were fitted using MDAnalysis version 2.9.0 and in-house Python 3.11 scripts. Equilibrium quantities were averaged over the last 50% of each 20 ns trajectory. The mean adsorbed population in Equation (1) was computed as the time average of the per-frame adsorbed count over the last 50% of each 20 ns production trajectory (10–20 ns, 101 frames at 100 ps intervals). Equilibrium concentrations were computed as , using the time-averaged cell volume of each system over the same last-50% window; per-system volumes and resulting values are listed in the Supporting Information (Table S4).
where and are adsorption capacities at time t and at equilibrium, (ns−1) and (mol−1 ns−1) are rate constants, is the maximum monolayer capacity (mol/mol), is the Langmuir energy constant (L/mol), is the Freundlich capacity constant, and n is the heterogeneity factor. Capacities are reported in mol/mol (MO per hydrochar molecule) as the intrinsic molecular-scale unit of the model. Where mg/g values are quoted in the Results, they are obtained by rescaling mol/mol using the molar mass of the corresponding hydrochar molecule (HC1 1787.6 g/mol, HC2 1730.4 g/mol, HC3 2123.6 g/mol) and are compared with experimental MO adsorption capacities on biochar and hydrochar adsorbents.
2.4. Statistical Analysis
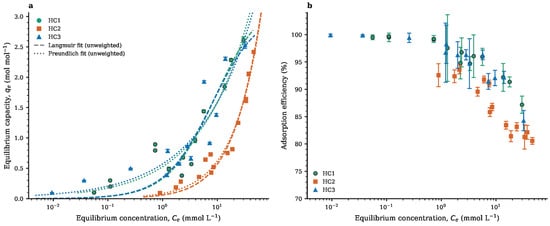
Each condition was simulated as a single production trajectory; no independent replicate trajectories were generated, which we acknowledge as a limitation. Uncertainties on the mean adsorbed populations (Equation (1)) were therefore quantified by block averaging within each trajectory, using autocorrelation-based effective sample sizes, and stationarity of the averaging window was checked by comparing sub-window means (10–15 ns vs. 15–20 ns); block-averaging details and per-system results are provided in the Supporting Information. All per-system means are reported with 95% confidence intervals, computed as the block-averaged standard error multiplied by the student-t quantile at the effective degrees of freedom; these 95% confidence intervals are shown in Figure 2 and Figure 3, and tabulated per system in the Supporting Information. We emphasize that these within-trajectory intervals quantify temporal sampling uncertainty of a single simulation and do not substitute for uncertainty across independent initial configurations or random seeds; each of the 42 systems started from an independently prepared initial configuration (MD Simulations), which partially mitigates but cannot eliminate this limitation. The “±” notation used for the average adsorption efficiencies denotes the mean ± standard deviation across the 14 simulated loading levels; it quantifies the variability across loading conditions, not a temporal or replicate uncertainty. Isotherm and kinetic fits report parameter standard errors from the covariance matrix, RMSE, and reduced chi-square; residuals are shown in the Supporting Information.
Figure 2.
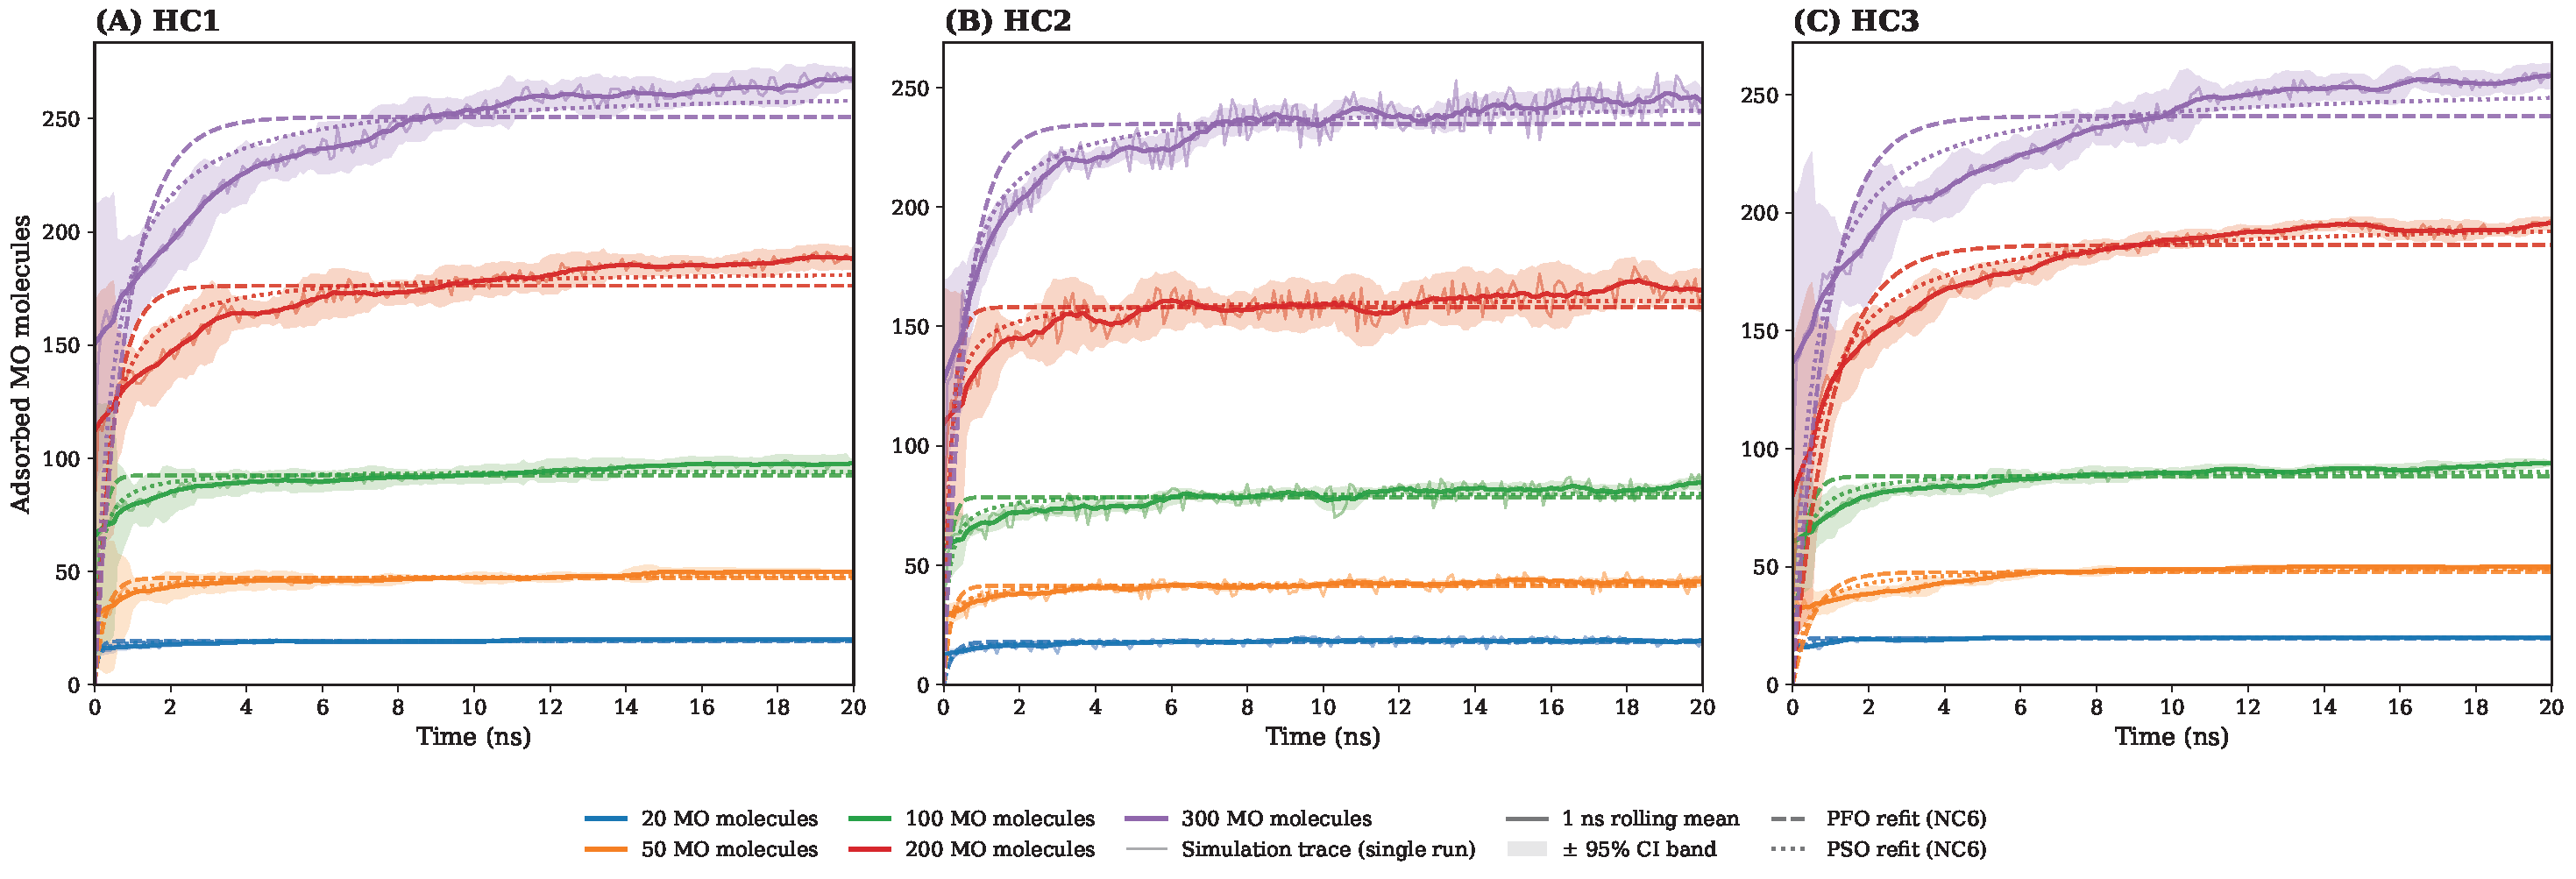
Adsorption kinetics with PFO (Equation (2)) and PSO (Equation (3)) model fits at representative MO concentrations. (A) HC1 (mixed functional groups), (B) HC2 (oxygen-lean), (C) HC3 (hydroxyl-enriched). Thin solid lines show the simulation trajectory (single production run per condition); thicker lines show a 1 ns rolling mean with shaded 95% confidence-interval bands (Section 2 and Section 2.4); dashed and dotted lines show PFO and PSO refits.
Figure 3.
Adsorption isotherms for MO on three hydrochar models. (a) Equilibrium adsorption capacity (, mol/mol) vs. equilibrium concentration (, mmol/L, logarithmic axis) with Langmuir (dashed) and Freundlich (dotted) fits; error bars show 95% confidence intervals on the window mean (Section 2 and Section 2.4). (b) Adsorption efficiency (%) vs. with the same error bars. was computed with trajectory-averaged cell volumes (Table S4); the complete-adsorption point ( = 0) is omitted from the logarithmic axis. Averages are taken over the last 50% of each 20 ns trajectory, with HC1 (Cbase) as green circles, HC2 (Conly) as orange squares, and HC3 (COH) as blue triangles.
3. Results and Discussion
All three hydrochar variants exhibit efficient MO removal across the entire concentration range, with more than 90% adsorbed at loadings of up to 50 MO molecules per simulation cell. Increasing dye concentration lowers fractional coverage as MO molecules compete for limited surface area. Three interaction mechanisms govern MO immobilization: van der Waals contacts, - stacking, and hydrogen bonding. While these interaction types are individually well-known at carbonaceous surfaces, the central finding of this work is a non-additive relationship between interaction counts and uptake (i.e., the per-molecule contact counts do not translate linearly into overall adsorption): van der Waals contact counts rise linearly with MO loading in all systems, but HC3 produces the strongest per-molecule contacts (slope coefficient 51.0 vs. 43.4 for HC1 and 23.2 for HC2, see Supporting Information) without translating into the highest overall uptake, because the dense hydroxyl coverage on HC3 also stabilises a hydration layer that partially offsets the binding gain. Contact counts are geometric observables and do not by themselves quantify binding affinities. - stacking between MO and the hydrochar aromatic scaffold is similar across all three models (linear coefficients 0.189, 0.156, and 0.228 for HC1, HC2, HC3, respectively, with ) and always exceeds MO–MO self-aggregation, indicating that surface binding prevails over dye self-association. In HC1 and HC3, hydroxyl groups donate hydrogen bonds to MO’s sulfonate (−SO3−) and accept bonds from aromatic C−H units, providing targeted anchoring that is absent on oxygen-lean HC2 (hydrogen-bond profiles are shown in the Supporting Information). On HC2, the thin hydration film is easily removed by approaching MO molecules, whereas the structured water layers on HC1 and HC3, stabilized by hydrogen bonds at 2.7–2.9 Å, are consistent with a partial hydration/entropic penalty for dye binding; the hydration-layer interpretation is a plausible but not directly quantified explanation, and a desolvation free-energy analysis would be required to establish it. HC1 reaches the highest overall efficiency because it balances all three interaction types rather than relying on one alone. Detailed mechanistic analyses for individual systems are presented in the Supporting Information.
Adsorption profiles over time were fitted with PFO and PSO models (Figure 2; Table 2). For Congo Red on the same hydrochar models, PSO gave consistently better fits, but MO shows a less clear kinetic signature: PSO describes the data moderately better overall (median = 0.63 vs. 0.32 for PFO across the 42 systems), although both models remain descriptive of the approach to the plateau rather than mechanistic rate laws. Adsorption is predominantly complete within the first 1–2 ns of each trajectory, with only a slow residual drift at the highest loadings (Section S1 of the Supporting Information), so the equilibrium profiles are nearly flat and offer limited curvature for reliable regression. We attribute this rapid saturation to the absence of intra-pore diffusion barriers in the finite, non-porous cluster model: dye molecules reach surface sites by direct contact and associate on a sub-nanosecond timescale, so the PFO/PSO regressions at low loading have little curvature to fit, which reflects the model geometry rather than a failure of the underlying chemistry. The kinetic parameters at low concentration should therefore not be over-interpreted as evidence of a particular rate law; they are reported for completeness and become more meaningful at higher loadings, where surface congestion introduces measurable curvature. The fitted curves also start from a non-zero adsorbed population (median initial count of 36.7 molecules per cell across the 42 systems) because production begins after equilibration, so some MO–hydrochar contacts pre-exist at t = 0; the PFO/PSO forms assume , and this offset is a further reason the fits are descriptive. Neither rate constant follows a single monotonic trend with initial concentration. The four systems in which reaches the upper fit bound are reported only as lower limits (≥10 ns−1, flagged with a dagger in Table 2) and are excluded from the trend assessment, because their true values are unidentifiable at the 100 ps sampling interval. Among the systems with identifiable , no monotonic trend emerges for any hydrochar (for HC1, rises from 3.6 ns−1 at 50 MO to 6.0 ns−1 at 100 MO before falling again), which we attribute to the limited curvature of the near-flat profiles; , in contrast, decreases overall by roughly two orders of magnitude across the loading series (HC1: 1.32 to 0.009 cell·molec.−1ns−1 over 10–300 MO), consistent with surface-congestion effects within the finite cluster model, as increased loading lowers the frequency of productive dye–surface encounters. The 20 ns production runs are sufficient for surface-association equilibration in this finite, non-porous model, but do not sample the diffusion-limited regime that governs uptake in porous adsorbents; quantitative comparison to experimental kinetics on porous hydrochar would require a cross-linked, pore-resolved model and substantially longer or enhanced-sampling trajectories.
Table 2.
Kinetic model parameters for MO adsorption on all three hydrochar types at representative concentrations (PFO: Equation (2); PSO: Equation (3)). Adsorbed amounts are in molecules per simulation cell; in ns−1; in cell·molec.−1ns−1. † reached the upper fit bound (≥10 ns−1) and is unidentifiable at the 100 ps sampling interval. Full fit statistics for all 42 systems (, RMSE, and parameter errors) are given in Table S5 of the Supporting Information.
Figure 3 shows that increases steadily with MO loading across all three models. HC1 reaches the highest value (2.62 mol/mol at 300 MO), followed by HC3 (2.53 mol/mol) and HC2 (2.42 mol/mol). After correcting the equilibrium concentrations with the trajectory-averaged cell volumes, the values shrink by a factor of 14–25 relative to the original analysis (Section S3 of the Supporting Information), and the Freundlich model (Equation (5)) still provides the best unweighted fits for all three hydrochars ( = 0.83–0.96; Table 3), with better , RMSE, and AIC than Langmuir in every case (AIC = 5.0, 2.2, and 1.5 in favor of Freundlich for HC1, HC2, and HC3), indicating adsorption on energetically non-uniform surfaces typical of the mixed chemical environments on hydrochar; as an empirical descriptor this is consistent with, but does not prove, heterogeneous binding. The Langmuir capacity carries large extrapolation uncertainty because the data never reach true saturation: for HC1 the fit gives = 3.34 ± 0.53 mol/mol (95% CI 2.17–4.50), only 1.27 times the maximum observed capacity, and for HC3 = 3.14 ± 0.61 mol/mol (95% CI 1.79–4.48), 1.24 times the maximum observed capacity. For HC2, although the Langmuir model fits well ( = 0.952), its (17.8 ± 20.6 mol/mol) is not statistically identified within the simulated range (the 95% CI includes negative values), so the Freundlich parameters remain the reliable descriptor for HC2. All systems exceed 90% removal efficiency at ≤50 MO, yet under high loading HC2 drops most sharply, falling to ∼81% at 300 MO, whereas HC1 remains at 87.2% and HC3 declines to 84.3% at the highest loading (Table 4). Weighted refits, 95% confidence intervals, reduced , AIC, and residual plots for all fits, together with the concentration-quantization caveat at low loading, are reported in Section S4 of the Supporting Information.
Table 3.
Adsorption isotherm fitting parameters for all three hydrochar systems (Langmuir and Freundlich models; unweighted fits on the corrected values, parameter ± standard error). is in (mol/mol) (L/mol)1/n and n is dimensionless. Weighted fits, 95% confidence intervals, reduced , AIC, and residual plots are reported in Section S4 of the Supporting Information. The HC2 Langmuir is not statistically identified within the simulated range (its 95% CI includes negative values). – denotes a parameter that is not applicable to the given model.
Table 4.
Adsorption performance summary for all hydrochar systems. Averages over the last 50% of each 20 ns trajectory; values are mean ± standard deviation across the 14 simulated loading levels (one production trajectory per condition). The per-system 95% confidence intervals on the temporal mean (Section 2 and Section 2.4) have a median half-width of 0.97 percentage points of efficiency (range: 0–6.1 pp); per-system values are given in Section S1 of the Supporting Information.
HC1 leads in average efficiency (96.0 ± 3.7%) although HC3 carries more than twice as many hydroxyl groups (33 vs. 13 −OH). HC3 carries 33 hydroxyl groups together with 2 carboxyl, 8 carbonyl, and 9 ether oxygens, whereas HC1 combines 13 hydroxyl with 1 carboxyl, 9 carbonyl, and 9 ether oxygens; the similar average efficiencies may reflect compensation between the higher hydrogen-bonding density on HC3 and the broader interaction portfolio of HC1, a possible mechanistic explanation rather than proof that diversity alone drives the result. Within the three models investigated, this suggests that functional-group diversity is at least as effective as maximizing a single group type. The ∼9% efficiency advantage of HC1 and HC3 over HC2 at low concentrations comes from hydrogen bonding between surface −OH donors and the sulfonate acceptor on MO, interactions that are entirely absent on oxygen-lean HC2. This behavior differs from Congo Red adsorption on the same hydrochar models [29,30], where HC3 proved optimal because the four-ring CR molecule uses dense hydroxyl arrays for extensive - stacking. The more compact MO molecule, anchored mainly through a single sulfonate group, instead benefits from the wider range of binding options available on a chemically mixed surface.
Rescaling our mol/mol capacities to mg/g (see Methods) gives values in the range of 15–480 mg/g depending on loading. As summarized in Table 5, these values fall within the experimental range reported for biochar and hydrochar adsorbents (20.5–909 mg/g [14,15,16,17,18,19]), with the simulation range overlapping the raw biochar regime (40–163 mg/g) and high-loading simulations reaching into the range of chemically modified materials. This overlap provides order-of-magnitude consistency with experimental uptake, but does not constitute validation of the molecular model, given the differences in porosity, accessibility, and chemical heterogeneity between the simulated clusters and real materials; direct experimental validation on structurally controlled hydrochars remains necessary. The PSO/Langmuir kinetics reported experimentally for nitrogen-enriched hydrochar [19] and the dual-mechanism picture for Fe2O3–biochar composites [16] are consistent with our results. In both simulation and experiment, deliberate surface functionalization is the main strategy for improving MO removal [5,18], supporting the superiority of HC1 and HC3 over HC2. The near-optimal performance of HC1 (O/C ≈ 0.33) suggests that, at the molecular scale, moderate oxygen incorporation distributed among mixed functional groups favors MO adsorption, a molecular-scale design hypothesis for hydrochar surface chemistry that requires experimental validation.
Table 5.
Comparison of MO adsorption capacities: experimental literature vs. MD simulation results (this work). Simulation capacities (15–480 mg/g) fall within the experimental range (20.5–909 mg/g), with the simulation range overlapping raw biochar and reaching into the chemically modified regime.
Finally, several factors relevant to real water treatment applications are outside the scope of the present model: the protonation states are fixed at the simulated pH, the ionic strength is set only by the charge-compensating counter-ions, no competing solutes or natural organic matter are present, and the non-porous clusters omit mass-transfer limitations. Each of these factors can shift adsorption behavior in real systems and represents a direction for future work (e.g., constant-pH simulations, explicit salt, and mixed-adsorbate systems).
4. Conclusions
All-atom MD simulations of MO adsorption on three finite, non-porous hydrochar cluster models with different surface chemistries yield several molecular-scale findings. HC1 (mixed functional groups, O/C = 0.33) achieves the numerically highest average adsorption efficiency (96.0 ± 3.7%), statistically indistinguishable from the hydroxyl-enriched HC3 (95.5 ± 4.4%; the 0.42 percentage-point gap is smaller than the per-system 95% confidence intervals, Section S1 of the Supporting Information), and clearly exceeding the oxygen-lean HC2 (86.8 ± 4.9%; a deficit that exceeds the 95% confidence intervals of both systems). Within the three models investigated, this suggests that a mixed functional-group surface is at least as effective as a hydroxyl-enriched one for MO adsorption. All systems remove more than 90% of MO at low dye loadings (≤50 MO molecules), yet HC2 declines most sharply at high concentrations, falling to 81.3% at ≥200 MO. Under the simulated conditions, polar functional groups contribute to maintaining high adsorption efficiency at high loadings in the MO/hydrochar systems studied. The adsorption kinetics show rapid initial uptake, with PSO describing the approach to the plateau moderately better than PFO (median = 0.63 vs. 0.32), although both models remain descriptive of this finite, non-porous cluster model, which lacks intra-pore diffusion barriers; this differs from Congo Red on the same adsorbents [29], where PSO proved clearly dominant. Freundlich isotherms fit the equilibrium data best ( = 0.83–0.96), reflecting the energetically heterogeneous binding expected on a chemically mixed hydrochar surface. Three interaction mechanisms together govern MO uptake: - stacking, van der Waals contacts, and hydrogen bonds between surface −OH donors and MO’s sulfonate acceptor; their non-additive competition explains why the hydroxyl-enriched HC3 does not outperform the mixed HC1. These results motivate a molecular-scale design hypothesis, that moderate oxygen incorporation (O/C ≈ 0.3) distributed across hydroxyl, carboxyl, and carbonyl groups favors MO uptake, which requires experimental validation on hydrochars with controlled porosity and well-characterized chemistry before any materials-design recommendation. The simulation-derived capacities fall within the experimental range reported for biochar and hydrochar adsorbents, showing order-of-magnitude consistency with experimental adsorption capacities while remaining an idealized, non-porous model that awaits direct experimental validation. Because the three models co-vary in oxygen content, group composition, and mass, the comparison does not isolate a single causal variable, and the conclusions are restricted to the molecular architectures investigated. In particular, HC1 and HC3 share the C99H70 carbon framework but differ in both total oxygen content and functional-group distribution, so their pairwise comparison probes the joint role of oxygen content and composition rather than isolating either variable alone.
Supplementary Materials
The following supporting information can be downloaded at https://www.mdpi.com/article/10.3390/app162010376/s1: Section S1. Convergence and statistical uncertainty; Section S2. Adsorption criterion sensitivity; Section S3. Cell volumes and equilibrium concentrations (Table S4); Section S4. Isotherm and kinetic fit statistics; Section S5. Molecular Interaction Analysis; Section S6. Hydrogen Bond Analysis.
Author Contributions
Conceptualization, D.T.H. and T.T.T.; methodology, D.T.H.; software, D.T.H.; validation, D.T.H. and T.T.T.; formal analysis, D.T.H.; investigation, D.T.H.; writing—original draft preparation, D.T.H.; writing—review and editing, D.T.H. and T.T.T.; supervision, T.T.T.; funding acquisition, T.T.T. All authors have read and agreed to the published version of the manuscript.
Funding
T.T.T. acknowledges funding from the Research Council of Norway (RCN), the Center of Excellence Funding Scheme, Project No. 262644, PoreLab. D.T.H. is supported by the Faculty of Applied Sciences, Ton Duc Thang University.
Institutional Review Board Statement
Not applicable.
Informed Consent Statement
Not applicable.
Data Availability Statement
The datasets generated and/or analyzed during the current study are available from the corresponding author on reasonable request.
Acknowledgments
The authors are grateful to Ton Duc Thang University and the Norwegian University of Science and Technology for their support.
Conflicts of Interest
The authors declare no conflicts of interest.
References
- Rafatullah, M.; Sulaiman, O.; Hashim, R.; Ahmad, A. Adsorption of methylene blue on low-cost adsorbents: A review. J. Hazard. Mater. 2010, 177, 70–80. [Google Scholar] [CrossRef] [Scilit] [PubMed]
- Crini, G. Non-conventional low-cost adsorbents for dye removal: A review. Bioresour. Technol. 2006, 97, 1061–1085. [Google Scholar] [CrossRef] [Scilit] [PubMed]
- Gupta, V.; Suhas. Application of low-cost adsorbents for dye removal—A review. J. Environ. Manag. 2009, 90, 2313–2342. [Google Scholar] [CrossRef] [Scilit] [PubMed]
- Srinivasan, A.; Viraraghavan, T. Decolorization of dye wastewaters by biosorbents: A review. J. Environ. Manag. 2010, 91, 1915–1929. [Google Scholar] [CrossRef] [Scilit] [PubMed]
- Iwuozor, K.; Ighalo, J.; Emenike, E.; Ogunfowora, L.; Igwegbe, C. Adsorption of methyl orange: A review on adsorbent performance. Curr. Res. Green Sustain. Chem. 2021, 4, 100179. [Google Scholar] [CrossRef] [Scilit]
- Zhang, Z.; Zhu, Z.; Shen, B.; Liu, L. Insights into biochar and hydrochar production and applications: A review. Energy 2019, 171, 581–598. [Google Scholar] [CrossRef] [Scilit]
- Islam, M.; Ahmed, M.J.; Khanday, W.A.; Asif, M.; Hameed, B.H. Mesoporous activated coconut shell-derived hydrochar prepared via hydrothermal carbonization-NaOH activation for methylene blue adsorption. J. Environ. Manag. 2017, 203, 237–244. [Google Scholar] [CrossRef] [Scilit] [PubMed]
- Zhu, X.; Liu, Y.; Qian, F.; Zhou, C.; Zhang, S.; Chen, J. Preparation of magnetic porous carbon from waste hydrochar by simultaneous activation and magnetization for tetracycline removal. Bioresour. Technol. 2014, 154, 209–214. [Google Scholar] [CrossRef] [Scilit] [PubMed]
- Wang, J.; Wang, S. Preparation, modification and environmental application of biochar: A review. J. Clean. Prod. 2019, 227, 1002–1022. [Google Scholar] [CrossRef] [Scilit]
- Takaya, C.A.; Fletcher, L.A.; Singh, S.; Anyikude, K.U.; Ross, A.B. Phosphate and ammonium sorption capacity of biochar and hydrochar from different wastes. Chemosphere 2016, 145, 518–527. [Google Scholar] [CrossRef] [Scilit] [PubMed]
- Figueiredo, J.L.; Pereira, M.F.R.; Freitas, M.M.A.; Órf ao, J.J.M. Modification of the surface chemistry of activated carbons. Carbon 1999, 37, 1379–1389. [Google Scholar] [CrossRef] [Scilit]
- Arima, Y.; Iwata, H. Effect of wettability and surface functional groups on protein adsorption and cell adhesion using well-defined mixed self-assembled monolayers. Biomaterials 2007, 28, 3074–3082. [Google Scholar] [CrossRef] [Scilit] [PubMed]
- Gu, B.; Schmitt, J.; Chen, Z.; Liang, L.; McCarthy, J. Adsorption and Desorption of Natural Organic Matter on Iron Oxide: Mechanisms and Models. Environ. Sci. Technol. 1994, 28, 38–46. [Google Scholar] [CrossRef] [Scilit] [PubMed]
- Yu, J.; Zhang, X.; Wang, D.; Li, P. Adsorption of methyl orange dye onto biochar adsorbent prepared from chicken manure. Water Sci. Technol. 2018, 77, 1303–1312. [Google Scholar] [CrossRef] [Scilit] [PubMed]
- Zubair, M.; Mu’azu, N.; Jarrah, N.; Blaisi, N.; Aziz, H.; Al-Harthi, M. Adsorption Behavior and Mechanism of Methylene Blue, Crystal Violet, Eriochrome Black T, and Methyl Orange Dyes onto Biochar-Derived Date Palm Fronds Waste Produced at Different Pyrolysis Conditions. Water Air Soil Pollut. 2020, 231, 240. [Google Scholar] [CrossRef] [Scilit]
- Chaukura, N.; Murimba, E.; Gwenzi, W. Synthesis, characterisation and methyl orange adsorption capacity of ferric oxide–biochar nano-composites derived from pulp and paper sludge. Appl. Water Sci. 2017, 7, 2175–2186. [Google Scholar] [CrossRef] [Scilit]
- Lian, F.; Cui, G.; Liu, Z.; Duo, L.; Zhang, G.; Xing, B. One-step synthesis of a novel N-doped microporous biochar derived from crop straws with high dye adsorption capacity. J. Environ. Manag. 2016, 176, 61–68. [Google Scholar] [CrossRef] [Scilit] [PubMed]
- Li, B.; Wang, Q.; Guo, J.; Huan, W.; Liu, L. Sorption of methyl orange from aqueous solution by protonated amine modified hydrochar. Bioresour. Technol. 2018, 268, 454–459. [Google Scholar] [CrossRef] [Scilit] [PubMed]
- He, C.; Lin, H.; Dai, L.; Qiu, R.; Tang, Y.; Wang, Y.; Duan, P.; Ok, Y. Waste shrimp shell-derived hydrochar as an emergent material for methyl orange removal in aqueous solutions. Environ. Int. 2020, 134, 105340. [Google Scholar] [CrossRef] [Scilit] [PubMed]
- Sanchez, V.; Jachak, A.; Hurt, R.; Kane, A. Biological interactions of graphene-family nanomaterials: An interdisciplinary review. Chem. Res. Toxicol. 2012, 25, 15–34. [Google Scholar] [CrossRef] [Scilit] [PubMed]
- Li, Y.; Yang, Z.; Wang, Y.; Bai, Z.; Zheng, T.; Dai, X.; Liu, S.; Gui, D.; Liu, W.; Chen, M.; et al. A mesoporous cationic thorium-organic framework that rapidly traps anionic persistent organic pollutants. Nat. Commun. 2017, 8, 1354. [Google Scholar] [CrossRef] [Scilit] [PubMed]
- El Haouti, R.; Ouachtak, H.; El Guerdaoui, A.; Amedlous, A.; Amaterz, E.; Haounati, R.; Addi, A.; Akbal, F.; El Alem, N.; Taha, M. Cationic dyes adsorption by Na-Montmorillonite Nano Clay: Experimental study combined with a theoretical investigation using DFT-based descriptors and molecular dynamics simulations. J. Mol. Liq. 2019, 290, 111139. [Google Scholar] [CrossRef] [Scilit]
- Pareek, S.; Jain, D.; Hussain, S.; Biswas, A.; Shrivastava, R.; Parida, S.; Kisan, H.; Lgaz, H.; Chung, I.; Behera, D. A new insight into corrosion inhibition mechanism of copper in aerated 3.5 wt. experimental and theoretical approach. Chem. Eng. J. 2019, 358, 725–742. [Google Scholar] [CrossRef] [Scilit]
- Jervell, V.; Hammer, M.; Wilhelmsen, Ö.; Trinh, T. Thermodynamic Properties of Hydrogen Adsorbed on Graphite Surfaces at Temperatures Above 100 K: A Molecular Dynamics and Classical Density Functional Theory Study. Entropy 2025, 27, 184. [Google Scholar] [CrossRef] [Scilit] [PubMed]
- Trinh, T.; Vlugt, T.; Hägg, M.; Bedeaux, D.; Kjelstrup, S. Selectivity and self-diffusion of CO2 and H2 in a mixture on a graphite surface. Front. Chem. 2013, 1, 38. [Google Scholar] [CrossRef] [Scilit] [PubMed]
- Ho, T.; Hoang, N.; Wilhelmsen, Ö.; Trinh, T. Water adsorption on surfaces of calcium aluminosilicate crystal phase of stone wool: A DFT study. Sci. Rep. 2024, 14, 9135. [Google Scholar] [CrossRef] [Scilit] [PubMed]
- Ma, Y.; Velioğlu, S.; Trinh, T.; Wang, R.; Chew, J. Investigation of Surfactant-Membrane Interaction Using Molecular Dynamics Simulation with Umbrella Sampling. ACS ES T Eng. 2021, 1, 1470–1480. [Google Scholar] [CrossRef] [Scilit]
- Ma, Y.; Hua, T.; Trinh, T.; Wang, R.; Chew, J. Molecular dynamics simulation of the competitive adsorption behavior of effluent organic matters by heated aluminum oxide particles (HAOPs). Sep. Purif. Technol. 2022, 292, 120961. [Google Scholar] [CrossRef] [Scilit]
- Ho, T.H.; Tong, H.D.; Trinh, T.T. Molecular mechanisms of Congo Red adsorption on hydrochar: The critical role of hydroxyl groups in dye removal. Chem. Eng. J. Adv. 2026, 25, 101017. [Google Scholar] [CrossRef] [Scilit]
- Ho, T.H.; Van Le, K.; Nguyen, P.T.; Nguyen, L.; Trinh, T.T. Molecular dynamics simulation of Sunset Yellow dye removal from water using hydrochar adsorbent. Sci. Rep. 2025, 15, 43993. [Google Scholar] [CrossRef] [Scilit] [PubMed]
- Falco, C.; Baccile, N.; Titirici, M. Morphological and structural differences between glucose, cellulose and lignocellulosic biomass derived hydrothermal carbons. Green Chem. 2011, 13, 3273–3281. [Google Scholar] [CrossRef] [Scilit]
- Hoekman, S.; Broch, A.; Robbins, C. Hydrothermal carbonization (HTC) of lignocellulosic biomass. Energy Fuels 2011, 25, 1802–1810. [Google Scholar] [CrossRef] [Scilit]
- Ha, D.; Tong, H.; Tran, K.; Trinh, T. The role of chemical functional groups in dewaterability of hydrochar: A molecular simulation study. J. Mol. Liq. 2024, 400, 124482. [Google Scholar] [CrossRef] [Scilit]
- Berendsen, H.J.C.; Grigera, J.R.; Straatsma, T.P. The missing term in effective pair potentials. J. Phys. Chem. 1987, 91, 6269–6271. [Google Scholar] [CrossRef] [Scilit]
- Abraham, M.; Murtola, T.; Schulz, R.; Páll, S.; Smith, J.; Hess, B.; Lindahl, E. Gromacs: High performance molecular simulations through multi-level parallelism from laptops to supercomputers. SoftwareX 2015, 1–2, 19–25. [Google Scholar] [CrossRef] [Scilit]
- Wang, J.; Wolf, R.; Caldwell, J.; Kollman, P.; Case, D. Development and testing of a general Amber force field. J. Comput. Chem. 2004, 25, 1157–1174. [Google Scholar] [CrossRef] [Scilit] [PubMed]
- Chami, F.; Wilson, M. Molecular order in a chromonic liquid crystal: A molecular simulation study of the anionic azo dye sunset yellow. J. Am. Chem. Soc. 2010, 132, 7794–7802. [Google Scholar] [CrossRef] [Scilit] [PubMed]
- Wang, J.; Wang, W.; Kollman, P.; Case, D. Automatic atom type and bond type perception in molecular mechanical calculations. J. Mol. Graph. Model. 2006, 25, 247–260. [Google Scholar] [CrossRef] [Scilit] [PubMed]
- Bussi, G.; Donadio, D.; Parrinello, M. Canonical sampling through velocity rescaling. J. Chem. Phys. 2007, 126, 014101. [Google Scholar] [CrossRef] [Scilit] [PubMed]
- Parrinello, M.; Rahman, A. Polymorphic transitions in single crystals: A new molecular dynamics method. J. Appl. Phys. 1981, 52, 7182–7190. [Google Scholar] [CrossRef] [Scilit]
- Darden, T.; York, D.; Pedersen, L. Particle mesh Ewald: An N·log(N) method for Ewald sums in large systems. J. Chem. Phys. 1993, 98, 10089–10092. [Google Scholar] [CrossRef] [Scilit]
- Hess, B.; Bekker, H.; Berendsen, H.; Fraaije, J. LINCS: A Linear Constraint Solver for molecular simulations. J. Comput. Chem. 1997, 18, 1463–1472. [Google Scholar] [CrossRef]

Disclaimer/Publisher’s Note: The statements, opinions and data contained in all publications are solely those of the individual author(s) and contributor(s) and not of MDPI and/or the editor(s). MDPI and/or the editor(s) disclaim responsibility for any injury to people or property resulting from any ideas, methods, instructions or products referred to in the content. |
© 2026 by the authors. Licensee MDPI, Basel, Switzerland. This article is an open access article distributed under the terms and conditions of the Creative Commons Attribution (CC BY) license.