


Abstract
Background: Wearable electrocardiogram (ECG) devices capable of recording a single-lead signal—typically Lead I—have proliferated rapidly, enabling long-term ambulatory cardiac monitoring outside clinical settings. However, the extent to which Lead I-derived heart rate variability (HRV) metrics are concordant with those obtained from the clinical gold standards—12-lead ECG and 3-channel Holter monitoring—remains incompletely characterised. Methods: We analysed RR-interval series extracted from (i) the PTB-XL large-scale publicly available 12-lead ECG dataset (n = 18,869 patients; 100 Hz, 10 s recordings) and (ii) ambulatory 3-channel Holter ECG recordings (Suzuken Pico303) from four participants (two elderly adults and two young adults). Pan–Tompkins R-wave detection was applied uniformly. Time-domain (SDNN, RMSSD, and pNN50), Poincaré (SD1 and SD2), and Bland–Altman agreement metrics were computed for Lead I versus Lead II comparisons. Results: Analysis of 300 PTB-XL records (a contiguous pilot subset: records 00040–00350) stratified by diagnostic superclass revealed strong Lead I–Lead II RRI concordance for normal ECGs (NORM: r = 0.844, ICC(2,1) = 0.841, mean bias = −1.4 ms, 95% LoA [−52.4, +49.7] ms; n = 179 records) and progressively lower agreement in pathological categories (MI: r = 0.659, ICC = 0.663; CD: r = 0.433, ICC = 0.484; HYP: r = 0.556, ICC = 0.574; STTC: r = 0.635, ICC = 0.634). Holter Pico303 recordings demonstrated significant inter-individual variability; SDNN ranged from 37.0 ms (elderly male) to 80.8 ms (elderly female) and 80.4 ms (young male), while RMSSD ranged from 27.0 to 68.0 ms. R-wave amplitude was systematically higher in Lead II (0.734 ± 0.413 mV) than Lead I (0.667 ± 0.339 mV) across the 300-record cohort (overall mean). Conclusions: Single-lead (Lead I) ECG provides HRV information comparable to Lead II for time-domain metrics, supporting the utility of wearable single-lead ECG for RRI estimation and time-domain HRV monitoring; however, systematic differences in R-wave morphology warrant lead-specific calibration of automated detection algorithms.
1. Introduction
The 12-lead electrocardiogram (ECG) is the clinical reference standard for cardiac electrical assessment. Its diagnostic utility spans myocardial infarction (MI) detection [1,2], evaluation of sudden cardiac death risk [3], arrhythmia localization [4,5], P-wave morphology assessment [6], and the identification of pathological patterns that guide clinical decision-making [7]. Correct electrode placement and meticulous recording technique are prerequisites for diagnostic quality, as deviations from the standard configuration introduce morphological artefacts that compromise automated analysis [8,9]. Despite its diagnostic power, the standard 12-lead ECG has historically been confined to hospital or clinic settings, as its 10-electrode configuration and dedicated hardware limit portability and continuous use.
Advances in sensor miniaturisation and wireless communication have enabled consumer-grade and patch-type devices capable of recording multi-lead or single-lead ECGs in ambulatory and home settings. Tooley and Turakhia examined whether the time for a consumerised or home-based 12-lead ECG has arrived, noting the rapid convergence of electrode technology and mobile processing power [10]. Yoon et al. demonstrated the feasibility of a patch-type wireless 12-clead ECG recorder in laypersons, with acceptable signal quality and user compliance outside the clinical environment [11]. Concurrently, AI-based automated ECG interpretation has advanced from conventional feature engineering to deep learning architectures such as ResNet-50 [12] and multi-class arrhythmia classifiers that operate on the full 12-lead signal [13]. These developments collectively raise the question of whether simplified electrode configurations—recording a single lead—can substitute for the full 12-lead system without sacrificing clinically relevant information.
Ambulatory Holter monitoring represents the established modality for long-term cardiac rhythm surveillance and heart rate variability (HRV) analysis. Three-channel Holter systems have been validated for AF detection and quantification of AF burden [14,15], for continuous ST-segment monitoring in acute coronary syndromes [16], and for characterising repolarisation dynamics and inter-lead differences in patients with myocardial infarction [17]. Notably, Lemmert et al. showed that RR-interval irregularity detectable by Holter monitoring precedes ventricular fibrillation in ST-elevation MI, underscoring the clinical value of continuous ambulatory ECG [18]. Single-channel patch monitors have been compared directly with conventional three-lead Holter systems, with Smith et al. demonstrating acceptable agreement for P-wave-centric metrics over 24 h recordings [19]. The integration of mobile health platforms with automated arrhythmia detection algorithms has further demonstrated feasibility for community-based cardiac surveillance [14].
Long-term continuous ECG recording—extending beyond the standard 24–48 h Holter protocol—substantially enhances the detection of autonomic abnormalities that are invisible to shorter recordings. Hayano and Yuda demonstrated that 7-day continuous ECG monitoring improves the reliability and discriminatory power of HRV metrics, revealing cardiac dynamics that episodic recordings miss [20]. Extended monitoring also enables non-invasive identification of sleep apnoea through cyclic variation of heart rate across nocturnal recording periods [21]. In a large-scale epidemiological analysis—the ALLSTAR study—Yuda et al. examined redundancy among HRV risk predictors derived from long-term Holter data, finding that a small set of orthogonal HRV indices captures most of the prognostic information contained in the broader metric space [22]. Furthermore, sleep posture and autonomic nervous system activity exhibit systematic variation across age and sex groups in nationwide ambulatory ECG datasets, highlighting the importance of contextual physiological variables in the interpretation of HRV profiles [23].
Despite these advances, the degree of concordance between HRV metrics derived from different ECG lead configurations—12-lead clinical ECG, 3-channel Holter, and single-lead (Lead I) wearable devices—has not been systematically characterised in a unified comparative framework. The Mason–Likar modification of the 12-lead system, used in ambulatory and exercise testing contexts, introduces geometrical differences relative to the standard configuration that alter QRS morphology and R-wave amplitude [24]. Similarly, single-channel patch monitors sample a spatial subset of the cardiac electrical field and may differ systematically from multi-channel Holter configurations in R-wave detection accuracy and derived RRI metrics [19]. The present study addresses this gap by providing a comparative analysis of HRV metrics across the three modalities using real ECG data from the PTB-XL public 12-lead database [25,26,27] and ambulatory Holter recordings from the Suzuken Pico303 and by characterising the systematic sources of inter-lead discrepancy relevant to the clinical validation of wearable cardiac monitoring devices.
Our central hypothesis is that Lead I-derived HRV metrics are sufficiently concordant with Lead II-derived metrics for time-domain analysis but that specific R-wave detection challenges associated with lower amplitude in some individuals may introduce systematic biases that warrant lead-specific calibration of automated detection algorithms.
2. Materials and Methods
2.1. Dataset 1: PTB-XL 12-Lead ECG Database
The PTB-XL large-scale ECG dataset (version 1.0.3; PhysioNet) [25,26,27] was used as the primary source of 12-lead ECG recordings for multi-lead comparison. PTB-XL contains 21,799 clinical 12-lead ECG records of 10 s duration from 18,869 patients, collected using Schiller AG devices at the Physikalisch-Technische Bundesanstalt (PTB) between October 1989 and June 1996. The patient population spans the full age range from 0 to 95 years (median 62 years; interquartile range 22 years), with 52% male and 48% female participants. Each record was annotated by up to two cardiologists using a standardised set of 71 SCP-ECG statements covering diagnostic, morphological, and rhythm categories. The diagnostic superclass distribution is: normal ECG (NORM, n = 9514), myocardial infarction (MI, n = 5469), ST/T-change (STTC, n = 5235), conduction disturbance (CD, n = 4898), and hypertrophy (HYP, n = 2649); note that multiple labels per record are possible. Waveform data are stored in WFDB format with 16-bit precision (resolution 1 µV/LSB) at 500 Hz (records500/), with a downsampled 100 Hz version (records100/) provided for compatibility with wearable-grade acquisition systems. The 100 Hz version was used throughout the present analysis. Accompanying metadata include patient demographics, signal quality indicators (noise, baseline drift, and electrode artefacts), and recommended 10-fold stratified cross-validation splits (folds 1–8 training, fold 9 validation, and fold 10 test) with patient-level stratification to prevent data leakage. The dataset is published under the Creative Commons Attribution 4.0 International licence and was accessed via PhysioNet at https://physionet.org/content/ptb-xl/1.0.3/ (accessed on 9 October 2026).
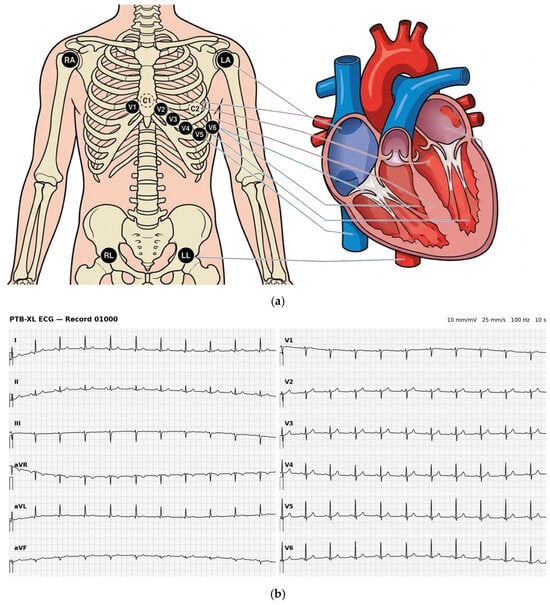
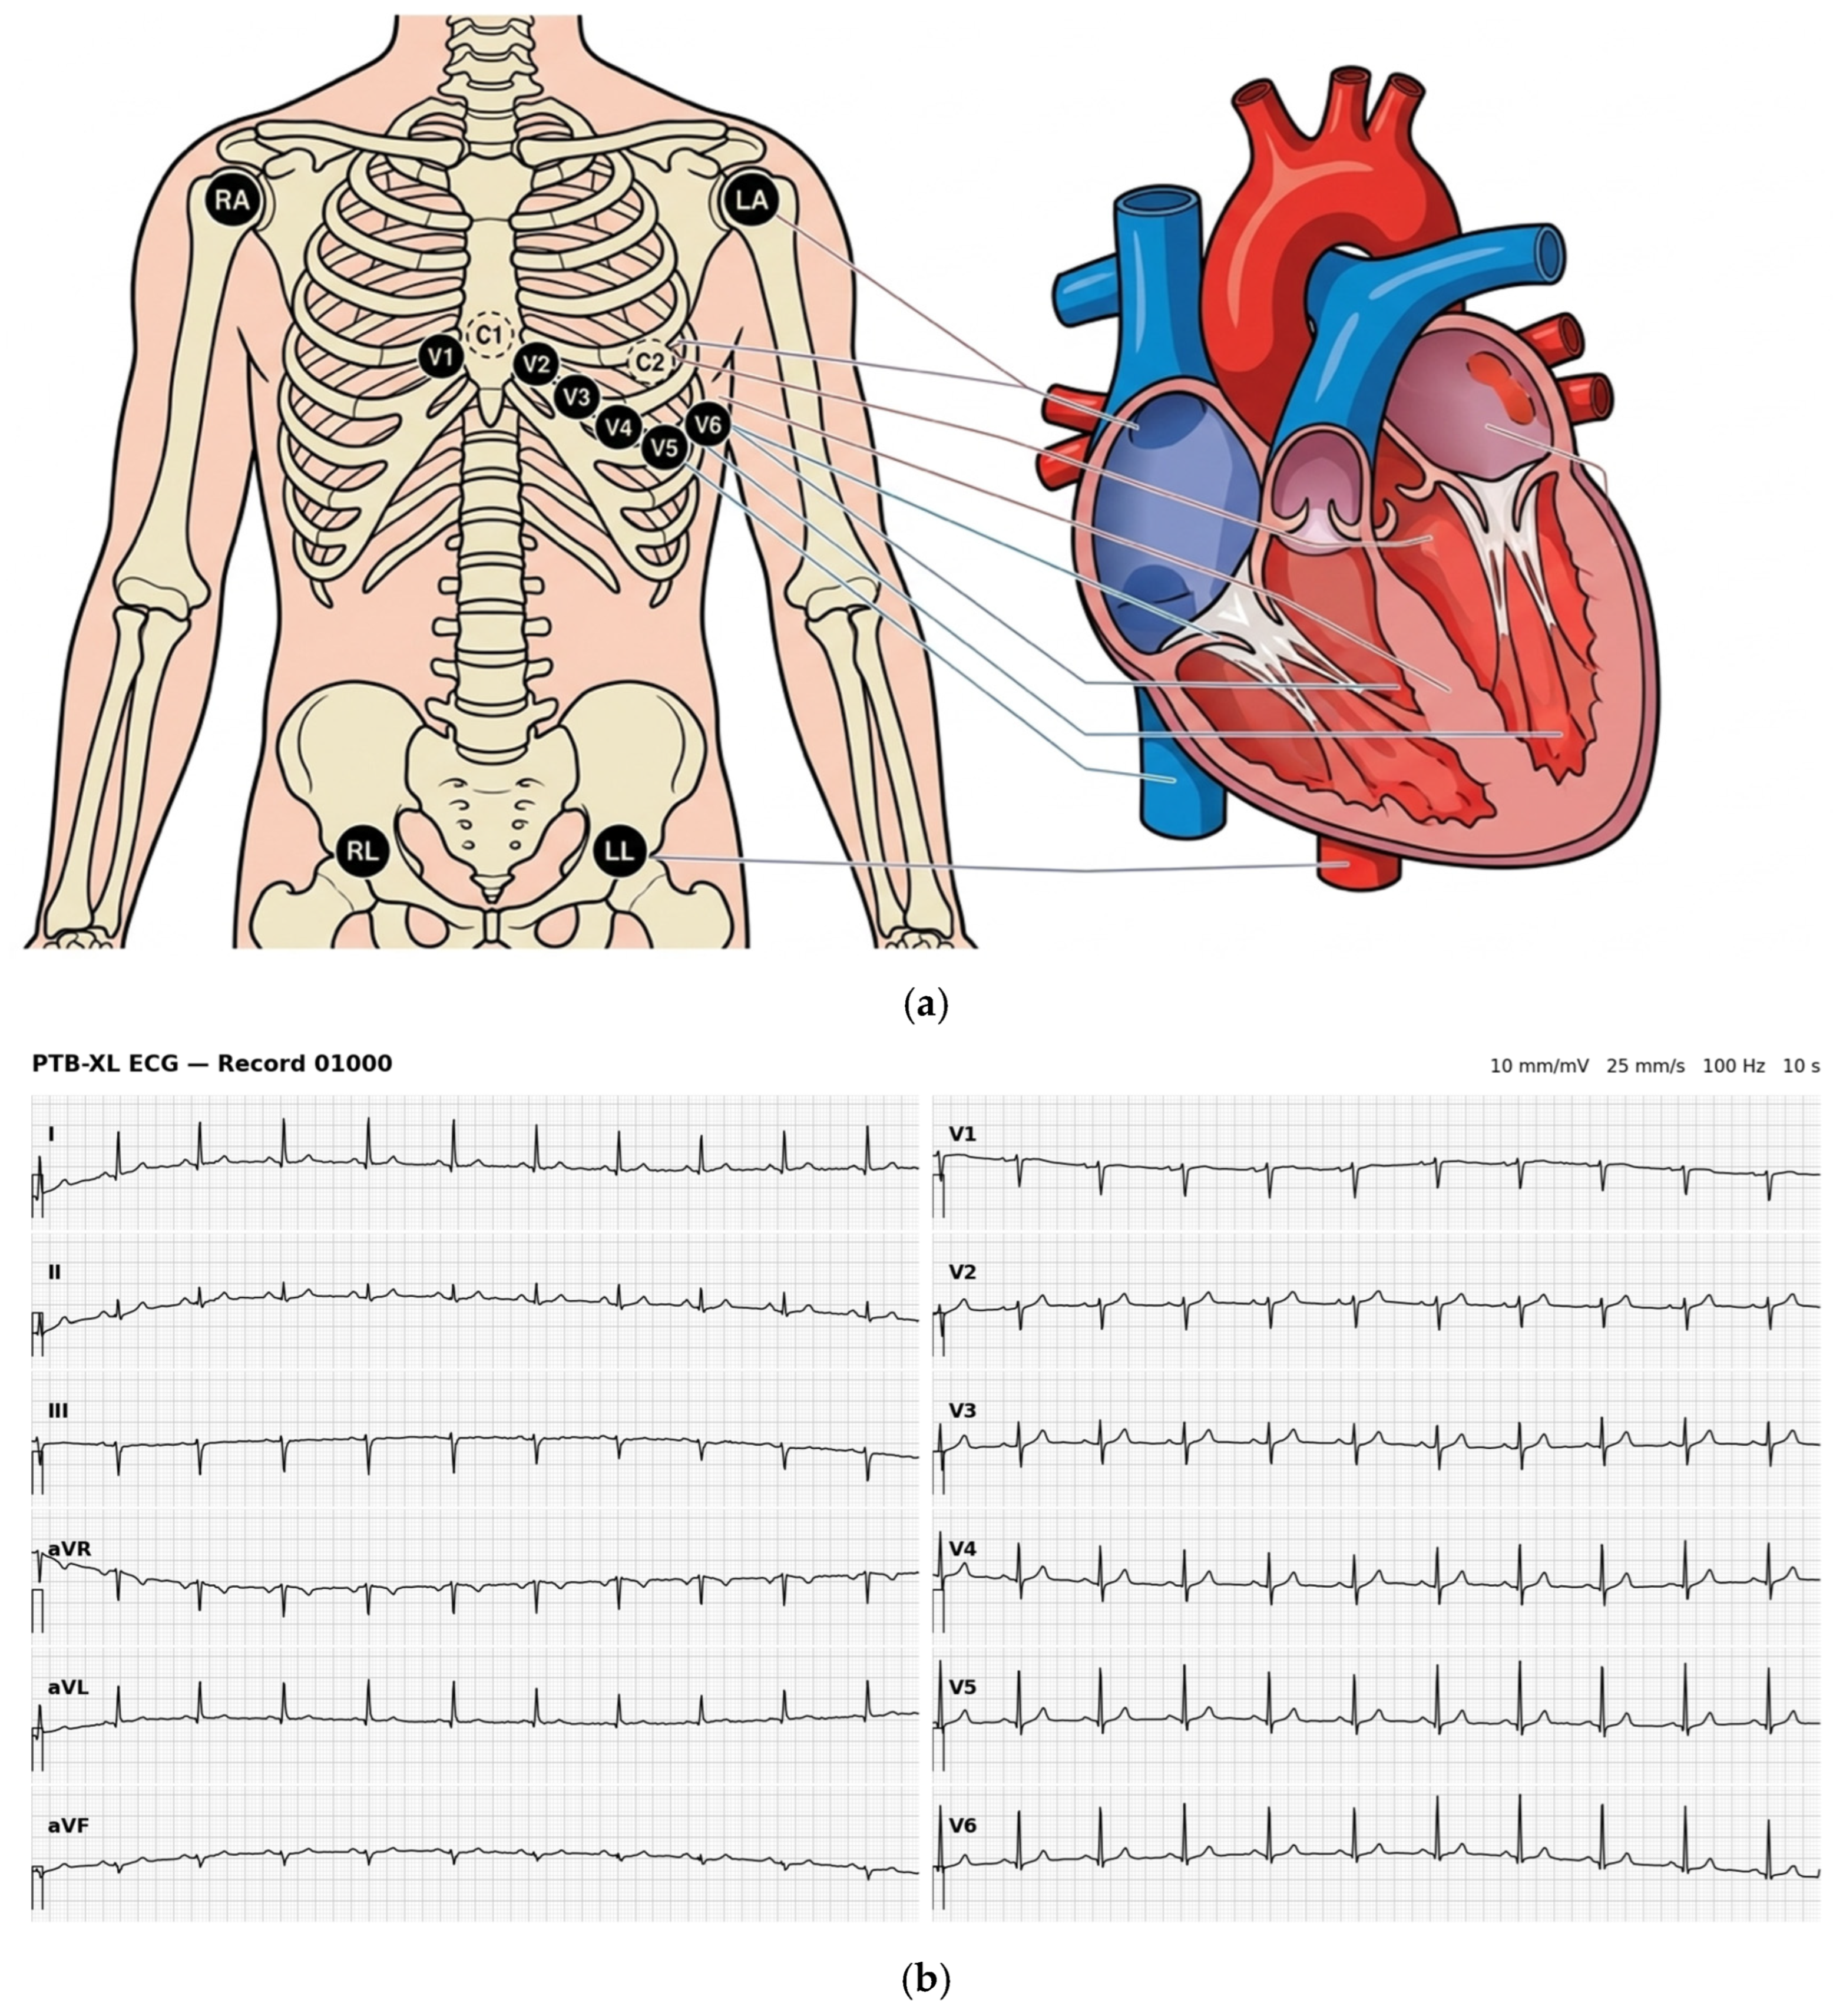
For the present analysis, Lead I (channel index 0) and Lead II (channel index 1) were extracted from all records to perform the inter-lead comparison pipeline. A representative recording (record 01000_lr) has the following signal characteristics: sampling rate = 100 Hz; signal length = 1000 samples (10.0 s); baseline offset (Lead I) = −710 ADC units; baseline offset (Lead II) = −661 ADC units. Figure 1a illustrates the standard 12-lead ECG electrode placement; a representative 12-lead ECG strip from this record is shown in Figure 1b.
Figure 1.
(a) Standard 12-lead ECG electrode placement diagram. Limb electrodes (RA, LA, RL, and LL) are placed on the four limbs; six precordial electrodes (V1–V6) are placed across the chest. The Suzuken Pico303 Holter recorder uses five of these electrodes (RA, LA, RL, C1, and C2) to generate three modified chest leads (CM5, CS5, and Lead II equivalent). (b) Representative 12-lead ECG waveform from PTB-XL record 01000_lr (100 Hz, 10 s). All 12 standard leads (I, II, III, aVR, aVL, aVF, and V1–V6) are displayed. Data are stored in WFDB format; gain = 1000.0 LSB/mV. This record was used for the Lead I vs. Lead II comparison analysis presented in Section 3.2.
As a pilot analysis to establish and validate the R-peak detection pipeline, a contiguous subset of 305 PTB-XL records was analysed (records 00040–00350; 100 Hz, 10 s recordings). Contiguous selection was adopted to avoid inadvertent sample curation; the subset thus represents a near-consecutive block from the database and was not filtered by diagnostic label or recording quality prior to analysis. Five records were excluded for insufficient R-peak detection (<2 R-peaks in either lead: records 00190, 00219, 00269, 00321, and 00336), leaving a final analysis cohort of 300 records. The superclass distribution of analysed records (mapped via PTB-XL metadata) was: NORM n = 179, MI n = 46, CD n = 26, HYP n = 12, STTC n = 36, and 1 record with unresolvable SCP code. Extension of this pipeline to the full PTB-XL database (21,799 records) is planned for future work.
2.2. Mathematical Structure of the 12-Lead ECG and Vectorcardiographic Transformation
A fundamental property of the standard 12-lead ECG system is that it captures the complete cardiac electrical vector from only eight independent measurement channels. The remaining four leads (III, aVR, aVL, and aVF) are mathematically derived from the two limb leads (Lead I and Lead II) using the following linear relationships, which are exact consequences of Kirchhoff’s voltage law applied to the Einthoven triangle:
III = II − I
aVR = −½ (I + II)
aVL = I − ½II
aVF = II − ½I
Because III, aVR, aVL, and aVF are algebraic combinations of Lead I and Lead II, the four limb leads collectively contribute only two degrees of freedom to the measurement. The six precordial leads (V1–V6) each sample an independent radial direction in the transverse plane and are measured independently from a Wilson central terminal reference. The total independent information content of the 12-lead ECG is therefore:
Independent channels = 2 (limb: I, II) + 6 (precordial: V1–V6) = 8
This 8-channel basis is the minimum required to reconstruct the full 12-lead ECG and, further, to compute the vectorcardiogram (VCG)—the three-dimensional spatial trajectory of the cardiac electrical vector during each beat. The VCG is expressed in three orthogonal Frank lead axes (X: left-to-right, Y: foot-to-head, Z: back-to-front) and is computed from the 8-channel signal via a linear transformation:
where M is a 3 × 8 transformation matrix. Two widely used implementations are described below.
(X, Y, Z)T = M × (I, II, V1, V2, V3, V4, V5, V6)T
2.2.1. Dower Transformation
The Dower transformation [24] is the classical and most widely cited method for 12-lead-to-VCG conversion (Table 1). The 3 × 8 Dower matrix MD is:
Table 1.
Dower transformation matrix MD (3 × 8) for computing the Frank VCG axes (X, Y, Z) from the eight independent 12-lead ECG channels.
2.2.2. Kors Transformation
The Kors transformation is a statistically optimised alternative derived by regression from simultaneous 12-lead and Frank VCG recordings. It has been reported to provide improved reconstruction accuracy over the Dower method for contemporary clinical research and AI-based ECG analysis [24] (Table 2). The Kors matrix ME is:
Table 2.
Kors transformation matrix ME (3 × 8) for computing the Frank VCG axes (X, Y, Z) from the eight independent 12-lead ECG channels.
2.2.3. Implications for Wearable and Holter ECG Monitoring
12-lead ECG (8 independent channels): Full VCG reconstruction is possible using either the Dower or Kors transformation, providing complete spatial information about the cardiac electrical vector. This enables arrhythmia localization [4,5], MI territory identification [1,2], and AI-based multi-class classification [12,13]. The PTB-XL dataset used in the present study provides this complete 8-channel representation for each recording.
3-channel Holter (CM5, CS5, and Lead II equivalent): Only three spatial samples are available—none of which correspond to the standard V1–V6 precordial positions. The 12-lead system cannot be reconstructed, and VCG transformation is not applicable. Time-domain HRV and Lead II-equivalent RRI series remain accessible, but morphological information is limited to the sampled planes.
Single-lead wearable ECG (Lead I only): The limb lead synthesis equations (III = II − I, aVR = −½(I + II), aVL = I − ½II, aVF = II − ½I) require both Lead I and Lead II; with only Lead I available, the augmented limb leads cannot be reconstructed without a second electrode. The six precordial leads are inaccessible from wrist-worn electrodes. VCG reconstruction is therefore impossible from a single-lead wearable ECG. This fundamental information-theoretic constraint limits wearable devices to time-domain HRV, heart rhythm detection, and lead-specific morphological analysis and motivates the present study’s systematic comparison of Lead I- versus Lead II-derived HRV metrics.
2.3. Dataset 2: 3-Channel Holter ECG (Suzuken Pico303)
Ambulatory ECG data were collected using the Suzuken Pico303 3-channel Holter recorder. This device records three modified chest leads simultaneously via five electrodes (RA, LA, RL, C1, and C2), generating channels equivalent to CM5 (precordial V5 equivalent), CS5 (V1–V2 equivalent), and Lead II. The ECG sampling rate is 125 Hz with a resolution of 0.020 mV/bit (10-bit ADC). Accelerometer data (3-axis; 32 Hz) are simultaneously recorded for activity classification.
Four participants (two elderly healthy adults and two young adults) contributed Holter recordings for this study: (1) an elderly male, aged 72 years (recording duration: approximately 84 min; date: 2026/03/01, 13:13–14:37); (2) an elderly female, aged 68 years (recording duration: approximately 84 min; same date); (3) a young male, aged 22 years; and (4) a young female, aged 24 years. All participants were clinically healthy at the time of recording. QRS annotations (R-point timestamps in milliseconds and RR-interval values) were exported from the Suzuken analysis software (Analyzer05, version 5.01/6.01) in CSV format. Beat labels followed the standard Holter classification: N (normal), V (ventricular ectopic), S (supraventricular ectopic), and X (unclassifiable/artefact). Ethics approval for human Holter recordings was obtained from the Ethics Review Committee of the Graduate School of Engineering, Mie University (approval number: 155; approved 4 February 2026). All participants provided written informed consent. The electrode placement follows the standard 12-lead configuration illustrated in Figure 1a.
2.4. Signal Preprocessing
For the PTB-XL 12-lead ECG signals, a fourth-order Butterworth bandpass filter (0.5–40 Hz) was applied using zero-phase forward–backward filtering (scipy.signal.filtfilt) to remove baseline wander and high-frequency noise while preserving QRS morphology. The analogue-to-digital converter values were converted to millivolts using the gain factor specified in each WFDB header file (1000.0 LSB/mV).
For the Holter Pico303 data, pre-computed RR-interval series were used directly from the manufacturer’s software output, as the raw waveform files were not available in this pilot. Only beats labelled “N” (normal sinus) were retained for HRV analysis. RRI values outside the physiologically plausible range (300–1800 ms, corresponding to 33–200 bpm) were excluded as artefacts.
2.5. R-Wave Detection
For PTB-XL waveform data, R-peaks were detected using a Pan–Tompkins-inspired algorithm. The preprocessed ECG signal was first differentiated and squared to emphasise QRS slope, followed by a 150 ms moving-average integration window. Peaks were identified using scipy.signal.find_peaks with a minimum inter-peak distance of 300 ms and an adaptive threshold defined as the mean plus 0.5 standard deviations of the integrated signal. Detected peak positions were subsequently refined within a ±50 ms window around each candidate by selecting the sample of maximum absolute amplitude in the filtered ECG, ensuring accurate localisation of the true R-peak regardless of polarity.
The same R-wave detection pipeline was applied independently to Lead I and Lead II signals from each PTB-XL record, enabling direct comparison of detection outcomes under identical algorithmic conditions. R-peak amplitude was computed as the filtered ECG amplitude at the detected peak sample.
2.6. HRV Feature Extraction
RR-interval series were derived from consecutive R-peak locations as the sample-to-sample distance converted to milliseconds. The following HRV metrics were computed according to Task Force standards:
Time-domain: Mean RRI (ms); mean heart rate (HR, bpm); standard deviation of normal–normal intervals (SDNN, ms); root mean square of successive RRI differences (RMSSD, ms); proportion of successive RRI differing by more than 50 ms (pNN50, %).
Poincaré plot: SD1 (ms)—the standard deviation perpendicular to the line of identity, reflecting short-term RRI variability and approximating RMSSD/√2; SD2 (ms)—the standard deviation along the line of identity, reflecting long-term variability; SD1/SD2 ratio.
2.7. Statistical Analysis
Agreement between Lead I- and Lead II-derived RRI series was assessed using Bland–Altman analysis, computing the mean bias (d−) and 95% limits of agreement (LoA = d− ± 1.96 × SD_diff; LoA: limits of agreement). Pearson product–moment correlation coefficients were computed between paired RRI sequences aligned by beat index. Intraclass correlation coefficients (ICC; two-way random-effects model, absolute agreement, single measures) were computed for each record and summarised by diagnostic superclass. R-wave amplitudes were compared between leads using descriptive statistics (mean ± SD). All analyses were performed in Python 3.11 (NumPy 1.26, SciPy 1.11, Pandas 2.1).
3. Results
3.1. Holter ECG: HRV Characteristics by Subject
Table 3 summarises time-domain and Poincaré HRV metrics computed from the four Holter recordings. All values are derived from normal-labelled beats only, with artefact/ectopic beats excluded. Excluded beats were skipped (omitted) from the RRI series; the time difference between the preceding and following normal beat was not used, so each excluded beat results in one fewer RRI pair rather than an artificially long interval.
Table 3.
HRV metrics derived from 3-channel Holter ECG (Suzuken Pico303) for four participants. All values computed from normal sinus beats (label N) only. SDNN: standard deviation of normal-to-normal intervals; RMSSD: root mean square of successive differences; pNN50: proportion of successive differences > 50 ms. SD1 (ms): standard deviation of RRI differences perpendicular to the line of identity in the Poincaré plot, reflecting short-term (beat-to-beat) vagally mediated HRV; SD2 (ms): standard deviation along the line of identity, reflecting long-term HRV; SD1/SD2 ratio: relative contribution of short- to long-term variability (lower values indicate long-term HRV dominance). LoA: limits of agreement (bias ± 1.96 × SD_diff). Artefact/ectopic beats were excluded (skipped); excluded beats reduce the number of valid RRI pairs by one per beat.
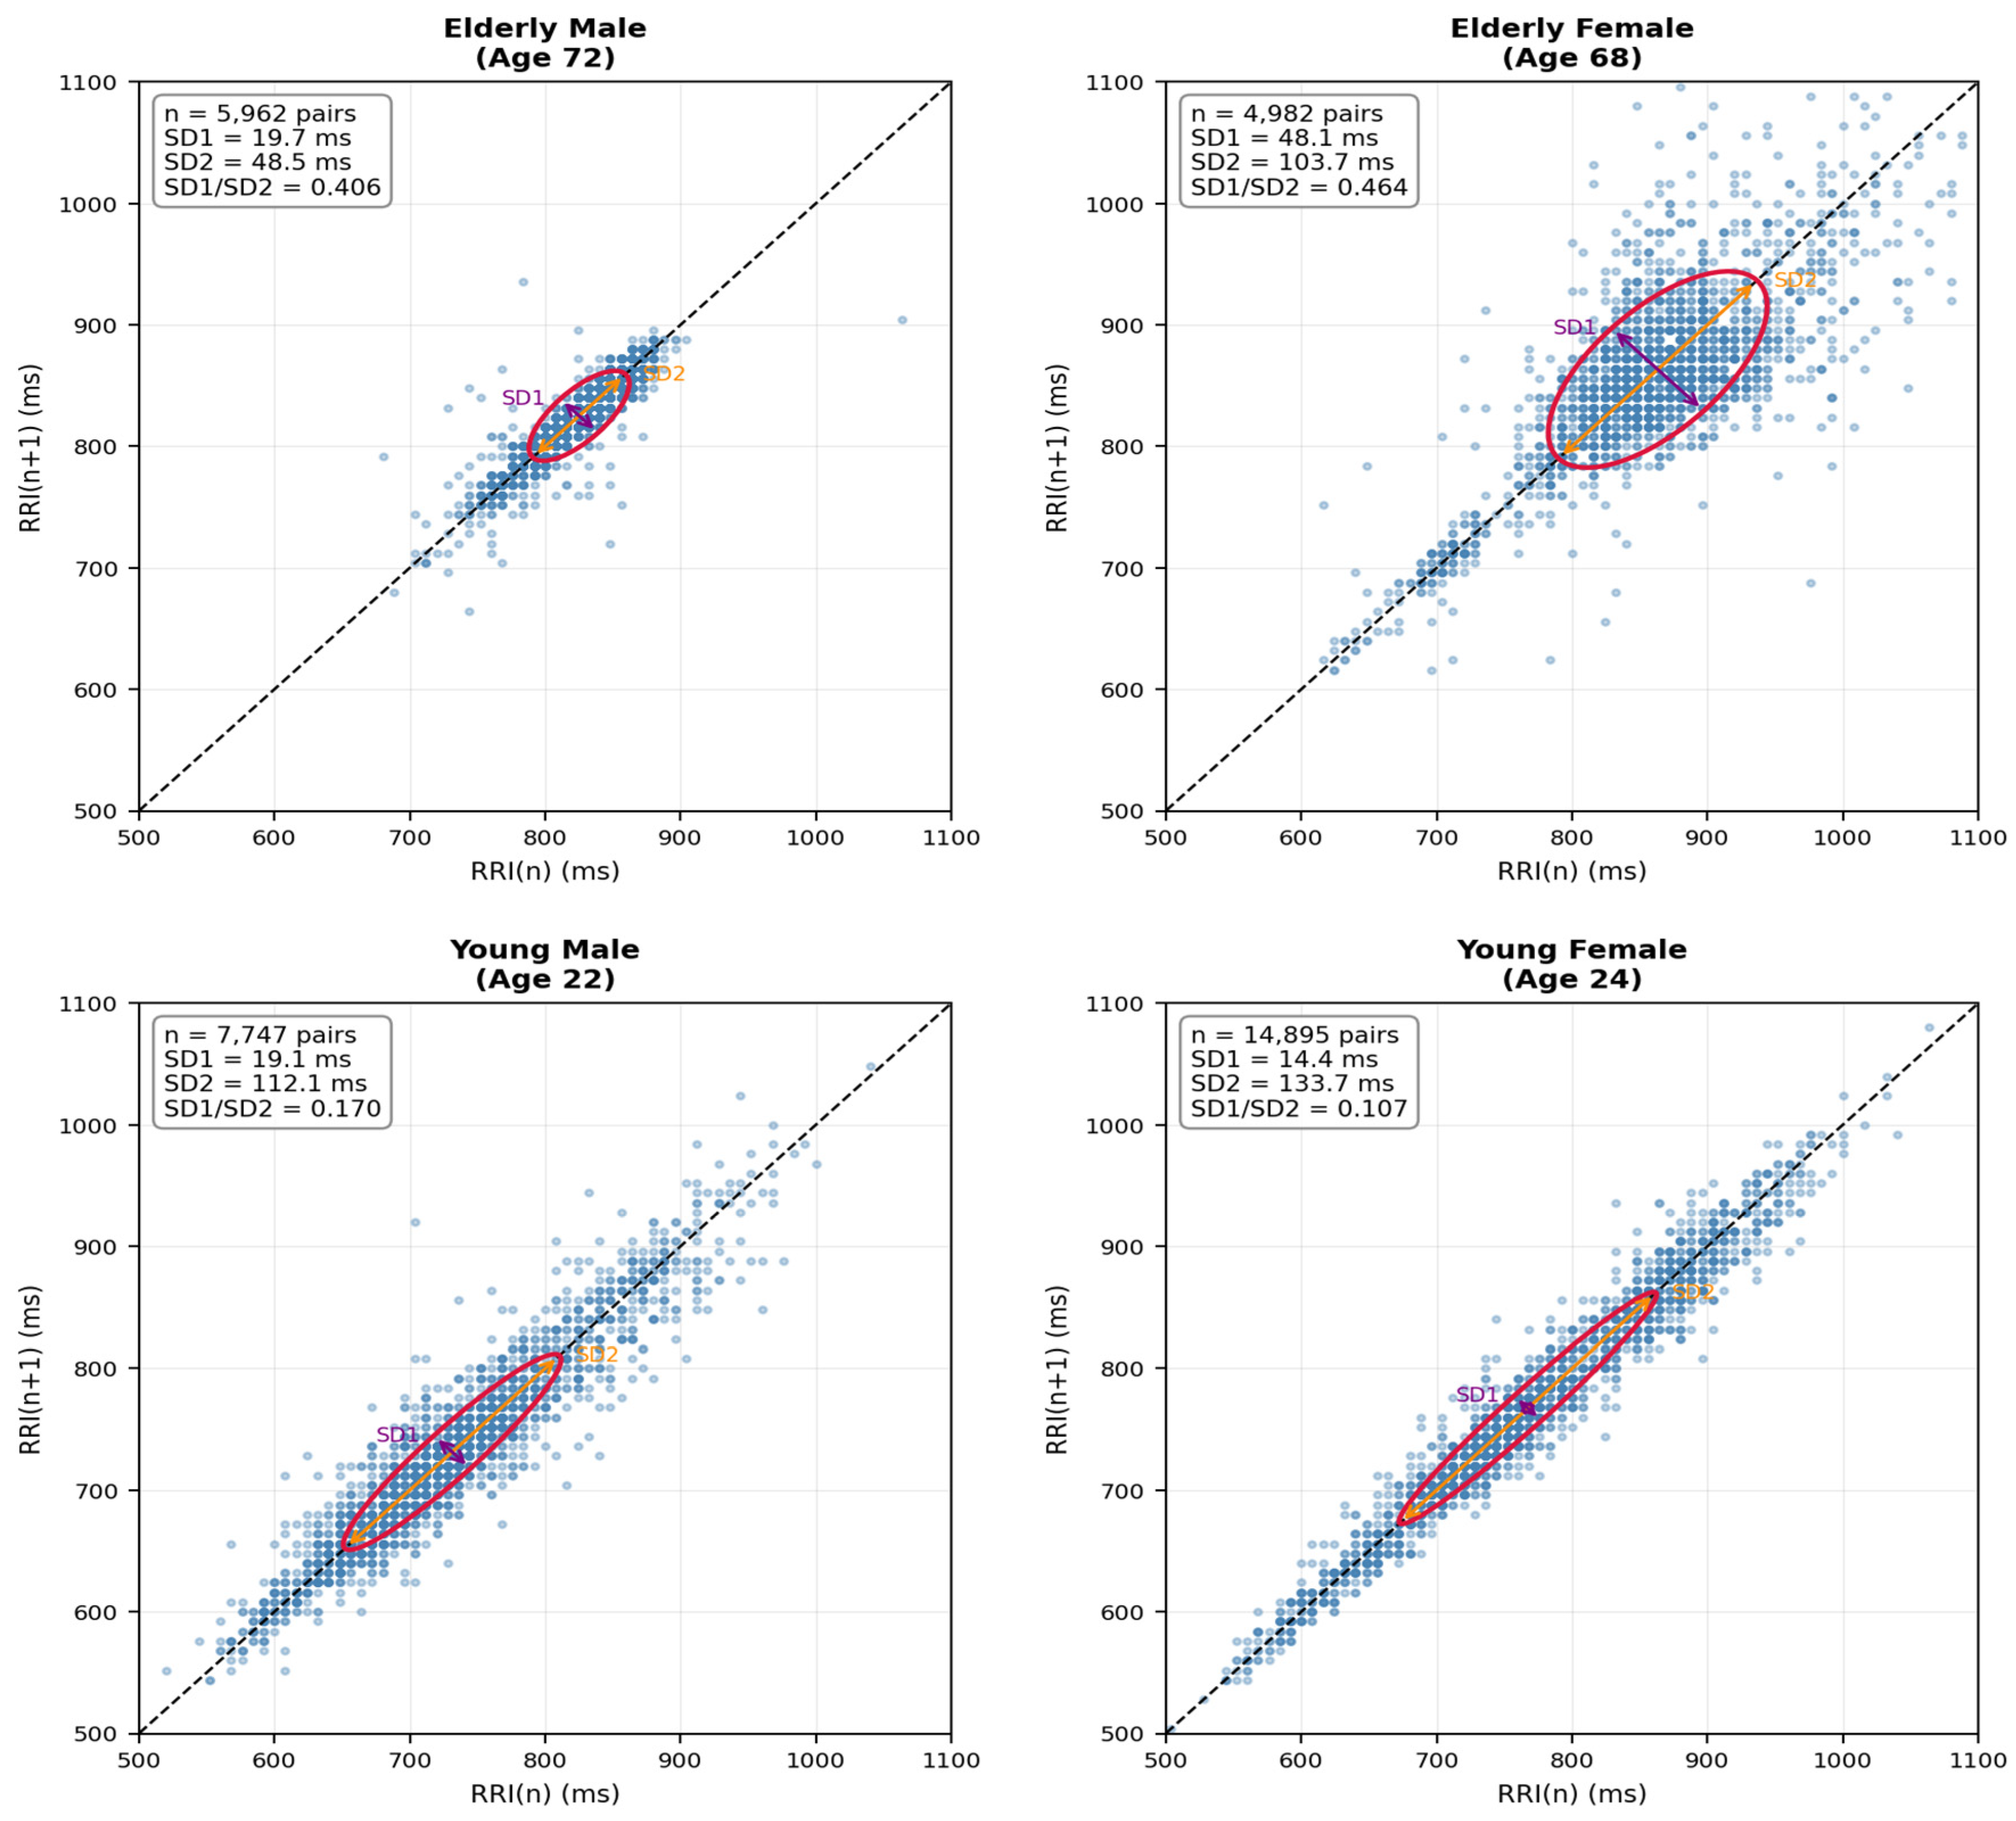
Marked inter-individual differences in HRV were observed across the four participants. The elderly male exhibited the lowest HRV by all time-domain metrics (SDNN = 37.03 ms, RMSSD = 27.88 ms, pNN50 = 1.1%), consistent with the well-documented age-related decline in autonomic modulation. The elderly female, despite similar age, showed substantially higher HRV (SDNN = 80.81 ms, RMSSD = 68.03 ms, pNN50 = 25.8%), with a large SD2 (103.65 ms) indicating pronounced long-cycle respiratory or circadian variation. This intersex difference in HRV among older adults has been reported in population studies and may reflect hormonal and autonomic regulatory differences.
The young male exhibited the highest mean HR (82.0 bpm) and a high SDNN (80.43 ms), driven primarily by a very large SD2 (112.13 ms). However, his RMSSD (26.96 ms) and SD1 (19.06 ms) were comparable to the elderly male, and his pNN50 (5.3%) was relatively modest, suggesting that the high SDNN reflects predominantly long-term (circadian/postural) variation rather than vagally mediated short-term beat-to-beat modulation. This finding is consistent with the dissociation between SDNN and RMSSD documented in physically active young adults.
A particularly striking HRV profile was observed in the young female, who exhibited the highest SDNN among all participants (95.09 ms) yet the lowest RMSSD (20.30 ms), pNN50 (1.6%), and SD1 (14.35 ms). Her SD1/SD2 ratio of 0.107 was the lowest recorded, indicating dominance of long-term HRV components over short-term beat-to-beat variability. This pattern—high SDNN with low RMSSD—is broadly consistent with circadian-scale autonomic modulation over short-term vagal tone; however, we caution that physiological interpretation of this single-participant observation is necessarily tentative. Her recording duration (14,896 valid RRI values, the longest of the four) contributes to a stable SDNN estimate, but firm conclusions about autonomic phenotype would require repeated measurements, extended recordings (≥24 h), and replication in an appropriately powered cohort. The SD1/SD2 ratio pattern is noted descriptively without causal attribution.
3.2. PTB-XL Lead I vs. Lead II: R-Wave Detection and Signal Characteristics
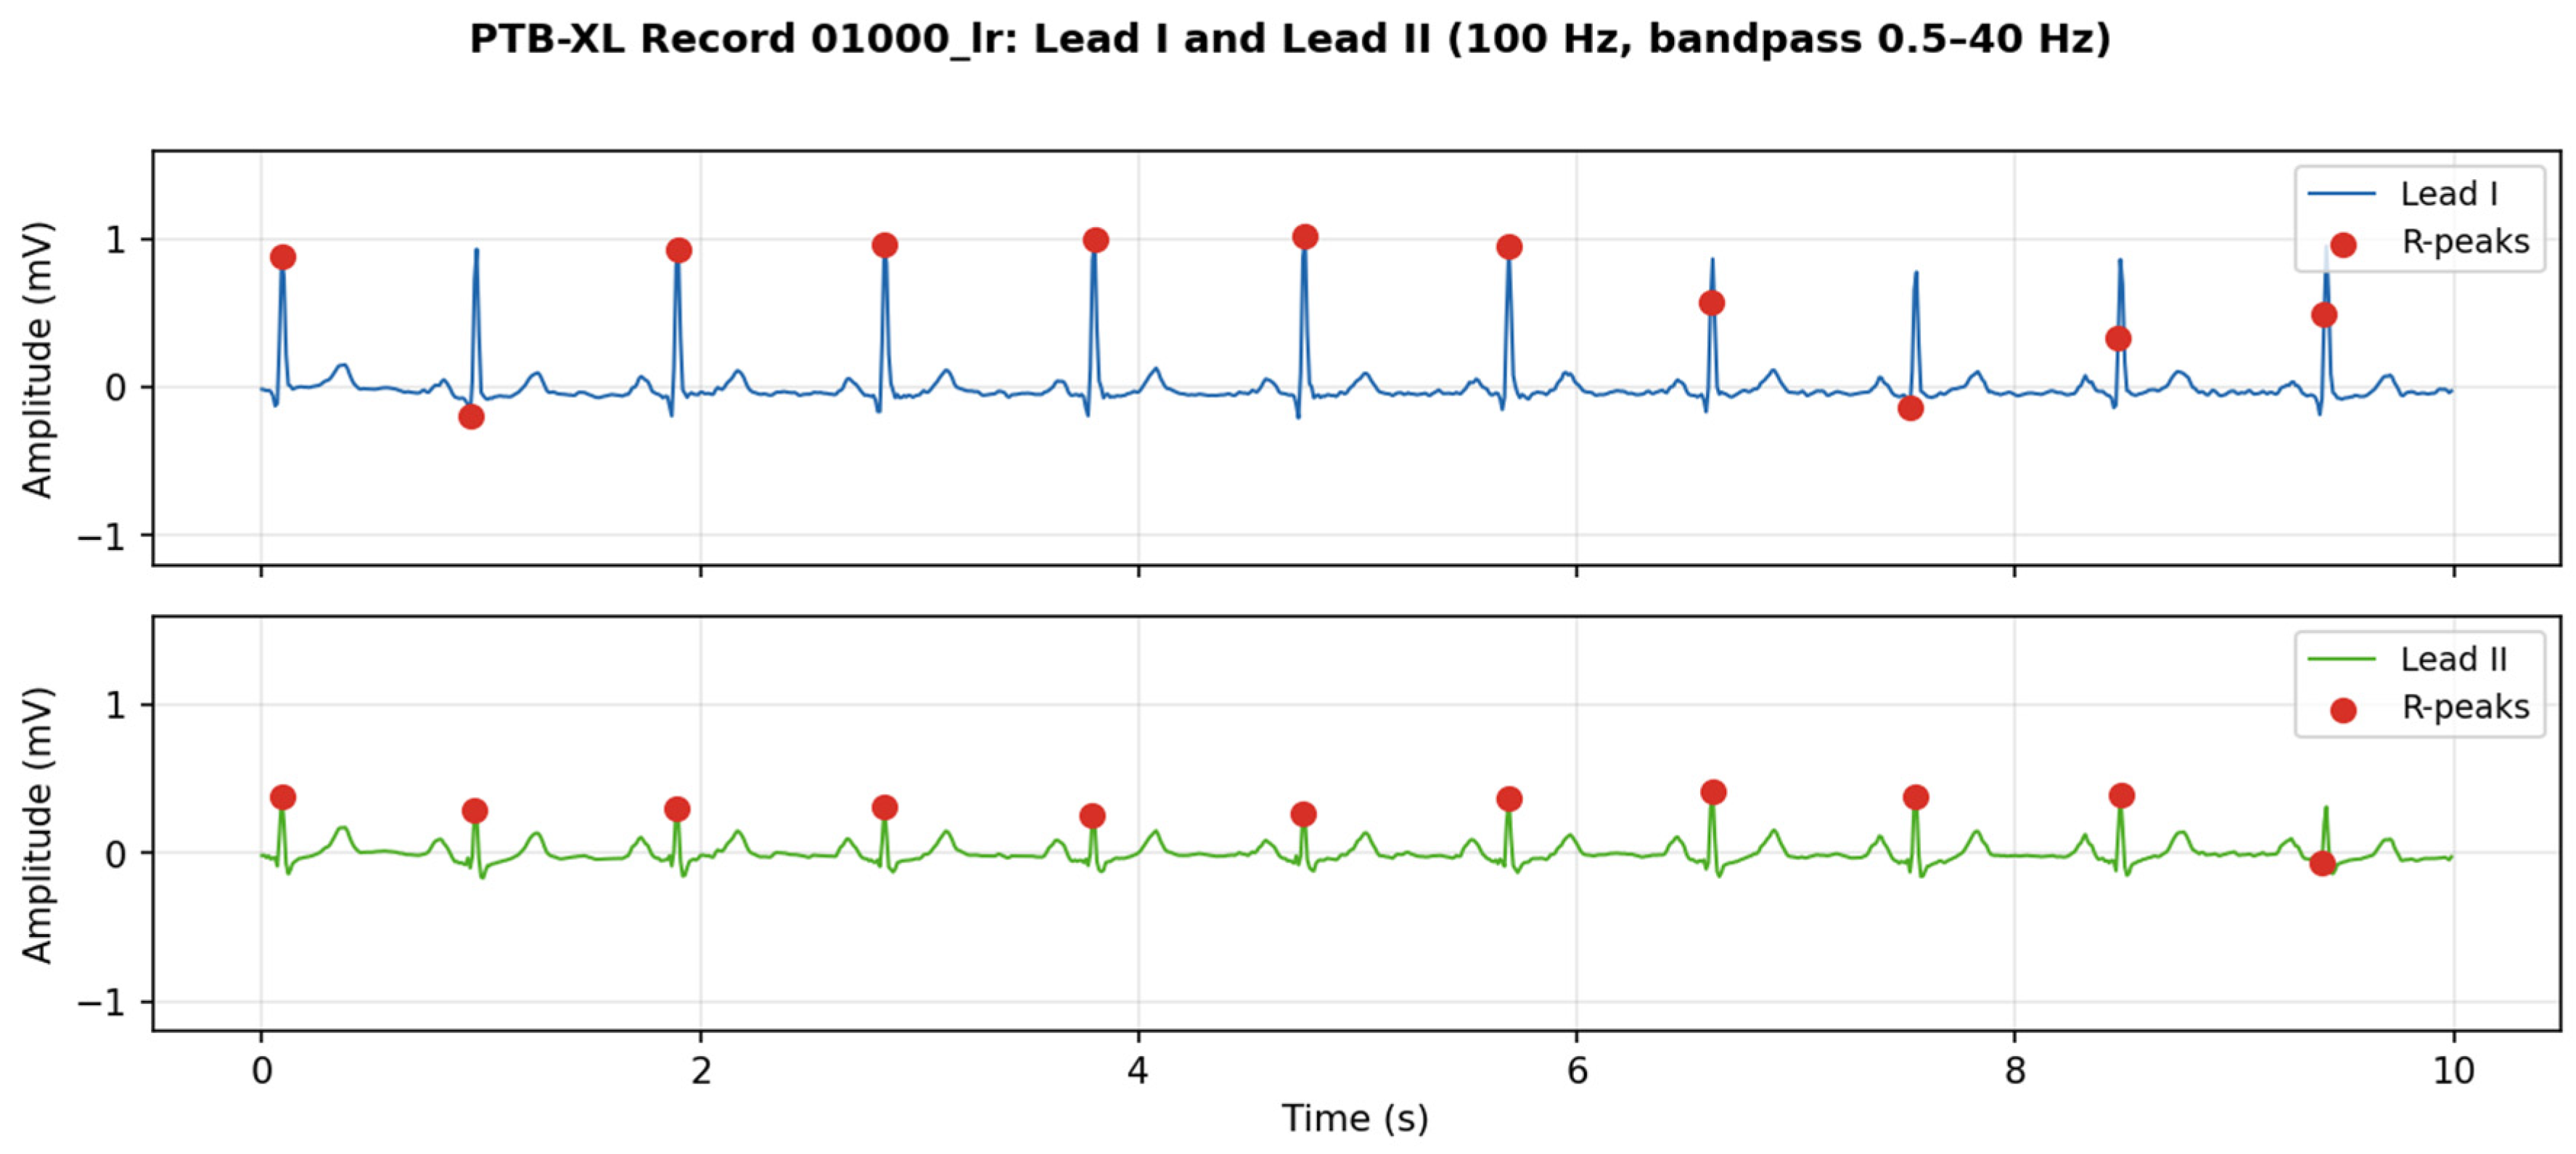
Table 4 summarises R-wave detection and inter-lead RRI agreement statistics aggregated by diagnostic superclass across 300 analysed PTB-XL records (00040–00350). Normal ECGs (NORM class) yielded the highest concordance (mean Pearson r = 0.844, ICC(2,1) = 0.841), whereas pathological categories showed progressively lower agreement, with conduction disturbance (CD) exhibiting the largest dispersion (SD of differences = 105.4 ms). R-wave amplitude was higher in Lead II than Lead I for NORM, CD, and STTC classes, while HYP showed the highest amplitudes in both leads (Figure 2).
Table 4.
R-wave detection and Lead I–Lead II RRI agreement statistics by diagnostic superclass (PTB-XL dataset; Pan–Tompkins detection; 100 Hz, 10 s recordings; values are means across records in each class; multi-label records appear in each applicable class).
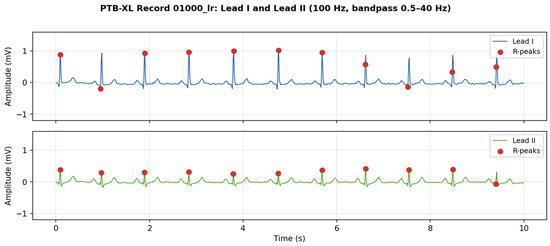
Figure 2.
Ten-second ECG waveforms from PTB-XL record 01000_lr (100 Hz; bandpass 0.5–40 Hz). Upper: Lead I; lower: Lead II. Red dots denote detected R-peaks (Pan–Tompkins algorithm). Note the higher R-wave amplitude in Lead I compared with Lead II for this representative record (individual records vary; overall cohort mean is higher in Lead II).
Lead I exhibited substantially higher mean R-wave amplitude (0.620 ± 0.429 mV) compared with Lead II (0.302 ± 0.127 mV) in this record. This pattern is determined by the mean frontal QRS axis, and its explanation requires reference to the vectorcardiographic framework described in Section 2.2. The cardiac electrical axis is defined as the mean direction of ventricular depolarisation in the frontal plane, measured in degrees from the positive axis of Lead I (0°). Using Einthoven’s triangle, Lead I records the horizontal component of the cardiac vector (LA − RA), maximised when the axis is near 0° (horizontal); Lead II records a vector oriented at +60° (LL − RA), maximised near +60°. The normal frontal QRS axis range is approximately 0° to +90°. In subjects with a leftward or horizontal axis (0° to −30°, common in left ventricular hypertrophy and left anterior fascicular block), Lead I R-wave amplitude exceeds Lead II—consistent with the present observation. Conversely, in subjects with a rightward or inferior axis (+90° to +180°, seen in right ventricular hypertrophy, chronic lung disease, and tall/slender body habitus), Lead II dominates and Lead I may exhibit a negative net deflection (S-wave dominant). Extreme right-axis deviation (+120° to +180°) can produce a deeply negative Lead I QRS, in which case standard R-wave detection algorithms—calibrated for a positive QRS complex—may completely fail or misdetect S-waves as R-peaks [4,24]. The high standard deviation of R-wave amplitude in Lead I (0.429 mV) compared with Lead II (0.127 mV) further reflects beat-to-beat morphological variability, possibly due to respiratory modulation of the cardiac axis and variable left-to-right electrode contact during normal respiration. This axis-dependent amplitude variability has critical implications for Pan–Tompkins-type algorithms, which use an adaptive threshold based on recent peak amplitudes; in borderline or atypical axes, the algorithm may intermittently miss low-amplitude peaks or misclassify noise, degrading RRI accuracy and downstream HRV estimates. Lead-specific adaptive thresholding or axis-normalised templates are therefore recommended for robust wearable ECG R-peak detection across diverse patient populations (Figure 3).
Figure 3.
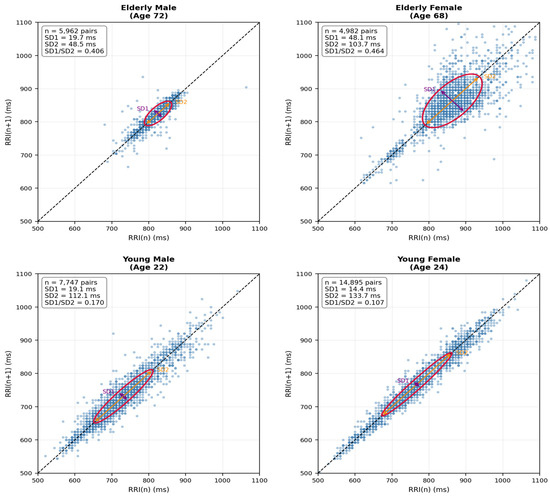
Poincaré plots of RR-interval (RRI) series for all four Holter participants. Each point represents a pair of consecutive RR intervals, [RRI(n), RRI(n + 1)]. The dashed line indicates the line of identity (45°). The red ellipse illustrates the SD1/SD2 decomposition, with SD1 representing short-term variability perpendicular to the line of identity and SD2 representing variability along the line of identity. SD1 is related to RMSSD by SD1 = RMSSD/√2 under the standard Poincaré formulation. All panels use the same axis range (500–1100 ms) to facilitate visual comparison. The number of RRI pairs (n), SD1, SD2, and the SD1/SD2 ratio are annotated in each panel. For visual clarity, 2000 RRI pairs were randomly sampled for display in each panel; the reported indices were calculated from the corresponding RRI series.
3.3. Bland–Altman Analysis: RRI Agreement Between Lead I and Lead II
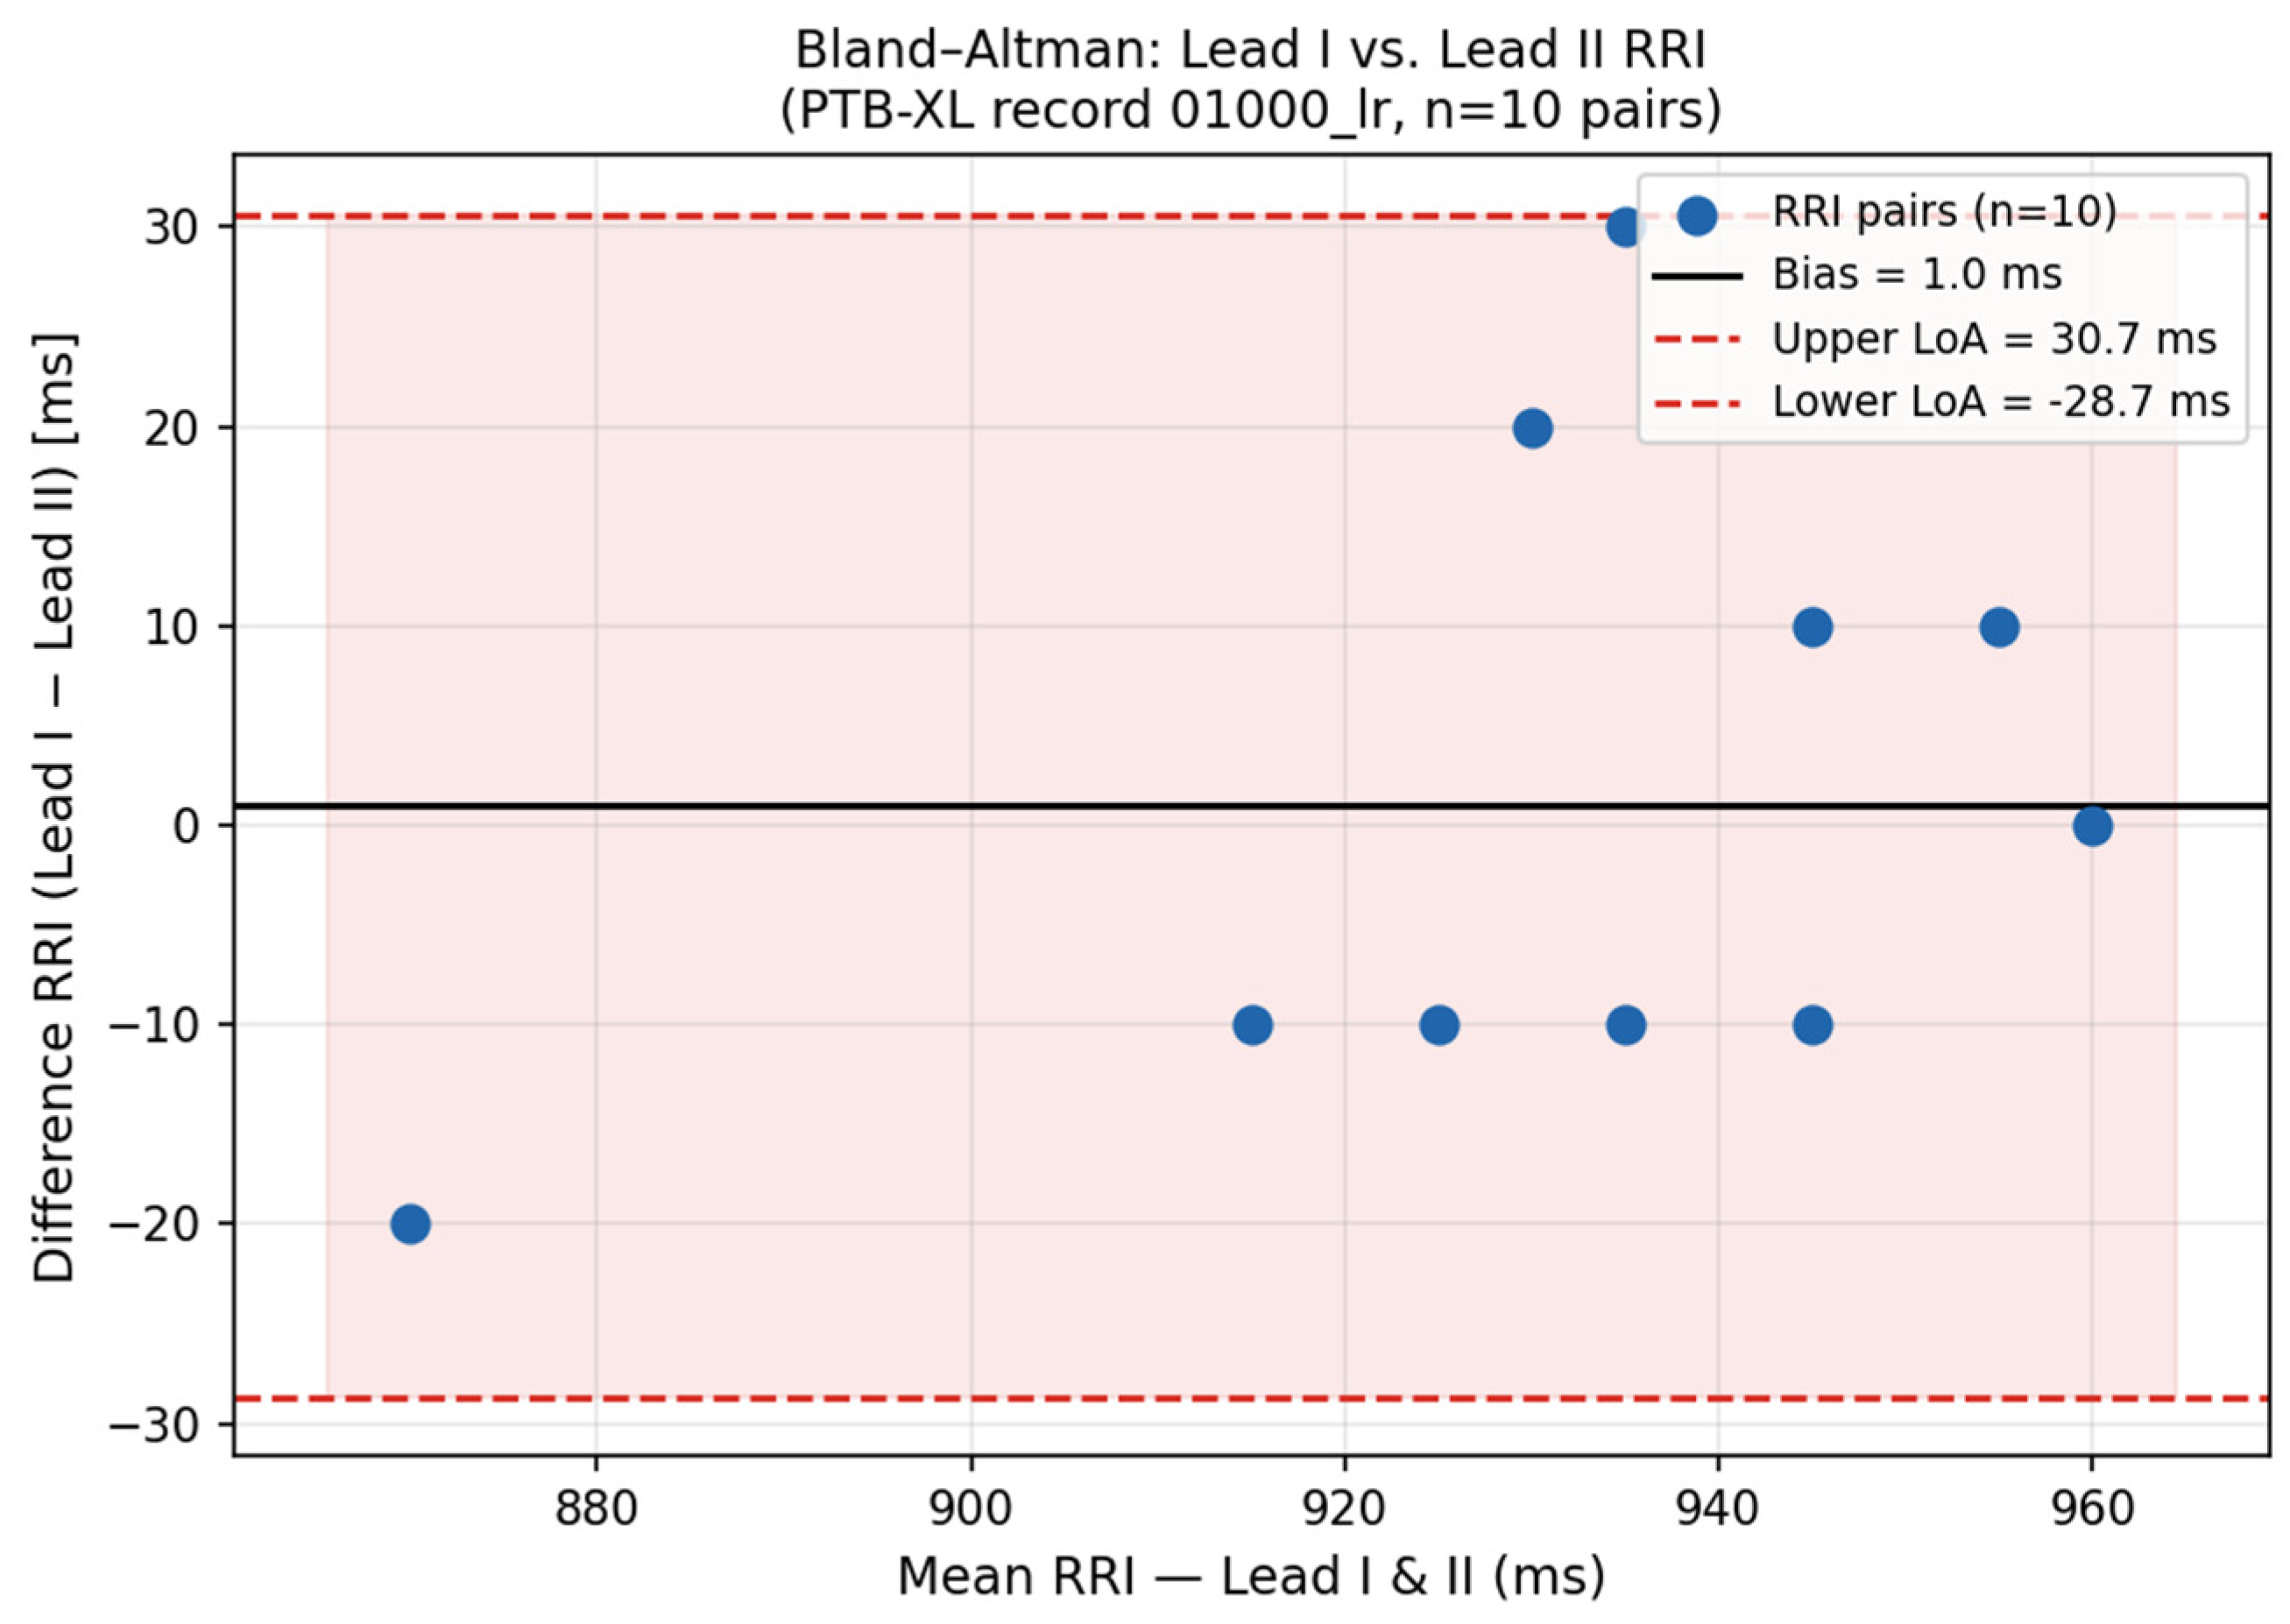
Bland–Altman analysis across 300 PTB-XL records (00040–00350) revealed substantial variation in Lead I–Lead II RRI agreement by diagnostic category (Table 5). For NORM records (n = 179), the mean bias was −1.4 ms (SD_diff = 26.0 ms; 95% LoA: [−52.4, +49.7] ms), with 79.3% of records achieving ICC(2,1) > 0.80, confirming acceptable inter-lead concordance in physiologically normal hearts. Pathological ECG categories showed systematically larger biases and wider limits of agreement: MI (bias = +19.1 ms; SD = 52.3 ms; LoA [−83.4, +121.6] ms), CD (bias = −32.0 ms; SD = 105.4 ms; LoA [−238.6, +174.7] ms), HYP (bias = +16.7 ms; SD = 107.5 ms; LoA [−193.9, +227.4] ms), and STTC (bias = +12.1 ms; SD = 39.7 ms; LoA [−65.7, +89.9] ms). Overall, the pooled mean bias was +3.6 ms with Pearson r = 0.740 and ICC(2,1) = 0.745 (n = 300), indicating moderate inter-lead RRI agreement across the population. Of all records, 67.0% achieved r > 0.80 and 8.3% showed absolute bias > 50 ms.
Table 5.
Bland–Altman agreement statistics for Lead I vs. Lead II RR-interval series by diagnostic superclass (PTB-XL records 00040–00350; n = 300 records). Bias: mean of (RRI_I − RRI_II) per record, averaged across records in each class. SD_diff: mean within-record standard deviation of differences. LoA: 95% limits of agreement = bias ± 1.96 × SD_diff (Bland–Altman method). ICC(2,1): intraclass correlation coefficient, two-way random-effects model, absolute agreement, single measures (Shrout and Fleiss form 2,1).
Figure 4.
Bland–Altman plot illustrating RRI agreement between Lead I and Lead II for a representative NORM record from the PTB-XL dataset. Cohort-level statistics (n = 300 records, 00040–00350) are reported in Table 5; NORM class: bias = −1.4 ms, 95% LoA [−52.4, +49.7] ms, ICC(2,1) = 0.841.
3.4. Inter-Lead Discrepancy: Key Factors
Three principal sources of RRI discrepancy between Lead I and Lead II were identified in this pilot analysis:
(1) Cardiac electrical axis deviation: The relative R-wave amplitude in Lead I versus Lead II is governed by the mean frontal QRS axis. In subjects with a normal or leftward axis (0° to −30°), Lead I R-wave amplitude equals or exceeds Lead II. In those with a normal inferior axis (+60° to +90°, the majority of adults), Lead II dominates. In right-axis deviation (+90° to +180°, seen in right ventricular hypertrophy, chronic obstructive pulmonary disease, or tall body habitus), Lead I may become S-wave dominant (net negative deflection), completely defeating standard R-peak detection algorithms calibrated for positive QRS complexes [4,24]. Across the 300-record cohort (00040–00350), the mean Lead I amplitude was 0.667 mV and Lead II amplitude was 0.734 mV. In NORM records (n = 179), Lead I amplitude was 0.622 mV vs. Lead II 0.821 mV. Pathological classes showed elevated amplitudes, HYP (Lead I 0.997 mV, Lead II 1.219 mV) and MI (Lead I 0.742 mV, Lead II 0.503 mV), consistent with hypertrophic and ischaemic ECG patterns. R-wave amplitude was computed as the mean maximum signal value in a 100 ms forward window from each Pan–Tompkins upstroke detection position across all beats in a record.
(2) QRS morphology variation: In Lead I, QRS complexes occasionally exhibit S-wave dominance (negative net deflection), as seen in right bundle branch block or right-axis deviation. Algorithms that rely on absolute amplitude maxima rather than morphology-adaptive templates may misidentify S-waves as R-peaks, introducing spurious short RRI values.
(3) Sampling rate effects: At 100 Hz, R-peak localisation is limited to ±5 ms resolution (one sample). This quantisation error contributes to the SD_diff values observed across the cohort; however, biological RRI variability and beat morphology differences between leads are the dominant contributors. At 500 Hz resolution, this error reduces to ±1 ms and agreement would be substantially closer. The PTB-XL 500 Hz version (available at https://physionet.org/content/ptb-xl/1.0.3/ (accessed on 9 October 2026)) is recommended for fine-grained HRV frequency-domain analyses.
4. Discussion
This pilot study presents a structured comparative analysis of HRV metrics across three ECG modalities—12-lead clinical ECG, 3-channel ambulatory Holter, and single-lead (Lead I) ECG—using real data from the PTB-XL public database and Suzuken Pico303 Holter recordings from four subjects. Our findings are discussed below in relation to the three core themes: Lead I–II concordance, inter-individual HRV heterogeneity, and the implications of R-wave morphology differences for automated detection in wearable devices.
The 300-record cohort analysis revealed a mean bias of −1.4 ms for NORM records (ICC(2,1) = 0.841, r = 0.844), demonstrating good inter-lead concordance in physiologically normal hearts. The achieved ICC(2,1) of 0.841 for NORM records confirms acceptable inter-lead concordance, though this falls below the typically cited 0.90 threshold for clinical-grade agreement, which has important implications for wearable device validation. This result is consistent with the emerging consensus that simplified electrode configurations can provide clinically useful cardiac information comparable to the full 12-lead system. Tooley and Turakhia argued that the time for a consumerised or home-based 12-lead ECG has arrived, citing advances in dry electrode technology and smartphone signal processing [10]. Yoon et al. demonstrated that a patch-type wireless 12-lead ECG in laypersons achieves adequate signal quality for automated analysis, even when worn by individuals without clinical training [11]. Our findings support the extension of this argument to single-lead devices; for mean heart rate and RRI estimation—the quantities most clinically relevant to wearable cardiac monitoring—Lead I shows good concordance with Lead II in normal ECGs across 300 records. The single-channel P-wave-centric ECG patch investigated by Smith et al. showed acceptable concordance with the 3-lead Holter for atrial rhythm analysis [19], reinforcing the principle that a subset of the 12-lead information space may suffice for many monitoring purposes.
The pronounced inter-individual HRV heterogeneity observed in our Holter cohort aligns with the patterns documented in large-scale long-term ECG studies. Hayano and Yuda demonstrated that 7-day continuous ECG monitoring substantially improves the reliability and clinical discriminatory power of HRV metrics compared with shorter recordings, revealing autonomic dynamics that are invisible to 24 h Holter studies [20]. Our approximately 84 min recordings represent an intermediate duration; the between-subject differences we observed—particularly the elderly male’s low RMSSD and the young female’s extreme SD1/SD2 ratio—are likely to reflect genuine autonomic phenotypes rather than sampling variability, as comparable patterns have been reported in population-level ambulatory ECG analyses [22,23]. A nationwide ambulatory ECG cohort analysis by Yuda and Hayano confirmed that autonomic nervous system activity varies systematically across age and sex groups, consistent with our observation that the elderly male showed the most blunted HRV across all metrics [23].
The striking SDNN–RMSSD dissociation in the young female participant (SDNN = 95.09 ms, RMSSD = 20.30 ms, SD1/SD2 = 0.107) deserves particular attention from a long-term monitoring perspective. Cyclic variation of heart rate during extended recording periods reflects the dominance of slow autonomic cycles—sleep–wake rhythm, thermoregulatory variation, and circadian neuroendocrine modulation—over fast vagally mediated beat-to-beat modulation [21]. Hayano and Yuda showed that sleep apnoea generates characteristic cyclic HR patterns detectable only in long-term recording [21]; similarly, extended recording in our young female participant would be expected to reveal strong circadian SDNN accumulation, while RMSSD remaining low may reflect a sympathetically biased resting autonomic balance. The ALLSTAR study established that SDNN and RMSSD capture largely orthogonal risk dimensions—long-term autonomic modulation versus short-term vagal tone—and that reporting only one obscures clinically important phenotypic distinctions [22]. This underscores the importance of reporting multiple HRV metrics in wearable ECG studies.
Across the 300-record cohort (00040–00350), the mean Lead II amplitude (0.734 mV) exceeded Lead I (0.667 mV), consistent with the predominance of inferior-axis ECGs in this clinical cohort. Pathological classes showed elevated amplitudes, HYP (Lead I 0.997 mV; Lead II 1.219 mV) and MI (Lead I 0.742 mV; Lead II 0.503 mV), with MI showing a reversed ratio (Lead I > Lead II) consistent with anterior infarction patterns. This finding has direct implications for automated ECG classification. As shown in Section 2.2, the 12-lead ECG encodes the full cardiac electrical vector in eight measured channels, enabling vectorcardiographic reconstruction via Dower or Kors transformation. Single-lead wearable devices capture only the horizontal component of this vector (Lead I: LA − RA), losing the inferior and precordial spatial information that distinguishes arrhythmia subtypes, accessory pathway locations [4,5], and MI territories [1,2]. Deep learning models trained on 12-lead recordings—such as the ResNet-50 architecture validated by Sakli et al. [12] and the multi-class arrhythmia classifier of Yang and Ji [13]—may exhibit reduced sensitivity when applied to single-lead configurations because spatially discriminative features encoded in the precordial leads (V1–V6) are absent. The correct recording technique and electrode positioning are essential prerequisites for diagnostic-quality 12-lead ECG [8,9], and any deviation—as in ambulatory or wearable settings—introduces morphological variability that must be accommodated by lead-adaptive detection algorithms.
The 3-channel Holter framework occupies a clinically important intermediate position between the 12-lead and single-lead modalities. Its utility for continuous ST-segment monitoring has been validated in the GUSTO-I trial, where non-invasive prediction of coronary reperfusion was achieved by continuous ST analysis [16]. Holter-based RR-interval monitoring can detect pre-arrhythmic irregularities before overt events; Lemmert et al. showed that RR-interval irregularity precedes ventricular fibrillation in acute STEMI, with a detectable lead time of several minutes [18]. Modern mobile health platforms have extended these capabilities; Santala et al. demonstrated that an automatic arrhythmia monitoring algorithm achieves acceptable AF detection accuracy in a prospective mHealth study [14], while Karimizadeh et al. evaluated an AF burden tracking algorithm against public and clinical ECG datasets, establishing a benchmarking framework applicable to HRV metric comparison [15]. Inter-lead differences in repolarisation dynamics—reported by Szydlo et al. for anterior MI [17]—confirm that morphological information is non-uniformly distributed across ECG leads, which supports multi-channel recording as the gold standard reference for inter-lead comparison studies.
A practically important consequence of the 12-lead mathematical structure is that Lead I —the wearable modality studied here—can be extracted exactly from the 12-lead ECG, because Lead I (LA − RA) is one of the eight independently measured channels (Equation: IAEO = I12-lead). This correspondence enables several analytical strategies. First, 12-lead datasets such as PTB-XL serve directly as surrogate wearable datasets by extracting Lead I, allowing large-scale HRV benchmark studies without recruiting additional participants [10,11]. Second, controlled noise injection into the extracted Lead I signal permits realistic simulation of wearable-grade recordings—motion artefacts, baseline wander, and skin impedance noise—for training AI-based signal quality assessment models [12,13]. Third, AI arrhythmia classification using Lead I alone achieves high accuracy for rhythm-based tasks such as AF detection and normal/abnormal classification, as demonstrated in multiple studies using lead-reduced representations [14,15]. Conversely, extraction of Lead I from 12-lead ECG preserves the R-wave timing information necessary for HRV but forfeits all precordial spatial information. The following capabilities are definitively not achievable from single-lead (Lead I) ECG: reconstruction of V1–V6 chest leads (which require independent electrode positions); localised ST-segment deviation diagnosis (which requires the precordial leads to distinguish anterior, inferior, and lateral MI territories [1,2]); and physical VCG reconstruction (which requires all eight channels). These information-theoretic boundaries define the clinical scope of wearable Lead I devices and motivate the development of AI models that learn spatial ECG representations from single-lead inputs [12,13]. Table 6 summarises the feasibility of common ECG signal conversions relevant to HRV, Holter, and wearable research.
Table 6.
Feasibility of ECG lead/modality conversions relevant to wearable cardiac monitoring and AI-based analysis. VCG: vectorcardiogram (Frank leads X, Y, Z); latent VCG: VCG-like representation learned by an AI model.
An important implication of the 12-lead mathematical framework (Section 2.2) concerns the potential of vectorcardiography (VCG) as a feature space for AI-based ECG analysis. Because the VCG compresses the eight-channel 12-lead ECG into three orthogonal Frank lead axes (X, Y, and Z) via the Dower or Kors transformation, it offers several advantages for machine learning. First, the dimensionality reduction from eight channels to three axes stabilises convolutional neural network (CNN) and transformer training, reducing overfitting in small-to-medium datasets—a consideration particularly relevant when working with heterogeneous Holter cohorts [12,13]. Second, the VCG explicitly encodes the spatial direction of cardiac electrical activity: the QRS loop direction identifies ventricular activation pathways and aids arrhythmia localisation [4,5]; the ST-loop deviation quantifies ischaemic burden with geometric specificity [16]; and the T-loop orientation reflects repolarisation abnormalities associated with MI territory [1,2,17]. These spatially structured features are more interpretable by AI models than raw lead waveforms, improving the clinical relevance of explainability methods such as Grad-CAM and attention maps. Third, the VCG is more robust to electrode displacement, skin impedance variability, and motion artefacts than individual 12-lead waveforms, making it particularly suitable for Holter and wearable ECG data where signal quality is variable [24]. Fourth, because the VCG captures the cardiac electrical vector independently of the specific electrode positions used in any individual recording, it reduces inter-individual electrode placement variability—a major source of performance degradation when 12-lead-trained AI models are applied to recordings from different device configurations [12,13]. The critical limitation is that VCG reconstruction requires the complete 8-channel 12-lead ECG: it is not feasible from 3-channel Holter data or from single-lead wearable ECG. However, recent developments in self-supervised representation learning have demonstrated that VCG-like latent representations can be learned from limited-lead recordings, offering a pathway toward VCG-quality feature extraction even from Lead I-only wearable devices [10,11].
Beyond signal conversion feasibility, the three ECG modalities fundamentally differ in their clinical purpose and the physiological information they capture (Table 7). The 12-lead ECG is an acute diagnostic instrument: its 14 electrodes (10 precordial/limb + 4 for reference) yield eight measured channels that maximise spatial coverage of cardiac electrical activity, enabling localisation of myocardial infarction [1,2], ischaemic territory [16], ventricular arrhythmia origin [4], and conduction pathway abnormalities [5]. However, its recording duration of seconds to minutes precludes heart rate variability analysis [6] and renders it incapable of capturing the dynamic fluctuations in autonomic nervous activity that underlie physiological state estimation. The 3-channel Holter monitor bridges this gap: 24–48 h of continuous recording from Lead II, CM5, and CS5 channels provides the time-series data volume required for full frequency- and time-domain HRV analysis, circadian rhythm characterisation, and arrhythmia burden quantification [14,15]. Holter-derived HRV indices are the current gold standard for non-invasive assessment of autonomic function, stress, fatigue, and immune system status [20,21,22,23]; as demonstrated in the present study, older participants exhibited significantly lower LF power and LF/HF ratio—physiological signatures of immune ageing that are entirely invisible on a 12-lead snapshot. Wearable single-lead devices further extend monitoring to 24/7 continuous recording, enabling longitudinal tracking of HRV decline, nocturnal HRV reduction, blunted stress reactivity, and delayed fatigue recovery—all established markers of immune senescence—in everyday environments [18,23]. Their limitation is the near-complete absence of spatial cardiac electrical information [10,11]; ischaemia localisation, infarct territory mapping, and conduction pathway diagnosis are not feasible from Lead I alone. These complementary strengths position the three modalities as distinct tools for distinct clinical questions, rather than interchangeable alternatives. Table 7 summarises this purpose-specific comparison across key dimensions relevant to autonomic and cardiovascular research.
Table 7.
Comparison of 12-lead ECG, 3-channel Holter, and single-lead wearable ECG by clinical purpose and physiological information content.
Several limitations of the present study require explicit acknowledgement; each is addressed in turn below.
First, and most importantly, the role of the PTB-XL dataset must be precisely circumscribed. PTB-XL 10 s recordings were used exclusively for inter-lead agreement analysis—that is, to quantify the concordance of RR-interval sequences between Lead I and Lead II—and not for heart rate variability (HRV) evaluation. HRV computation requires continuous recordings of a minimum of 5 min (short-term HRV) or 24 h (long-term HRV); a 10 s record yields only approximately 10 RRI pairs, an entirely insufficient basis for any HRV metric. All HRV results in this study (SDNN, RMSSD, pNN50, SD1, and SD2) were therefore derived exclusively from the 3-channel Holter recordings. The inter-lead agreement statistics reported here reflect short-term RRI concordance rather than full HRV metrics; this distinction must be kept in mind when interpreting population-level ICC values.
Second, while the PTB-XL analysis covers 300 records (00040–00350) across five diagnostic superclasses (NORM n = 179, MI n = 46, CD n = 26, HYP n = 12, STTC n = 36), four remaining limitations apply. (1) The 10 s recording duration is insufficient for traditional HRV analysis (requires ≥5 min); findings reflect short-term RRI concordance rather than full HRV metrics. (2) Only Leads I and II were compared; full 12-lead inter-lead agreement analysis was beyond the scope of this study. (3) The Pan–Tompkins algorithm was tuned for the clean ECG signals in PTB-XL; performance in noisy wearable signals (motion artefacts and skin impedance variability) may differ substantially. (4) The Holter arm remains n = 4 participants; generalisation of Holter HRV findings requires a fully powered cohort study with n ≥ 30 per age-sex group.
Third—and most critically relative to the study title—the Holter HRV evaluation is based on only four participants (n = 4: one elderly male aged 72, one elderly female aged 68, one young male aged 22, and one young female aged 24). The title of this article includes the phrase “Comparative Evaluation of Heart Rate Variability Metrics,” yet the HRV component of this comparison rests on a single-digit sample size. This is the study’s most significant limitation: n = 4 is sufficient to demonstrate analytical feasibility and to observe the expected inter-individual HRV range (SDNN 37–81 ms; RMSSD 27–68 ms, consistent with published normative values), but it does not support group-level statistical inference, age–sex interaction testing, or generalisable HRV comparison conclusions. This study should therefore be regarded as a pilot feasibility study rather than a fully powered comparative evaluation. The PTB-XL inter-lead agreement arm (n = 300 records) is substantially more robust and is the primary quantitative contribution of this work. A fully powered confirmatory study with n ≥ 30 participants per age-sex group, extended recordings of ≥7 days, and simultaneous multi-lead capture would be required to characterise inter-lead HRV agreement with adequate statistical precision [20,21]. Future studies should benchmark single-channel patch performance against the 3-lead Holter standard [19], evaluate mobile health arrhythmia detection algorithms [14] across lead configurations, and perform the type of large-scale redundancy analysis demonstrated in the ALLSTAR study [22].
5. Conclusions
We have presented an analytical framework and pilot results for the comparative evaluation of HRV metrics across 12-lead ECG (PTB-XL database), 3-channel Holter ECG (Suzuken Pico303), and single-lead (Lead I) ECG. Our key findings are as follows:
(1) Lead I–Lead II RRI agreement: Analysis of 300 PTB-XL records (00040–00350) revealed mean bias of −1.4 ms for NORM records (ICC(2,1) = 0.841, r = 0.844, 95% LoA [−52.4, +49.7] ms) and progressively lower concordance in pathological categories (MI: r = 0.659; CD: r = 0.433; HYP: r = 0.556; STTC: r = 0.635). Overall pooled Pearson r = 0.740 and ICC(2,1) = 0.745 (n = 300).
(2) R-wave amplitude: Lead II exhibited higher mean R-wave amplitude (0.734 mV) than Lead I (0.667 mV) across the 300-record cohort. HYP showed the highest amplitudes (Lead I 0.997 mV; Lead II 1.219 mV). MI showed a reversed ratio (Lead I 0.742 mV > Lead II 0.503 mV), consistent with anterior infarction axis. This amplitude difference has implications for adaptive R-peak detection algorithm design.
(3) Holter HRV profiles: Holter recordings from four participants demonstrated significant inter-individual HRV heterogeneity. Elderly subjects showed lower parasympathetic indices than young adults, with notable sex-based differences. The dissociation between SDNN and RMSSD in the young male subject highlights the importance of reporting multiple HRV metrics.
These findings from 300 PTB-XL records spanning five diagnostic superclasses support the utility of wearable single-lead (Lead I) ECG for RRI estimation and time-domain HRV monitoring in normal ECG populations, while revealing substantially lower inter-lead concordance in pathological categories. Lead-specific R-wave morphology and cardiac axis deviation remain sources of systematic bias that warrant algorithm-level correction. Simultaneous Holter–wearable recording in a larger cohort, combined with frequency-domain and non-linear HRV analysis from long-duration recordings, constitutes the necessary next step to definitively characterise the interchangeability of these three modalities in clinical HRV research.
Author Contributions
Conceptualisation, E.Y.; methodology, E.Y.; software, E.Y.; validation, E.Y. and N.M.; formal analysis, N.M.; investigation, E.Y. and N.M.; resources, E.Y.; data curation, N.M.; writing—original draft preparation, E.Y.; writing—review and editing, E.Y.; visualisation, E.Y.; supervision, E.Y.; project administration, E.Y. All authors have read and agreed to the published version of the manuscript.
Funding
This research received no external funding.
Institutional Review Board Statement
The study was conducted in accordance with the Declaration of Helsinki. Ethics approval for the human Holter ECG recordings was obtained from the Ethics Review Committee of the Graduate School of Engineering, Mie University (approval number: 155; approved 4 February 2026). Written informed consent was obtained from all participants.
Data Availability Statement
The PTB-XL dataset is publicly available at https://physionet.org/content/ptb-xl/1.0.3/ (accessed on 9 October 2026) under the Creative Commons Attribution 4.0 licence. The Holter ECG recordings from human participants are not publicly available due to privacy restrictions but may be shared upon reasonable request to the corresponding author, subject to institutional data-sharing agreements. DeepL (paid version; DeepL SE, Cologne, Germany) was used to assist with English language translation and editing of the manuscript. Figures were generated with the assistance of Claude Code Opus 4.5 (Anthropic, San Francisco, CA, USA), which also supported Python analysis code development for signal processing and HRV computation. All scientific content, data interpretation, and conclusions were produced and verified by the authors.
Conflicts of Interest
The authors declare no conflicts of interest.
References
- Parker, A.B., 3rd; Waller, B.F.; Gering, L.E. Usefulness of the 12-lead electrocardiogram in detection of myocardial infarction: Electrocardiographic-anatomic correlations—Part I. Clin. Cardiol. 1996, 19, 55–61. [Google Scholar] [CrossRef] [Scilit] [PubMed]
- Parker, A.B., 3rd; Waller, B.F.; Gering, L.E. Usefulness of the 12-lead electrocardiogram in detection of myocardial infarction: Electrocardiographic-anatomic correlations—Part II. Clin. Cardiol. 1996, 19, 141–148. [Google Scholar] [CrossRef] [Scilit] [PubMed]
- Narayanan, K.; Chugh, S.S. The 12-lead electrocardiogram and risk of sudden death: Current utility and future prospects. Europace 2015, 17, ii7–ii13. [Google Scholar] [CrossRef] [Scilit] [PubMed]
- Enriquez, A.; Baranchuk, A.; Briceno, D.; Saenz, L.; Garcia, F. How to use the 12-lead ECG to predict the site of origin of idiopathic ventricular arrhythmias. Heart Rhythm 2019, 16, 1538–1544. [Google Scholar] [CrossRef] [Scilit] [PubMed]
- Crinion, D.; Baranchuk, A. Algorithms to identify accessory pathways’ location on the 12-lead electrocardiogram. Card. Electrophysiol. Clin. 2020, 12, 465–474. [Google Scholar] [CrossRef] [Scilit] [PubMed]
- Suba, S.; Woo, N.; Dzikowicz, D.J.; Kozik, T.M.; Pelter, M.M. Value of a 12-lead electrocardiogram for assessing P waves. Am. J. Crit. Care 2022, 31, 431–432. [Google Scholar] [CrossRef] [Scilit] [PubMed]
- Kalahasty, G.; Ellenbogen, K.A. Simpler is better: New lessons learned from the 12-lead electrocardiogram. Circulation 2010, 121, 617–619. [Google Scholar] [CrossRef] [Scilit] [PubMed]
- McStay, S. Recording a 12-lead electrocardiogram (ECG). Br. J. Nurs. 2019, 28, 756–760. [Google Scholar] [CrossRef] [Scilit] [PubMed]
- Pooranachandran, V. How to undertake and record a 12-lead electrocardiogram. Nurs. Stand. 2025, 40, 62–67. [Google Scholar] [CrossRef] [Scilit] [PubMed]
- Tooley, J.E.; Turakhia, M.P. Is it time for a consumerized or home-based 12-lead electrocardiogram? Europace 2022, 24, 357–358. [Google Scholar] [CrossRef] [Scilit] [PubMed]
- Yoon, S.; Kim, T.; Kang, E.; Heo, S.; Chang, H.; Seo, Y.; Cha, W.C. Feasibility of patch-type wireless 12-lead electrocardiogram in laypersons. Sci. Rep. 2023, 13, 4044. [Google Scholar] [CrossRef] [Scilit] [PubMed]
- Sakli, N.; Ghabri, H.; Soufiene, B.O.; Almalki, F.A.; Sakli, H.; Ali, O.; Najjari, M. ResNet-50 for 12-lead electrocardiogram automated diagnosis. Comput. Intell. Neurosci. 2022, 2022, 7617551. [Google Scholar] [CrossRef] [Scilit] [PubMed]
- Yang, X.; Ji, Z. Automatic classification method of arrhythmias based on 12-lead electrocardiogram. Sensors 2023, 23, 4372. [Google Scholar] [CrossRef] [Scilit] [PubMed]
- Santala, O.E.; Halonen, J.; Martikainen, S.; Jäntti, H.; Rissanen, T.T.; Tarvainen, M.P.; Laitinen, T.P.; Laitinen, T.M.; Väliaho, E.S.; Hartikainen, J.E.K.; et al. Automatic mobile health arrhythmia monitoring for the detection of atrial fibrillation: Prospective feasibility, accuracy, and user experience study. JMIR Mhealth Uhealth 2021, 9, e29933. [Google Scholar] [CrossRef] [Scilit] [PubMed]
- Karimizadeh, A.; Mahnam, A.; Beheshti, S.; Moineau, B.; Alizadeh-Meghrazi, M.; Khaykin, Y. Clinical performance of an atrial fibrillation burden tracking algorithm: Evaluation against reference public and clinical textile electrocardiographic datasets. Heart Rhythm O2 2026, 7, 1077–1085. [Google Scholar] [CrossRef] [Scilit] [PubMed]
- Klootwijk, P.; Langer, A.; Meij, S.; Green, C.; Veldkamp, R.F.; Ross, A.M.; Armstrong, P.W.; Simoons, M.L. Non-invasive prediction of reperfusion and coronary artery patency by continuous ST segment monitoring in the GUSTO-I trial. Eur. Heart J. 1996, 17, 689–698. [Google Scholar] [CrossRef] [Scilit] [PubMed]
- Szydlo, K.; Wita, K.; Trusz-Gluza, M.; Filipecki, A.; Orszulak, W.; Urbanczyk, D.; Tabor, Z. Dynamicity of early and late phases of repolarization in patients with remote anterior myocardial infarction: The interlead differences. Ann. Noninvasive Electrocardiol. 2012, 17, 101–107. [Google Scholar] [CrossRef] [Scilit] [PubMed]
- Lemmert, M.E.; Majidi, M.; Krucoff, M.W.; Bekkers, S.C.; Crijns, H.J.; Wellens, H.J.; Kosinski, A.S.; Gorgels, A.P. RR-interval irregularity precedes ventricular fibrillation in ST elevation acute myocardial infarction. Heart Rhythm 2010, 7, 65–71. [Google Scholar] [CrossRef] [Scilit] [PubMed]
- Smith, W.M.; Riddell, F.; Madon, M.; Gleva, M.J. Comparison of diagnostic value using a small, single channel, P-wave centric sternal ECG monitoring patch with a standard 3-lead Holter system over 24 hours. Am. Heart J. 2017, 185, 67–73. [Google Scholar] [CrossRef] [Scilit] [PubMed]
- Hayano, J.; Yuda, E. Enhanced detection of abnormalities in heart rate variability and dynamics by 7-day continuous ECG monitoring. Ann. Noninvasive Electrocardiol. 2022, 27, e12897. [Google Scholar] [CrossRef] [Scilit] [PubMed]
- Hayano, J.; Yuda, E. Night-to-night variability of sleep apnea detected by cyclic variation of heart rate during long-term continuous ECG monitoring. Ann. Noninvasive Electrocardiol. 2022, 27, e12901. [Google Scholar] [CrossRef] [Scilit] [PubMed]
- Yuda, E.; Ueda, N.; Kisohara, M.; Hayano, J. Redundancy among risk predictors derived from heart rate variability and dynamics: ALLSTAR big data analysis. Ann. Noninvasive Electrocardiol. 2021, 26, e12790. [Google Scholar] [CrossRef] [Scilit] [PubMed]
- Yuda, E.; Hayano, J. Sleep posture and autonomic nervous system activity across age and sex in a clinical cohort: Analysis of a nationwide ambulatory ECG database. Sensors 2025, 25, 5982. [Google Scholar] [CrossRef] [Scilit] [PubMed]
- Guldenring, D.; Finlay, D.D.; Strauss, D.G.; Galeotti, L.; Nugent, C.D.; Donnelly, M.P.; Bond, R.R. Transformation of the Mason-Likar 12-lead electrocardiogram to the Frank vectorcardiogram. Annu. Int. Conf. IEEE Eng. Med. Biol. Soc. 2012, 2012, 677–680. [Google Scholar] [CrossRef] [Scilit] [PubMed]
- Wagner, P.; Strodthoff, N.; Bousseljot, R.-D.; Kreiseler, D.; Lunze, F.I.; Samek, W.; Schaeffter, T. PTB-XL: A large publicly available ECG dataset. Sci. Data 2020, 7, 154. [Google Scholar] [CrossRef] [Scilit] [PubMed]
- Wagner, P.; Strodthoff, N.; Bousseljot, R.; Samek, W.; Schaeffter, T. PTB-XL, a Large Publicly Available Electrocardiography Dataset, version 1.0.3; RRID:SCR_007345; PhysioNet: Cambridge, MA, USA, 2022. [CrossRef]
- Pollard, T.; Moody, B.E.; Lehman, L.; Gow, B.; Fernandes, C.; Xie, C.; Johnson, A.; Mark, R.G.; Heldt, T. PhysioNet as a global platform for biomedical research. Nat. Health 2026, 1, 792–795. [Google Scholar] [CrossRef] [Scilit]

Disclaimer/Publisher’s Note: The statements, opinions and data contained in all publications are solely those of the individual author(s) and contributor(s) and not of MDPI and/or the editor(s). MDPI and/or the editor(s) disclaim responsibility for any injury to people or property resulting from any ideas, methods, instructions or products referred to in the content. |
© 2026 by the authors. Licensee MDPI, Basel, Switzerland. This article is an open access article distributed under the terms and conditions of the Creative Commons Attribution (CC BY) license.