


Abstract
Accurate workload prediction does not necessarily translate into effective proactive offloading because forecast errors affect controller roles differently. This study develops an oracle-intervention framework to examine the decision value of event information, continuous magnitude, and source and destination forecasts within a fixed replay controller. Development-stage diagnostics motivate a lightweight hurdle predictor that separates a threshold-event score from conditional excess magnitude. The event score gates an upward source correction, while destination capacity remains tied to the current state. A data audit identifies future-dependent interpolation in the historical Alibaba evaluation; a post-review reanalysis using causal forward filling retains a modest overload benefit with additional migration work. A supplementary Azure invocation workload provides a second workload family but does not establish superiority over classical forecasts. Historical confirmation, representation ablations, and subsequent sensitivity analyses are explicitly distinguished. The contribution is a diagnostic methodology and a baseline-preserving deployment interface whose utility depends on workload, preprocessing, and migration cost. Cross-controller and real edge-deployment generalization remain open.
1. Introduction
Edge computing places computation and storage near data sources and latency-sensitive users, reducing wide-area communication delay and enabling local control [1,2,3]. Bursty, heterogeneous demand can nevertheless overload individual nodes even when the cluster has sufficient aggregate capacity. Offloading or migration can relieve these nodes, but sensing, planning, and actuation introduce a delay. A controller that relies exclusively on the current state may therefore respond too late.
Forecast-assisted control offers a natural response: estimate the next load vector and use it to guide the current decision. Previous studies have combined prediction with offloading [4], used learned workload distributions for cloud resource allocation [5], and applied recurrent models to autoscaling [6]. These studies establish the practical motivation for anticipation. However, conventional objectives such as mean absolute error, mean squared error, and classification accuracy measure statistical discrepancies without directly accounting for their consequences for control.
This distinction is particularly relevant to proactive offloading because source selection and destination placement have asymmetric requirements. Source selection must identify which nodes are likely to become overloaded and how much work should be removed. Destination placement must identify nodes with sufficient capacity to receive that work. Underestimating source risk can leave overload untreated, whereas overestimating destination capacity can send work to an unsuitable node. Using the same forecast for both roles couples these error pathways, allowing an improvement in average prediction accuracy to coexist with worse placement decisions.
This problem is related to decision-focused and predict-then-optimize learning, which assess predictions through the decisions they induce [7,8,9]. The broader concern that prediction should support action also appears in maintenance research. Di Nardo et al. review Industry 4.0 maintenance approaches that connect predictive analysis with intervention and decision support [10]. We therefore do not claim that the distinction between prediction accuracy and decision value is new. Our specific question is how event and magnitude information affect source selection and destination placement within the same offloading controller and how a deployment interface can preserve the CurrentState baseline.
We investigate these questions through oracle decomposition and an algorithm frozen before the historical evaluation. In development-stage diagnostics, binary transition information yields limited benefit, while continuous future load on currently safe nodes has greater value. Learned destination forecasts can degrade performance, motivating a source-only hurdle interface. A subsequent audit identifies future-dependent interpolation in the historical input pipeline. We therefore report those results as conditional legacy replay evidence, conduct a complete causal preprocessing reanalysis on Alibaba, and add an Azure invocation-arrival proxy workload. The new analyses retain a modest Alibaba benefit but expose limits to cross-workload superiority. They motivate a controller-specific interface rather than a universal design principle.
The contributions are as follows:
- An oracle-intervention framework that separates event information from continuous magnitude and source-side from destination-side information within a fixed controller;
- A source-role hurdle interface that separates the trigger and magnitude of proactive correction, motivated by development-stage diagnostics in the studied replay;
- Two testable deployment invariants: disabling the correction exactly recovers CurrentState and destination state remains unchanged;
- A transparent historical frozen evaluation, a preprocessing audit with complete causal retraining, and a supplementary arrival-workload replay, with paired uncertainty, classical baselines, and joint overload–migration utility sensitivity.
The historical frozen batch samples machine subsets from Alibaba Cluster Trace v2018 under a stress transform and synthetic migration topology. Its algorithm and pass criteria were fixed before that batch, but its input pipeline used bidirectional interpolation. Development diagnostics, representation ablations, and subsequent baseline and robustness analyses share this legacy limitation. Post-review causal retraining and the Azure arrival-proxy analysis are separate follow-up evidence, not an enlargement of the original confirmation. All results are conditional on their workload construction and fixed replay controller; the new Azure results do not establish a general advantage over classical forecasting.
2. Related Work
2.1. Edge Offloading and Predictive Resource Management
Surveys of mobile edge computing identify offloading, resource allocation, and mobility management as central design problems [2,3]. A more recent task-oriented survey distinguishes static and dynamic offloading and examines how task characteristics affect resource allocation and assignment [11]. These perspectives motivate explicit attention to workload dynamics and deployment assumptions. Predictive methods address part of this problem: COME-UP incorporates LSTM-based user-direction prediction into mobile edge offloading [4], while bidirectional LSTM models have been used for Kubernetes autoscaling [6]. Their reported benefits do not, however, establish that a more accurate forecast will improve every downstream controller.
Production traces support empirical evaluation of resource-management methods. Resource Central combines telemetry and prediction to improve allocation in a large cloud platform [5]. Alibaba’s public trace program includes a release covering approximately 4000 machines over eight days [12], while prior characterization work examines co-located long-running and batch workloads [13]. We use machine-usage and metadata records from the 2018 release as inputs to a controlled replay, rather than evaluating Alibaba’s production scheduler.
2.2. Decision-Focused Prediction
Decision-focused learning replaces or supplements statistical loss with downstream decision loss. Task-based learning differentiates through stochastic optimization [7]; Smart Predict-then-Optimize measures the decision error induced by predictions [8]; and related methods integrate combinatorial optimization into learning pipelines [9]. A recent survey systematizes gradient-based and gradient-free approaches and their evaluation challenges [14]. OptNet and differentiable convex optimization layers provide mechanisms for embedding optimization problems within trainable networks [15,16]. Industry 4.0 maintenance research likewise connects predictive analysis with feasible maintenance decisions and intervention support [10]. Our contribution builds on this established prediction-to-action perspective. It uses controlled information interventions to diagnose event, magnitude, and controller-role effects, then imposes baseline-preserving deployment rules. We do not differentiate through the replay controller or claim a new general theory of decision-focused prediction.
2.3. Spatiotemporal Graph Forecasting
Graph-based forecasting models capture dependencies among time series. DCRNN models diffusion on a directed graph [17], and STGCN combines graph convolution with temporal modeling [18]. Graph WaveNet learns an adaptive dependency matrix [19], MTGNN infers relations among multivariate series [20], and AGCRN combines adaptive graph generation with node-specific modeling [21]. These methods motivate testing whether cross-node structure adds useful information to workload forecasts. However, forecasting success in another domain does not establish decision value for offloading. We therefore compare a training-derived correlation graph with a shuffled-graph control. The absence of a significant advantage over this control provides insufficient evidence for a graph-specific contribution in the present experiment.
3. System Model and Control Objective
3.1. Discrete-Time Edge Cluster
Consider edge nodes observed at discrete intervals . Let denote the offered-load ratio at node ; overload occurs when . Given a causal history of length , the controller selects migration work from source to a feasible destination . Actions selected at affect the next interval, making the prediction target. Each node is represented by six signals: CPU, memory, network, disk, memory bandwidth, and a queue proxy.
The six-signal interface is specific to the Alibaba replay. The queue is constructed by the simulator, and the audited memory-bandwidth channel is constant zero because no values pass the loader’s validity rule. The Azure supplementary replay instead supplies one arrival-count load channel. These inputs are not interchangeable measurements of the same physical resources.
The principal closed-loop metric is the proportion of node-time observations that remain overloaded after control:
Secondary metrics comprise timeout rate, an average-latency proxy, and total migration work. CurrentState uses the current replay load , whereas Full Oracle supplies the same controller with the realized next-interval load in the constructed replay . Comparisons therefore estimate the effect of changing controller information within the same constructed replay.
3.2. Oracle-Gap Metric
For a method , the percentage of the CurrentState-to-Full-Oracle overload gap that it closes is
This normalization expresses each improvement relative to the observed one-step benefit of Full Oracle within the fixed controller. It helps distinguish a repeatable but small absolute gain from a large fraction of the oracle gap and provides a common scale for learned and oracle interventions.
4. Decision-Value Decomposition
Section 4, Section 7.1, Section 7.2, Section 7.3 and Section 7.4 report historical experiments using legacy bidirectional imputation. Their intervention effects diagnose the specified imputed replay and motivated model design; they do not demonstrate causally available online telemetry. Section 6.5 documents the audit and follow-up design, and Section 7.5 and Section 7.6 report the new evidence separately.
4.1. Binary Events Versus Continuous Magnitude
The development analysis first considered a binary safe-to-control transition: whether a node below the control threshold would enter a high-load state in the next interval. A learned binary-priority model closed 0.57% of the Full-Oracle gap; substituting perfect event information increased this to 1.42%. This is the observed benefit of the specified binary intervention in the studied controller, not an upper bound for every possible controller using binary information. The intervention identifies an event without supplying the continuous magnitude used to size offloading.
In the same development analysis, interventions exposing continuous future load have greater decision value. Safe-to-control magnitude closes 35.80% of the gap, critical magnitude closes 40.06%, and complete next-state magnitude for currently safe nodes closes 71.02%. These are diagnostic results on development seeds, not estimates from the frozen confirmation. They motivate predicting excess magnitude alongside event occurrence in this replay setting. Table 1 summarizes the development-stage event and magnitude interventions.
Table 1.
Historical development-stage Oracle decomposition under legacy bidirectional imputation.
4.2. Source/Destination Role Asymmetry
A full future-state predictor was then applied to both source urgency and destination room. Despite competitive offline errors, it increased overload relative to CurrentState in the development replay. Role-specific Oracle and learned interventions helped identify this error pathway. Oracle future-hot information used on the source side closed 41.48% of the full gap, and Oracle future-cool information used on the destination side closed 30.11%. However, learned hot-only information produced a small positive gap closure of 1.99%, whereas learned cool-only destination information produced −24.72%. Combining an Oracle source signal with a learned destination signal also eroded the source benefit.
These development-stage results motivate an asymmetric interface for the evaluated controller. A learned forecast may increase the urgency of a currently safe source, but it does not modify the capacity attributed to a destination. Destination ranking therefore uses the current replay state. This restriction controls one observed error pathway; it does not establish that current replay destination state is optimal when workloads fall rapidly or actuation delays differ.
4.3. Deployment-Semantics Audit
An intermediate implementation used . Setting raises every load below 0.90 to 0.90 instead of recovering . Because the same vector also affected destination placement, the implementation reduced apparent destination capacity even with the correction disabled. This run was invalidated by the implementation audit and excluded from the scientific evidence.
The corrected replay enforces two invariants: (I1) setting exactly recovers CurrentState on the source side and (I2) destination risk equals CurrentState for every node and every . On development seeds 7 and 17, the corrected formulation reduced overload by 0.2981 percentage points, closed 8.8068% of the oracle gap, and increased migration work by 7.1524%. The algorithm was then frozen before evaluation on the confirmation seeds.
5. Control-Aligned Source-Role Hurdle Forecasting
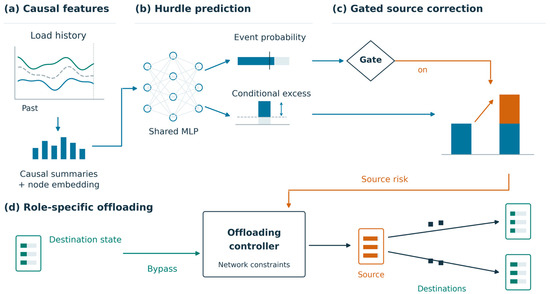
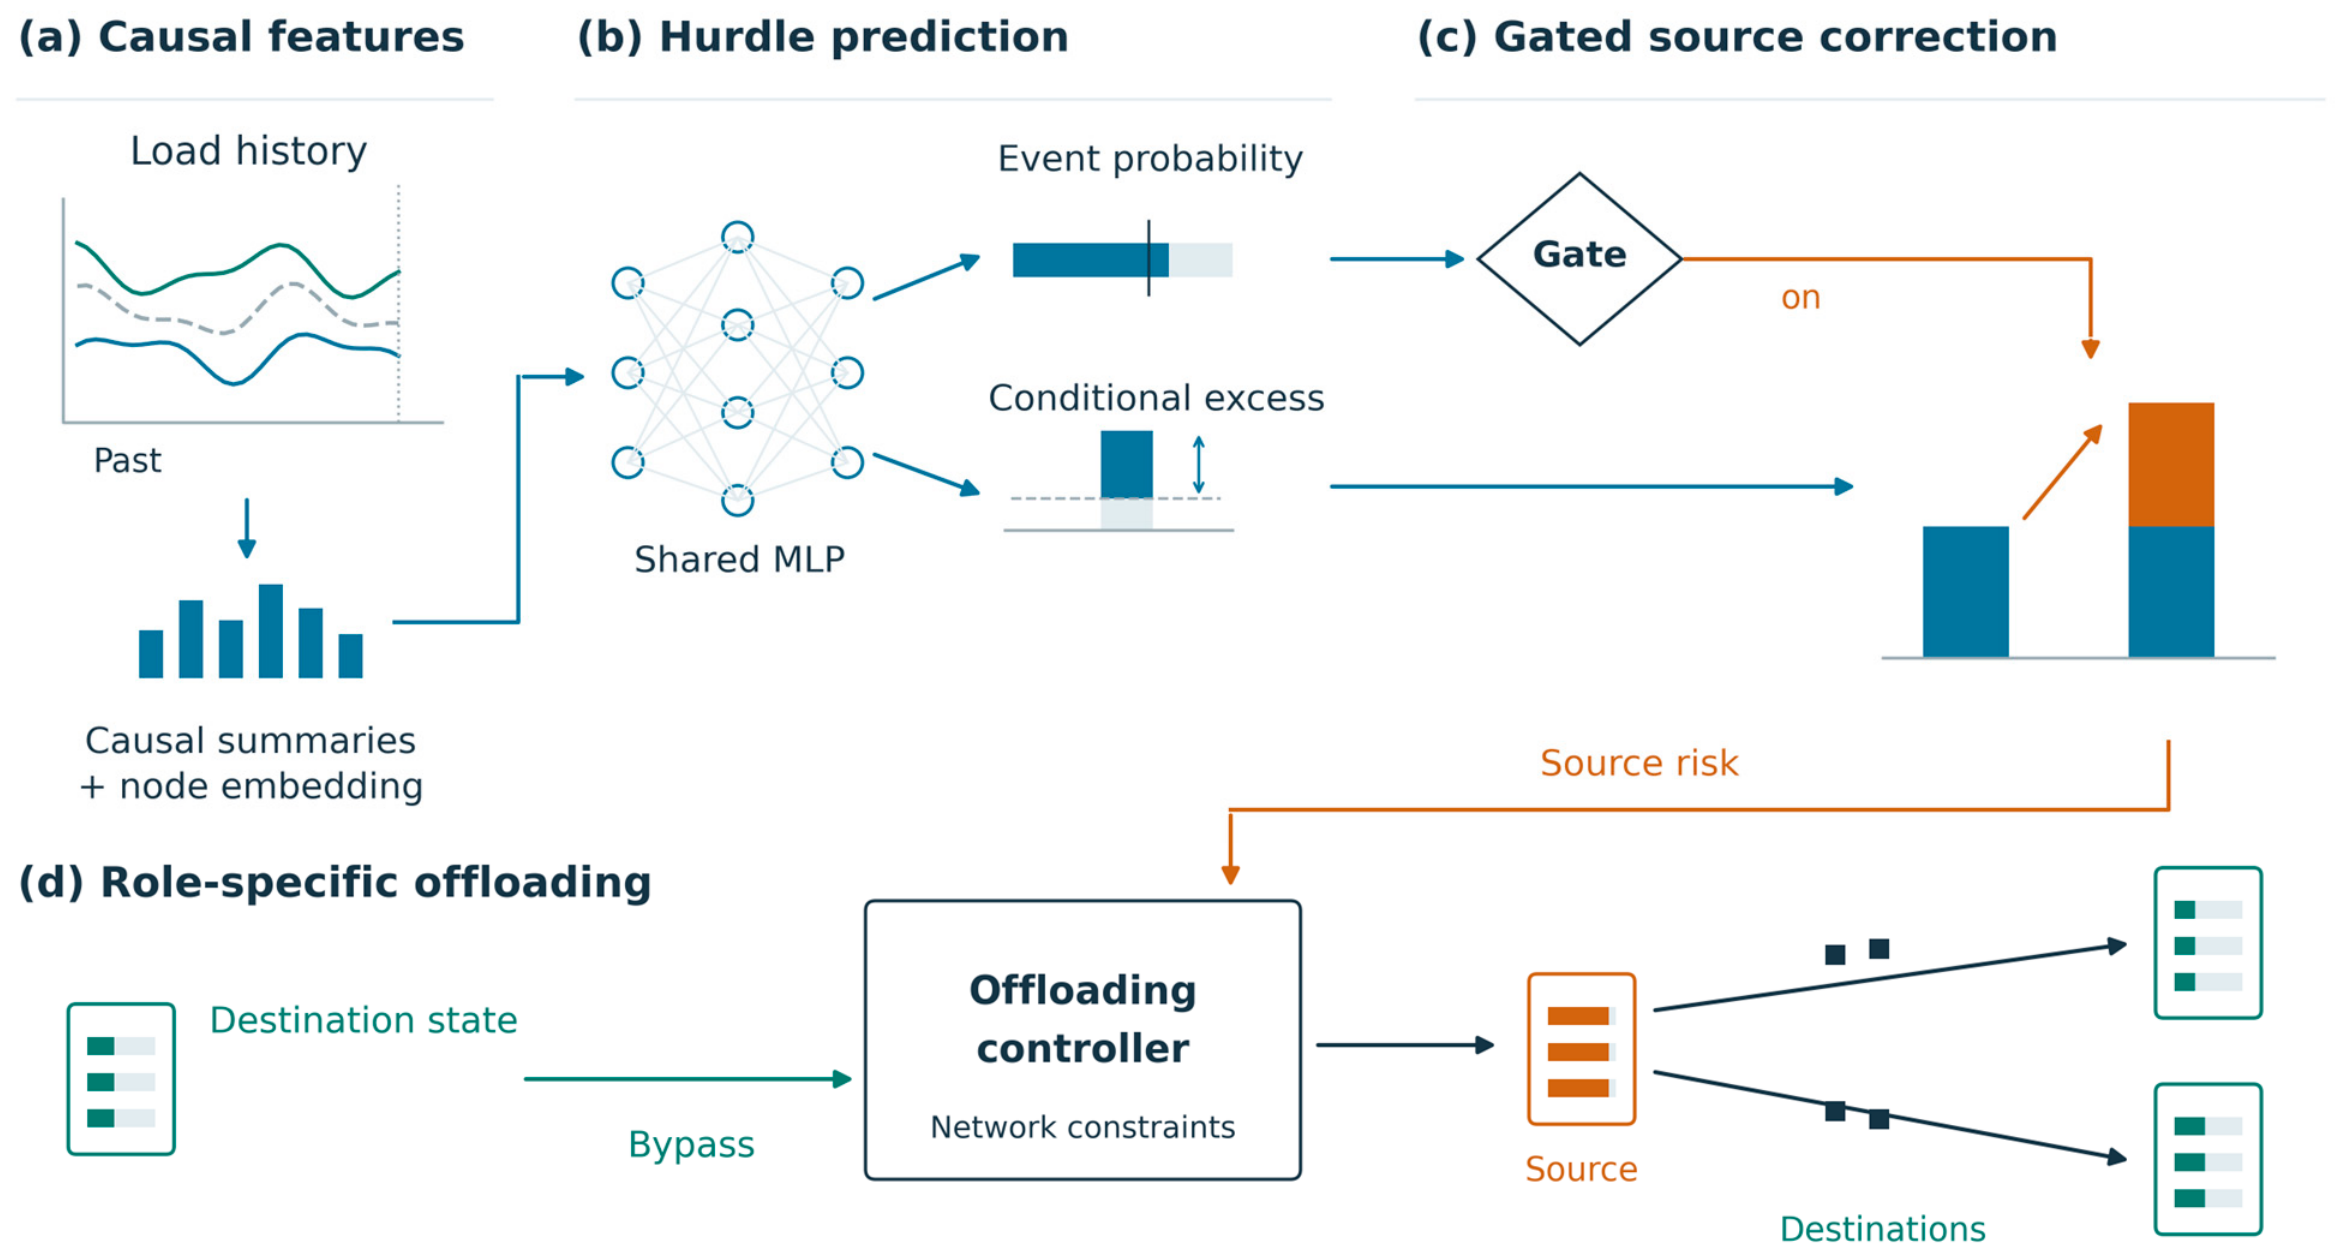
Figure 1 illustrates the source-role hurdle forecasting framework and its deployment interface.
Figure 1.
Source-role hurdle forecasting and deployment. (a) Causal load summaries and node embeddings feed a shared MLP. (b) Separate heads estimate a threshold-event score and conditional excess magnitude. (c) The event score gates the source correction, magnitude determines its size, and the validation-selected scale controls the upward adjustment. A closed gate leaves source risk at current replay load. (d) Current replay destination state bypasses the predictor; source risk, destination capacity, and network constraints guide next-interval offloading. Zero scale recovers CurrentState. All miniature plots and load indicators are schematic and have no empirical axes or units. Causality of the feature summaries assumes that their input history has been processed causally, as in the post-review Alibaba analysis. The event-probability labels in the schematic denote learned scores, without a calibration claim. The destination-state label denotes the current replay input, which may include imputed telemetry. Arrows indicate the direction of information flow, and colors distinguish the functional components.
5.1. Causal Representation and Hurdle Outputs
The dataset interface supplies a history of 72 intervals, but the frozen MLP constructs its temporal representation from, at most, the latest 13 observations. It concatenates the current six-dimensional feature vector, six adjacent differences, four CPU-load differences at lags 1, 3, 6, and 12, and nine CPU summaries: the mean, population standard deviation, and maximum over windows of 3, 6, and 12 intervals. These 25 features are combined with an eight-dimensional node embedding. The shared trunk uses a 64-unit linear layer, layer normalization, GELU, dropout at rate 0.10, and a 32-unit linear layer followed by GELU, before the two output heads:
The event-score output is trained to predict whether next-interval load will exceed the target ; estimates the conditional positive excess above that target. This separation of occurrence and positive magnitude is conceptually related to two-part models for limited dependent variables [22]. Here, the components serve distinct control functions. Their product serves as an expected-excess proxy in the training objective. The weighted classification loss does not establish probability calibration. Deployment uses the event score to gate the correction and the magnitude estimate to size it.
The event head targets exceedance of the load target 0.90, whereas the replay overload metric uses load greater than 1. These events are distinct. The target defines an early-warning level for proactive control; the head output has not been established as a calibrated probability of an overload violation.
5.2. Control-Aligned Training Loss
Training supervision is restricted to nodes with current load at or below the control threshold , matching the population eligible for proactive correction. The objective combines weighted binary cross-entropy, a hot/cool-balanced loss on expected excess, and a conditional magnitude loss evaluated on the hot subset:
The positive-class weight is the training negative-to-positive ratio among currently safe nodes, clipped to [1,12], with weight one when no positive examples exist. Geometry loss gives equal weight to the hot and cool subset means of SmoothL1 error between the expected-excess proxy and the true positive excess above 0.90; an empty subset contributes zero. Magnitude loss is SmoothL1 error on hot nodes only. If a batch contains no currently safe nodes, its loss is zero. AdamW uses a learning rate of 0.0004, weight decay of 0.0001, and gradient-norm clipping at one. Training uses batches of 256 for, at most, 60 epochs, stops after 10 epochs without sufficient validation-loss improvement, and restores the best validation checkpoint. Fitting and gate selection use their assigned chronological prefixes. Strict exclusion of future information also requires causal input processing; the legacy pipeline does not meet that requirement, as disclosed in Section 6.5.
5.3. Validation-Only Deployment Selection
For each seed, the event-score threshold and magnitude scale are selected using only the validation split. The scale grid is 0 to 1.50 in steps of 0.05; the event-score-threshold grid is 0.50 to 0.90 in steps of 0.05. Selection minimizes the balanced source error over future-hot and future-cool subsets of currently safe nodes. Ties favor a smaller scale and then a higher event-score threshold. The frozen 10 seeds select scales from 0.40 to 0.90 and event-score thresholds from 0.50 to 0.75. At test time, the source arrival-load estimate is computed as
when and ; otherwise . Destination risk is always
For a nonnegative scale , this interface can only increase source risk. It neither reduces source urgency nor increases apparent destination capacity. Equation (6) also satisfies the zero-scale identity by construction.
Equations (6) and (7) provide arrival-load estimates to the controller. The controller projects current queued work through service in the current interval and adds the remaining backlog to predicted arrivals in the target interval. It then ranks sources by projected source load and feasible destinations by the CurrentState-based destination projection. Thus, the source-only correction changes the arrival estimate, while both projections retain the controller’s backlog accounting.
6. Materials and Methods
6.1. Dataset and Replay Scenario
Experiments use the machine-usage and machine-metadata components of Alibaba Cluster Trace v2018 [12]. The release covers approximately 4000 machines over eight days. Each seed deterministically selects 50 machines, with measurements aggregated into 300 s intervals for a 48 h replay. The trace supplies production-derived temporal and cross-machine observations; the controller, migration topology, and stress transformation are experimental constructs.
The historical loader first fills missing telemetry by bidirectional interpolation and then scales CPU utilization from the nominal training prefix, targeting a training 95th percentile of 1.5 subject to a scale cap of six and a load cap of three. Using the training prefix for scaling does not make the preceding interpolation causal. Consequently, historical overload intensity and intervention effects describe this constructed offline stress replay. The post-review analysis changes the imputation and recalibrates scale on the resulting training prefix, as detailed in Section 6.5.
6.2. Network and Control Configuration
Prediction graphs and migration graphs serve separate purposes. Graph ablations use an absolute-load correlation graph constructed from the nominal training prefix of the legacy-filled data, with at most four neighbors per node and a minimum absolute correlation of 0.10. The chronological prefix limits graph fitting, but preceding bidirectional filling can still introduce later observations. Migration feasibility is defined by a seed-deterministic sparse ring lattice with nominal degree four. Migration efficiency is 0.94, the edge bandwidth ratio is 0.6, the action lead is one interval, and additional migration delay is zero. Table 2 summarizes the historical frozen configuration and the nominal control settings retained in the follow-up analyses.
Table 2.
Historical frozen configuration and retained nominal control settings.
6.3. Data Splits and Confirmation Discipline
Analysis-stage labels are used as follows: M6 denotes the historical frozen 10-seed batch; M7 denotes post-confirmation representation ablations; and M9 denotes post-confirmation baseline, robustness, and efficiency analyses. All three use the legacy bidirectionally imputed Alibaba input. Development diagnostics precede M6. The post-review causal Alibaba and Azure arrival-proxy experiments are additional analyses and are not labeled M6 confirmation.
Each 48 h trace is split chronologically into 65% training, 15% validation, and 20% test. Development seeds 7 and 17 were used for mechanism diagnosis, implementation audit, and method design; they are excluded from final confirmation statistics. After freezing the algorithm, the first fresh set comprised seeds ; the second pre-specified set comprised . Together they form the 10-seed confirmation set.
The pass criteria, recorded in a frozen pre-run manifest before the confirmation batch, were: improvement in at least 8/10 seeds, mean Full-Oracle gap closure of at least 5%, mean migration increase no greater than 15%, and mean timeout change no greater than +0.05 percentage points. This manifest was a local reproducibility control, not a public study registration. Fitting and deployment selection use their assigned training and validation prefixes. However, legacy interpolation precedes this split and can access future observations; the frozen manifest therefore documents the experiment protocol, not strict causal isolation of its inputs.
6.4. Statistical Analysis
Seeds are the paired units of analysis. We report mean paired overload differences and paired bootstrap 95% confidence intervals obtained by resampling seeds [23]. For the primary comparison, an exact two-sided sign-flip test enumerates all sign assignments to the paired differences [24]. Holm correction is applied separately within the stated comparison families [25]. Representation analyses (M7) and baseline and robustness analyses (M9) reuse the confirmation seeds after observation of the primary result; they are therefore treated as post-confirmation descriptive analyses.
Historical seed-level calculations summarize sampled machine subsets conditional on one trace and replay. Different seeds do not imply independent workload families, and overlapping machines or a shared window may induce dependence. New Alibaba analyses retain seed pairing; new Azure analyses average 10 allocation/training seeds within each of seven nonoverlapping windows before pairing by window. Windows still share one production trace. These bootstrap and sign-flip summaries are conditional exploratory uncertainty measures; Holm adjustment does not remove dependence, selection, or preprocessing assumptions.
6.5. Post-Review Data Audit and Supplementary Replays
The raw-aggregate audit reconstructs the legacy six-channel arrays exactly for all 10 nominal seeds. Among 5-min node slots, CPU has no valid record in 35.58–38.77% of the complete 48-h windows and 64.62–67.21% of the actual control-evaluation interval. The latter uses slots 460 through 563 of each 576-slot trace, excluding the final 12 slots. Memory bandwidth has no usable values under the validity rule and becomes constant zero. The metadata records show constant CPU capacity and status for the selected machines; some lack records at time zero, so capacity remains a fixed replay assumption.
The new causal Alibaba pipeline computes valid per-slot means, carries observations forward within each node and channel, and initializes leading or entirely missing values to zero. These zeros stand in for unobserved demand by an explicit simulation convention; they are not evidence of measured zero usage. CPU scale is refitted only on the causally filled training prefix with the same target and caps; queue construction, selected nodes, capacity, control settings, and prediction grids are retained. The comparison tests the complete preprocessing pipeline, including its induced labels and work, rather than the interpolation operator alone. Both legacy and causal conditions are fully retrained with the original architecture and validation rules.
The Azure Functions Invocation Trace 2021 [26] supplies application identifiers, invocation end timestamps, and durations in seconds. The analyzed two-week sample contains 1,980,951 invocations and 119 applications. Arrival time is reconstructed as end time minus duration, and each invocation contributes one arrival to a 300-s bin. Duration is not used to weight work or as a predictor. Empty arrival bins mean zero counted arrivals, unlike missing machine telemetry. The 4032 bins form seven predefined nonoverlapping 48-h windows.
For each Azure window and seed, applications map to 50 virtual nodes by hashing the UTF-8 string “seed: application_identifier” with SHA256, interpreting the first eight digest bytes as an unsigned big-endian integer, and taking that integer modulo 50. The capacity shared by those nodes is the training-prefix 95th percentile of node-slot counts divided by 1.5, with a minimum capacity of one arrival per slot. Counts are divided by capacity and capped at load three; simulated work is clipped consistently. Capacity, topology, and equal-work arrivals are experimental constructs. This is an arrival-count workload replay, not measured Azure CPU, network, or request-level SLA evaluation.
Azure supplies one load channel, producing 15 temporal features plus an eight-dimensional node embedding; the two-head network has 4210 parameters, compared with 4850 for the six-channel Alibaba network. Trunk widths, losses, training settings, and validation grids are unchanged. Each condition is retrained; this evaluates an adapted forecasting scheme, not an Alibaba checkpoint transferred without training. CurrentState, Full Oracle, source-role Oracle, hurdle, seasonal naive, EWMA, linear trend, and AR ridge share each condition’s controller and workload. Only Oracle references are explicitly supplied with future workload information; the legacy condition retains the interpolation leakage disclosed above.
For each new data condition, nine overload comparisons form one Holm family: hurdle and four classical methods versus CurrentState, plus hurdle versus each classical method. All use 20,000 paired bootstrap resamples with seed 20261004 and exact two-sided sign-flip tests. Alibaba pairs 10 seeds. Azure first averages 10 seeds within each window and pairs seven window means, avoiding 70 pseudo-independent observations. Marginal bootstrap intervals are unadjusted and need not agree with discrete multiplicity-adjusted tests. The post-review protocol was saved before execution, after the original study and data audit; it is not an independent preregistered confirmation. The exact sign-flip calculation assumes exchangeable paired signs under the null, and resampling assumes suitable exchangeability of the sampled units; shared trace structure limits interpretation of these conditional summaries.
7. Results
7.1. Historical M6 Confirmation Under Legacy Imputation
As shown in Table 3, the frozen source-role hurdle method reduces overload in all 10 confirmation seeds. The following M6 numbers are retained to document the previously frozen experiment. Its pre-specified criteria were met under the legacy imputed replay; this is not confirmation of strictly online-causal preprocessing. The primary follow-up evidence using causally processed input appears in Section 7.5.
Table 3.
Historical M6 mean performance under legacy bidirectional imputation.
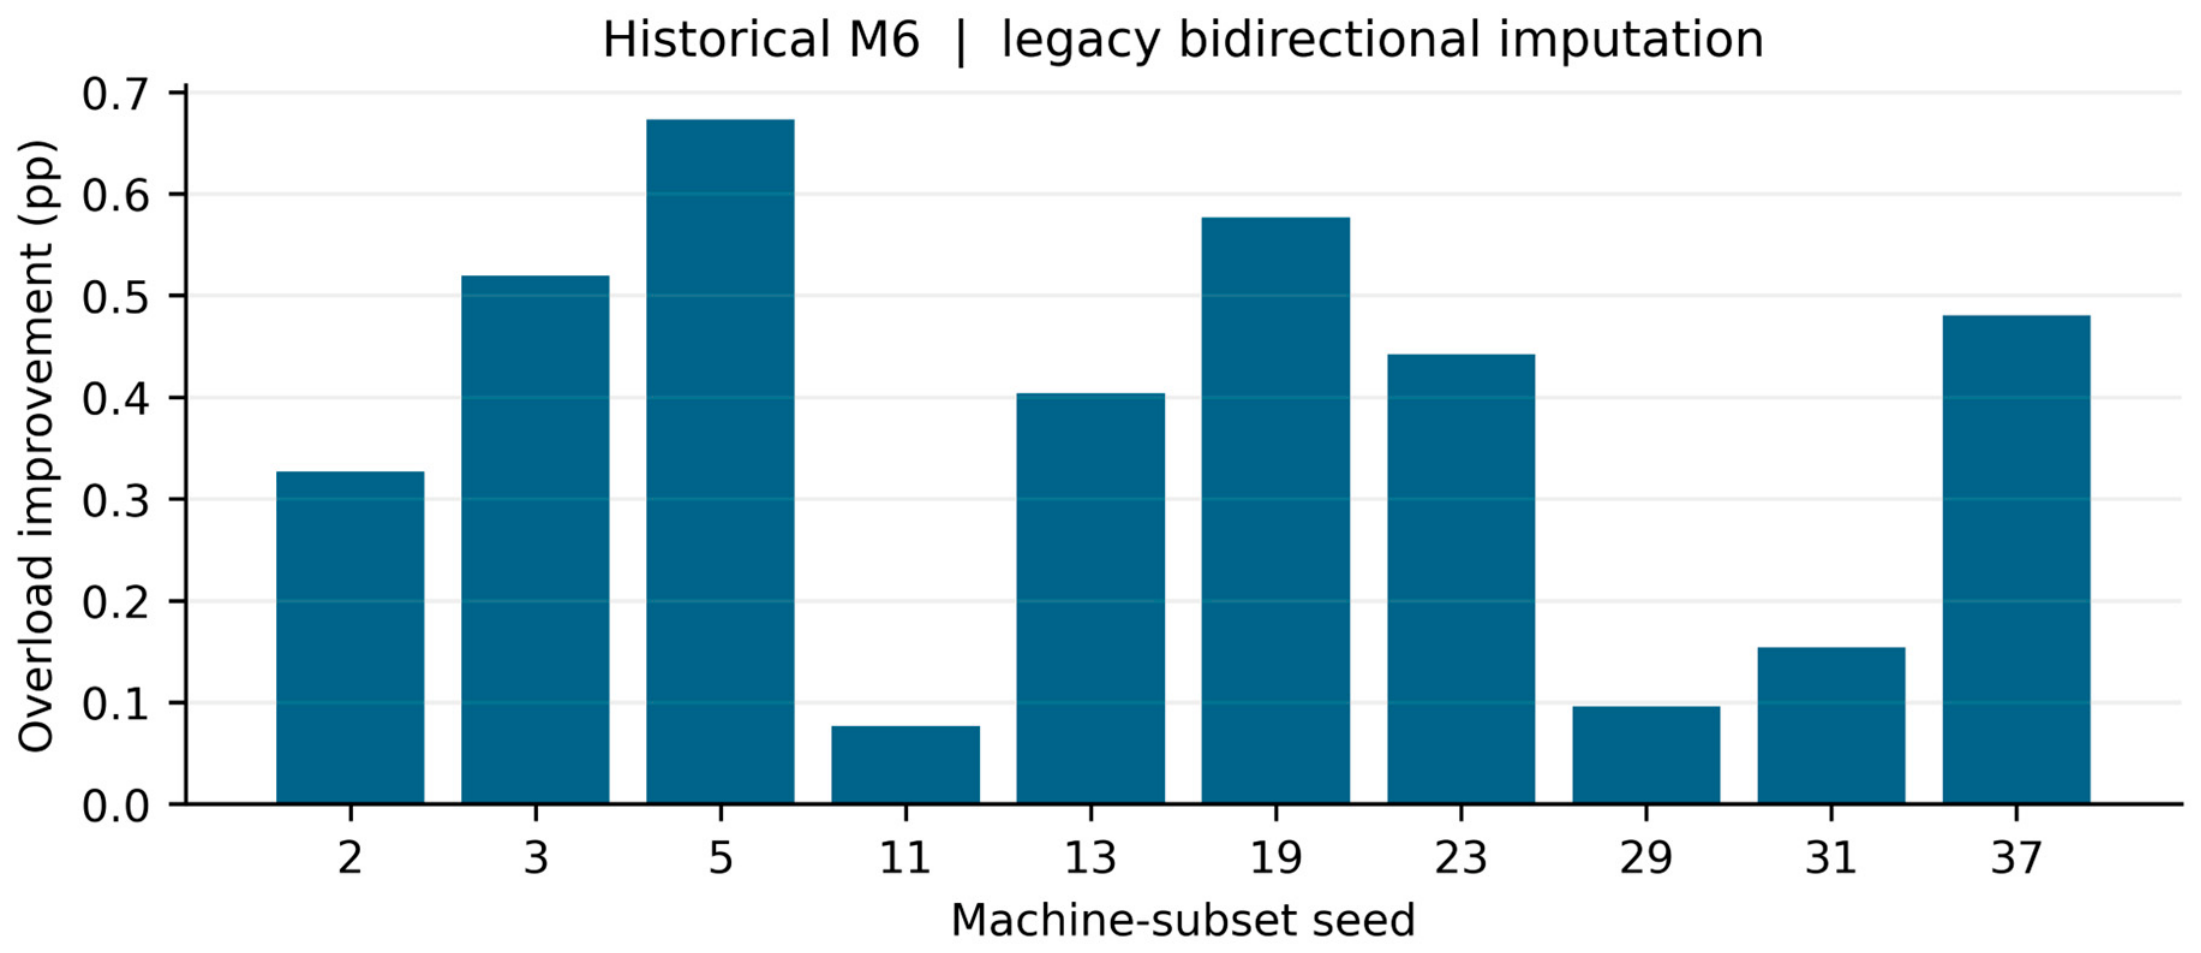
The frozen source-role hurdle method reduces overload in all 10 confirmation seeds. Mean overload falls from 30.7096% under CurrentState to 30.3346%, a paired reduction of 0.3750 percentage points. The paired bootstrap 95% confidence interval for the reduction is 0.2519–0.4942 percentage points, and the exact two-sided sign-flip test gives . The method closes 12.142% of the full Oracle gap. Migration work increases by 9.134%, while timeout changes by −0.00117 percentage points and the latency proxy changes by −0.0695%. All frozen pre-specified criteria pass.
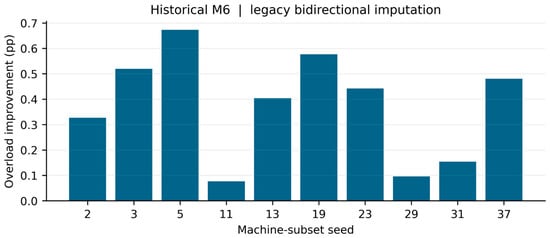
Figure 2 shows the overload improvement for each of the 10 confirmation seeds.
Figure 2.
M6 frozen confirmation. Overload improvement for each of the 10 machine-subset seeds is CurrentState minus the frozen source-role hurdle method in percentage points. Positive bars indicate lower overload. The horizontal axis identifies machine-subset seeds within the same Alibaba trace, not independent datasets. The underlying telemetry uses legacy bidirectional imputation.
The source-role Oracle closes 31.445% of the Full-Oracle gap, and the frozen learned method captures 38.61% of this role-restricted benefit. The remaining gap motivates further source-risk modeling, but additional tuning would require a separate development and evaluation split.
7.2. Representation and Graph Ablations
As shown in Table 4, all four variants in the post-confirmation M7 analysis improve overload relative to CurrentState in all 10 reused seeds. Their exact sign-flip p values are each 0.001953, with Holm-adjusted p = 0.009766 for the five comparisons against CurrentState. This pattern suggests that the observed benefit persists across these representation changes. Because the variants were analyzed after observation of the primary result, the comparisons are exploratory and do not independently confirm component necessity.
Table 4.
Historical M7 representation ablations under legacy bidirectional imputation.
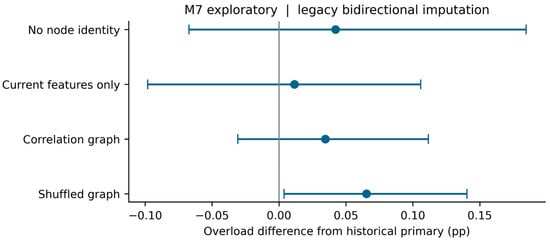
Figure 3 shows the paired overload differences between the representation ablations and the frozen primary method.
Figure 3.
M7 post-confirmation representation analysis. Points show mean paired overload differences between each ablation and the frozen primary method in percentage points. The vertical line marks zero; negative differences favor the ablation and positive differences favor the frozen primary method. Error bars are unadjusted 95% paired percentile-bootstrap confidence intervals over the 10 M6 machine-subset seeds, using 20,000 resamples and random seed 431700. These intervals are not obtained by inverting the exact sign-flip tests and are not simultaneous multiplicity-adjusted intervals. All inputs use legacy bidirectional imputation.
In the historical legacy replay, no ablation shows a statistically reliable improvement over the frozen primary method. Mean overload differences relative to the primary are +0.0423 percentage points without node identity (unadjusted ), +0.0115 with current features only (), +0.0346 with the correlation graph (), and +0.0654 with the shuffled graph (). Because no equivalence margin was specified, these non-significant comparisons do not establish equivalence.
The correlation graph lowers overload by 0.0308 percentage points relative to the shuffled graph on average, but the paired comparison is not significant (). This historical comparison leaves the benefit of the tested graph unresolved.
7.3. Offline Error Versus Closed-Loop Value
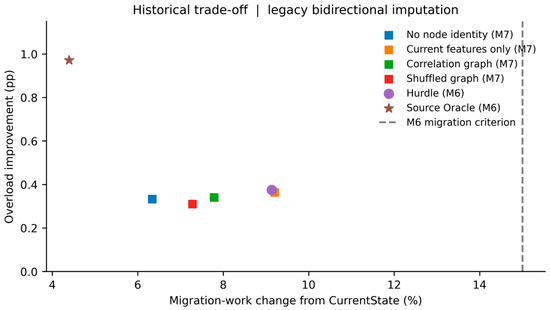
Across 40 seed–variant observations, the descriptive Spearman correlation between offline balanced source error and closed-loop overload delta is −0.414. The sign is inconsistent with a simple positive association between prediction error and overload delta in this pooled sample. However, observations share seeds and variants, so this is not an independent-sample inferential test or evidence that prediction quality is irrelevant. Removing node identity yields the lowest mean balanced source error among the four ablations without yielding the best mean control outcome. Together, these descriptive observations motivate evaluating forecasts through their deployment role as well as offline error. Figure 4 summarizes the mean overload–migration trade-off for the frozen method, the source-role Oracle, and the representation variants in the historical nominal replay.
Figure 4.
Mean overload and migration trade-off in the nominal replay. The vertical axis is overload improvement relative to CurrentState in percentage points; larger values indicate greater benefit. The horizontal axis is migration-work change relative to CurrentState in percent. The frozen method and source-role Oracle use M6 summaries; representation variants are M7 exploratory summaries. The dashed line is the pre-specified 15% migration-increase limit for M6 and is shown only as a reference for M7. The Oracle is an information diagnostic, not a deployable method. Points do not show uncertainty intervals. All points use the historical legacy input pipeline.
7.4. Post-Confirmation Baselines, Robustness, and Efficiency
Classical baselines include seasonal naive, exponentially weighted moving average (EWMA), linear trend, and node-wise autoregressive ridge. Simple forecasting methods provide essential benchmarks [27], while ridge regularization controls coefficient instability in regression [28]. Under the nominal configuration, the frozen method has the largest mean reduction relative to CurrentState among the evaluated deployable learned and classical methods (Table 5). Direct paired comparisons favor the frozen method over seasonal naive by 0.2846 percentage points (95% CI: 0.0827 to 0.4923 in favor of the frozen method; Holm-adjusted ), EWMA by 0.2904 (), linear trend by 0.3481 (), and node-wise autoregressive ridge by 0.2385 (). Hyperparameters for EWMA, trend, and ridge were selected only on each seed’s original validation prefix, and every predictor used the same upward-only source–risk interface and CurrentState destination view.
Table 5.
Historical M9 nominal comparisons under legacy bidirectional imputation.
Seasonal naive and linear trend do not significantly outperform CurrentState under the five-comparison Holm family (adjusted p = 0.2012 and 0.1875, respectively). They are retained as transparent reference forecasts that test whether simple seasonality or local extrapolation is sufficient under the shared deployment interface. Their results do not establish that these forecasting approaches are generally ineffective. The linear-trend bootstrap interval excludes zero while its Holm-adjusted sign-flip test is non-significant; these summaries use different statistical procedures, and the interval is not a simultaneous multiplicity-adjusted interval.
The frozen method also reduces mean overload relative to CurrentState under every deployment perturbation (Table 6), with reductions ranging from 0.1942 to 0.4000 percentage points. All 10 seeds improve in the four bandwidth and topology scenarios. Demand −10% improves in 9/10 seeds, while demand +10% improves in 9/10 with one tie. Each perturbation comparison has a Holm-adjusted value of 0.0117. Under reduced demand, autoregressive ridge achieves a numerically larger mean reduction than the frozen method by 0.0058 percentage points. These results describe sensitivity to the tested perturbations within the legacy replay; they do not establish production robustness or dominance over every baseline in every condition.
Table 6.
Historical M9 robustness with legacy imputation and frozen checkpoints.
The source-role hurdle network contains 4850 trainable parameters and has a 24,172-byte checkpoint. Median recorded training time is 1.525 s per seed. Batched offline inference over 25,200 node decisions takes a median of 7.27 ms, with a recorded range of 6.87–174.56 ms. The seed-2 record accounts for the maximum; the other nine records range from 6.87 to 8.67 ms. The measurements did not isolate the cause of this variation. Mean nominal closed-loop replay time is 0.0513 s for the hurdle method and 0.0462 s for CurrentState. These measurements describe computational cost within the replay workflow; they do not measure per-request online latency or establish a deployment latency guarantee.
7.5. Causal Alibaba Sensitivity
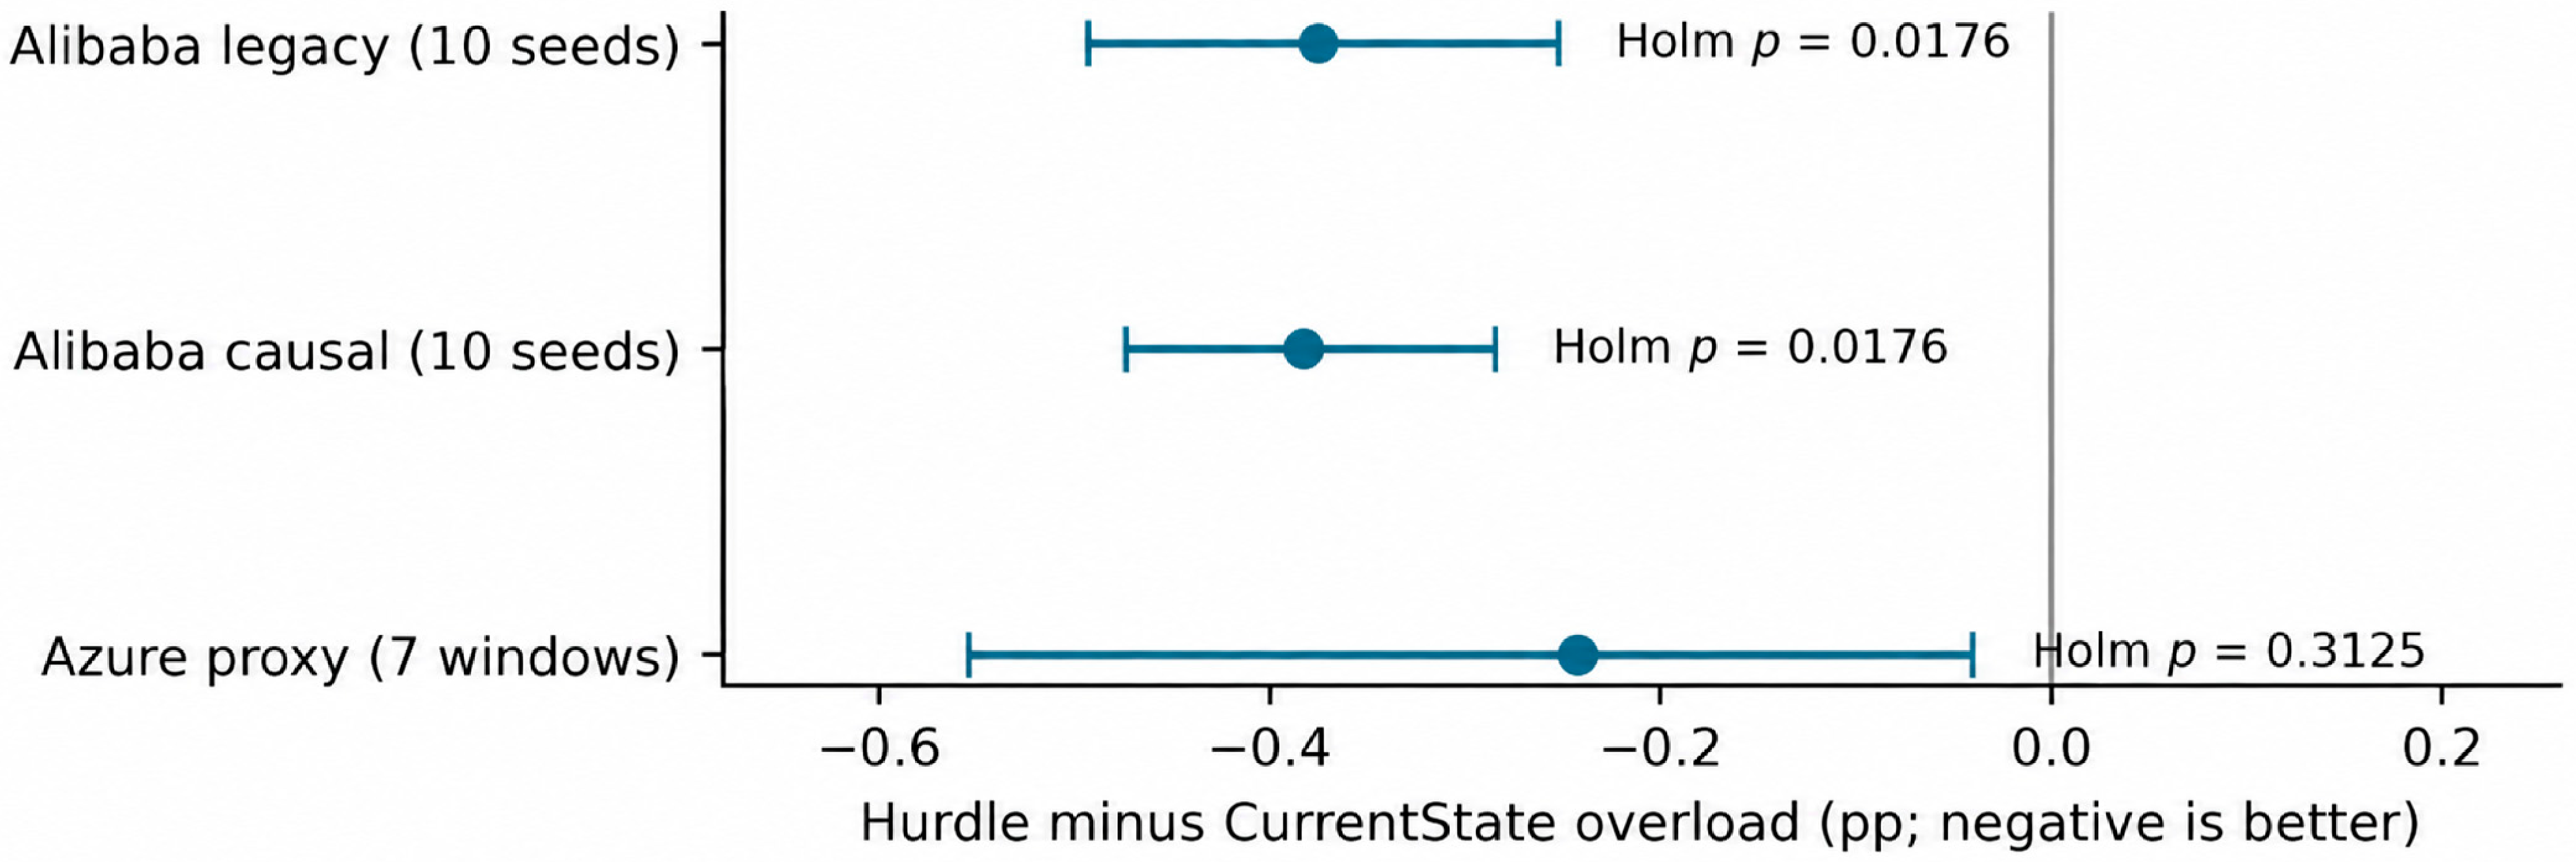
After causal preprocessing and full retraining, mean overload decreases from 39.4077% for CurrentState to 39.0250% for hurdle, a 0.3827-percentage-point reduction (paired 95% bootstrap interval 0.2846–0.4731; exact p = 0.001953; nine-comparison Holm p = 0.0176). All 10 seeds improve. Migration work increases by 8.23%, timeout changes by −0.00124 percentage points, and the latency proxy changes by −0.0733%. The learned method closes 12.32% of the Full-Oracle gap under this causal imputed workload. Table 7 summarizes the post-review causal Alibaba replay results.
Table 7.
Post-review causal Alibaba replay across 10 paired machine subsets.
The legacy rerun retains the historical 0.3750-percentage-point gain, whereas causal preprocessing yields a much higher absolute baseline overload. The method-versus-baseline contrast retains its direction and approximate magnitude, but the change in absolute workload level shows substantial preprocessing sensitivity. This is not an equivalence test of the two pipelines. Within the causal condition, hurdle has lower mean overload than seasonal naive, EWMA, linear trend, and AR ridge by 0.3308, 0.3038, 0.3500, and 0.2500 percentage points, respectively; nine-family Holm p values are 0.0352, 0.0176, 0.0176, and 0.0234. These comparisons remain post-review exploratory evidence.
7.6. Supplementary Azure Arrival Workload
Averaging 10 seeds inside each window and then seven windows, CurrentState overload is 6.1618% and hurdle overload is 5.9195%. The paired change is −0.2423 percentage points (marginal bootstrap interval −0.5541 to −0.0401), with improvement in five of seven windows. The exact sign-flip p value is 0.0625 and Holm p is 0.3125. Migration increases by 1.06%, timeout changes by −0.01338 percentage points, and the latency proxy changes by −0.7445%. The bootstrap interval alone does not establish adjusted significance. Table 8 summarizes the supplementary Azure arrival-proxy replay results.
Table 8.
Post-review Azure arrival-proxy replay across seven paired window means.
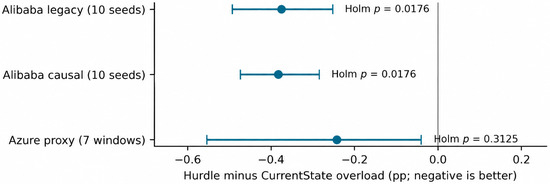
Seasonal naive achieves mean overload of 5.6102%, lower than hurdle by 0.3093 percentage points. Hurdle-versus-seasonal, EWMA, linear trend, and AR ridge have Holm p values of 0.3125, 1.0000, 0.7031, and 1.0000, respectively. No superiority over a classical baseline is established. The result broadens workload coverage while showing that source-role hurdle forecasting is not uniformly the strongest mean-performing predictor. This replay does not repeat the full event/magnitude decomposition or compare matched learned destination-only and both-role predictors. Figure 5 summarizes the paired hurdle-minus-CurrentState overload differences across the legacy Alibaba, causal Alibaba, and Azure arrival-proxy replays.
Figure 5.
Post-review hurdle-minus-CurrentState overload differences. Points show paired means and bars show marginal 95% percentile-bootstrap intervals. Alibaba pairs 10 machine subsets; Azure pairs seven window means after averaging seeds. Negative values favor hurdle. Holm p values use the separate nine-comparison family within each condition. An interval excluding zero is not an adjusted significance claim. The grey vertical line indicates zero difference in overload between Hurdle and CurrentState.
8. Discussion
8.1. Why Control Alignment Matters
The results distinguish three aspects of control-aligned prediction. First, predictable information need not be sufficient for useful action: the binary intervention identifies events but lacks the magnitude needed to size migration. Second, source and destination roles assign different costs to errors. Underestimating source risk can delay relief, while underestimating available destination capacity is generally conservative; overestimating that capacity can produce poor placements. Third, the deployment mapping is part of the algorithm. If fails to recover CurrentState, an ablation changes the baseline controller and cannot isolate the learned signal’s value.
The largest mean reduction among the evaluated deployable methods in the historical nominal replay refers to M9. The causal follow-up supports a similar Alibaba ranking, while Azure produces a different numerical ranking; the design hypothesis is therefore workload-dependent.
The hurdle formulation separates the controller’s trigger and sizing decisions. The event score determines whether a proactive correction is admitted, and magnitude determines its size. Restricting supervision and deployment to currently safe source candidates focuses the model on nodes whose source status may change. In the post-confirmation nominal evaluation, the hurdle method has the largest mean closed-loop overload reduction among the evaluated deployable methods without minimizing generic balanced source error. This result reinforces the distinction between statistical accuracy and decision value; it does not imply that prediction quality is irrelevant.
8.2. Magnitude and Practical Trade-Off
The historical M6 reduction of 0.3750 percentage points represents approximately 1.22% of its baseline overload rate. The post-review causal Alibaba reduction of 0.3827 percentage points represents approximately 0.97% of its higher baseline rate. Both are modest absolute gains. Neither counts avoided requests or measures SLA benefits, and the two baseline rates must not be interchanged because preprocessing changes the simulated workload. Migration and timeout effects are reported separately, and the post-review evidence remains exploratory.
Equation (8) uses mean overload fraction and mean migration work over the relevant paired units, with CurrentState as the reference and hurdle as the evaluated method. The penalty expresses the cost of one baseline unit of additional migration work in overload-fraction units. This net benefit is evaluated separately for the historical and new replay constructions:
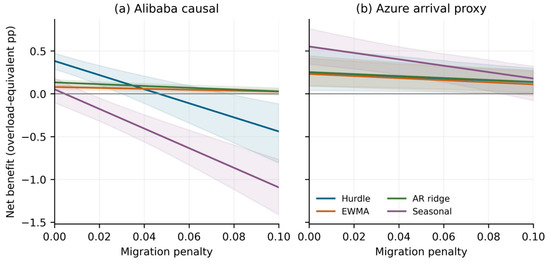
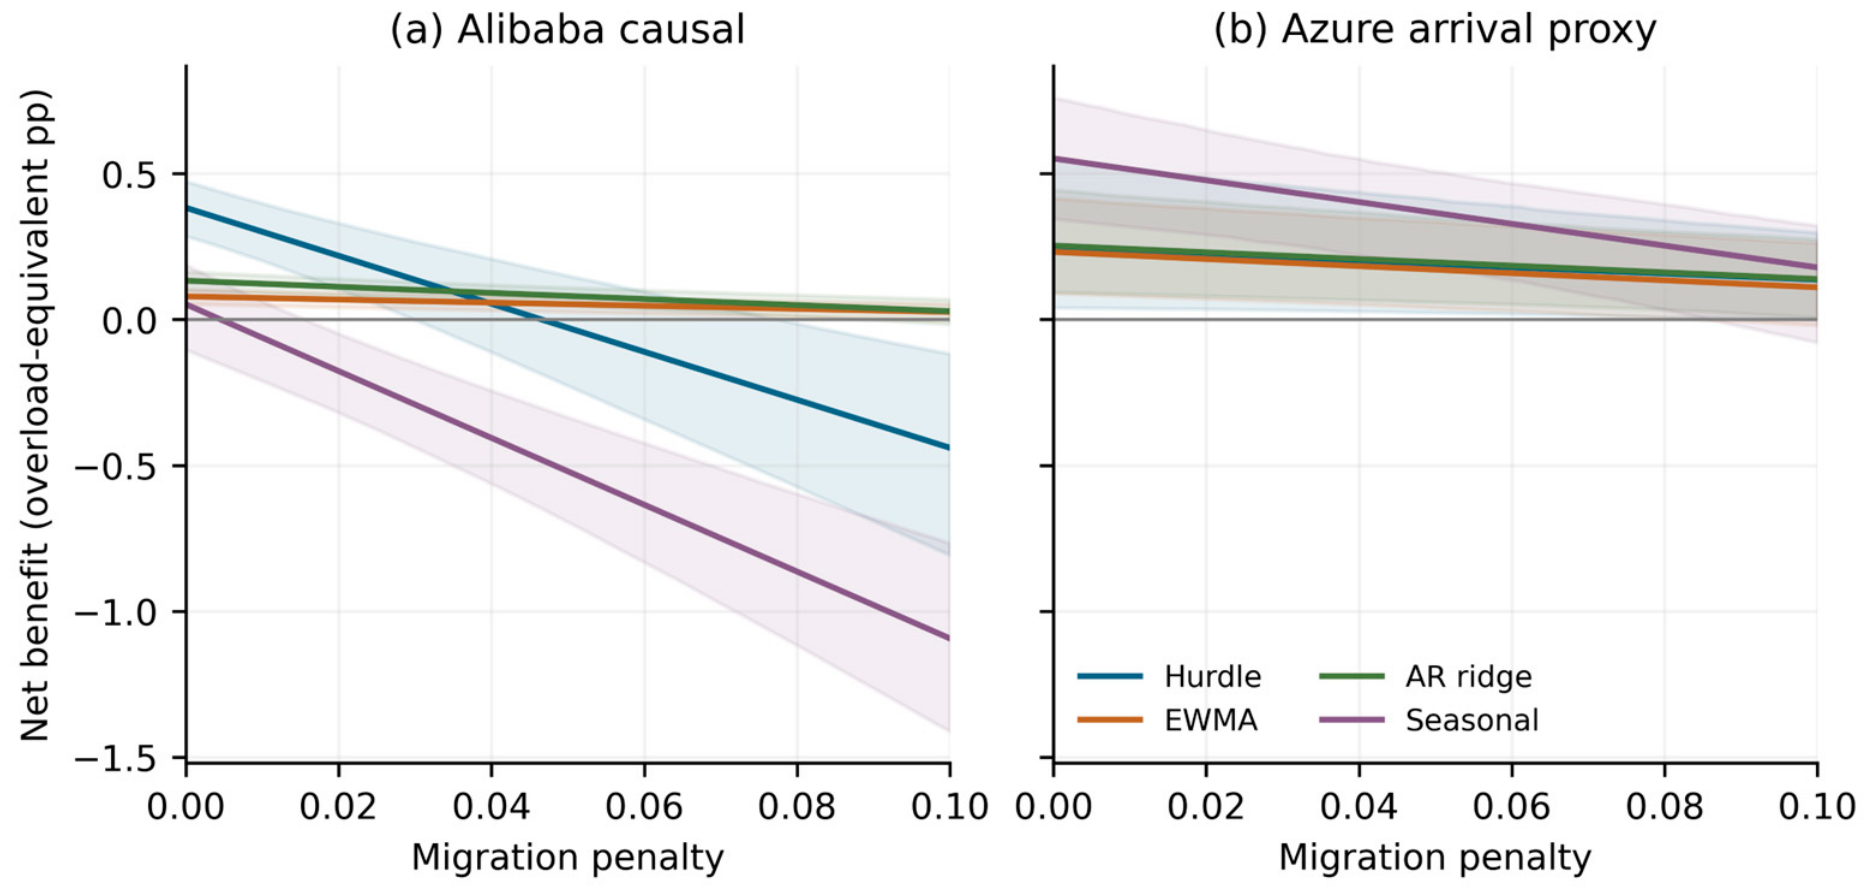
For causal Alibaba, the mean overload gain is 0.00382692 and relative migration increase is 0.08226296, giving a point-estimate break-even penalty of 0.0465. Joint paired bootstrap resampling recomputes both the overload gain and the ratio of mean migration work, preserving their dependence; its unadjusted 95% break-even interval is 0.0298–0.0774. Figure 6 compares the hurdle method with classical alternatives with smaller migration increases in the causal Alibaba replay. These sensitivity calculations summarize a specified utility, not measured energy, money, response latency, or SLA value. The migration penalty was not fitted to the test outcomes.
Figure 6.
Joint overload–migration utility sensitivity for (a) causal Alibaba and (b) Azure arrival proxy. Net benefit follows Equation (8), multiplied by 100 to give overload-equivalent percentage points. Positive values favor the method over CurrentState. Shading denotes marginal 95% paired percentile-bootstrap intervals jointly resampling overload and migration. Penalties are sensitivity inputs, not test-selected operational costs; bands are not simultaneous intervals and windows may be dependent.
The overload benefit alone does not determine the preferred method. In causal Alibaba, EWMA and AR ridge incur smaller migration increases, so their utility can exceed that of the hurdle method at sufficiently high penalties. In the Azure proxy, seasonal naive has a larger mean overload reduction but also more migration; its preferred status likewise depends on the penalty. Curves and unadjusted intervals are descriptive, and apparent curve crossings do not establish significant policy superiority. Deployment requires external cost calibration and validation-based policy selection.
8.3. Interpretation of the Unresolved Graph Comparison
The graph result warrants a narrow interpretation. Shared demand or common external factors can correlate node histories, making graph forecasting plausible [17,18,19,20,21]. The observed correlation-versus-shuffled mean difference is 0.0308 percentage points in favor of the correlation graph, but the unadjusted paired test is non-significant (p = 0.582). No equivalence margin was specified, and these analyses reuse the primary confirmation seeds. The result therefore leaves graph-specific benefit unresolved. Possible explanations include dominant node-local dynamics, unstable correlations, or limited controller sensitivity. A follow-up should freeze the graph construction and a practically meaningful effect or equivalence margin, use separate development and evaluation data, and determine its sample size from paired variance and the target effect before observing new test outcomes. Adding outcomes opportunistically to M6 would not resolve this limitation.
8.4. Threats to Validity
- Dataset coverage: the post-review study includes Alibaba telemetry and an Azure invocation-arrival workload, but the feature contracts differ. Azure uses a single count-based load channel and retraining; Alibaba uses six nominal channels, including a constant-zero bandwidth channel. Dataset effects cannot therefore be isolated from representation and workload-construction differences. Azure does not establish model transfer without retraining, measured CPU generalization, or a universal source-role advantage. The full event/magnitude and learned source/destination decomposition has not been independently repeated on Azure.
- Preprocessing and stress assumptions: historical bidirectional interpolation reads future observations. The causal follow-up removes that interpolation path but forward filling can remain stale; leading and all-window missing values set to zero are simulation assumptions. High CPU missingness affects inputs, labels, scale calibration, and simulated work. Neither analysis identifies unobserved true demand. Stress scaling and load clipping alter production intensity; Azure replay additionally treats each arrival as equal work and clips simulated load.
- Network semantics: the migration topology is synthetic and does not represent Alibaba’s physical network.
- Forecast horizon: the controller uses a one-interval, five-minute lead with zero additional migration delay. Longer horizons and delayed actions remain open.
- Statistical power: ten Alibaba machine subsets cannot establish architectural equivalence and seven Azure windows provide limited resolution. With seven nonzero paired units, the smallest attainable two-sided exact sign-flip p value is 0.015625; under the fixed nine-comparison Holm family, no comparison can reach the 0.05 threshold. Thus, the absence of adjusted significance on Azure must be interpreted with its workload construction, numerical outcomes, and limited resolution, rather than as proof of no effect. Shared trace windows also limit independence.
- Analysis status: M7/M9 legacy analyses and both post-review experiments are exploratory follow-up. Existing seed labels are reused, the supplementary code was defined after the original results and data audit, and its saved protocol is a local record rather than public preregistration. Architecture and selection grids are held fixed, but weights and validation-selected gates are retrained in each condition. These results cannot retrospectively strengthen the original confirmation’s status.
- Controller scope: the replay studies proactive offloading, not autoscaling, restart policies, heterogeneous service-level objectives, or online concept drift.
9. Reproducibility
The experiment package records development, confirmation, ablation, and post-confirmation analysis seeds. It fits prediction graphs to the nominal training prefix of the legacy-filled data, subject to the interpolation limitation in Section 6.2, and stores per-seed checkpoints, training histories, validation selections, prediction and system metrics, paired statistics, robustness settings, efficiency measurements, and identity audits. The post-confirmation nominal replay reproduces all 40 frozen primary-analysis method–seed records to numerical tolerance, with maximum absolute metric differences on the order of .
The revision package records the raw-aggregate data contract, causal preprocessing, Azure count aggregation, per-unit checkpoints, training histories, validation selections, and all 720 new system records. Independent recomputation reproduces all 27 paired comparisons and the three nine-comparison Holm families. Selected Alibaba and Azure checkpoints were also re-inferred and replayed to verify their reported system metrics to numerical tolerance. Instructions identify the original datasets [12,26]; derived inputs are provided only subject to their owners’ applicable terms.
10. Conclusions
This study develops an oracle-intervention framework and a baseline-preserving source-role hurdle interface for forecast-assisted offloading. Historical Alibaba diagnostics suggest different decision value for event, magnitude, source, and destination information within the specified legacy replay. A subsequent audit identifies future-dependent interpolation, so those findings remain conditional design diagnostics. Complete post-review causal retraining retains a modest Alibaba overload benefit with additional migration work. The supplementary Azure arrival-proxy replay broadens workload coverage but does not establish superiority over classical forecasts; seasonal naive achieves a lower mean overload rate. Joint utility sensitivity shows why workload and migration cost matter to deployment. The evidence supports testing role-specific forecast interfaces within explicit workload and preprocessing contracts, while cross-controller, independent mechanism replication, and real edge-deployment validation remain open.
Author Contributions
Conceptualization, Z.D. and X.F.; methodology, Z.D.; software, Z.D.; validation, Z.D., X.F. and Y.R.; formal analysis, Y.R.; investigation, Y.R.; resources, Z.C.; data curation, X.J.; writing—original draft preparation, Z.D.; writing—review and editing, X.F.; visualization, Y.R.; supervision, X.F.; project administration, X.F.; funding acquisition, X.F. All authors have read and agreed to the published version of the manuscript.
Funding
This research received no external funding.
Institutional Review Board Statement
Not applicable.
Informed Consent Statement
Not applicable.
Data Availability Statement
Alibaba Cluster Trace v2018 is available through the Alibaba Cluster Trace Program [12]. The supplementary workload uses the Azure Functions Invocation Trace 2021 from the Azure Public Dataset repository [26]. Derived records, configuration, checkpoints, aggregation contracts, and figure source files accompany the revision materials; the original datasets remain subject to their providers’ terms.
Conflicts of Interest
The authors declare no conflicts of interest.
Abbreviations
| Abbreviation | Meaning |
| MEC | Multi-access/mobile edge computing |
| MLP | Multilayer perceptron |
| LSTM | Long short-term memory |
| DCRNN | Diffusion convolutional recurrent neural network |
| STGCN | Spatio-temporal graph convolutional network |
| CI | Confidence interval |
References
- Satyanarayanan, M. The Emergence of Edge Computing. Computer 2017, 50, 30–39. [Google Scholar] [CrossRef] [Scilit]
- Mach, P.; Becvar, Z. Mobile Edge Computing: A Survey on Architecture and Computation Offloading. IEEE Commun. Surv. Tutor. 2017, 19, 1628–1656. [Google Scholar] [CrossRef] [Scilit]
- Mao, Y.; You, C.; Zhang, J.; Huang, K.; Letaief, K.B. A Survey on Mobile Edge Computing: The Communication Perspective. IEEE Commun. Surv. Tutor. 2017, 19, 2322–2358. [Google Scholar] [CrossRef] [Scilit]
- Zaman, S.K.U.; Jehangiri, A.I.; Maqsood, T.; Umar, A.I.; Khan, M.A.; Jhanjhi, N.Z.; Shorfuzzaman, M.; Masud, M. COME-UP: Computation Offloading in Mobile Edge Computing with LSTM Based User Direction Prediction. Appl. Sci. 2022, 12, 3312. [Google Scholar] [CrossRef] [Scilit]
- Cortez, E.; Bonde, A.; Muzio, A.; Russinovich, M.; Fontoura, M.; Bianchini, R. Resource Central: Understanding and Predicting Workloads for Improved Resource Management in Large Cloud Platforms. In Proceedings of the 26th Symposium on Operating Systems Principles, Shanghai, China, 28–31 October 2017; pp. 153–167. [Google Scholar] [CrossRef] [Scilit]
- Dang-Quang, N.-M.; Yoo, M. Deep Learning-Based Autoscaling Using Bidirectional Long Short-Term Memory for Kubernetes. Appl. Sci. 2021, 11, 3835. [Google Scholar] [CrossRef] [Scilit]
- Donti, P.L.; Amos, B.; Kolter, J.Z. Task-Based End-to-End Model Learning in Stochastic Optimization. In Advances in Neural Information Processing Systems, Proceedings of the 31st Annual Conference on Neural Information Processing Systems (NIPS 2017), Long Beach, CA, USA, 4–9 December 2017; Curran Associates: Red Hook, NY, USA, 2017; Volume 30, pp. 5484–5494. [Google Scholar]
- Elmachtoub, A.N.; Grigas, P. Smart ‘Predict, Then Optimize’. Manag. Sci. 2022, 68, 9–26. [Google Scholar] [CrossRef] [Scilit]
- Wilder, B.; Dilkina, B.; Tambe, M. Melding the Data-Decisions Pipeline: Decision-Focused Learning for Combinatorial Optimization. Proc. AAAI Conf. Artif. Intell. 2019, 33, 1658–1665. [Google Scholar] [CrossRef] [Scilit]
- Di Nardo, M.; Madonna, M.; Addonizio, P.; Gallab, M. A Mapping Analysis of Maintenance in Industry 4.0. J. Appl. Res. Technol. 2021, 19, 653–675. [Google Scholar] [CrossRef] [Scilit]
- Zhang, S.; Yi, N.; Ma, Y. A Survey of Computation Offloading With Task Types. IEEE Trans. Intell. Transp. Syst. 2024, 25, 8313–8333. [Google Scholar] [CrossRef] [Scilit]
- Alibaba Group. Alibaba Cluster Trace Program. Available online: https://github.com/alibaba/clusterdata (accessed on 3 September 2026).
- Cheng, Y.; Anwar, A.; Duan, X. Analyzing Alibaba’s Co-Located Datacenter Workloads. In Proceedings of the 2018 IEEE International Conference on Big Data, Seattle, WA, USA, 10–13 December 2018; pp. 292–297. [Google Scholar] [CrossRef] [Scilit]
- Mandi, J.; Kotary, J.; Berden, S.; Mulamba, M.; Bucarey, V.; Guns, T.; Fioretto, F. Decision-Focused Learning: Foundations, State of the Art, Benchmark and Future Opportunities. J. Artif. Intell. Res. 2024, 81, 1623–1701. [Google Scholar] [CrossRef] [Scilit]
- Amos, B.; Kolter, J.Z. OptNet: Differentiable Optimization as a Layer in Neural Networks. In Proceedings of Machine Learning Research, Proceedings of the 34th International Conference on Machine Learning, Sydney, NSW, Australia, 6–11 August 2017; Volume 70, pp. 136–145. Available online: https://proceedings.mlr.press/v70/amos17a.html (accessed on 4 October 2026).
- Agrawal, A.; Amos, B.; Barratt, S.; Boyd, S.; Diamond, S.; Kolter, J.Z. Differentiable Convex Optimization Layers. In Advances in Neural Information Processing Systems 32, Proceedings of the 33rd Conference on Neural Information Processing Systems (NeurIPS 2019), Vancouver, BC, Canada, 8–14 December 2019; Curran Associates, Inc.: Red Hook, NY, USA, 2019; Volume 32, Available online: https://proceedings.neurips.cc/paper/2019/hash/9ce3c52fc54362e22053399d3181c638-Abstract.html (accessed on 4 October 2026).
- Li, Y.; Yu, R.; Shahabi, C.; Liu, Y. Diffusion Convolutional Recurrent Neural Network: Data-Driven Traffic Forecasting. In Proceedings of the International Conference on Learning Representations, Vancouver, BC, Canada, 30 April–3 May 2018. [Google Scholar]
- Yu, B.; Yin, H.; Zhu, Z. Spatio-Temporal Graph Convolutional Networks: A Deep Learning Framework for Traffic Forecasting. In Proceedings of the Twenty-Seventh International Joint Conference on Artificial Intelligence, Stockholm, Sweden, 13–19 July 2018; pp. 3634–3640. [Google Scholar] [CrossRef] [Scilit] [PubMed]
- Wu, Z.; Pan, S.; Long, G.; Jiang, J.; Zhang, C. Graph WaveNet for Deep Spatial-Temporal Graph Modeling. In Proceedings of the Twenty-Eighth International Joint Conference on Artificial Intelligence, Macao, China, 10–16 August 2019; pp. 1907–1913. [Google Scholar] [CrossRef] [Scilit] [PubMed]
- Wu, Z.; Pan, S.; Long, G.; Jiang, J.; Chang, X.; Zhang, C. Connecting the Dots: Multivariate Time Series Forecasting with Graph Neural Networks. In Proceedings of the 26th ACM SIGKDD International Conference on Knowledge Discovery and Data Mining, Virtual Event, 23–27 August 2020. [Google Scholar] [CrossRef] [Scilit]
- Bai, L.; Yao, L.; Li, C.; Wang, X.; Wang, C. Adaptive Graph Convolutional Recurrent Network for Traffic Forecasting. In Advances in Neural Information Processing Systems 33, Proceedings of the 34th Conference on Neural Information Processing Systems (NeurIPS 2020), Virtual, 6–12 December 2020; Curran Associates, Inc.: Red Hook, NY, USA, 2020; Volume 33, Available online: https://proceedings.neurips.cc/paper/2020/hash/ce1aad92b939420fc17005e5461e6f48-Abstract.html (accessed on 4 October 2026).
- Cragg, J.G. Some Statistical Models for Limited Dependent Variables with Application to the Demand for Durable Goods. Econometrica 1971, 39, 829–844. [Google Scholar] [CrossRef] [Scilit]
- Efron, B.; Tibshirani, R.J. An Introduction to the Bootstrap; Chapman & Hall/CRC: New York, NY, USA, 1993. [Google Scholar] [CrossRef] [Scilit]
- Edgington, E.S.; Onghena, P. Randomization Tests, 4th ed.; Chapman & Hall/CRC: Boca Raton, FL, USA, 2007. [Google Scholar] [CrossRef] [Scilit]
- Holm, S. A Simple Sequentially Rejective Multiple Test Procedure. Scand. J. Stat. 1979, 6, 65–70. [Google Scholar]
- Microsoft. Azure Functions Invocation Trace 2021. Available online: https://github.com/Azure/AzurePublicDataset/blob/master/AzureFunctionsInvocationTrace2021.md (accessed on 4 October 2026).
- Hyndman, R.J.; Athanasopoulos, G. Forecasting: Principles and Practice, 3rd ed.; OTexts: Melbourne, Australia, 2021; Available online: https://otexts.com/fpp3/ (accessed on 14 September 2026).
- Hoerl, A.E.; Kennard, R.W. Ridge Regression: Biased Estimation for Nonorthogonal Problems. Technometrics 1970, 12, 55–67. [Google Scholar] [CrossRef]

Disclaimer/Publisher’s Note: The statements, opinions and data contained in all publications are solely those of the individual author(s) and contributor(s) and not of MDPI and/or the editor(s). MDPI and/or the editor(s) disclaim responsibility for any injury to people or property resulting from any ideas, methods, instructions or products referred to in the content. |
© 2026 by the authors. Licensee MDPI, Basel, Switzerland. This article is an open access article distributed under the terms and conditions of the Creative Commons Attribution (CC BY) license.