


Abstract
Natural hazards have a significant impact on the power supply chain and simultaneously affect the utilization efficiency of renewable energy. The joint effect of disaster probability and emergency procurement costs on pricing, renewable energy investment, and profit distribution within a two-echelon power supply chain remains underexplored. To fill this gap, we construct two game-theoretic models: Model S in a stable natural environment and Model D under natural hazards. The main conclusions are as follows: (1) In both scenarios, the profit level of the producer depends on the probability of natural hazards. When 0 < μ ≤ μ1, the producer earns a higher profit in Model S, whereas when μ1 < μ < 1, the producer earns a higher profit in Model D. The profit level of retailers depends on the unit procurement price of emergency supplies and the probability of natural hazards. (2) In a stable natural environment, the optimal wholesale price set by the power producer, the optimal retail price set by the electricity retailer, the demand for renewable energy electricity, the total electricity demand, and consumer surplus are all higher than in the scenario where a natural hazard occurs. In the scenario of a natural hazard, the profit of the players is determined by the proportion of renewable energy power supply and prevailing market demand conditions. (3) As the preference coefficient for renewable electricity increases, the retail price, electricity demand, profit of both players, and consumer surplus all rise. In contrast, the renewable energy investment cost coefficient has the opposite effect on them. Additionally, the demand for traditional energy power is positively correlated with the investment cost coefficient.
1. Introduction
Natural hazards increasingly threaten the stable operation of power systems and, at the same time, affect the utilization efficiency of renewable energy. In 2021, Winter Storm Uri caused widespread power outages in Texas, leaving nearly 5 million households without electricity and resulting in economic losses exceeding $20 billion. In 2023, Europe experienced a once-in-a-century drought, with water levels in the Rhine River dropping to historic lows; nearly 40% of hydropower plants in countries such as Germany and France were forced to reduce output due to insufficient water intake, while the efficiency of photovoltaic plant components declined by 15–20% under persistent high temperatures. These events illustrate a common feature that is central to this paper: natural hazards simultaneously reduce the available supply of renewable energy and raise the cost of securing alternative electricity, thereby altering both the pricing decisions of power producers and the procurement decisions of electricity retailers.
This vulnerability is becoming more consequential as the share of renewable energy in electricity generation continues to rise. Renewable energy accounted for over 28% of global electricity generation in 2023, and this proportion is expected to exceed 40% by 2030. Because renewable generation is highly dependent on natural conditions, its inherent intermittency and volatility make the power supply chain more exposed to natural hazards. On the production side, renewable energy producers often have fixed assets located in remote areas with limited hazard resilience and face high restoration costs, while disruptions to fuel transportation can also hinder the supply of coal and natural gas. On the sales side, electricity retailers face contractual default risks when producers reduce or halt generation, and they must also cope with wholesale price fluctuations driven by supply shortages. These production-side and sales-side effects jointly determine how the supply chain responds to natural hazards, which motivates a chain-level rather than a firm-level analysis.
Against this backdrop, existing research predominantly focuses on cost optimization, green preferences, or risk prevention in the power supply chain, yet lacks a holistic chain perspective that integrates the interests of multiple stakeholders such as renewable energy producers, traditional thermal power enterprises, and electricity retailers. For instance, some studies have proposed energy storage allocation schemes to address the uncertainty of renewable energy generation, but they have not considered the risks of damage to the energy storage equipment itself caused by natural hazards. Other research has focused on optimizing electricity retailers’ procurement strategies but has overlooked the impact of fluctuations in power producers’ contractual performance capabilities on procurement costs during hazard scenarios.
The research questions are as follows:
- (1)
- How do optimal wholesale price, renewable energy demand, retail price, and the profits of the producer and retailer differ between a stable environment and a natural hazard scenario?
- (2)
- How do natural hazard probability and price jointly affect the profit of the supply chain participants?
- (3)
- How do renewable energy preference and renewable energy investment cost affect electricity demand, pricing, profit, and consumer surplus?
Based on the above actual circumstances, the objectives of this paper are to derive the equilibrium decisions of both participants under the two scenarios, to compare these decisions and identify the conditions under which each scenario yields higher profit, and to provide managerial and policy implications for pricing, emergency procurement, and renewable energy investment.
For the sake of clarity, based on the perspective of natural hazards, we explored optimization decision-making in the power supply chain. The research contributes to existing literature in two aspects. On the one hand, by incorporating natural hazards into the power supply chain, we conducted a comparative analysis of the optimal decisions of supply chain participants under stable natural environments and hazard scenarios. It was found that the profits of producers and retailers are correlated with the probability of natural hazards. On the other hand, while some scholars have studied issues related to renewable energy generation, there is a lack of research conducted against the backdrop of natural hazards. Few studies have integrated the probability of hazard occurrence into power supply chain models. This paper incorporates renewable energy and the probability of hazards influencing the decision-making of participants, thereby enriching research in the field of electricity markets.
The remainder of this paper is structured as follows. Section 2 provides a literature review. Section 3 presents the model description and basic assumptions. Section 4 presents the model construction and solving process. The models are analyzed in Section 5. Section 6 concludes the paper, summarizing the key contributions.
2. Literature Review
This section mainly conducts a review of the relevant literature from two perspectives.
2.1. The Impact of Natural Hazards on the Production and Operation of Renewable Energy
The first group of studies examines pricing, investment, and planning in electricity systems with renewable resources. Chao [1] investigated efficient pricing and investment strategies in electricity markets characterized by intermittent renewable resources. Their work introduces an updated economic model for pricing and investment in restructured electricity markets, which is subsequently applied in a simulation study to conduct a preliminary evaluation of renewable energy strategies and alternative pricing mechanisms. Through a Stackelberg game framework, Ji et al. [2] used a Stackelberg game to examine emission reduction in retail- and dual-channel supply chains under cap-and-trade regulation and consumer low-carbon preferences. These studies provide useful benchmarks for pricing and investment decisions, but they treat renewable intermittency as an exogenous supply characteristic and do not model how the probability of a natural hazard changes the cost structure of the supply chain participants.
A second group focuses on the resilience of energy systems to extreme weather and climate events. Abdin et al. [3] proposed a modeling and optimization framework for power system planning that accounts for operational flexibility and resilience to extreme heat waves and droughts. In response to the threats posed by climate change and extreme events to energy systems, Perera et al. [4] developed a stochastic-robust optimization method capable of considering both low-impact variations and extreme events. Li et al. [5] integrated demand prediction, system design, dispatch optimization, and system evaluation for a fully renewable island energy system under extreme weather. Liao et al. [6] proposed an optimal allocation method for distributed renewable generations that addresses carbon emission constraints and multi-scenario hazard resilience.
A third group examines the broader economic and innovation consequences of natural hazards. Cao et al. [7] studied information sharing and carbon reduction strategies in the platform economy under extreme weather and found that platforms should share demand information with firms when actual demand potential is low. Fang et al. [8] aimed to explore the dynamics between economic development, environmental pollution, and natural hazards, and to assess energy and natural hazard efficiency through a phased evaluation approach. Ma et al. [9] found that environmental threats from natural hazards act as a catalyst, prompting countries to pay greater attention to sustainable development. This, in turn, accelerates the transition of innovation paradigms from traditional to green. Zhou et al. [10] introduced a novel stochastic distributionally robust optimization approach for resilience-oriented planning in integrated electricity and heat systems. Rastegar et al. [11] examined how firms’ renewable energy innovation after climate change-induced hazards is shaped by uncertainty from the hazards themselves and from climate policy.
These studies establish that natural hazards influence innovation and efficiency, but they operate at the country, industry, or firm level and do not translate these effects into operational decisions such as wholesale pricing, retail pricing, or emergency procurement within a specific supply chain.
2.2. Research Related to Supply Chain
The second stream addresses pricing, investment, and coordination in supply chains. Adnan et al. [12] investigated the interplay between pricing and green investment strategies in a competitive electric vehicle supply chain, focusing on how these strategies are contingent on different channel leadership models. Focused on cooperative abatement between power generators and sellers under a carbon tax policy, Pan et al. [13] developed a low-carbon transformation strategy for the blockchain-based power supply chain. Panahi et al. [14] investigated a data-driven model for designing a renewable electricity supply chain that utilizes wind and solar energy. Huang et al. [15] focused on the evaluation and enhancement of resilience within China’s electric vehicle supply chain. Zhang et al. [16] studied pricing and production decisions in a manufacturer–retailer closed-loop supply chain for electric vehicle power batteries with government subsidies. Under a carbon trading policy, Zhao et al. [17] analyzed dynamic emission reduction strategies for new energy vehicles under carbon trading. Wu [18] investigated the role of channel leadership in shaping electric vehicle battery recycling strategies within a carbon trading mechanism. Sun and Ying [19] analyzed a forward–reverse blockchain traceability strategy in the new energy vehicle supply chain with consumer green preferences. Cao et al. [20] focused on optimizing a three-echelon logistics supply chain for power metering equipment, with strategies tailored to emergency scenarios. Gao et al. [21] investigated how different channel power structures influence the configuration of the integrated recycling mode in a closed-loop battery supply chain. Chu et al. [22] focused on the coordination problem in a closed-loop supply chain for power batteries, which comprised a battery manufacturer, an electric vehicle producer, and consumers. Investigating the interplay between policy subsidies and channel power structures, Wang et al. [23] developed Stackelberg game models to analyze optimal strategies under policy subsidies and different channel power structures. Han and Liu [24] examined a competitive supply chain with consumer green preferences under demand uncertainty.
In summary, studies on supply chains are strong in game-theoretic modeling but largely silent on natural hazard probability and emergency procurement. Most of the existing literature focused on pricing strategies and channel sales issues in the supply chain environment. Only a few articles have focused on the impact of renewable energy and natural hazards on the operational efficiency of supply chain systems. To fill this gap, our paper has constructed a bridge. This work integrates renewable energy, natural hazards and green preference in the context of the power supply chain environment. Unlike optimization-based resilience studies that derive optimal capacity or dispatch, this paper derives a Stackelberg game and compares equilibrium outcomes across a stable scenario (Model S) and a hazard scenario (Model D).
For the ease of presentation, Table 1 compares the present paper with the most closely related references.
Table 1.
Comparison of the relevant literature.
3. Model Description and Basic Assumptions
3.1. Model Description
Natural hazards such as earthquakes and floods can damage production and storage facilities and disrupt transportation, thereby reducing the electricity that a producer can deliver and raising the cost that a retailer must bear to secure alternative supply. The producer generates electricity from both traditional and renewable sources and sells it to the retailer at a wholesale price; the retailer then sets a retail price and serves end users. The retailer may also procure emergency supplies at an exogenous unit procurement price when the producer’s delivered quantity falls short of demand.
Emergency supplies are typically procured under pre-arranged contracts or government-directed arrangements that specify quantities in advance, so the retailer’s emergency procurement quantity is largely determined by contractual and regulatory conditions rather than by period-by-period optimization.
Based on the realistic context, optimization decision-making models for the power supply chain are constructed for both stable natural environments and hazard scenarios. These models analyze factors such as costs, profit, and social welfare of supply chain node enterprises, leading to the proposal of emergency management strategies. The implementation of these models and strategies helps enhance the resilience of the power system and mitigate the socio-economic impacts of natural hazards.
3.2. Basic Assumptions
Based on full consideration of the probability of natural hazards, this paper constructs a two-level power supply chain model composed of power producers and electricity retailers. Sequence of the game: Power producers first set the wholesale price, and then electricity retailers determine the retail price based on this wholesale price. Producers invest in renewable energy power generation alongside traditional energy sources to reduce carbon emissions, minimize environmental pollution, and maintain sustainable development of the enterprise.
The occurrence of natural hazards is not random but follows a certain probability. Assuming the probability of a natural hazard occurring is μ(0 < μ < 1), then the probability of a stable natural environment, i.e., no natural hazard, is 1 − μ. In the absence of natural hazards, producers supply both traditional energy power and renewable energy power.
Against this backdrop, the following basic assumptions are made:
Assumption 1.
The linear demand functions are adopted because they are analytically tractable, yield closed-form equilibrium solutions, and are widely used in the supply chain pricing literature. Drawing on the electricity demand functions used by Menanteau et al. [25] and Ghosh and Shah [26], where the magnitude of electricity demand is related to electricity prices and the output level of renewable energy, the total market electricity demand function under stable natural conditions is assumed to be,
q0 = a − p + bg
In the equation: a represents the potential market demand for electricity; p denotes the electricity price; b is the preference coefficient for renewable energy electricity, indicating electricity users’ preference for renewable energy; and grepresents the output level of renewable energy.
In the event of a natural hazard, as the hazard reduces the output level of renewable energy to varying degrees, producers can only supply a portion of renewable energy electricity δg (where 0 < δ < 1) in addition to traditional energy power generation. Therefore, the total market electricity demand under hazard conditions can be expressed as:
q1 = a − p + bδg
Assumption 2.
Power producers invest in energy based on the unit production cost c of traditional energy power. Power generation costs include fuel expenses, equipment maintenance costs, environmental protection costs, etc. In this context, the production cost of renewable energy power is minimal and can be neglected. Drawing on the functional forms established in the previous literature, the renewable energy investment cost function is assumed to be:
In the equation, h(h > 0) is the investment cost coefficient, which is proportional to the investment cost of renewable energy. These costs include initial equipment investment, operation and maintenance expenses, and potential capital adjustment costs, among others.
Assumption 3.
In this power system, there is one power producer and one electricity retailer. The producer sells both renewable energy power and traditional energy power to the retailer at the wholesale price w. The retailer then supplies electricity to consumers at a uniform retail price p. During the process of selling electricity to consumers, the producer is required to pay transmission and distribution costs, with the unit cost assumed to be λ.
Assumption 4.
With reference to previous literature, the expressions for the consumer surplus function and the social welfare function are defined as follows:
F = πm + πr + Cs
The variables and their meanings involved in the two supply chain decision models are shown in Table 2.
Table 2.
Parameters and descriptions.
4. Optimization Decision Models for Power Supply Chain Under Different Scenarios
4.1. Optimal Decision Model for Power Supply Chain in a Stable Natural Environment (Model S)
In the stable natural environment model, the producer invests in renewable energy and pays the electricity retailer for transmission and distribution costs. The total power generation includes both traditional energy generation and renewable energy generation. The decision sequence is as follows: In the first stage of the Stackelberg game, the leader (producer) prioritizes determining the wholesale price ws and the demand for renewable energy electricity gs; in the second stage, the electricity retailer sets the retail price ps for end-users based on the wholesale price to maximize its own profit. Finally, both parties obtain their respective revenues according to the electricity demand from consumers. The hazard probability μ is an exogenous parameter that characterizes the environment in which the Stackelberg game is played, not a decision made by either player. It enters the model before the game begins and is known to both players when they make their decisions. Because decisions on the wholesale price, renewable energy demand, and retail price are made before the realization of the hazard, both players maximize expected profit, in which the stable-state conditional profit is weighted by 1 − μ and the hazard-state conditional profit is weighted by μ.
The backward induction method is used to derive the equilibrium solution. Phase 1: The retailer’s decision problem is formulated as follows:
P1: ps = argmaxπr(p|w)
Phase 2: The producer’s decision problem is formulated as follows:
P2: ws = argmaxπm(w|ps)
The expression for the power producer’s profit function is:
The expression for the electricity retailer’s profit function is:
In this scenario, no natural hazard occurs, so there is no emergency procurement and no reduction in renewable energy availability. Furthermore, using backward induction, the Stackelberg equilibrium solution is obtained, with the results presented in the following proposition.
Proposition 1.
In the model of a stable natural environment, optimal electricity wholesale price wS*, electricity sales price pS*, demand for renewable energy electricity gS*, the demand for traditional energy-based electricity dS*, total electricity demand , the profit of power producer , the profit of electricity retailer , consumer surplus and social welfare FS*, respectively, are,
The wholesale price wS* increases with baseline demand a and with the transmission and distribution cost λ, because a larger market and higher pass-through costs raise the producer’s reservation price. The retail price pS* follows the wholesale price and also increases with a, reflecting the retailer’s markup over procurement cost.
4.2. Optimal Decision Model for Power Supply Chain in a Natural Hazard Environment (Model D)
In the hazard scenario model, a hazard occurs with probability μ and reduces the availability of renewable energy; the supply capacity of renewable energy is reduced, and reliance is primarily placed on traditional energy generation. The decision sequence in this model is the same as in Model S. The total electricity demand function during a natural hazard is precisely represented by Equation (2). Based on the above analysis and explanation, the profit functions of the supply chain participants are expressed as follows:
The expression for the power producer’s profit function is:
The cost of emergency supplies procurement is generally borne by the electricity retailer. Let y be the procurement quantity of emergency supplies, which are crucial for ensuring the normal operation of the power supply chain during natural hazards. The procurement cost of emergency supplies is related to the procurement quantity y and the unit procurement price e. Assuming the unit procurement price e is a fixed value, the procurement cost of emergency supplies is given by: C(y) = ey.
The expression for the electricity retailer’s profit function is:
Based on the above functional expressions, the Stackelberg equilibrium solution is derived using backward induction, with the results presented in the following proposition.
Proposition 2.
In the model of a natural hazard environment, optimal electricity wholesale price wD*, electricity sales price pD*, the demand for renewable energy electricity gD*, the demand for traditional energy-based electricity dD*, total electricity demand , the profit of the power producer , the profit of the electricity retailer , consumer surplus and social welfare FD*, respectively, are,
The wholesale price wD* decreases with δ, because a lower availability of renewable energy reduces the value of the producer’s renewable generation and induces it to lower the wholesale price to maintain sales volume. The retail price pD* follows the same pattern.
5. Model Analysis
5.1. Sensitivity Analysis
This section primarily analyzes the impact of the preference coefficient b for renewable energy electricity and the investment cost coefficient h for renewable energy on the equilibrium solution. Z = {S,D} represents the optimization decision model of the power supply chain under two scenarios.
Proposition 3.
As the preference coefficient b for renewable energy electricity increases, the impact on the equilibrium solution is as follows:
- (1)
- , , ;
- (2)
- When a > c, , , .
This proposition focuses on the impact of the renewable energy preference coefficient on the equilibrium solution of the power supply chain. It can be observed that, from the perspective of market demand, an increase in the preference coefficient reflects users’ higher acceptance of renewable energy. This drives electricity retailers to raise retail prices while incentivizing producers to increase the wholesale price wZ* and the demand for renewable energy electricity g (since the preference coefficient b for renewable energy increases, the demand will correspondingly rise). The total market electricity demand will also increase under both stable natural conditions and hazard scenarios. This aligns with the logic of a demand-driven market: shifts in user preferences guide upstream and downstream adjustments in pricing and production capacity structures, incentivizing producers to increase investments in renewable energy. Such a trend is consistent with the development direction of green energy, providing a basis for enterprises to formulate energy investment strategies and contributing to the achievement of sustainable development goals.
Under certain conditions (when a > c), an increase in the preference coefficient for renewable energy electricity drives higher profit for both producers and retailers. It identifies precisely when the profit effects are unambiguously positive, and it shows that a stronger green preference does not automatically benefit both players. This conclusion aligns with the operational logic of the power supply chain and can be analyzed from multiple dimensions. (1) From the perspective of market demand, a > c indicates strong baseline demand for electricity and a cost advantage in traditional power generation. Consumers’ willingness to pay a premium for renewable energy allows electricity retailers greater flexibility in adjusting retail prices. This enables them to not only cover the costs of traditional power generation but also secure additional revenue through green electricity pricing, directly driving profit growth for retailers. (2) From a cost allocation perspective, a > c indicates relatively low cost pressure from traditional power generation. As user preference for renewable energy increases, producers can transfer part of the investment costs to consumers through appropriate pricing strategies when scaling up renewable energy investments. On one hand, producers can raise wholesale prices to allocate renewable energy investment costs to retailers, who then pass these costs on to consumers through retail electricity prices. On the other hand, due to sufficient latent market demand, consumers’ sensitivity to price increases is relatively reduced, making them more likely to accept electricity prices that incorporate green costs, thereby mitigating the impact of cost allocation on sales volume. This cost allocation mechanism alleviates the individual cost pressures on both producers and retailers, driving synchronized profit growth for both parties.
Within the mechanisms represented in the model, an increase in b raises the marginal value of renewable electricity to consumers, which allows the retailer to charge a higher retail price and induces the producer to expand renewable generation.
From the perspective of social welfare, an increase in the preference coefficient promotes growth in consumer surplus, ultimately contributing to the enhancement of social welfare. As the adoption of renewable energy expands, it not only reduces pollution from traditional energy sources, aligning with environmental protection requirements, but also optimizes the structure of electricity supply and demand, thereby improving the stability of the power supply. Simultaneously, it safeguards consumer rights in green energy consumption, achieving coordinated development across economic, environmental, and social welfare dimensions. These results apply to the pricing and investment decisions represented in the model and do not rely on mechanisms outside it.
Proposition 4.
As the investment cost coefficient h for renewable energy increases, the impact on the equilibrium solution is as follows:
- (1)
- When a > c, ;
- (2)
- , , , , ;
- (3)
- , , .
Proposition 4 reveals the impact of changes in the renewable energy investment cost coefficient on the equilibrium of the power supply chain.
From the perspective of the power supply chain pricing mechanism, sufficient market demand exists under this condition, and traditional energy generation maintains a cost advantage. When the renewable energy investment cost coefficient rises, the return on investment in renewable energy for producers decreases, leading them to reduce investments in renewable energy and shift toward increasing the supply of traditional energy power. Considering both the reduction in investment costs and consumer preference for renewable energy, producers can lower wholesale electricity prices to expand the market share of traditional energy power, thereby maintaining overall capacity utilization and market competitiveness and avoiding market share loss due to rising renewable energy investment costs. As retailers benefit from lower wholesale electricity procurement costs, they will set correspondingly lower retail electricity prices. From the consumer perspective, although electricity prices are lower, a significant portion of low-carbon-preference users are unwilling to purchase electricity dominated by traditional energy sources. This leads to a decrease in electricity demand under both stable natural conditions and hazard scenarios. The combined effect of lower prices and reduced demand ultimately results in decreased profits for both producers and retailers.
From the perspective of profit distribution among supply chain entities, an increase in the investment cost coefficient h directly squeezes producers’ profit margins. On one hand, rising renewable energy investment costs lead to reduced returns in this area; on the other hand, lowering wholesale prices to expand the sales volume of traditional energy power further compresses profit margins per unit of electricity. For electricity retailers, although the wholesale price decreases, the reduction in renewable energy supply may lead to a homogenized electricity product mix, making it difficult to meet the preferences of some consumers for renewable energy. This can negatively impact sales volume to some extent, and the cost savings from lower wholesale prices may not effectively translate into profit growth. Ultimately, profit declines as the investment cost coefficient h increases. The profit of both players falls with h, which means that the cost increase is not fully passed through to consumers and is instead absorbed by the supply chain.
From the perspective of market demand and energy structure, an increase in the investment cost coefficient leads to a decrease in the demand for renewable energy electricity and an increase in the demand for traditional energy electricity. This indicates that high investment costs can hinder the promotion of renewable energy and are unfavorable for energy structure transition. Consumer surplus falls with h even though prices fall, because the reduction in renewable energy availability and the shift toward traditional energy reduce the value that consumers obtain from the electricity mix. From an economic efficiency perspective, the decline in consumer surplus as the cost coefficient rises indicates that excessively high renewable energy investment costs reduce market efficiency and overall social welfare.
The reduction in renewable supply lowers the value of the electricity mix to consumers; consumer surplus declines despite the lower price. These results pertain to the pricing and investment decisions represented in the model.
5.2. Model Comparison Analysis
This section compares the equilibrium solutions under stable natural conditions (Model S) and a hazard scenario (Model D), leading to the following propositions.
Proposition 5.
By comparing the wholesale price of the producer and the retail price of the electricity retailer under the two different scenarios, the following conclusion can be drawn: wS* > wD*, pS* > pD*.
From this proposition, it can be observed that under stable natural conditions (Model S), the optimal wholesale price set by the power producer and the optimal retail price set by the electricity retailer are both higher than their corresponding prices in hazard scenario (Model D). From the perspective of supply chain game theory, the pricing decisions of the power producer and the electricity retailer consistently revolve around the goal of “profit maximization,” though different scenarios lead to variations in pricing strategies. In Model S, the cost structure and capacity planning of the power producer are more stable. On one hand, the producer can simultaneously supply both traditional and renewable energy, with stable renewable energy output levels. The investment costs can be gradually amortized through long-term, stable electricity sales. In this scenario, market demand forecasting is highly predictable. Consequently, he tends to set higher wholesale prices wS* to cover renewable energy investment costs and capture excess profit. On the other hand, for the electricity retailer, the stable environment ensures sufficient power supply and low risk of outages, making consumers relatively less sensitive to price fluctuations. The retailer can set a higher retail price pS* based on elevated wholesale prices while maintaining stable sales volume, thereby maximizing his own profit.
Excessively high electricity prices may be perceived as “profiteering from hazards,” triggering potential policy risks. Therefore, the electricity retailer needs to lower prices to maintain stability in core demand. This constitutes a key market logic behind the relationship where pD* < pS*. Within the mechanisms represented in the model, the producer lowers the wholesale price in the hazard scenario because the reduction in renewable energy availability lowers the value of its renewable generation and induces it to compete on price to maintain sales volume. The retailer lowers the retail price accordingly.
The power producer should establish a pricing adjustment mechanism to proactively reduce wholesale prices during hazard warning periods, incentivizing the electricity retailer to increase emergency procurement. The retailer needs to optimize emergency cost allocation strategies, avoiding fully passing these costs on to consumers.
Proposition 6.
By comparing the demand for renewable energy electricity and the total electricity demand under the two different scenarios, the following conclusions are obtained: .
Proposition 6 indicates that both the renewable energy electricity demand and the total electricity demand in Model S are higher than the corresponding demands in Model D. In Model S, from the production side of the upstream power supply chain, the energy production structure of producers exhibits characteristics of “diversification + low risk.” On one hand, the stable natural environment ensures consistent output from renewable sources (such as wind, solar, and hydropower), allowing the producer to recover upfront investment costs in renewable energy through continuous power generation without incurring costs associated with traditional energy. On the other hand, policy-driven support for “dual-carbon” goals and market preferences for green energy endow renewable electricity with dual attributes of “environmental value + market premium.” By increasing the supply of renewable electricity, the producer can not only reduce environmental costs linked to traditional energy but also enhance profit margins through green power pricing. Consequently, the producer has strong incentives to expand renewable energy production, leading to gS* > gD*.
In Model D, from the perspective of demand structure, natural hazards directly suppress non-essential electricity demand: stalled product sales reduce electricity consumption. At the commercial level, closures of shopping malls lead to a significant decline in service-related electricity demand. From the perspective of purchasing power, natural hazards may cause business losses due to shutdowns and reduced household incomes, diminishing the ability of some market entities to pay for electricity. Ultimately, this results in a decline in total electricity demand ().
Within the mechanisms represented in the model, the reduction in renewable energy availability lowers the effective value of renewable generation, leading the producer to substitute toward traditional energy and reducing both renewable and total electricity demand. While promoting the green transition of energy, the government must prioritize energy security in hazard scenarios. In emergency management, green power priority dispatch policies can be implemented, but traditional energy sources should also be allowed to supplement supply promptly during shortages to avoid exacerbating supply crises due to over-reliance on renewable energy.
Proposition 7.
By comparing consumer surplus under the two different scenarios, the following conclusion is drawn: .
This proposition indicates that consumer surplus under stable natural conditions is higher than that under a hazard scenario. In Model D, changes occur in the supply-demand structure: First, renewable energy output drops significantly or even falls to zero, making the power supply highly reliant on traditional energy. Moreover, the production and transportation of traditional energy may be compromised by hazards (e.g., transportation disruptions preventing coal from reaching power plants), creating a “supply shortage” scenario. Consumers are forced to cut non-essential electricity demand, and even core demands (like residential heating) may not be fully met. This decline in “demand satisfaction” directly reduces consumer surplus. Second, although the emergency costs caused by hazards (e.g., retailers procuring emergency supplies) do not directly lead to significant price hikes, the supply shortage itself imposes hidden costs on consumers, further widening the gap compared to Model S.
Consumer surplus is one of the key indicators for measuring social welfare. Proposition 7 demonstrates that natural hazards not only impact corporate profit but also directly harm consumer interests. Hazards lead to tight power supply, price volatility, and reduced renewable energy availability, forcing consumers to face lower power supply reliability and resulting in a significant decline in social welfare. In a stable environment, all segments of the supply chain operate in coordination, enabling consumers to access electricity at prices closer to their willingness to pay, thereby maximizing social welfare. Under stable conditions, with sufficient power supply and relatively controllable prices, consumers can obtain stable electricity at lower costs, thus enjoying higher consumer surplus.
Proposition 8.
In a hazard scenario, by comparing the equilibrium profit of the power producer and the electricity retailer, the following conclusion is drawn: When and a1 < a < a2, ; When and a1 < a < a2, .
Proposition 8 reveals the dynamic adjustment pattern of profit distribution within the power supply chain under a hazard scenario, which varies with the supply capacity of renewable energy and market demand conditions.
When the proportion of renewable energy supply is small () and market demand is moderate (a1 < a < a2), the profits of the electricity retailer exceed those of the producer. This indicates that during the early stages of a hazard or when renewable energy recovery capacity is weak, the retailer possesses stronger market bargaining power. The reason lies in the fact that hazards cause renewable energy supply to nearly halt, forcing the power supply to rely primarily on traditional energy sources. However, the dispatch and supply of traditional energy are often constrained by the pace of infrastructure recovery, reducing the producer’s supply elasticity. As the channel facing end-users, the electricity retailer takes on responsibilities such as emergency material procurement and power distribution scheduling during hazards. Their channel control and emergency resource allocation capabilities become key sources of profit. Meanwhile, the producer faces challenges in recovering renewable energy investments and rising costs for traditional power generation, leading to compressed profit margins and a shift in supply chain power toward the retailer.
When the proportion of renewable energy supply is relatively high () and market demand is moderate (a1 < a < a2), the profit of the producer exceeds that of the electricity retailer. This indicates that if renewable energy maintains a strong supply capacity during hazards, the producer regains dominant control. The logic lies in the fact that if renewable energy can maintain supply during hazards, its clean and low-carbon attributes carry greater premium potential in emergency contexts, particularly in regions with strong policy support or significant consumer preference for green energy. By ensuring stable output from renewable sources, the producer reduces reliance on traditional energy, thereby controlling costs and enhancing pricing autonomy.
Proposition 8, from the perspective of economic management, reveals that natural hazards redistribute supply chain power and profit by altering resource availability and market demand structures.
Proposition 9.
By comparing the equilibrium profit of the power producer under the two scenarios, we reach the following conclusions: when 0 < μ ≤ μ1, ; when μ1 < μ < 1, .
When the probability of hazards is low (0 < μ ≤ μ1), the producer achieves higher profit under stable natural conditions. This indicates that in a low-risk scenario, companies can optimize returns by relying on conventional operational models. With low-risk expectations, firms concentrate capital and technology on enhancing operational efficiency under stable conditions. In such cases, any additional investments for low-probability events (such as reinforcing facilities or stockpiling high-cost emergency supplies) are regarded as economically inefficient sunk costs, as these investments remain underutilized most of the time, thereby reducing average profit levels. In a stable environment, investments in renewable energy (such as wind and solar power) by the producer can yield predictable returns. Therefore, the producer achieves higher profit under stable natural conditions.
When the probability of hazards is high (μ1 < μ < 1), the producer’s profits under the hazard scenario actually exceeds those under stable conditions. A high probability of hazards also encourages the electricity retailer or government to sign emergency power supply agreements with the producer. In this context, profit in a stable environment becomes relatively lower due to the inability to fully recover hazard prevention investment costs.
Corporate managers should possess risk insight capabilities. When hazards become high-probability events, companies should not view them solely as external threats but rather leverage technological innovation to enhance corporate profit.
Proposition 10.
By comparing the equilibrium profit of the electricity retailer under the two scenarios, the following conclusion can be drawn:
- (1)
- When 0 < e < e1, ① when 0 < μ ≤ μ2, ; ② when μ2 < μ < 1, .
- (2)
- When e > e1, ① when 0 < μ ≤ μ2, ; ② when μ2 < μ < 1, .
Proposition 10 reveals the interaction mechanism between the unit procurement price of emergency supplies (e) and the probability of natural hazards (μ) on the profit of the electricity retailer. The profit performance of the retailer under natural hazards is not determined solely by the hazard probability or emergency costs alone, but rather by the nonlinear relationship formed through their combined effects.
(1) When the unit procurement price of emergency supplies e is relatively low (0 < e < e1), it implies lower procurement costs for emergency supplies, resulting in lower marginal costs for the electricity retailer to maintain operations during hazards. ① When the probability of hazards is low (0 < μ ≤ μ2), profits in a stable environment exceed those in a hazard scenario. Operations in stable conditions are characterized by high efficiency and controllable costs. With low-cost emergency supplies and a low probability of hazards, the fixed costs associated with emergency preparedness (such as storage and management expenses) remain relatively low, resulting in higher profit under stable conditions compared to hazard scenarios. ② When the probability of hazards is high (μ2 < μ < 1), profits in a stable environment are lower than those in hazard scenarios. In high-risk environments, companies must frequently respond to hazards. At this point, low-cost emergency supplies enable electricity retailers to maintain power distribution capabilities at a relatively small cost, or even create a “supply advantage” during hazards. Frequent hazards, in turn, create opportunities for them to leverage their emergency response capabilities and enhance their market position, thereby achieving “profitability in crises.”
(2) When the unit procurement price of emergency supplies e is relatively high (e > e1), it indicates elevated emergency supply costs, making hazard response a significant burden. ① When the probability of hazards is low (0 < μ ≤ μ2), profit in stable environments is lower than that in hazard scenarios. This may seem counterintuitive but actually reflects the risk mechanism under “low-probability, high-cost” conditions. Although the likelihood of hazards is low, their occurrence entails significant emergency costs. To mitigate potential massive losses, electricity retailers proactively accumulate emergency funds during normal times by raising electricity prices. As a result, the model displays higher profit in the hazard scenario. ② When the probability of hazards is high (μ2 < μ < 1), profits in the stable environment exceed those in the hazard scenario. Under conditions of frequent hazards and high emergency costs, the electricity retailer faces the dilemma of “repeated high-cost responses.” The costs of emergency supplies cannot be fully passed on to electricity prices, resulting in profit erosion with each hazard. In such cases, routine operations in a stable environment prove more profitable, while the high-cost emergency responses in hazard scenarios become a burden for companies, leading to reduced profit.
Whether a company can remain profitable during hazards depends on its ability to implement effective risk transfer, cost control, and pricing strategies. The significance lies in reminding managers that corporate performance in hazard scenarios is determined not only by the hazards themselves but also by whether the company possesses resource allocation and pricing capabilities aligned with the risk structure.
6. Numerical Analysis
This section further discusses the effects of b and h on the electricity demand and consumer surplus, as well as the impact of μ on profit. Through these figures, it can be observed which model is more beneficial to the economic benefits of the game players and consumer surplus, thereby obtaining valuable conclusions for each enterprise and the government. In order to simplify the calculation and at the same time satisfy the size relationship of the parameters in the model as well as the assumptions, the relevant parameters are set as follows: a = 100, e = 0.01, y = 50, c = 0.2, μ = 0.5, δ = 0.1, λ = 0.01. These values meet the parameter requirements and size relationships in the model, but they are not the only possible values. For example, μ = 0.5 corresponds to a moderate-to-high likelihood of hazardous events, which allows the comparison between Model S and Model D to be examined in a range where both scenarios are relevant. δ = 0.1 represents a severe reduction in renewable output during a hazard, consistent with the observation in the Introduction that extreme events can sharply reduce hydropower and photovoltaic output. All parameter values satisfy Assumptions 1–4.
6.1. The Impact of b and h on the Electricity Demand
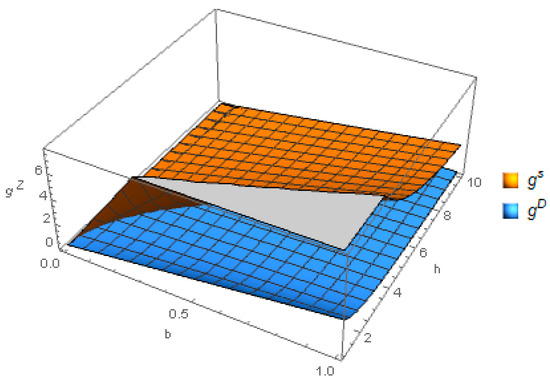
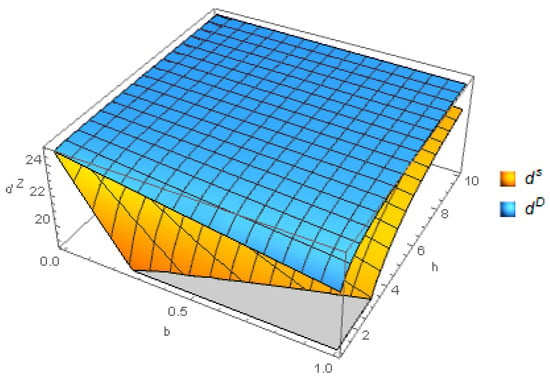
It can be observed from Figure 1 and Figure 2 that, under the combined influence of b and h in Model S within a stable natural environment, the demand for renewable energy electricity g is consistently higher than that in Model D under a natural hazard environment. However, the demand for traditional energy electricity d in Model S is consistently lower than that in Model D. This indicates that in a stable environment, the demand for renewable energy electricity has significant advantages. In Figure 1, as b increases, g exhibits a monotonically increasing trend. That is, the higher the user preference for renewable energy, the greater the demand for renewable electricity. As h increases, g shows a monotonically decreasing trend. The higher the investment cost coefficient, the lower the producer’s willingness to invest in renewable energy, and the less renewable electricity is available in the market. In Figure 2, d exhibits a monotonically increasing trend as h increases. This is mainly because the rising investment cost of renewable energy leads to a reduction in renewable energy supply. To meet the total electricity demand, the market must compensate for the supply gap with traditional energy power, resulting in an increase in d.
Figure 1.
The impact of b and h on the demand for renewable energy electricity.
Figure 2.
The impact of b and h on the demand for traditional energy-based electricity.
The gap between gS and gD widens as h increases, which means that the demand advantage of the stable environment is larger when renewable investment is more costly. This is because a higher h reduces renewable generation in both scenarios, but the reduction is proportionally larger in Model D, where the effective preference coefficient is bδ rather than b.
We can derive the following managerial insight: For producers, in a stable environment, they should seize the market opportunity presented by increasing consumer green preferences, increase investment in renewable energy, and appropriately reduce traditional energy power generation capacity to achieve a low-carbon transition in the energy structure. In hazard-prone areas, producers should avoid over-reliance on renewable energy and maintain a certain scale of traditional energy power generation capacity. For electricity retailers, when hazards occur and renewable energy supply falls short, they should enter into emergency procurement agreements with traditional energy producers in advance to ensure a stable supply of traditional energy power.
6.2. The Impact of μ on the Profit of Producer and Electricity Retailer
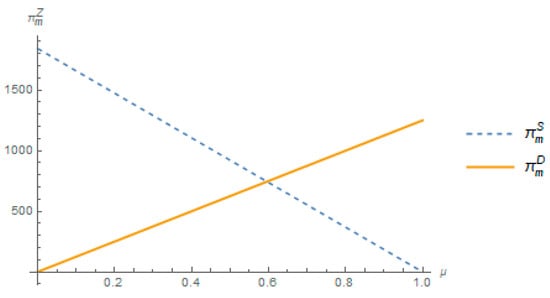
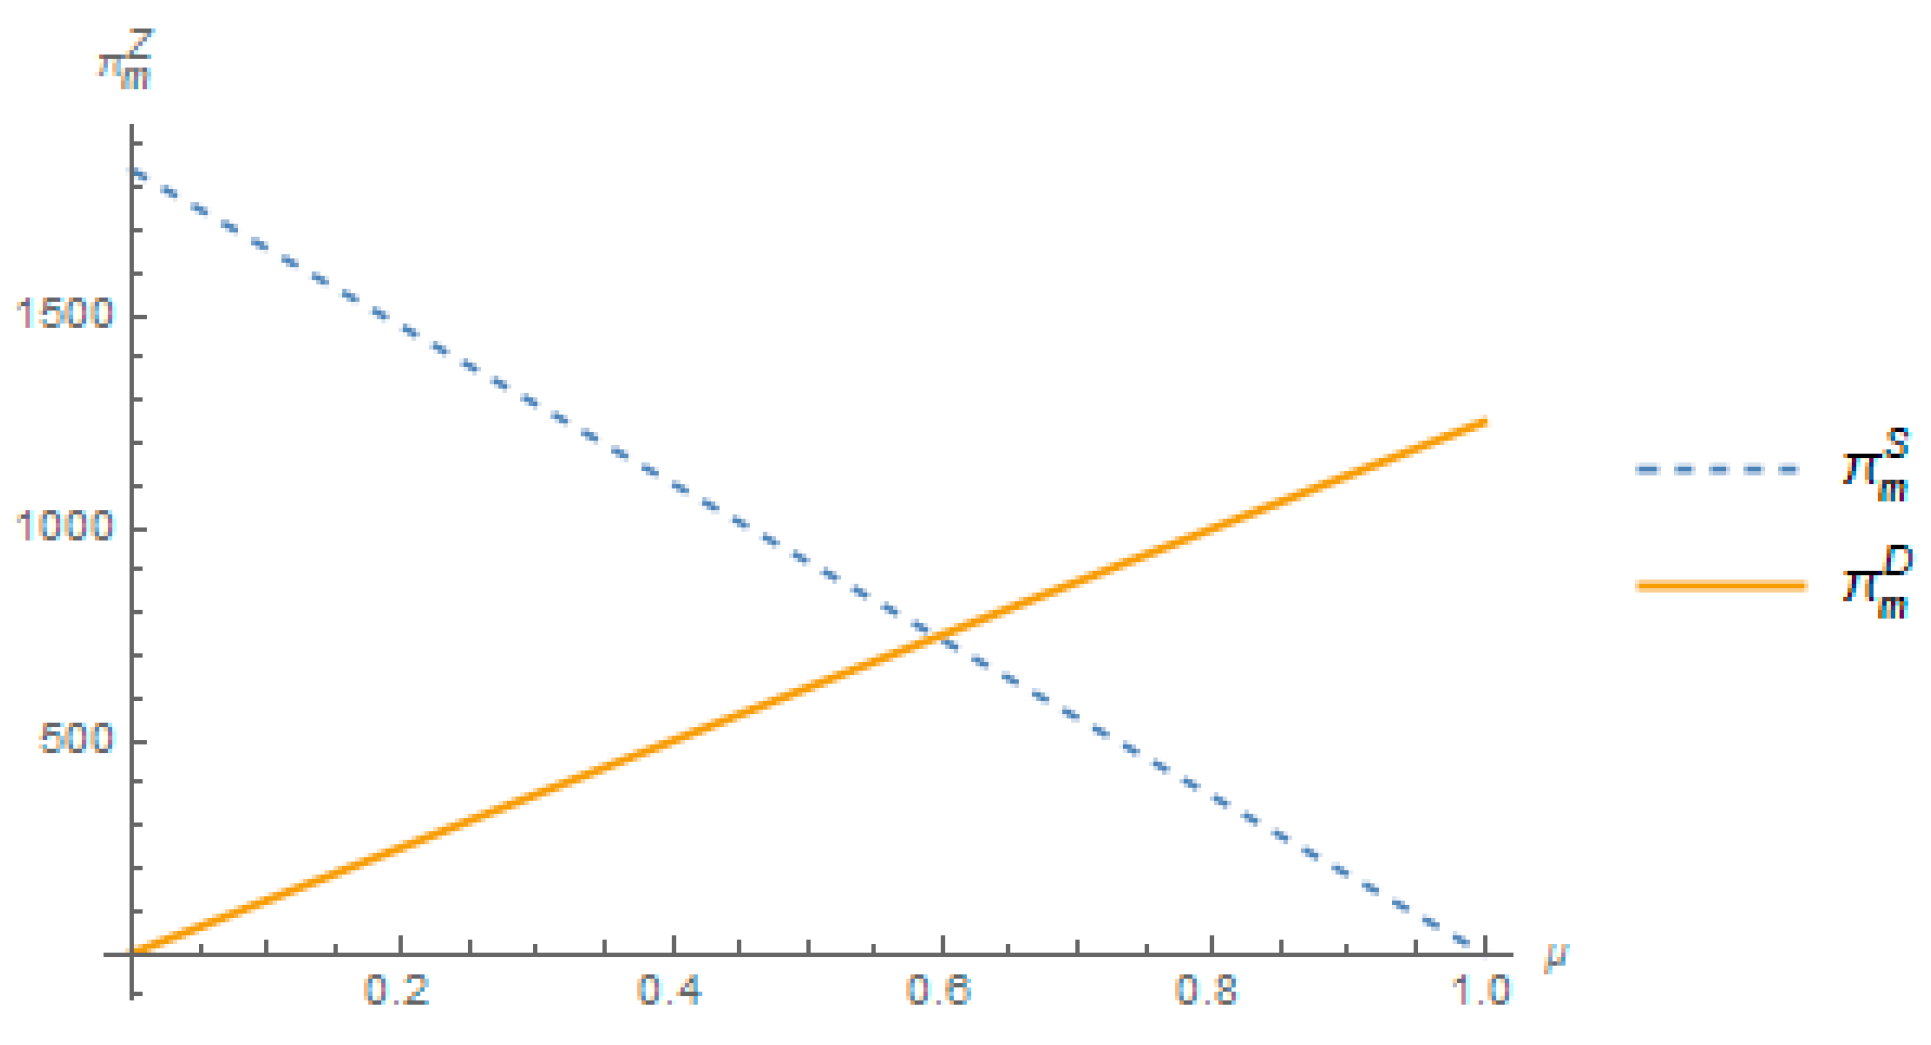
It can be observed from Figure 3 that when the probability of natural hazards occurring μ is low, the producer’s profit in a stable environment (Model S) is significantly higher than that in a hazard-prone environment (Model D). This is mainly because, in a stable environment, the producer does not need to invest additional hazard-resistant capital expenditures. The investment cost of renewable energy can be continuously recovered through stable electricity supply, allowing profit to remain at an optimal level. When the probability of natural hazards occurring μ is high, the producer’s profit in a hazard-prone environment exceeds that in a stable environment. This is because, under hazard conditions, the overall regional electricity supply becomes scarce, and the producer’s effective power supply becomes a valuable resource with stronger market bargaining power, further increasing profit.
Figure 3.
The impact of μ on the profit of producer.
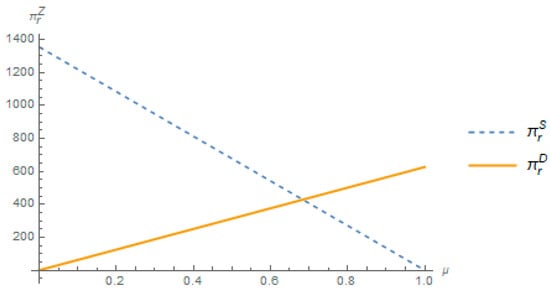
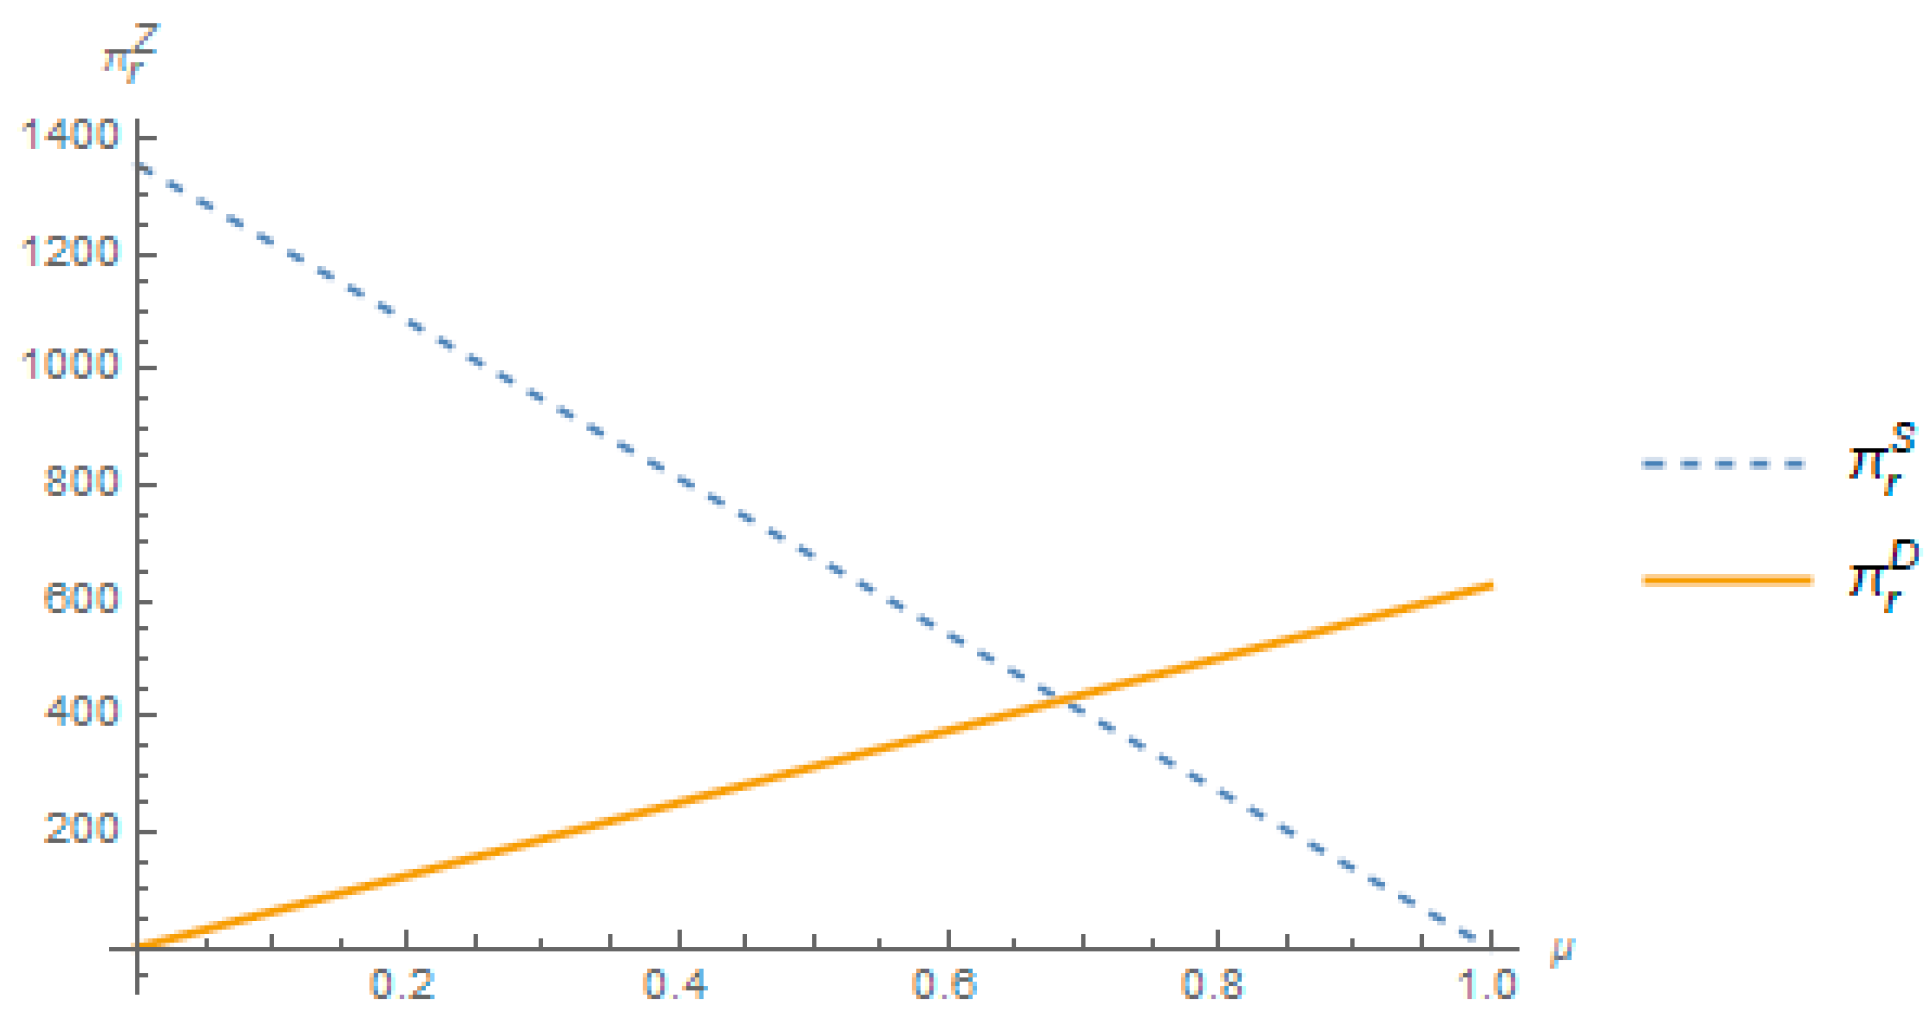
In Figure 4, when μ is small, the retailer’s profit in a stable environment is significantly higher than that in a hazard environment. This is mainly because, in a stable environment, retailers do not need to bear the costs of emergency material procurement and storage, and the retail electricity price has greater pricing flexibility, enabling them to achieve higher profit. When μ is high, the retailer’s profit in a hazard environment exceeds that in a stable environment. This is because, under hazard conditions, retailers can set emergency electricity prices within the scope permitted by policy, thereby realizing the value of scarce resources. Additionally, government financial subsidies for emergency supply efforts help offset some of the costs, ultimately resulting in relatively higher profit for retailers in a hazard environment.
Figure 4.
The impact of μ on the profit of electricity retailer.
From the above analysis, several managerial insights can be identified. At low probabilities of natural hazards, producers should sustain an optimal green energy capacity structure and leverage commercial insurance to transfer risks of infrequent disasters. Under high natural hazard probabilities, producers should boost investments in disaster-resistant energy facilities and conclude long-term emergency power supply contracts with governments and electricity retailers for explicit electricity price stipulation. Producers and electricity retailers should move beyond a single-entity approach to risk response and establish a hazard risk-sharing mechanism within the power supply chain. This may include jointly building a hazard early warning information sharing platform and signing profit-sharing and cost-sharing agreements to maximize the overall profit of the supply chain.
6.3. The Impact of b and h on the Consumer Surplus
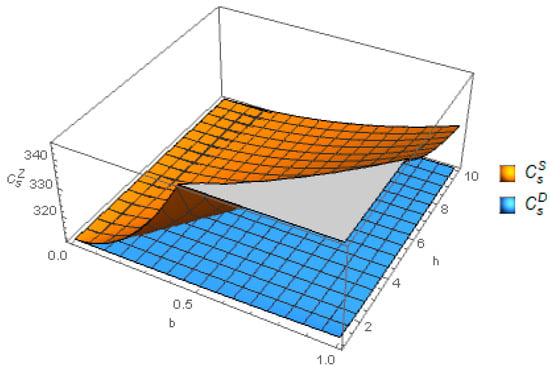
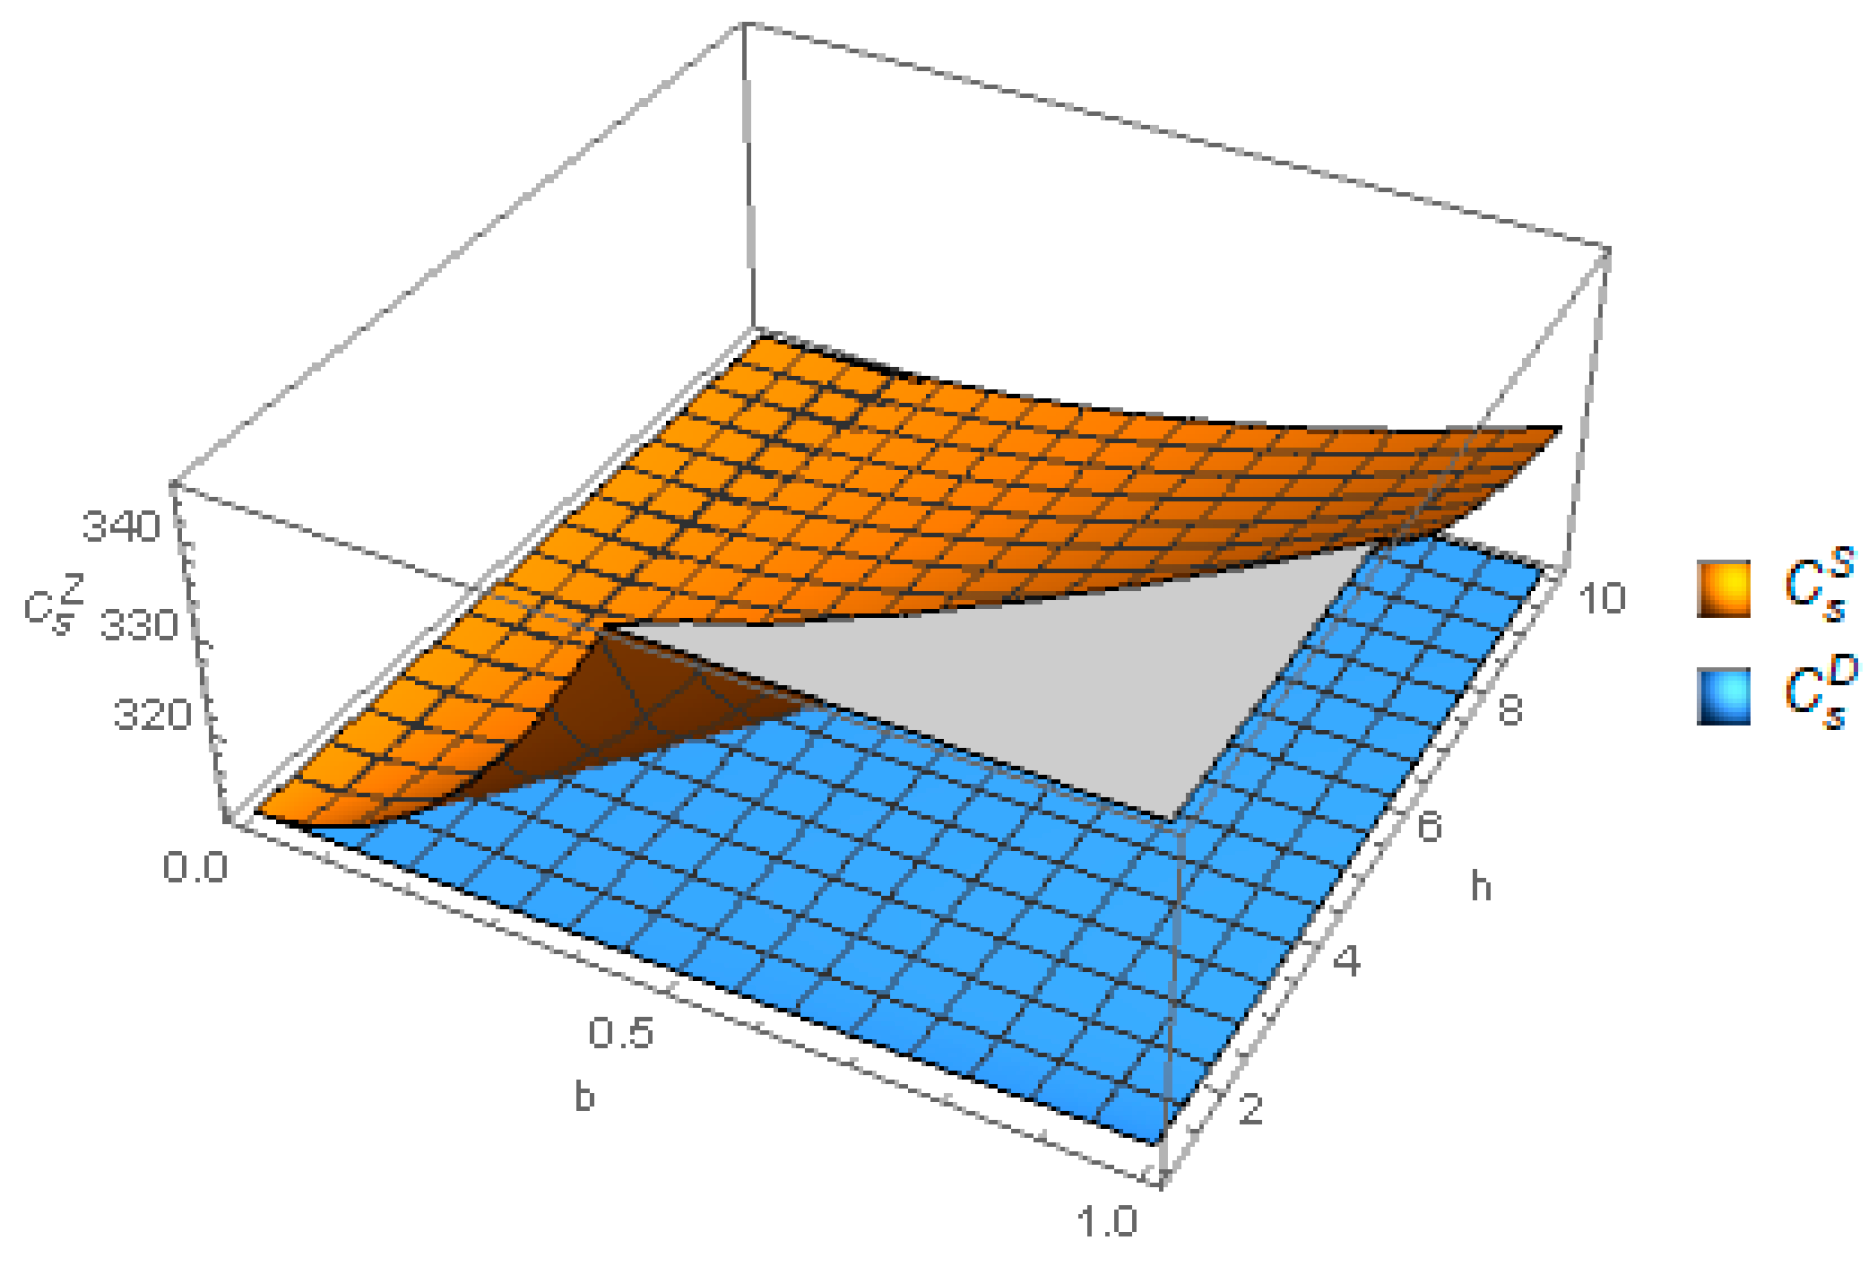
Figure 5 illustrates the variation in consumer surplus under the influence of the renewable energy preference coefficient b and the investment cost coefficient h. Regardless of the values of b and h, consumer surplus in a stable environment consistently exceeds that in a hazard environment, indicating that environmental stability is a prerequisite for safeguarding consumer surplus. In both models, consumer surplus shows a monotonically increasing trend as b increases—that is, the higher the consumer preference for renewable energy, the greater the consumer surplus. Consumer surplus also exhibits a monotonically decreasing trend as h increases, meaning the higher the investment cost of renewable energy, the lower the consumer surplus.
Figure 5.
The impact of b and h on the consumer surplus.
In a stable environment, the producer can simultaneously ensure a stable supply of both renewable and traditional energy, resulting in a market state of oversupply or supply-demand balance, with consumer surplus remaining at a relatively high level. In a hazard environment, the electricity retailer must bear additional costs for emergency material procurement and emergency power procurement. However, these costs may be implicitly passed on to consumers through other means—such as subsequent minor adjustments in electricity prices or a decline in the quality of power supply services—further reducing consumer surplus.
Producers should increase investment in the research and development of renewable energy technologies to reduce investment costs. On the premise of ensuring an adequate power supply, they should introduce diverse electricity products at different price points to meet the varying willingness to pay and preference needs of consumers, thereby enhancing consumer choice value and promoting an increase in consumer surplus. Electricity retailers should develop various incentive strategies to guide consumers in using electricity rationally and promote the green transition of market demand. Additionally, by sharing operational costs during hazard periods jointly with producers and the government, they can prevent a single entity from fully passing on costs to consumers, thereby safeguarding consumer welfare in hazard environments.
7. Conclusions
This study examines decision-making in a two-echelon power supply chain consisting of one power producer and one electricity retailer under natural hazard risk. The producer supplies both traditional and renewable energy and acts as the Stackelberg leader, choosing the wholesale price and renewable energy demand; the retailer acts as the follower, choosing the retail price. Two scenarios are compared: a stable natural environment (Model S) and a natural hazard scenario (Model D). The main conclusions can be summarized into three aspects.
First, when the probability of hazards is low, the producer achieves higher profit under stable natural conditions (Model S). Conversely, when the probability of hazards is high, the producer’s profit under hazard scenarios (Model D) exceeds that in stable environments.
When the unit procurement price of emergency supplies is relatively low, the electricity retailer achieves higher profit in stable environments than in hazard scenarios under low hazard probability. However, when the hazard probability is high, their profit in stable environments falls below that in hazard scenarios. Conversely, when the unit procurement price of emergency supplies is relatively high, the impact of hazard probability on profit reverses.
Second, under stable natural conditions, the optimal wholesale price set by the power producer, the optimal retail price determined by the electricity retailer, the demand for renewable energy electricity, the total electricity demand, and consumer surplus are all higher than those in hazard scenarios. Under the hazard scenario with moderate market demand, the electricity retailer achieves higher profit than the producer when the proportion of renewable energy supply is relatively small. Conversely, when this proportion is larger, the producer’s profit exceeds that of the retailer.
Finally, as the preference coefficient for renewable energy electricity increases, retail electricity prices, electricity demand, profit for both game participants, and consumer surplus all rise. However, the impact of the investment cost coefficient for renewable energy on these factors is the opposite. Additionally, the demand for traditional energy electricity is positively correlated with the investment cost coefficient.
This study explores optimization decision-making in the power supply chain from the perspective of natural hazards and draws several conclusions, though there remains potential for further improvement: (1) The market electricity demand function in this study is assumed to be linear, whereas real-world demand may be influenced by multiple factors. Other functional forms could be further investigated. (2) The model could be extended to multiple producers and multiple retailers in order to examine how horizontal competition and channel power structures affect the pass-through of emergency procurement costs. (3) Future research can delve deeper into this area. Inter-regional emergency material allocation should be introduced into the model, allowing retailers to purchase emergency materials from other regions after a hazard occurs, and allocation costs should be incorporated in the retailer’s profit function.
Author Contributions
Conceptualization, J.D. and K.H.; methodology, F.W.; software, Y.C.; validation, K.H.; formal analysis, Y.C.; investigation, K.H.; resources, J.D.; data curation, Y.C.; writing—original draft preparation, J.D. and F.W.; writing—review and editing, F.W.; visualization, Y.C.; supervision, K.H.; project administration, F.W.; funding acquisition, F.W. All authors have read and agreed to the published version of the manuscript.
Funding
This work was supported by the National Statistical Science Research Project of China (2025LY083); the 2026 Annual Research Projects of the 15th Five-Year Plan for Beijing Municipal Educational Science (ADDB26197); and the Scientific Research Project of Higher Education Institutions in Hebei Province (ZC2026019).
Institutional Review Board Statement
Not applicable.
Informed Consent Statement
Not applicable.
Data Availability Statement
The original contributions presented in this study are included in the article. Further inquiries can be directed to the corresponding author.
Conflicts of Interest
Author Jingping Duan was employed by the company State Grid Material Co., Ltd., Beijing, China. The remaining author declare that the research was conduct in the absence of any commercial or financial relationships that could be construed as a potential conflict of interest.
References
- Chao, H.-P. Efficient pricing and investment in electricity markets with intermittent resources. Energy Policy 2011, 39, 3945–3953. [Google Scholar] [CrossRef] [Scilit]
- Ji, J.; Zhang, Z.; Yang, L. Carbon emission reduction decisions in the retail-/dual-channel supply chain with consumers’ preference. J. Clean. Prod. 2017, 141, 852–867. [Google Scholar] [CrossRef] [Scilit]
- Abdin, A.F.; Fang, Y.P.; Zio, E. A modeling and optimization framework for power systems design with operational flexibility and resilience against extreme heat waves and drought events. Renew. Sustain. Energy Rev. 2019, 112, 706–719. [Google Scholar] [CrossRef] [Scilit]
- Perera, A.T.D.; Nik, V.M.; Chen, D.; Scartezzini, J.-L.; Hong, T. Quantifying the impacts of climate change and extreme climate events on energy systems. Nat. Energy 2020, 5, 150–159. [Google Scholar] [CrossRef] [Scilit]
- Li, L.; Wang, J.; Zhong, X.; Lin, J.; Wu, N.; Zhang, Z.; Meng, C.; Wang, X.; Shah, N.; Brandon, N.; et al. Combined multi-objective optimization and agent-based modeling for a 100% renewable island energy system considering power-to-gas technology and extreme weather conditions. Appl. Energy 2022, 308, 118376. [Google Scholar] [CrossRef] [Scilit]
- Liao, W.; Weng, J.; Liu, D.; Wu, Y. Optimal allocation of distributed renewable generations in low-carbon distribution system considering impact of natural hazards. Front. Energy Res. 2023, 11, 1202054. [Google Scholar] [CrossRef] [Scilit]
- Cao, K.; Guo, Q.; Xu, Y. Information sharing and carbon reduction strategies with extreme weather in the platform economy. Int. J. Prod. Econ. 2023, 255, 108683. [Google Scholar] [CrossRef] [Scilit]
- Fang, Z.; Chiu, Y.-h.; Lin, T.-Y.; Chang, T.-H.; Lin, Y.-N. Analysis of natural hazards and energy efficiency in China. Environ. Dev. Sustain. 2023, 26, 10999–11026. [Google Scholar] [CrossRef] [Scilit]
- Ma, Y.; Feng, G.F.; Chang, C.P. From traditional innovation to green innovation: How an occurrence of natural hazards influences sustainable development? Sustain. Dev. 2023, 32, 2779–2796. [Google Scholar] [CrossRef] [Scilit]
- Zhou, Y.; Li, X.; Han, H.; Wei, Z.; Zang, H.; Sun, G.; Chen, S. Resilience-oriented planning of integrated electricity and heat systems: A stochastic distributionally robust optimization approach. Appl. Energy 2024, 353, 122053. [Google Scholar] [CrossRef] [Scilit]
- Rastegar, H.; Sajjad, A.; Eweje, G.; Kobayashi, K. Sustainability Solution: Renewable Energy Innovation Against Climate Hazards. Bus. Strategy Environ. 2025, 34, 9808–9824. [Google Scholar] [CrossRef] [Scilit]
- Adnan, Z.H.; Chakraborty, K.; Bag, S.; Wu, J.S. Pricing and green investment strategies for electric vehicle supply chain in a competitive market under different channel leadership. Ann. Oper. Res. 2023, 355, 87–122. [Google Scholar] [CrossRef] [Scilit]
- Pan, H.; Zhu, H.; Teng, M. Low-Carbon Transformation Strategy for Blockchain-Based Power Supply Chain. Sustainability 2023, 15, 12473. [Google Scholar] [CrossRef] [Scilit]
- Panahi, H.; Sabouhi, F.; Bozorgi-Amiri, A.; Ghaderi, S.F. A data-driven optimization model for renewable electricity supply chain design. Renew. Sustain. Energy Rev. 2024, 202, 114618. [Google Scholar] [CrossRef] [Scilit]
- Huang, Z.; Zhou, Y.; Lin, Y.; Zhao, Y. Resilience evaluation and enhancing for China’s electric vehicle supply chain in the presence of attacks: A complex network analysis approach. Comput. Ind. Eng. 2024, 195, 110416. [Google Scholar] [CrossRef] [Scilit]
- Zhang, W.; Liu, X.; Zhu, L.; Wang, W.; Song, H. Pricing and production R&D decisions in power battery closed-loop supply chain considering government subsidy. Waste Manag. 2024, 190, 409–422. [Google Scholar] [CrossRef] [Scilit] [PubMed]
- Zhao, L.; Li, J.; Bao, X. Dynamic Emission Reduction Strategy of New Energy Vehicles Based on Technology Investment Under Carbon Trading Policy. Energies 2025, 18, 2851. [Google Scholar] [CrossRef] [Scilit]
- Wu, W. Electric vehicle battery recycling strategy considering channel leadership under the carbon trading mechanism: Cooperation, competition, or monopoly? Energy 2025, 335, 138262. [Google Scholar] [CrossRef] [Scilit]
- Sun, Y.; Ying, Y. Forward–Reverse Blockchain Traceability Strategy in the NEV Supply Chain Considering Consumer Green Preferences. Mathematics 2025, 13, 1804. [Google Scholar] [CrossRef] [Scilit]
- Cao, J.; Zhang, M.; Pan, N.; Han, Y.; Liu, J.; He, Z.; Ai, Z. Optimization of three-echelon logistics supply chain considering emergency scenarios under resilience strategy: A case study in power metering industry. Comput. Ind. Eng. 2025, 203, 110985. [Google Scholar] [CrossRef] [Scilit]
- Gao, A.; Liu, B.; Yue, S. The impact of channel power structures on integrated mode of recycling in a closed-loop battery supply chain. Comput. Ind. Eng. 2025, 208, 111378. [Google Scholar] [CrossRef] [Scilit]
- Chu, H.; Zhang, W.; Zhu, L. The impact of government policies on the coordination of power battery closed-loop supply chain. J. Clean. Prod. 2025, 519, 145961. [Google Scholar] [CrossRef] [Scilit]
- Wang, L.; Xu, T.; Chen, T. Optimal Strategies in Green Supply Chains When Considering Consumers’ Green Preferences and Government Subsidies. Mathematics 2025, 13, 2209. [Google Scholar] [CrossRef] [Scilit]
- Han, X.; Liu, X. A competitive supply chain model considering consumer green preference under demand uncertainty. Oper. Res. 2025, 25, 57. [Google Scholar] [CrossRef] [Scilit]
- Menanteau, P.; Finon, D.; Lamy, M.-L. Prices versus quantities: Choosing policies for promoting the development of renewable energy. Energy Policy 2003, 31, 799–812. [Google Scholar] [CrossRef] [Scilit]
- Ghosh, D.; Shah, J. Supply chain analysis under green sensitive consumer demand and cost sharing contract. Int. J. Prod. Econ. 2015, 164, 319–329. [Google Scholar] [CrossRef] [Scilit]

Disclaimer/Publisher’s Note: The statements, opinions and data contained in all publications are solely those of the individual author(s) and contributor(s) and not of MDPI and/or the editor(s). MDPI and/or the editor(s) disclaim responsibility for any injury to people or property resulting from any ideas, methods, instructions or products referred to in the content. |
© 2026 by the authors. Licensee MDPI, Basel, Switzerland. This article is an open access article distributed under the terms and conditions of the Creative Commons Attribution (CC BY) license.