


Abstract
Stay-cable forces in cable-stayed bridges without backstays may deviate from their design values during service, compromising safety and motivating regulation. This paper reports an in-service cable-force regulation project for the Jinzhou Bridge. A previous study characterized the in-service state of the bridge, determined its reasonable target state, and established and calibrated the corresponding finite element (FE) models; these results are adopted here as the research baseline. The maximum measured cable-force deviation was 78.95%, occurring in cable C2. The present study focuses on the stage-by-stage transition between the prescribed in-service and target states. Two opposite regulation sequences were evaluated stage by stage through FE simulations: Scheme A (from short cable C1 to long cable C9) and Scheme B (from long cable C9 to short cable C1), with the intermediate cable-force redistribution and the corresponding stress and deformation responses of the girder and tower examined at each stage. After satisfying the prescribed strength and alignment constraints, Scheme B was selected for field implementation because of its smaller process-induced cable-force fluctuations. The effect of the regulation sequence was particularly pronounced for the long cables C8 and C9, whose standard deviations under Scheme A were approximately 3.5 and 5 times those under Scheme B, respectively. Under Scheme B, the reductions applied to individual cables at their regulation stages ranged from 1856 to 14,646 kN. The required anchor-cup pullout control values ranged from 16.6 to 383.9 mm. The proposed framework advances the analysis from prescribed-state determination to constrained transition-path design and provides an implementable approach for in-service cable-force regulation of cable-stayed bridges without backstays.
1. Introduction
A cable-stayed bridge consists of a pylon (tower), a girder (deck system), and stay cables. The stay cables provide inclined tensile support to the girder, while the pylon primarily resists the resulting compressive force and bending moment [1,2,3]. A cable-stayed bridge without backstays omits the shore-side stays used in conventional layouts, and the unbalanced girder load is mainly counteracted by the self-weight and stiffness of the pylon and its connection to the girder [4]. Recent work continues to examine this distinctive asymmetric structural form.
In general, the load of a cable-stayed bridge is carried by the stay cables and the girder. Stay cables are vital components of the cable-stayed bridge. A stay cable transmits the weight of the bridge span and most of the live load to the tower through tension, while providing elastic support points and external prestress for the main girder. Stay-cable force is a key parameter governing the internal-force state of a cable-stayed bridge, and variations in cable force can directly affect girder stress and structural safety [5]. In the current Chinese specification JTG/T 3365-01-2020 [6], the safety of stay cables is evaluated using a limit-state formulation rather than a single prescribed global safety factor. For dead- and live-load proportions ranging from 0.9:0.1 to 0.7:0.3, the corresponding equivalent safety factor is approximately 2.48–2.56. Therefore, the stress level of each stay cable remains an important indicator for evaluating its safety margin and determining whether cable-force regulation is required. For the asymmetric cable–tower–girder system of a cable-stayed bridge without backstays, cable-force regulation is therefore particularly important [7].
Cable forces are designed to achieve a reasonable completion-stage internal-force state and are controlled during construction to satisfy stage-wise requirements. During service, re-regulation may be needed to mitigate long-term deviations and to improve internal forces and alignment under sustained actions.
For existing cable-stayed bridges, the need for cable-force re-regulation is typically justified within a specification-oriented evaluation framework that combines strength/serviceability checks with inspection or assessment evidence [6,8]. Construction-stage analysis, especially for cantilever erection, has been widely used to track the evolution of cable forces and geometry and to support assessment-oriented back-analysis [9]. Moreover, fatigue-related studies have shown that cable arrangement can influence cable stress ranges and long-term performance, providing an important background for evaluating in-service cable systems [10]. Recent research has also reported monitoring-based identification and evaluation of stay-cable forces to support maintenance decision-making [11,12,13].
Cable-force deviations may develop during service due to relaxation, anchorage slip, shrinkage and creep, settlement, and maintenance activities, which can significantly alter the internal-force state and alignment [14]. Therefore, in-service cable-force regulation is often required to restore a reasonable stress state and acceptable alignment.
Engineering practice indicates that in-service cable-stayed bridges may require cable-force re-regulation and/or stay-cable replacement to restore a reasonable stress state and controllable geometry when significant deviations develop over time. Case-specific reports document the General Rafael Urdaneta Bridge [15,16]. Related literature covers cable-replacement design [17], corrosion protection and inspection [18,19], corroded-wire performance and general cable-stayed-bridge design [20,21], the Hale Boggs Bridge [22,23,24], the Annacis Bridge [25,26], GPS-based structural monitoring and long-span bridge practice [27,28], and cable replacement of the Tianjin Yonghe Bridge [29]. Recent studies address cable-loss risk and construction-stage optimization [30,31], radar-based measurement and monitoring-data quality [32,33], data-driven damage and corrosion assessment [34,35], and advanced cable-force identification, maintenance, and optimization methods [36,37,38,39,40].
However, for cable-stayed bridges without backstays, the asymmetric cable–tower–girder system is more sensitive to cable-force redistribution, and implementation-oriented guidance for in-service regulation remains limited.
A previous study on the Jinzhou Bridge [41] evaluated the existing internal-force state using the measured cable forces and girder–tower alignment, established and calibrated the corresponding finite element models, and determined a reasonable target internal-force state and the associated target cable forces through cable-force-sensitivity and stress-feasible-region analyses. These results provide the initial state, computational baseline, and prescribed target state required for subsequent cable-force regulation. However, that study did not report a stage-by-stage comparison of alternative regulation sequences, particularly the sequence-dependent redistribution of cable forces and structural responses during the intermediate regulation stages.
Building on the baseline established in Reference [41], the present study focuses on the stage-by-stage transition from the existing in-service state to the prescribed target state. Two opposite cable-force regulation sequences are simulated to investigate intermediate cable-force redistribution and the corresponding stress and deformation responses of the girder and tower. The candidate regulation paths are evaluated considering structural safety, alignment control, and construction feasibility, while the stage-wise cable-force fluctuations are quantified to support regulation-sequence selection. The required cable-force adjustments are subsequently converted into anchor-cup pullout control values by accounting for cable elastic elongation and girder–tower deformation, providing directly controllable parameters for field implementation.
2. Description of the Bridge
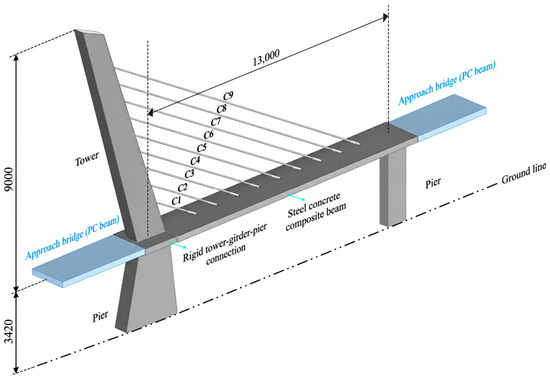
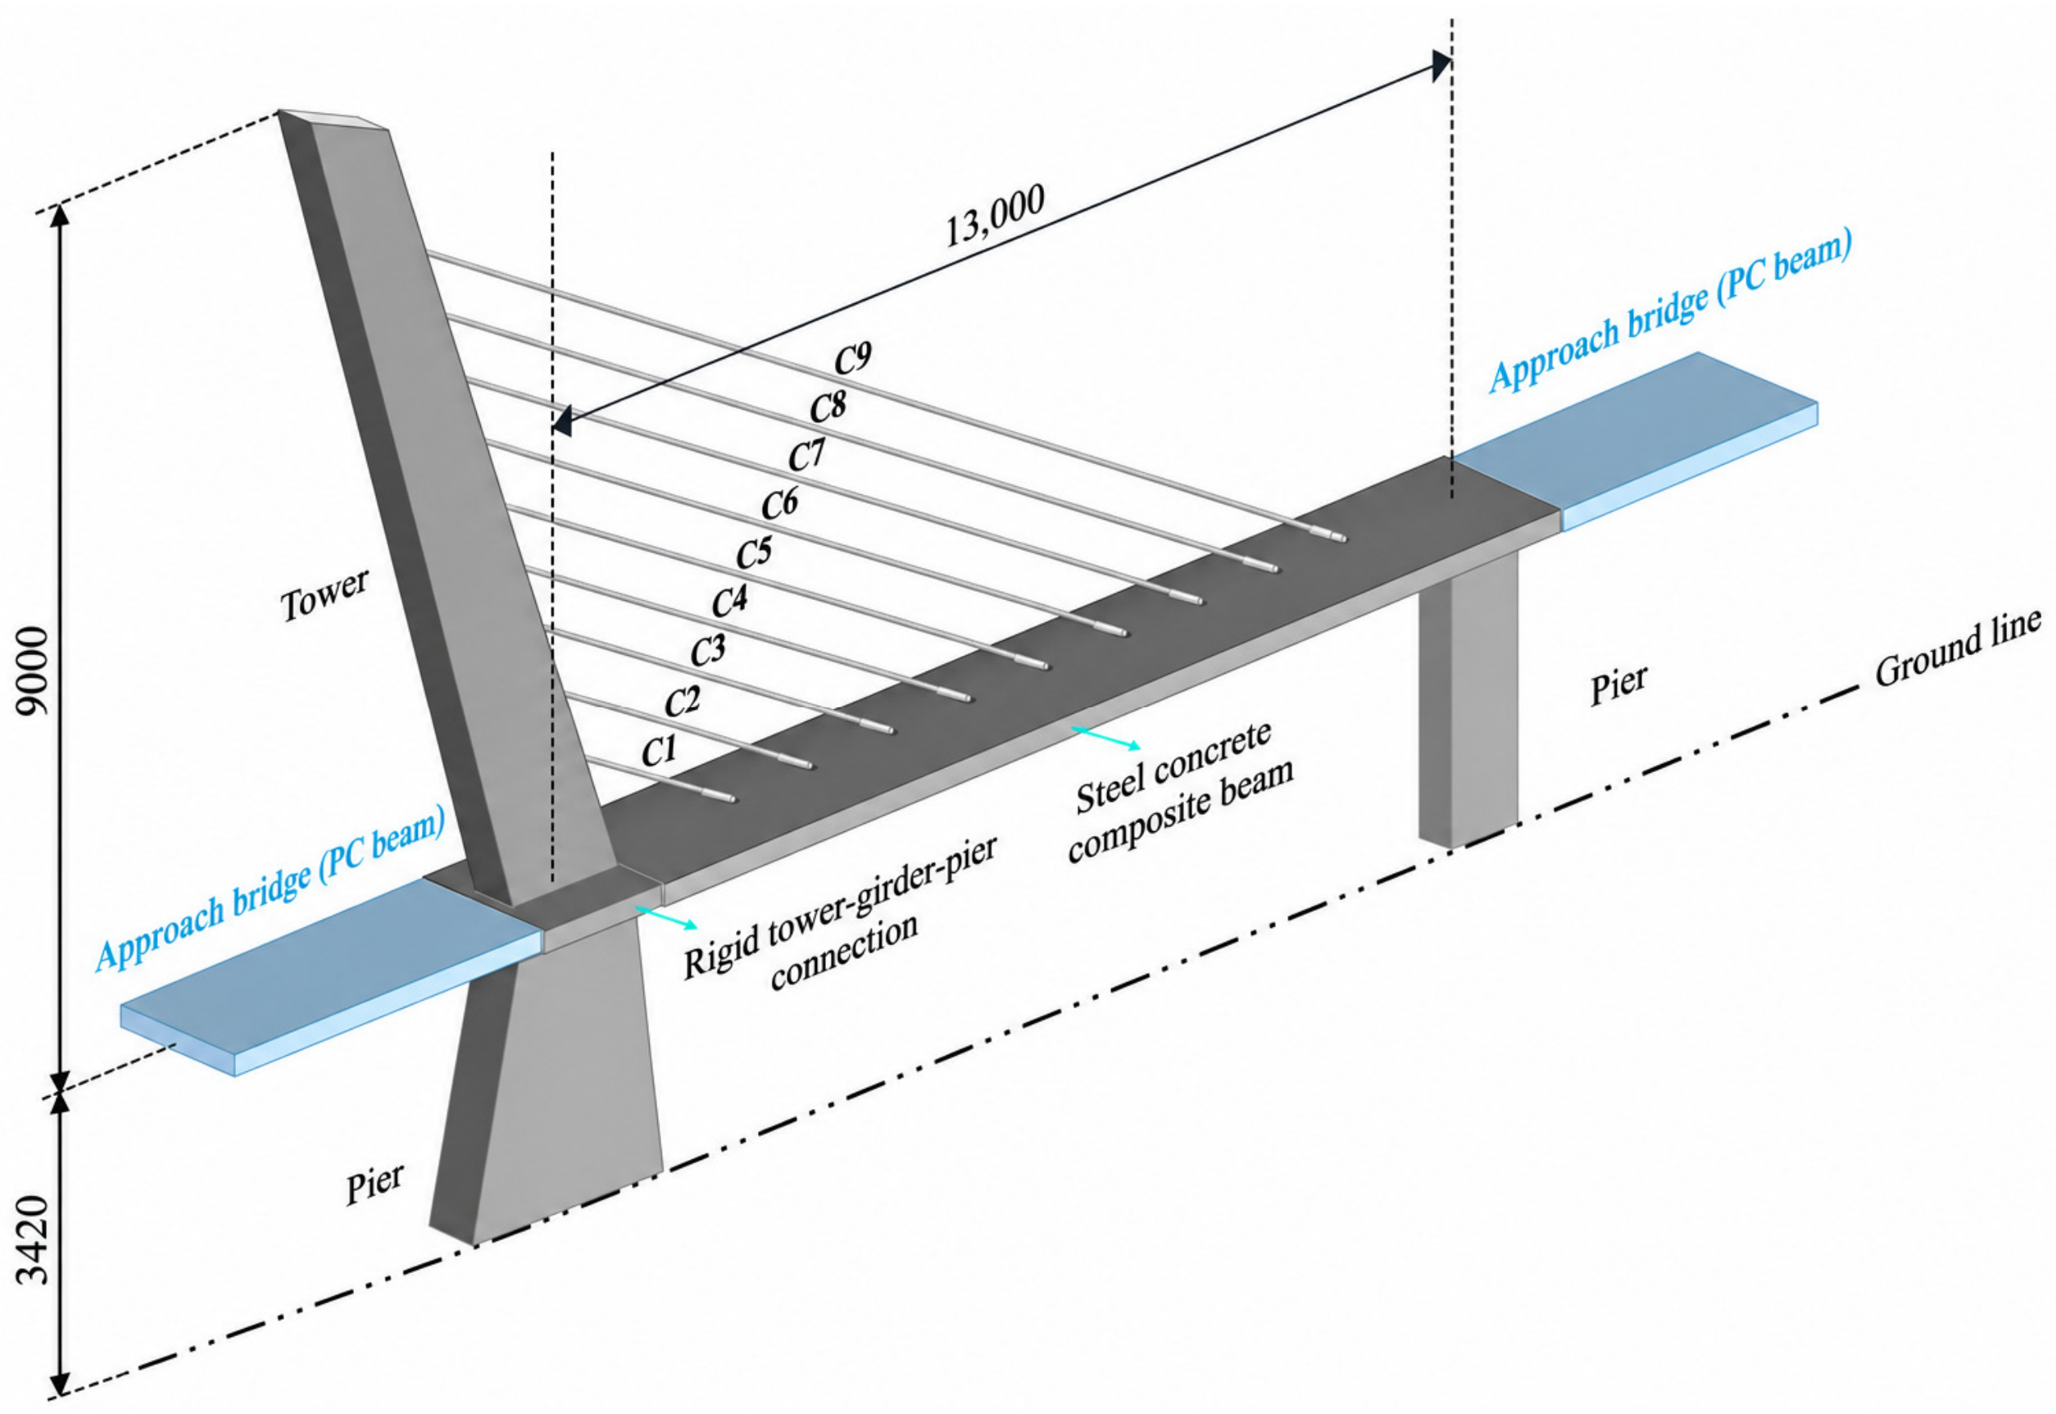
The Jinzhou Bridge crosses the Shenyang–Dalian Expressway and the Harbin–Dalian Passenger Dedicated Line in the Jinbo Coast Modern Service Industry Development Area of the Liaoning Coastal Economic Zone. The bridge centerline is located at chainage K2 + 300.00. The bridge is a cable-stayed bridge without backstays with a main span of 130 m. The 124.2 m-high main tower is rigidly connected to the girder and pier. The maximum longitudinal slope of the bridge deck is 1.38%. The main span is on a convex vertical curve with a radius of 1400 m. The design vehicular load is Highway Class I. According to the original design documents, the design service life of the Jinzhou Bridge is 100 years, consistent with the design requirement for cable-stayed bridges specified in JTG/T 3365-01-2020 [6]. A three-dimensional schematic layout of the Jinzhou Bridge is shown in Figure 1.
Figure 1.
Three-dimensional schematic layout of the Jinzhou Bridge [cm].
- (1)
- Beam
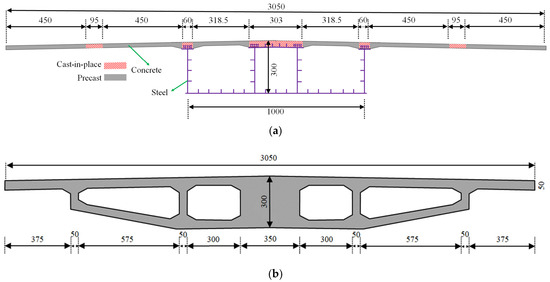
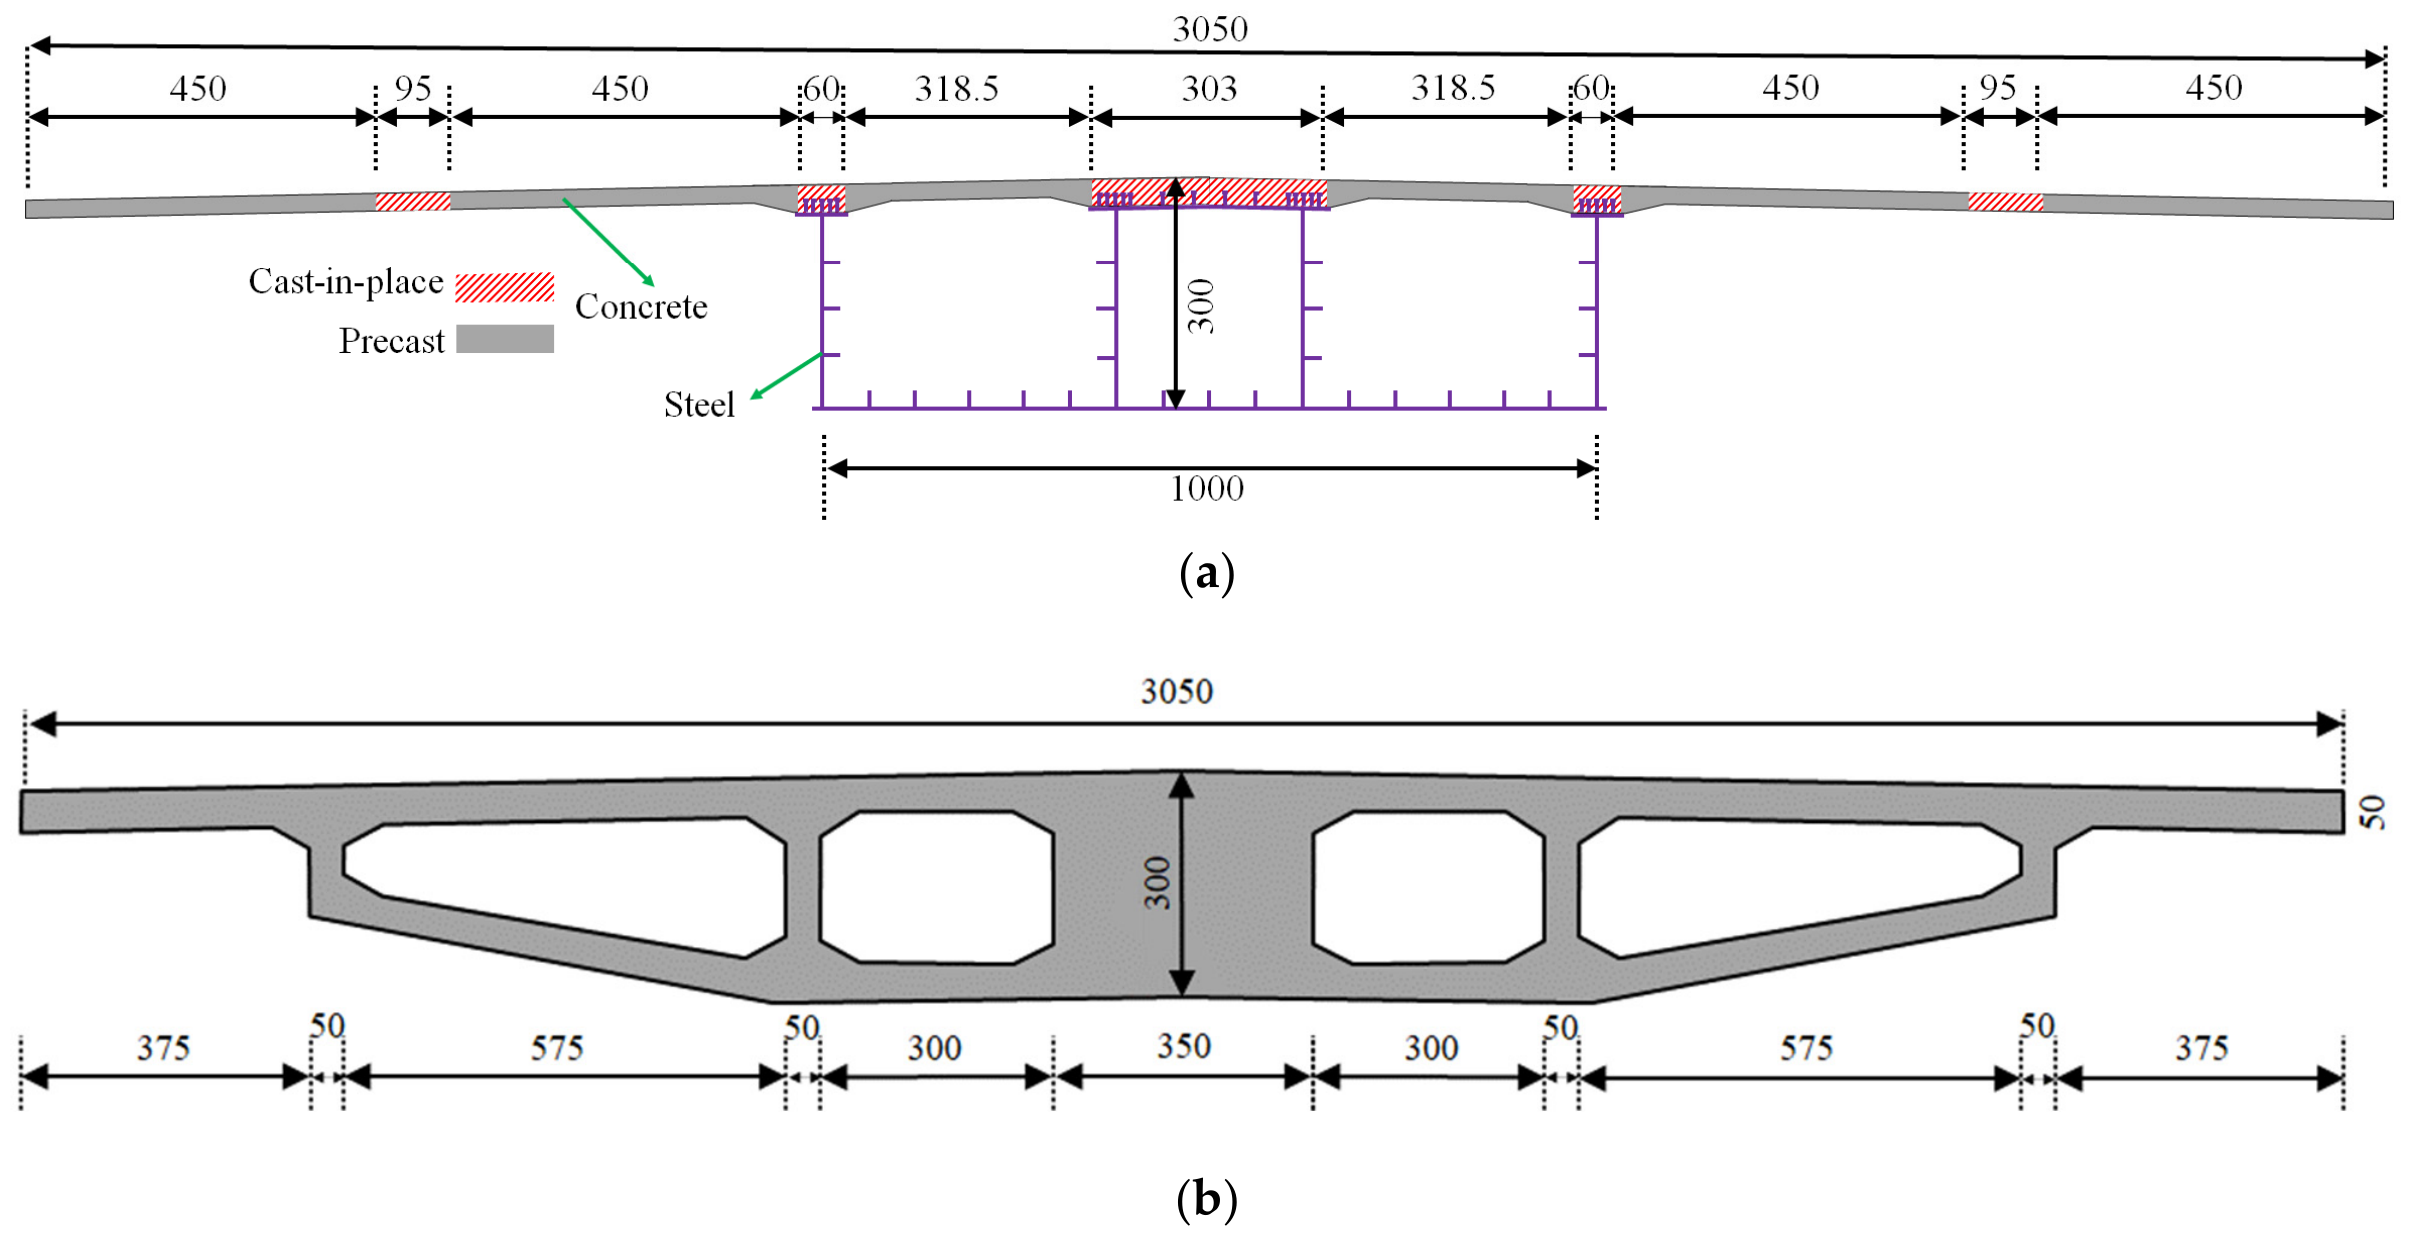
The main girder of the Jinzhou Bridge is a steel–concrete composite box girder. The girder depth is 3 m. The bottom plate and webs of the box girder are made of steel, whereas the top slab is made of C50 polypropylene-fiber-reinforced concrete. The top and bottom widths of the box girder are 30.5 m and 10.0 m, respectively. The cross-section is a three-box structure with cantilevered beams on the outside and a longitudinal bridge spacing of 4 m. A concrete box-girder section with the same depth as the composite girder is adopted at the tower root. The composite and concrete girder sections are shown in Figure 2.
Figure 2.
Girder sections: (a) composite girder section [cm]; (b) concrete girder section [cm].
- (2)
- Tower
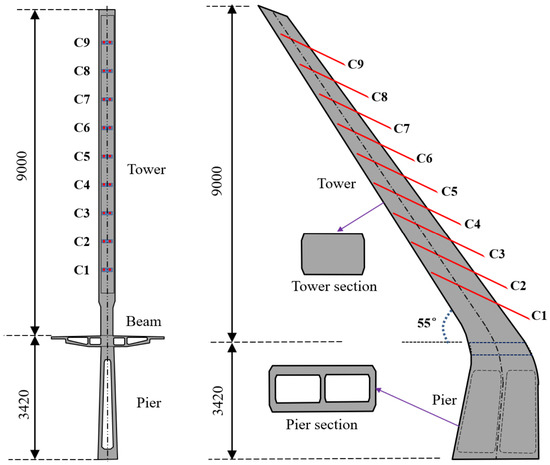
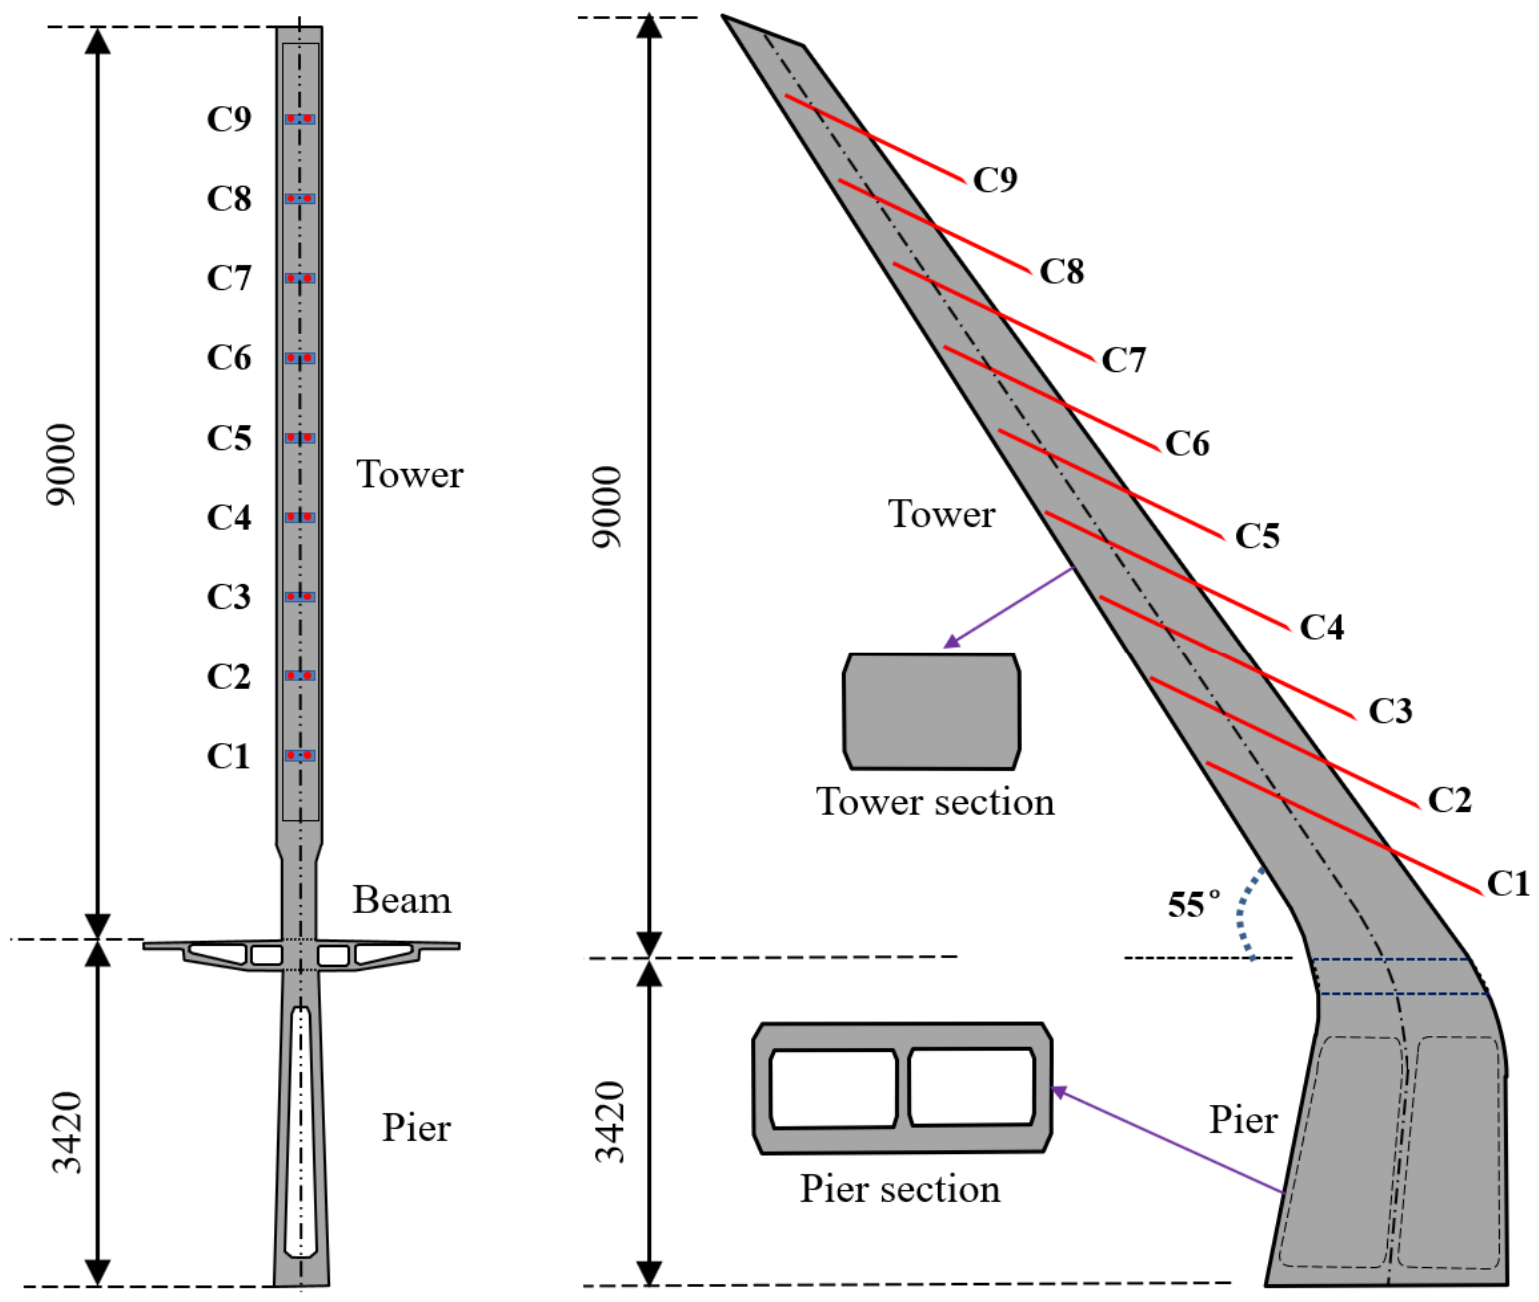
The tower of the Jinzhou Bridge is a single-column concrete tower. The tower is inclined at an angle of 55° to the horizontal. The full height of the tower is 124.2 m. The lower and upper tower segments have variable box and rectangular cross-sections, respectively. The layout of the tower is shown in Figure 3.
Figure 3.
Layout of tower [cm].
- (3)
- Stay cable
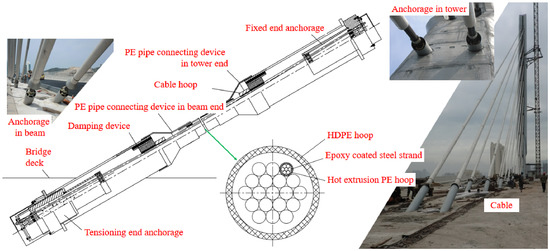
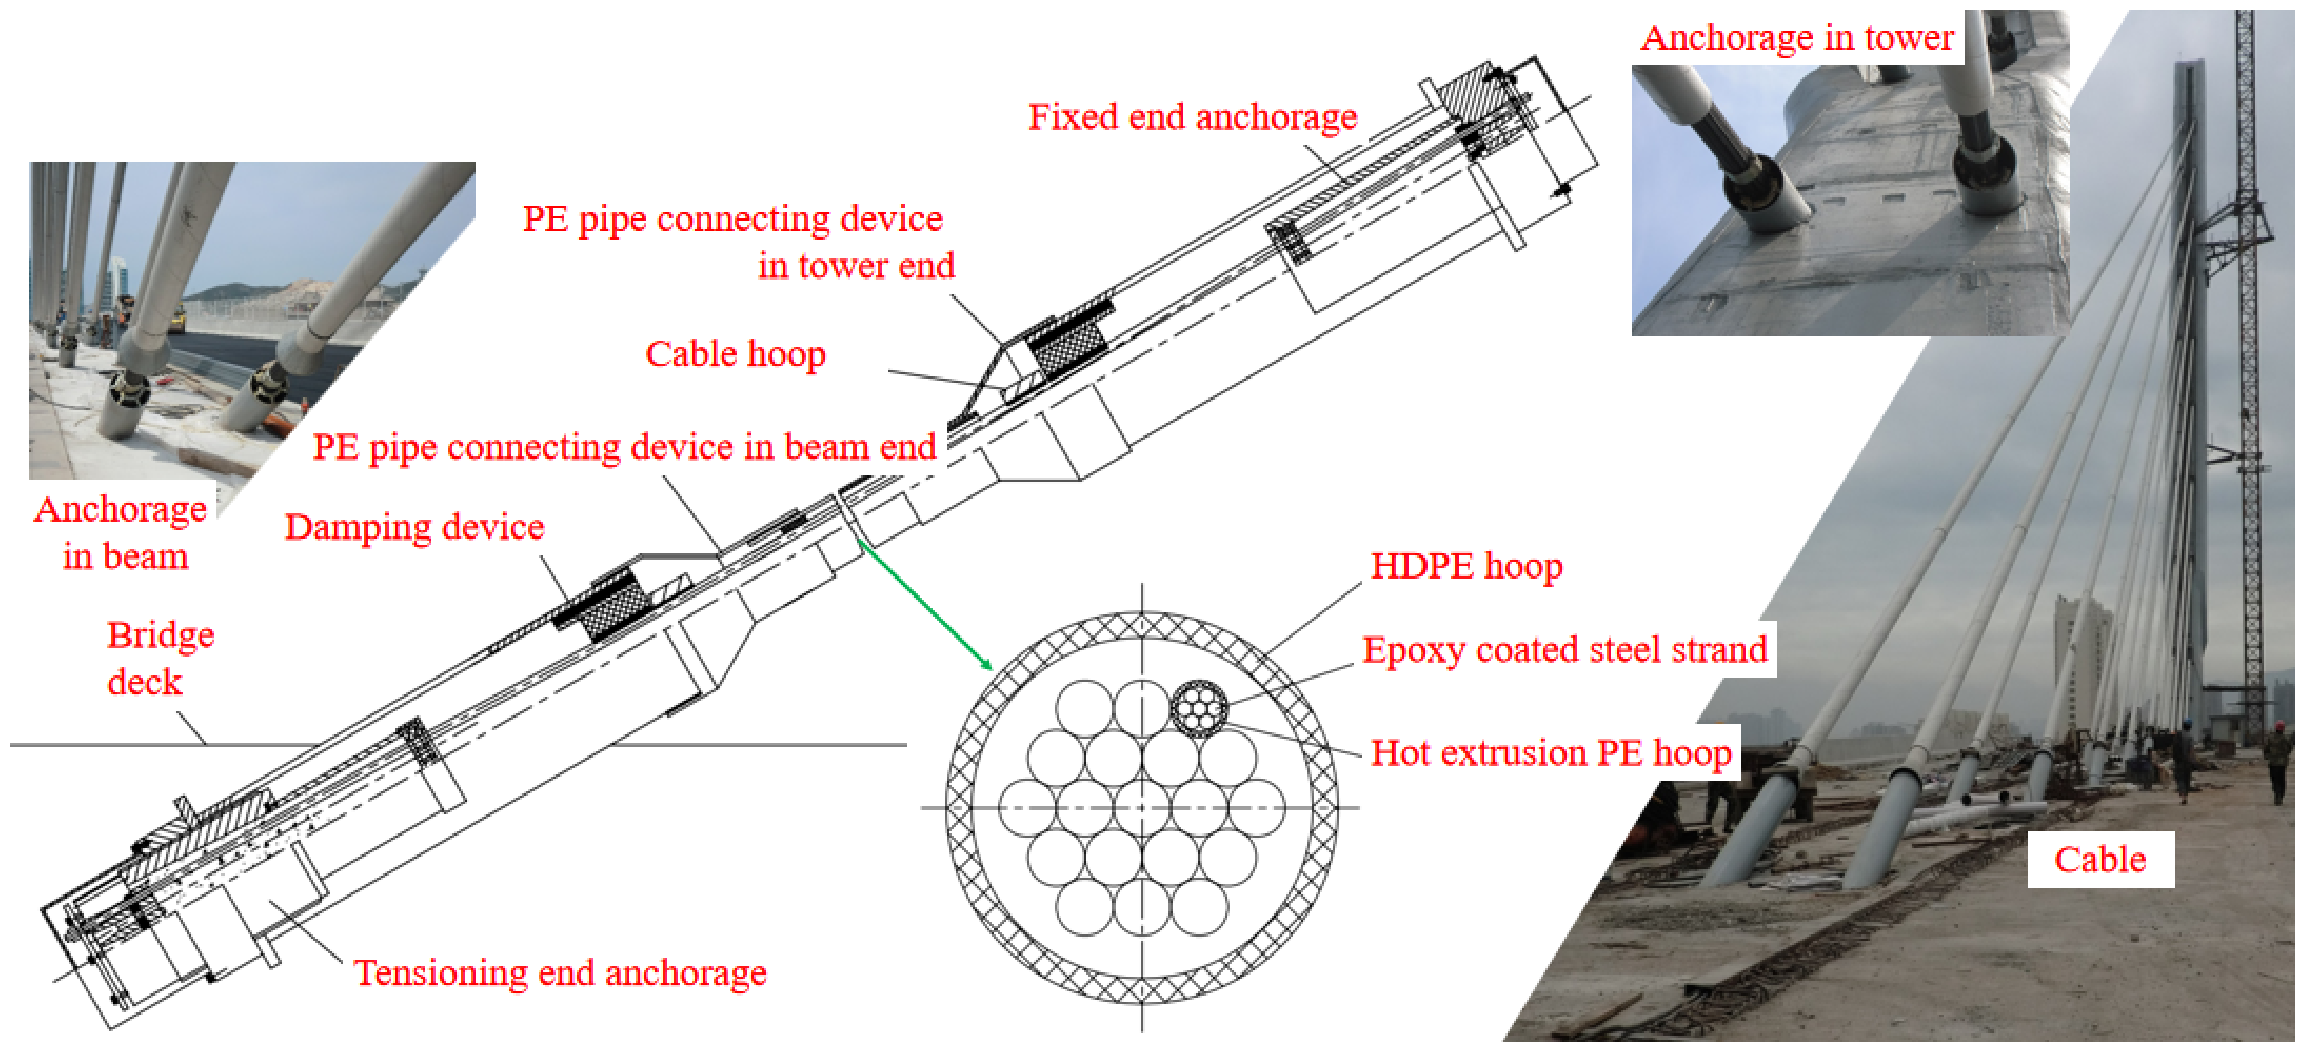
The stay cables are arranged in a harp configuration. Transverse spacing of tie anchor points on the beam is 1.6 m. The standard spacing of the stay cables on the girder is 12.0 m. The distance between the first pair of diagonal cables (C1) and the intersection of the tower and the beam is 22.0 m. The longest and shortest cables are 196.056 m and 44.732 m, respectively. Three layers of corrosion protection are provided for the stay cables. Each steel strand is epoxy-coated and sheathed with PE, and the strands are bundled and wrapped with an HDPE jacket. The standard strength of the steel strand is 1860 MPa, and the nominal diameter is 15.2 mm. Fixed-end anchorages are located at the tower, whereas tensioning-end anchorages are located in the girder. The anchorage tooth block, embedded cable, pre-buried pipe, and anchor plate are arranged on the tower and are connected with the main girder in the form of a steel anchor box. The layout of the cable is presented in Figure 4.
Figure 4.
Layout of cable.
3. Cable Force State and Finite Element Model
3.1. Cable Force State
The measured cable forces, girder–tower alignment, and basic cable parameters used to characterize the initial in-service state were previously reported in Reference [41] and are adopted here as baseline information for the subsequent regulation-path analysis. The cable forces were obtained using a cable-force dynamic tester with an accelerometer (both manufactured by Kingmach Measurement & Monitoring Technology Co., Ltd., Changsha, China). The accelerometer was secured to each stay cable using a fastening strap at a location away from the anchorage. Each cable was manually excited using a rubber hammer, and the recorded vibration response was analyzed in the frequency domain.
For cable-force identification, each stay cable was idealized as a taut chord hinged at both ends, with its bending stiffness neglected. The cable force was determined from the identified natural frequencies, cable weight per unit length, and effective calculation length. The effective cable length was corrected considering the measured girder elevation, longitudinal tower deviation, and the influence of the dampers near the anchorages. The corrected cable lengths and identified frequencies were used to determine the measured cable forces listed in Table 1, following the vibration-frequency identification and damper-related effective-length correction procedure reported for the Jinzhou Bridge in Reference [41].
Table 1.
Safety factor of stay cables.
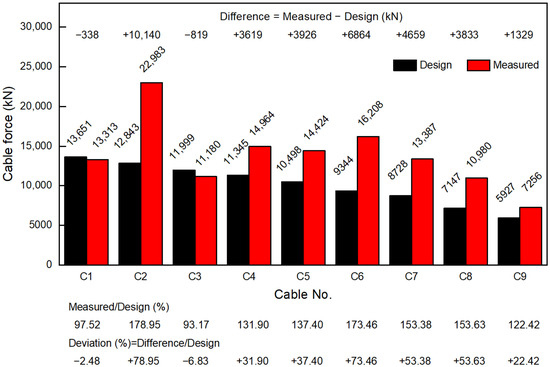
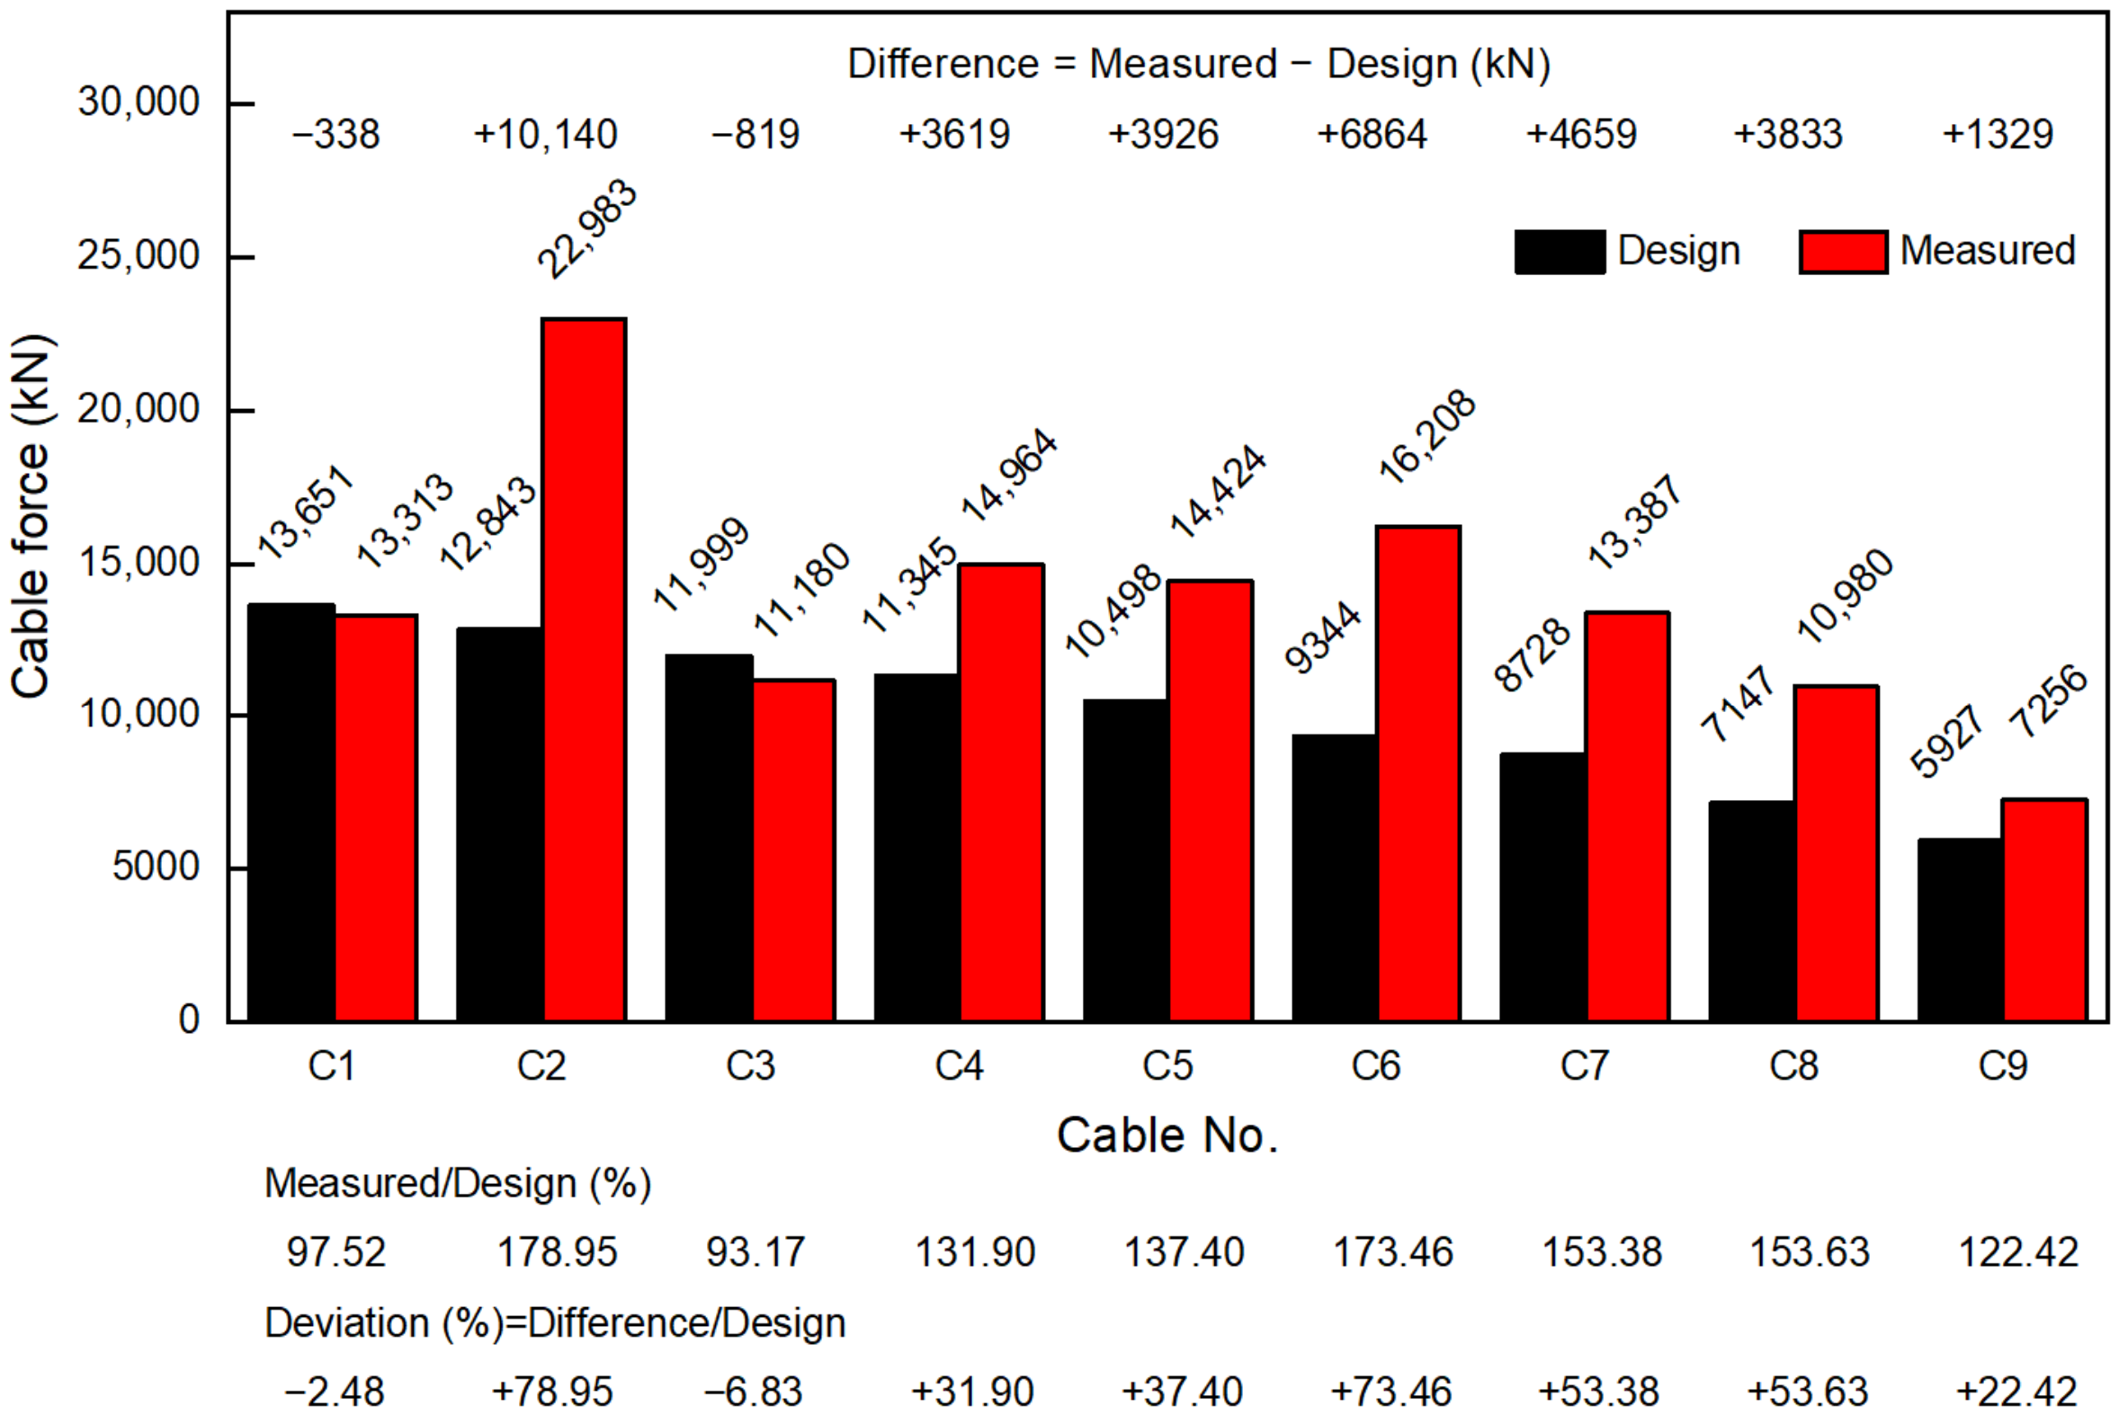
The original design cable forces were obtained from the construction drawings of the Jinzhou Bridge. Figure 5 compares them with the measured in-service cable forces and presents the signed force differences, measured-to-design ratios, and percentage deviations.
Figure 5.
Comparison of design and measured cable forces.
As shown in Figure 5, the measured cable forces of C1 and C3 are 2.48% and 6.83% lower than their design values, respectively. The measured cable forces of the other cables (C2 and C4–C9) are greater than their corresponding design values. Among the cables whose measured forces exceed their design values, C9 has the smallest deviation (22.42%), whereas C2 has the largest (78.95%), followed by C6 (73.46%). Summing the nine measured cable forces gives 124,695 kN, which is 33,213 kN (36.31%) greater than the sum of the nine design values. The absolute deviations of cables C2–C9 and of the sum of the measured cable forces exceed the 5% deviation criterion.
Epoxy-coated anticorrosive steel strands are used in the stay cables of the Jinzhou Bridge. The strand diameter and standard tensile strength are 15.2 mm and 1860 MPa, respectively. Table 1 lists the size, measured cable force, and safety factor of the stay cables. The equivalent safety factors of cables C1 and C3–C9 exceed 2.48, which is the lower bound of the equivalent safety-factor range derived from JTG/T 3365-01-2020 [6]. In contrast, the equivalent safety factor of cable C2 is 2.14, indicating an insufficient safety margin and the need for cable-force regulation.
3.2. Finite Element Model (FE Model)
The internal-force state of an existing cable-stayed bridge without backstays is determined by several main factors, including structural dead load, actual alignment, and actual cable force. It is therefore critical to determine the internal-force state of the existing bridge before adjusting cable force. Structural design drawings, measured cable forces, and the alignment of the girder and tower can be used to calibrate the FE model. The original FE model of the Jinzhou Bridge was established from the design drawings, and the construction process was simulated to obtain the design alignment and cable forces. The dead load and other relevant parameters were then determined from the completion information.
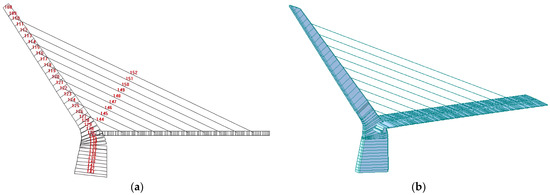
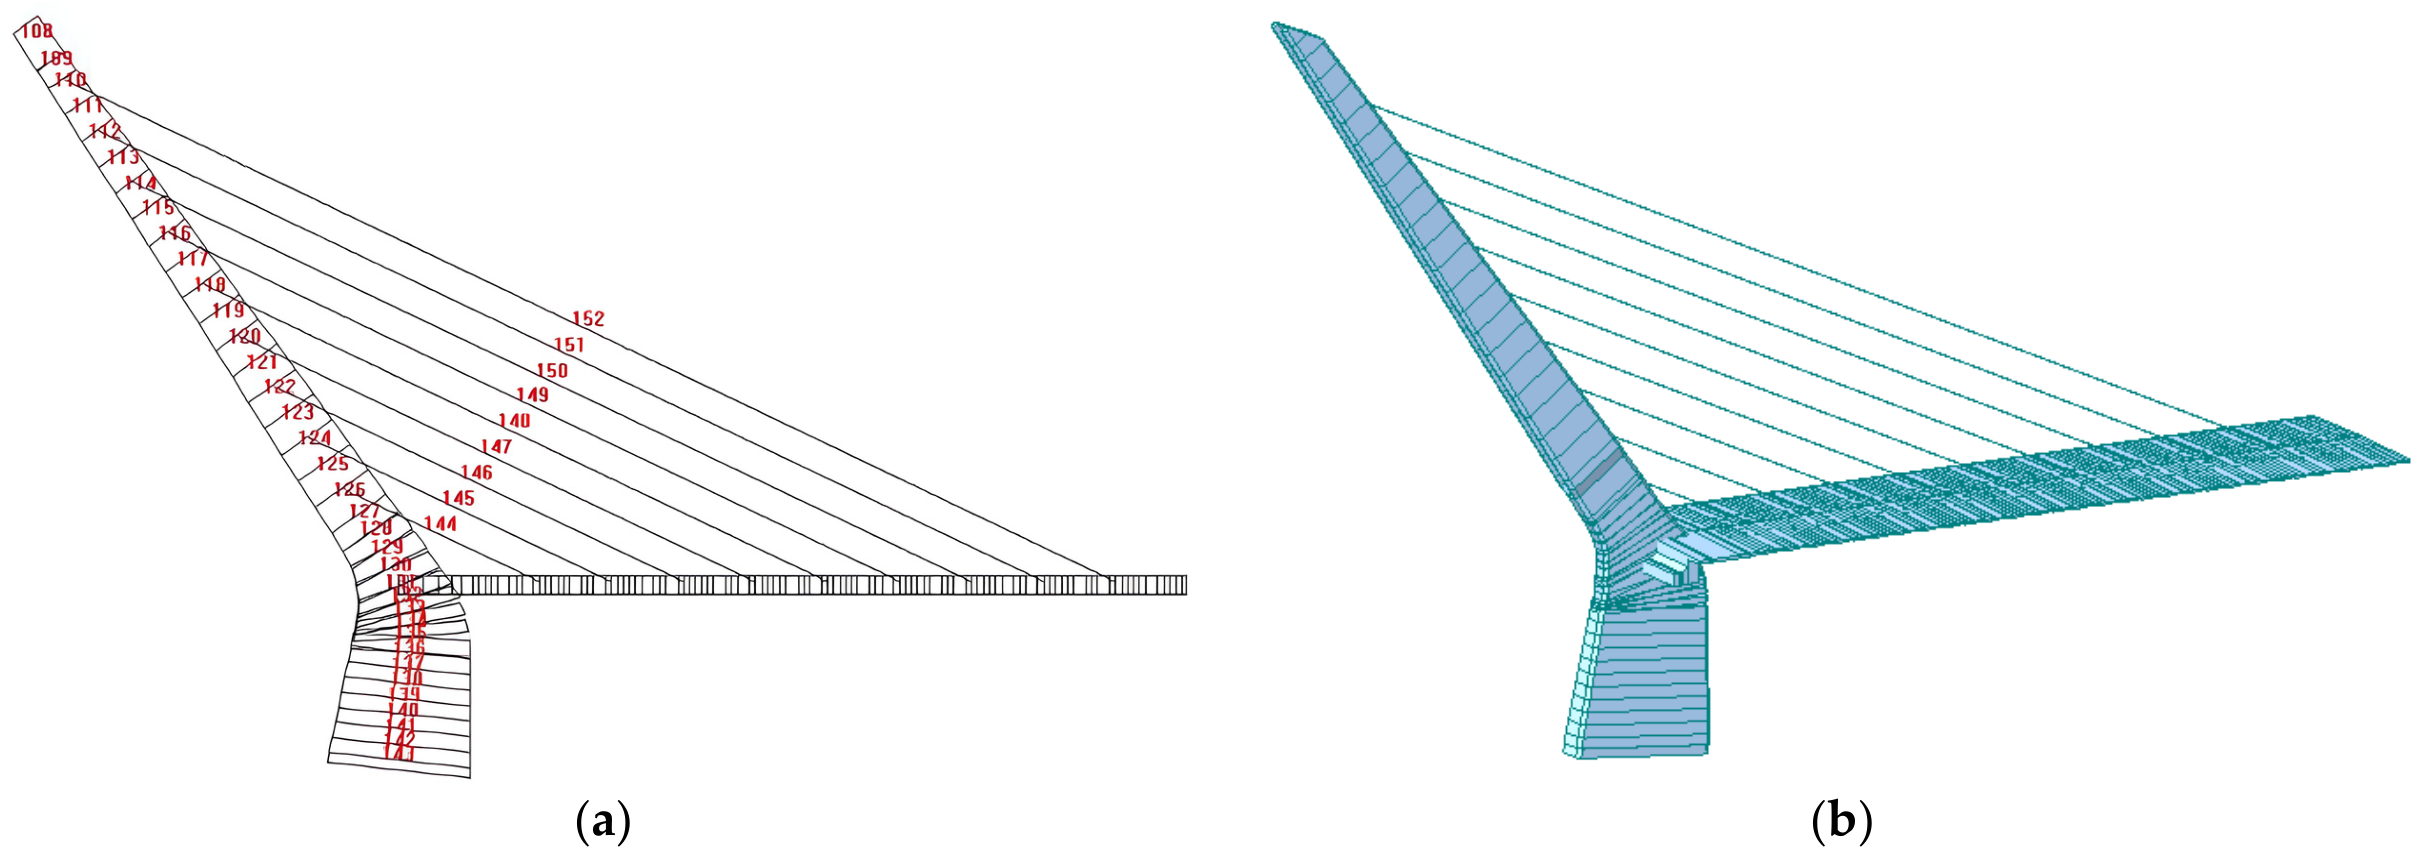
The calibrated Dr Bridge (version 4.4.1) and MIDAS/Civil (version 9.1.0) FE models previously established in Reference [41] are adopted as the computational baseline for the stage-by-stage cable-force regulation analysis. The models were calibrated by adjusting cable forces and applying enforced nodal displacements and local loads to reproduce the measured girder–tower alignment and cable forces. The Dr Bridge model is a two-dimensional plane-frame model, whereas the MIDAS/Civil model is a three-dimensional beam–truss model with 337 nodes and 280 elements, including 262 beam elements and 18 truss elements. The girder, tower, and piers are modeled using beam elements. In the composite-girder region, the steel box girder and the C50 concrete deck are represented by separate lines of beam elements and coupled by rigid links. The 18 stay cables, comprising two cables for each of the C1–C9 cable groups, are modeled using axial truss elements with the corresponding sectional and material properties. Their initial cable forces are applied as pretension loads and adjusted during model calibration to reproduce the measured cable forces. As reported in Reference [41], the maximum absolute relative errors between the calculated and measured cable forces after calibration were 3.00% for the Dr Bridge model and 2.78% for the MIDAS/Civil model.
Nodes are arranged at cable anchorages, cross-section changes, supports, and structural connections, with intermediate nodes added along the longitudinal members. Local refinement is applied to the girder and pier/tower region shown in Figure 6b, which contains the rigid tower–girder–pier connection and is the principal force-transfer region affected by cable-force adjustment. This refinement improves the representation of local internal-force redistribution and deformation. The global X-, Y-, and Z-axes denote the longitudinal, transverse, and vertical directions, respectively. The tower–pier base is fully restrained; at the side-span support, Uy, Uz, and Rz are restrained, while Ux, Rx, and Ry are released. Because the bridge has a 130 m main span and relatively high structural stiffness, geometric nonlinear effects were neglected, consistent with the assumptions adopted in the original calculation.
Figure 6.
FE models of Jinzhou Bridge: (a) 2D FE model using Dr Bridge; (b) 3D FE model using MIDAS Civil.
At each regulation stage, the prescribed cable-force adjustment of the actively regulated cable is applied to the bridge FE model, and structural equilibrium is recalculated under the same dead-load condition. The equilibrium solution provides the redistributed internal forces of the girder, tower, and the remaining cables, and the updated nodal displacements are taken as the global geometric response (i.e., girder–tower alignment change). The equilibrium state of the current stage is then used as the starting state for the next stage in the stage-by-stage simulation. Figure 6 illustrates the calibrated FE models of Jinzhou Bridge.
4. Analysis of the Cable-Force Regulation Scheme
4.1. Ideas of Cable-Force Regulation
Cable-force regulation and internal-force analysis for an existing cable-stayed bridge without backstays differ from those performed during construction. The target state must satisfy the relevant specifications while accounting for the actual condition and uncertainties of the existing structure. The following issues should therefore be addressed.
- (1)
- Determination of the current alignment and internal-force state of the cable-stayed bridge. This establishes the basis for subsequent cable-force regulation and internal-force improvement. The in-service structural condition can be affected by vehicle loads, shrinkage and creep, temperature effects, stay-cable relaxation, and deviations introduced during construction. These effects can cause the current condition of an existing bridge to differ significantly from its design condition. The FE-model parameters should therefore represent the actual structural condition as closely as possible. The measured in-service condition represented by the calibrated FE model is defined as initial state B for the regulation analysis.
- (2)
- A reasonable target internal-force state and the corresponding target cable forces should be specified as the endpoint of cable-force regulation. For the Jinzhou Bridge, target state A represents the reasonable target internal-force state previously determined in Reference [41] through cable-force-sensitivity and stress-feasible-region analyses. The corresponding target cable forces are adopted as the prescribed endpoint values for the regulation analysis and are distinct from the original design cable forces.
- (3)
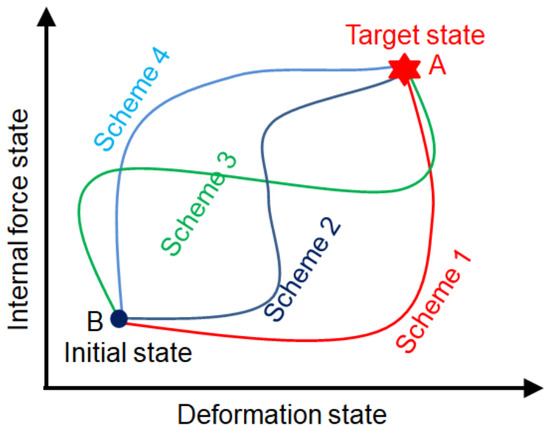
- After the initial state B and target state A are specified, a reasonable regulation path between the two states should be determined, i.e., the cable-force regulation scheme.
4.2. Principles of Cable-Force Regulation
For an existing cable-stayed bridge, the transition from initial state B to target state A can be achieved through different regulation sequences and cable-force adjustments, as shown in Figure 7.
Figure 7.
Cable-force regulation path diagram.
For the Jinzhou Bridge, the regulation scheme must account for structural safety, on-site equipment and personnel, and construction duration. The following principles are adopted.
- (1)
- In each regulation stage, the stresses of the stay cable, main girder, and tower shall not exceed the design strength limits specified in JTG/T 3365-01-2020 [6].
- (2)
- The stage-wise cable-force variation should be kept as small as practicable to avoid abrupt internal-force changes during regulation.
- (3)
- The regulation scheme should be operable with simple on-site steps. Since the tensioning end is located inside the girder box and jack relocation is time-consuming, the selected sequence should minimize unnecessary repositioning and help shorten the construction duration.
- (4)
- The tensioning jacks shall have a rated capacity greater than the required cable-force increment at each regulation stage, and the equipment arrangement shall be compatible with the site constraints.
4.3. Proposal of the Cable-Force Regulation Scheme
Based on the regulation principles described above and the spatial arrangement of the stay cables, two candidate regulation schemes are considered for the Jinzhou Bridge: Scheme A, proceeding from the short cable C1 to the long cable C9, and Scheme B, proceeding from the long cable C9 to the short cable C1.
Table 2 and Table 3 list the cable forces at each regulation stage for Schemes A and B, respectively. The error values in Table 2 and Table 3 are used to verify whether the final simulated cable forces reach the prescribed target cable forces. The maximum absolute errors of Schemes A and B are 0.83% and 0.96%, respectively, both of which are below 1%, supporting the theoretical feasibility of the two regulation schemes. These errors are not used as an independent validation of the FE model, which was calibrated separately using the measured cable forces and the measured girder–tower alignment.
Table 2.
Cable tensioning path of Scheme A (kN).
Table 3.
Cable tensioning path of Scheme B (kN).
4.4. Effect of Different Cable-Force Regulation Schemes
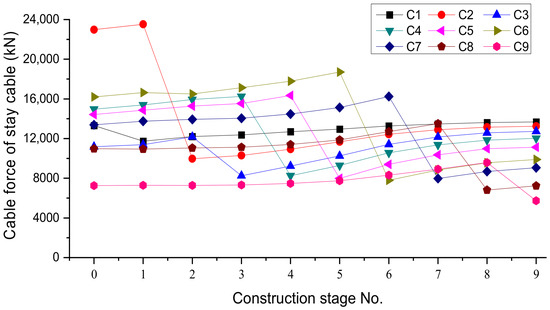
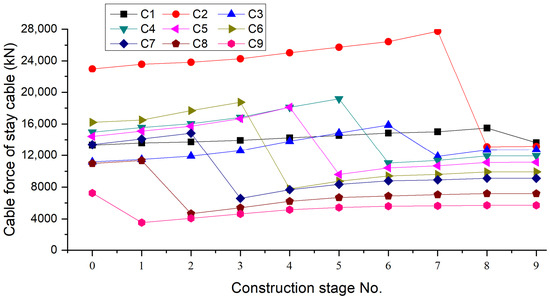
Forward simulations are performed using the FE model according to the cable-force regulation sequences of Schemes A and B, and the stage-wise cable-force histories are obtained, as shown in Figure 8 and Figure 9. In each stage, the cable-force increment of the actively regulated cable is applied, and the full-bridge equilibrium is solved, so that both the internal-force redistribution and the corresponding deformation (alignment change) are obtained simultaneously. The construction stage number 0 represents the current state of the cable-stayed bridge.
Figure 8.
Stage-wise cable-force variation under Scheme A.
Figure 9.
Stage-wise cable-force variation under Scheme B.
In both schemes, the cable forces vary noticeably during the regulation process, as shown in Figure 8 and Figure 9. When a stay cable is regulated to its target value, its cable force decreases sharply because of the relatively large regulation amount. The forces in the other stay cables increase, but their variations are relatively small.
For example, cable C5 is regulated at construction Stage 5 in both schemes. In Scheme A, the cable force of C5 decreases by 8360 kN, while the forces in the other stay cables increase, with a maximum change of 1032 kN. In Scheme B, the cable force of C5 decreases by 8521 kN, while the forces in the other stay cables increase, with a maximum change of 1063 kN. Under either scheme, the largest increase in another cable is approximately one-eighth of the reduction in C5. The cable forces increase gradually during the stages before and after the target value is reached. Taking the regulation of cable C5 as an example, four construction stages are considered before and after its regulation in both schemes. For Schemes A and B, the total cable-force variations during the four stages before C5 regulation are 1919 kN and 3688 kN, respectively, while those during the four stages after regulation are 1731 kN and 715 kN, respectively. These results indicate that, for cable C5, Scheme A exhibits relatively stable cable-force variations during the four stages before and after regulation. In contrast, Scheme B shows greater cable-force variation than Scheme A during the four stages before regulation, but smaller variation during the four stages after regulation.
5. Determination of Regulation Scheme
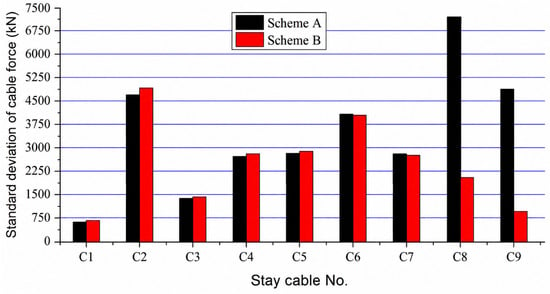
To quantitatively compare the process-induced cable-force fluctuations of Schemes A and B, the standard deviation σ of the stage-wise cable forces is employed as a descriptive measure [42].
where
- —Cable force of the stay cable at the ith stage,
- —Arithmetic mean of the cable forces over all considered stages,
- —Total number of cable-force states considered, including Stage 0.
A larger standard deviation σ indicates greater stage-wise fluctuation in the cable force during the regulation process. Greater cable-force fluctuation leads to more pronounced internal-force redistribution and structural response during intermediate stages. Therefore, a smaller σ is preferred when evaluating alternative regulation sequences.
Because the results are deterministic outputs of FE forward simulations, the comparison is based on descriptive measures rather than inferential statistical testing, and no statistical significance is inferred from the observed differences.
As shown in Table 4 and Figure 10, the standard deviations of cables C1–C7 are similar for the two schemes, indicating only small differences in their stage-wise cable-force fluctuations. The standard deviations of cables C8 and C9 differ considerably between the two schemes, with the values for Scheme A being approximately 3.5 and 5 times those for Scheme B, respectively. For Jinzhou Bridge, the regulation of the long cables far from the tower produces interactions among the cables, and the degree of interaction varies with the regulation sequence. If the long cables are regulated first, their influence on the short cables is relatively small; however, if the short cables are regulated first, the long cables are more significantly affected.
Table 4.
Mean cable force and standard deviation for the two regulation schemes (kN).
Figure 10.
Cable force standard deviation of Scheme A and Scheme B.
In addition to the cable-force fluctuation index (σ), the stage-wise structural responses of Schemes A and B were evaluated during Stages 1–8. For the strength check, the stage-wise peak stresses were extracted from the stress histories at representative sections of the main girder (tower vicinity, L/4, midspan, and 3 L/4; top and bottom fibers) and the tower (tower base, girder–tower junction, and cable anchorage regions) (Figures S1–S4) and checked against the design strength limits. For the alignment check, the maximum absolute girder vertical displacement at each stage was extracted from the displacement profiles as the alignment deviation index (Figures S5 and S6) and checked against the alignment-control criterion. With these mandatory strength and alignment constraints satisfied, the smaller process-induced cable-force fluctuations of C8 and C9 under Scheme B supported the selection of Scheme B (C9 to C1) for field implementation.
6. Cable-Force Regulation and Implementation
6.1. Calculation of Cable-Force Adjustments
Based on Scheme B, the cable-force adjustment applied to each stay cable at its regulation stage is determined, as listed in Table 5.
Table 5.
Value of the cable-force adjustments.
As revealed by the above results, the cable-force adjustments vary considerably among the stay cables. The absolute values of the adjustment ratios in Table 5 are 13.94% and 35.55% for C1 and C3, respectively, and exceed 50% for the other stay cables. The largest absolute ratio is 67.55% for C6.
6.2. Calculation of Anchor-Cup Pullout Control Values
Under Scheme B, each stay cable undergoes a force reduction during its active regulation stage. Although the corresponding force adjustments are negative according to the sign convention adopted in Table 5, the construction-control quantities are reported as positive magnitudes in the anchor-cup pullout direction. The elastic component is therefore calculated using the magnitude of the cable-force reduction, |ΔT|. The positive values in Table 6, Table 7 and Table 8 represent the elastic component, the deformation-induced components, and the total anchor-cup pullout control values, respectively.
Table 6.
Elastic component of the required anchor-cup pullout.
Table 7.
Anchor-cup pullout components caused by deformation of the girder and tower.
Table 8.
Required anchor-cup pullout control values for cable-force reduction.
During stay-cable tensioning, the initial force may be estimated from the hydraulic-jack oil-pressure reading according to site conditions, with the measurement error controlled within 200 kN. More accurate cable-force measurement should then be performed using a spectrum analyzer or another verified vibration-based method [43]. Recent tensioning-control research also supports integrating force measurement with the on-site tensioning procedure [44]. Finally, cable-force regulation should be implemented according to the determined anchor-cup pullout for each stay cable.
Accurate control of anchor-cup pullout requires the following two conditions:
- (1)
- The calculated anchor-cup pullout should be accurate.
- (2)
- The anchor-cup pullout should be measured accurately on site.
The girder anchorage is located in a narrow box-girder compartment. Installation of the jacks and working platforms further restricts the available space, while poor lighting makes direct measurement of anchor-cup pullout difficult. Lighting equipment is therefore required during regulation. According to the original design drawings and anchorage configuration, anchor-cup pullout can be related to the thread pitch and controlled by measuring the rotation angle of the anchor-cup nut. Installing direct cable-force sensors in this confined space is difficult. An initial attempt to use the vibration-frequency method for this on-site control step was not satisfactory.
Two methods are used. Method 1 decomposes the total pullout into cable elastic elongation and the contribution of girder–tower deformation. Method 2 uses an equivalent straight-rod model to determine the pullout value for construction control (Table 8).
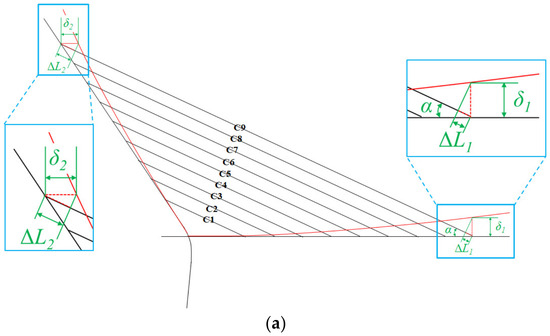
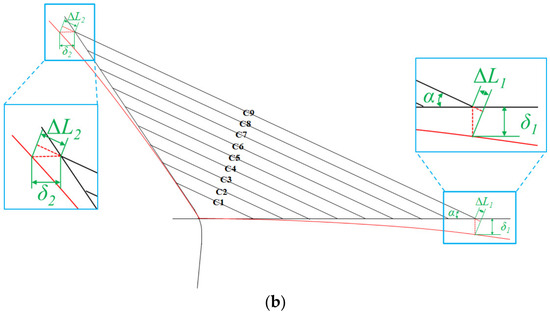
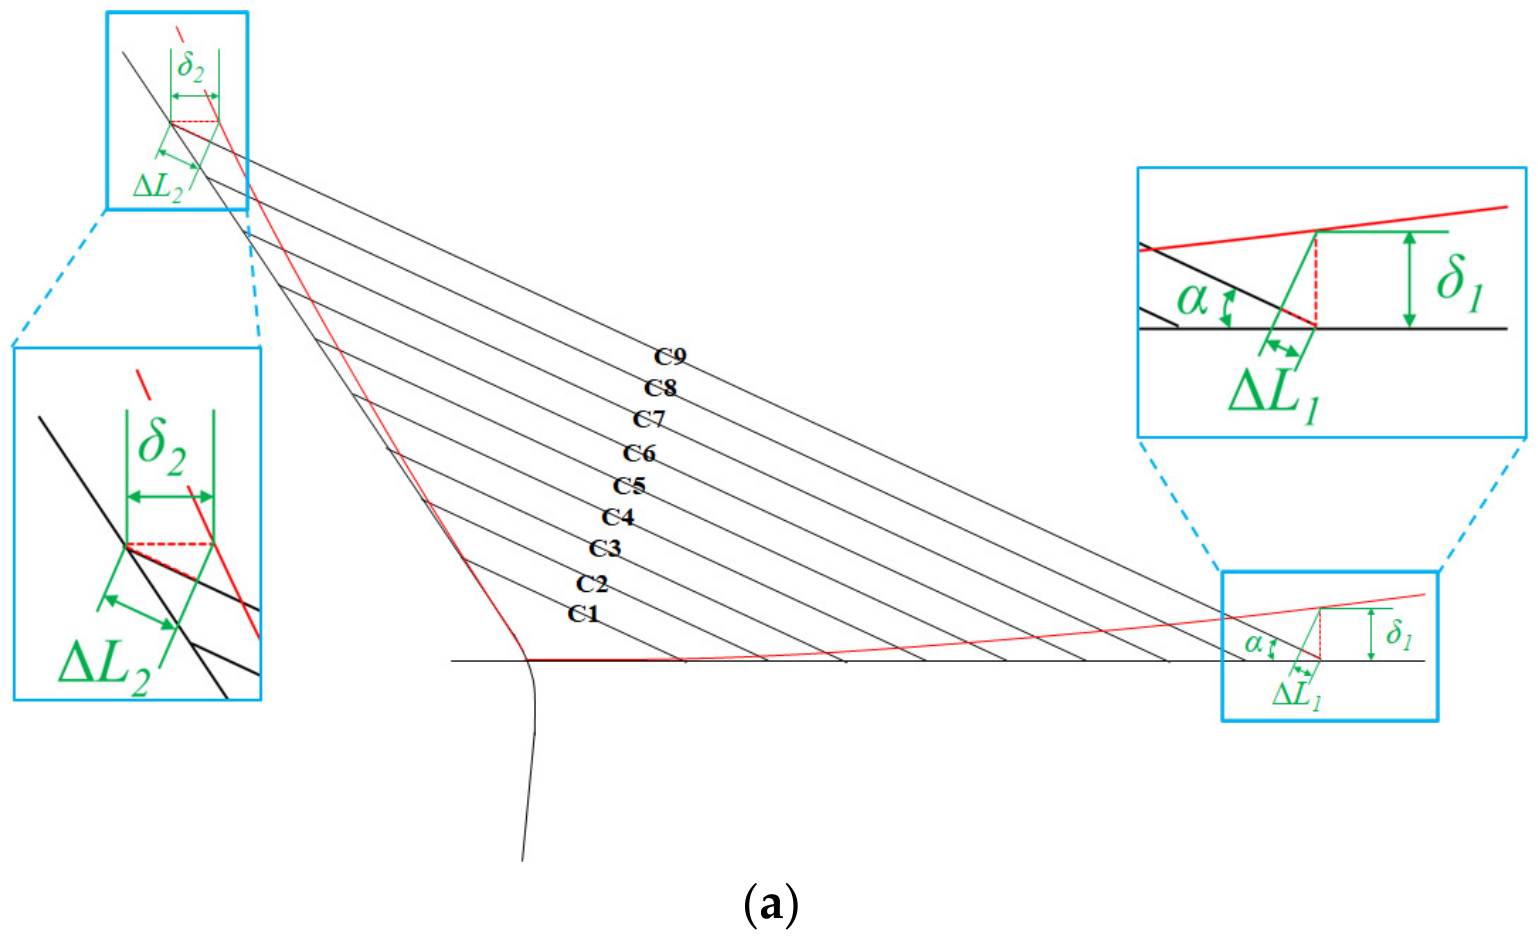
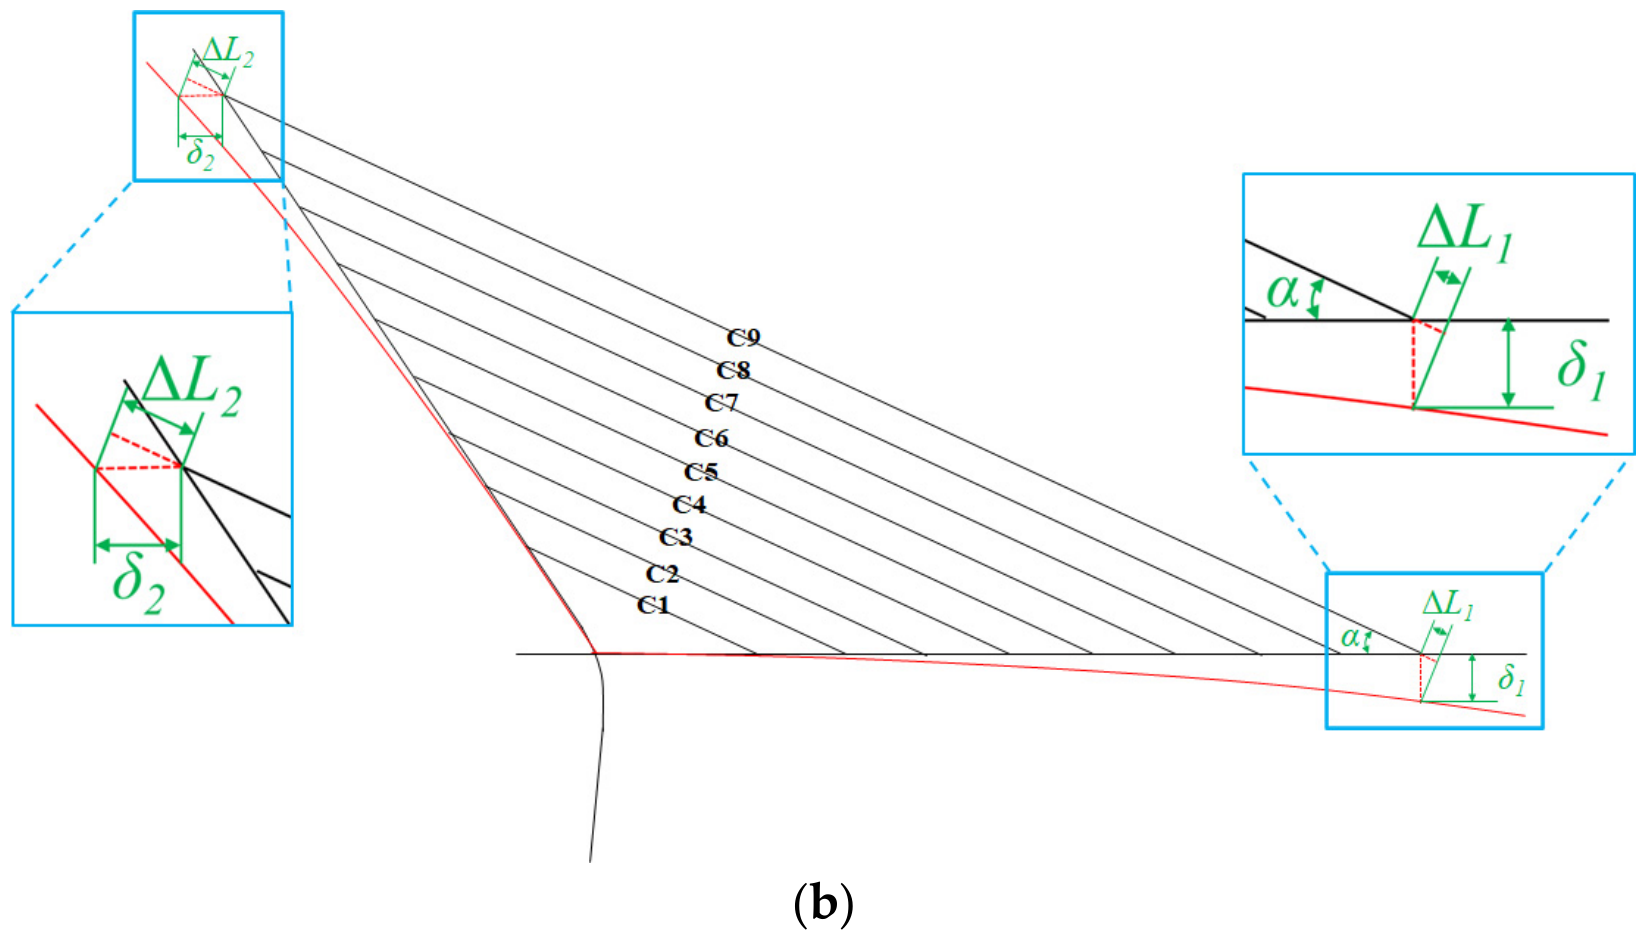
Method 1: The total anchor-cup pullout can be determined from the elastic elongation of the stay cable, the vertical displacement of the main girder, and the horizontal displacement of the tower. The corresponding deformation after cable-force adjustment is shown in Figure 11.
Figure 11.
Structural deformation associated with cable-force regulation: (a) cable-force increase; (b) cable-force decrease.
The elastic elongation of a stay cable is calculated from its material and geometric properties and the required cable-force change using axial-deformation theory. The pullout component caused by structural deformation is determined separately.
Cable-force adjustment causes vertical displacement of the main girder and horizontal displacement of the main tower. The pullout component caused by structural deformation is derived from the geometric relationship among the cable, girder, and tower.
where
- —Amount of anchor-cup pullout,
- —Elastic component of the required anchor-cup pullout associated with ,
- —Signed cable-force adjustment, defined as the cable force after regulation minus that before regulation,
- —Magnitude of the cable-force reduction used to calculate the anchor-cup pullout control value,
- —Elongation caused by variation in cable sag,
- , —Value of the cable force before and after tension,
- —Amount of anchor-cup pullout caused by vertical displacement of the main girder under action,
- —Amount of anchor-cup pullout caused by horizontal displacement of the tower under action.
The stay cables of the existing bridge are subjected to relatively high tensile forces and operate at a high stress level. Under these conditions, the effect of cable sag on the adjustment is small. The elongation caused by changes in cable sag is therefore considered negligible. If , and are calculated accurately, the required cable-force adjustment can be controlled through accurate measurement of the anchor-cup pullout.
In Method 2, each stay cable is represented by an equivalent straight-rod element. Compression of this element caused by tower and girder deformation is used to determine the corresponding anchor-cup pullout.
A stay cable carries tension rather than compression. However, when an equivalent straight-rod element is used to simulate the stay cable, its cross-sectional area cannot be zero, i.e., A ≠ 0. A pair of unit forces P is applied to the anchorage nodes of the main tower and the main girder at both ends of the straight rod element along the direction of the stay cable. Unit force P results in the deformation of the tower and the girder. Moreover, under the above deformation, the straight rod element produces a compressive force N, such that the effective cable force acting on the towers and girders can be reduced. The resulting effective cable force is P-N. Only when the external force applied to the anchorage nodes of the tower and girder is greater than the unit force P can the effective cable force acting on the tower and girder reach P. Based on the above analysis, the external force applied to the tower and girder can be expressed as:
This force can be divided into two parts:
Equations (2)–(6) show that the total anchor-cup pullout equals the cable elastic elongation plus the pullout component caused by tower and girder deformation.
The anchor-cup pullout caused by tower and girder deformation is represented by the elongation of the equivalent straight-rod element under . Here, is the external force applied to extend the element. The total anchor-cup pullout obtained using Method 2 is:
Method 1 establishes the geometric relationship between structural deformation and cable elongation and is mainly used to reveal the mechanical origin of the pullout quantity. For practical regulation, the deformation effect is represented by an equivalent straight-rod element model (Method 2). Method 1 is retained to interpret the deformation–force relationship and to check the physical consistency of the calculated elongation.
Table 6 presents the elastic component of the required anchor-cup pullout calculated using |ΔT|. Cable C6 has the largest elastic component of 362.8 mm. Table 7 presents the additional pullout components caused by deformation of the girder and tower. The contribution of girder displacement is less than 1 mm, whereas the maximum contribution of tower displacement is 44.50 mm for cable C8. The total anchor-cup pullout control values obtained by combining the elastic and deformation-induced components are listed in Table 8 and are used to control the field regulation process.
6.3. Field Implementation
Scheme B, proceeding from C9 to C1, was implemented in the field regulation of the Jinzhou Bridge. During construction, the cable forces, girder alignment, and tower displacement were monitored throughout the regulation process.
Before regulation, the initial cable force is estimated from the jack oil-pressure reading when the jack pulls the anchor head and is compared with the force obtained using the vibration-frequency method. If the difference exceeds 20%, the jack is released, the vibration-based force is remeasured, and the jack-based force is re-estimated until the two estimates are sufficiently close. Because the bridge has been in service, its current internal-force state may differ from the completion state; completion-stage cable forces are therefore used only as supplementary reference values during cable loosening.
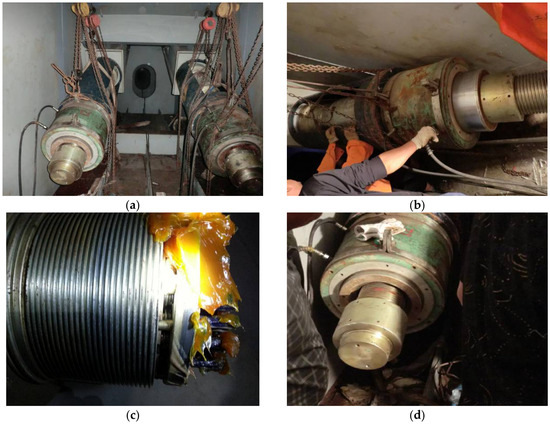
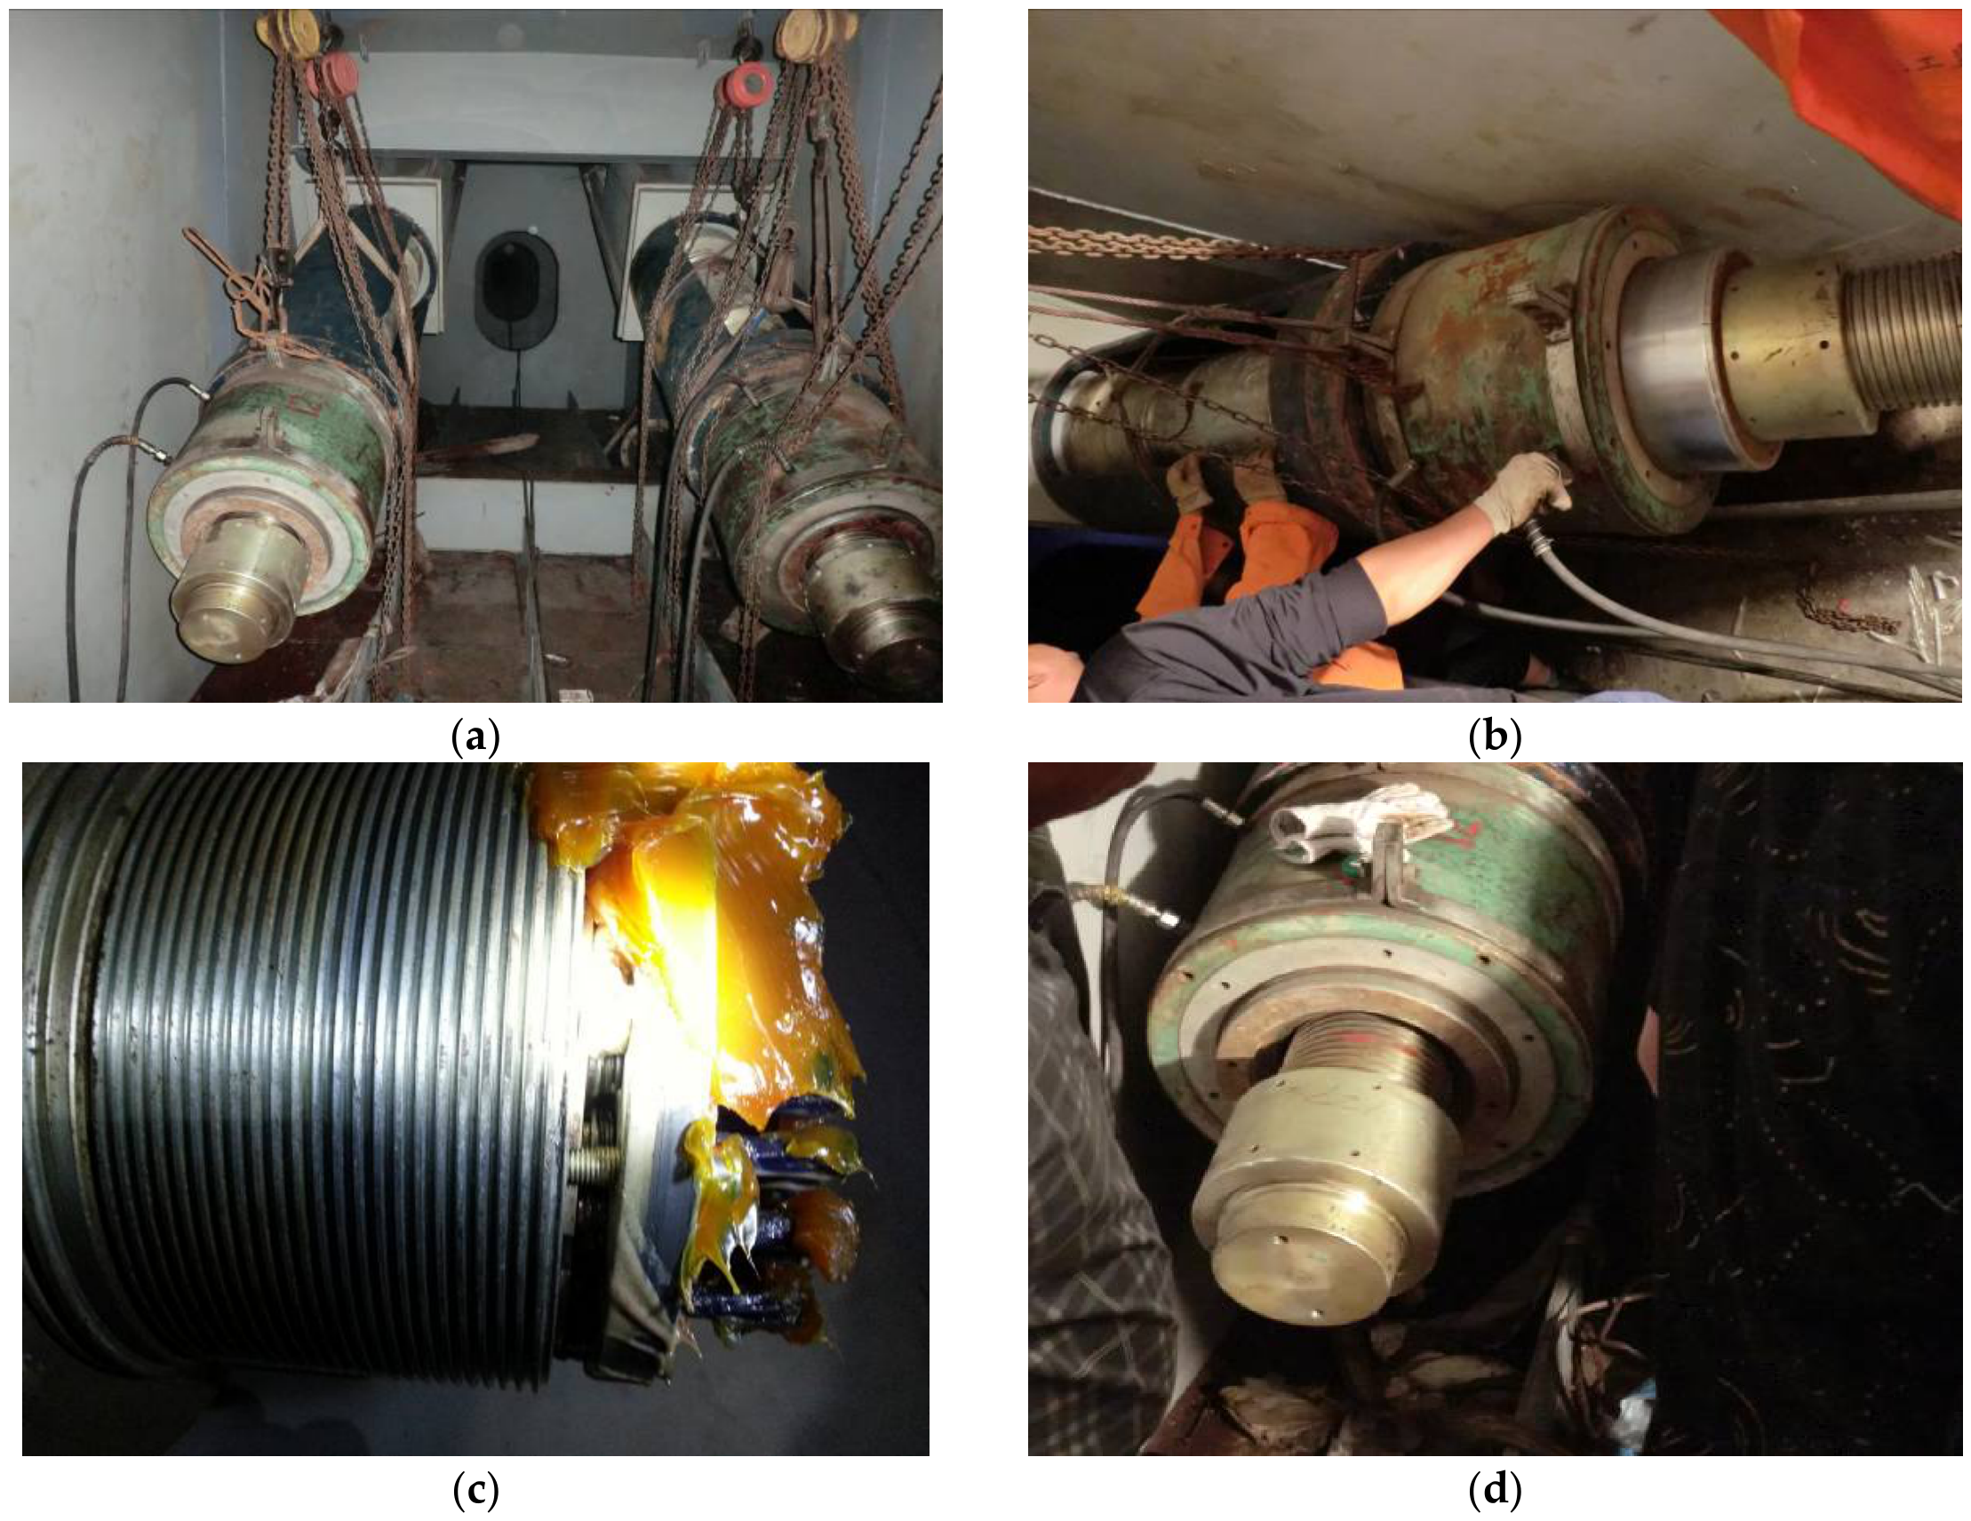
Two jacks were used for cable-force regulation, and the two stay cables with the same cable number were regulated simultaneously. Figure 12 illustrates the on-site cable-force regulation process.
Figure 12.
Construction process: (a) jack installation; (b) pulling the anchorage with the jack; (c) rotation of the anchor-cup nut; (d) adjustment of the anchor-cup pullout.
The on-site procedure is as follows:
After the tensioning equipment is moved to the working platform, the jack and oil pump are installed and checked. The jack is first loaded until the anchor nut just loosens; the oil-pressure reading is then recorded, and the corresponding force inferred from that reading is compared with the pre-regulation cable-force meter reading. The two cables in a pair are then adjusted simultaneously to the calculated control values. During this step, the forces in both the regulated pair and the next pair are measured. The cable-force change indicated by the cable-force meter is compared with that inferred from the jack oil-pressure readings. Girder elevations at the C1–C9 control sections are measured before and after each regulation stage as an independent check.
Regulation of a cable pair is considered complete when the force change indicated by the cable-force meter agrees with that inferred from the jack oil-pressure readings within ±5%. The procedure is then repeated for the next cable pair.
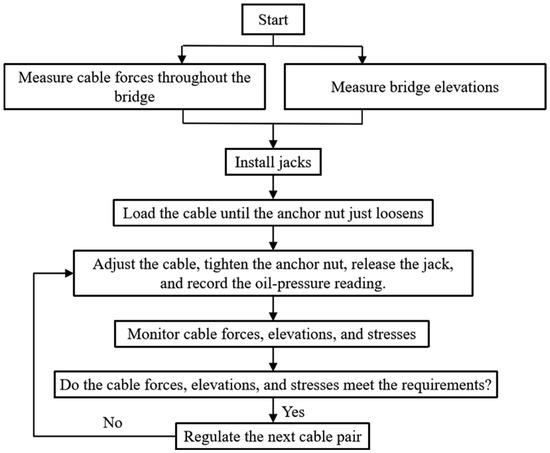
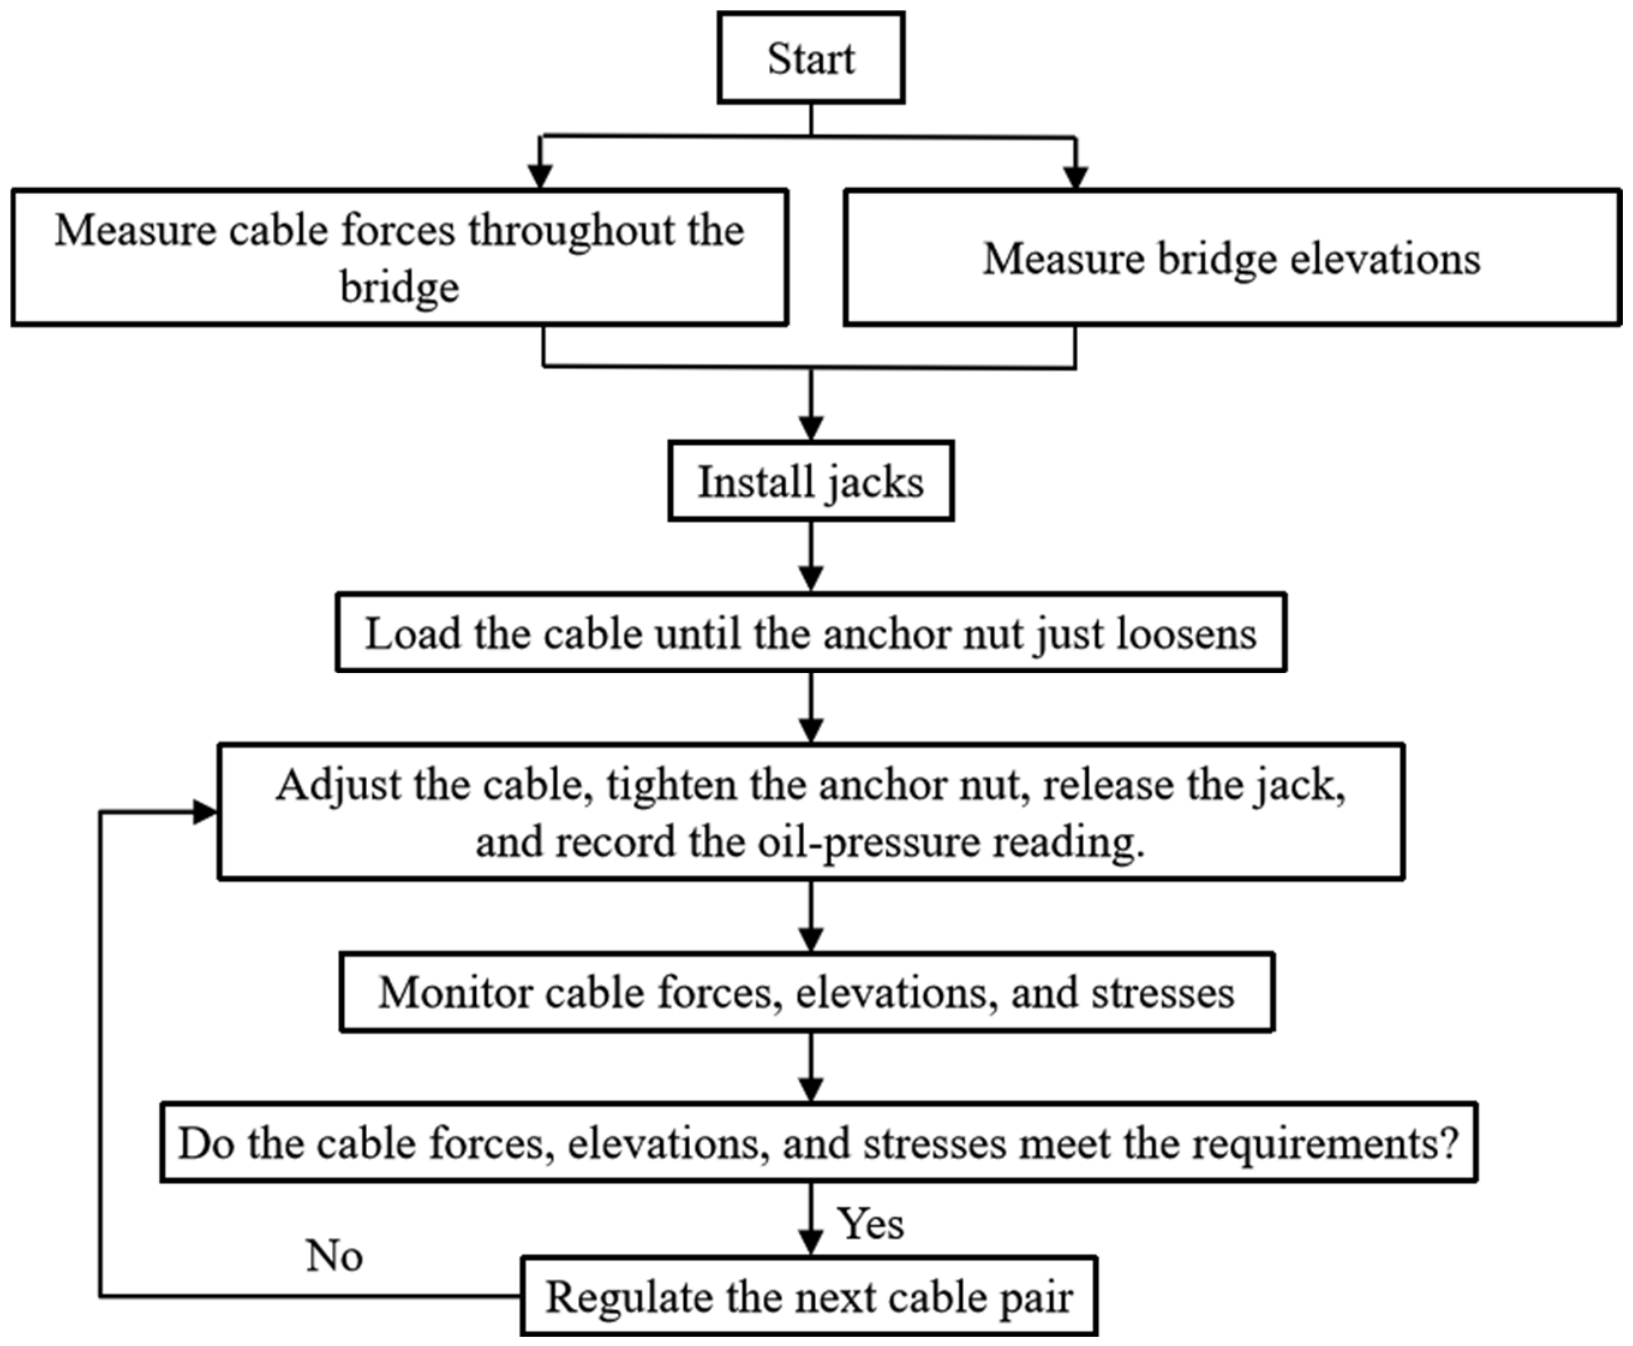
After all stay cables have been regulated, the bridge elevation, tower displacement, and cable forces are remeasured. The differences between measured and calculated alignment values should remain within ±10 mm, and the cable forces should be checked for anomalies. Figure 13 summarizes the stage-wise on-site cable-force regulation procedure.
Figure 13.
Flow diagram of the cable-force regulation process.
The main stages of the overall procedure, including the establishment of the pre-regulation structural baseline, stage-wise control and monitoring during cable-force regulation, and post-regulation inspection and verification, can be compared in principle with the inspection, monitoring, and evaluation framework for in-service highway bridges specified in JTG 5120–2021 [45] and the cable-force and structural safety requirements of JTG/T 3365-01-2020 [6]. However, Figure 13 presents a regulation-stage engineering workflow developed for the structural characteristics and on-site requirements of the Jinzhou Bridge, rather than a direct reproduction of a procedure prescribed by these standards.
7. Conclusions
This study investigates the stage-by-stage transition of the Jinzhou Bridge from its measured in-service state to a prescribed reasonable target state under two alternative cable-force regulation sequences. The principal findings are as follows:
- (1)
- Both regulation sequences can achieve the prescribed target cable forces, with maximum final-state errors of 0.83% for Scheme A and 0.96% for Scheme B. However, the regulation sequence has a pronounced influence on the intermediate cable-force response. The differences between the two schemes are relatively small for cables C1–C7, whereas the standard deviations of C8 and C9 under Scheme A are approximately 3.5 and 5 times those under Scheme B, respectively. With the prescribed strength and alignment constraints satisfied, Scheme B, proceeding from C9 to C1, was therefore selected for field implementation. These results demonstrate that regulation-path selection should consider not only the final target state but also the structural response during intermediate stages.
- (2)
- Under Scheme B, the active regulation step for each stay cable (C1–C9) involves a reduction in its cable force. The required reductions range from 1856 to 14,646 kN, corresponding to reduction ratios of 13.94–67.55%. Except for C1 and C3, the reduction ratios exceed 50%, with the largest reduction ratio of 67.55% occurring in C6.
- (3)
- The required anchor-cup pullout control values range from 16.6 to 383.9 mm. The pullout component associated with girder deformation is less than 1 mm for all cables, whereas that associated with tower deformation reaches 44.50 mm for C8. Therefore, the deformation-induced contribution, particularly that caused by tower displacement, should be included when converting the required cable-force reductions into field-control quantities.
Supplementary Materials
The following supporting information can be downloaded at: https://www.mdpi.com/article/10.3390/app162010043/s1, Figure S1: Girder stress history during Scheme A; Figure S2: Girder stress history during Scheme B; Figure S3: Tower stress history during Scheme A; Figure S4: Tower stress history during Scheme B; Figure S5: Girder vertical displacement history during Scheme A; Figure S6: Girder vertical displacement history during Scheme B.
Author Contributions
Conceptualization, M.Y.; methodology, J.Z. and M.Y.; software, M.Y.; validation, M.Y.; formal analysis, J.Z.; investigation, J.Z., Z.W., J.L. (Jinlong Liu), J.L. (Junqi Lin) and H.G.; resources, J.Z. and H.G.; data curation, Z.W.; writing—original draft preparation, M.Y.; writing—review and editing, H.G.; visualization, M.Y. and Z.W.; supervision, J.Z. and H.G.; project administration, J.L. (Jinlong Liu) and J.L. (Junqi Lin); funding acquisition, H.G. All authors have read and agreed to the published version of the manuscript.
Funding
This research was funded by the Scientific Research Fund of Institute of Engineering Mechanics, China Earthquake Administration (Grant No. 2024B21); the Natural Science Foundation of Heilongjiang Province; the Fundamental Scientific Research Expenses at Heilongjiang Provincial College and University (2024-KYYWF-0076, 2022-KYYWF-1094); the Heilongjiang Province Ecological Environment Protection Research Project (HST2023GF004, HST2025GF009); and the Key Laboratory of Flood Disaster Risk Warning and Prevention and Control, Ministry of Emergency Management (2024YJ007-003).
Institutional Review Board Statement
Not applicable.
Informed Consent Statement
Not applicable.
Data Availability Statement
The data supporting the findings of this study are available from the corresponding author upon reasonable request.
Conflicts of Interest
Author Jingyuan Zhang was employed by the company Heilongjiang Provincial Transportation Planning and Design Institute Group Co., Ltd. The remaining authors declare that the research was conducted in the absence of any commercial or financial relationships that could be construed as a potential conflict of interest.
References
- Xu, T.; Ma, J.; Wei, G.; Gong, B.; Liu, J. A framework for evaluating the reasonable internal force state of the cable-stayed bridge without backstays. Buildings 2024, 14, 3656. [Google Scholar] [CrossRef] [Scilit]
- Hou, N.; Sun, L.; Chen, L. Cable reliability assessments for cable-stayed bridges using identified tension forces and monitored loads. J. Bridge Eng. 2020, 25, 05020003. [Google Scholar] [CrossRef] [Scilit]
- Takena, K.; Miki, C.; Shimokawa, H.; Sakamoto, K. Fatigue resistance of large-diameter cable for cable-stayed bridges. J. Struct. Eng. 1992, 118, 701–715. [Google Scholar] [CrossRef] [Scilit]
- Zheng, X. Construction monitoring and control of cable-stayed bridges without backstays. Arch. Civ. Eng. 2024, 70, 649–666. [Google Scholar] [CrossRef] [Scilit]
- Luo, L.-Y.; Du, Y.-L.; Yi, T.-H.; Qu, C.-X.; Liu, H. Cable force identification of cable-stayed bridges considering boundary disturbances using tower–cable–beam responses. Eng. Struct. 2025, 343, 121262. [Google Scholar] [CrossRef] [Scilit]
- JTG/T 3365-01-2020; Specifications for Design of Highway Cable-Stayed Bridge. China Communications Press Co., Ltd.: Beijing, China, 2020.
- Xiong, H.-Z.; Yang, X.; He, Y.-N.; Huang, Y. Optimization of cable-stayed force for asymmetric single-tower cable-stayed bridge formation based on an improved particle swarm algorithm. Int. J. Struct. Integr. 2024, 15, 873–901. [Google Scholar] [CrossRef] [Scilit]
- Tabatabai, H. Inspection and Maintenance of Bridge Stay Cable Systems; Transportation Research Board: Washington, DC, USA, 2005. [Google Scholar] [CrossRef] [Scilit] [PubMed]
- Pipinato, A.; Pellegrino, C.; Modena, C. Structural analysis of the cantilever construction process in cable-stayed bridges. Period. Polytech. Civ. Eng. 2012, 56, 141–152. [Google Scholar] [CrossRef] [Scilit]
- Pipinato, A.; Pellegrino, C.; Fregno, G.; Modena, C. Influence of fatigue on cable arrangement in cable-stayed bridges. Int. J. Steel Struct. 2012, 12, 107–123. [Google Scholar] [CrossRef] [Scilit]
- Liu, X.; Yang, J.; Zhuo, W.; Lin, K.; Lin, Y. Real-time identification of time-varying cable force for cable-stayed bridges based on vibration monitoring. Measurement 2024, 231, 114590. [Google Scholar] [CrossRef] [Scilit]
- Aloisio, A.; Pasca, D.P.; Rosso, M.M.; Briseghella, B. Role of cable forces in the model updating of cable-stayed bridges. J. Bridge Eng. 2023, 28, 05023002. [Google Scholar] [CrossRef] [Scilit]
- Weng, J.; Chen, L.; Sun, L.; Zou, Y.; Liu, Z.; Guo, H. Fully automated and non-contact force identification of bridge cables using microwave remote sensing. Measurement 2023, 209, 112508. [Google Scholar] [CrossRef] [Scilit]
- Zheng, X. Parameter analysis of a cable-stayed bridge without backstays. Arch. Civ. Eng. 2025, 71, 625–642. [Google Scholar] [CrossRef] [Scilit]
- Zhang, J.; Xie, W. Cable detection and adjusting tension of General Rafael Urdaneta Bridge. J. China Foreign Highw. 2004, 24, 47–50. [Google Scholar] [CrossRef]
- Sarcos-Portillo, A.; Navarro-Cerpa, A.; Garcia-Legaz, H. Inspection and process of tension of cables of General Rafael Urdaneta Bridge. J. Bridge Eng. 2003, 8, 223–228. [Google Scholar] [CrossRef] [Scilit]
- Jiang, W.; Li, Y.; Xu, J. Research on cable replacement design for cable-stayed bridges. Struct. Eng. 2010, 26, 57–62. [Google Scholar] [CrossRef]
- Saul, R.; Nützel, O. Wrapping with butyl rubber tapes—An innovative corrosion protection for bridge cables. Struct. Eng. Int. 2012, 22, 330–335. [Google Scholar] [CrossRef] [Scilit]
- Hopwood, T., II; Havens, J.H. Inspection, Prevention, and Remedy of Suspension Bridge Cable Corrosion Problems; Kentucky Transportation Center: Lexington, KY, USA, 1984. [Google Scholar] [CrossRef] [Scilit]
- Zheng, X.; Xie, X.; Li, X. Experimental study and residual performance evaluation of corroded high-tensile steel wires. J. Bridge Eng. 2017, 22, 04017091. [Google Scholar] [CrossRef] [Scilit]
- Leonhardt, F. Cable-stayed bridges with prestressed concrete. PCI J. 1987, 32, 52–80. [Google Scholar] [CrossRef] [Scilit]
- Mehrabi, A.B. Luling Bridge stay-cable replacement. In Proceedings of the Structures Congress 2009, Austin, TX, USA, 30 April–2 May 2009; pp. 1–10. [Google Scholar] [CrossRef] [Scilit]
- Mehrabi, A.B. Stay-cable replacement of the Hale Boggs Bridge. In Proceedings of the 26th US–Japan Bridge Engineering Workshop, Tsukuba, Japan, 20–22 September 2010; pp. 333–343. [Google Scholar]
- Mehrabi, A.B.; Ligozio, C.A.; Ciolko, A.T.; Wyatt, S.T. Evaluation, rehabilitation planning, and stay-cable replacement design for the Hale Boggs Bridge in Luling, Louisiana. J. Bridge Eng. 2010, 15, 364–372. [Google Scholar] [CrossRef] [Scilit]
- Taylor, P.R.; van Selst, A.M.; Hodge, W.E.; Sexsmith, R.G. Annacis cable-stayed bridge—Design for earthquake. Can. J. Civ. Eng. 1985, 12, 472–482. [Google Scholar] [CrossRef] [Scilit]
- Stiemer, S.F.; Taylor, P.; Vincent, D.H.C. Full-scale dynamic testing of the Annacis Bridge. IABSE Proc. 1988, 12, 1–16. [Google Scholar]
- Manzini, N.; Orcesi, A.; Thom, C.; Clément, A.; Botton, S.; Ortiz, M.; Dumoulin, J. Structural health monitoring using a GPS sensor network. In Proceedings of the 9th European Workshop on Structural Health Monitoring (EWSHM 2018), Manchester, UK, 10–13 July 2018; p. 12. [Google Scholar]
- Stensvold, B.; Minoretti, A. A long-span bridge in Norway. In Proceedings of the International Seminar on Long Span Bridge Construction, Maintenance and Disaster Resistance Techniques, Shanghai, China, 23–25 October 2014. [Google Scholar]
- Yao, W.J.; Yang, W.; Liu, X.Y. Analysis of the cable replacement method of Tianjin Yonghe Bridge. Appl. Mech. Mater. 2011, 71–78, 1383–1387. [Google Scholar] [CrossRef] [Scilit]
- Chen, Q.; Wang, H.; El-Tawil, S.; Agrawal, A.K.; Bhattacharya, B.; Wong, W. Progressive collapse behavior of a long-span cable-stayed bridge induced by cable loss. J. Bridge Eng. 2023, 28, 05023005. [Google Scholar] [CrossRef] [Scilit]
- Huang, E.; Ke, H.; Hu, H. Optimization of construction process and determination of intermediate cable forces for composite beam cable-stayed bridge. Appl. Sci. 2023, 13, 5738. [Google Scholar] [CrossRef] [Scilit]
- Che, G.; Jia, R.; Liu, K.; Zhu, S.; Hu, J. Cable force measurement of cable-stayed bridge based on microwave radar test technology. Adv. Civ. Eng. 2024, 2024, 2515052. [Google Scholar] [CrossRef] [Scilit]
- Jeong, S.; Jin, S.-S.; Sim, S.-H. Modal property-based data anomaly detection method for autonomous stay-cable monitoring system in cable-stayed bridges. Struct. Control Health Monit. 2024, 2024, 8565150. [Google Scholar] [CrossRef] [Scilit]
- Yao, G.; Wang, Q.; Chen, F.; Ying, L.; He, X.; Zhen, S.; Yu, X. A data-driven model for damage evolution of bridge stay cable. Case Stud. Constr. Mater. 2024, 20, e03209. [Google Scholar] [CrossRef] [Scilit]
- Guo, T.; Qin, D.; Zou, Y.; Liu, Z. Research and development of corrosion monitoring sensor for bridge cable using electrical resistance probes technique. Measurement 2024, 237, 115178. [Google Scholar] [CrossRef] [Scilit]
- Guo, X.-Y.; Fang, S.-E. A physics-informed auto-encoder-based cable force identification framework for long-span bridges. Structures 2024, 60, 105906. [Google Scholar] [CrossRef] [Scilit]
- Luo, L.-Y.; Du, Y.-L.; Yi, T.-H.; Qu, C.-X. Identification of time-varying cable force for cable-stayed bridge using cable–beam transmissibility function. J. Civ. Struct. Health Monit. 2025, 15, 3589–3606. [Google Scholar] [CrossRef]
- Li, Y.; Zhu, Y.; Xiong, W.; Zhou, T.; Cai, C.S. Digital bridge maintenance: A point cloud and physical model fusion method for cable force identification. Mech. Syst. Signal Process. 2025, 234, 112842. [Google Scholar] [CrossRef] [Scilit]
- Deng, C.; Ren, Y.; Xu, X.; Fan, Z.; Huang, Q. Real cable force-based time-varying degradation and maintenance strategy analysis of stay cables. Eng. Struct. 2025, 328, 119730. [Google Scholar] [CrossRef] [Scilit]
- Guo, J.; Zhu, L.; Zhang, Y.; Guo, H. Application research on cable force optimization of cable-stayed bridge based on improved grey wolf algorithm. Buildings 2025, 15, 1309. [Google Scholar] [CrossRef] [Scilit]
- Duan, H.; Liu, H.; Sun, Y.; Gao, H. Determination of reasonable internal force state for cable-stayed bridge without backstays. J. Civ. Struct. Health Monit. 2023, 13, 1243–1263. [Google Scholar] [CrossRef] [Scilit]
- Devore, J.L. Probability and Statistics for Engineering and the Sciences, 5th ed.; Higher Education Press: Beijing, China, 2004. [Google Scholar]
- Kosco, T.; Margetin, M.; Chmelko, V.; Sulko, M. Bridge cable tension estimation using the vibration method. Structures 2024, 63, 106332. [Google Scholar] [CrossRef] [Scilit]
- Wang, L.; Zhang, Y.; Xiao, Z.; Liu, L. A tensioning control method for stay cables with super-large-tonnage cable force. Int. J. Struct. Integr. 2024, 15, 613–630. [Google Scholar] [CrossRef] [Scilit]
- JTG 5120-2021; Specifications for Maintenance of Highway Bridges and Culverts. China Communications Press Co., Ltd.: Beijing, China, 2021.

Disclaimer/Publisher’s Note: The statements, opinions and data contained in all publications are solely those of the individual author(s) and contributor(s) and not of MDPI and/or the editor(s). MDPI and/or the editor(s) disclaim responsibility for any injury to people or property resulting from any ideas, methods, instructions or products referred to in the content. |
© 2026 by the authors. Licensee MDPI, Basel, Switzerland. This article is an open access article distributed under the terms and conditions of the Creative Commons Attribution (CC BY) license.