


Abstract
To promote waste tyre resource utilisation and reduce environmental pressure, this study prepared five stone sample groups using waste tyre rubber fibre (RF) as a modifier, combined with blast furnace slag, fly ash, carbide slag, and calcium chloride, with RF contents of 0%, 6%, 10%, 14%, and 18%. Working performance was analysed via density, fluidity, and water separation rate tests, while mechanical properties and failure mechanisms were explored through uniaxial compression tests, acoustic emission (AE) monitoring, and SEM microstructure observations. Results showed that as RF content increased, slurry density and fluidity decreased nonlinearly, water separation rate first rose then fell, and uniaxial compressive strength dropped significantly (64.97% lower at 18% RF than 0%). Failure mode shifted from shear to tensile–shear mixed failure, AE signal activity weakened, energy release gentled, and crack propagation was delayed. Microstructurally, 6–10% RF ensured uniform fibre dispersion, blocking microcracks and optimising interfacial zones, while 14–18% RF caused agglomeration and pore defects. The optimal grouting material ratio was determined as 10% RF, blast furnace slag: fly ash = 4:1, 40% carbide slag, 1% calcium chloride, and a 0.7 water–cement ratio (total solid component 100%).
1. Introduction
The continuous expansion of the scale of coal mining has strongly supported the high-quality development [1,2] of China, but the contradiction between the mining damage caused by it and the protection of ground buildings (structures) has become increasingly prominent [3,4]. In the field of underground engineering construction, grouting technology [5,6,7] is a core means of controlling the stability of surrounding rock and mitigating water-related hazards, and its effectiveness depends directly on the overall performance of the grouting materials. At present, this technology relies mainly on fly ash as the primary grouting material [8]. The ever-increasing demand for fly ash, reflected in the rising grouting-to-extraction ratio, has led to supply shortages in some mining areas, thereby constraining the wider application of the technology. Meanwhile, the massive accumulation of waste tyres is posing a serious environmental challenge, and their resource utilisation has become urgent [9,10]. Waste tyre rubber is characterised by low density, high elasticity, and chemical stability; when processed into granular or fibrous forms and incorporated as a functional component in grouting materials, it can not only alleviate the pressure on fly ash resources, but also potentially endow the slurry with advantageous properties such as reduced density, enhanced toughness, and tunable rheology [11]. Therefore, investigating the application of waste tyre rubber in overburden separation grouting and developing high-performance alternative grouting materials based on waste rubber are of great theoretical significance for both the resource utilisation of waste tyres and the development of green, high-performance grouting materials.
Waste tyre rubber is one of the largest solid waste streams worldwide. Statistics indicate that more than 1.5 billion waste tyres are generated globally each year [12], and the annual output of waste tyres in China alone exceeds 200 million tonnes [13]. If improperly managed, waste tyres can cause serious environmental harm, whereas their rational utilisation can transform waste into a resource and promote circularity [14,15]. Over many years, extensive research has been conducted domestically and internationally on the comprehensive utilisation of waste tyre rubber. Liu et al. [16] prepared rubber lightweight soil using construction spoil and waste tyre rubber particles and reported that the addition of rubber reduces the workability of the fresh mixture while offsetting part of the expansion stress caused by pore-water freezing, thereby improving the frost resistance of the material. Li et al. [17] evaluated two configurations of waste tyres—one in the form of chips or granules and the other in the form of fibres—and concluded that the fibrous form exhibits superior performance to chips or granules. Wang et al. [18] investigated the effects of rubber powder particle size and dosage on the compressive and flexural strengths of cement mortar, finding that smaller rubber particle sizes lead to greater reductions in both strengths. Xie [19] demonstrated that an appropriate amount of waste tyre rubber admixture can improve the workability of concrete, reduce the heat of hydration, and enhance its cracking resistance and durability, thereby providing valuable guidance for the resource utilisation of waste tyres and the performance enhancement of mass concrete. Zhang et al. [20] carried out optimal mix-design tests on expansive soil improved with waste rubber particles, showing that this approach not only enables the reuse of waste tyres but also improves the workability of expansive soil and enhances subgrade stability. Maciej et al. [21] incorporated rubber particles from recycled tyres as a modifying additive in cement-based composites and, through analysing various types and mixtures of rubber particles, showed that rubberised mortars retained the required flow properties and achieved the target compressive strength after curing, confirming both technical feasibility and practical applicability. Zhang et al. [22] further reported that variations in rubber content markedly affect the mechanical properties of hydraulic concrete, with increasing rubber content and decreasing rubber particle size leading to significant reductions in mechanical performance. Ni et al. [23,24] examined the sustainable recycling and resource utilisation of urban waste tyres; by systematically studying the compressive behaviour of tyre aggregates and its influencing factors, they revealed the considerable potential for sustainable resource utilisation.
The above-mentioned studies provide an important theoretical basis for understanding how rubber particles and fibres, when used as additives in construction materials, can improve fluidity, frost resistance, and overall workability while generally leading to a reduction in mechanical strength and showing that fibres perform better than particles. Although their application in concrete, mortar, and related materials has been shown to be feasible, the associated loss of mechanical performance remains a critical bottleneck. In view of this, the present study prepares five groups of grouting material specimens with different rubber particle dosages and investigates the influence of rubber content on the workability of the grouting materials. Uniaxial compression tests are then conducted with the aid of an acoustic emission system and a three-dimensional full-field strain measurement system (XTDIC) to analyse the stress response, deformation and failure characteristics, acoustic emission evolution, and micromorphology of the specimens. On this basis, the intrinsic mechanisms governing load bearing and failure are elucidated, and the optimal mix proportion of the grouting materials is determined. The findings provide a scientific basis for the formulation optimisation of high-performance grouting materials and offer a new pathway for the resource utilisation of waste materials in underground engineering.
2. Experimental Materials and Methodologies
2.1. Material and Sample Preparation
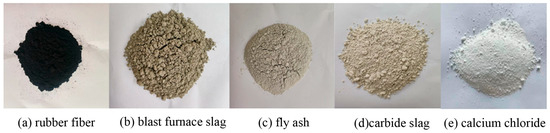
The specimens used in the tests were prepared from six constituent materials: rubber particles, blast-furnace slag, fly ash, carbide slag, calcium chloride and potable water, as shown in Figure 1. Rubber particles, from a car repair factory in Qingdao, Shandong Province, are produced by crushing and screening of waste tyres, with a particle size of 2~5 mm. Blast furnace slag, fly ash, and carbide slag were selected from a steel plant, a power plant and a chemical plant in Qingdao, Shandong Province, and the calcium chloride was supplied by Tianjin Beilian Fine Chemicals Development Co., Ltd. (Tianjin, China).The water used in the experiments was tap water from the laboratory of Shandong University of Science and Technology. The main chemical compositions of the rubber particles, blast-furnace slag, fly ash, carbide slag, and calcium chloride are presented in Table 1, Table 2, Table 3 and Table 4.
Figure 1.
Test raw materials.
Table 1.
Chemical composition and proportion of rubber fibre.
Table 2.
Chemical composition and proportion of blast furnace slag.
Table 3.
Chemical composition and proportion of fly ash.
Table 4.
Chemical composition and proportion of carbide slag.
The rubber fibre (RF) used in this experiment was prepared from waste tyres by a series of processes such as physical crushing, screening, fibre stripping, purification, and drying. The specific steps are as follows:
- (1)
- Raw material pretreatment: Artificially remove stones, soil, and other attachments on the surface of waste tyres, cut into 5~10 cm block waste by shearing machine, separate steel cord and nylon cord, and only retain rubber matrix.
- (2)
- Multi-stage crushing: first through the jaw crusher primary crushing to 5~20 mm, and then through the impact crusher secondary crushing to 2~10 mm, finally using high-speed shear crusher peeled into fibrous, using the shear cutterhead high-speed rotation to achieve the conversion of rubber particles to fibre.
- (3)
- Screening and purification: 2 mm and 5 mm double-layer vibrating screens were used for grading and screening, and 2~5 mm fibrous products were retained; the fine particles and dust were separated by an air separator to improve the purity of the fibre to more than 98%.
- (4)
- Surface treatment: put the fibre into a high-speed stirrer, add a silane coupling agent aqueous solution accounting for 0.5% of the fibre mass, and stir for 15 min to improve the surface hydrophobicity; rinse 3 times with deionized water for 3 min each time to remove the residual coupling agent.
- (5)
- Drying and storage: Drying in a constant temperature oven at 60 °C for 24 h, control the moisture content below 1%; after sealing, it is placed in a cool and dry place for standby to avoid moisture absorption and ageing.
2.2. Proportioning Scheme Design
In this experiment, all the proportions are measured by mass ratio, and the solid components include rubber fibre, blast furnace slag, fly ash, calcium carbide slag, and calcium chloride, accounting for 100% in total. The mass ratio of blast furnace slag to fly ash is fixed at 4:1, and the proportion of the two is adjusted according to the content of rubber fibre. Purified water was additionally added at a water–cement ratio of 0.7 (mass ratio of water to solid components). The specific test ratio design is shown in Table 5. According to the different content of rubber fibre, the samples were divided into five groups: 0% RF, 6% RF, 10% RF, 14% RF, and 18% RF.
Table 5.
Design of rubber fibre slurry proportioning scheme.
2.3. Test Process and Monitoring Method
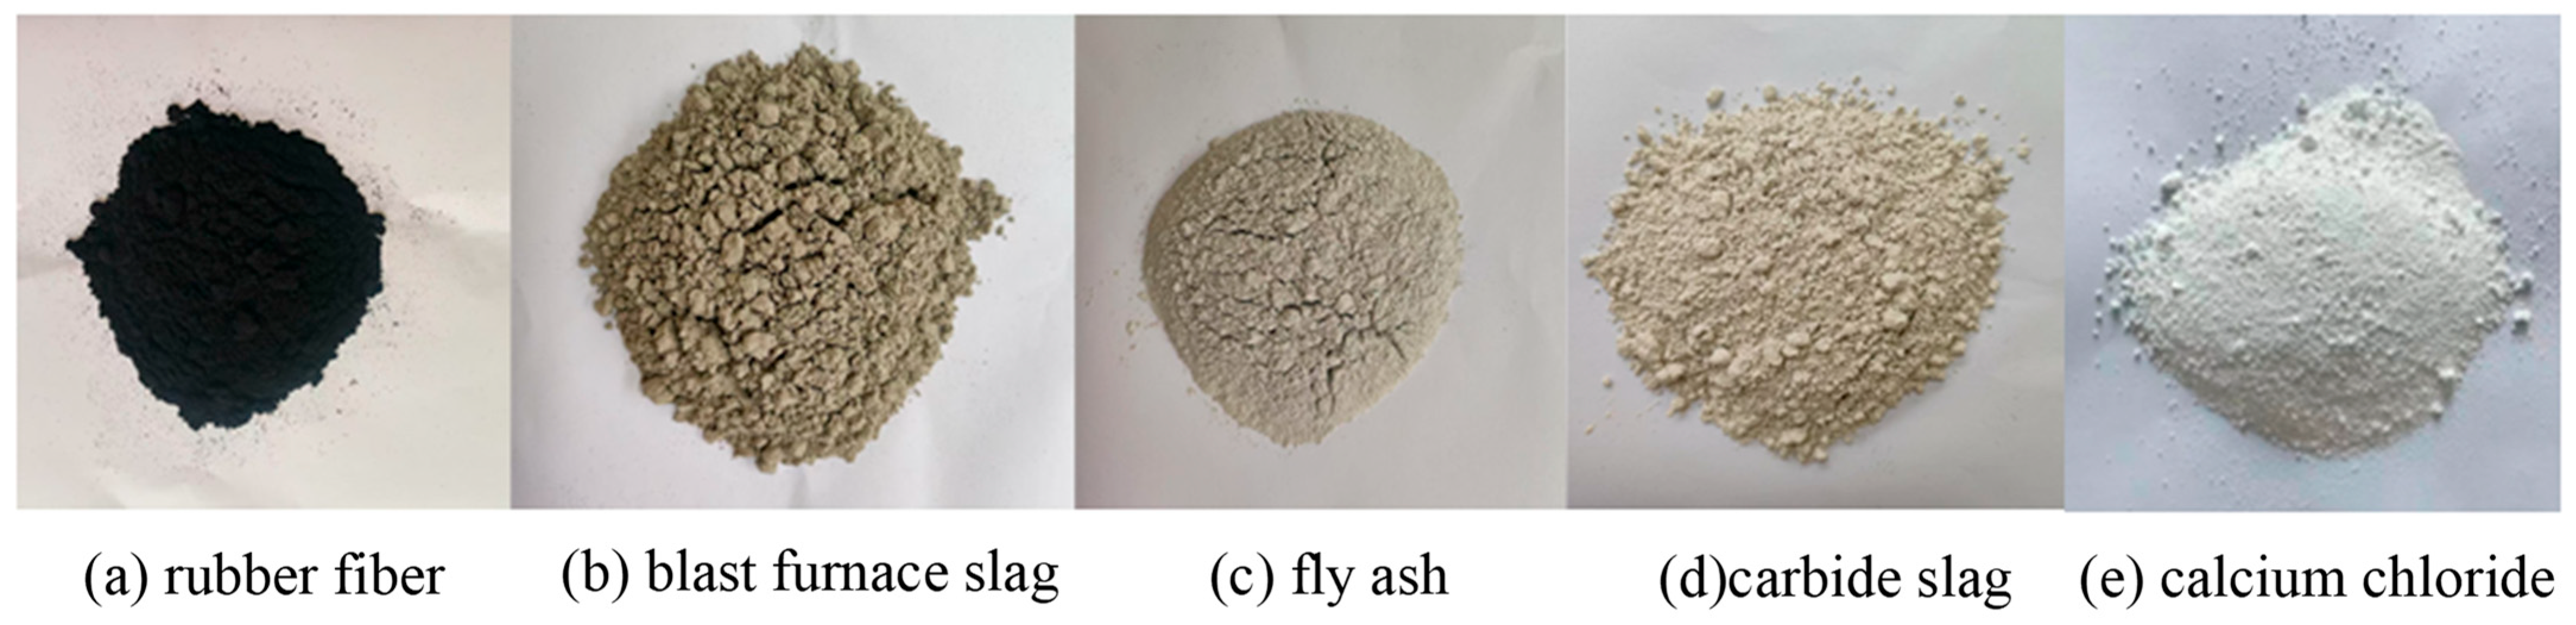
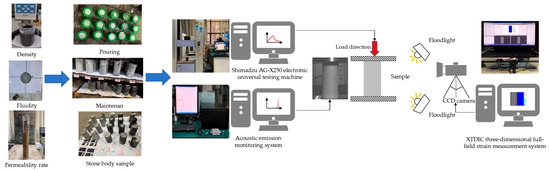
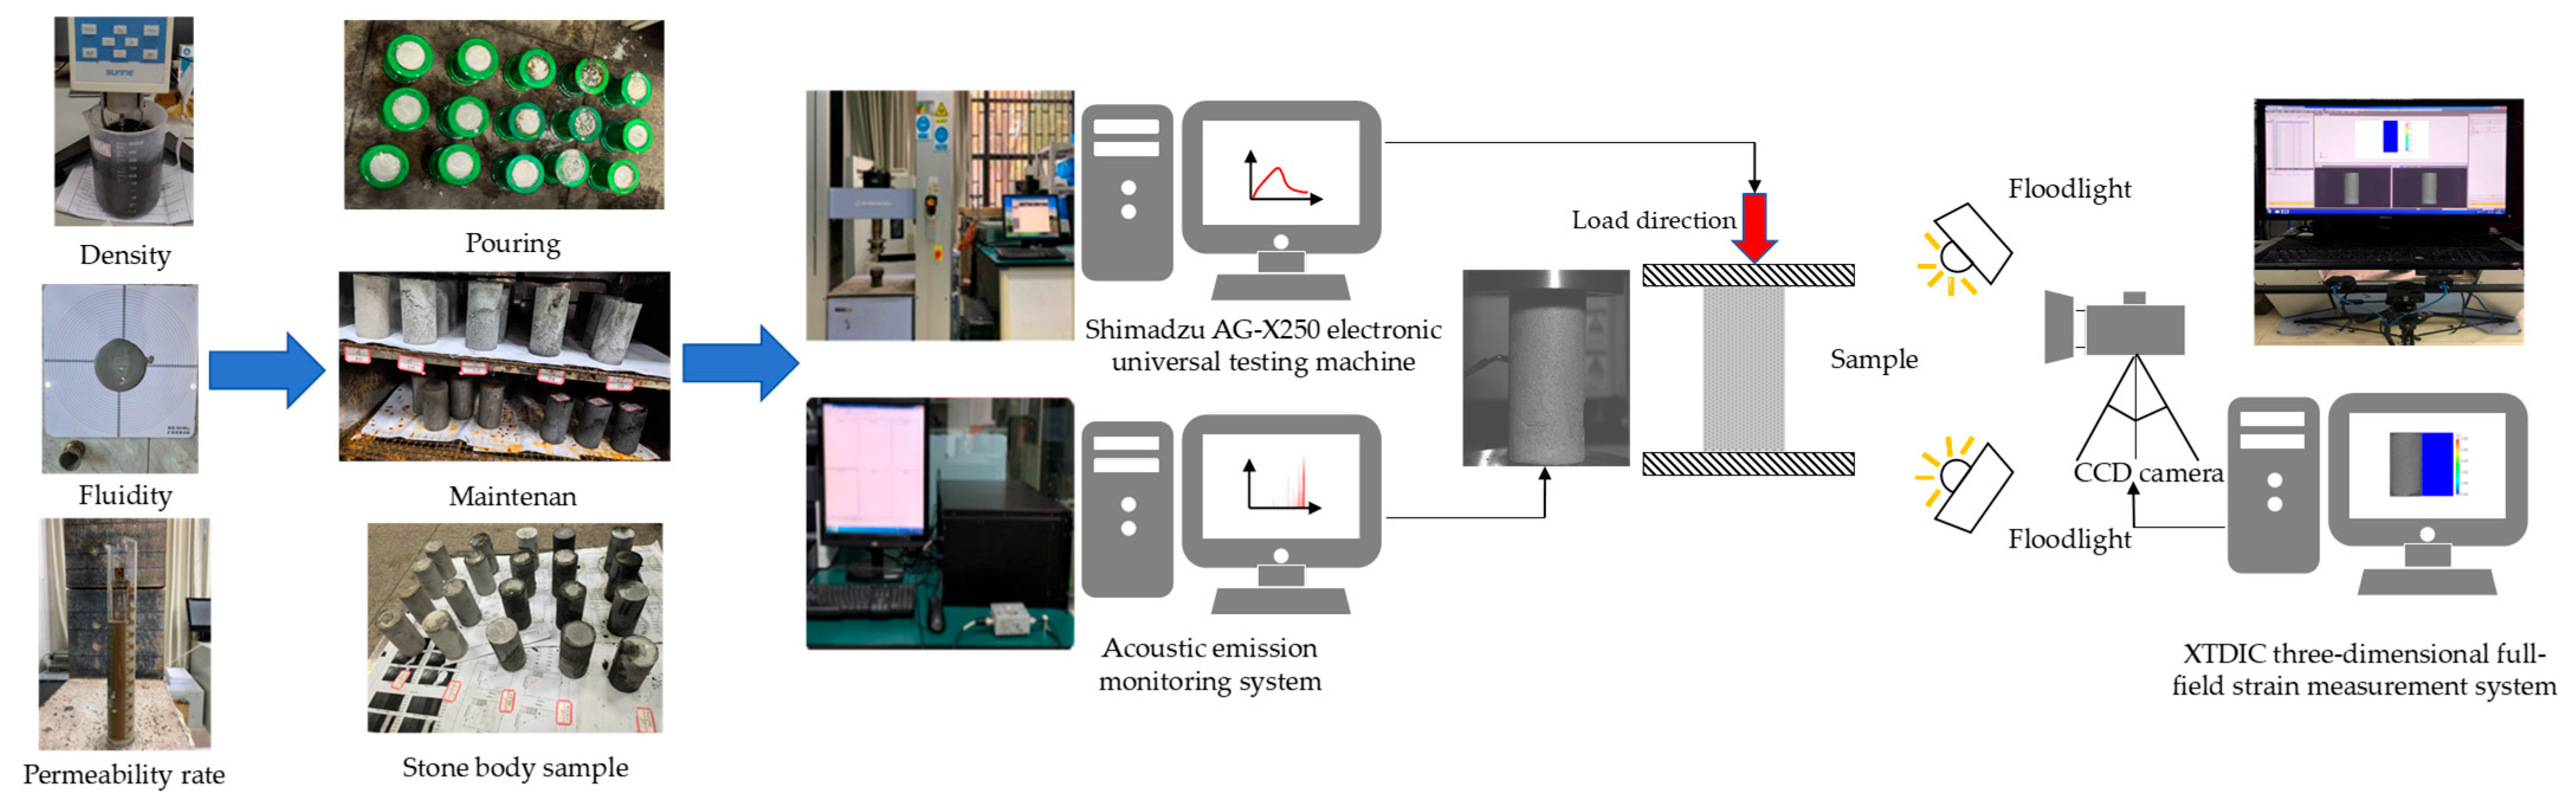
As shown in Figure 2, the experimental procedure comprised slurry performance testing, slurry preparation, and specimen casting, followed by microstructural analyses. The specific testing methods were as follows.
Figure 2.
Test process and monitoring system.
- (1)
- The density of the slurry [25,26] (g/cm3) was determined by weighing a known volume using a densimeter or a graduated cylinder. By analysing the density, the rationality of the rubber particle dosage and the proportions of the other components could be assessed, thereby indirectly reflecting the compactness of the internal structure of the slurry.
- (2)
- Fluidity [27] was measured with reference to the Technical Specification for Application of Cement-based Grout (GB 50448-2015) [28]. Fluidity directly affects the ease of handling of rubber particle slurry during construction; its analysis enables assessment of construction operability and determination of optimal process parameters. A truncated cone mould was used to measure the maximum spread diameter of the slurry 30 s after lifting the mould. The apparatus for the fluidity test consisted of a flow table (400 × 400 × 5 mm), a paste mould (top diameter 36 mm, bottom diameter 60 mm, height 60 mm), and a scraper. The flow table was placed on a horizontal surface, and the mould was positioned at its centre. After the slurry was prepared and thoroughly mixed, it was poured into the mould. The mould was then lifted vertically and the time recorded. After 30 s, the maximum diameter of the spread slurry on the table was measured. Two orthogonal diameters were recorded, and their average value was taken as the fluidity index.
- (3)
- The permeability rate of the slurry [29] is a key indicator of slurry stability and is defined as the ratio of the volume of free water released, due to particle settling and water separation during resting or setting, to the initial total volume of the slurry. Bleeding leads to stratification, with a water-rich upper layer and a lower layer with an increased concentration of solid particles, which severely compromises the homogeneity and uniformity of the hardened material. By controlling the permeability rate, internal porosity can be reduced, thereby improving the impermeability, frost resistance, and other durability indices of the slurry and extending the service life of engineering structures.
- (4)
- For the uniaxial compressive strength (UCS) tests, slurries with different mix proportions were poured into a mixer and blended until homogeneous. The mixed slurry was then cast into cylindrical moulds (φ50 × 100 mm) in three layers, each corresponding to one-third of the total volume, and compacted using a vibrating device to minimise entrapped air. During casting, a thin layer of lubricant was applied to the mould walls to prevent damage to the specimens during demoulding. After casting, the specimens were left to stand for 24 h, demoulded, and then cured in a chamber at 20 °C and 95% relative humidity for 28 d. Upon completion of curing, the specimen surfaces were ground with sandpaper to ensure planarity prior to mechanical testing. The test control and monitoring system consisted of a loading system, an acoustic emission (AE) system, and a three-dimensional full-field strain measurement system (Figure 2). To reduce timing errors and facilitate data processing and analysis, the loading system, AE system, and three-dimensional full-field strain measurement system were operated synchronously throughout the tests. The loading system was a Shimadzu AG-X250 electronic universal testing machine (Shimadzu Corporation, Kyoto, Japan) driven by an AC servo motor with a dual-screw loading configuration, capable of conventional compression, tension, and other mechanical tests, with a maximum load capacity of 250 kN. Displacement-controlled loading was adopted at a rate of 0.005 mm/s until specimen failure [30,31]. A MISTRAS PCI-2 AE system (Soft Island Times Technology Co., Ltd., Beijing, China) was used to monitor in real time the AE signals generated during the uniaxial compression failure process. Vaseline was applied between the sensors and the specimen surface to ensure good coupling and reliable signal reception. The XTDIC three-dimensional full-field strain measurement system (China Xintuo 3D Technology (Shenzhen) Co., Ltd., Shenzhen, China) was employed to monitor the deformation characteristics of specimens with different rubber particle contents during uniaxial compression. During the tests, speckle patterns on the specimen surfaces were captured by a CCD industrial camera at a sampling frequency of 3 frames/s.
- (5)
- For the scanning electron microscopy (SEM) tests, plate-like specimens with a side length of 1 cm, a thickness of less than 2 mm, and a relatively flat surface were selected. The microstructure of the samples was examined using a Hitachi Regulus 8100 ultra-high-resolution field-emission scanning electron microscope (FE-SEM, Hitachi, Tokyo, Japan). As a powerful microanalytical tool, SEM employs a high-energy electron beam to scan the sample surface point by point, and by detecting various signals generated from the interaction between the electrons and the sample (such as X-rays), it provides information on the surface morphology, composition, and structure. The specimens were fixed on the SEM sample holder, and any loose surface powder was removed using an air blower. The specimen chamber was then sealed to ensure safe locking. During imaging, the micrographs displayed on the screen were monitored in real time, enabling detailed observation of nanoscale particles, cracks, pores, and other fine surface features. Based on these observations, the magnification was adjusted as needed to characterise the mesoscopic structure of the different grouting materials.
3. Working Performance Analysis of Grouting Material
3.1. Test Results
In this study, each test for a given mix proportion was independently repeated three times. After obtaining the raw data from the three tests, the arithmetic mean was calculated and taken as the final result for that group. This averaging procedure effectively reduces random errors that may arise in individual tests, thereby improving the reliability and accuracy of the data and providing a more robust basis for subsequent analysis and conclusions. Table 6 summarises the experimental results for the rubber-particle grouting materials, including the four measured indices for all five specimen groups.
Table 6.
Grouting material test results.
3.2. Result Analysis
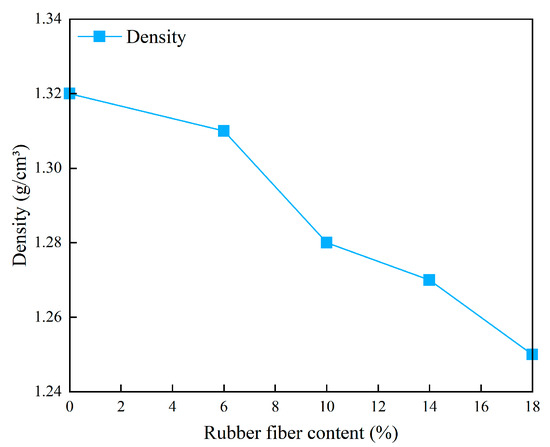
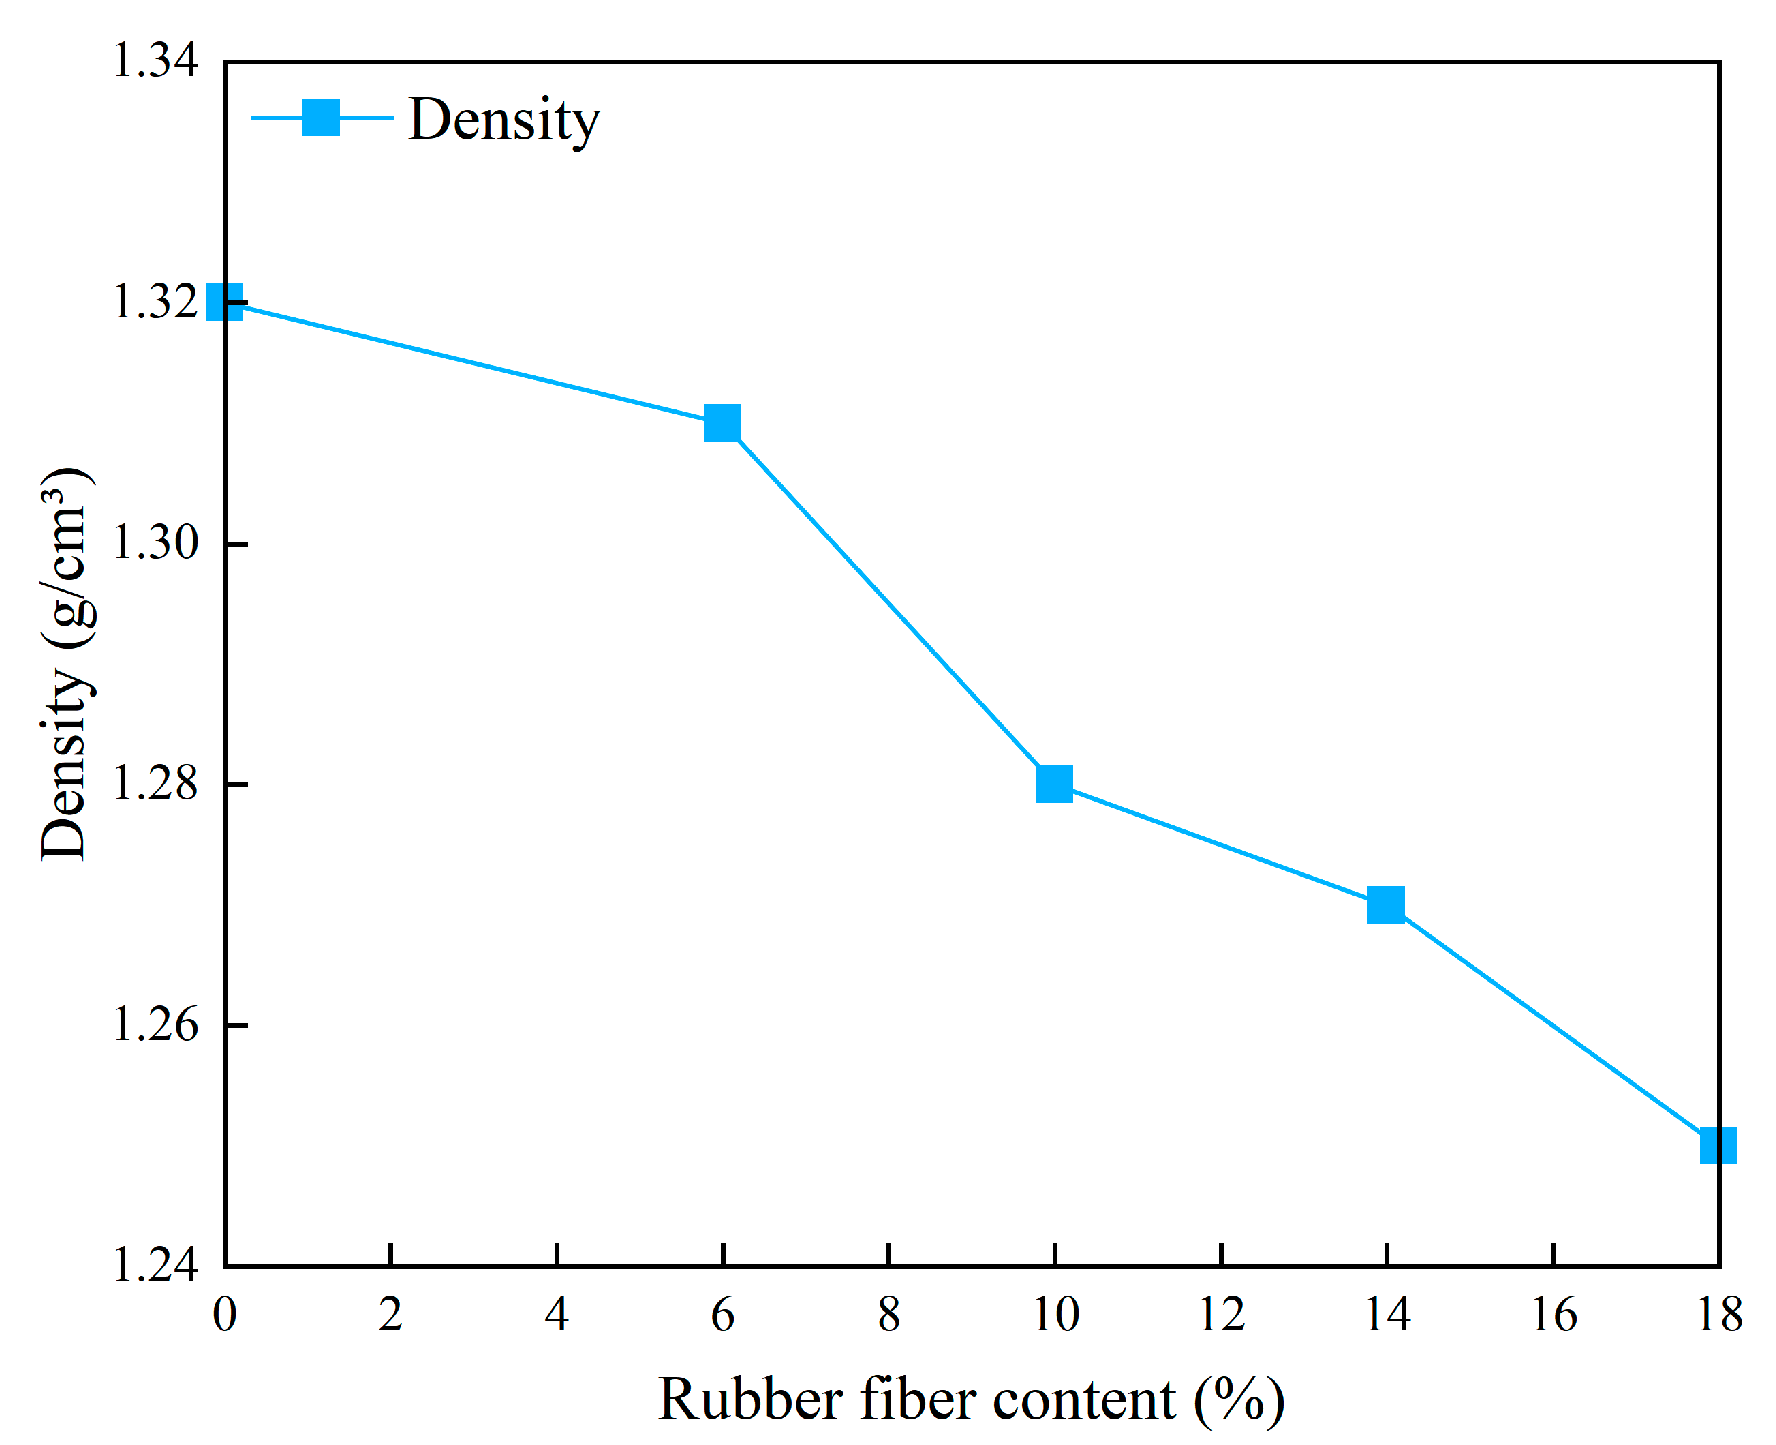
The variation in slurry density as a function of rubber particle content is shown in Figure 3. The slurry density is negatively correlated with the rubber particle dosage, exhibiting a continuous decrease as the rubber content increases. As illustrated, the maximum density of 1.32 g/cm3 occurs at a rubber content of 0%, whereas the minimum density of 1.25 g/cm3 is observed at a rubber content of 18%. The density–content relationship can be broadly divided into three stages: a gentle initial stage, a rapid decline stage, and a fluctuation–adjustment stage. In the gentle initial stage (0–6% rubber content), the density decreases by only 0.8%. At this stage, the amount of rubber particles is relatively small, their disturbance to the grouting system is limited, and the reduction in density is minor, corresponding to an initial incorporation of rubber and a gradual adjustment of the system density. In the rapid decline stage (6–10% rubber content), the reduction in density abruptly increases to 2.3%. Here, the rubber content exceeds a critical threshold, dispersion becomes more uniform, and particle–particle interactions as well as particle–slurry interfacial effects intensify, generating more low-density regions and leading to an accelerated decrease in density; this is the most influential interval. In the fluctuation–adjustment stage, the density reduction drops back to 0.8% for 10–14% rubber content, and then increases again to 1.6% for 14–18% content. Within this range, competing effects such as particle agglomeration and saturation of the slurry–rubber interface give rise to a nonlinear response. It is also noteworthy that at a rubber content of 10%, the density is 1.28 g/cm3, only 3% lower than at 0%. This indicates that a certain weight reduction can be achieved through the incorporation of rubber particles without inducing excessive loosening of the structure due to an overly low density, thereby meeting the lightweighting requirements of grouting materials. As the rubber fibre content increases from 0% to 18%, the proportion of light components gradually increases, which directly dilutes the overall density of the slurry, which is the core factor of low density. During the slurry stirring process, tiny voids are easily formed between the fibres, and there is a weak interface transition zone between the fibres and the hydrophilic cementitious matrix. These voids and interface defects further reduce the density of the slurry.
Figure 3.
Effect of rubber fibre content on slurry density.
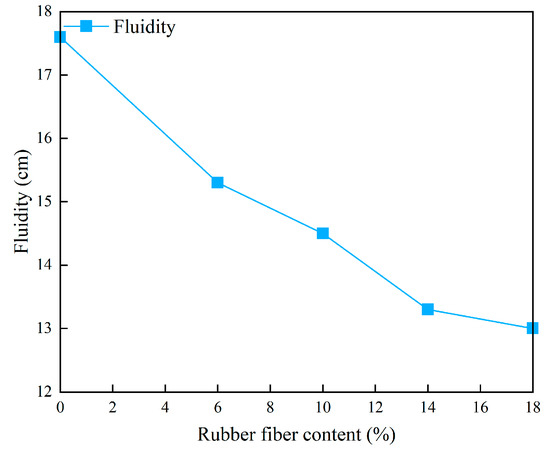
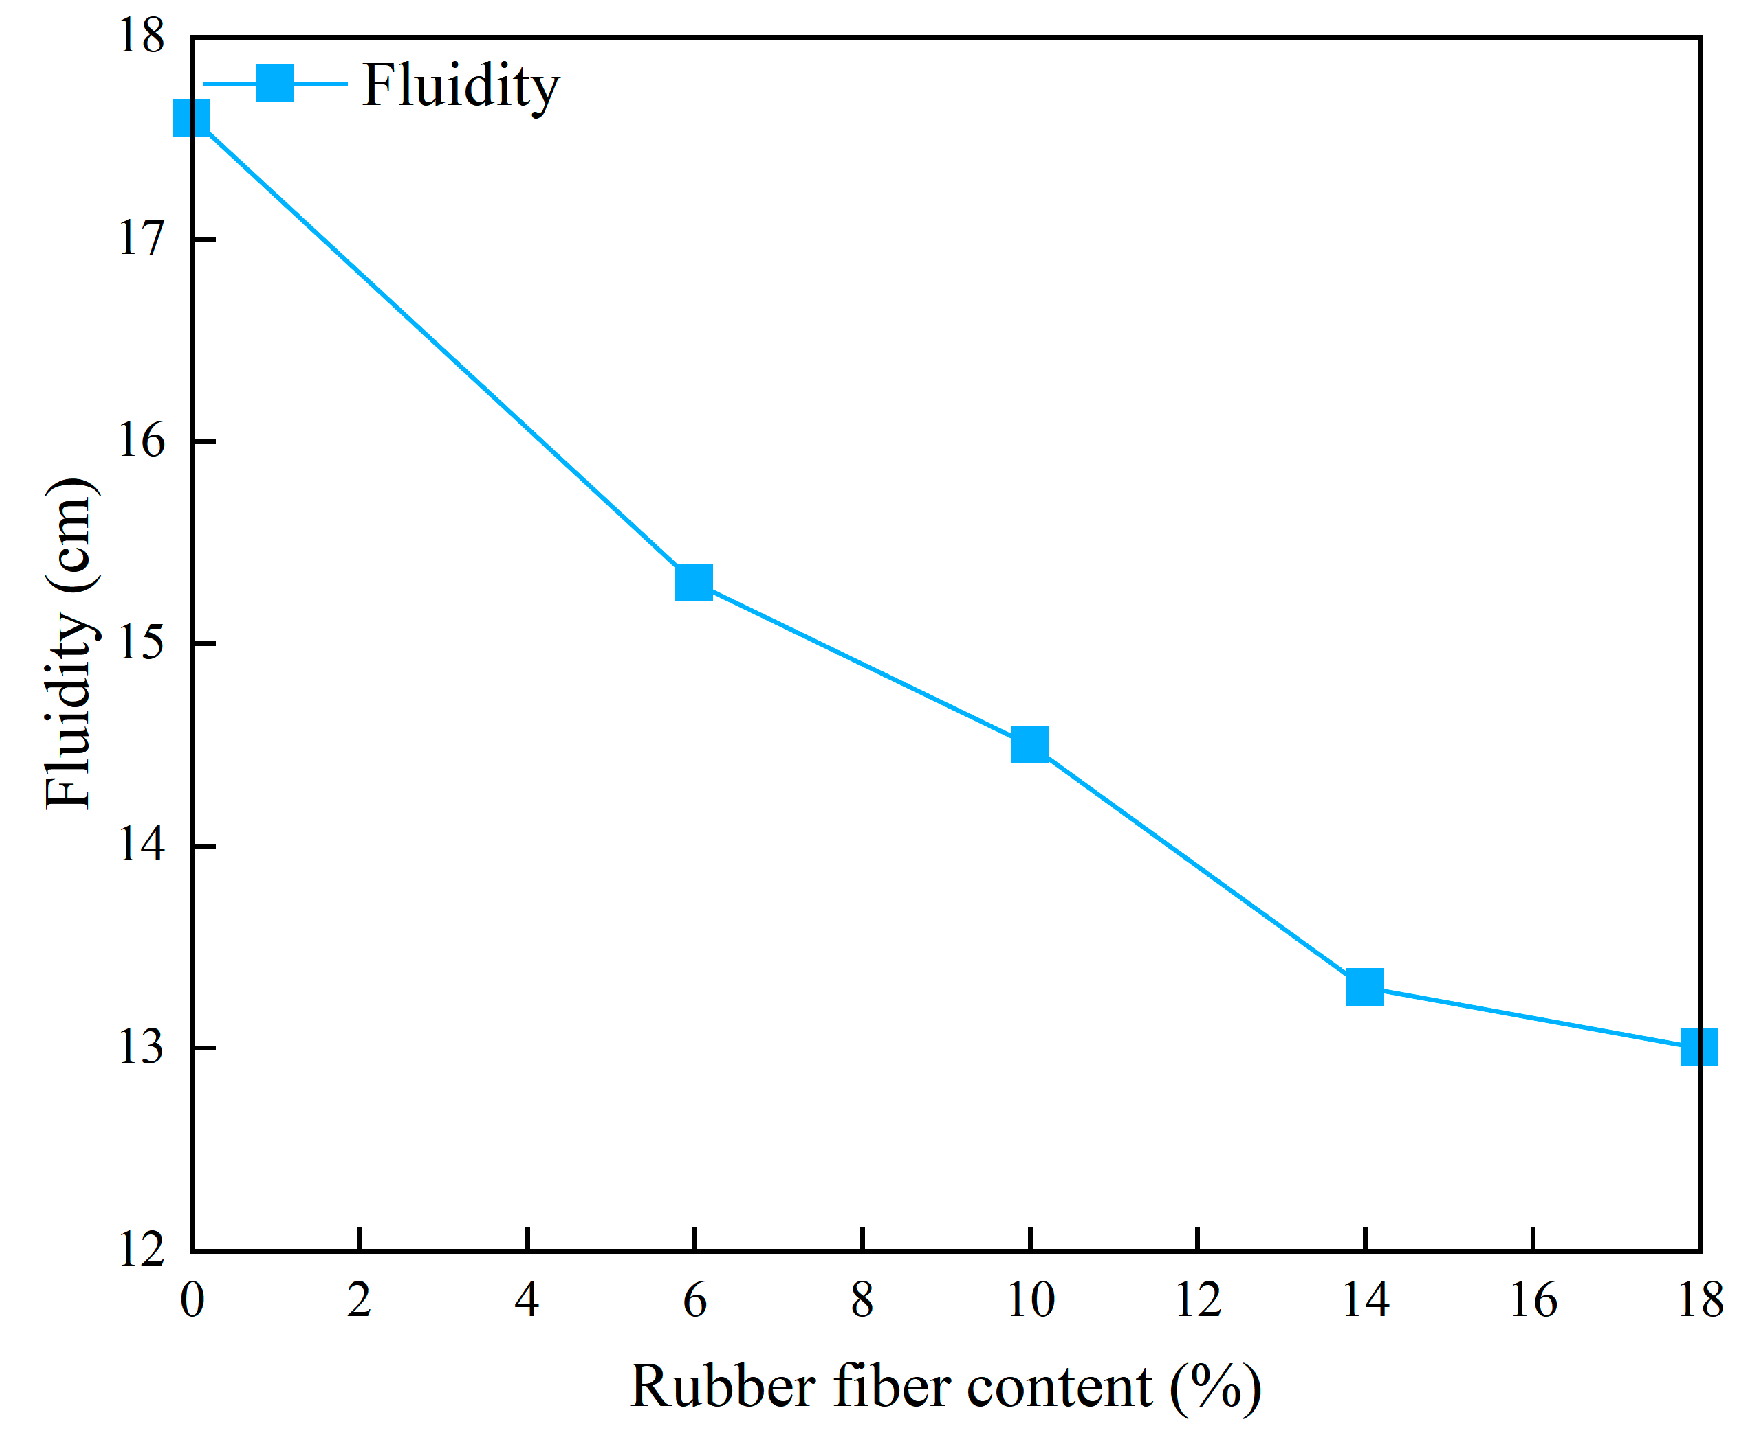
The variation in slurry fluidity as a function of rubber particle content is shown in Figure 4. Slurry fluidity is negatively correlated with rubber particle dosage, exhibiting a continuous decrease as the rubber content increases. As illustrated, the maximum fluidity of 17.6 cm occurs at a rubber content of 0%, whereas the minimum value of 13.0 cm is observed at 18%. When the rubber content increases from 0% to 6%, the fluidity decreases by 13.1%. At this stage, the amount of rubber is relatively low, with only a small quantity of particles dispersed within the system; the original slurry structure is not severely disrupted, and the reduction in fluidity remains relatively controlled. This can be regarded as a transitional phase in which the rubber particles are initially incorporated and the system gradually adapts, while maintaining a relatively stable flow behaviour.
Figure 4.
Influence curve of rubber fibre content on slurry fluidity.
As the rubber content increases from 6% to 10%, the decrease in fluidity reaches 5.2%. In this stage, the rubber dosage exceeds a critical threshold, and particle–particle interactions as well as particle–slurry interfacial effects intensify. The rubber particles become more uniformly dispersed within the slurry and begin to alter its internal structure, potentially forming a fine “obstruction network” that increases flow resistance and accelerates the decline in fluidity. This interval thus represents a key region controlling flow behaviour, in which the original flow equilibrium of the system is significantly disrupted. When the rubber content increases from 10% to 14%, the reduction in fluidity is 8.3%, whereas for 14–18% it narrows to 2.3%. Within this range, the mechanisms by which rubber particles influence fluidity become more complex. On the one hand, at high dosages local particle agglomeration may occur, and these agglomerates act as obstacles to flow; on the other hand, the slurry–rubber interface gradually approaches saturation. The alternating influence of particle dispersion and agglomeration, together with interfacial effects and their saturation, leads to repeated changes in the rate of fluidity loss and gives rise to a nonlinear relationship between rubber content and fluidity.
It is also noteworthy that at a rubber content of 10%, the fluidity remains at 14.5 cm. Although this represents a 17.6% reduction compared with 0% rubber, it still falls within an acceptable range for construction and is well above the minimum value of 13.0 cm. Thus, at 10% rubber content, the slurry can still achieve adequate filling of fractures without causing construction difficulties associated with excessively low fluidity at higher dosages.
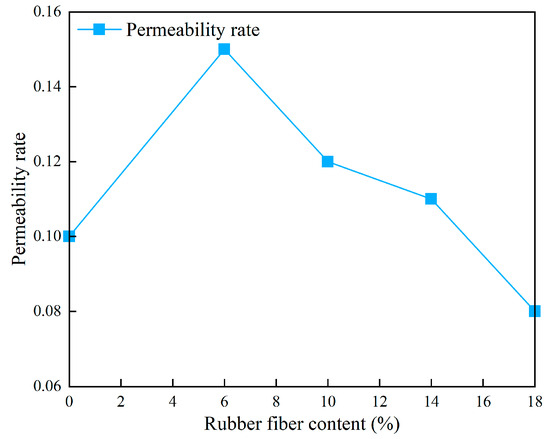
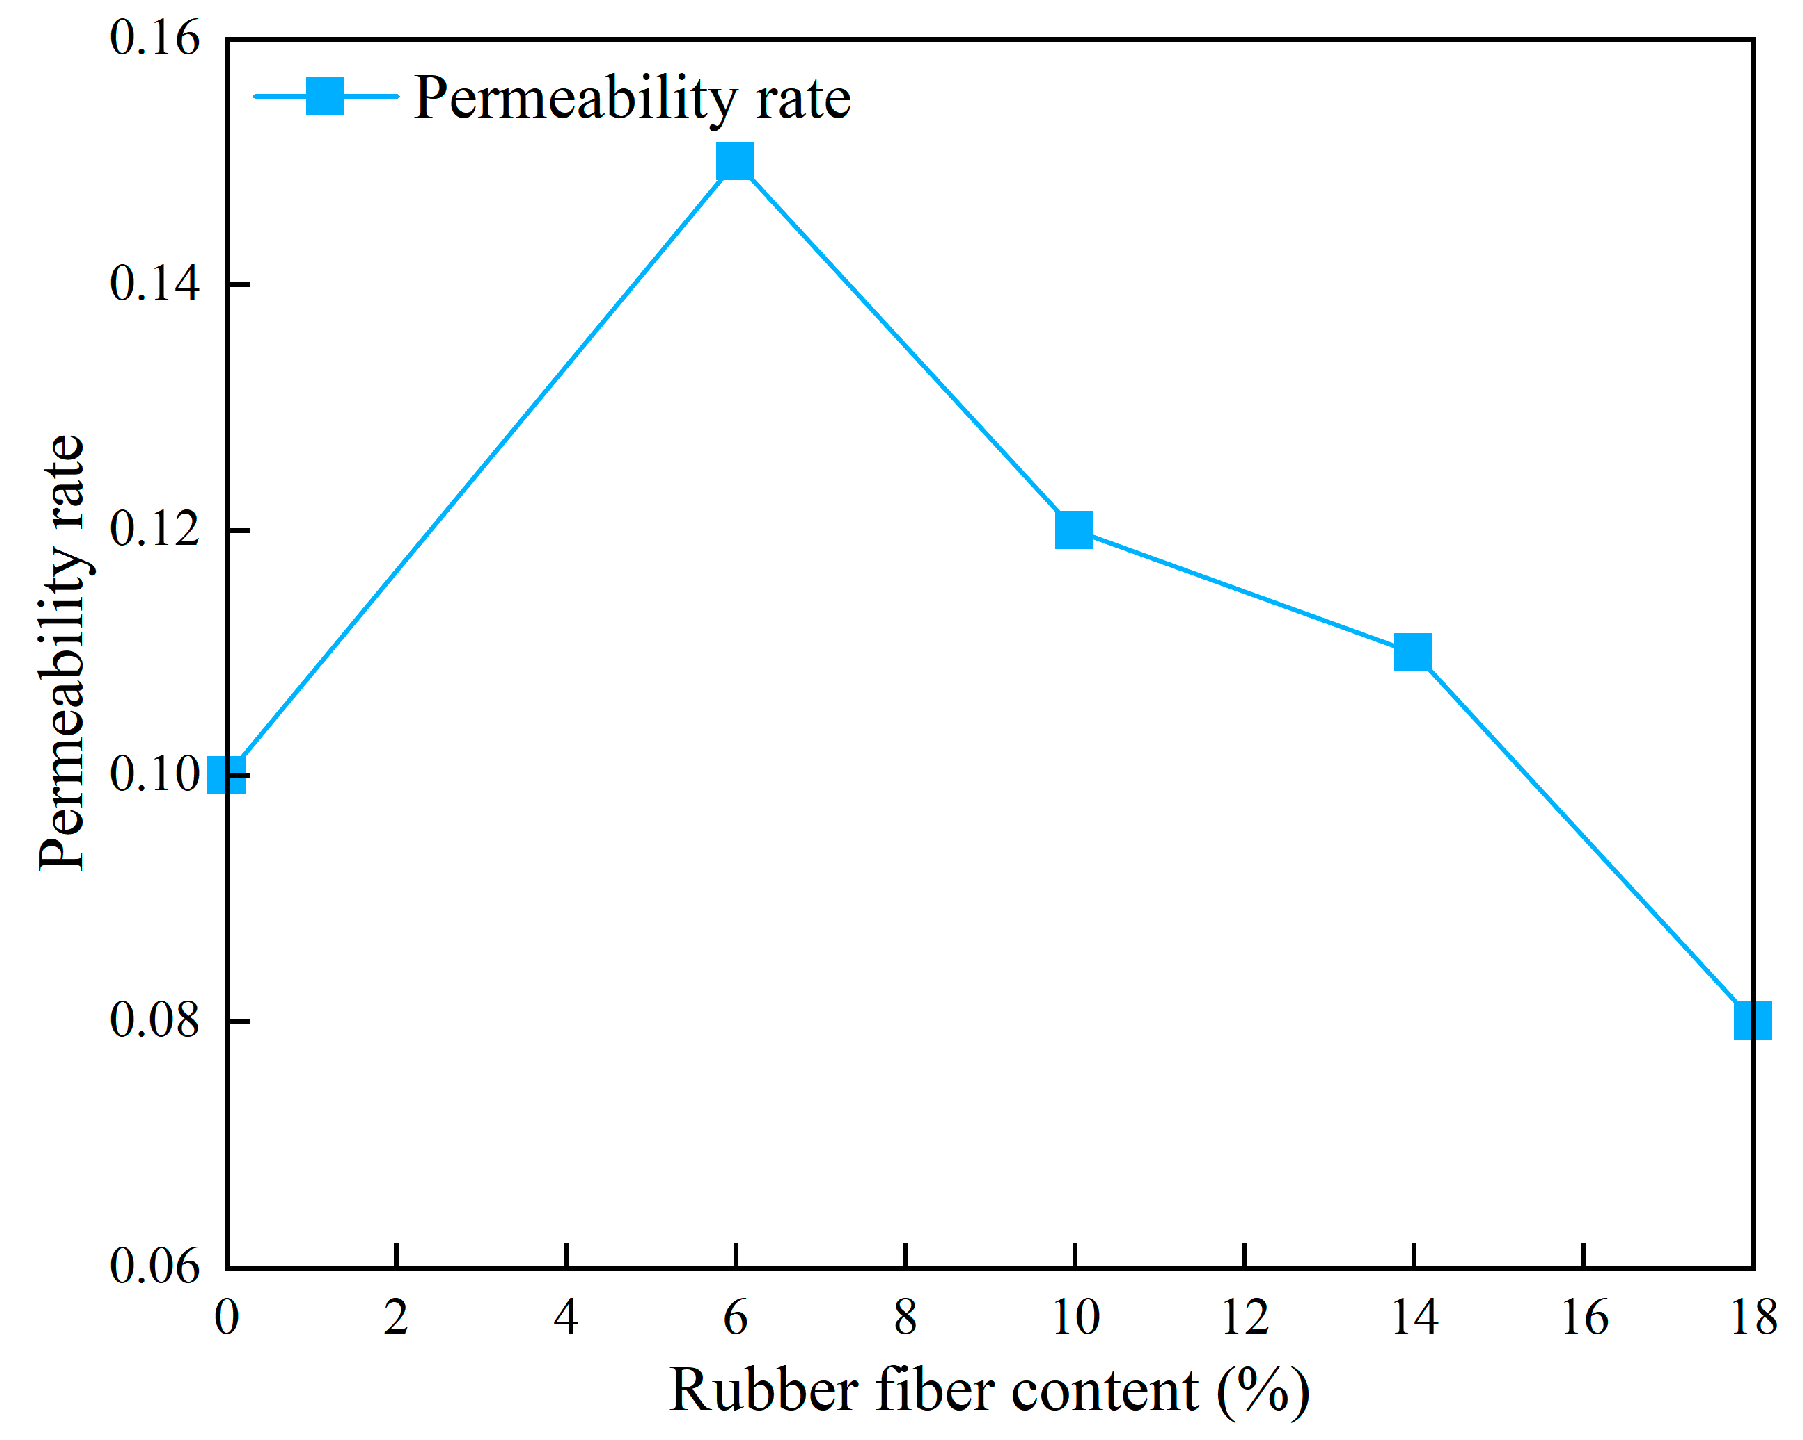
The variation in slurry permeability rate as a function of rubber particle content is shown in Figure 5. Overall, the permeability rate is negatively correlated with rubber dosage, exhibiting a general decreasing trend as the rubber content increases. As illustrated, the maximum permeability rate of 0.15 occurs at a rubber content of 6%, whereas the minimum value of 0.08 is observed at 18%. When the rubber content lies in the range of 0–6%, the permeability rate increases with increasing dosage and is 50.0% higher at 6% than at 0%. An increase in permeability rate indicates that free water in the slurry is more readily separated, which reduces slurry homogeneity, impairs its filling performance in construction joints and pores, leads to non-uniform density in the hardened body, and consequently weakens load-bearing, anti-seepage, and other functional properties.
Figure 5.
The influence curve of rubber fibre content on slurry drainage rate.
At rubber particle content of 10%, the permeability rate is 20.0% higher than that at 0%; however, relative to the peak at 6%, it has already decreased, and the overall trend beyond 6% is downward. At 14% rubber content, the permeability rate is 8.3% higher than that at 0%. In this stage, the rubber particles begin to provide a certain structural support and water-entraining effect, reducing the amount of free water released and thereby enhancing slurry stability. This promotes a more uniform distribution of water during setting and hardening, facilitates the formation of higher-quality hardened bodies, and gradually mitigates the adverse effects on filling and cementation performance. When the rubber content reaches 18%, the permeability rate is 27.3% lower than that at 0%, indicating that a high dosage of rubber particles can form a denser spatial network that strongly restrains water migration and significantly improves the water-retention capacity of the slurry. At 10% rubber content, the permeability rate is 0.12, markedly lower than the peak at 6% and only 20% higher than at 0%; under these conditions the slurry exhibits good stability, helping to reduce pores caused by water separation after hardening and achieving a balance between water retention and homogeneity.
4. Analysis of Mechanical Properties of Grouting Materials
4.1. Analysis of Strength Characteristics of Specimens
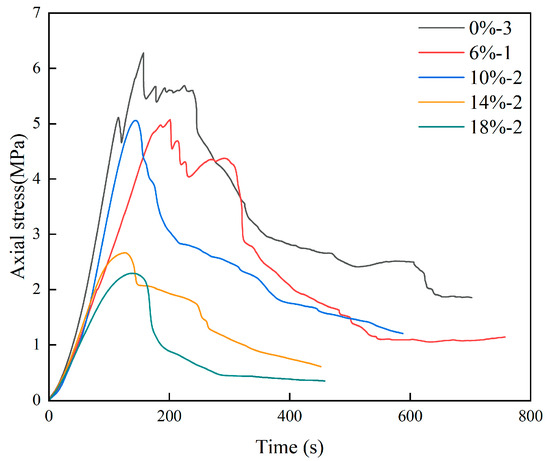
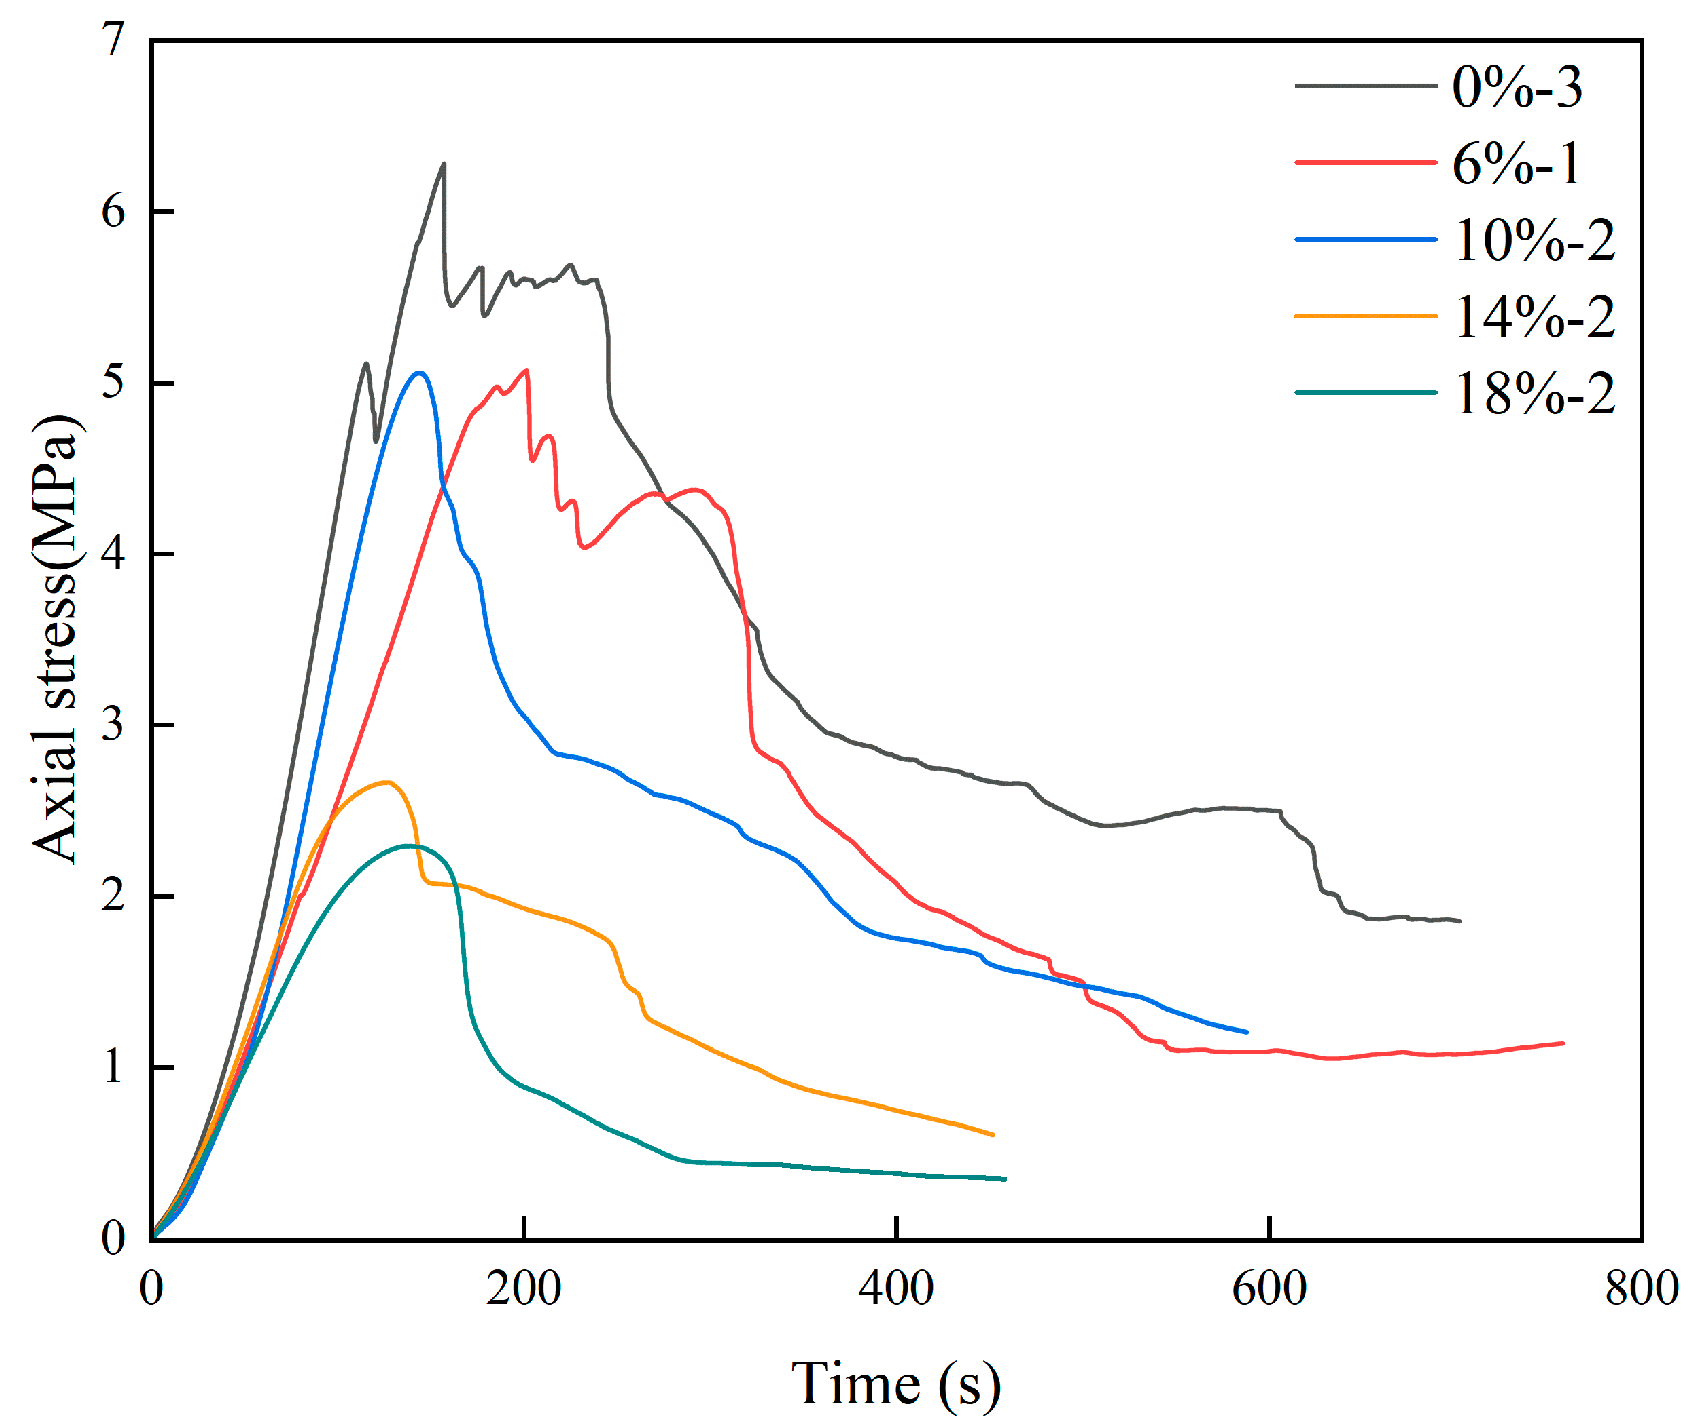
The axial stress–time curves of specimens with different rubber particle contents are shown in Figure 6. When the rubber content is 0%, the specimens exhibit the highest uniaxial compressive strength, whereas at 18% rubber content the uniaxial compressive strength is the lowest, indicating a decreasing trend in uniaxial compressive strength with increasing rubber dosage. The evolution of axial stress with time can be broadly divided into four stages: an initial compaction stage, an elastic stage, a plastic stage, and a post-peak failure stage. At the beginning of loading, the initial microcracks within the specimen gradually close, and the axial stress–time curve exhibits a nonlinear increase. As the axial stress continues to rise, the specimen enters a linear elastic deformation stage and progressively accumulates energy, during which internal microcracks continuously initiate and propagate. When the axial stress reaches the ultimate load that the internal structure of the specimen can sustain, the specimen enters the post-peak failure stage, during which its load-bearing capacity continuously decreases, manifesting macroscopically as instability and fracturing of the specimen.
Figure 6.
Axial stress-time curve of specimen.
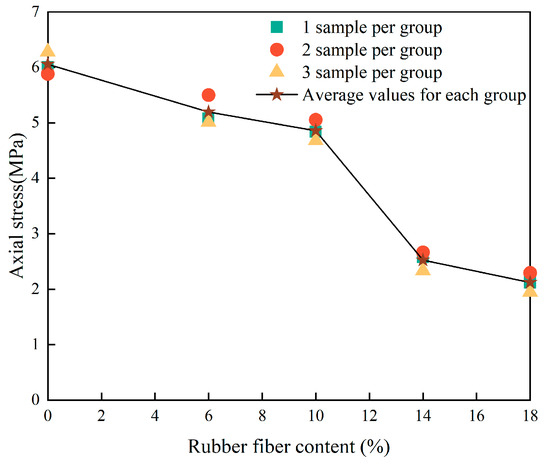
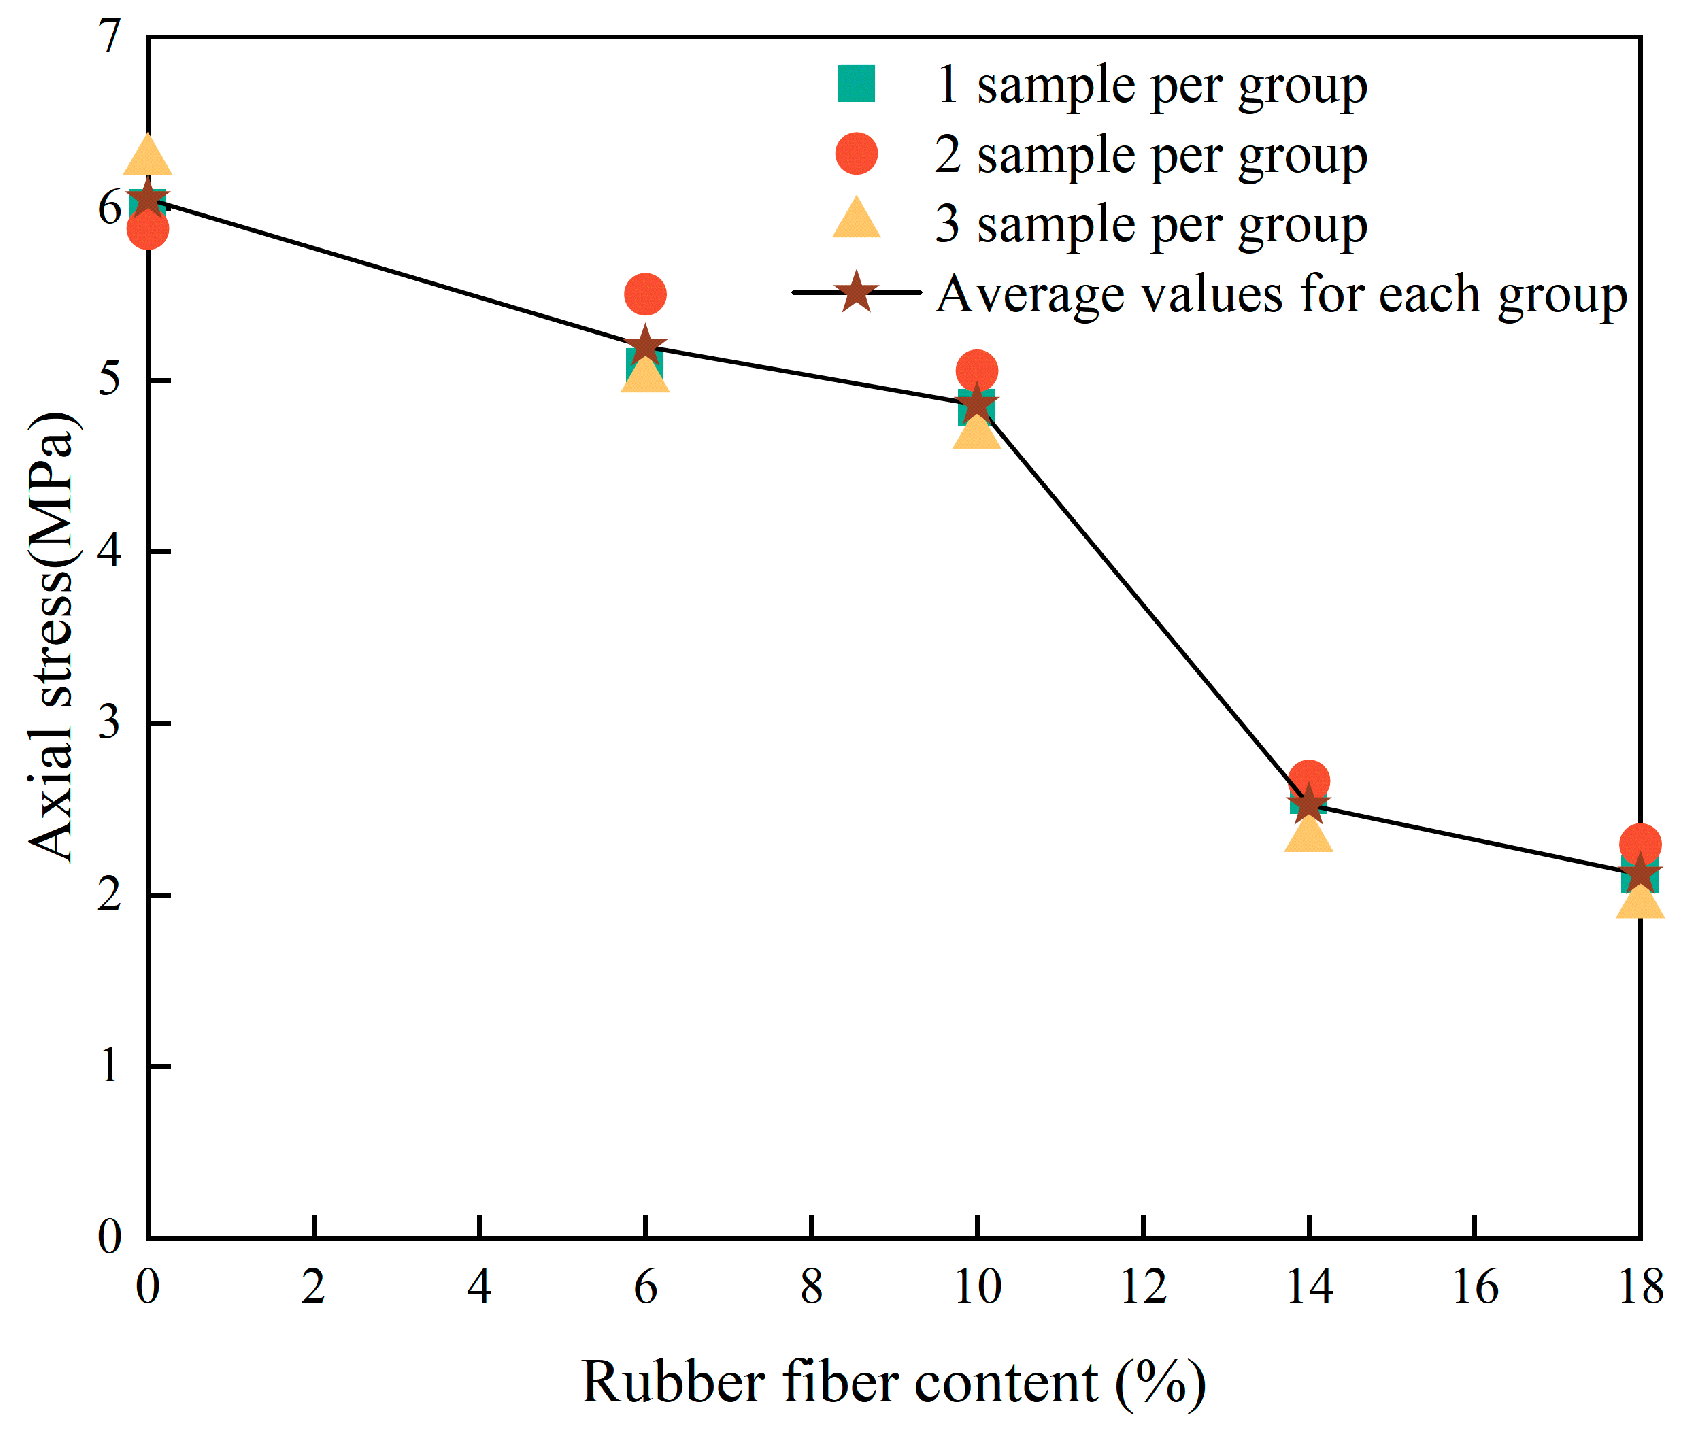
The results of the uniaxial compression tests are presented in Table 7, and the relationship between axial stress and rubber particle content is shown in Figure 7. As can be seen from Table 7 and Figure 7, the average uniaxial compressive strength of the 0% RF specimens is 6.056 MPa. Compared with the 0% RF group, the average uniaxial compressive strengths of the 6% RF, 10% RF, 14% RF, and 18% RF groups decrease by 14.19%, 19.77%, 58.27%, and 64.97%, respectively. Thus, the uniaxial compressive strength of the specimens exhibits a decreasing trend with increasing rubber particle content.
Table 7.
Uniaxial compression test results of specimens.
Figure 7.
Relationship curve between peak load of specimen and rubber fibre content.
The observation that higher rubber particle (RF) contents lead to lower uniaxial compressive strength, with a distinctly nonlinear reduction, is fundamentally governed by the weak interface effect [32]. Owing to the hydrophobic nature of the rubber surface and its extremely poor adhesion to the hydrophilic cementitious matrix [33,34], a porous and loose weak interfacial transition zone (ITZ) is formed around the rubber particles [35,36]. These weak ITZs act as natural stress concentrators and crack initiation sites, severely compromising the integrity and load-bearing capacity of the matrix. At the same time, the incorporation of rubber particles introduces additional pores, further reducing the density.
At a rubber content of 10%, the average compressive strength is 4.858 MPa, representing a 19.77% decrease relative to 0% and remaining far below the 58.27% reduction observed at 14%. At low dosages (6% and 10% RF), the particles behave as isolated defects dispersed within a relatively strong continuous matrix, leading to a gradual decline in strength. Once the dosage exceeds a critical threshold, however, the soft rubber phase becomes interconnected, forming a continuous weak network that dominates the failure path; cracks then propagate rapidly along this network, causing a dramatic loss of load-bearing capacity.
These results clearly indicate that rubber particles do not act as a reinforcing phase; instead, their primary role is to substantially enhance the deformation capacity, impact resistance, and crack resistance of the composite [37,38]. They also highlight the existence of a crucial critical dosage, which provides a clear design boundary for engineering applications, where an optimal balance between strength and toughness must be sought. Consequently, such materials are not suitable for primary load-bearing structural elements, but their excellent energy-dissipation characteristics make them highly attractive for non-structural applications that demand high toughness, such as mine backfill, subgrade grouting, and seismic buffer layers. Furthermore, the interfacial properties are shown to be critical for composite performance, suggesting that future optimisation efforts may focus on surface treatments to improve the bonding between rubber particles and the cementitious matrix.
4.2. Deformation and Failure Characteristics of Specimens
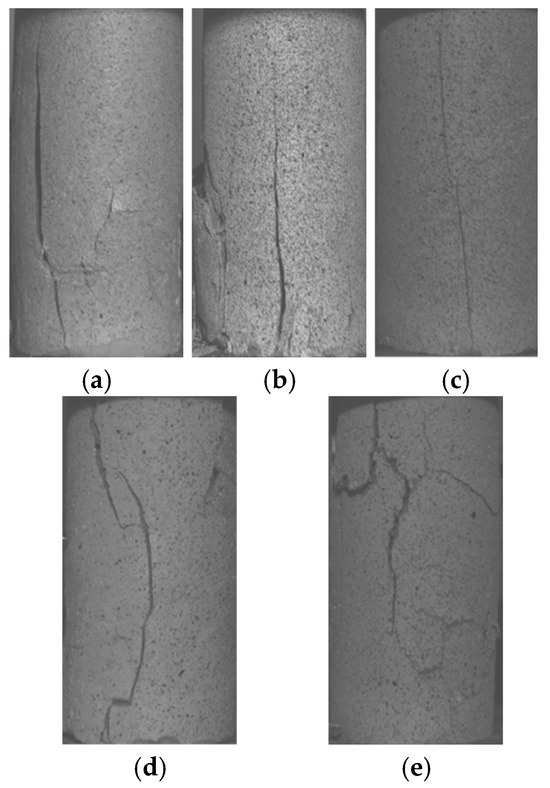
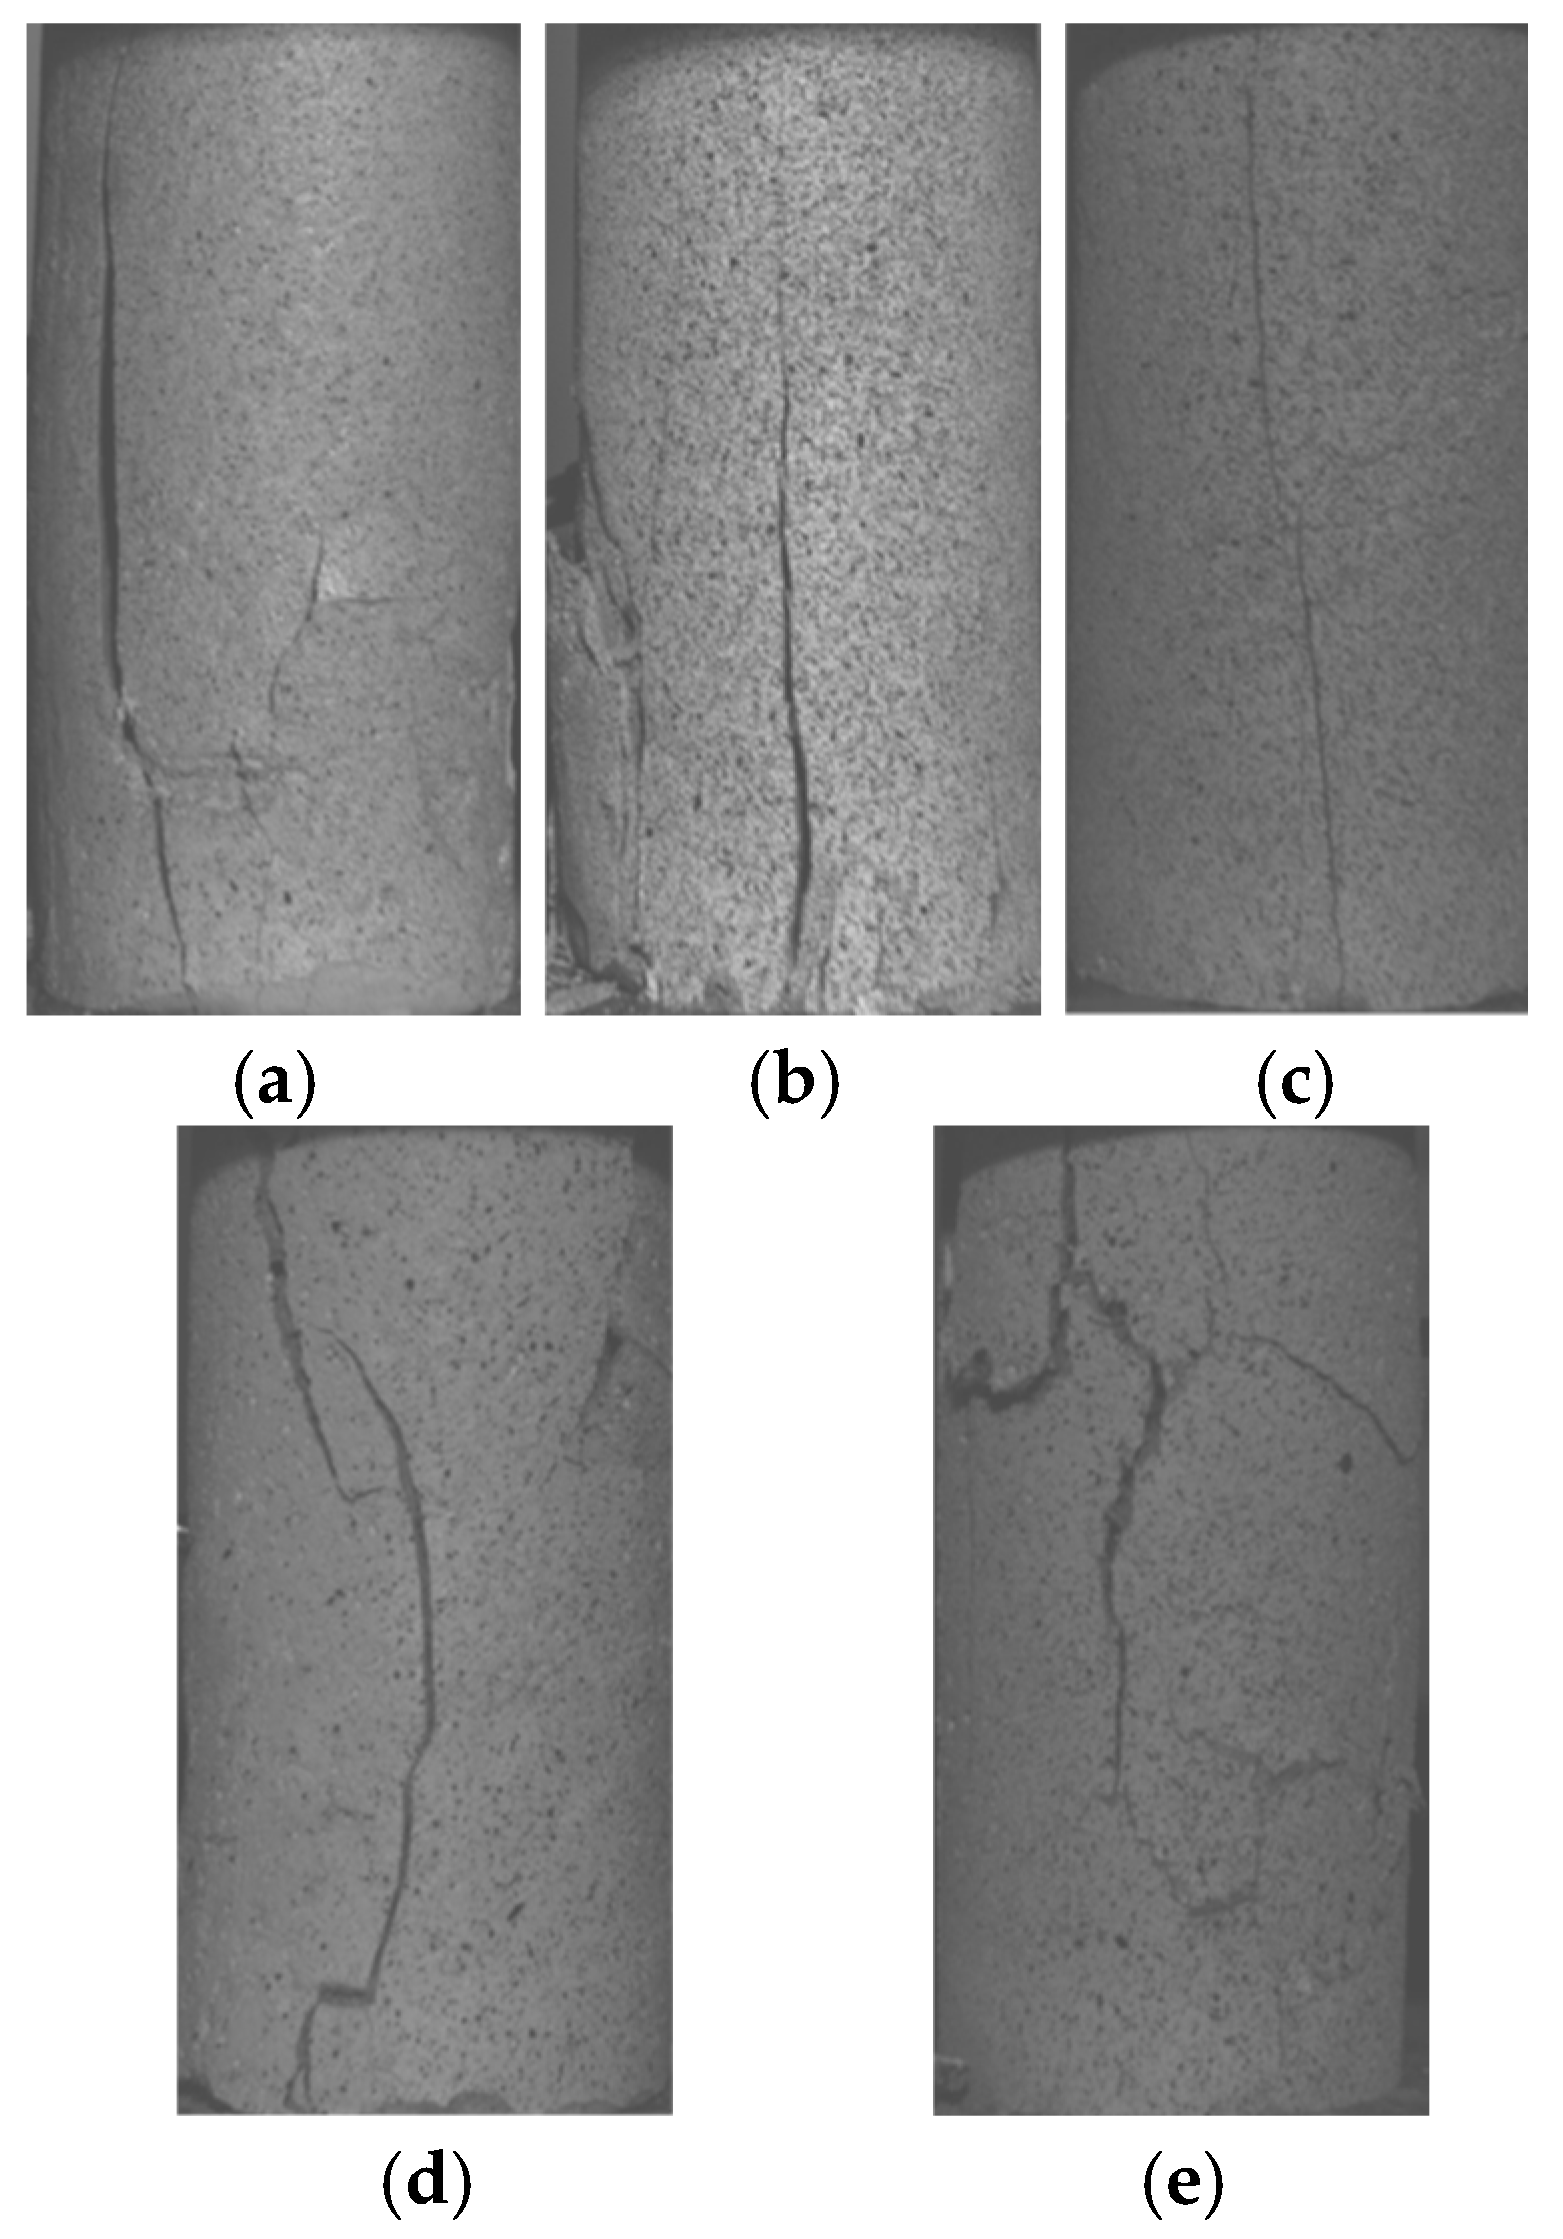
The failure process of the grouted specimens is essentially a progressive evolution of internal micro-defects under external loading, whereby these defects initiate and grow, ultimately coalescing into macroscopic through-going fracture surfaces that lead to the loss of overall mechanical performance. This process does not occur abruptly, but proceeds through a gradual sequence of stress accumulation, defect initiation, crack propagation, and macroscopic instability. The resulting failure modes effectively reflect the loading history experienced by the specimens; therefore, an in-depth analysis of the failure patterns of the grouted specimens is of considerable significance. In this study, specimens 0%—1, 6%—3, 10%—3, 14%—2, and 18%—2 were selected to examine in detail the progressive failure characteristics of the grouted bodies. The final failure patterns of these specimens under uniaxial compression are shown in Figure 8.
Figure 8.
The final failure diagram of uniaxial compression test of grouting stone body. (a) 0%—1 sample; (b) 6%—3 sample; (c) 10%—3 sample; (d) 14%—2 sample; (e) 18%—2 sample.
As shown in Figure 8, the surfaces of the 0–10% groups are dominated by tensile cracks, with failure primarily governed by shear and exhibiting typical brittle fracture characteristics. In the late loading stage, a main crack forms that is approximately perpendicular to the loading direction; this crack is relatively wide and has a smooth surface. The main crack cuts through the entire specimen, accompanied by limited spalling, and the resulting fragments have sharp edges with no obvious plastic deformation. The spalled blocks around the crack are relatively large and the crack width is considerable, indicating a more instantaneous failure. Because the rubber particle content is low, stress concentrations at internal defects are difficult to relieve, leading to rapid instability once the strength limit is reached.
In the 14–18% groups, the specimens exhibit combined tensile–shear failure, with a relatively milder failure process and more regular crack patterns, and somewhat reduced spalling. The rubber particles provide a bridging and crack-arresting effect; under load, they can share part of the stress and suppress rapid crack propagation, allowing the failure process to develop in stages. However, because the dosage is insufficient to alter the splitting-dominated failure mechanism, pronounced cracking remains evident. With increasing rubber content, the failure mode of the grouted specimens transitions from shear failure to mixed tensile–shear failure, and the severity of explosive spalling-type damage tends to increase. Under uniaxial compression, internal microcracks initiate, grow, and coalesce, ultimately leading to macroscopic splitting failure. The incorporation of rubber particles influences the intensity of this failure: the bonding between the particles and the matrix, together with the deformability of the particles themselves, allows part of the strain energy to be dissipated during crack propagation, delaying the failure process and rendering it less abrupt. Nevertheless, the presence of rubber does not change the fundamental mechanism in which tensile stresses dominate compressive failure, and the overall failure mode remains splitting. If pores or non-uniform cementation exist within the grouted body, they act as stress concentrators and accelerate crack initiation. The similarity of failure patterns observed across specimens suggests that the preparation quality was relatively uniform and that the main differences are governed by the rubber content. Overall, the failure mode is determined by the inherent brittle compressive behaviour of the grouted bodies, whereas the severity of failure is jointly controlled by the crack-arresting and energy-dissipation effects of the rubber particles [39] and the intrinsic brittleness of the material; by modifying the stress-release process, the particles adjust the violence of failure.
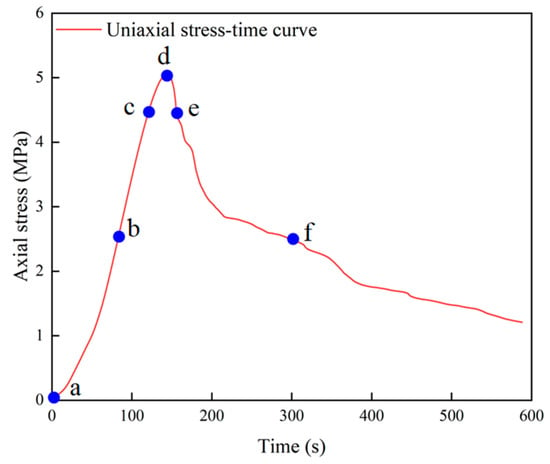
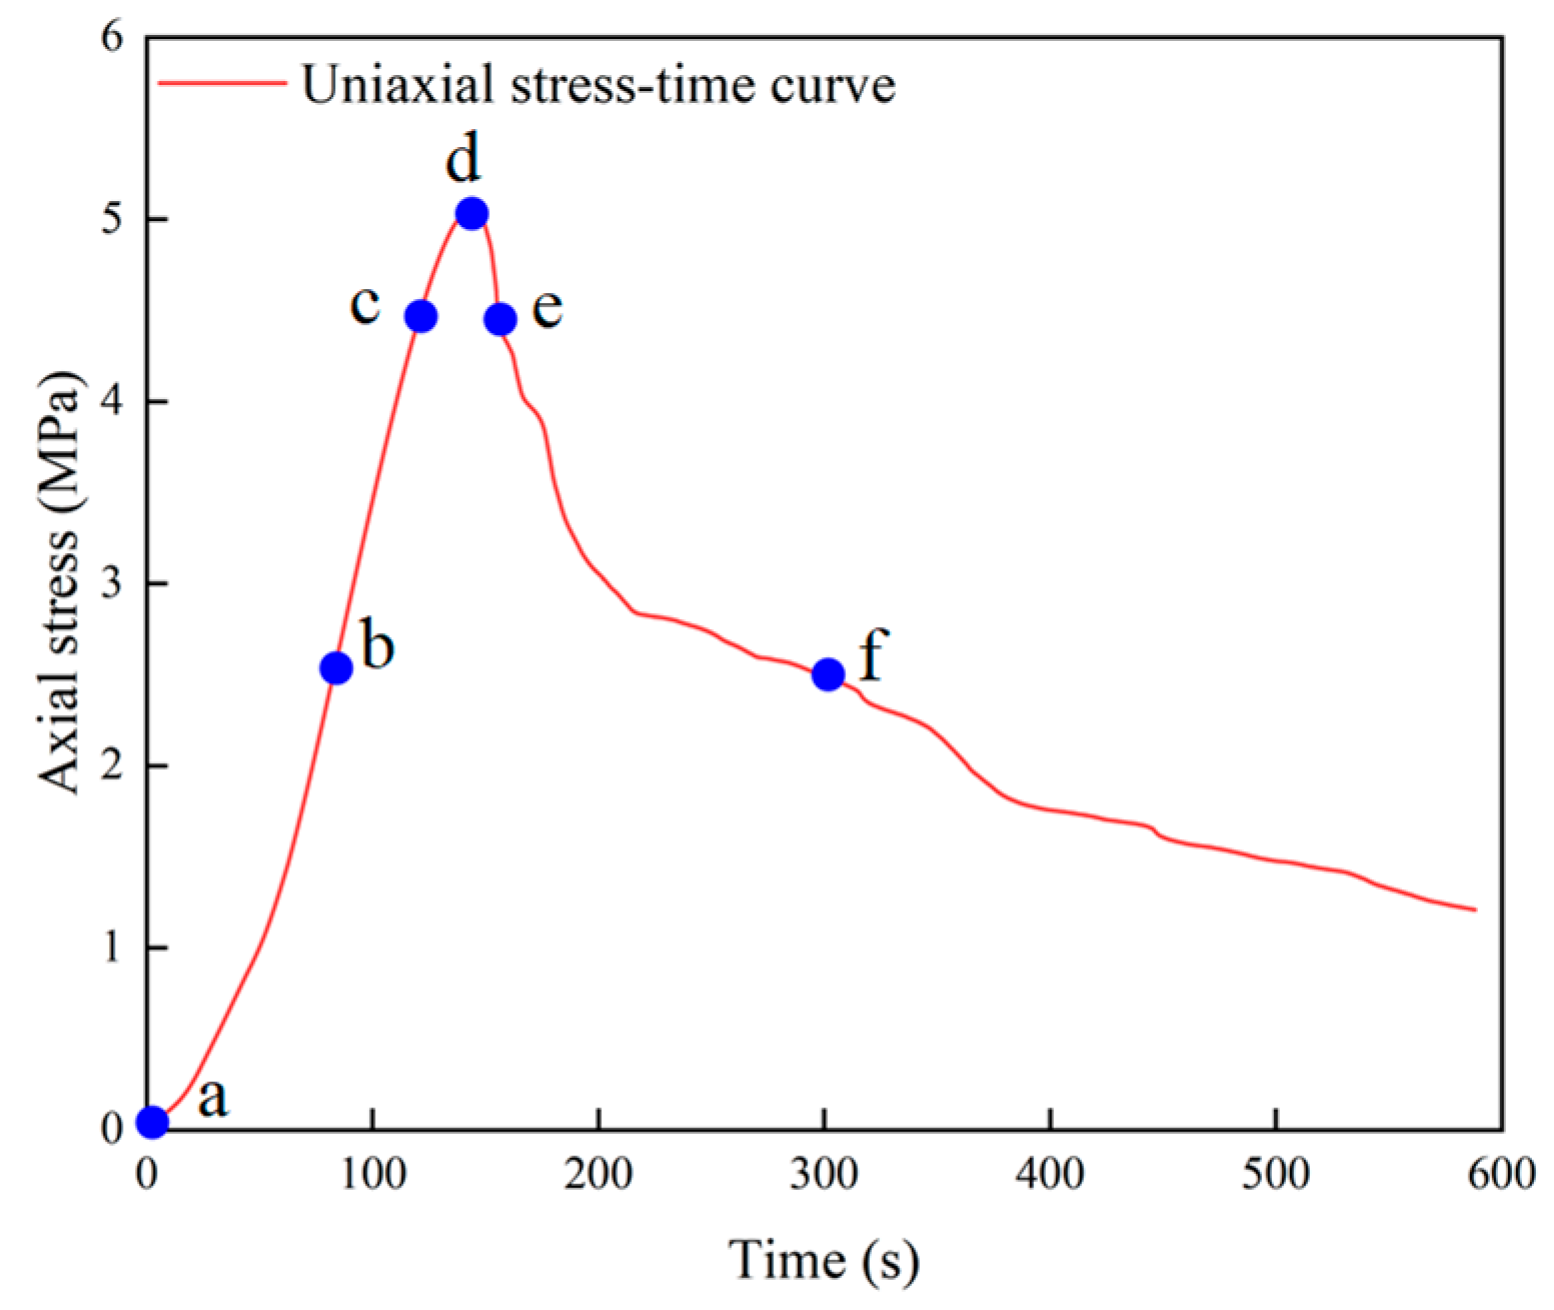
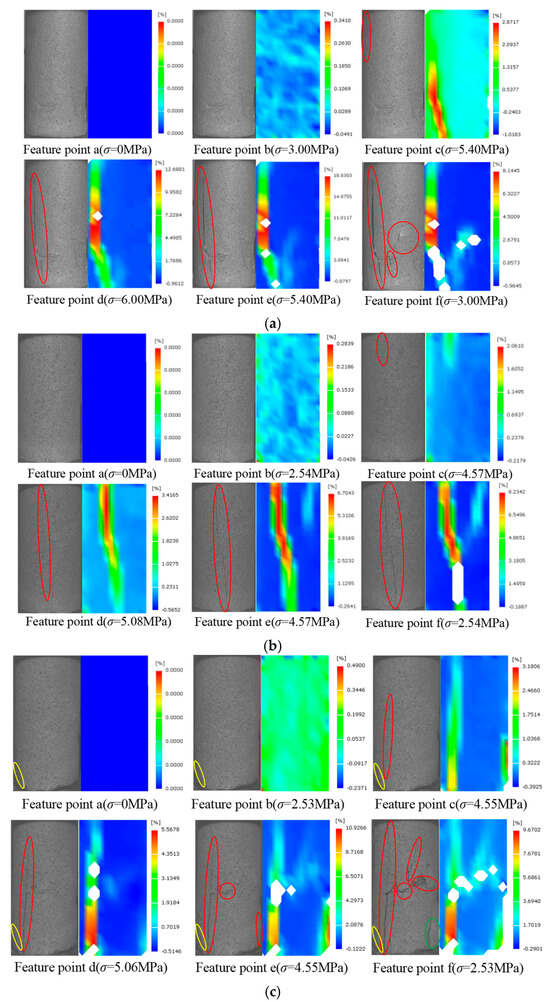
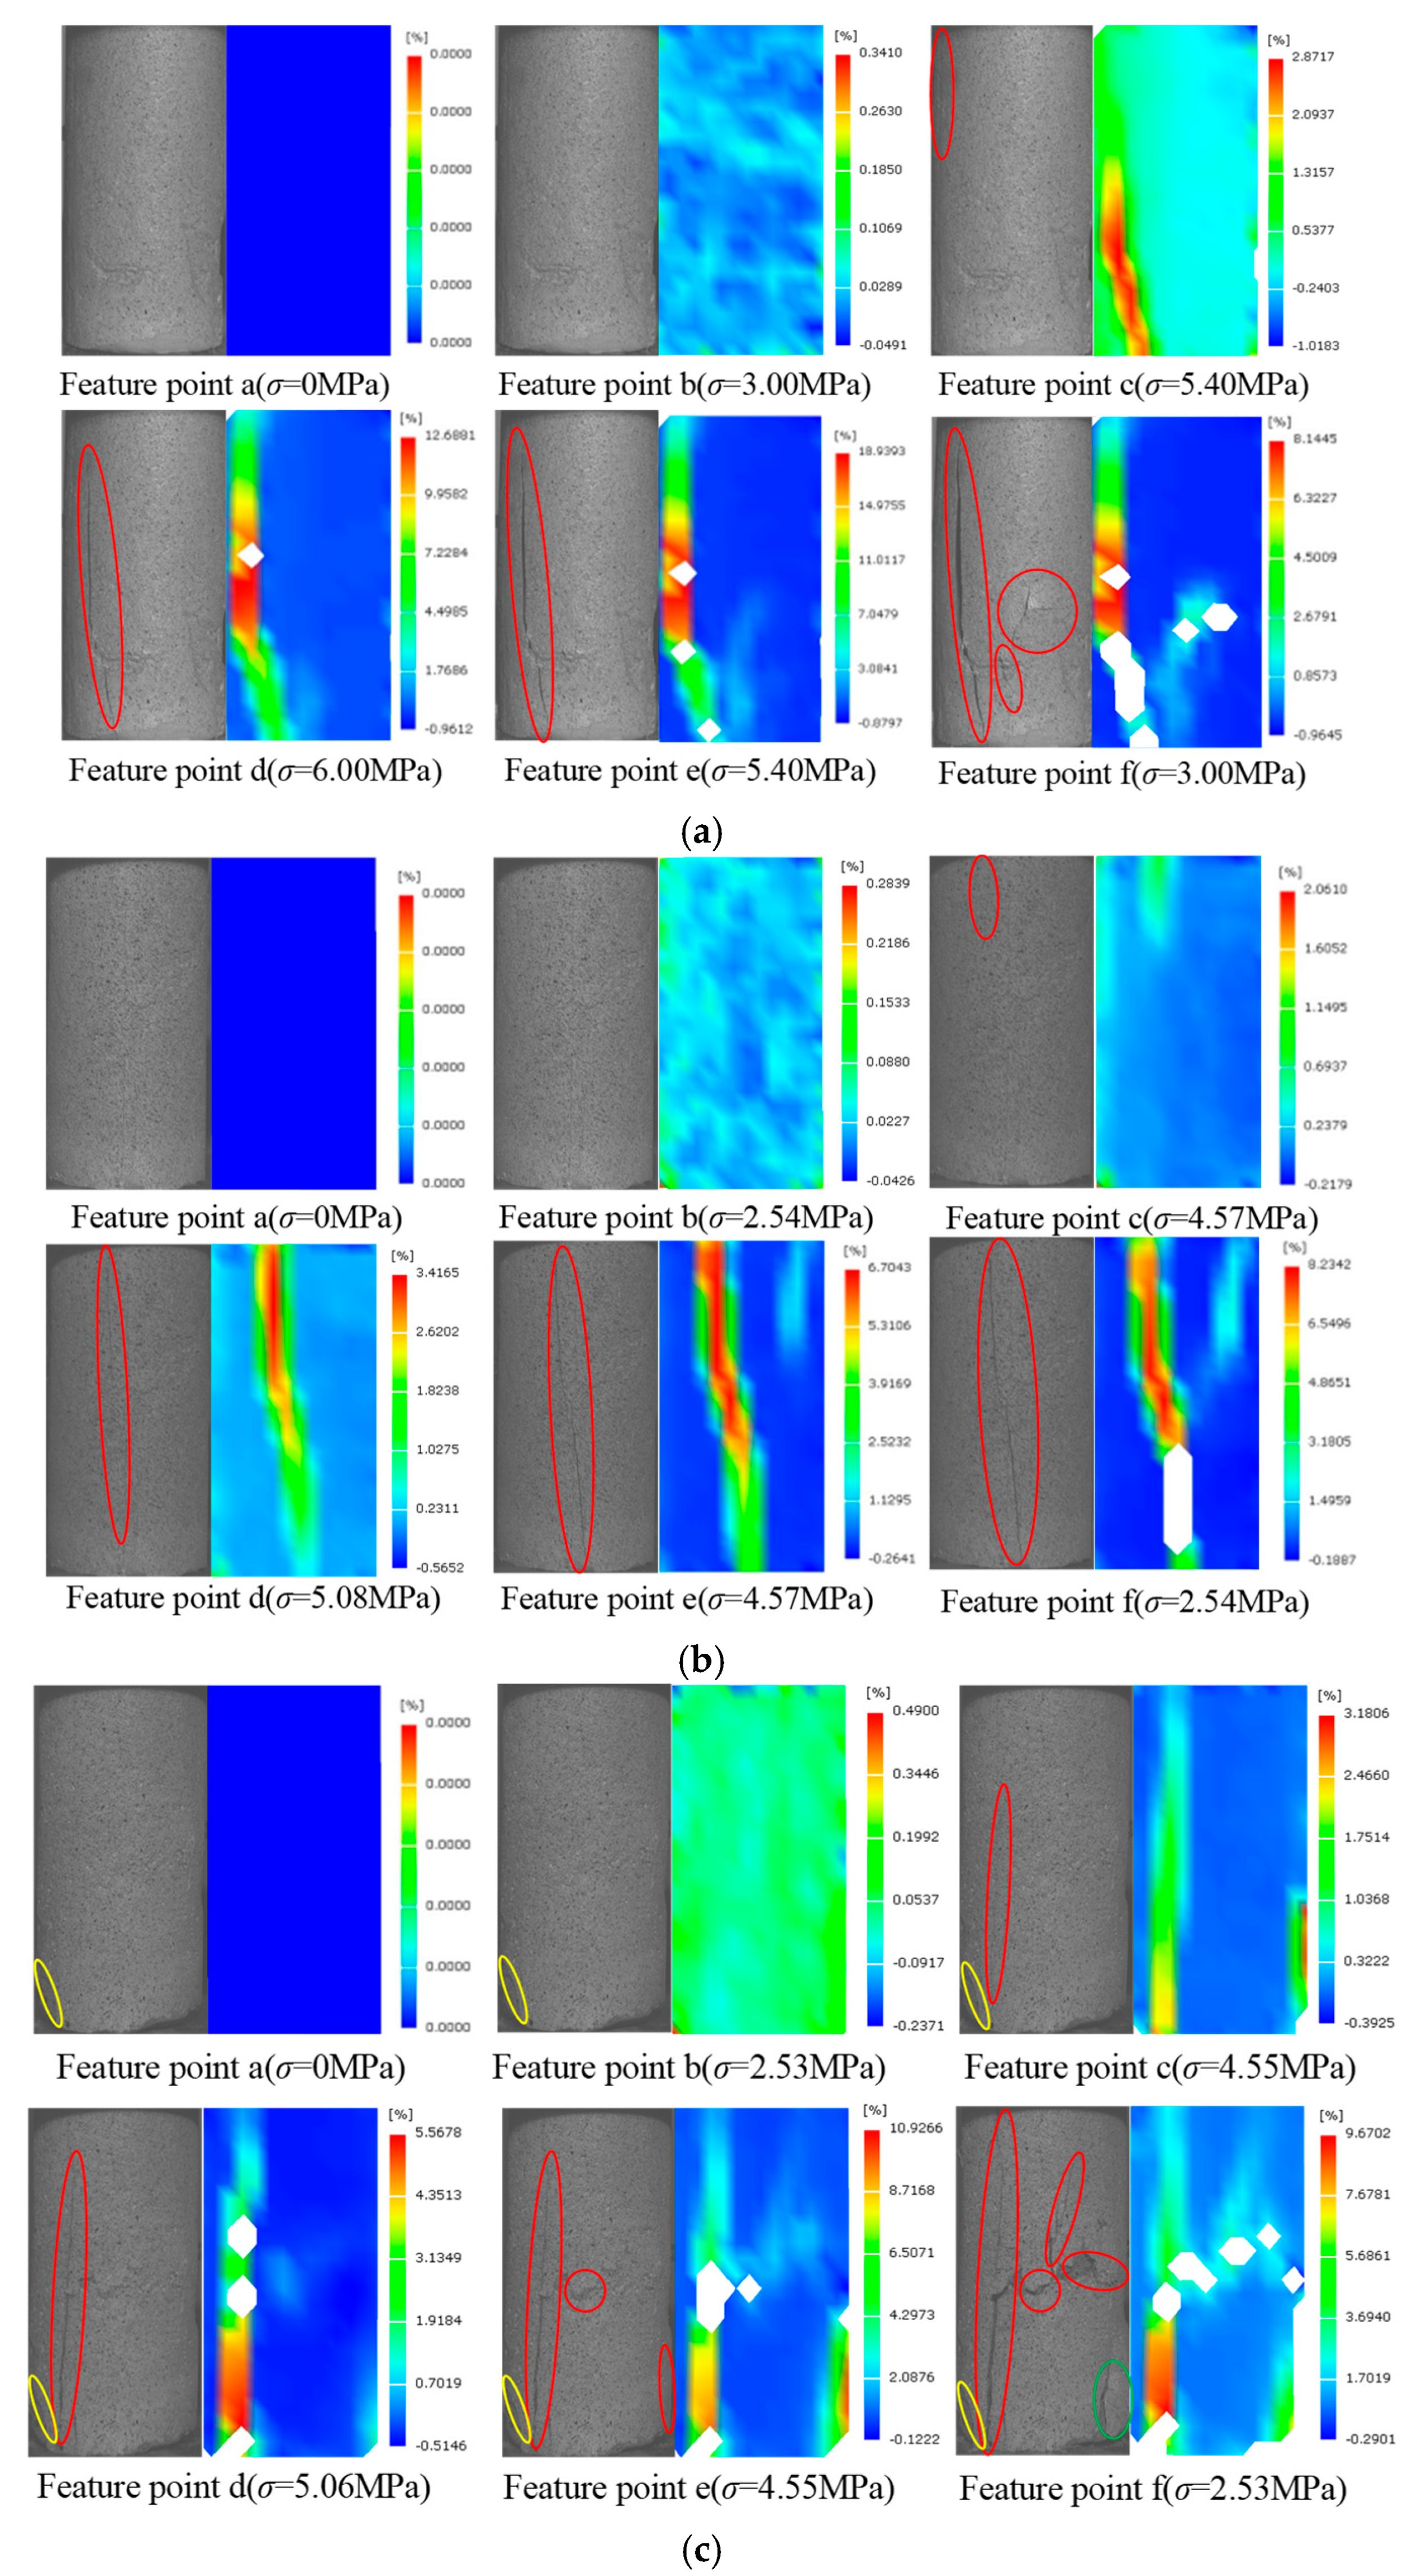
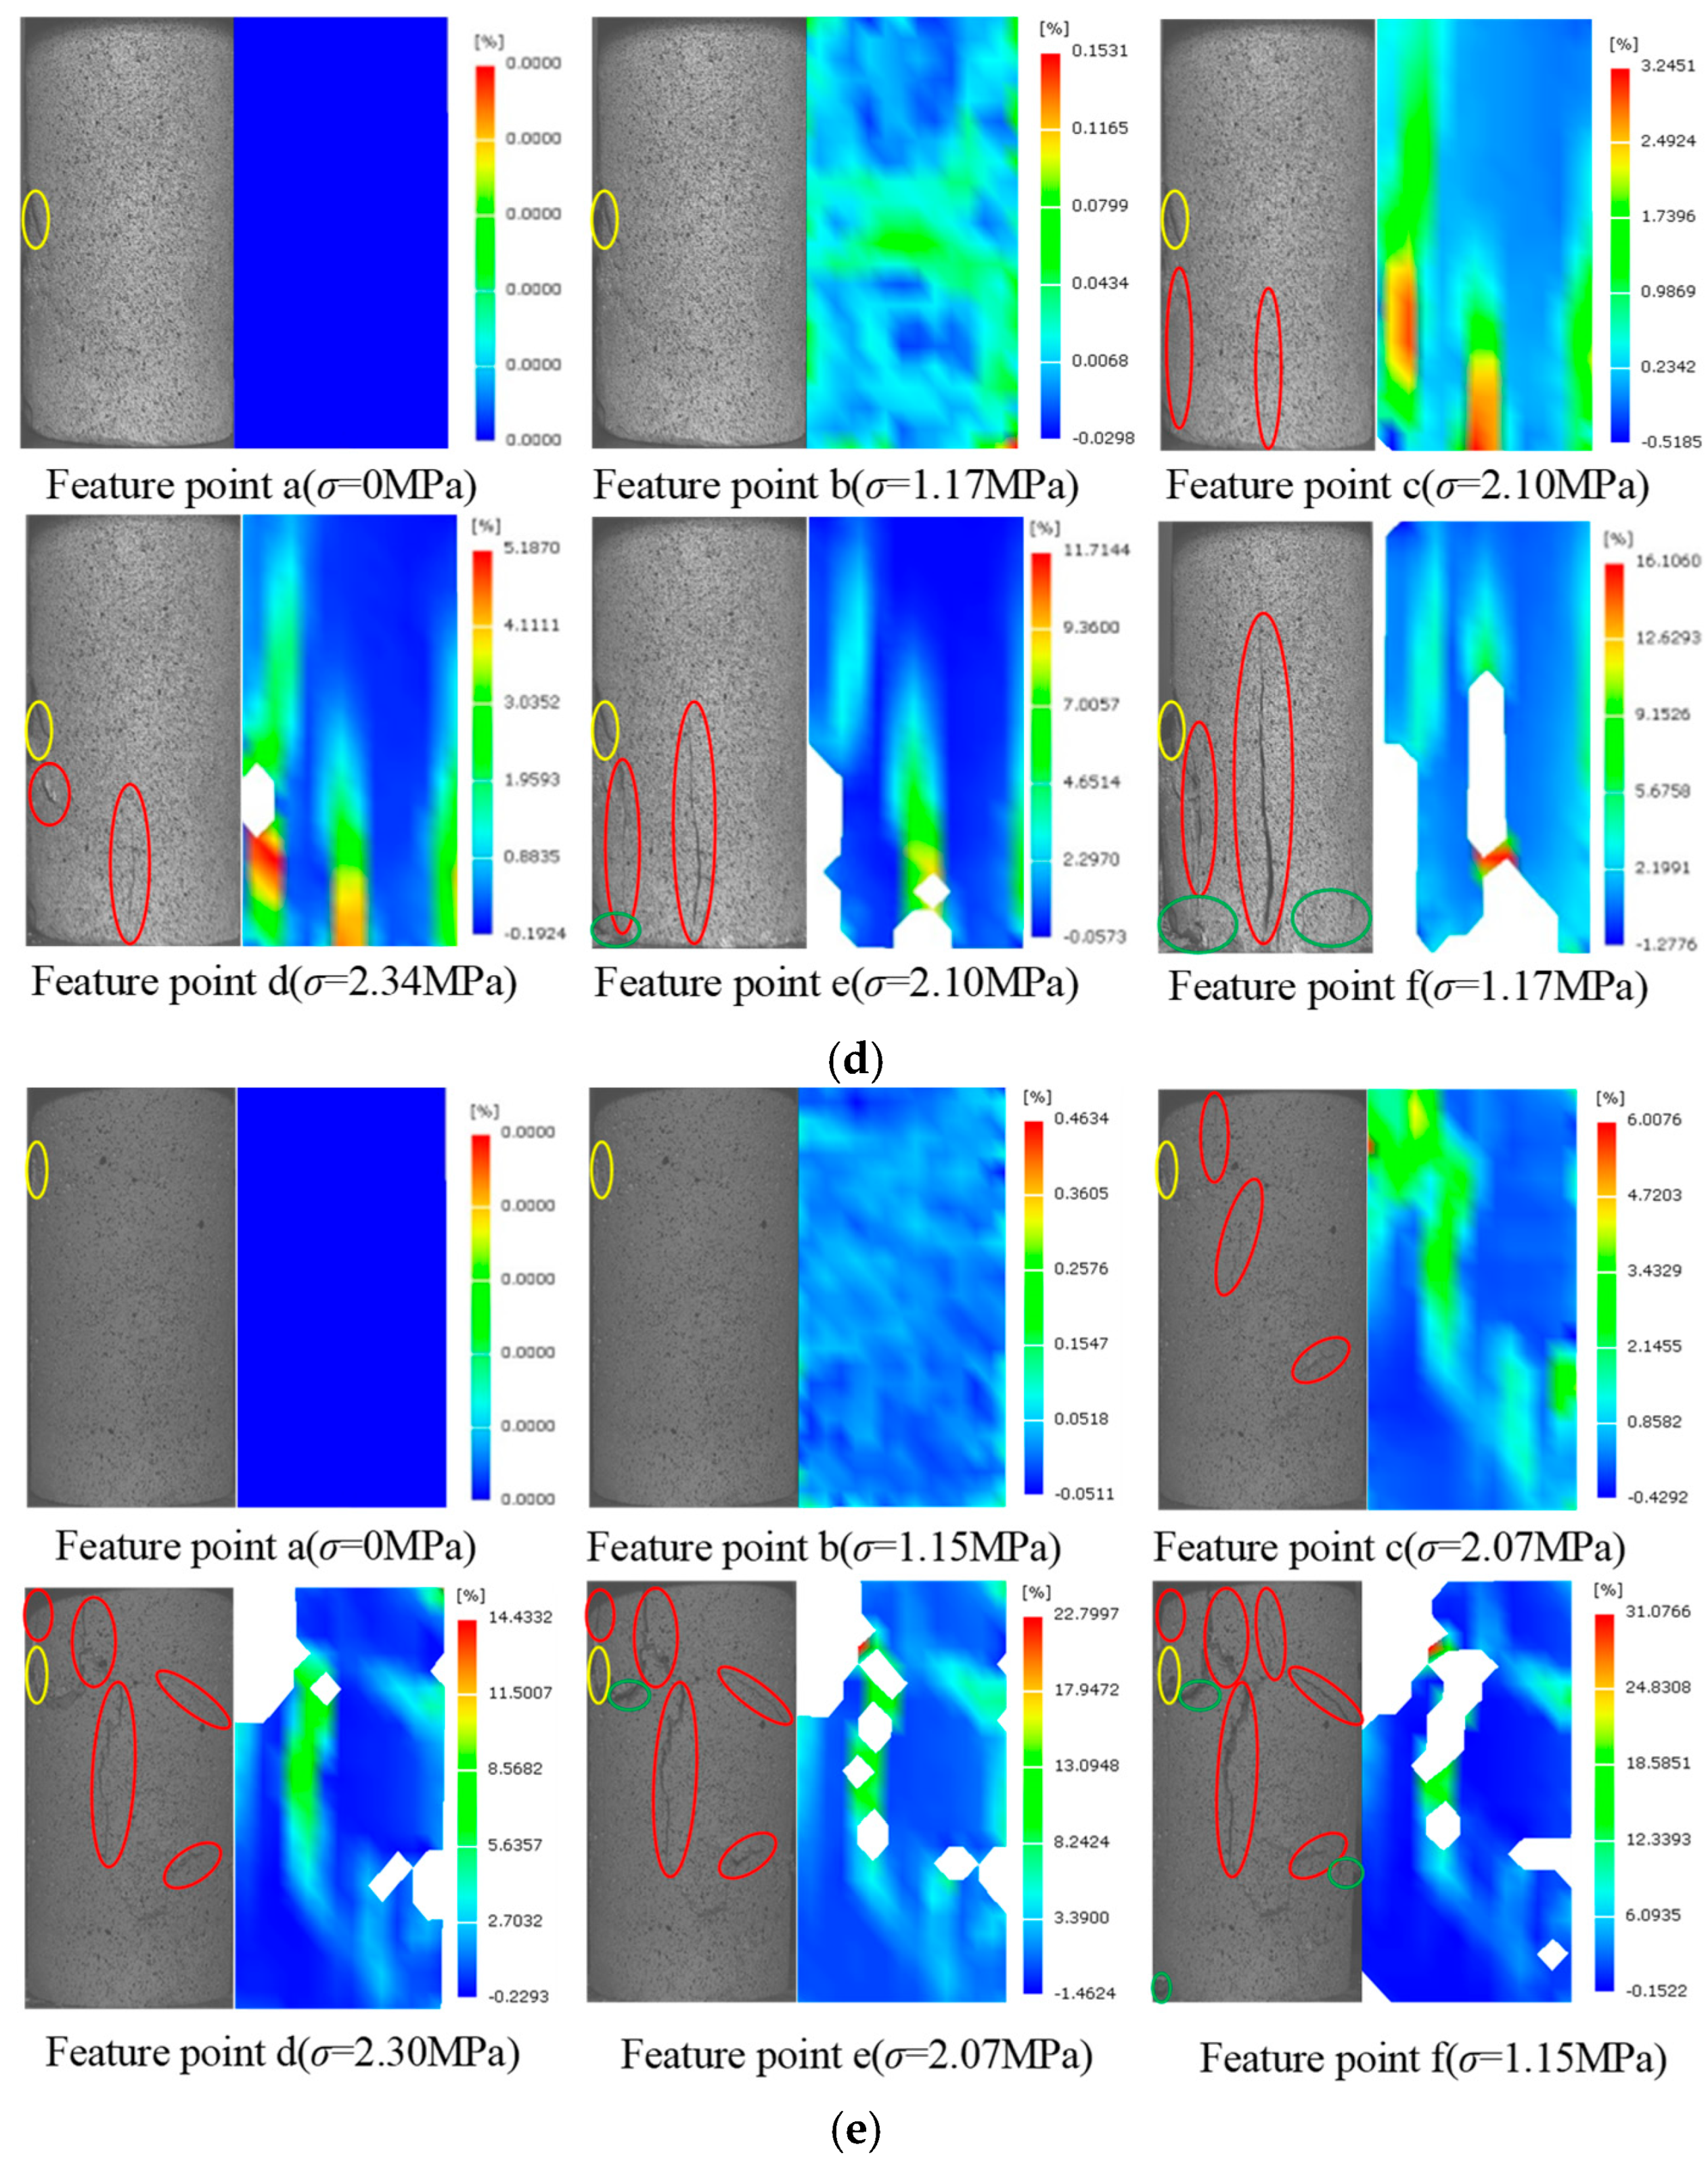
In the uniaxial compression tests on the grouted specimens, one specimen from each group was selected to analyse the evolution of the deformation field. For each selected specimen, six characteristic points were defined along the loading history to display the strain contour maps; these were used to record and analyse the deformation and crack propagation processes, as shown in Figure 9. Characteristic point a corresponds to the initial state, while points b, c, d, e, and f correspond to stress levels of 0%, 50% and 90% of the peak stress before the peak, the peak point itself, and 90% and 50% of the peak stress in the post-peak stage, respectively. Taking the speckle image of the specimen surface at the beginning of loading as the reference, the speckle images acquired during loading were processed using the digital image correlation (DIC) method to obtain the evolution of the surface strain field of the specimens under uniaxial loading, as shown in Figure 10. Among these, characteristic point a is the reference image point selected in the DIC analysis, characteristic points b–f are the corresponding points in the deformed images, and σ denotes the stress associated with each characteristic point.
Figure 9.
10%—2 Selection of stress-time characteristic points for stone specimens.
Figure 10.
Evolution characteristics of the maximum principal strain field of the stone specimen under uniaxial loading. (a) 0%—1 sample; (b) 6%—1 sample; (c) 10%—2 sample; (d) 14%—3 sample; (e) 18%—2 sample.
As shown in the figure, characteristic point a corresponds to the initial state of the specimen. During the compaction stage (characteristic point b), the grouted specimen is at the early stage of loading under compression; pre-existing microcracks within the specimen are gradually compacted and closed, and relatively large strains are observed in the vicinity of these microcracks. At this stage, the strain field is approximately uniform, with only small overall deformation. When the specimen enters the elastic deformation stage (characteristic point c), localised strain regions begin to appear in the strain field. Newly generated cracks gradually develop, and differential deformation arises at various points on the specimen surface, with the contrast between high- and low-strain zones becoming evident. For 0% rubber content, the strain concentration bands expand markedly, mostly around matrix defects, with large strain gradients that herald the imminent formation of a main crack. At 6–14% rubber content, the number of strain concentration zones increases, but they are more dispersed, and the high-strain regions appear diffuse without a clear tendency for a dominant main crack. At 18% rubber content, the number of strain concentration zones exceeds that at 14%, and local particle agglomeration gives rise to larger concentrated regions.
At characteristic point d, the internal cracks enter the propagation stage. For 0% rubber content, the strain concentration band penetrates the specimen to form a main crack; the high-strain zone associated with this crack expands dramatically, the specimen is on the verge of failure, and the strain reaches its peak value with an extremely non-uniform distribution. With increasing rubber content, no through-going main crack develops; instead, the high-strain regions are scattered at multiple locations, the peak strain values are lower than those at 0% content, and the specimen as a whole remains largely intact. In the 0% group, the matrix loses its load-bearing capacity at peak stress, the main crack rapidly extends, and the strain concentration fully penetrates the specimen. In contrast, in the rubber-containing specimens, the particles are stretched at peak stress and absorb part of the strain energy through an energy-dissipation effect, thereby preventing crack coalescence and dispersing the strain. At characteristic point e, the internal cracks enter a stable propagation stage. For 0% rubber content, the absence of any toughening phase beyond the peak leads to instantaneous crack extension, sharply concentrated strain, complete penetration of the main crack, and expansion of the high-strain region along the entire crack path, causing a rapid loss of structural integrity. With increasing rubber content, the high-strain zones expand more gradually; the particles continuously provide a bridging effect, newly formed microcracks are bridged, and the strain distribution remains relatively dispersed, with strain growth proceeding slowly. At 18% content, however, the excessive dosage weakens the toughening effect; after the peak, structural integrity is more severely compromised, and interfacial failure at particle-agglomeration zones causes locally accelerated strain development. At characteristic point f, the specimens enter the residual load-bearing stage. In the 0% group, the absence of rubber toughening means that the structure completely loses integrity after the peak and the specimen is fully fractured with no residual capacity. For 6–14% rubber content, the particles can still dissipate energy in the residual stage through plastic deformation and interfacial friction, maintaining a stable multi-crack state; the specimens develop multiple dispersed microcracks, with high-strain regions distributed along these cracks, and retain a certain degree of overall integrity. At 18% rubber content, some relatively wide cracks appear locally, and the residual load-bearing capacity decreases, but the specimen does not completely disintegrate.
The observed evolution of the strain field in the grouted specimens indicates that, as the rubber content increases, the regions of strain concentration under axial loading shift from an approximately uniform distribution to localisation near internal defects, where weak zones are prone to form and to be accompanied by the initiation and growth of internal microcracks. When the strain in these zones exhibits a marked upward trend, it signifies that the microcracks within the grouted body are rapidly evolving into macroscopic cracks.
4.3. Acoustic Emission Evolution Rule of Stone Sample
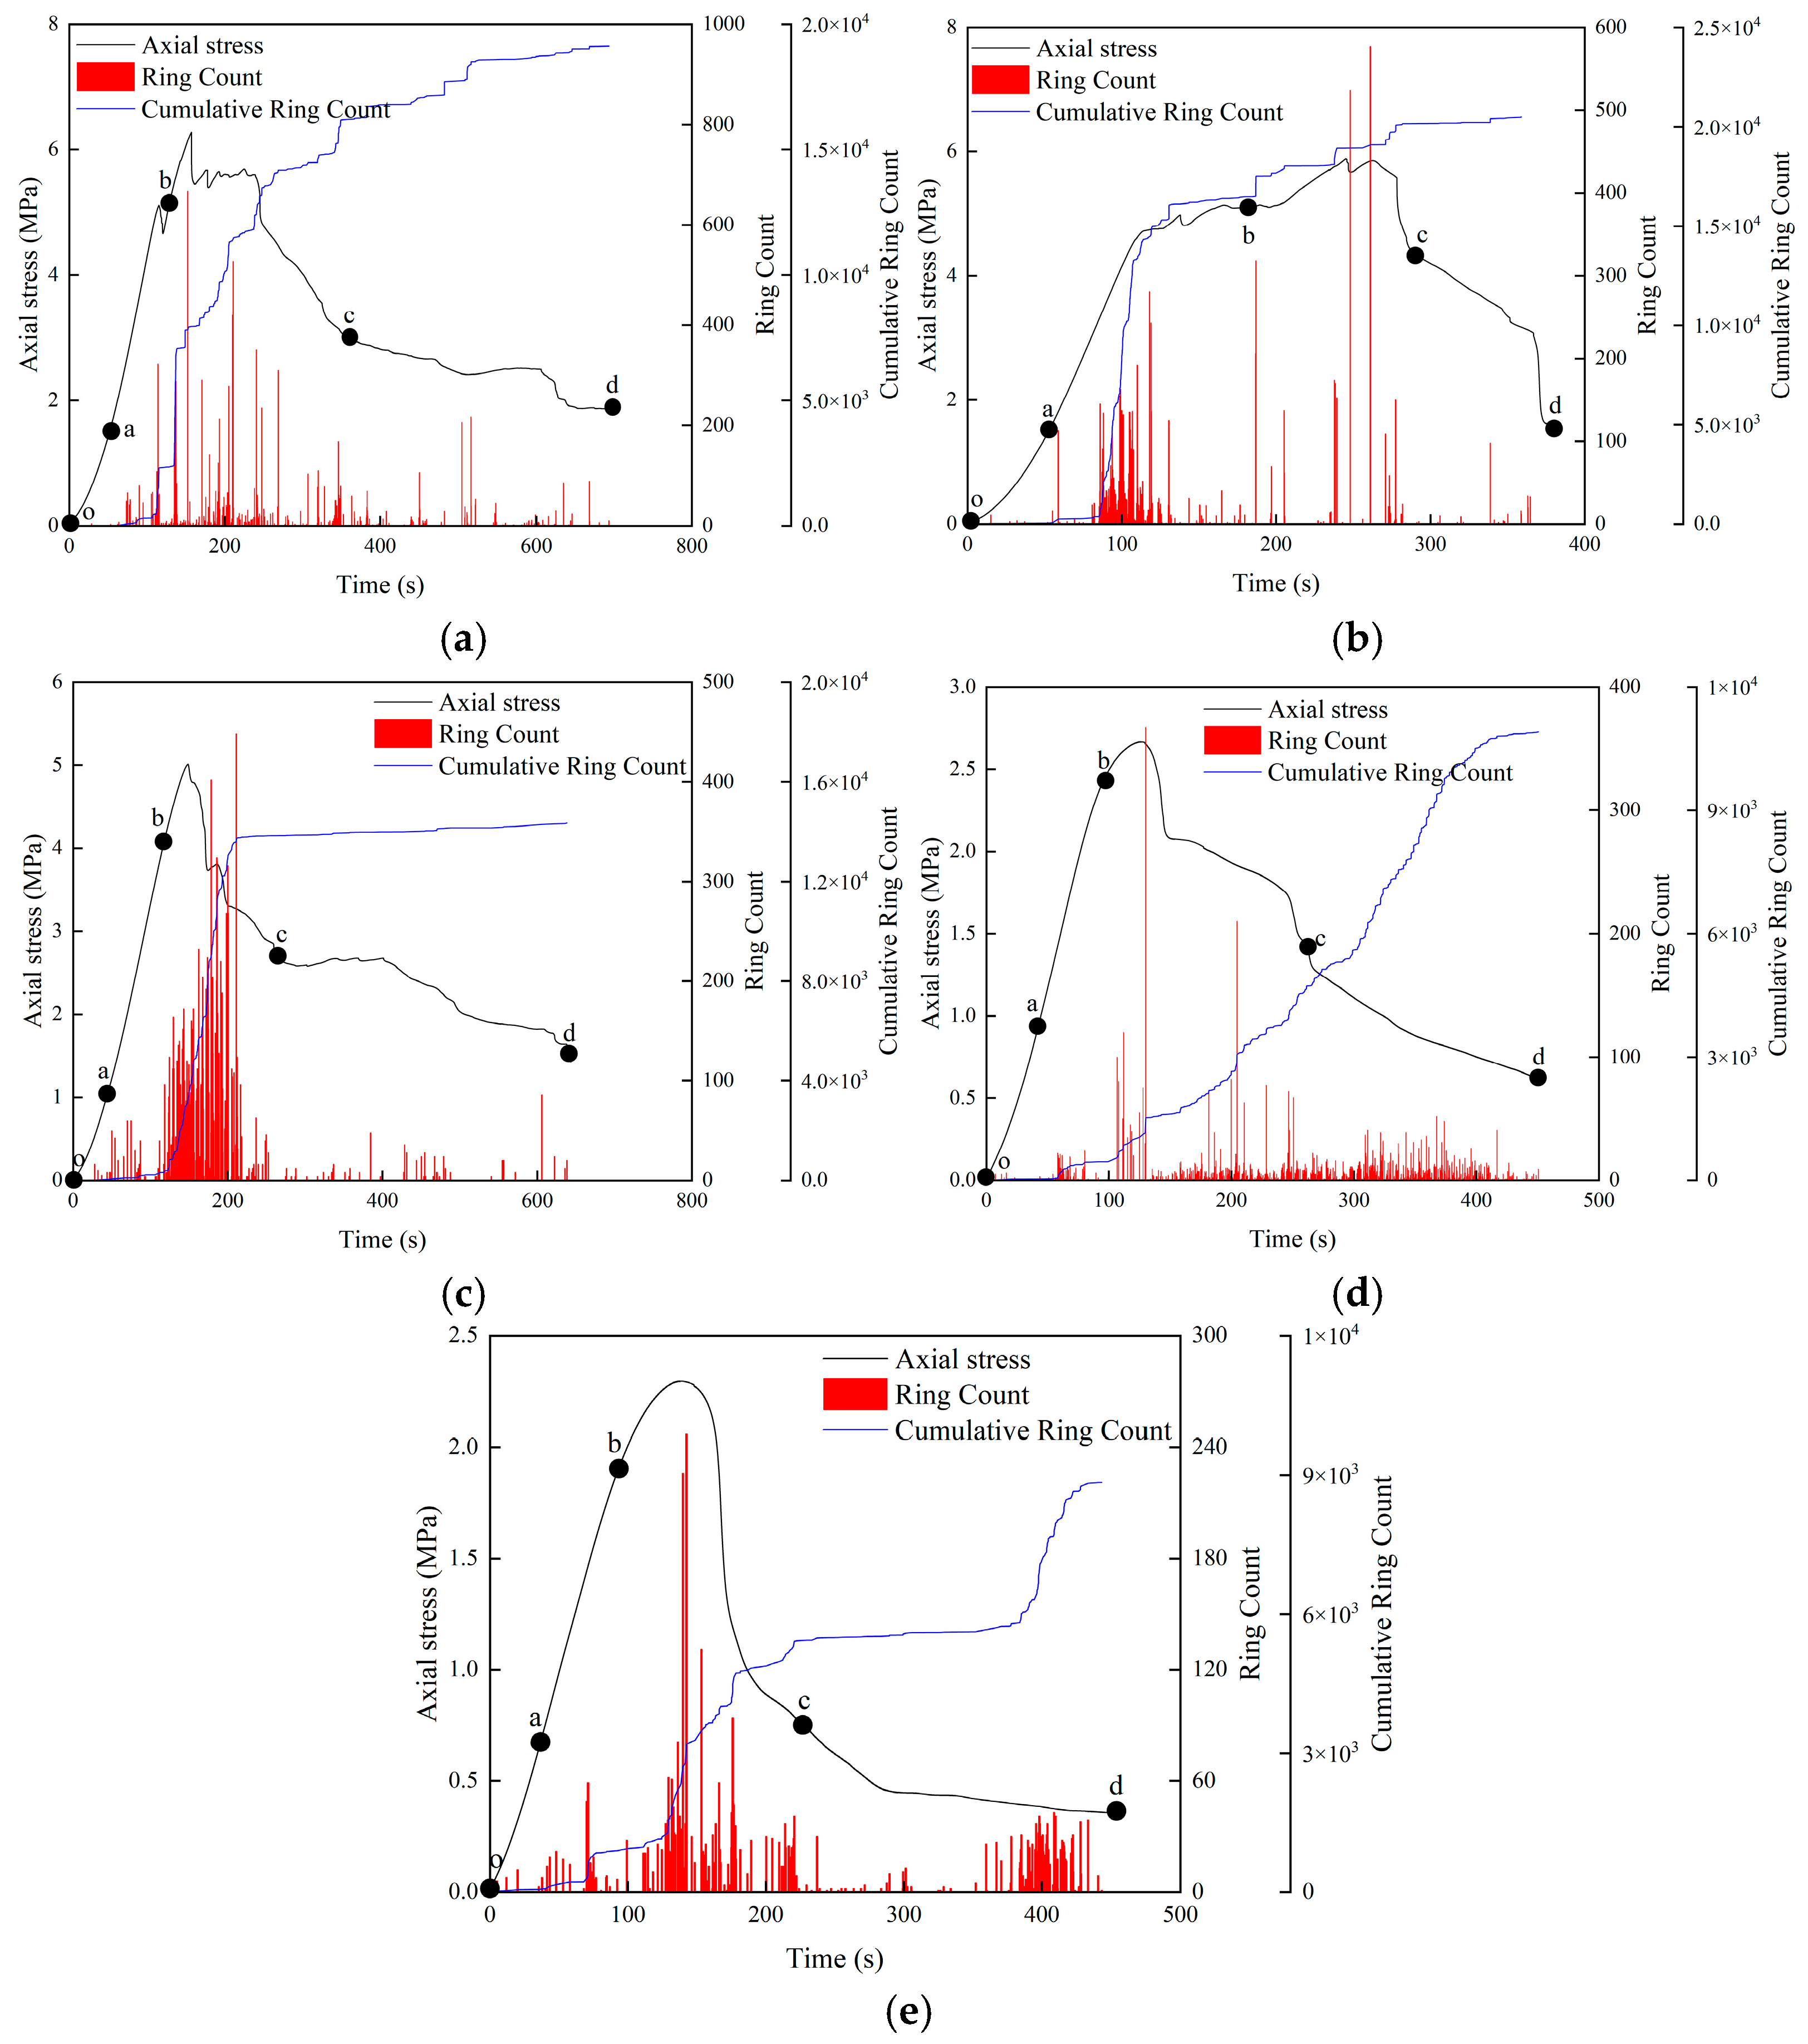
During the damage and failure process of the grouted specimens under load, the acoustic emission (AE) signals can capture in real time the dynamic evolution of internal damage. The AE ringing count is a key parameter in AE testing and reflects the activity level of AE events per unit time; it can be understood as the “number of signal pulses.” The cumulative ringing count refers to the total number of ringing counts from the beginning of the test to a given moment, representing the overall activity of AE signals throughout loading, i.e., the accumulated degree of damage evolution.
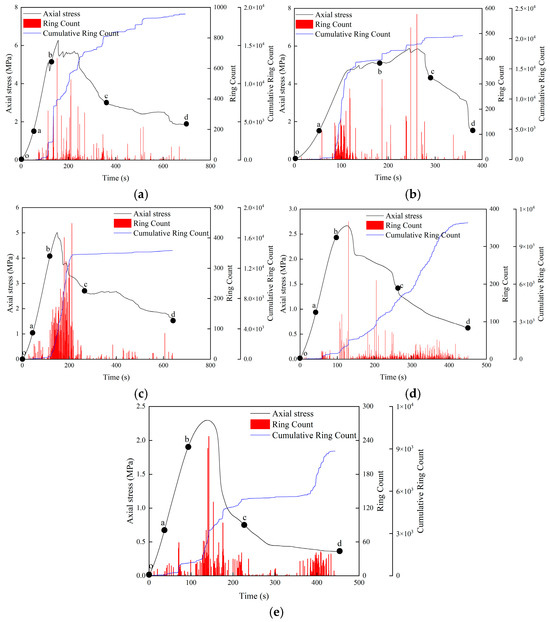
Figure 11 shows the evolution curves of axial stress, ringing count, and cumulative ringing count for the grouted specimens. As can be seen from Figure 11, with increasing axial stress, the AE ringing count exhibits distinct stage-wise variations. Based on the number and fluctuation frequency of the AE counts, the progressive failure process of the grouted specimens under uniaxial compression can be divided into four stages: a quiet stage (point o–point a), a fluctuating rising stage (point a–point b), a growth stage (point b–point c), and a residual stage (point c–point d). At the same time, the evolution of AE signal characteristics during loading shows good consistency with the load–time curves.
Figure 11.
Evolution curve of axial stress-ringing count-cumulative ringing count of stone specimen. (a) 0%—3; (b) 6%—2; (c) 10%—3; (d) 14%—2; (e) 18%—2. Note: A %—B represents the experimental group of A % rubber content; b represents the pattern of the experimental group.
- (1)
- Quiet stage (point o–point a). In this stage, the grouted specimen is in the compaction phase. The original micro-pores and microcracks within the specimen are gradually compressed and closed. The number of AE ringing counts is relatively small, with only a few AE events; the ringing counts are low and increase slowly, and the fluctuation frequency is also low. This is because the process is dominated by physical compression of pre-existing internal defects [40], without the generation of new cracks and with only limited energy release. All five mix groups exhibit low ringing counts with minimal differences between them, indicating that the rubber content has little influence on internal structural changes at this stage.
- (2)
- Fluctuating rising stage (point a–point b). The specimen enters the elastic deformation stage and undergoes elastic strain, with essentially no development of initial cracks. In this stage, the AE signals display a certain level of activity. Due to the presence of small joints or flaws within the specimen, elastic deformation induces slight stress redistribution and localised micro-energy release, leading to modest fluctuations in the ringing counts. The fluctuation frequency remains relatively stable and does not yet show a sustained growth trend. As the rubber content increases, the peak ringing counts in this stage are slightly lower, because the elastic buffering effect of the rubber particles reduces stress concentrations in the matrix and diminishes the energy released by minor crack sliding events.
- (3)
- Growth stage (point b–point c). The specimen is now in the crack development stage. As the applied stress increases beyond the elastic limit of the specimen, pre-existing cracks begin to extend and new microcracks are generated. Stress concentration at crack tips causes crystal bond breakage and releases a large amount of energy, manifested as a sharp rise in ringing counts. AE activity is intense in this stage: both the magnitude and frequency of the ringing counts are significantly higher than in the quiet and fluctuating rising stages. Under axial loading, the connections between some crystal particles in the grouted body are destroyed, and the energy accumulated during loading is continuously released, resulting in the highest damage rate per unit time and a peak in the AE ringing counts. At lower rubber contents, the particles are insufficient to effectively arrest cracks, which therefore propagate rapidly, leading to high peak ringing counts. At higher rubber contents, the addition of rubber particles provides a crack-arresting effect, slows crack propagation and causes the energy to be released in increments, so the peak ringing counts decrease with increasing rubber dosage. Point c corresponds to the peak ringing count and represents the critical state at which internal cracks are about to coalesce into a through-going macrocrack. The higher the rubber content, the lower the ringing count at point c and the later this peak occurs, indicating a delayed failure of the specimen.
- (4)
- Residual stage (point c–point d). In this stage, the specimen enters the strain-softening phase. After the peak stress, microcracks within the specimen coalesce into a macroscopic main crack, which continues to extend and eventually penetrates the entyre specimen. Residual energy is still released during this process, so the ringing counts remain at a relatively high level, but gradually decrease as the energy is exhausted. Beyond the peak stress, the load decreases as the strain rapidly increases; a large number of new microcracks are generated and grow, eventually merging into a macrocrack that leads to overall failure. After the ringing counts reach their peak, they begin to decline but remain relatively high, and their fluctuation pattern becomes more complex due to the unstable nature of energy release during crack propagation and coalescence.
From the onset of micro-damage to the formation of final macroscopic failure, both the ringing counts and cumulative ringing counts show a downward trend in the later stage. This is because, under load, the rubber particles can alleviate stress concentrations, delay the initiation of microcracks, and reduce AE signals associated with stress release at crack tips. Through plastic deformation and interfacial friction, the grouted body absorbs part of the energy, slowing the growth of macroscopic cracks and smoothing the energy-release process. Consequently, for high rubber contents, the ringing counts decline more gradually in this stage, and their final values are higher than those of the low-content groups. In the low-content groups, brittle failure causes the macrocrack to rapidly penetrate the specimen, the stored energy to be released abruptly, and the ringing counts to drop sharply.
4.4. Effect of Rubber Fibre Content on Microstructure of Grouting Material
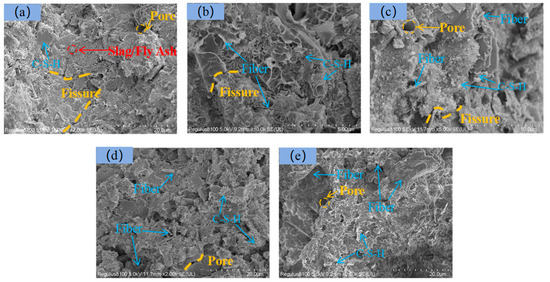
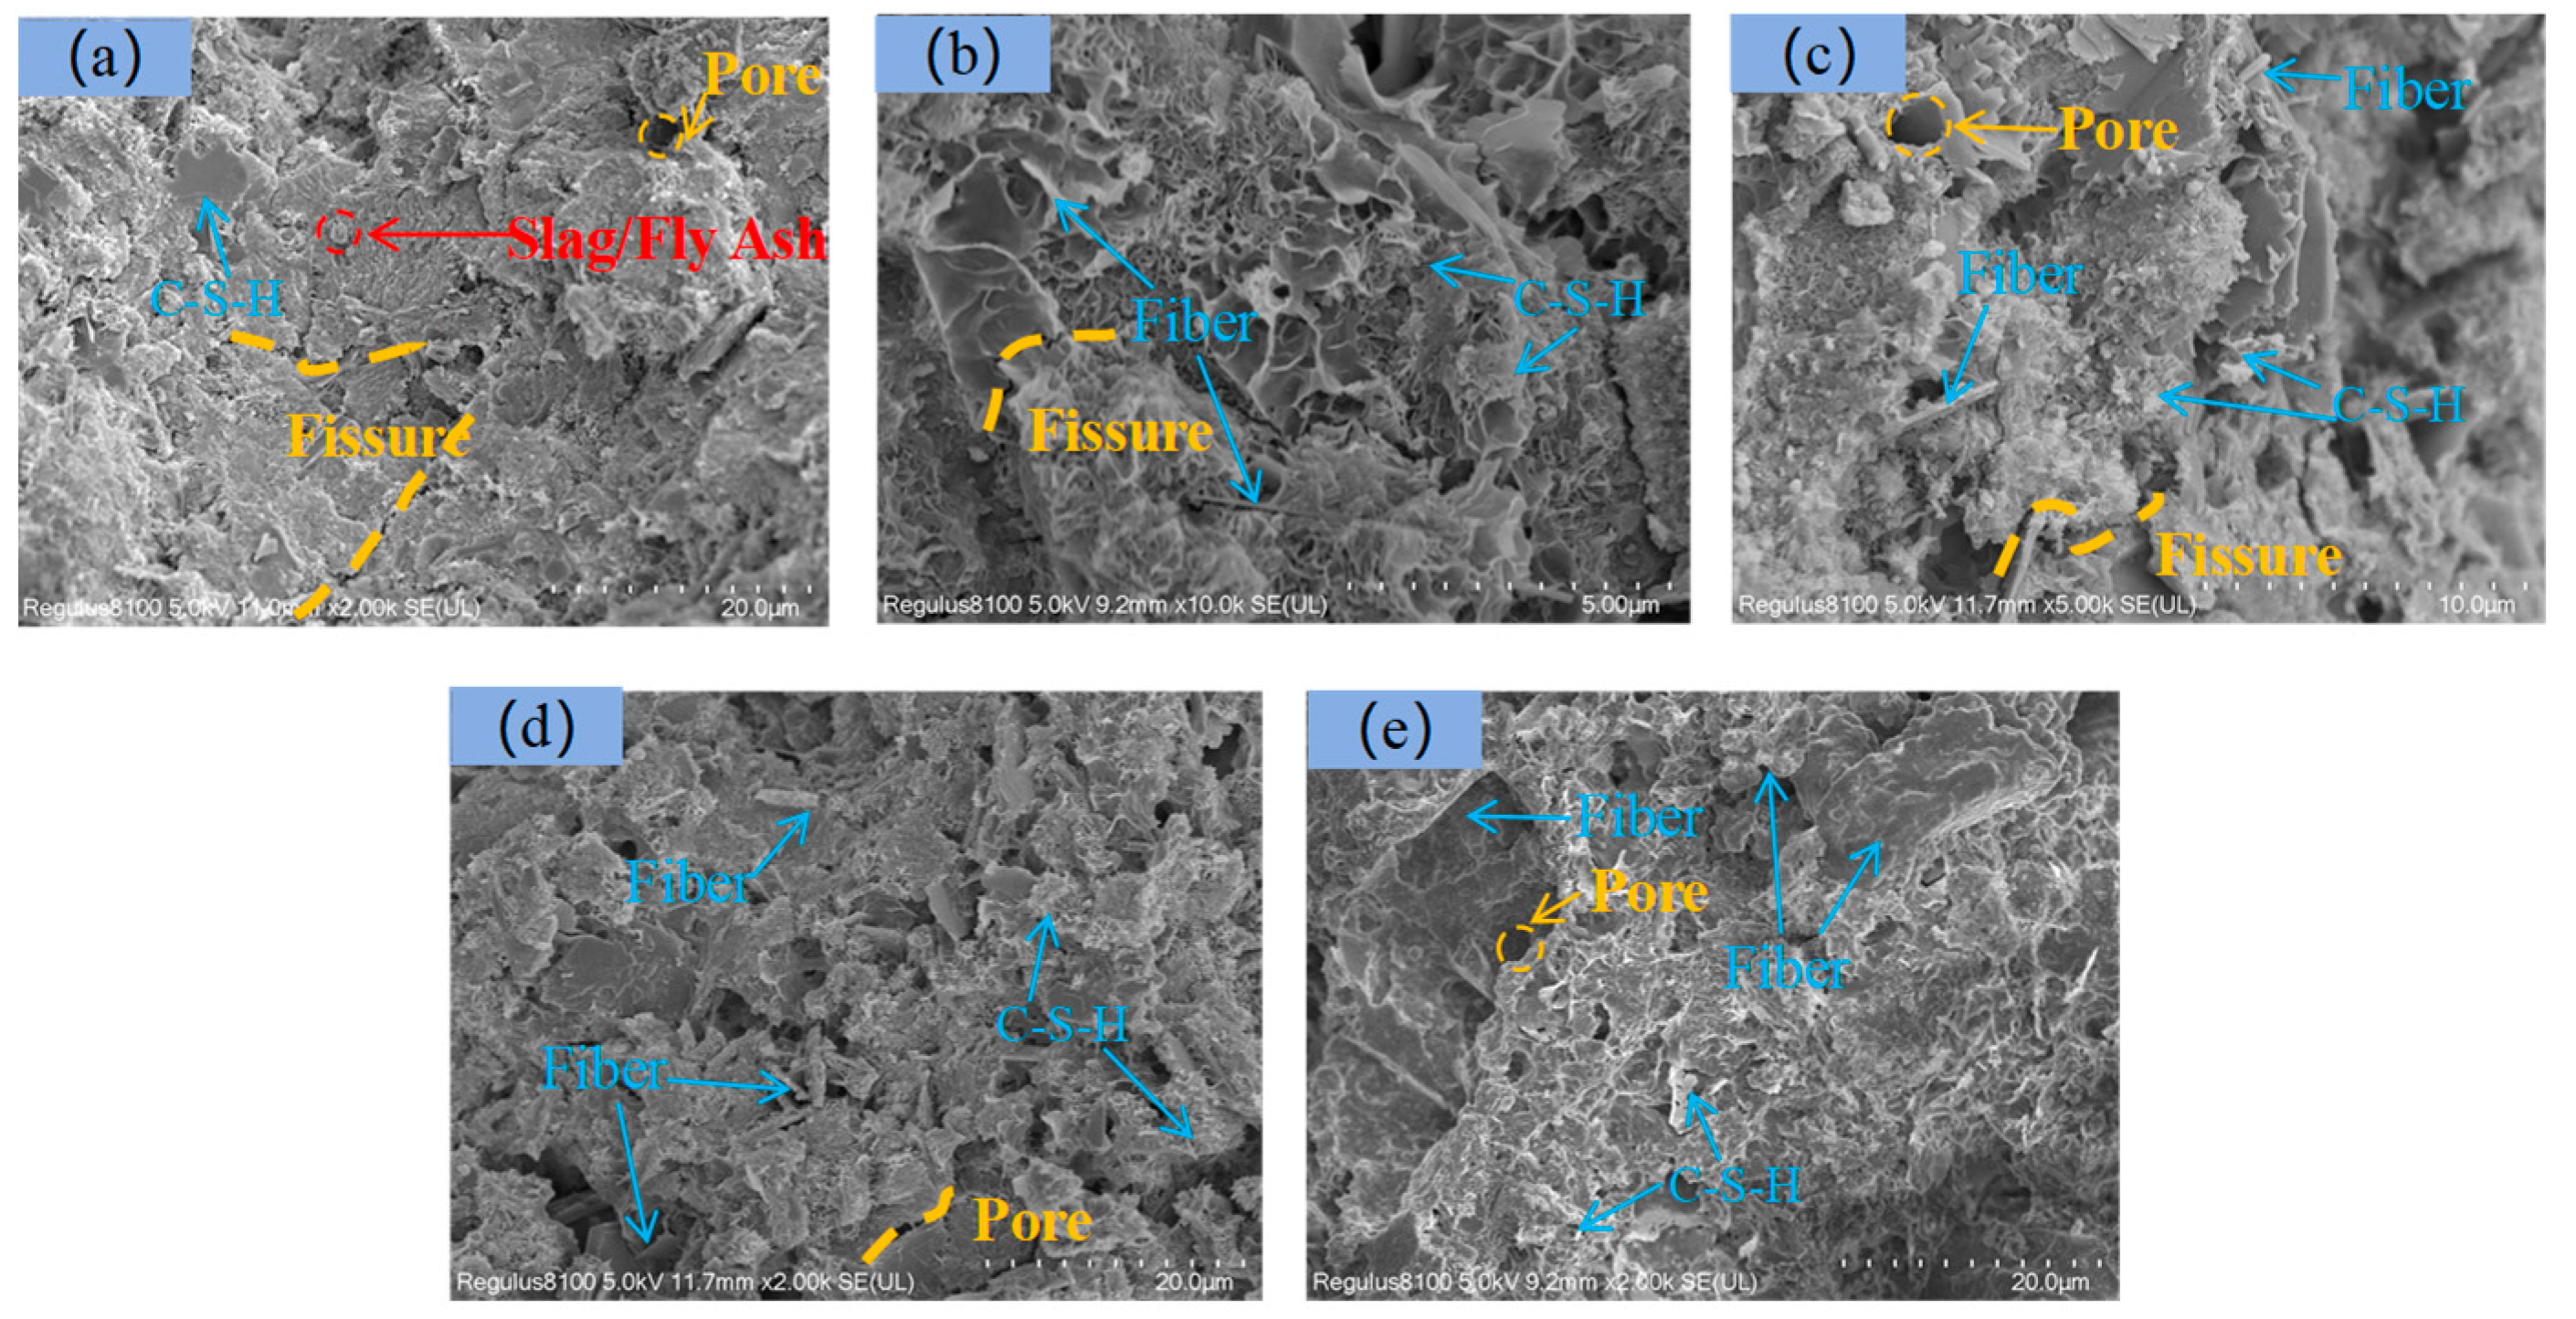
Figure 12 presents the SEM images of fracture sections of the grouted specimens with rubber particle contents of 0%, 6%, 10%, 14%, and 18%. As shown in Figure 12a, at 0% rubber content the specimen exhibits a relatively dense structure but contains a considerable number of micro-pores and microcracks; the interfacial transition zones between hydration products are clearly visible, and some unhydrated slag/fly ash particles remain in certain regions. Cracks are mostly straight and highly penetrating, and the hydration products, including calcium silicate hydrate (3CaO·2SiO2·3H2O, C–S–H), are distributed as fillers between particles. In Figure 12b,c, a small amount of rod-like rubber fibres can be observed, with flocculent C–S–H gel distributed around the fibres and within the matrix. The number of microcracks in the matrix is reduced, and some microcracks are arrested or deflected upon encountering rubber particles. The C–S–H gel is more uniformly distributed, and interfacial defects are slightly diminished. As shown in Figure 12d, at 14% rubber content, the specimens exhibit pronounced rubber particle aggregation, reduced spacing between fibres, and a stronger interfacial bond between fibres and matrix; however, the C–S–H gel becomes non-uniformly distributed due to the dense fibre network. The matrix as a whole appears denser, and most microcracks are short and non-penetrating. After compressive failure, cracks tend to propagate locally along the fibre–matrix interface rather than traversing the entire specimen. In Figure 12e, corresponding to 18% rubber content, the excessive rubber dosage leads to fibre agglomeration in some regions, forming fibre clusters. Around these clusters, the distribution of hydration products in the matrix is non-uniform, with local pores or interfacial defects present. In the non-agglomerated regions, the crack-arresting effect of the fibres is still evident, although small gaps can be observed at some fibre–matrix interfaces. In summary, as the rubber content increases, the spatial distribution of fibres evolves from sparse and discrete to more uniformly dispersed and eventually to locally agglomerated, while the fibre surfaces transition from relatively smooth, to partially covered with hydration products, and finally to being largely encapsulated by C–S–H gel.
Figure 12.
Microstructure of stone samples with different rubber fibre content. (a) 0%—2 sample; (b) 6%—2 sample; (c) 10%—3 sample; (d) 14%—2 sample; (e) 18%—2 sample.
In summary, at a rubber content of 10%, the slurry density is 1.28 g/cm3, which achieves a certain weight-reduction effect without inducing structural looseness due to excessively low density, thereby satisfying the lightweight requirements of grouting materials. The fluidity is 14.5 cm, ensuring adequate filling of fractures and avoiding construction difficulties associated with excessively low fluidity at higher dosages. The permeability rate is 0.12, indicating good slurry stability, which helps to reduce pores generated by water separation after hardening and achieves a balance between water retention and homogeneity. At the same 10% rubber content, the average uniaxial compressive strength is 4.858 MPa, representing a 19.77% reduction relative to 0% but substantially lower than the 58.27% reduction observed at 14%, and still meeting the strength requirements for non-load-bearing mine grouting applications. Therefore, a mix proportion consisting of 10% rubber particles, a blast-furnace slag to fly ash mass ratio of 4:1, 40% calcium carbide slag, 1% calcium chloride, and a water–cement ratio of 0.7 can be identified as the optimal mix design in this study.
5. Conclusions
This study aimed to investigate the effects of incorporating waste tyre rubber particles (RF) into grouting materials and to identify the optimal mix proportion for developing a green and sustainable grouting material. By experimentally analysing the influence of different rubber dosages (0%, 6%, 10%, 14% and 18%) on the workability, mechanical properties, and microstructure of the grouting material, the following main conclusions can be drawn:
- (1)
- Based on the multi-dimensional evaluation of working performance, mechanical properties, and microstructure, the optimal ratio of grouting materials was determined: rubber fibre 10%, blast furnace slag: fly ash mass ratio 4:1, calcium carbide slag 40%, calcium chloride 1%, water–cement ratio 0.7. Under this ratio, the slurry density is 1.28 g/cm3, the fluidity is 14.5 cm, the water separation rate is 0.12, and the uniaxial compressive strength is 4.858 MPa.
- (2)
- With the increase in rubber fibre content, the slurry density and fluidity decreased nonlinearly [41], the density decreased from 1.32 g/cm3 to 1.25 g/cm3, and the fluidity decreased from 17.6 cm to 13.0 cm. The water separation rate first increased and then decreased. The 6% dosage reached the peak value of 0.15, the 18% dosage decreased to 0.08, and the water separation rate decreased steadily after 10% dosage, and the slurry stability was significantly improved.
- (3)
- The uniaxial compressive strength decreased significantly with the increase in rubber fibre content, and the failure mode changed from shear failure to tensile–shear mixed failure. The activity of acoustic emission signal decreases with the increase in dosage, and the peak value of ringing count changes from high-frequency concentrated distribution of 0% dosage to low-frequency dispersed distribution of high dosage. The energy release is more uniform, and the crack penetration is effectively inhibited.
- (4)
- When the rubber fibre content is 6~10%, the fibres are uniformly dispersed in the matrix, which can block the microcracks and optimise the interface transition zone. The C-S-H gel is evenly distributed, and the interface defects are reduced. When the content is 14~18%, the fibre is easy to agglomerate to form local pore defects. Although it can still play a part of the crack resistance, the distribution of the hydration products of the matrix is uneven, and the interface bonding strength decreases.
- (5)
- The selection of rubber fibre has made a positive response to promote solid waste recycling, optimise slurry performance, improve material failure characteristics, and enhance toughness and crack resistance [42,43]; however, when the dosage is too high, the compressive strength is significantly reduced, the microstructure is degraded, and agglomeration defects easily occur. Therefore, it is necessary to control the balance toughness and structural integrity by the dosage.
Author Contributions
Conceptualization, Z.Y.; data curation, writing—original draft, Y.W.; project administration, X.L. and X.Q.; data curation, project administration, M.L.; supervision, R.G.; supervision, Y.Z. All authors have read and agreed to the published version of the manuscript.
Funding
This research was funded by the National Natural Science Foundation of China, grant number 42372327, and the National Natural Science Foundation of China, grant number 42177153.
Institutional Review Board Statement
Not applicable.
Informed Consent Statement
Not applicable.
Data Availability Statement
The data presented in this study are available on request from the corresponding author.
Acknowledgments
Thank Qiankunxing Intelligent Technology Co., Ltd. Wang Danqi, Sun Yu and others for their support and help.
Conflicts of Interest
The authors declare no conflicts of interest.
References
- Fang, J.; Wei, H.; Shi, J.; Chen, J.; Li, S. Research on the development of new qualityproductive forces of green low-carbon coal mining. China Min. Mag. 2025, 34, 296–304. [Google Scholar] [CrossRef]
- Song, S.; Niu, R.; Yang, S.; Cheng, X.; Ruan, H.; Chen, B.; Li, Y.; Tang, L. Effects of Coal Mining Subsidence on Loess Slope Morphology and Soil Erosion in the Middle Reaches of the Yellow River. Appl. Sci. 2025, 15, 5684. [Google Scholar] [CrossRef] [Scilit]
- Jiang, C. Research on the Theory and Technology Andapplication of 3D Deformation Monitoring of Fullperiod of Mining Subsidence Based on InSAR. Ph.D. Thesis, Anhui University of Science and Technology, Huainan, China, 2022. [Google Scholar] [CrossRef]
- Zhou, B.; Kang, J.; Li, S.; Zhang, L.; Zhang, J.; Li, M. A practicable land subsidence prediction model considering the coupling effect of coal mining and loose layer drainage based on Boltzmann function. Geosci. J. 2025, 29, 957–977. [Google Scholar] [CrossRef] [Scilit]
- Zhao, G.M.; Wang, Y.F.; Ai, J.; Liu, Y.; Zhang, P.; Li, X.H.; Wang, H.T.; Chen, Q.; Zhou, N.; Sun, J.; et al. Development and prospect of cement-based grouting materials for coal mine. J. China Univ. Min. Technol. 2024, 53, 1–22. [Google Scholar] [CrossRef]
- Zhao, Y.Y.; Liu, S.L.; Du, J.P. Research and application of deep and shallow hole grouting reinforcement technology in deep roadway under mining disturbance. Coal Chem. Ind. 2023, 46, 1–34+75. [Google Scholar] [CrossRef]
- Du, J.L.; Pan, S.R.; Liu, C.Y.; Zhang, H.; Li, X.; Wang, Z.; Chen, Y.; Wu, Q.; Zhao, M.; Sun, P.; et al. Key grouting technology and engineering demonstration for green mines. Min. Sci. Technol. 2023, 8, 293–307. [Google Scholar] [CrossRef]
- He, L.X. Application of Fly Ash in Mine Fire Prevention and Extinguishing. Mod. Chem. Res. 2019, 6, 131–132. [Google Scholar]
- Yuan, Z.K. Study on Activation Modification of Waste Rubber Powder and lts Effecton the Performance of Cement Mortar. Master’s Thesis, Beijing University of Civil Engineering and Architecture, Beijing, China. [CrossRef]
- Wu, F. Study on Static and Dynamic Properties of FiberReinforced Rubber Concrete. Master’s Thesis, Anhui University of Science and Technology, Huainan, China, 2020. [Google Scholar] [CrossRef]
- Aliakbari, M.; Jazani, O.M.; Sohrabian, M. Epoxy adhesives toughened with waste tire powder, nanoclay, and phenolic resin for metal-polymer lap-joint applications. Prog. Org. Coat. 2019, 136, 105291. [Google Scholar] [CrossRef] [Scilit]
- Jing, Y. Study on the Mechanicalproperties and Interfacebonding Mechanism of Rubberconcrete Reinforced Bymodified Waste Rubber Particles. Master’s Thesis, Qingdao University of Technology, Qingdao, China, 2025. [Google Scholar] [CrossRef]
- Xu, W.R.; Zhou, S.C. Environmental Impact Assessment of Resource Utilization of End-of-Life Tires from a Life Cycle Perspective. China Tire Resour. Recycl. 2025, 7, 37–39. [Google Scholar] [CrossRef]
- Kang, Y. Current status and development direction of waste rubber pyrolysis technology. China Rubber/Plast. Technol. Equip. 2021, 47, 30–37. [Google Scholar] [CrossRef]
- Zhen, X.F.; Li, K.; Zhan, H.; Wang, Y.; Liu, Z.; Chen, Q.; Zhang, M.; Zhao, P.; Sun, R.; Zhou, T.; et al. Progress in the study of waste tire pyrolysis catalysts and process parameters. Chem. Ind. Eng. Prog. 2021, 47, 30–37. [Google Scholar] [CrossRef]
- Liu, B.; Zhou, H.A.; Miao, C.J.; Chen, Y.; Li, X.; Zhang, S.; Wang, L.; Huang, Z.; Liu, Y.; Xu, M.; et al. Preparation and Performance Study of Light Soil Mixed with Waste Rubber. Guangdong Build. Mater. 2025, 41, 35–42. [Google Scholar]
- Li, G.Q.; Michael, A.S.; Gregory, G.; Smith, P.; Johnson, R.; Lee, K.; Wang, H.; Zhang, Q.; Brown, T.; Davis, C.; et al. Development of waste tire modified concrete. Cem. Concr. Res. 2004, 34, 2283–2289. [Google Scholar] [CrossRef]
- Wang, H.L.; Shen, X.D.; Wang, X.X. Effect of Waste Tire Rubber Powder on Cement Mortar Mechanical Properties. Bull. Chin. Ceram. Soc. 2014, 33, 1662–1666. [Google Scholar] [CrossRef]
- Xie, J.H. Research on the Application of Waste Tire Rubber Admixture in the Pouring of Large Volume Concrete. China Tire Resour. Recycl. 2025, 7, 109–111. [Google Scholar] [CrossRef]
- Zhang, X.C.; ShangGuan, Y.L. Experimental Study on the Optimal Proportion of Waste Rubber Particles to Improve the Mechanical Properties of Expansive Soils. Jiangxi Build. Mater. 2025, 6, 135–137+147. [Google Scholar]
- Maciej, G.; Alicja, K.K.; Tadeusz, T. Effect of Rubber Granulate Content on the Compressive Strength of Concrete for Industrial Vibration-Isolating Floors. Materials 2025, 18, 3134. [Google Scholar] [CrossRef] [Scilit] [PubMed]
- Zhang, J.K.; Liu, C.S.; Luo, J.G.; Wang, H.; Li, X.; Chen, Y.; Zhao, Q.; Sun, P.; Zhou, T.; Wu, M.; et al. The mechanics and durability of rubber fiber hydraulic concrete on laboratory. Eng. Rep. 2023, 6, e12755. [Google Scholar] [CrossRef] [Scilit]
- Ni, P.P.; Qin, X.; Yi, Y.L. Numerical Study of Earth Pressures on Rigid Pipes with Tire-derived Aggregate Inclusions. Geosynth. Int. 2018, 25, 494–506. [Google Scholar] [CrossRef] [Scilit]
- Yi, Y.L.; Chao, K.; Alireza, B. Predicting One-dimensional Compression of Tire Derived Aggregate Using a Simple Method. Soils Found. 2019, 59, 1292–1301. [Google Scholar] [CrossRef] [Scilit]
- Gou, Q.Q.; Feng, H.L.; Li, W.J.; Zhang, Y.; Liu, Z.; Chen, S.; Wang, L.; Zhao, P.; Sun, R.; Zhou, T.; et al. Study on Diffusion Characteristics of Grouting Filling Slurry for Fractured Rock in Caving Zone of Double-layer Goaf. Met. Mine 2025, 2, 189–197. [Google Scholar] [CrossRef]
- Miao, R.C.; Gu, Z.H.; Wang, C.; Li, X.; Zhang, Q.; Liu, Y.; Chen, J.; Zhao, B.; Sun, H.; Zhou, W.; et al. Study on rock-breaking mechanism of impact trenching in underground diaphragm wall with consideration of slurry effects. Comput. Geotech. 2025, 179, 106998. [Google Scholar] [CrossRef] [Scilit]
- Gao, Z.X.; Yang, J.; Meng, X.X.; Wang, Y.; Zhang, S.; Liu, C.; Chen, Q.; Zhao, L.; Sun, P.; Zhou, H.; et al. Study on diffusion law of highly viscous slurry grouting in complex fracture network based on viscosity time variability. J. Shandong Univ. Sci. Technol. (Nat. Sci.) 2025, 44, 13–22. [Google Scholar] [CrossRef]
- GB 50448–2015; Technical Code for the Application of Cementitious Grout. China Building Industry Press: Beijing, China, 2015.
- Han, L.; Xu, Q.; Zhang, Y.Q. Study on Overburden Rock Layer Separation Grouting and Filling Material Performance of Coal Gangue Powder-Coal Slime. Shandong Coal Sci. Technol. 2024, 42, 157–162. [Google Scholar]
- Lv, K.; Jiang, N.; Yin, D.W.; Zhang, H.; Li, X.; Wang, C.; Liu, Y.; Chen, Q.; Zhao, B.; Sun, P.; et al. Deterioration of compressive properties of coal rocks under water and gas coupling. J. Cent. South Univ. 2024, 31, 475–493. [Google Scholar] [CrossRef] [Scilit]
- Yin, D.W.; Sun, Y.; Yuan, X.T.; Li, C.; Wang, Z.; Liu, Z.; Chen, J.; Zhao, Q.; Sun, H.; Zhou, W.; et al. Experimental study on mechanical properties of the non-equal-size rock-coal composite specimens. Geomech. Eng. 2024, 39, 563–577. [Google Scholar] [CrossRef]
- Zhang, Y.L.; Zhou, H.K.; Pang, C.A.; Wang, L.; Li, X.; Liu, Y.; Chen, Q.; Zhao, B.; Sun, P.; Zhou, T.; et al. Sudy on improvement of characteristics of polypropylene fibre reinforced marine concrete with high perfomance admixture. Water Resour. Hydropower Eng. 2005, 11, 90–92+99. [Google Scholar] [CrossRef]
- Yang, Z. Study on Creep Characteristics and Instability Mechanism of Modified Concrete Filling Body Beside Roadways Retained Along Goaf. Master’s Thesis, Taiyuan University of Technology, Taiyuan, China, 2023. [Google Scholar] [CrossRef]
- Huang, Z.D. Experimental Study on the High Strength and Pressure Mining Mechanical Concrete of Properties. Master’s Thesis, Taiyuan University of Technology, Taiyuan, China, 2022. [Google Scholar] [CrossRef]
- Wang, F.C.; Wang, T.Q.; Yu, H.T. Study on Damage and Deterioration of Pretreated Waste Rubber Powder Cement Soil under Freeze-Thaw Conditions. J. Shenyang Jianzhu Univ. (Nat. Sci.) 2025, 41, 31–38. [Google Scholar]
- Döndüren, M.S.; Al Hagri, M.G. Single and Combined Effect of Fine and Coarse Tire Rubbers on the Static, Microstructural, and Impact Properties of Concrete. Strength Mater. 2023, 55, 1055–1078. [Google Scholar] [CrossRef] [Scilit]
- Zhang, J.W.; Wu, S.K.; Song, Z.X.; Li, H.; Wang, C.; Liu, Y.; Chen, Q.; Zhao, B.; Sun, P.; Zhou, T.; et al. The influence of fiber type and rubber content on the properties of cement-based materials for coal mines. J. Min. Strat. Control. Eng. 2024, 6, 42–56. [Google Scholar] [CrossRef]
- Geng, O.; Guo, Z.; Zhang, Y.L.; Liu, X.; Wang, L.; Li, X.; Zhang, S.; Zhao, Q.; Sun, H.; Zhou, W.; et al. Lateral resistance performance of embedded wall panels fabricated by fiber-reinforced foam concrete filled with crumb rubber powders. Innov. Infrastruct. Solut. 2025, 10, 334. [Google Scholar] [CrossRef] [Scilit]
- Li, Z. Research on Self-compacting Rubberised Concrete. Master’s Thesis, Central South University, Changsha, China, 2012. [Google Scholar]
- Jiang, W.C.; Zhang, Q.; Zhang, Y.T.; Wang, L.; Li, X.; Liu, Y.; Chen, Q.; Zhao, B.; Sun, P.; Zhou, T.; et al. Flexural behavior and damage evolution of pultruded fibre-reinforced composite by acoustic emission test and a new progressive damage model. Int. J. Mech. Sci. 2020, 188, 105955. [Google Scholar] [CrossRef] [Scilit]
- Gao, X.Y. Preparation of Rubber- Manufactured Sand UHPC Andstudy on Its Dynamic and Static Mechanical Properties. Master’s Thesis, Anhui University of Science and Technology, Huainan, China, 2025. [Google Scholar] [CrossRef]
- Hassan, S.; Mehdi, M.; Arman, A.; Ali, K.; Smith, P.; Johnson, R.; Lee, K.; Wang, H.; Zhang, Q.; Brown, T.; et al. Residual axial performance of PET/rubber-modified concrete confined with CFRP strips after thermal exposure: Experimental and theoretical analysis. Dev. Built Environ. 2026, 25, 100834. [Google Scholar] [CrossRef] [Scilit]
- Sun, L.N.; Lan, Y.H.; Hu, Y.X. Research Progress on Toughening Modification of Polylactic Acid. Guangdong Chem. Ind. 2025, 52, 76–78. [Google Scholar]

Disclaimer/Publisher’s Note: The statements, opinions and data contained in all publications are solely those of the individual author(s) and contributor(s) and not of MDPI and/or the editor(s). MDPI and/or the editor(s) disclaim responsibility for any injury to people or property resulting from any ideas, methods, instructions or products referred to in the content. |
© 2026 by the authors. Licensee MDPI, Basel, Switzerland. This article is an open access article distributed under the terms and conditions of the Creative Commons Attribution (CC BY) license.