


Abstract
Extensive coal mining activities can exert substantial negative impacts on surface ecosystems. Vegetation indices are widely recognized as effective indicators of land ecological conditions and provide valuable insights into long-term ecological changes in mining areas. In this study, the Zhaogu mining area of the Jiaozuo Coalfield was selected as the study site. Using the Google Earth Engine (GEE) platform, the Kernel Normalized Difference Vegetation Index (kNDVI) was constructed to generate a vegetation dataset covering the period from 2010 to 2024. The temporal dynamics and future trends of vegetation coverage were analyzed using Theil–Sen median trend analysis, the Mann–Kendall test, the Hurst index, and residual analysis. Furthermore, the relative contributions of climatic factors and human activities to vegetation changes were quantitatively assessed. The results indicate that: (1) vegetation coverage in the Zhaogu mining area exhibits an overall improving trend, affecting approximately 77.1% of the study area, while slight degradation is mainly concentrated in the southeastern region, accounting for about 15.2%; (2) vegetation dynamics are predominantly characterized by low and relatively low fluctuations, covering approximately 78.5% of the region, whereas areas with high fluctuations are limited and mainly distributed in zones with intensive mining activities; although the current vegetation trend is generally increasing, future projections suggest a potential decline in approximately 55.8% of the area; and (3) vegetation changes in the Zhaogu mining area are jointly influenced by climatic factors and human activities, with climatic factors promoting vegetation growth in approximately 70.6% of the study area, while human activities exert inhibitory effects in about 24.2%, particularly in regions affected by mining operations and urban expansion.
1. Introduction
Vegetation, as the primary producer in terrestrial ecosystems, plays a crucial role in sustaining ecological processes and regulating biogeochemical cycles. Vegetation coverage is widely regarded as a key indicator for characterizing ecosystem conditions and assessing changes in the regional ecological environment [1]. It not only reflects ecosystem health directly but also supports essential ecological functions, including wind erosion control, sand fixation, water conservation, soil stabilization, and climate regulation [2]. In addition, vegetation provides habitats for diverse organisms and forms the structural foundation of terrestrial food webs. Consequently, investigating the spatiotemporal dynamics of vegetation coverage is fundamental to regional ecological conservation, ecosystem restoration, the construction of ecological security barriers, and the optimization of territorial spatial patterns [3].
Mining areas, as regions subjected to intensive anthropogenic disturbance, often face particularly severe ecological and environmental challenges [4]. Long-term coal resource exploitation has made surface vegetation highly vulnerable to degradation, resulting in a series of environmental problems such as land degradation, surface subsidence, and soil erosion, which substantially constrain the sustainable development of mining regions [5]. Vegetation dynamics in mining areas tend to exhibit stage-dependent characteristics, typically involving rapid degradation during the initial mining phase, followed by fluctuating decline during continued exploitation, and partial recovery through natural succession or artificial restoration after mine closure. Spatially, vegetation degradation commonly displays a radial pattern centered on mining sites, with its extent closely related to mining intensity, topographic conditions, and vegetation types. Notably, artificial restoration measures may alter natural successional trajectories and give rise to new vegetation distribution patterns [6].
Vegetation growth is jointly regulated by natural environmental factors and human activities [7]. Climate change exerts a profound influence on vegetation species composition, community structure, and geographical distribution patterns [8], with climatic variables such as radiation, temperature, and precipitation directly affecting vegetation growth and spatiotemporal dynamics through their impacts on ecosystem resource availability. In parallel, inappropriate land-use practices—including coal mining, land reclamation, and urban expansion—have accelerated vegetation degradation across many regions [9]. In recent years, the implementation of ecological restoration initiatives, such as programs converting farmland to forests and grasslands, has provided favorable conditions for vegetation recovery in mining areas [10].
Remote sensing has become an indispensable tool for monitoring and assessing vegetation dynamics in mining regions owing to its macroscopic, multi-temporal, and spatially continuous observation capabilities [11]. Among various remote sensing indices, the Normalized Difference Vegetation Index (NDVI) has been extensively applied to characterize spatiotemporal variations in vegetation coverage [12]. However, NDVI suffers from several well-recognized limitations, including its nonlinear relationship with green biomass and saturation effects under high vegetation coverage conditions [13]. In addition, NDVI is sensitive to soil background conditions and atmospheric disturbances, which restricts its ability to accurately discriminate dense vegetation canopies [14]. To overcome these limitations, Camps-Valls et al. proposed the Kernel Normalized Difference Vegetation Index (kNDVI) in 2021 [15], which incorporates kernel-based machine learning concepts into vegetation index construction. Compared with NDVI and the near-infrared reflectance of vegetation (NIRv), kNDVI has demonstrated superior performance in alleviating saturation effects and capturing complex phenological and seasonal variations [16]. For instance, Wang et al. [17] compared NDVI, kNDVI, and SIF, highlighting the advantages of kNDVI in detecting vegetation stress under dense canopy conditions. Wu et al. [18] further demonstrated that kNDVI enhances sensitivity to gradual vegetation changes through nonlinear kernel transformation. As a result, kNDVI is considered more suitable for representing gradual vegetation changes and monitoring vegetation dynamics in highly disturbed environments such as mining areas.
Although vegetation dynamics in mining regions have been widely investigated using traditional vegetation indices, long-term spatiotemporal assessments employing advanced indices such as kNDVI remain relatively scarce, particularly in coal mining subsidence areas. Moreover, existing studies have often focused on short-term changes or single analytical perspectives, while comprehensive analyses integrating vegetation trends, stability characteristics, future change potential, and driving mechanisms are still limited. Addressing these gaps is essential for improving the understanding of vegetation evolution processes and for supporting effective ecological restoration and management strategies in mining regions.
In this context, this study adopts kNDVI as the core indicator to systematically investigate the spatiotemporal evolution of vegetation coverage in the Zhaogu mining area using the Google Earth Engine (GEE) platform. The specific objectives of this study are to:
- (1)
- analyze the spatiotemporal variations and long-term trends of vegetation coverage in the study area;
- (2)
- assess the stability characteristics of vegetation dynamics under prolonged mining disturbance;
- (3)
- evaluate the future persistence and potential evolution of vegetation coverage; and
- (4)
- quantify the relative contributions of climatic factors and human activities to observed vegetation changes.
Based on the objectives outlined above, this study puts forward the following hypotheses:
Hypothesis 1.
The kernel Normalized Difference Vegetation Index (kNDVI) provides a more accurate representation of vegetation dynamics in highly disturbed mining environments than traditional NDVI, particularly in areas with dense vegetation or complex spatial patterns.
Hypothesis 2.
Vegetation dynamics in mining areas exhibit stage-dependent patterns, driven jointly by climatic factors and human activities.
Hypothesis 3.
Comprehensive long-term spatiotemporal analyses can elucidate vegetation stability, potential future trajectories, and the underlying driving mechanisms, thereby offering critical insights for ecological restoration and environmental management.
Testing these hypotheses will provide a robust scientific foundation for monitoring vegetation, guiding ecological restoration initiatives, and promoting sustainable environmental management in mining regions.
2. Materials and Methods
2.1. Overview of the Research Area
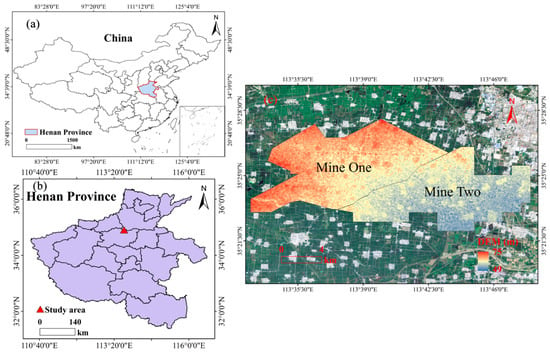
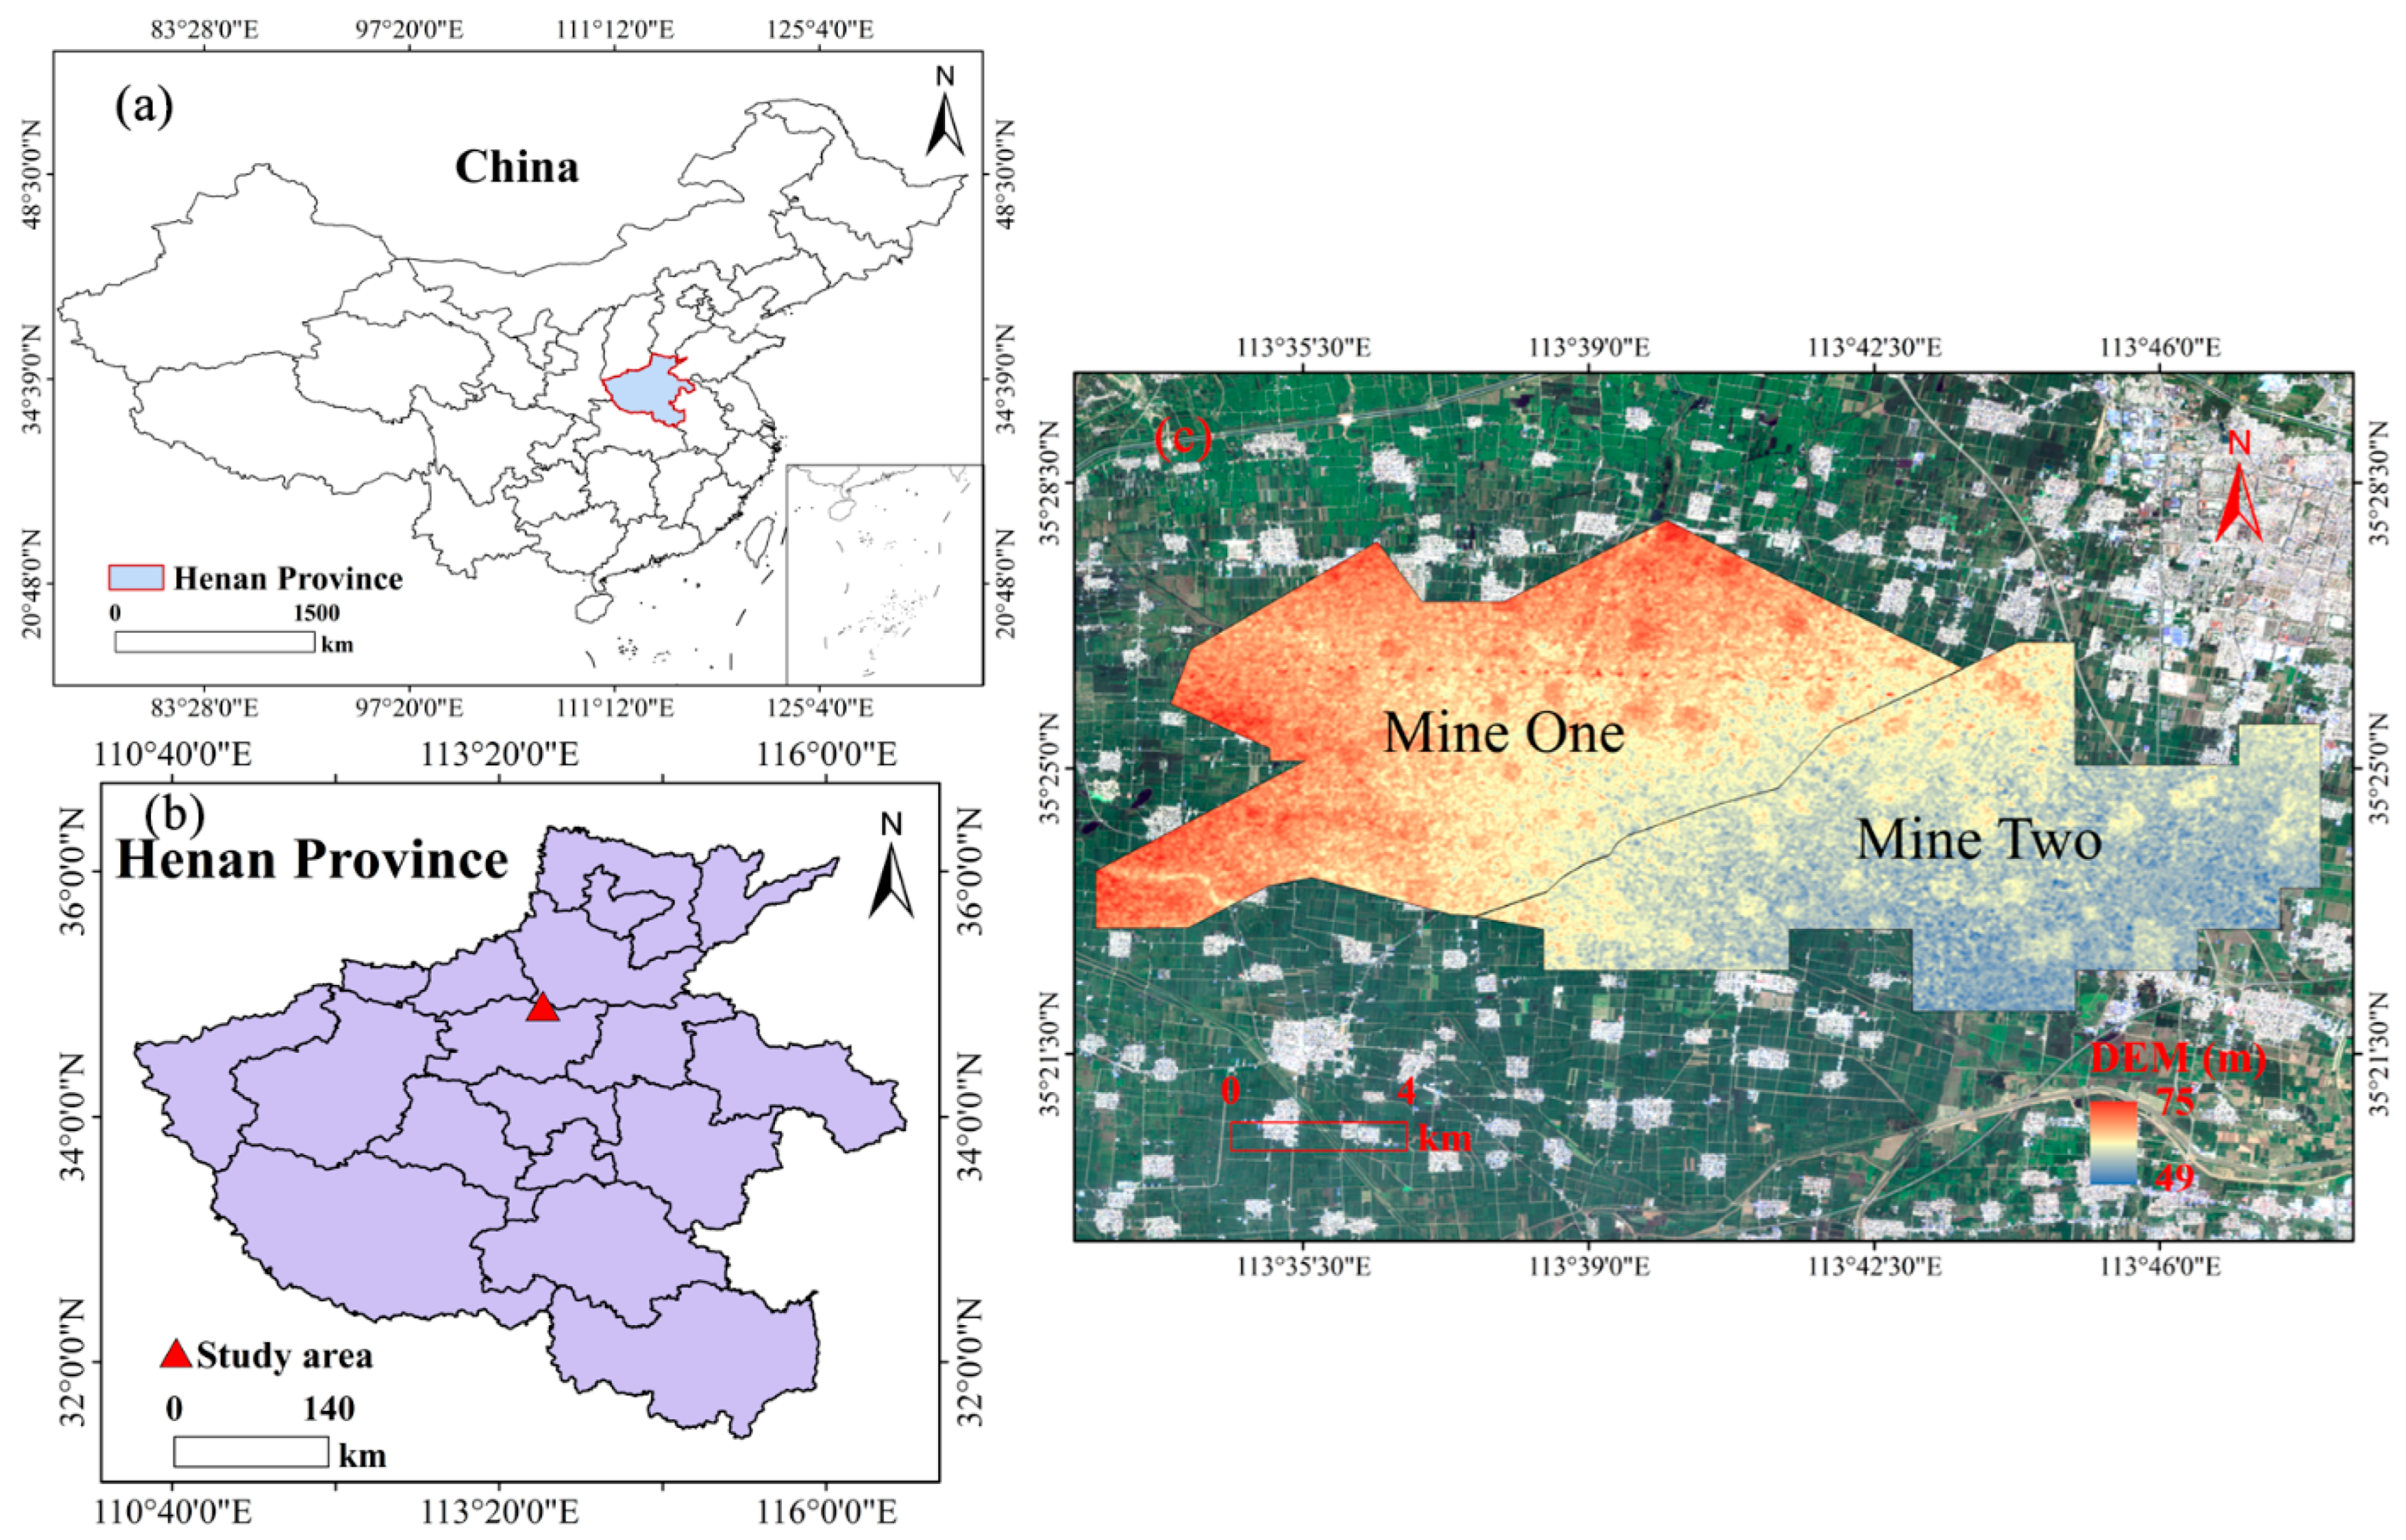
The geographical location and basic physical characteristics of the study area are shown in Figure 1. Figure 1a illustrates the location of the Zhaogu mining area within China and Henan Province, while Figure 1b depicts the administrative boundaries, topographic features, and spatial extent of the mining region. The Zhaogu mining area is situated in the eastern part of the Jiaozuo coalfield in Henan Province, China (113°35′50″ E–113°36′36″ E, 35°24′24″ N–35°25′11″ N), and administratively belongs to Xinxiang City. The area is located at the foothills of the Taihang Mountains, with a terrain characterized by higher elevations in the northwest and lower elevations in the southeast.
Figure 1.
Geographical Overview Map: (a) Location of Henan Province in China; (b) Location of the mining area in Henan Province; (c) Altitude of the Zhaogu Mining Area.
The study area experiences a typical warm temperate continental monsoon climate, with an annual mean temperature ranging from 14.1 to 14.9 °C and an average annual precipitation of approximately 580–600 mm, most of which falls during July and August [16]. Soil types in the region are diverse and include brown soil, fluvo-aquic soil, black soil, paddy soil, aeolian sandy soil, and marsh soil. These soils are further classified into 13 subcategories, 29 soil groups, and 62 specific soil types [19]. In terms of land use, the area is predominantly occupied by cultivated land and construction land. However, prolonged coal mining activities and mining-induced surface subsidence have resulted in a continuous reduction in cultivated land, accompanied by an increase in water bodies and unused land [20].
As an important anthracite production base in Henan Province, the Zhaogu mining area comprises two major mining units, namely Mine One and Mine Two, both of which are indicated in Figure 1b. Coal extraction activities in these mining units have contributed substantially to local economic development, while simultaneously exerting considerable pressure on regional ecological conditions and land-use patterns.
2.2. Data Source
The data used in this study were derived from the USGS Landsat Tier 1 Level-2 (T1_L2) surface reflectance products, accessed via the Google Earth Engine (GEE) platform [21,22]. The dataset comprises multispectral imagery acquired by the Landsat 5 TM, Landsat 7 ETM+, and Landsat 8 OLI/TIRS sensors, covering the period from 2010 to 2024 [23]. All Landsat images have a spatial resolution of 30 m and a nominal temporal resolution of 16 days.
The Landsat Level-2 products provide atmospherically corrected surface reflectance data generated using standardized USGS processing algorithms [21]. To ensure data quality, images with cloud cover exceeding 20% were excluded from further analysis. Additional preprocessing procedures were implemented within the GEE platform, including radiometric calibration, cloud and cloud-shadow masking, and image mosaicking. For Landsat 7 ETM+ imagery, striping artifacts caused by the Scan Line Corrector (SLC) failure were corrected using the gap-filling and striping correction functions available in GEE [23].
Based on the preprocessed surface reflectance data, NDVI and kNDVI were calculated for each image. To reduce the influence of residual clouds, atmospheric noise, and viewing geometry effects, the maximum value composite (MVC) method was applied to generate annual NDVI and kNDVI datasets. In addition, the quality mosaic algorithm was employed during image compositing and spatial clipping to further minimize the impacts of clouds, haze, and sensor-related disturbances. All data processing and analysis were conducted on the GEE platform, and the final datasets were retrieved in 2024 [22].
Climate variables, including monthly mean air temperature and monthly precipitation, were obtained from two independent gridded datasets with a spatial resolution of 1 km, developed by Peng Shouzhang and distributed by the National Tibetan Plateau/Third Pole Environment Data Center [24,25]. Specifically, the China Monthly Mean Temperature Dataset (1 km, 1901–2024) and the China Monthly Precipitation Dataset (1 km, 1901–2024) were used. These datasets were generated through the spatial downscaling and fusion of meteorological station observations with auxiliary environmental variables and have been widely applied in climate change and ecological studies across China. The climate datasets were resampled and spatially aligned with the vegetation indices to facilitate subsequent statistical analyses.
2.3. Research Method
Based on the kNDVI data of 15 periods from 2010 to 2024 in the Zhaogu mining area, the Theil-Sen Median slope estimation and Mann–Kendall trend test methods were used to determine the vegetation change pattern. The Hurst index was used to evaluate the sustainability of the vegetation dynamics. Finally, the residual analysis method was adopted to quantify the relative contribution of human activities and climate change to the vegetation in the mining area.
2.3.1. Calculation of kNDVI Vegetation Index
kNDVI, an improved form of NDVI, is a normalized vegetation index based on kernel functions derived from machine learning. It aims to resolve the challenges related to scale conversion and nonlinear behavior of traditional NDVI. By introducing nuclear technology, kNDVI can provide more robust and accurate vegetation information at different scales and with nonlinear variations [15]. kNDVI is calculated as:
where σ is a length scale parameter linearly proportional to the average values of the near-infrared and red-light reflectance of the obtained remote sensing image. At τ = 0.5, there is a good compromise between accuracy and simplicity [16]. When σ = τ(NIR + Red), the derivative can be obtained as:
2.3.2. Vegetation Trend Analysis of Sen + Mann–Kendall
Theil-Sen Median trend analysis (Sen trend analysis) is a robust non-parametric statistical trend calculation method. Compared with linear regression trend analysis, Sen trend analysis can avoid the influence of missing time series data and data distribution patterns, and eliminate the interference of outliers on the time series [26]. The calculation formula of the Sen trend degree is shown in Formula (4).
where kNDVIi and kNDVIj are time series data. A βkNDVI value greater than 0.0005 indicates an increasing trend in kNDVI, whereas a value below 0.0005 signifies a decreasing trend.
The Mann–Kendall test (MK test) is usually used in combination with Sen trend analysis. This method is robust to missing values and outliers and does not require the sample data to conform to any specific distribution [27]. The statistical test methods are shown in formulas (5)–(8).
here kNDVIj and kNDVIi are time series data, “sign” denotes the sign function; S is the test statistic; Z is the standardized test statistic; and n is the sample size. At a given significance level α, |Z| > Z1 − α/2 indicates the existence of a significant trend change. In this study, a significance level of α = 0.05 was adopted to assess the statistical significance of trends in the kNDVI time series.
2.3.3. Sustainability Analysis of Vegetation Changes
The Hurst index is based on the rescale range (R/S) analysis. The indicator is commonly employed to assess whether time series data adhere to a random walk or a biased random walk process, particularly in the domains of hydrology, geology, and climate [28]. In this study, the Hurst index is used to describe the future pixelwise variation trend in the study area as:
For the given time series {kNDVI (t), 1,2,… n, the mean sequence is defined as:
With the cumulative deviation as:
Range:
Then, the standard deviation is obtained as:
Finally, according to the above formula, one can obtain:
R/S∝TH indicates the existence of the Hurst phenomenon in the analyzed sequence. Here, H is the Hurst index, which can be obtained by fitting a log(R/S)n = R/S ()n = α + H × log (n) using the least squares method. If 0 < H < 0.5, it indicates that the kNDVI time series exhibits anti-persistent behavior, meaning that future trends tend to oppose past patterns. Values of H closer to 0 indicate a stronger anti-persistence in the series. Similarly, if 0.5 < H < 1, it indicates that kNDVI has a positive correlation in this time series. This implies that future trends follow past patterns. An H value approaching 1 indicates a strong positive temporal correlation in the series. When H = 0.5, it indicates that the changing trend of kNDVI is a random sequence within the time series and there is no obvious correlation.
2.3.4. Residual Analysis
Residual analysis is used to quantify the individual contributions of climate change and human activities to vegetation change. A multiple regression model was constructed using climate factors at various lag periods to estimate the predicted NDVI (CNDVI), while the observed NDVI (ANDVI) was derived from remote sensing imagery. The residual value (VNDVI), calculated as the difference, represents the influence of human activities on vegetation change. Based on the change slopes (θ) of VNDVI, ANDVI and CNDVI, the driving factors were categorized and their relative contributions quantified [29], as presented in Table 1.
Table 1.
Classification of Driving Mechanism Types and Calculation of Relative Contribution Rates (1).
3. Results
3.1. Spatiotemporal Variations in Vegetation in the Zhaogu Mining Area
3.1.1. Temporal Variations
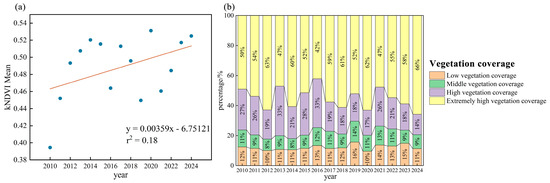
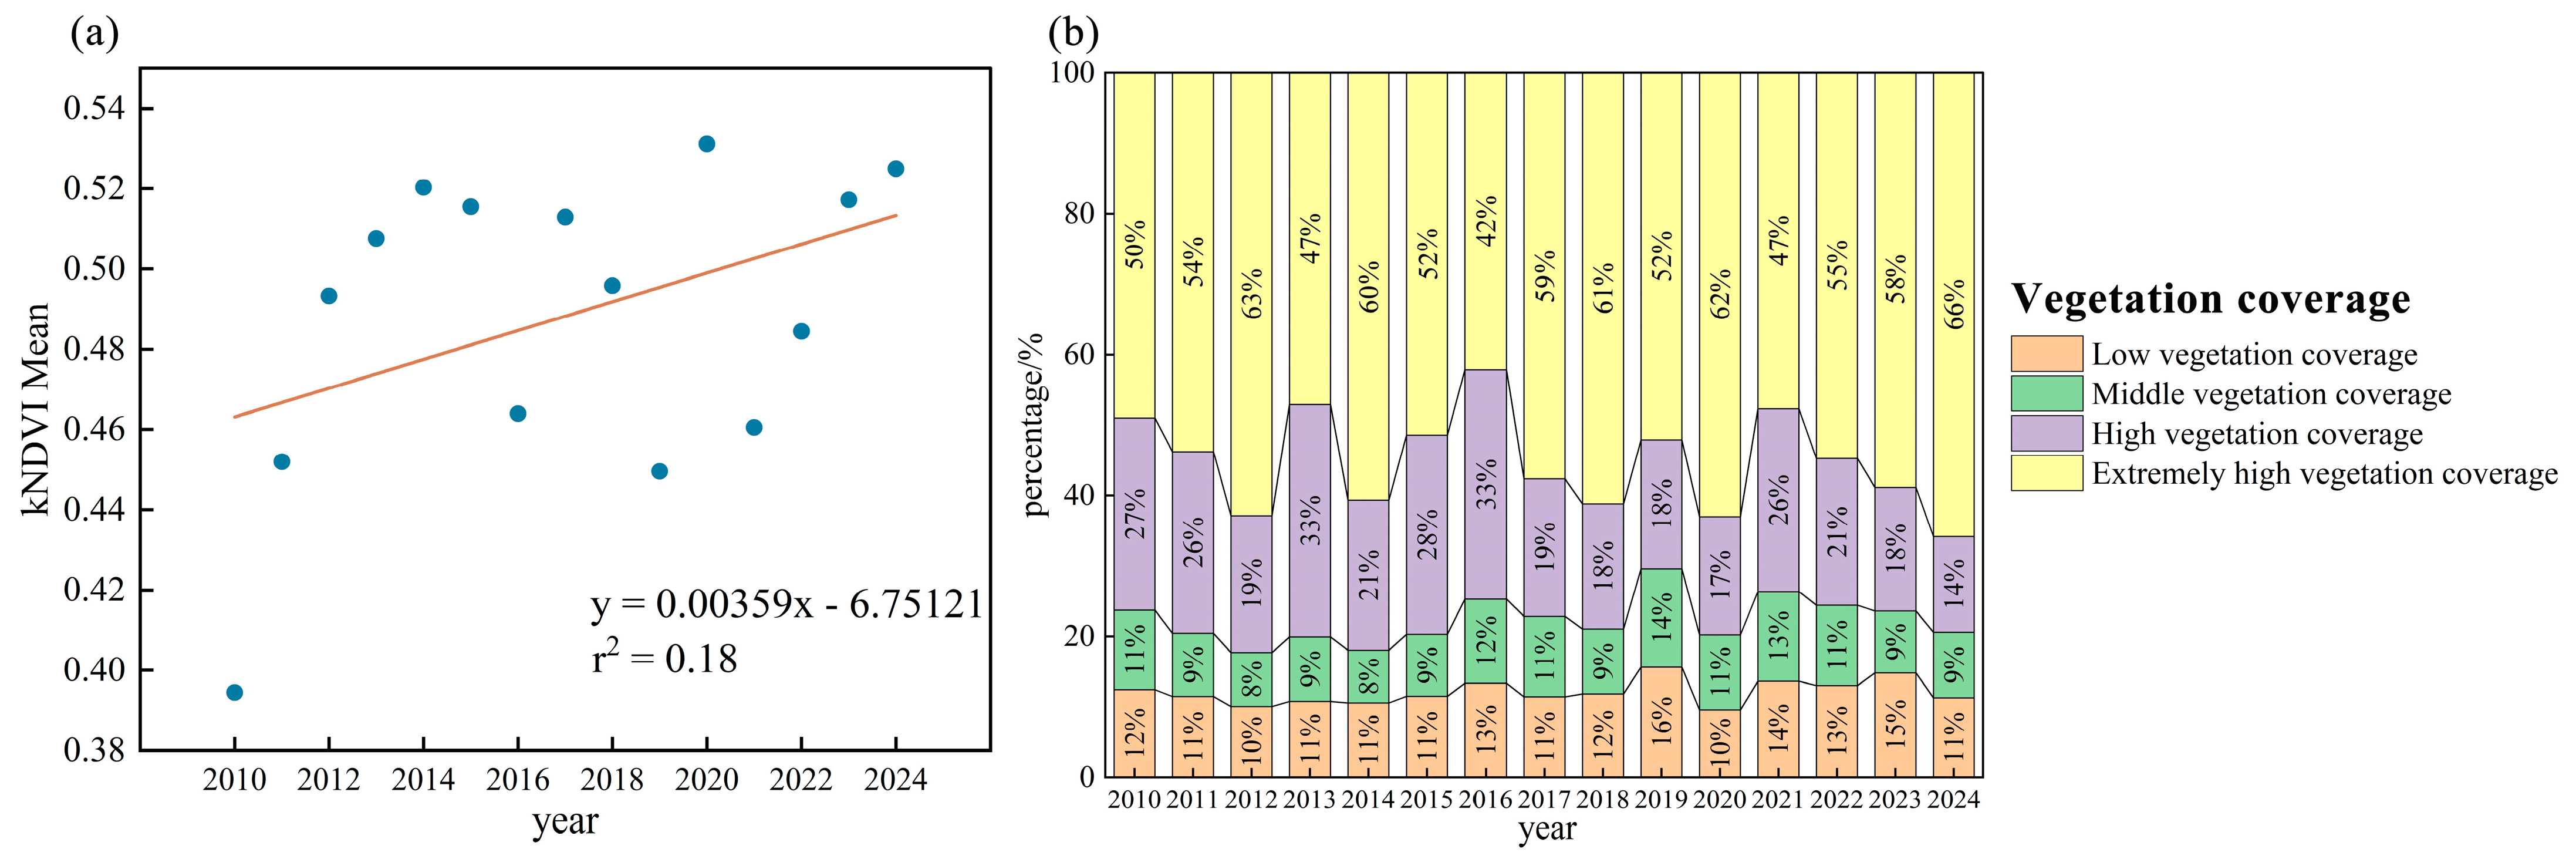
The spatial distribution of mean kNDVI in the Zhaogu mining area during 2010–2024 (Figure 2a) shows clear interannual fluctuations, ranging from approximately 0.39 to 0.53. A linear regression indicates a slight increasing trend (slope = 0.00359), though the low coefficient of determination (R2 = 0.18) suggests that most variability is driven by factors beyond a simple temporal trend, such as climatic variation and mining activities. Overall, the kNDVI demonstrates moderate but persistent vegetation recovery, with the lowest and highest mean values observed in 2010 (≈0.395) and 2020 (≈0.535), respectively, and 2024 (≈0.530) also reaching a high level. This trend aligns with greening patterns reported for other coal mining regions in northern China, albeit lower than areas with more intensive restoration initiatives [30,31,32].
Figure 2.
The mean temporal variation trend and the stacked area chart of kNDVI in Zhaogu mining area from 2010 to 2024 (a) Mean trend of kNDVI (b) Statistical analysis of vegetation coverage classification.
With respect to vegetation coverage composition, the proportion of low vegetation coverage remained relatively stable throughout the study period, accounting for approximately 10% of the total area. Moderate vegetation coverage generally fluctuated between 10% and 20%, exhibiting limited interannual variability. In contrast, high and extremely high vegetation coverage classes showed pronounced temporal dynamics. The proportion of high vegetation coverage typically ranged from 20% to 40%, reaching a local maximum of 33% in 2016, while extremely high vegetation coverage varied between 40% and 60%, peaking at 66% in 2024. Spatially, areas characterized by higher kNDVI values were predominantly concentrated in zones less directly affected by mining activities, whereas lower kNDVI values were mainly distributed in proximity to active or historically disturbed mining sites.
3.1.2. Spatial Variations
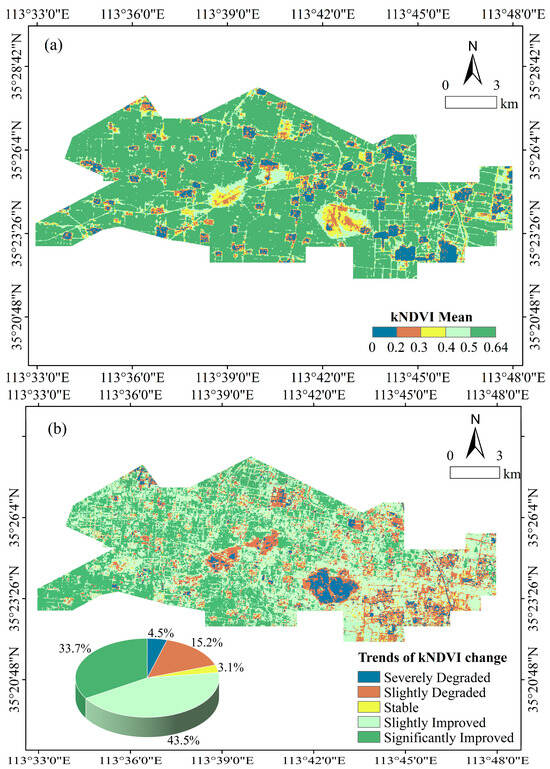
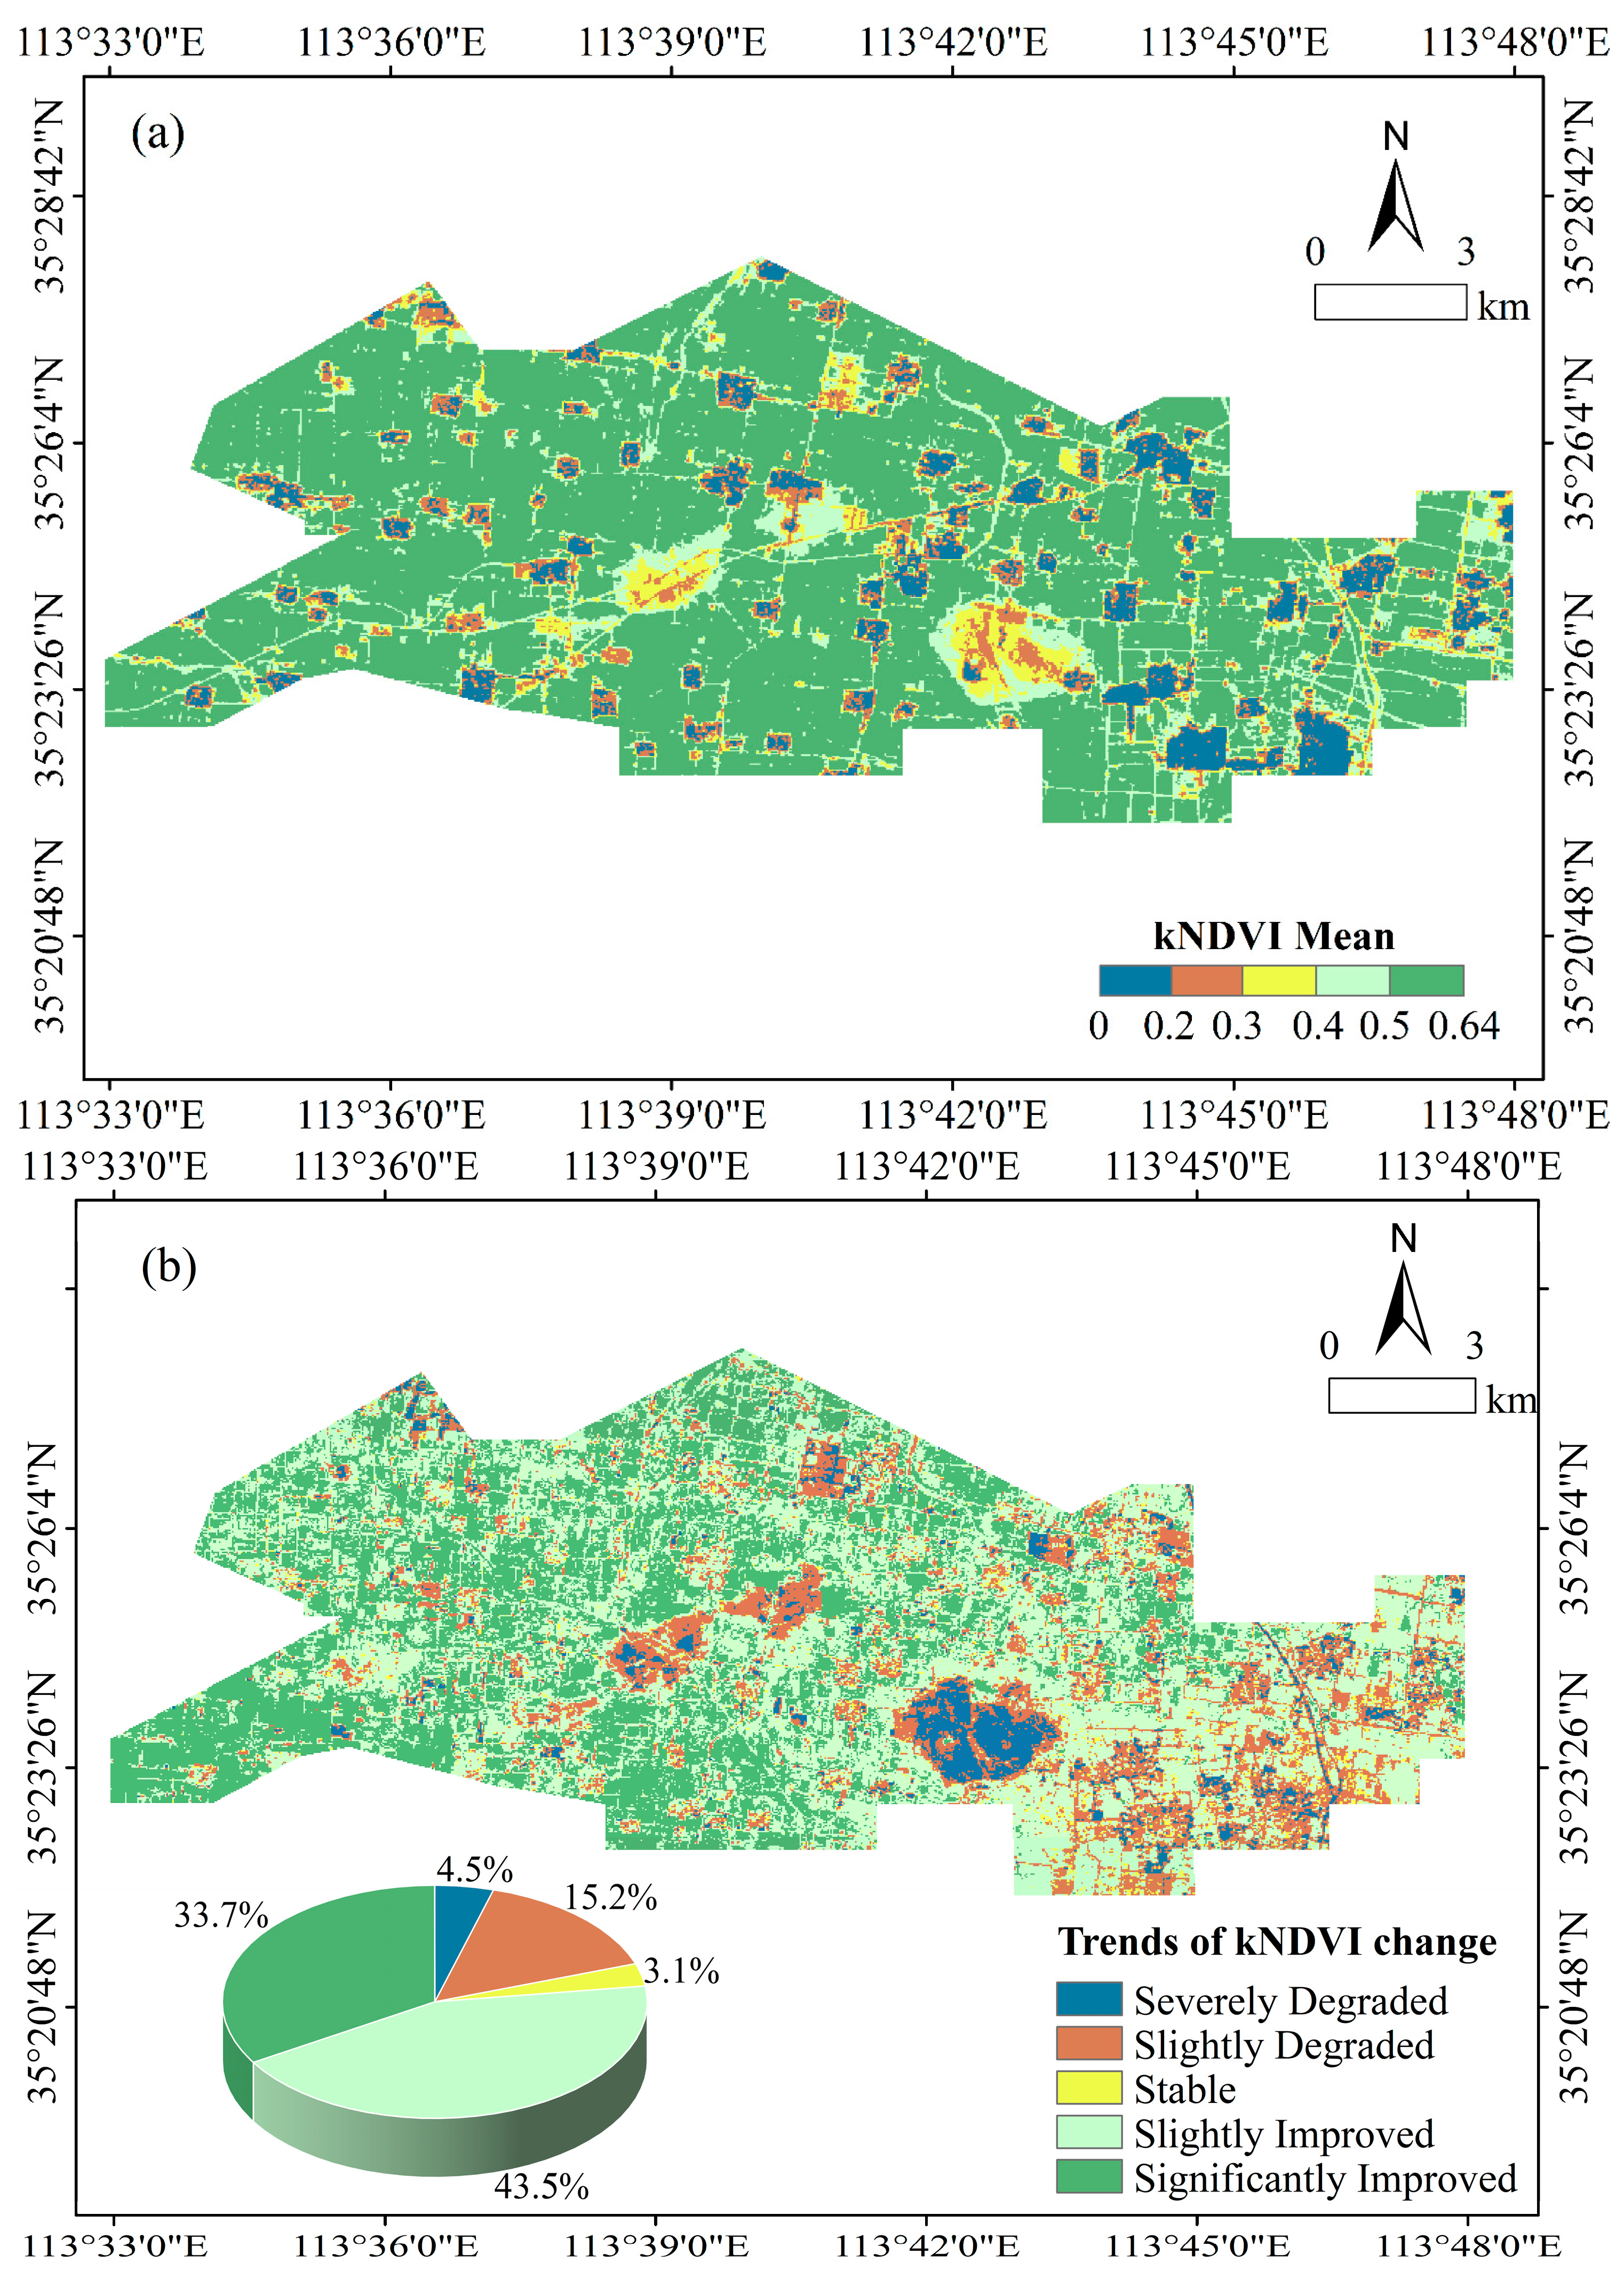
From a spatial perspective, kNDVI values in the Zhaogu mining area were predominantly concentrated within the range of 0.50–0.64, indicating a moderately high level of vegetation coverage and accounting for approximately 55% of the total area. Areas with extremely low kNDVI values (0–0.20) were sparsely distributed in isolated patches across the study region. The intermediate kNDVI classes (0.20–0.30, 0.30–0.40, and 0.40–0.50) exhibited a clear concentric spatial pattern, which was particularly evident in two central parts of the mining area. This pattern reflects a gradual spatial transition in vegetation conditions from severely disturbed zones toward surrounding areas with relatively higher vegetation coverage.
To characterize both the temporal trends and spatial patterns of vegetation dynamics, Sen’s slope estimator was combined with the Mann–Kendall (MK) trend test [33]. Sen’s slope values were classified into three categories: stable regions (−0.0005 to 0.0005), improvement areas (≥0.0005), and degradation areas (<−0.0005) [34]. MK test results at the 0.05 significance level were categorized as significant change (Z > 1.96 or Z < −1.96) and non-significant change (−1.96 ≤ Z ≤ 1.96). By overlaying Sen’s slope and MK test results at the pixel level, a spatially explicit map of vegetation change trends was generated, dividing the study area into five vegetation trend categories. Detailed classification criteria are provided in Table 2.
Table 2.
Statistical analysis of kNDVI trend patterns.
As shown in Figure 3, vegetation dynamics in the Zhaogu mining area from 2010 to 2024 were dominated by improvement, although pronounced spatial heterogeneity was observed. Areas of significant improvement were mainly distributed in the western part of the study area, accounting for approximately 33.7% of the total area, with particularly concentrated improvement in the southwestern corner. In contrast, areas of severe degradation exhibited a clustered spatial pattern, covering about 4.5% of the study area, and were commonly surrounded by zones of slight degradation. Slightly degraded areas were largely contiguous and primarily concentrated in the southeastern portion of the mining area, comprising approximately 15.2% of the total area. Stable areas accounted for only a small proportion of the region. Slightly improved areas constituted the largest category, covering approximately 43.4% of the study area, indicating that gradual vegetation improvement was the dominant trend across most of the mining area.
Figure 3.
Spatial variation characteristics of vegetation kNDVI in Zhaogu Mining Area (a) Spatial distribution of kNDVI (b) Trend analysis of kNDVI.
3.2. Characteristics of Vegetation Stability in Zhaogu Mining Area
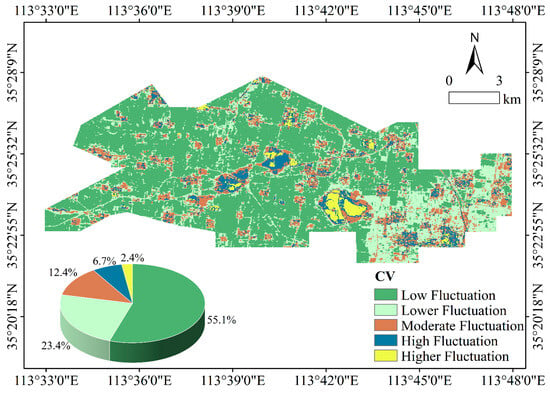
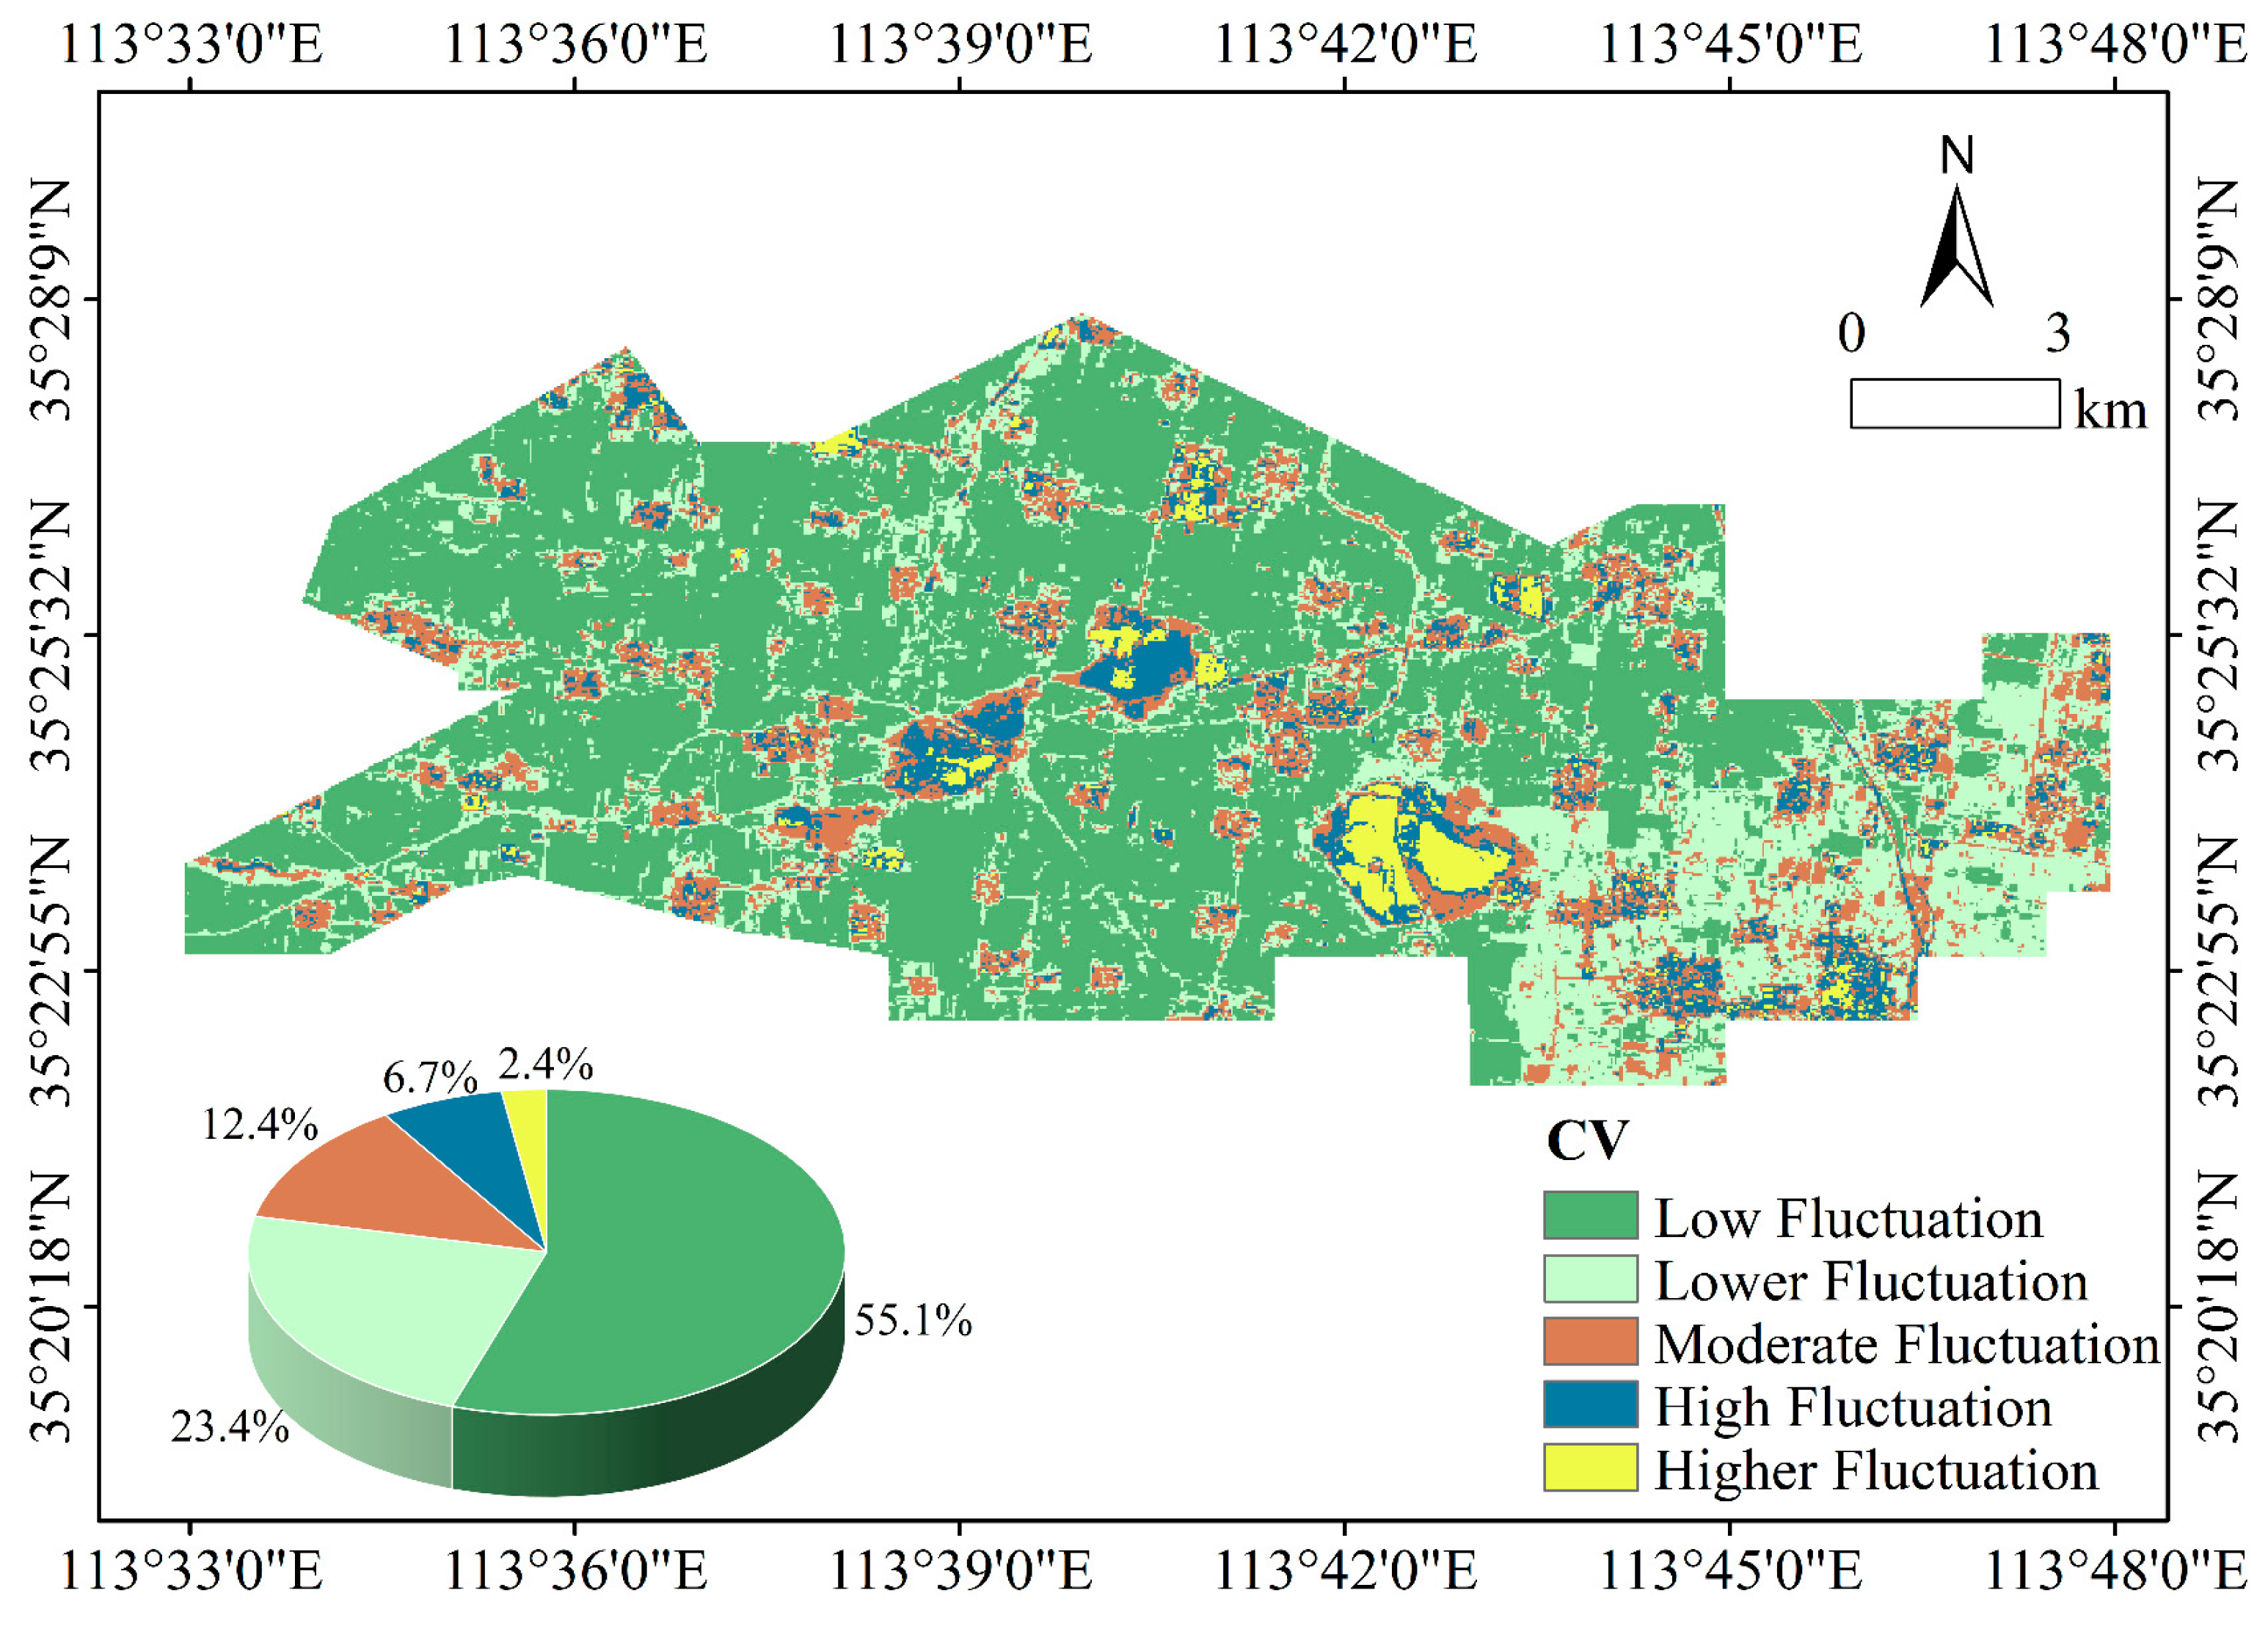
To further characterize the variability of vegetation conditions in the Zhaogu mining area, the coefficient of variation (CV) of kNDVI was calculated [35]. Using the natural breaks classification method, the study area was divided into five fluctuation categories: low, relatively low, moderate, relatively high, and high fluctuation. As shown in Figure 4, CV values during the period 2010–2024 ranged from 0.03 to 1.13, with a mean value of 0.17, indicating that overall vegetation variability across the mining area was relatively low. Areas characterized by low and relatively low fluctuation accounted for approximately 78.5% of the total area, suggesting that vegetation conditions remained generally stable throughout the study period.
Figure 4.
Spatial distribution of vegetation CV in the Zhaogu mining area.
In contrast, areas exhibiting relatively high and high fluctuation represented approximately 9.1% of the study area and displayed a distinctly clustered spatial pattern. These areas were mainly concentrated in zones subject to more intensive mining disturbance. Regions with lower fluctuation were predominantly distributed in the southeastern part of the study area, forming continuous and compact spatial patches, whereas low-fluctuation areas were more widely distributed across the mining region. Overall, the spatial distribution of CV values indicates that vegetation dynamics in the Zhaogu mining area were largely characterized by stable conditions, with pronounced variability confined to a limited number of localized areas.
3.3. Future Trend of Vegetation Changes
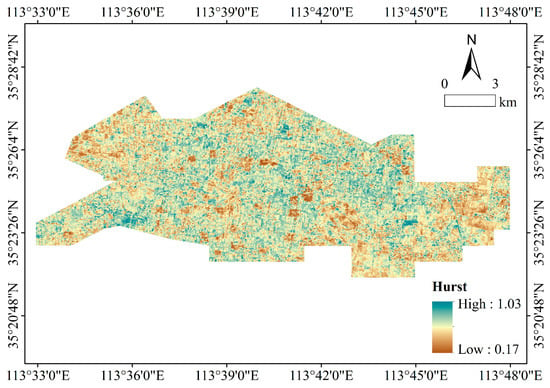
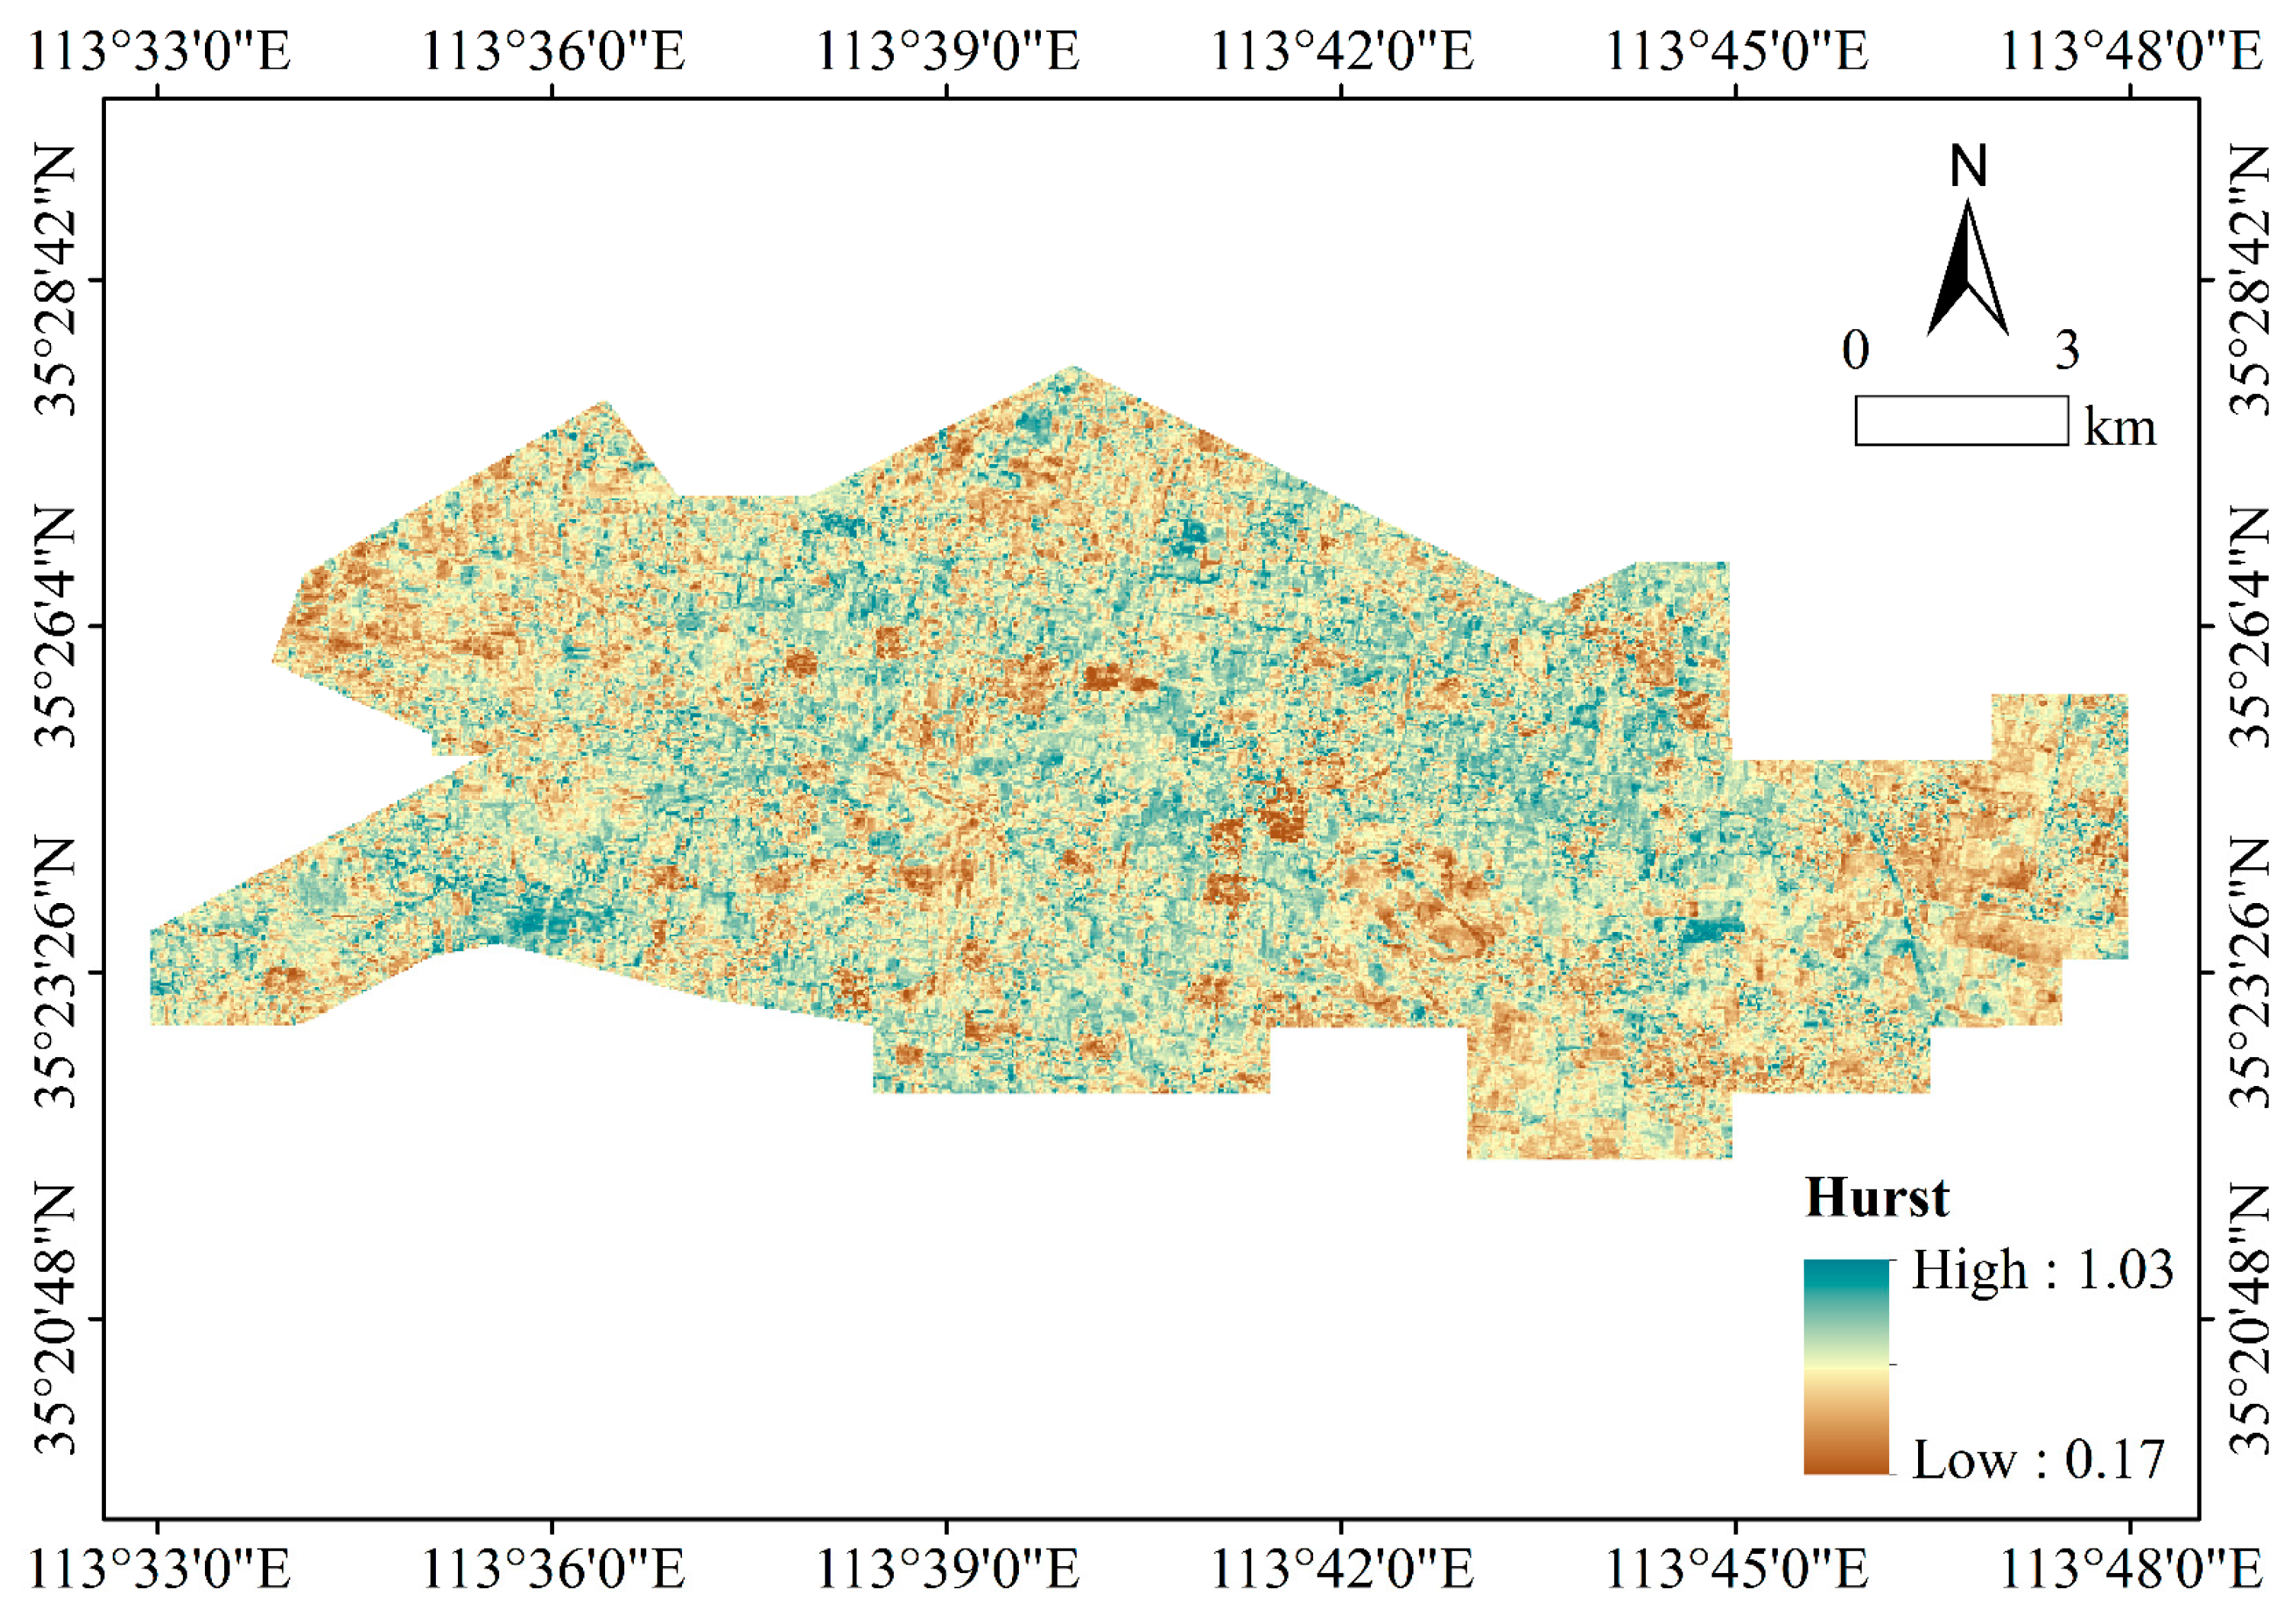
The Hurst exponent was employed to characterize the persistence of vegetation dynamics and the temporal continuity of kNDVI trends, with a value of 0.5 used as the threshold distinguishing persistent from anti-persistent behavior. As shown in Figure 5, areas with relatively high Hurst values were mainly distributed in localized and contiguous patches, indicating strong persistence in vegetation dynamics. In contrast, areas with lower Hurst values were more widely scattered across the study area, suggesting weaker persistence and a greater likelihood of future trend reversal. Overall, the spatial distribution of the Hurst exponent reveals pronounced heterogeneity in the temporal continuity of vegetation changes across the Zhaogu mining area.
Figure 5.
Spatial distribution of the Hurst index in Zhaogu Mining Area.
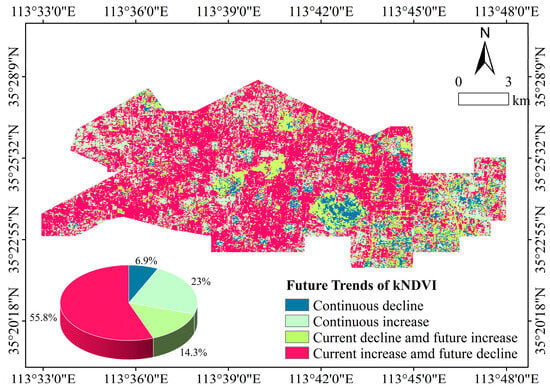
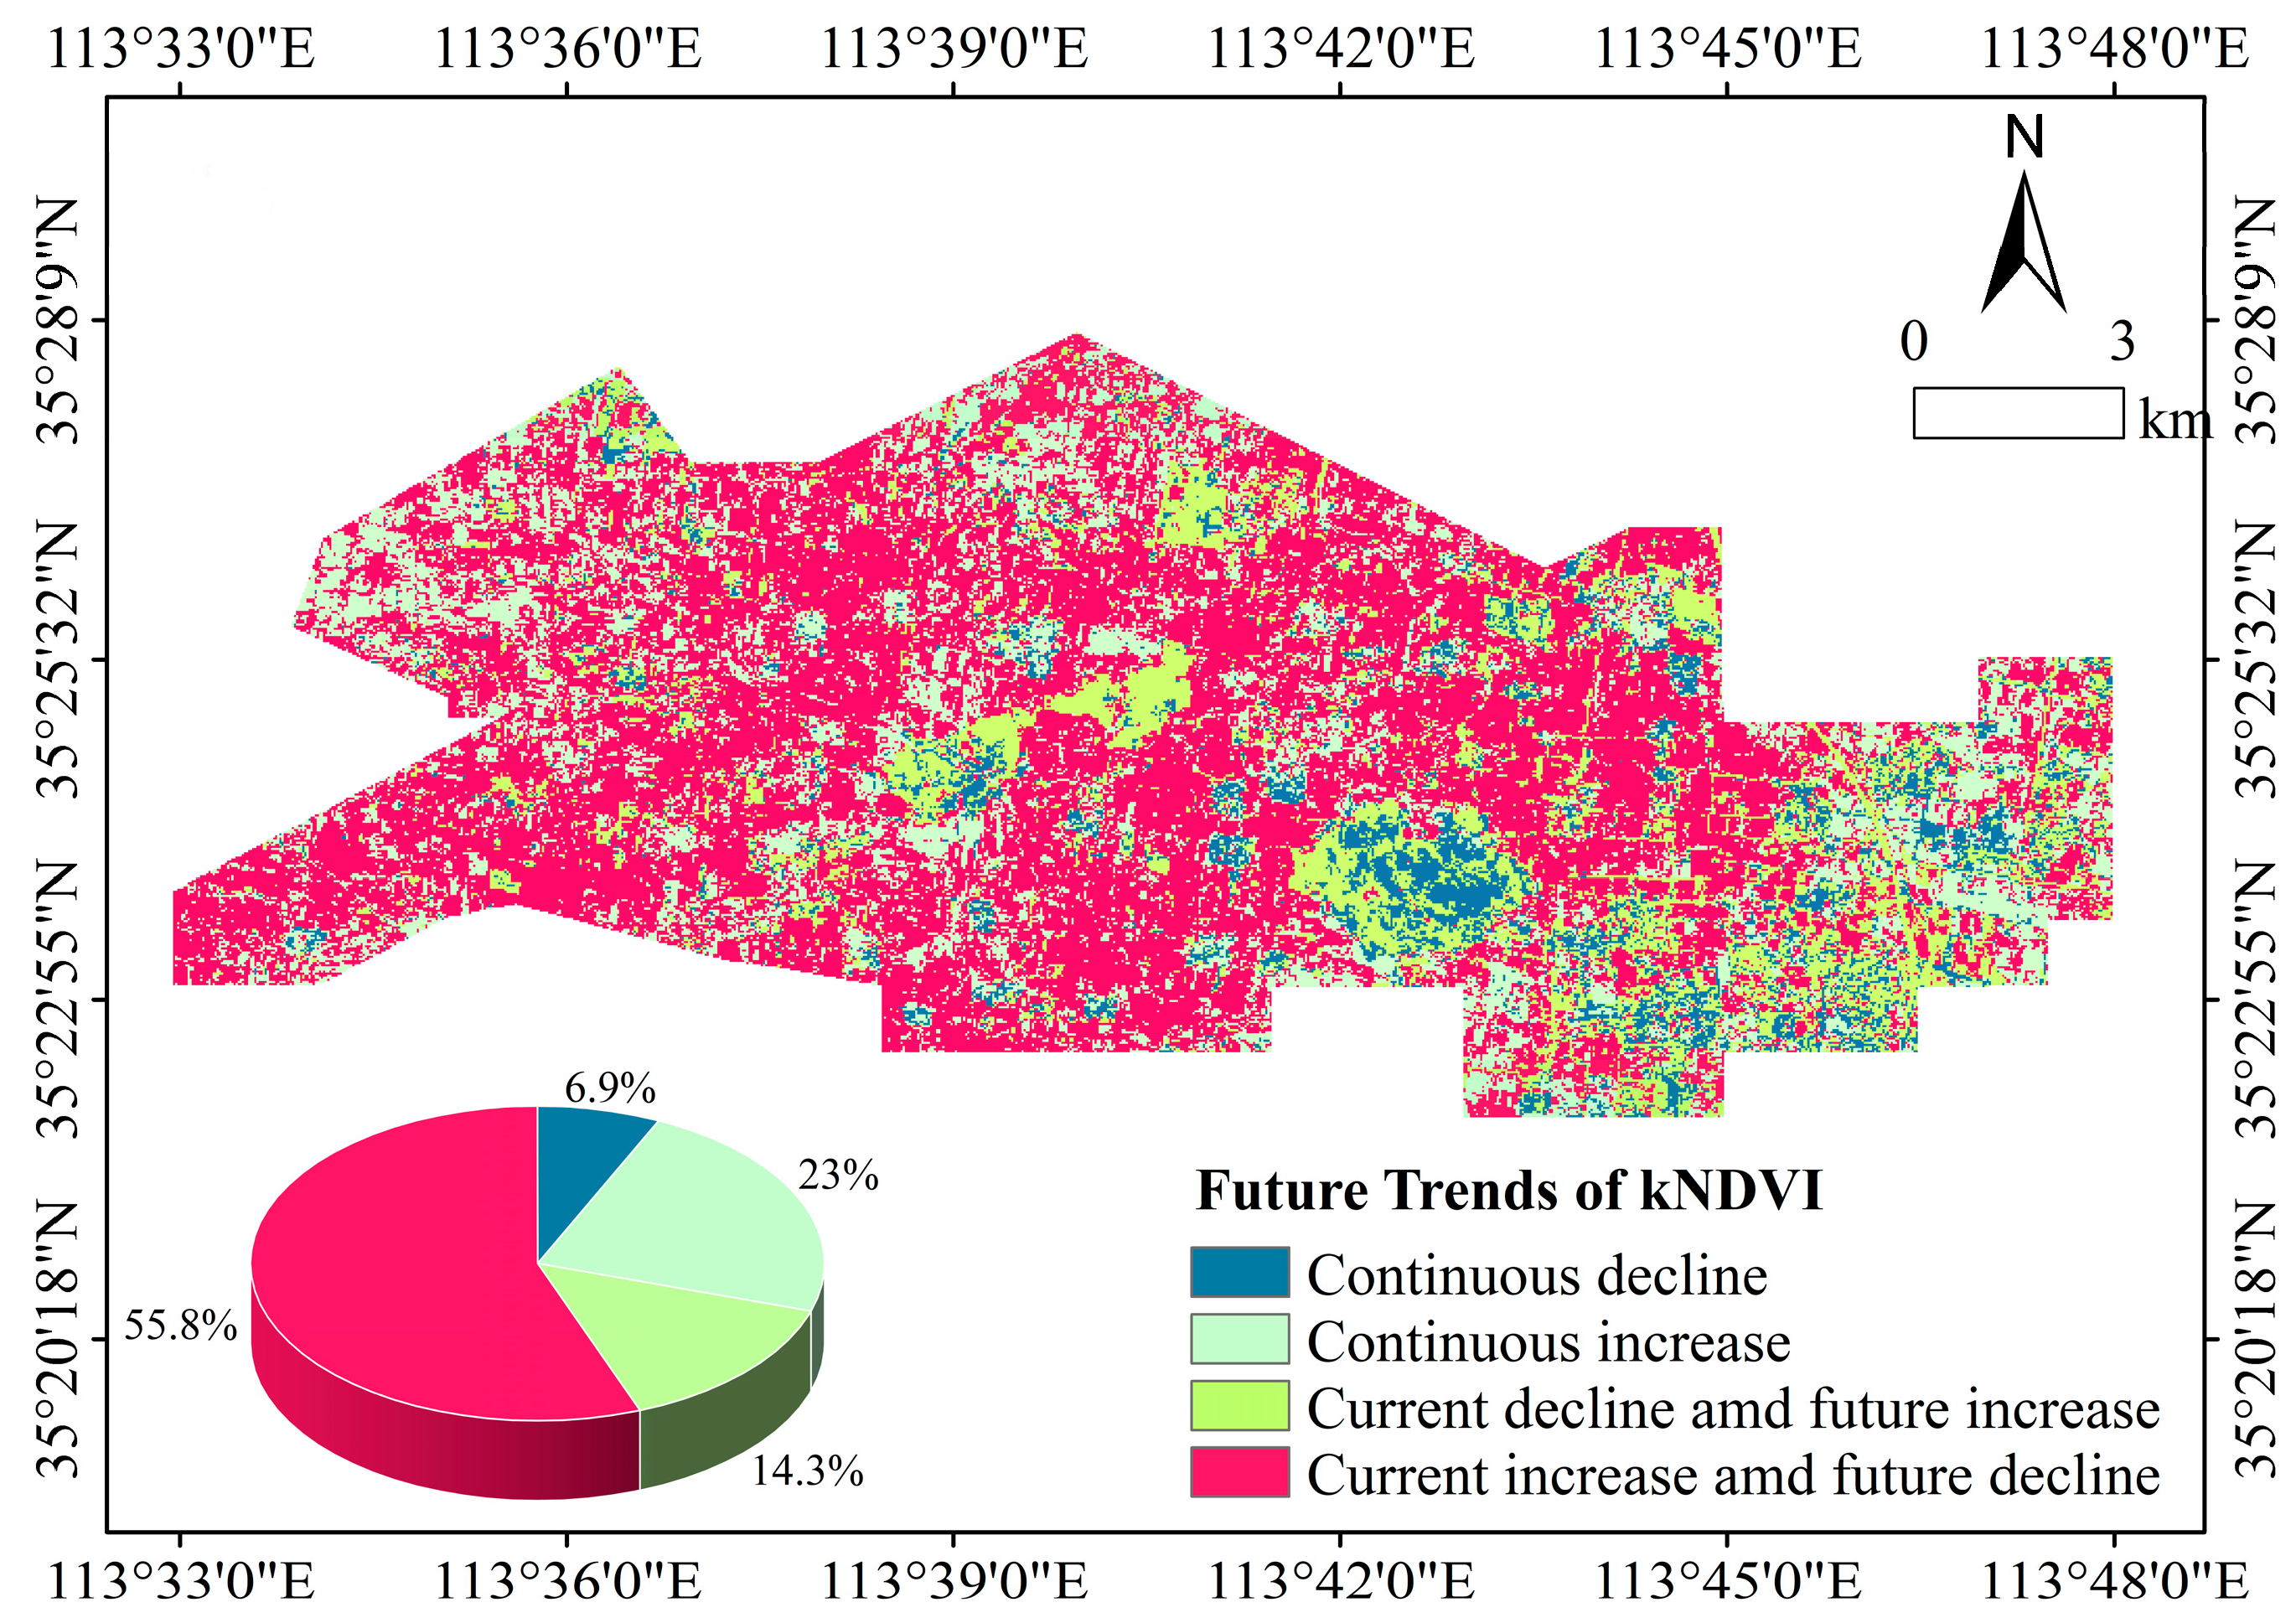
Based on the combined classification of current kNDVI trends and Hurst exponent values, future vegetation change potential in the study area was categorized into four types (Figure 6). The dominant category, accounting for approximately 55.8% of the study area, comprised regions exhibiting a current increasing trend but a potential future decline, indicating limited persistence of recent vegetation improvement. Areas characterized by a current declining trend but a potential future increase accounted for approximately 23.0% of the total area and were mainly distributed in regions with relatively high kNDVI variability. Areas showing continuous degradation represented about 6.9% of the study area, while areas exhibiting continuous improvement accounted for approximately 14.3%. These results indicate that future vegetation dynamics in the Zhaogu mining area are spatially differentiated, with a substantial proportion of areas showing a tendency toward trend reversal.
Figure 6.
Future variations in kNDVI in the Zhaogu Mining Area.
3.4. Impact of Climate and Human Activities on Vegetation Coverage
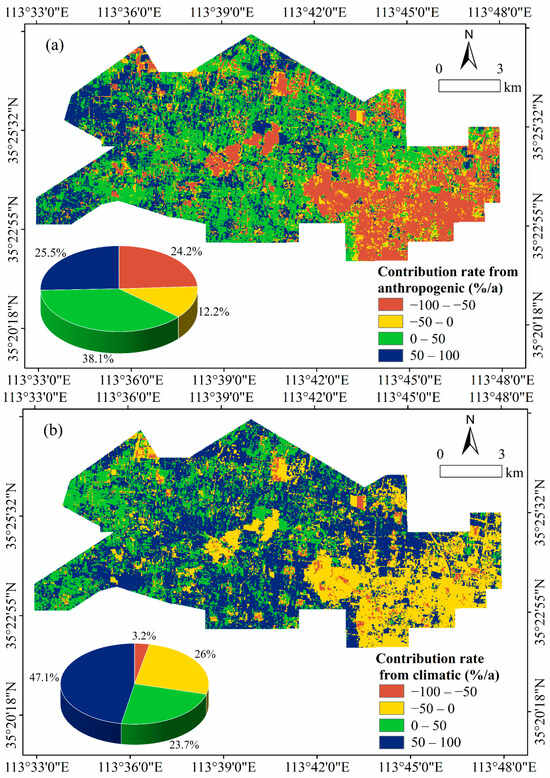
In this study, residual analysis was employed to distinguish and quantify the relative contributions of climatic factors and human activities to vegetation dynamics (Figure 7). Contribution rates are represented using a color scale, where dark blue (−100% to −50%) and blue (−50% to 0%) indicate strong and moderate inhibitory effects, respectively, while green (0% to 50%) and yellow (50% to 100%) represent moderate and strong promoting effects.
Figure 7.
Spatial distribution of the contribution of climate factors and human activities to vegetation changes (a) The contribution of human activities to vegetation changes; (b) The contribution of climate change to vegetation changes.
The contribution patterns of key climatic factors—particularly precipitation and air temperature—exhibit a pronounced east–west spatial differentiation. The southeastern and parts of the central regions are dominated by green and yellow tones, suggesting that relatively abundant precipitation and favorable thermal conditions exert a positive influence on vegetation growth. In contrast, blue and dark blue areas are mainly distributed in the western and parts of the central regions, indicating that limited precipitation and/or elevated temperatures, which enhance evapotranspiration demand, negatively affect vegetation dynamics. Overall, areas with positive climatic contributions account for approximately 70.8% of the study area, including 47.1% characterized by strong promoting effects and 23.7% by moderate promoting effects. Regions with negative climatic contributions represent about 29.2% of the total area, primarily exhibiting moderate inhibitory effects (approximately 26.0%), while areas with strong inhibitory effects are limited to 3.2%.
The spatial influence of human activities displays a highly fragmented pattern, forming a mosaic of small and discontinuous patches. The western and central parts of the study area are predominantly characterized by green and yellow colors, indicating that human activities in these regions generally promote vegetation growth. This positive influence is likely associated with ecological restoration initiatives, land reclamation efforts, and vegetation management practices. In contrast, numerous blue and dark blue patches are observed in the eastern and certain localized areas, suggesting that human activities have exerted inhibitory or damaging effects on vegetation. These negative impacts are closely related to intensive mining operations, urban expansion, and other anthropogenic disturbances.
Quantitatively, areas where human activities exert a positive influence on vegetation change account for approximately 63.6% of the study area, with strong promoting effects covering 25.3% and moderate promoting effects accounting for 38.1%. Regions exhibiting negative human-induced impacts comprise about 36.4% of the total area, among which strong inhibitory effects represent approximately 24.2%. In addition, about 12.2% of the study area experiences pronounced inhibitory influences from human activities.
4. Discussion
Using the Google Earth Engine (GEE) platform and the kernel Normalized Difference Vegetation Index (kNDVI)—which effectively mitigates the saturation effect inherent in traditional NDVI—this study systematically examined the spatial patterns, interannual variability, and future trajectories of vegetation dynamics in the Zhaogu mining area from 2010 to 2024. This approach addresses a critical gap in prior mining-area vegetation research, which has largely relied on NDVI and may therefore underestimate vegetation dynamics in regions with moderate to high vegetation coverage.
Over the past 15 years, vegetation kNDVI in the Zhaogu mining area exhibited a gradual upward trend, with a coefficient of determination (R2) of 0.18. While this trend indicates a general improvement in vegetation conditions, the relatively low R2 value highlights pronounced interannual variability and weak temporal persistence. This suggests that although ecological governance, land reclamation, and regional environmental protection policies have positively contributed to vegetation recovery, their cumulative effects remain limited and unstable. Compared with other mining regions, vegetation restoration in Zhaogu appears relatively modest. For example, Jia Zhian reported a higher annual vegetation growth rate (~0.01 a−1) and stronger temporal consistency (R2 = 0.367) in typical mining areas of Shanxi Province, demonstrating the effectiveness of sustained ecological governance [36]. Similarly, Yang Zi-heng documented significant vegetation improvement in Huainan, a resource-exhausted city, following green mine construction and ecological restoration initiatives [37]. These comparisons suggest that although vegetation recovery has occurred in Zhaogu, the intensity, continuity, and long-term effectiveness of restoration measures remain insufficient relative to better-managed mining areas.
The pronounced kNDVI fluctuations observed in the study area can be attributed to the combined effects of mining disturbances and natural environmental variability. Coal mining has led to extensive surface subsidence and waste accumulation, fundamentally altering local topography and severely damaging both agricultural and natural vegetation [38,39]. Situated at the foothills of the Taihang Mountains, the study area features relatively flat terrain with a southeastward slope, making vegetation particularly sensitive to surface deformation. Climatic factors further regulate vegetation dynamics. Precipitation—a dominant driver of vegetation growth in coal mining regions—exhibits strong interannual variability in the study area [40]. Years with higher precipitation generally correspond to increased kNDVI values, whereas drought years result in marked declines [41]. Additionally, the relatively high mean annual wind speed (2.37 m s−1) may exacerbate secondary degradation on already disturbed surfaces, intensifying vegetation damage and amplifying kNDVI variability [42]. These findings are consistent with previous studies indicating that, although climate change may promote vegetation growth at broader regional scales, vegetation responses in mining areas are substantially more complex due to strong anthropogenic disturbances [43].
From a spatial perspective, vegetation dynamics in the Zhaogu mining area are generally characterized by relative stability. Low-fluctuation kNDVI areas account for approximately half of the study area and are predominantly associated with higher kNDVI values, reflecting recent progress in land reclamation and vegetation restoration [44]. In contrast, areas exhibiting high and very high fluctuations—though covering less than 10% of the total area—are primarily concentrated in severely degraded zones directly affected by mining activities [45]. Despite their limited spatial extent, these areas experience intense ecological disturbance and therefore require targeted management and continuous monitoring.
This study also distinguishes between short-term vegetation recovery and long-term sustainability. Although most low-fluctuation areas currently exhibit increasing kNDVI trends, future projections indicate potential declines. In the short term, vegetation recovery may be driven by residual soil nutrients and the rapid establishment of pioneer species. Over longer timescales, however, soil degradation, water stress, and constraints on vegetation succession may limit sustained recovery [41]. Human activities play a critical role in this process. Certain reclamation measures may temporarily enhance vegetation greenness, whereas ongoing or future mining expansion may induce secondary disturbances. Low-fluctuation areas are often located in transitional zones between reclaimed land and actively exploited sites, where increasing dynamic pressures heighten ecosystem vulnerability [46]. Moreover, combined effects of climatic variability—particularly shifts in temperature and precipitation regimes—may further weaken vegetation resilience. The observed “increase–decline” pattern therefore reflects the potential unsustainability of current restoration strategies, underscoring the need for adaptive, long-term ecological management.
Vegetation dynamics in the Zhaogu mining area are jointly influenced by climatic factors and human activities. While both drivers exert an overall positive contribution to vegetation change, meteorological factors appear to have a stronger promoting effect due to generally favorable temperature and precipitation conditions. In contrast, the negative impacts of human activities—particularly intensive mining, land subsidence, and infrastructure expansion—are more pronounced at local scales [29]. This interaction produces strong spatial heterogeneity and complex underlying driving mechanisms.
Nevertheless, several uncertainties remain, including the selection of climatic variables, potential lagged vegetation responses to climate forcing, and uncertainties associated with residual trend decomposition and future projections. Furthermore, this study has several limitations. First, it relies on remotely sensed kNDVI data, which may be influenced by atmospheric conditions, sensor inconsistencies, and spatial resolution constraints. Second, the assessment of human activity impacts is primarily inferred from land-use changes and mining intensity, lacking detailed socio-economic or management data. Third, the study focuses on a single mining region, limiting the generalizability of the findings to other coal mining areas with different climatic and geological settings.
Future research should address these limitations by incorporating multi-source datasets, including higher-resolution satellite imagery, ground-based observations, and socio-economic information, to better quantify anthropogenic effects. Comparative studies across multiple mining regions are also warranted to generalize observed patterns and driving mechanisms. Moreover, integrating process-based ecosystem models with remote sensing analyses could improve predictions of long-term vegetation dynamics and support the evaluation of adaptive restoration strategies under varying climatic and management scenarios.
Collectively, despite these limitations, the present findings provide valuable insights into vegetation dynamics under combined climatic and anthropogenic pressures and offer a robust scientific basis for designing more effective, site-specific ecological restoration and management strategies in mining regions.
5. Conclusions
Firstly, vegetation in the Zhaogu mining area exhibits pronounced interannual fluctuations but an overall increasing trend, and is generally characterized by relatively high spatial vegetation coverage. Overall vegetation conditions have shown a gradual improvement during the study period. The proportion of areas with high vegetation coverage varies considerably from year to year, typically ranging between 40% and 60%. Spatially, significant vegetation improvement is mainly concentrated in the southwestern part of the study area, accounting for approximately 33.7% of the total area, whereas areas experiencing slight degradation are primarily distributed in the southeastern region, comprising about 15.2%.
Secondly, over the past fifteen years, vegetation conditions in most parts of the Zhaogu mining area have remained relatively stable. Areas characterized by low and relatively low fluctuations account for approximately 78.5% of the study area, while highly fluctuating regions are limited in extent and are predominantly located in zones subject to more intensive mining activities. Although the current vegetation trend is generally upward, future projections indicate a potential decline in approximately 55.8% of the area. These regions therefore require priority attention in ecological monitoring and management under ongoing restoration policies.
Thirdly, changes in vegetation coverage in the Zhaogu mining area are jointly influenced by climatic factors and human activities. Climatic factors exert a positive effect on vegetation growth in approximately 70.6% of the study area. Owing to ecological restoration, land reclamation, and environmental governance measures, human activities have predominantly promoted vegetation growth across about 63.6% of the area. In contrast, in the eastern part of the study area, human activities show a dominant inhibitory effect on vegetation, accounting for approximately 24.2%, mainly associated with intensive mining operations, urban expansion, and related anthropogenic disturbances.
Author Contributions
Conceptualization, H.Z., Z.C. and C.L.; methodology, C.L., H.Q. and X.L.; software, C.L. and X.L.; validation, C.L. and Y.J.; formal analysis, C.L. and H.Q.; investigation, C.L. and X.L.; resources, H.Z. and Z.C.; data curation, Y.J. and X.L.; writing—original draft preparation, C.L. and H.Q.; writing—review and editing, C.L.; visualization, C.L. and X.L.; supervision, H.Z. and Z.C.; project administration, H.Z. and Z.C.; funding acquisition, C.L., H.Z. and Z.C. All authors have read and agreed to the published version of the manuscript.
Funding
The Law of Coal Mining subsidence and the Driving Mechanism of Cultivated Land damage in the Central Plains Mineral and Grain Complex Area, Sub-project of the Key Project of the National Natural Science Foundation of China (grant number: U21A20108); Research on the Spatio-temporal Evolution Law of Vegetation in the Henan Section of the Yellow River Basin Based on Remote Sensing Stereoscopic Monitoring, Key Project of the National Natural Science Foundation of China (grant number: U22A20566); Project Entrusted by Enterprises and Public Institutions (ZYYH24-003).
Institutional Review Board Statement
Not applicable.
Informed Consent Statement
Not applicable.
Data Availability Statement
The remote sensing image data used in this study is derived from the United States Geological Survey. (USGS) is based on the Landsat T1_L2 product data obtained from 2010 to 2024 by Google Earth Engine, a geocomputing cloud platform of Google Inc. of the United States. The image resolution is 30 m and the time resolution is 16 d.
Conflicts of Interest
The authors declare no conflicts of interest.
References
- Zhou, C.; Zheng, Y.; Qian, Z.; Liang, J.; Zhou, J.; Dai, W.; Yu, Y. Effects of Forest Type Conversion on Soil Aggregate Characteristics and Their Impacts on Phosphorus Cycling. J. Nanjing For. Univ. (Nat. Sci. Ed.) 2025, 49, 65–74. [Google Scholar]
- Luo, P.; Jiang, Q.; Liu, X.; Zhang, X.; Wang, L. Spatiotemporal Changes in Vegetation Coverage in Hubei Province from 2001 to 2020. J. Southwest For. Univ. (Nat. Sci.) 2025, 45, 133–140. [Google Scholar]
- Liu, Y.; Shang, Z.; Li, L.; Jiang, H.; Jia, B.; Liu, J.; Ren, H.; Zhu, Y. Spatiotemporal Evolution of Vegetation Cover and Land Use and Their Impacts on River Sediment Load in the Upper Xiliao River Basin. China Rural. Water Hydropower 2025, 1–15, in press. Available online: https://kns.cnki.net/kcms2/article/abstract?v=yqBhao7Q9gxSaZiEl46gVzsQESDC41xS1QRLckB_HERdtg3JNn-JhVo0cCjUJDhe5eEA6oD2U5qPn1seE0-3B72AX6XrdXO-JHBPWE91Tr8p5zBRL495lu3qes0Oh2-xDnzEUcQjF3LlPNb2ntKl5BSQxN8q1g9vMagEiqo_37KupV90bhIHyw==&uniplatform=NZKPT&language=CHS (accessed on 5 January 2026).
- Wang, Z. Ecological Environment Monitoring of Mining Areas Based on an Improved Remote Sensing Ecological Index. Heilongjiang Environ. J. 2025, 38, 147–149. [Google Scholar]
- Xia, H.; Luo, H.; Fan, Y.; Jia, C.; Yao, Y.; Liu, X.; Song, Y. Accounting of Gross Ecosystem Product (GEP) Oriented toward Ecological Compensation Strategies: A Case Study of Shanxi Province. Green. Technol. 2023, 25, 226–234. [Google Scholar]
- Wu, H.; Liu, J.; Tang, J.; Wan, L.; Tong, F. Characteristics of Vegetation Communities and Soil Properties of Coal Mine Dump Sites in Jungar Banner. Sci. Soil. Water Conserv. 2025, 23, 178–187. [Google Scholar]
- Wang, J.; Dong, G.; Jiang, X.; Nie, T.; Li, Y. Spatiotemporal Evolution and Driving Forces of Ecosystem Services in the Heihe River Basin under Ecological Water Conveyance. Arid. Land. Geogr. 2025, 48, 1406–1420. [Google Scholar]
- Wang, T.; Gu, J.; Zhang, C. A Bibliometric Analysis of Landscape Pattern Evolution Research in China over the Past Two Decades Based on CNKI. Fujian Archit. 2025, 2, 20–25. [Google Scholar]
- Wu, W.; Li, X.; Yang, P.; Xue, J.; Dou, X.; Xu, J.; Wu, G. Spatiotemporal Changes and Driving Forces of Land Use in the Jinghe River Basin from 1992 to 2022. J. Jinan Univ. (Nat. Sci.) 2025, 39, 626–638. [Google Scholar]
- Hu, X.; Xiao, Z.; Cheng, X.; Ju, J. Assessment of Ecological Restoration Degree and Vegetation Restoration Potential in Southwest China Based on Ecogeographical Regionalization. Huan Jing Ke Xue 2025, 1–23, in press. Available online: https://kns.cnki.net/kcms2/article/abstract?v=yqBhao7Q9gzjnYFGMGIsl4dnE7IyJGX46LFGMww8bNUfXQOWqgDOC0wiFop4Ox3_s2oRDaMXMa0FOwas9eLHOBeOGdk_Z0IPVbHj69MkU1OhyPQxmly0GbrZwBP1n4gax2tV1KSaodCT8Jsm4NvboeS0rZDrpTPT4k3UVhIc85ubmJONDBL5ZA==&uniplatform=NZKPT&language=CHS (accessed on 5 January 2026).
- Wang, C.; Pang, Y.; Yuan, Z.; Meng, S.; Yu, T.; Sun, X. Forest Disturbance Monitoring and Analysis on Hainan Island Based on the LandTrendr Algorithm and Forest Inventory Data. Acta Ecol. Sin. 2025, 45, 8054–8070. [Google Scholar]
- Liu, Y. Differential Responses of Vegetation NDVI to Multi-Time-Scale SPEI in Karst and Non-Karst Regions. Acta Ecol. Sin. 2025, 45, 8111–8124. [Google Scholar]
- Carlson, T.N.; Ripley, D.A. On the relation between NDVI, fractional vegetation cover, and leaf area index. Remote Sens. Environ. 1997, 62, 241–252. [Google Scholar] [CrossRef] [Scilit]
- Li, B.; Zhang, A.; Sun, G.; Pan, Z.; Fu, H. Extraction of Typical Vegetation Communities in Poyang Lake Wetland Based on Time-Series Sentinel-2 Imagery. Remote Sens. Technol. Appl. 2024, 39, 1271–1283. [Google Scholar] [CrossRef] [Scilit]
- Camps-Valls, G.; Campos-Taberner, M.; Moreno-Martinez, A.; Walther, S.; Duveiller, G.; Cescatti, A.; Mahecha, M.D.; Munoz-Mari, J.; Garcia-Haro, F.J.; Guanter, L.; et al. A unified vegetation index for quantifying the terrestrial biosphere. Sci. Adv. 2021, 7, 10. [Google Scholar] [CrossRef] [Scilit] [PubMed]
- Wang, Q.; Moreno-Martinez, A.; Munoz-Mari, J.; Campos-Taberner, M.; Camps-Valls, G. Estimation of vegetation traits with kernel NDVI. ISPRS J. Photogramm. Remote Sens. 2023, 195, 408–417. [Google Scholar] [CrossRef] [Scilit]
- Wang, C.; Liu, L.; Zhou, Y.; Liu, X.; Wu, J.; Tan, W.; Xu, C.; Xiong, X. Comparison between satellite derived solar-induced chlorophyll fluorescence, NDVI and kNDVI in detecting water stress for dense vegetation across southern China. Remote Sens. 2024, 16, 1735. [Google Scholar] [CrossRef] [Scilit]
- Wu, Z.; Yao, F.; Ahmad, A.; Deng, F.; Fang, J. Spatiotemporal Evolution and Driving Mechanisms of kNDVI in Different Sections of the Yangtze River Basin Using Multiple Statistical Methods and the PLSPM Model. Remote Sens. 2025, 17, 299. [Google Scholar] [CrossRef] [Scilit]
- Wang, L. Ecological Security Evaluation and Analysis of Cultivated Land in a Mining–Agriculture Composite Area Based on the PSR Model. Master’s Thesis, Henan Polytechnic University, Jiaozuo, China, 2017. [Google Scholar]
- Wang, Z. Extraction of Coal Mining Subsidence Information and Its Spatiotemporal Evolution Based on Multi-Source Remote Sensing Data. Master’s Thesis, Henan Polytechnic University, Jiaozuo, China, 2023. [Google Scholar]
- U.S. Geological Survey. Landsat Collection 2 Level-2 Science Products; U.S. Geological Survey Fact Sheet 2021–3055; U.S. Geological Survey: Reston, VA, USA, 2021. [Google Scholar] [CrossRef] [Scilit]
- Gorelick, N.; Hancher, M.; Dixon, M.; Ilyushchenko, S.; Thau, D.; Moore, R. Google Earth Engine: Planetary-scale geospatial analysis for everyone. Remote Sens. Environ. 2017, 202, 18–27. [Google Scholar] [CrossRef] [Scilit]
- Markham, B.L.; Storey, J.C.; Williams, D.L.; Irons, J.R. Landsat sensor performance: History and current status. IEEE Trans. Geosci. Remote Sens. 2004, 42, 2691–2694. [Google Scholar] [CrossRef] [Scilit]
- Peng, S.Z. China Monthly Mean Temperature Dataset at 1 km Resolution (1901–2024); National Tibetan Plateau/Third Pole Environment Data Center: Beijing, China, 2019. [Google Scholar] [CrossRef]
- Peng, S.Z. High-Spatial-Resolution Monthly Precipitation Dataset over China During 1901–2017; Zenodo: Geneva, Switzerland, 2019. [Google Scholar] [CrossRef]
- Gocic, M.; Trajkovic, S. Analysis of changes in meteorological variables using Mann-Kendall and Sen’s slope estimator statistical tests in Serbia. Glob. Planet. Change 2013, 100, 172–182. [Google Scholar] [CrossRef] [Scilit]
- Yue, S.; Wang, C.Y. The Mann-Kendall test modified by effective sample size to detect trend in serially correlated hydrological series. Water Resour. Manag. 2004, 18, 201–218. [Google Scholar] [CrossRef] [Scilit]
- Sioris, C.E.; Zou, J.; Mcelroy, C.T.; Boone, C.D.; Sheese, P.E.; Bernath, P.F. Water vapour variability in the high-latitude upper troposphere—Part 2: Impact of volcanic eruptions. Atmos. Chem. Phys. 2016, 16, 2207–2219. [Google Scholar] [CrossRef] [Scilit]
- Wang, Y.; Rao, L. Impacts of Climatic Factors and Human Activities on Net Primary Productivity of Vegetation in the Pisha Sandstone Region. Arid. Zone Res. 2023, 40, 1982–1995. [Google Scholar]
- Yan, W.; Chen, Z.; Chen, J.; Zhao, C. Spatiotemporal Patterns of Vegetation Evolution in a Deep Coal Mining Subsidence Area: A Remote Sensing Study of Liangbei, China. Remote Sens. 2024, 16, 3204. [Google Scholar] [CrossRef] [Scilit]
- Li, X. Spatiotemporal Vegetation Dynamics and Climatic Drivers in the Qinshui Coalfield: MODIS-Based Analysis. Acad. J. Sci. Technol. 2025, 15, 91–96. [Google Scholar] [CrossRef] [Scilit]
- Chen, L.; Yin, S.Q.; Ju, L.X.; Zhang, X. Remote Sensing Monitoring of Vegetation Restoration Effects Based on NDVI Time-Series Data in the Muli Coalfield, Qinghai Province. Coal Sci. Technol. 2025, 53, 269–281. [Google Scholar] [CrossRef]
- Yue, S.; Pilon, P.; Phinney, B.; Cavadias, G. The influence of autocorrelation on the ability to detect trend in hydrological series. Hydrol. Process. 2002, 16, 1807–1829. [Google Scholar] [CrossRef] [Scilit]
- Peng, S.; Piao, S.; Ciais, P.; Fang, J.; Wang, X. Change in winter snow depth and its impacts on vegetation in China. Glob. Change Biol. 2010, 16, 3004–3013. [Google Scholar] [CrossRef] [Scilit]
- Zhang, Y.; Song, C.; Band, L.E.; Sun, G.; Li, J. Reanalysis of global terrestrial vegetation trends from MODIS products. Remote Sens. Environ. 2017, 191, 145–155. [Google Scholar] [CrossRef] [Scilit]
- Jia, Z. Spatiotemporal Characteristics and Driving Factors of Vegetation Coverage in Typical Mining Areas of Shanxi Province. Master’s Thesis, Shanxi Agricultural University, Jinzhong, China, 2018. [Google Scholar]
- Yang, Z. Research on Green Mine Construction Models Under the Transformation of Resource-Based Cities. Master’s Thesis, Anhui Agricultural University, Hefei, China, 2018. [Google Scholar]
- Zhang, J.; Zhang, C.; Bao, Z.; Li, M.; Wang, G.; Guan, X.; Liu, C. Impacts of Vegetation Cover Change on Runoff in the Huang–Huai–Hai River Basin. Adv. Water Sci. 2021, 32, 813–823. [Google Scholar]
- Lei, P.; Li, Q.; Yang, Q.; Yan, B. Ecological and Geological Environmental Risk Assessment of Coal Mining Areas. Northwest Hydropower 2025, 2, 18–24. [Google Scholar]
- Wang, Z.; Niu, Q.; Wang, G.; Cheng, X.; Shao, D. Monitoring of Vegetation Dynamic Changes and Driving Factors on the Loess Plateau of Gansu Province. Geomat. Sci. Technol. 2025, 50, 151–166. [Google Scholar]
- Liu, X.; Wang, Z.; Liu, T.; Wang, W.; Yang, Y.; Wang, W. Influencing Factors of Coordinated Coal–Water Co-Exploitation in Coal Resource-Enriched Areas. Coal Sci. Technol. 2024, 52, 162–174. [Google Scholar]
- Chen, L.; Li, Z.; Zhang, C.; Fu, X.; Ma, J.; Zhou, M.; Peng, J. Spatiotemporal changes of vegetation in the northern foothills of Qinling Mountains based on kNDVI considering climate time-lag effects and human activities. Environ. Res. 2025, 270, 15. [Google Scholar] [CrossRef] [Scilit] [PubMed]
- Ren, X.; Hou, P.; Ma, Y.; Ma, R.; Wang, J.; Xie, L. Analysis of Vegetation Changes and Driving Factors on the Qinghai–Tibet Plateau from 2000 to 2022. Forests 2024, 15, 2188. [Google Scholar] [CrossRef] [Scilit]
- Zhang, Q.; Cao, G.; Zhao, M.; Zhang, Y. kNDVI spatiotemporal variations and climate lag on the southern slope of the Qilian Mountains: Sen–Mann–Kendall and Hurst index analyses for ecological insights. Forests 2025, 16, 307. [Google Scholar] [CrossRef] [Scilit]
- Yu, H.; Yang, Q.; Jiang, S.; Zhan, B.; Zhan, C. Detection and attribution of vegetation dynamics in the Yellow River Basin based on long-term kernel NDVI data. Remote Sens. 2024, 16, 1280. [Google Scholar] [CrossRef] [Scilit]
- Liu, T.; Zhang, Q.; Li, T.; Zhang, K.; Numata, I. Dynamic vegetation responses to climate and land use changes over the Inner Mongolia reach of the Yellow River Basin, China. Remote Sens. 2023, 15, 3531. [Google Scholar] [CrossRef] [Scilit]

Disclaimer/Publisher’s Note: The statements, opinions and data contained in all publications are solely those of the individual author(s) and contributor(s) and not of MDPI and/or the editor(s). MDPI and/or the editor(s) disclaim responsibility for any injury to people or property resulting from any ideas, methods, instructions or products referred to in the content. |
© 2026 by the authors. Licensee MDPI, Basel, Switzerland. This article is an open access article distributed under the terms and conditions of the Creative Commons Attribution (CC BY) license.