


Abstract
One of the major issues in the energy intensive industries (EIIs) operation is corrosion control. Particularly, in refineries, corrosion causes 33% of malfunctions, especially due to the deterioration of the metallic materials and, therefore, the shortening of the useful life of equipment and installations. To face this problem, novel polymer-derived ceramic (PDC) coatings have been formulated, developed and characterized by physical and chemical tests. Different formulations were analyzed on a lab-scale through accelerated corrosion tests under acidic environments using electrochemical impedance spectroscopy (EIS) to evaluate their corrosion performance when exposed to near-real operating conditions. The optimized formulation will be used as a barrier in stainless-steel pipelines to improve the energy performance of EIIs by reducing energy losses due to excess cooling of components, maximizing the thermal efficiency of equipment, increasing the service life of equipment and reducing operation and maintenance (O&M) costs and downtime.
1. Introduction
The refining industry is the third-largest source of global greenhouse gas (GHG) emissions from stationary sources, so it is at the forefront of the energy transition and net zero pathways. Globally, cumulative GHG emissions from refineries reached approximately 34.1 Gt in the period 2000–2021, with an average annual increase rate of 0.7% [1]. In total, oil refineries contributed 3% to global CO2 emissions in the year 2022 [2], equating to approximately 1.3 Gt CO2. Under current technical specifications, globally, refineries will cumulatively emit 16.5 Gt of CO2 during 2020–2030 [3].
According to the European Green Deal [4], industries must contribute towards the targets set by the EU, such as 20% primary energy savings and reducing GHG emissions by 80–95% by 2050. Therefore, a cost-effective emission mitigation strategy needs to be developed for refineries to be operable in a net-zero society.
One of the major issues in refinery operation is corrosion control. The cost of corrosion to the global economy is estimated to be over USD 2.5 trillion each year, according to NACE. This includes the cost of repairs, maintenance, and replacement of corroded infrastructure and equipment. Not only does corrosion pose significant safety and environmental risks, including pipeline leaks and chemical spills, but it also has a massive impact on global CO2 emissions. As much as 40% of all new steel is used to replace steel that has been damaged by corrosion, contributing to about 3.2% of the world’s CO2 emissions just in O&M activities. Particularly, in oil refineries, corrosion causes 33% of malfunctions [1], especially due to the deterioration of the metallic materials and, therefore, the shortening of the useful life of equipment and installations.
Different types of corrosion can occur at any time and in various segments of petroleum refineries depending on the interaction between the material and the environment, causing disruptions in refinery operations such as unplanned shutdowns, leaks, and product losses. If proper mitigation methods are not used, it is common to find general and/or localized pitting corrosion, hydrogen-induced cracking, erosion-corrosion, microbiologically influenced corrosion, stress corrosion cracking, corrosion fatigue, high-temperature corrosion and/or corrosion under insulation throughout the refinery equipment. Therefore, to protect the integrity of the processing units and avoid product losses, corrosion phenomena must be controlled.
Because of its operating environment, the continuous catalytic regeneration (CCR) unit is one of the components most affected by acidic corrosion. This unit converts naphtha into high-octane reformate for use in final product blends, thanks to the Pt-based spherical catalyst. The CCR unit needs chloride injections to maintain dispersion of the catalyst during regeneration; therefore, a caustic agent is required to remove chloride in the vent gas. The non-neutralized chloride ions cause dew corrosion on the metal surface. This corrosion process promotes a significant reduction in wall thickness, therefore increasing stress and causing premature creep ruptures. It also significantly decreases the lifetime of installations, causing failures of equipment (such as pumps) and reducing the efficiency of the production plant.
In this scenario, it is critical to protect metallic equipment from corrosion by using mitigation methods, which should be incorporated into the refinery’s engineering design as described in [5]. To improve the energy performance of refineries, the introduction of innovative high-performance materials is beneficial. These materials can enable equipment and components to perform longer under harsh operating conditions, improving productivity and avoiding downtime, reducing shutdowns for maintenance and repair operations (O&M) and thus improving the overall performance and efficiency of the plant.
Currently, there is demand for new coatings that can withstand the harsh environment found in oil refineries by controlling electrochemistry or forming a barrier between the metal surface and the hostile environment. They can be used to provide resistance to heat, erosion, pitting, and general wear. The development of smart coatings will provide several benefits to refineries because they can respond to changes in pH, temperature, erosion processes and other important factors that are essential for corrosion mitigation. Coatings may be prepared from polymers, metals, ceramics or glass [6]. Ultimately, the choice of coating material will depend on the desired properties, environmental conditions during application and processing, compatibility with the substrate material and processing costs. Ceramic-based coatings have higher thermal stability and better chemical resistance over their organic counterparts [7,8,9,10]. Organosilicon-based polymers can be converted into Si-based ceramics upon thermal, chemical or radioactive treatment. They are known as pre-ceramic polymers, and their derived ceramics upon conversion are the so-called polymer-derived ceramics (PDCs). To be efficiently processed as coatings, their shrinkage upon conversion must be counterbalanced by the addition of passive and/or active fillers. The role of fillers is not limited to thermomechanical effects but can also be for functionalization of the coatings, such as thermal conductivity, chemical inertness or enhancement of mechanical properties [11].
One of the principal advantages of the PDC route is that the precursors (along with fillers) can be processed—prior conversion—by the usual polymer-shaping processes such as spin coating, spray, and tape casting, among others. Thus, this method is cost-effective compared to state-of-the-art ceramic coating routes such as physical vapor deposition (PVD), chemical vapor deposition (CVD), thermal spray or sol–gel [12,13].
Ceramic coatings are highly effective in protecting against corrosion, even in aggressive environments and at high temperatures [8]. Their properties, including chemical composition, density, thickness, and homogeneity, can be adjusted at the molecular level through the selection of precursors, heat treatment, and application methods. For the described use case, the optimum composition, heat conversion, and application are sought. With this objective, the morphology and adhesion of the coatings are studied, together with their corrosion behavior under acidic conditions. It should be noted that the aim is not to provide a completely impermeable barrier, but rather to slow down corrosion and delay damage compared to the bare material. The ability to analyze coatings in situ and to track failures makes conventional and localized electrochemical techniques an excellent choice among researchers. The wide applicability of electrochemical tests in this field is based on the fast measurements obtained with relatively simple instrumentation. The most commonly used corrosion tests include open circuit potential determination, linear polarization resistance, cyclic voltammetry and electrochemical impedance spectroscopy (EIS) [13,14,15]. These are normally combined with the robustness and simplicity of weight loss results and microscopic characterization.
The EIS technique presents several advantages over accelerated tests and other electrochemical measurements. Being a non-destructive technique, EIS allows easy comparison of different samples under the same conditions and provides quantitative information about charge transfer resistance and double-layer capacitance. Moreover, EIS can monitor the coating’s degradation and its passivation by self-healing. EIS data are commonly analyzed by fitting them to an equivalent electrical circuit (EEC) model consisting of passive elements that do not generate current or potential, such as resistors, capacitors and inductors. The literature proposes different models to interpret the impedance data [16,17,18]; however, to be useful, the elements in the model should have a physical meaning in the electrochemistry of the system.
2. Experimental Section
2.1. Materials and Solutions
Stainless steel (AlSI 321) coupons of 5 × 5 cm2 were coated with different PDC coating formulations and submitted to no (crude), crosslinking (CL) or pyrolysis (P) processing, respectively, at 200 °C under air for 1 h, or at 700 °C under argon for 1 h.
PDC formulations were obtained from Silres MK polysilsesquioxane polymer, which consists of a silicon methyl resin. This thermally curable polymer is often used as a binder or as an impregnation agent for porous materials and as an 82 wt.% yield upon ceramic conversion. The polymeric base is mixed with different ceramic and glass additives (Table 1).
Table 1.
Precursors, powders and solvents used in the coating formulations.
The first series of specimens was coated using a tape casting apparatus (Doctor Blade), with the blade height set to 100 µm relative to the substrate. This method was employed to conduct a preliminary assessment of the formulations and to investigate the effects of crosslinking and annealing on corrosion resistance. Coating thicknesses were measured at five control points using a thickness gauge.
The preparation of the formulations followed a standardized procedure. All precursors and fillers were individually weighed according to the ratios specified in Table 2. The preceramic polymer was first dissolved in 80% of the total solvent volume under mechanical stirring. Subsequently, the powder fillers—BN combined with CSP2/2 or SiC—were gradually added to the solution while maintaining agitation. In the final step, the remaining solvent was incorporated. Prior to application, the mixture was subjected to ultrasonic stirring to ensure homogeneous dispersion of the fillers.
Table 2.
Volume percentage (%vol) of compounds in the formulations and in the dried coatings (%vol dry). The following densities of the products are used for conversion: Silres MK: 1.33, Diestone: 0.8, SiC: 3.21, CSP2/2: 3.22, BN: 2.25.
The quantities of precursors were calculated to achieve a filler content of 51 vol.% SiC in the dried coatings of formulations F1 and F1′, and 30 vol.% CSP2/2 combined with 9 vol.% BN in formulation F2. Notably, F1′ was a diluted version of F1, intended exclusively for spray coating applications, and contained 16% more solvent. However, the dry compositions of both F1 and F1′ remained identical. The complete nomenclature of the formulations is provided in Table 3.
Table 3.
Sample types for tape casting coatings: 1F1CLP (1: deposition method, 1 = tape casting, 2 = spray coating), FX: Formulation used followed by the annealing type: D: Dried, CL: Crosslinking at 200 °C for 1 h under air, P: annealing at 700 °C under Ar for 1 h.
A second series of samples was then elaborated with an industrial robot arm equipped with a 360° spray gun. Coupons were placed on the inner wall of a 200 mm diameter tube. The spray gun deposition parameters were kept constant at 300 L/min of air flow and robot speed of 50 mm/s, and the flow rate and number of layers were adjusted to obtain the desired thickness. Following the same terminology, the nomenclature is depicted in Table 4.
Table 4.
Sample types and spray parameters. Nomenclature is the following 1F1CLP (1: deposition method, 1 = tape casting, 2 = spray coating), FX: Formulation used followed by the annealing type: D: Dried, CL: Crosslinking at 200 °C for 1 h under air, P: annealing at 700 °C under Ar for 1 h.
After deposition, all samples were submitted to crosslinking, which consisted of heating at 200 °C in air. Additionally, sample 2F1CLP was also submitted to pyrolysis, by applying 700 °C in Ar atmosphere for 1 h. The samples in the second batch were coated using a combination of the original formulation and a more diluted version (with increased solvent content), while also introducing variations in material flow and the number of layers.
2.2. Electrochemical Study
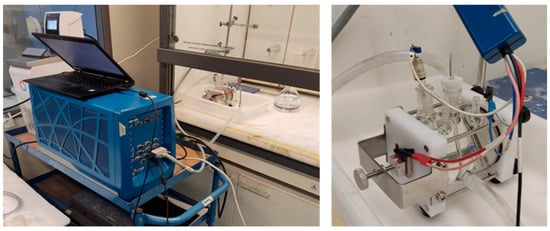
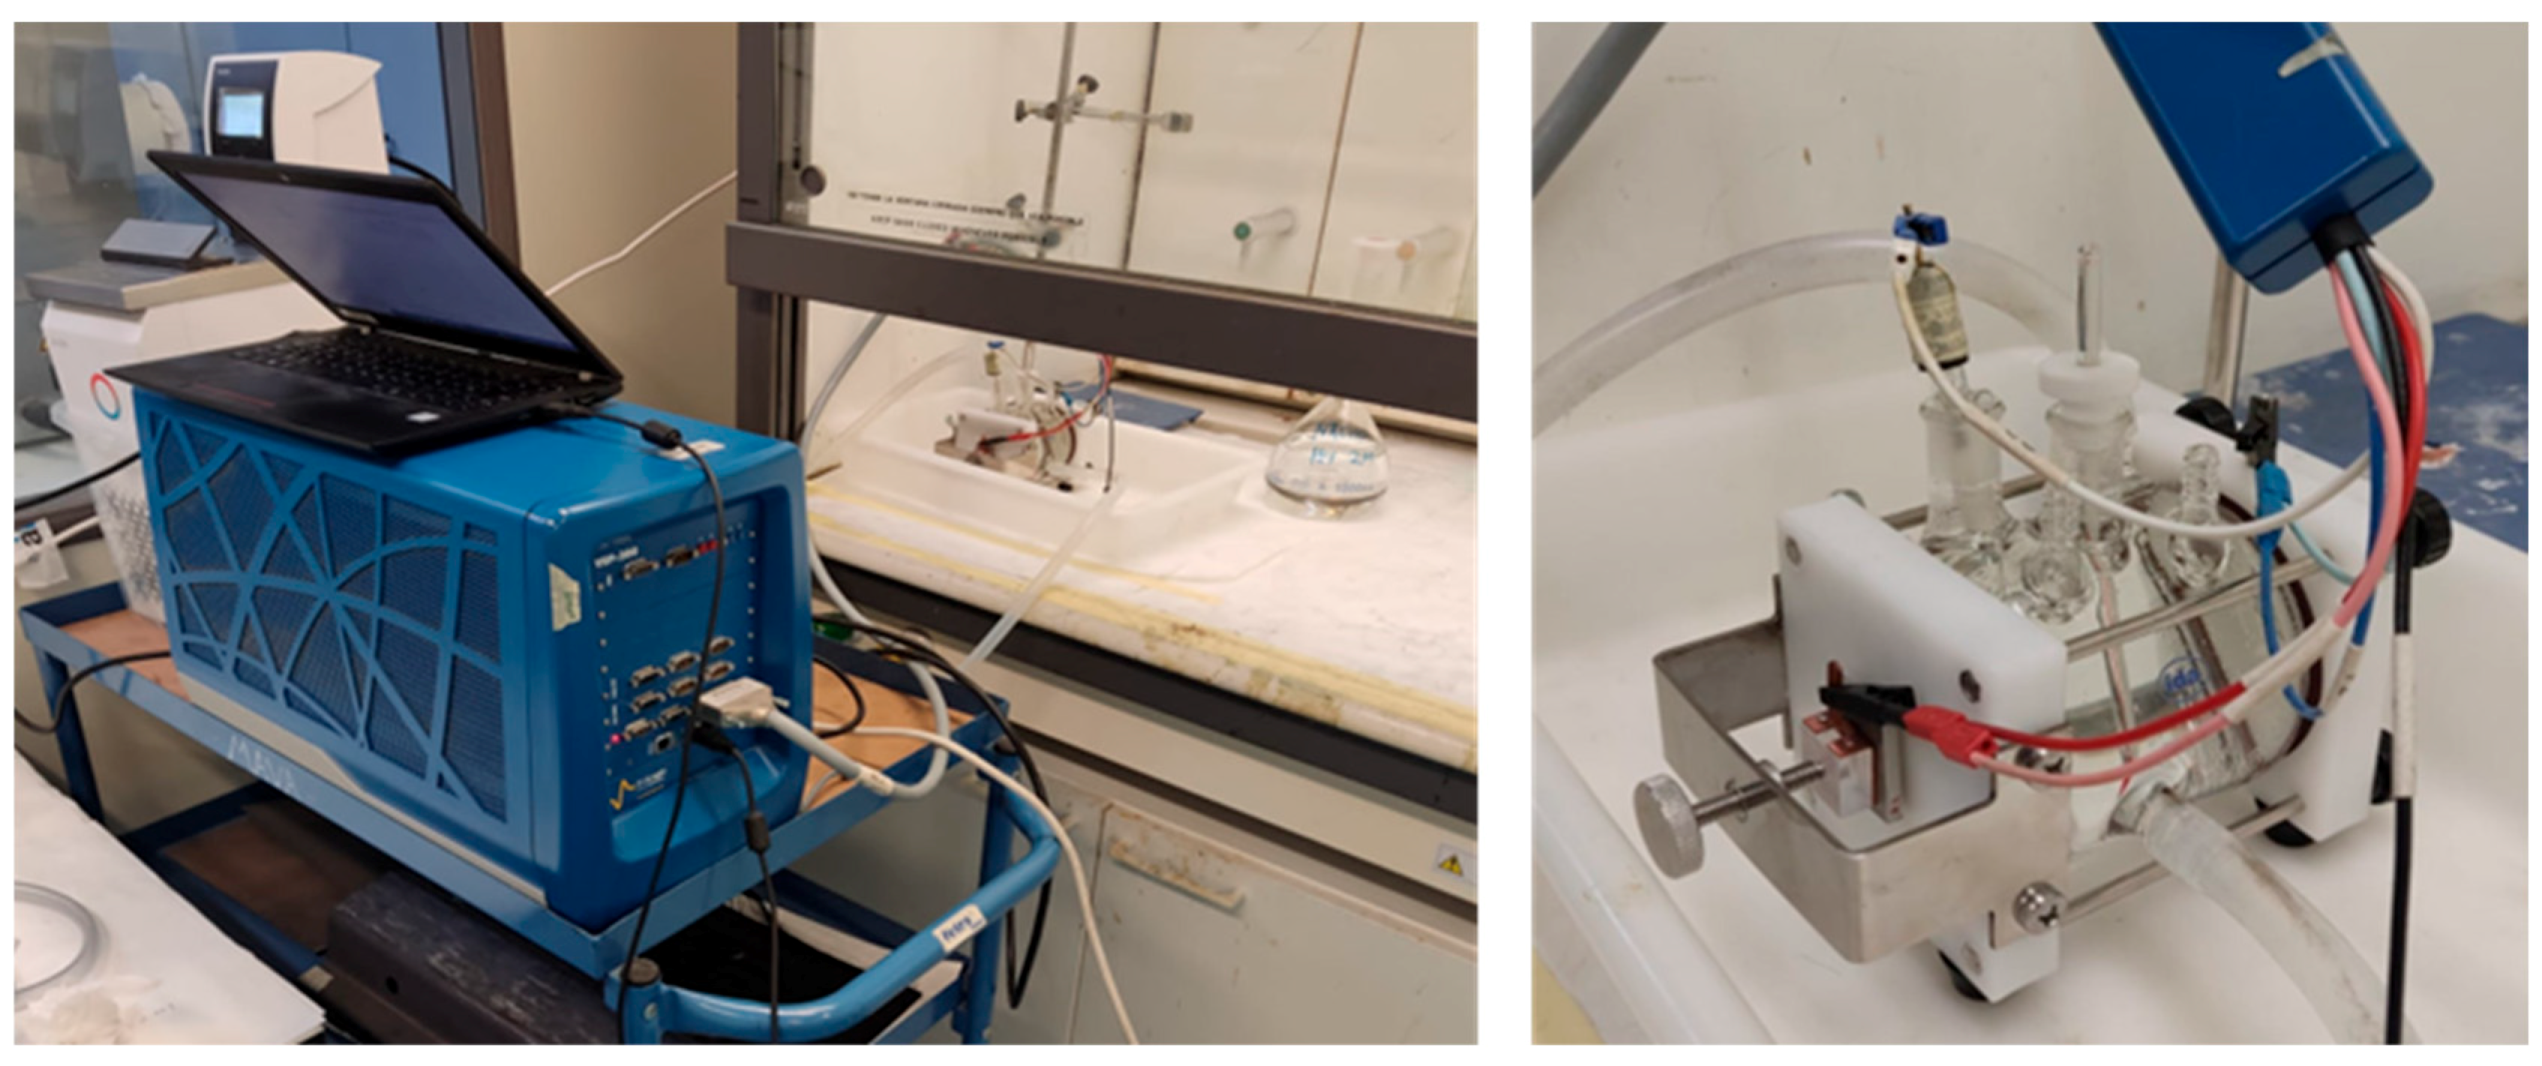
The electrochemical tests were performed using a Biologic VSP-300 potentiostat. EIS measurements were conducted using a thermostatic 3-electrode cell, shown in Figure 1. The working electrode was the PDC-coated sample (exposed area of 1 cm2), a platinum mesh was used as a counter electrode, and the reference electrode was a saturated calomel electrode (SCE) with an E0 of 0.24 V vs. SHE (standard hydrogen electrode).
Figure 1.
Experimental setup for the coating characterization, consisting of VSP-300 potentiostat (left) and a thermostatic electrochemical cell (right).
The sample was exposed to an acidic solution (HCl, 2 mol/L) at a temperature of 60 °C. These parameters were selected to simulate the real operating conditions at the refinery.
Periodic EIS data were recorded in potentiostatic mode at 0, 2, 4, 8, 12, 16, 24, 36, 48, 72, and 96 h, with a sweeping frequency range between 10 kHz and 0.01 Hz and a signal amplitude between 20 and 50 mV r.m.s., as reported in previous works [19,20]. This relatively high amplitude range was selected according to the nature of the coating. It is reported [21] that these types of high-resistant coatings need high AC perturbations to reduce fluctuations during EIS measurements. All the experimental spectra were fitted and simulated with a SIMPLEX-based software application, RELAXIS® (version 3.0.18.15, rhd-instruments 2013–2024, Darmstadt, Germany).
All measurements were performed in triplicate, to assure the reproducibility of the results obtained.
Corrosion rate as Rp values was obtained by fitting the Nyquist spectra. Additionally, microscopic characterization and gravimetric tests (based on ASTM D2688-05 standard) were also performed on each tested coupon. Weight loss provides the means to calculate the average corrosion rate as penetration rate (mm/year).
3. Results
Electrochemical Results
Electrochemical impedance measurements were performed in order to assess the electrochemical behavior of PDC-coated AISI 321 in non-contaminated and HCl-contaminated media (pH = 2.0) up to 48 h of immersion.
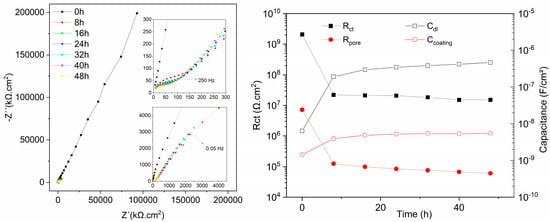
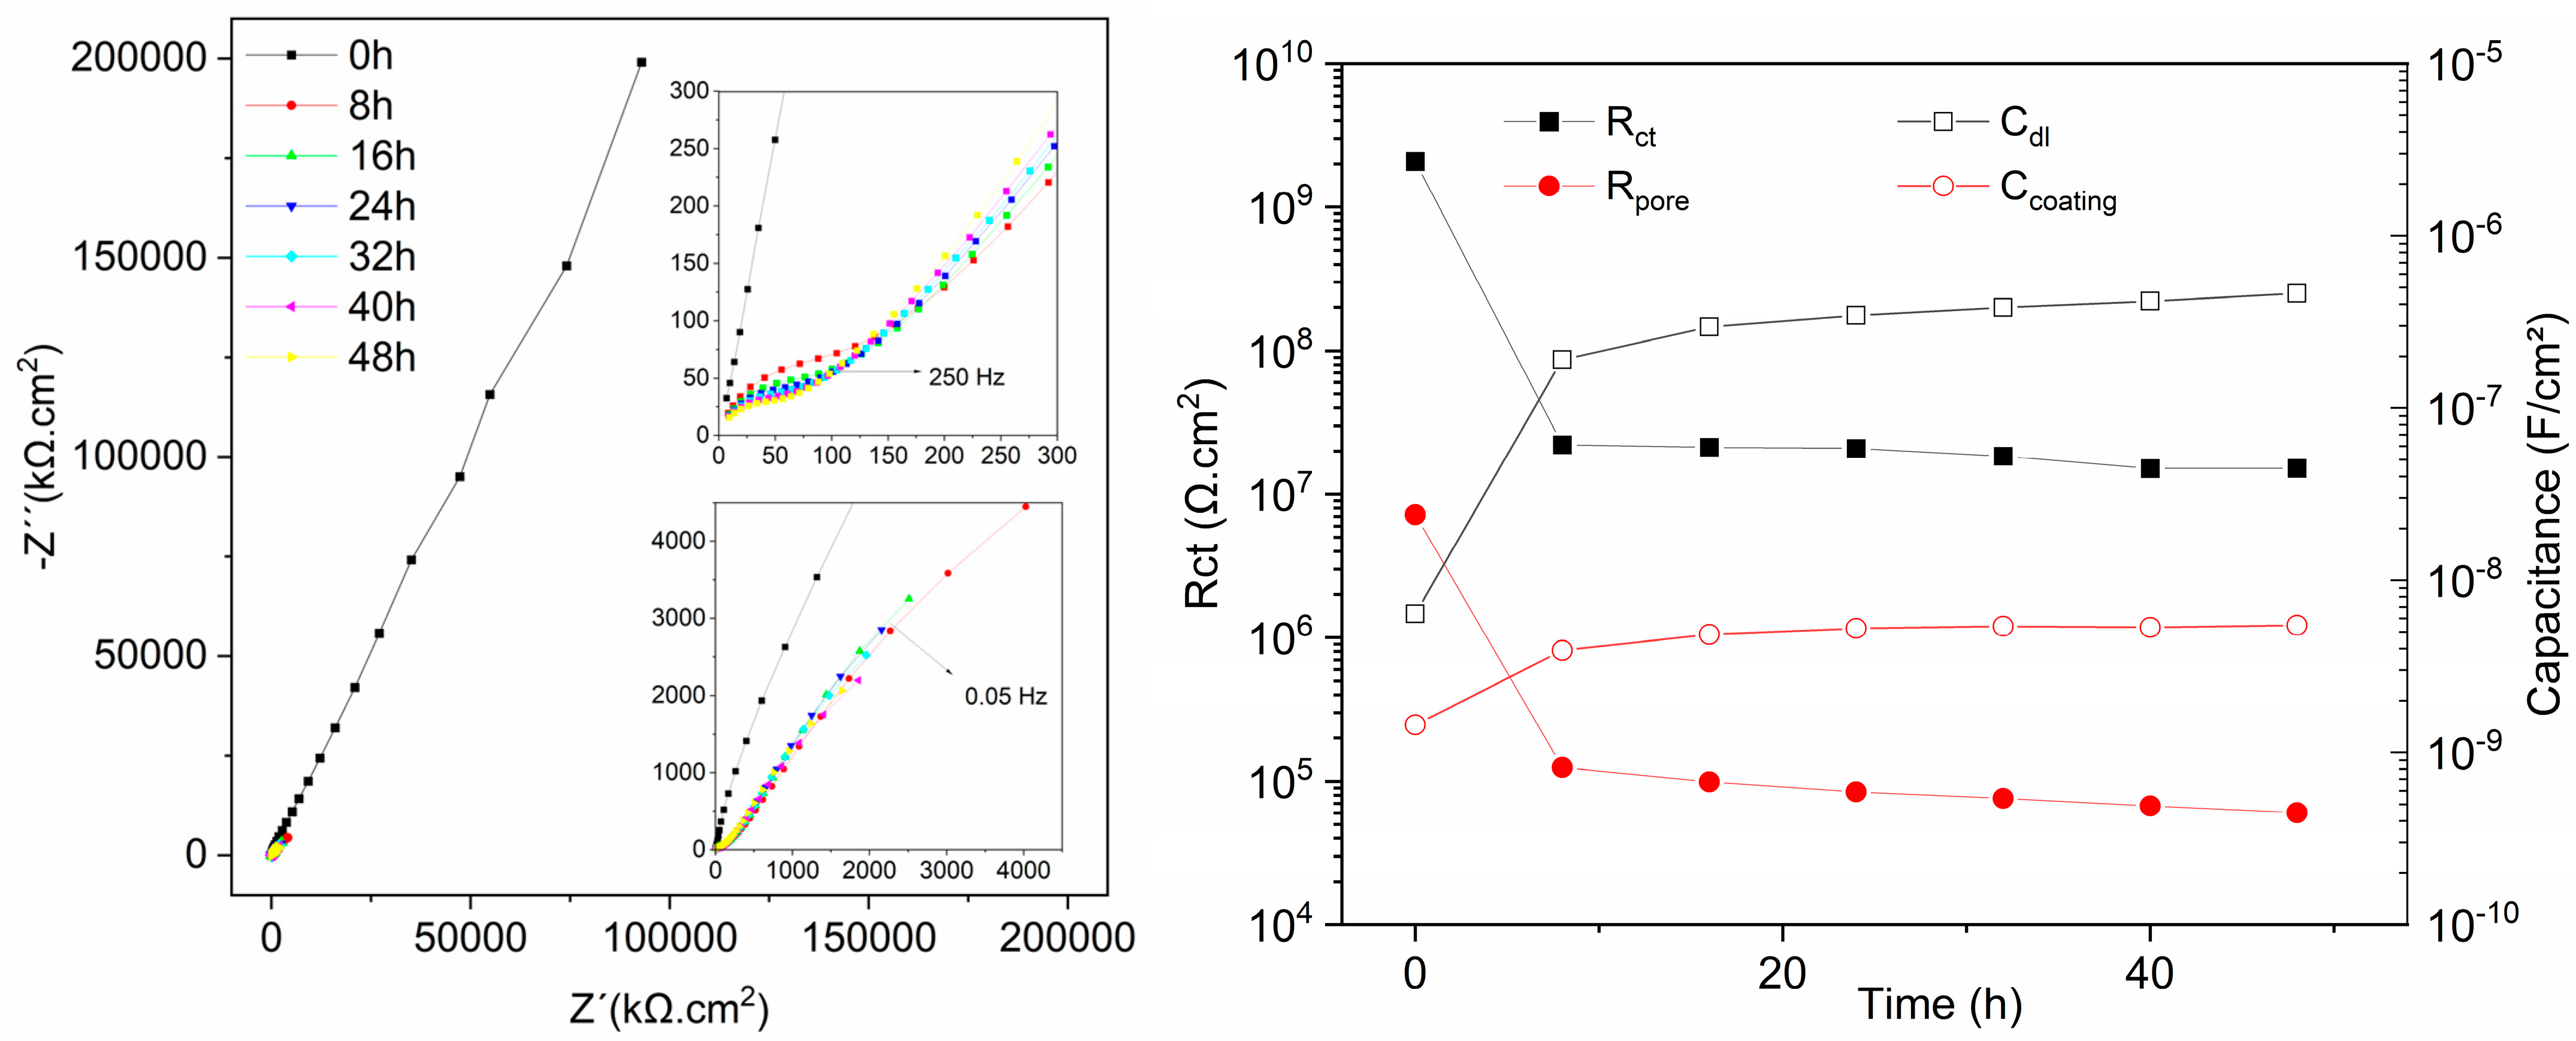
Initially, the performance of the PDC coatings corresponding to batch 1 and 2 (Table 3 and Table 4) was evaluated by EIS tests conducted in a non-corrosive electrolyte. Figure 2 presents the Nyquist plots obtained for the 2F1CL sample after 48 h of exposure in tap water. The results revealed purely capacitive behavior, indicating low permeability of the coating and, in general, excellent barrier properties of the coatings in this medium, acting as an almost perfect capacitor.
Figure 2.
Nyquist diagrams of 2F1CL exposed to water for 48 h (left) and evolution of the EEC fitted parameters through 48 h of test (right).
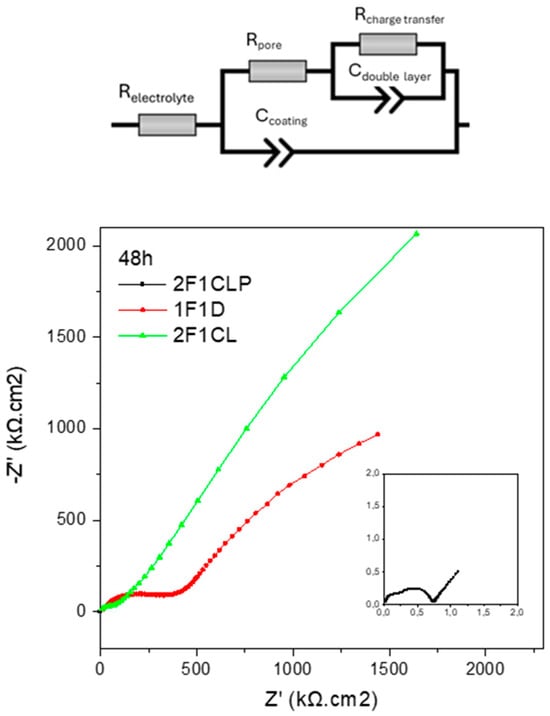
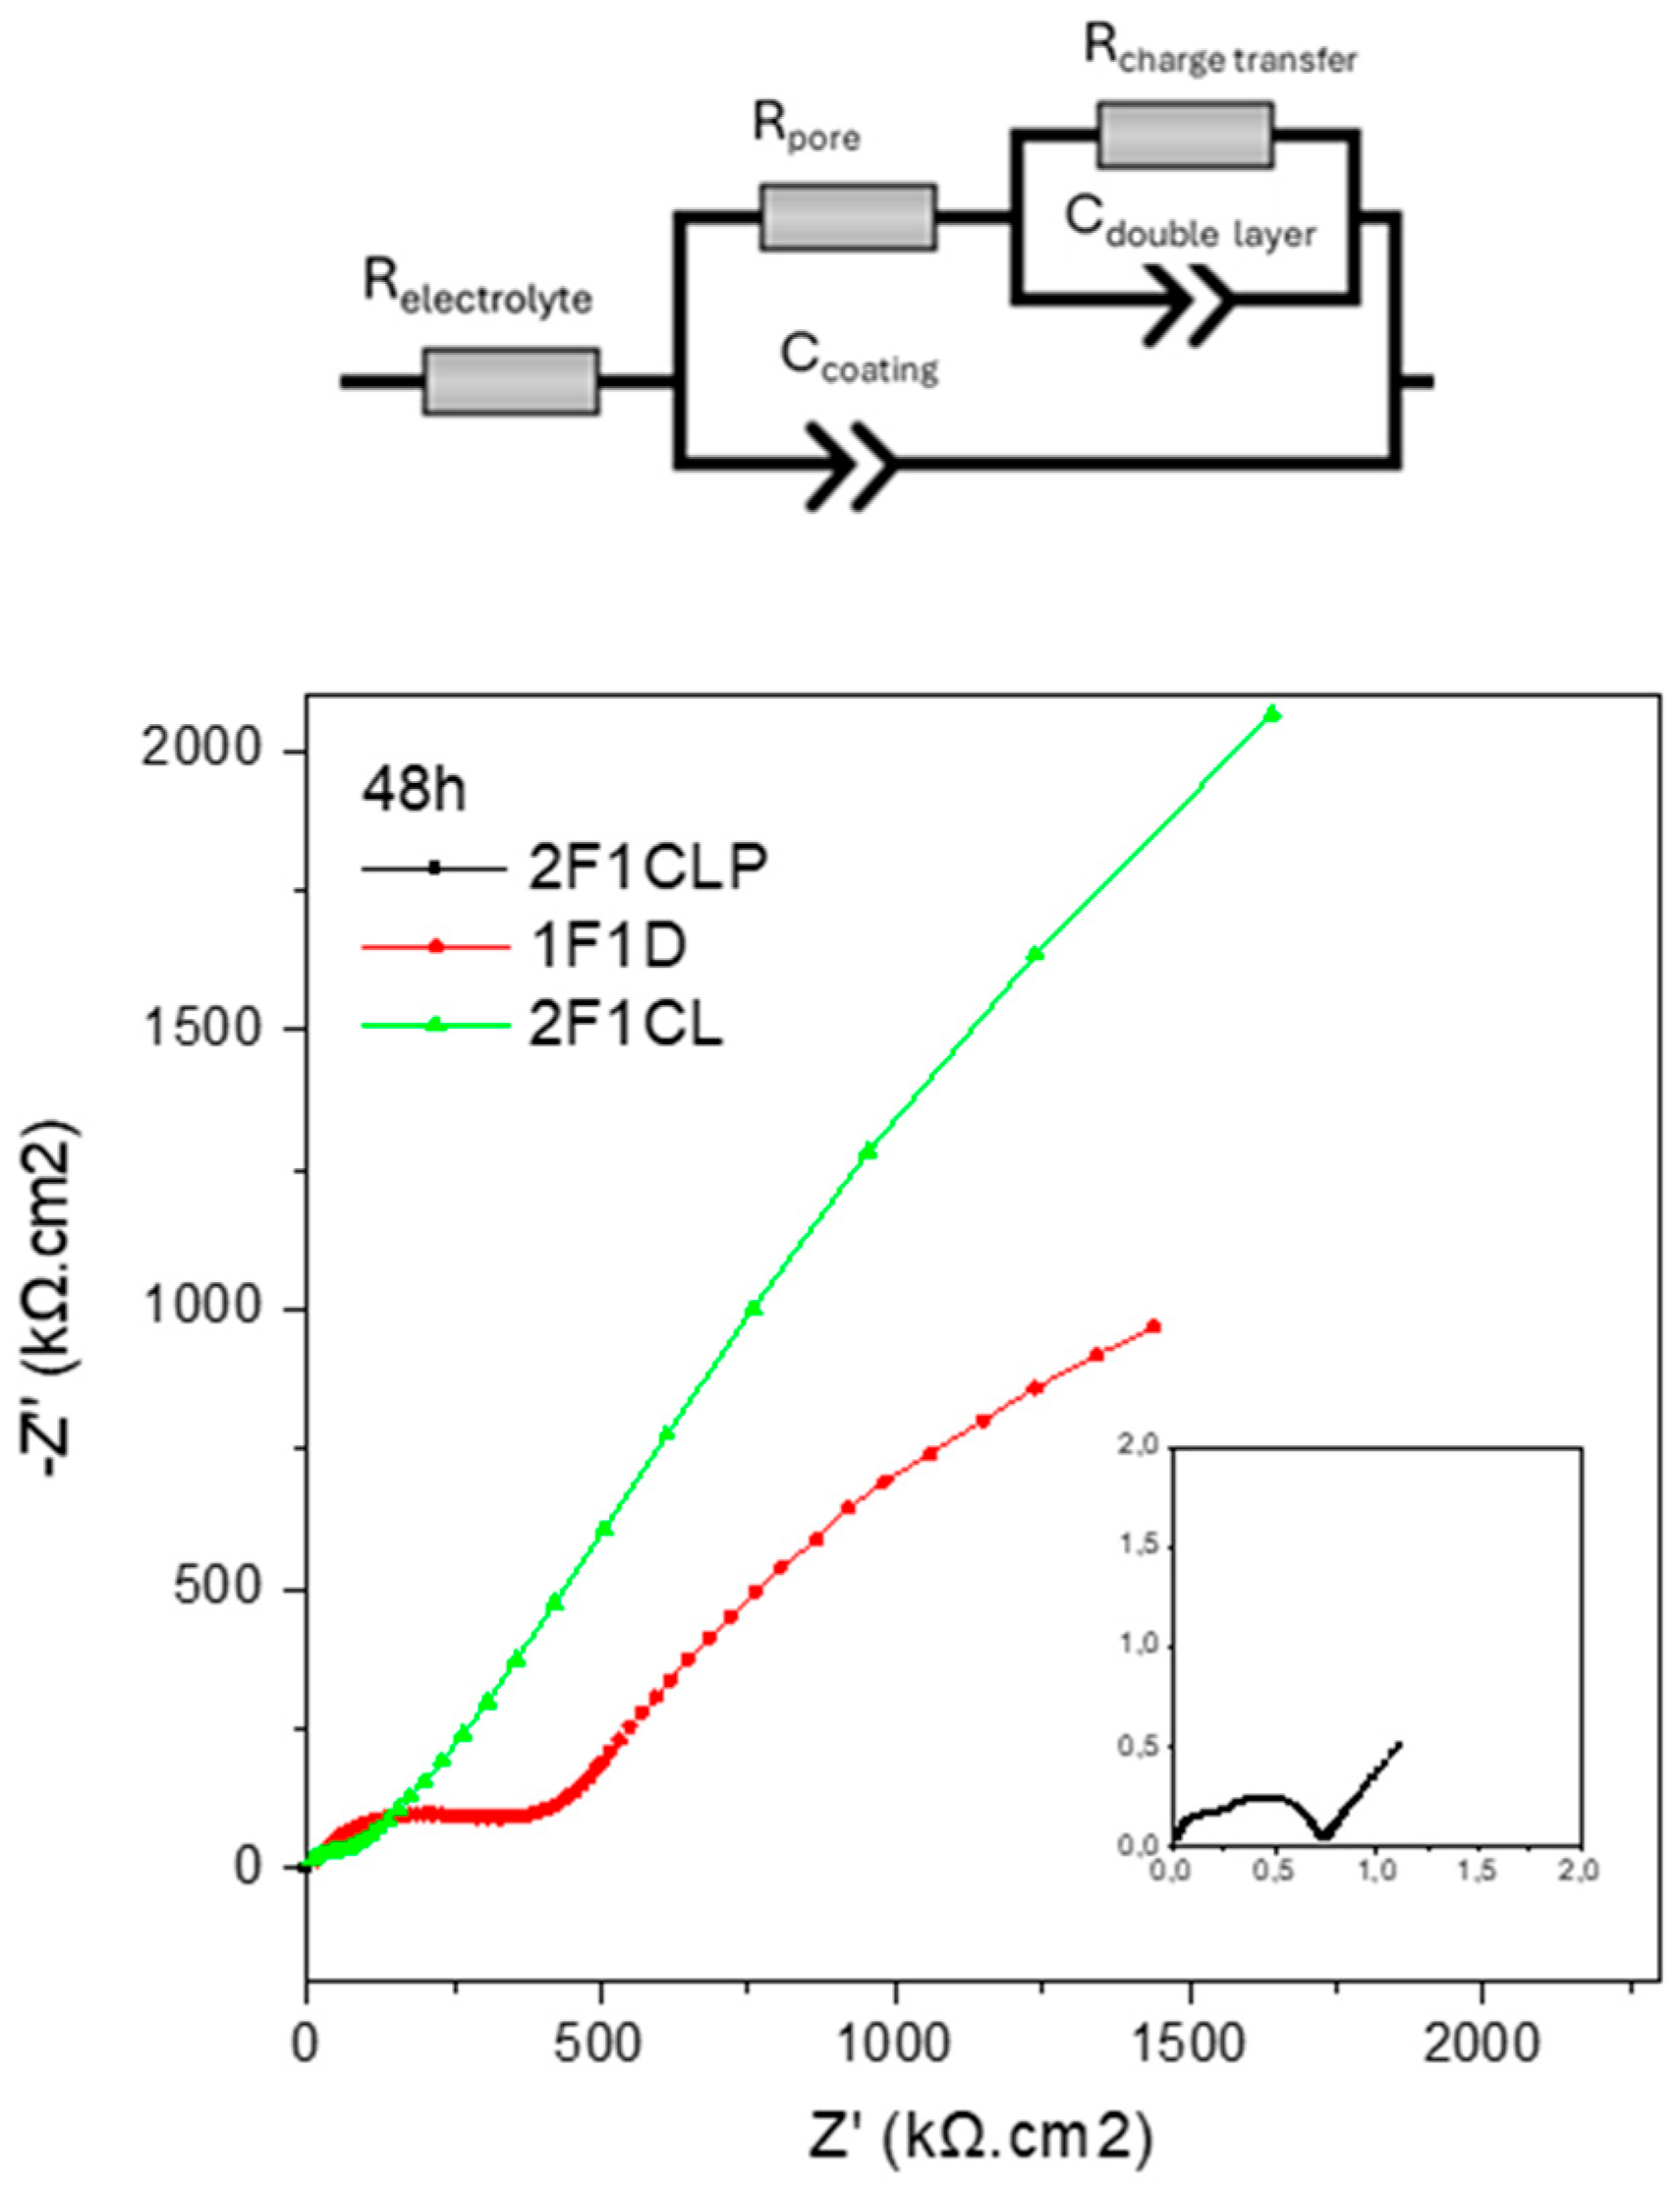
Nyquist spectra for an undamaged coating provided limited information; however, to enable a more detailed analysis and deeper discussion, EIS data were fitted using electrical equivalent circuits (EECs). The evolution of EIS plots with time revealed the presence of two time constants, particularly evident after 8 h of immersion. Thus, the equivalent circuit adopted in this case consisted of a hierarchically distributed configuration of elements (Figure 3, top) according to the impedance function given in Equation 1. Identical trends were found in other tested samples, as will be discussed later.
Figure 3.
Nyquist plot of the three samples tested in water after 48 h (bottom) and EEC circuit used for its fitting (top).
This circuit has been reported in previous works as a possible circuit to model the behavior of stainless steels in neutral/alkaline media; however, different interpretations have been proposed for the circuit elements [22,23]. Based on those previous references of the group, in the present work, the following physical explanation was adopted: the high-frequency time constant (Rpore, Ccoating) is associated with the areas covered by the protective coating layer and can be fitted with an Rpore (related to the coating resistance) in parallel to a Ccoating (coating capacitance). The low-frequency time constant (Rp, Cdl) is correlated with the active surface area (coating defects/pores), and it is represented by the charge transfer resistance (Rct), which describes the corrosion rate of the metal substrate beneath the coating, and Cdl, the double-layer capacitance. Fitting of all capacitance elements was performed by using constant phase elements (CPEs), in order to account for the non-ideal capacitive behavior arising from coating heterogeneity, surface roughness, and non-uniform current distribution, which are typical of real coating systems.
The resistance that appears at very high frequencies corresponds to the ohmic resistance of the solution (Re), which slightly changes with immersion time.
The evolution of the fitted capacitance parameters shown in Figure 2 (right) reveals progressive water penetration into the PDC coating during immersion. The coating capacitance (Ccoating) increases over time, which is attributed to an increase in the effective dielectric constant resulting from electrolyte uptake and the presence of accessible porosity within the coating structure. This trend indicates a gradual deterioration of the barrier properties, rather than fully impermeable behavior.
The double-layer capacitance (Cdl) exhibits a rapid increase during the initial hours of exposure, followed by a stabilization stage. As Cdl is associated with the electrochemically active surface area, this behavior suggests early wetting of the coating–substrate interface through defects or pores, without evidence of extensive coating failure under the tested conditions. For a more detailed explanation of the parameter’s evolution, the Brasher–Kingsbury equation (Equation (2)) can provide a convenient estimation of water uptake during this exposition:
where Ct is the coating capacitance at time t (48 h), C0 is the initial coating capacitance, and Ø (%) is the water volume fraction in the coating. εw is the relative permittivity of water.
The calculated water uptake (42%) obeys a first diffusion step (first 24 h), followed by a second step corresponding to a saturation plateau reached after 48 h. These values suggest that the coating exhibits a certain degree of porosity likely associated with an inefficient crosslinking which led to a looser structure that facilitates water penetration and, subsequently, probably a swelling of the material. When water is absorbed into the coating, the dielectric constant of the coating increases, and this change results in an increase in the Ccoating (Figure 2, Table 5). Conversely, the coating becomes more conductive, as water uptake enhances ionic mobility within the PDC network, progressively altering its microstructure. This process leads to a decrease in pore resistance (Rpore), since the absorbed water fills and connects existing voids, thereby facilitating charge transport and accelerating the loss of barrier properties.
Table 5.
EEC fitted parameters of the 2F1CL sample during 48 h of test in water.
In the case of the low-frequency time constant, Rct drops by two orders of magnitude, from 109 Ωcm2 during the first stages to a stable value of 107 Ωcm2. In contrast, Cdl evolves inversely and presents an abrupt increment of similar magnitude within the first 8 h. Since Cdl is directly connected with the electrochemically active surface area, this variation reflects changes in accessible surface. Thus, considering the good protective character of the PDC coating and the low corrosiveness of the media, this evolution is most likely related to the initial water uptake by the coating during the early stages of the exposure. This process does not alter the Nyquist plot’s shape but is manifested in the evolution of Rct and Cdl, as shown in Figure 2 and Table 5.
The same trend was observed across the other samples analyzed; however, some treatment-related differences became discernible after 48 h. The most significant differences appear in the resistance values (Table 6), which decrease considerably with the additional post-treatments applied to the samples. A remarkable case is sample 2F1CLP, treated with crosslinking and annealing at 700 °C, which shows a significant drop in both Rpore, already suggesting a reduced protective character of the coating, and Rp, further supporting the hypothesis of increased coating permeability and, consequently, lower resistance to corrosion processes under aggressive environments.
Table 6.
EEC fitted parameters of the three samples tested in water after 48 h.
Figure 3 and Table 6 depict the equivalent circuit used for fitting and the evolution of the fitted values obtained for those parameters as a function of the immersion time. The high-frequency resistance (Rpore) presents a monotonous decrease with time but on the order of 105 Ωcm2, suggesting that the protective characteristics of the coating hardly change during this period. In opposition, the Ccoating increases by one order of magnitude.
Following the preliminary evaluation of the coatings in tap water, the formulations of Series 1 (1F1D, 1F2D, 1F2CL, and 1F2CLP) were exposed to an acidic environment to assess their performance under corrosive conditions comparable to those found in refineries. For the initial screening of the different formulations, measurements were carried out in triplicate.
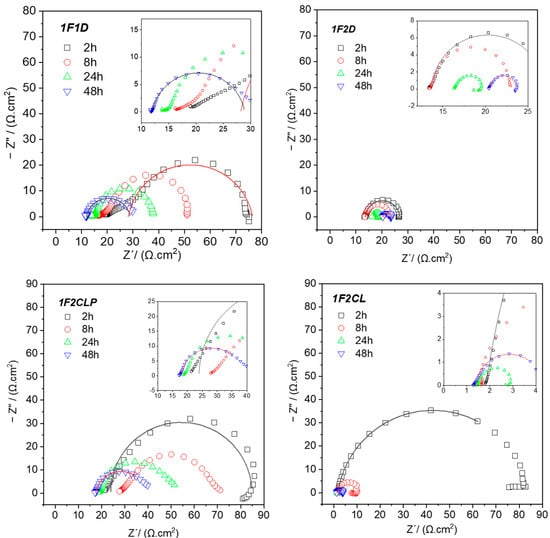
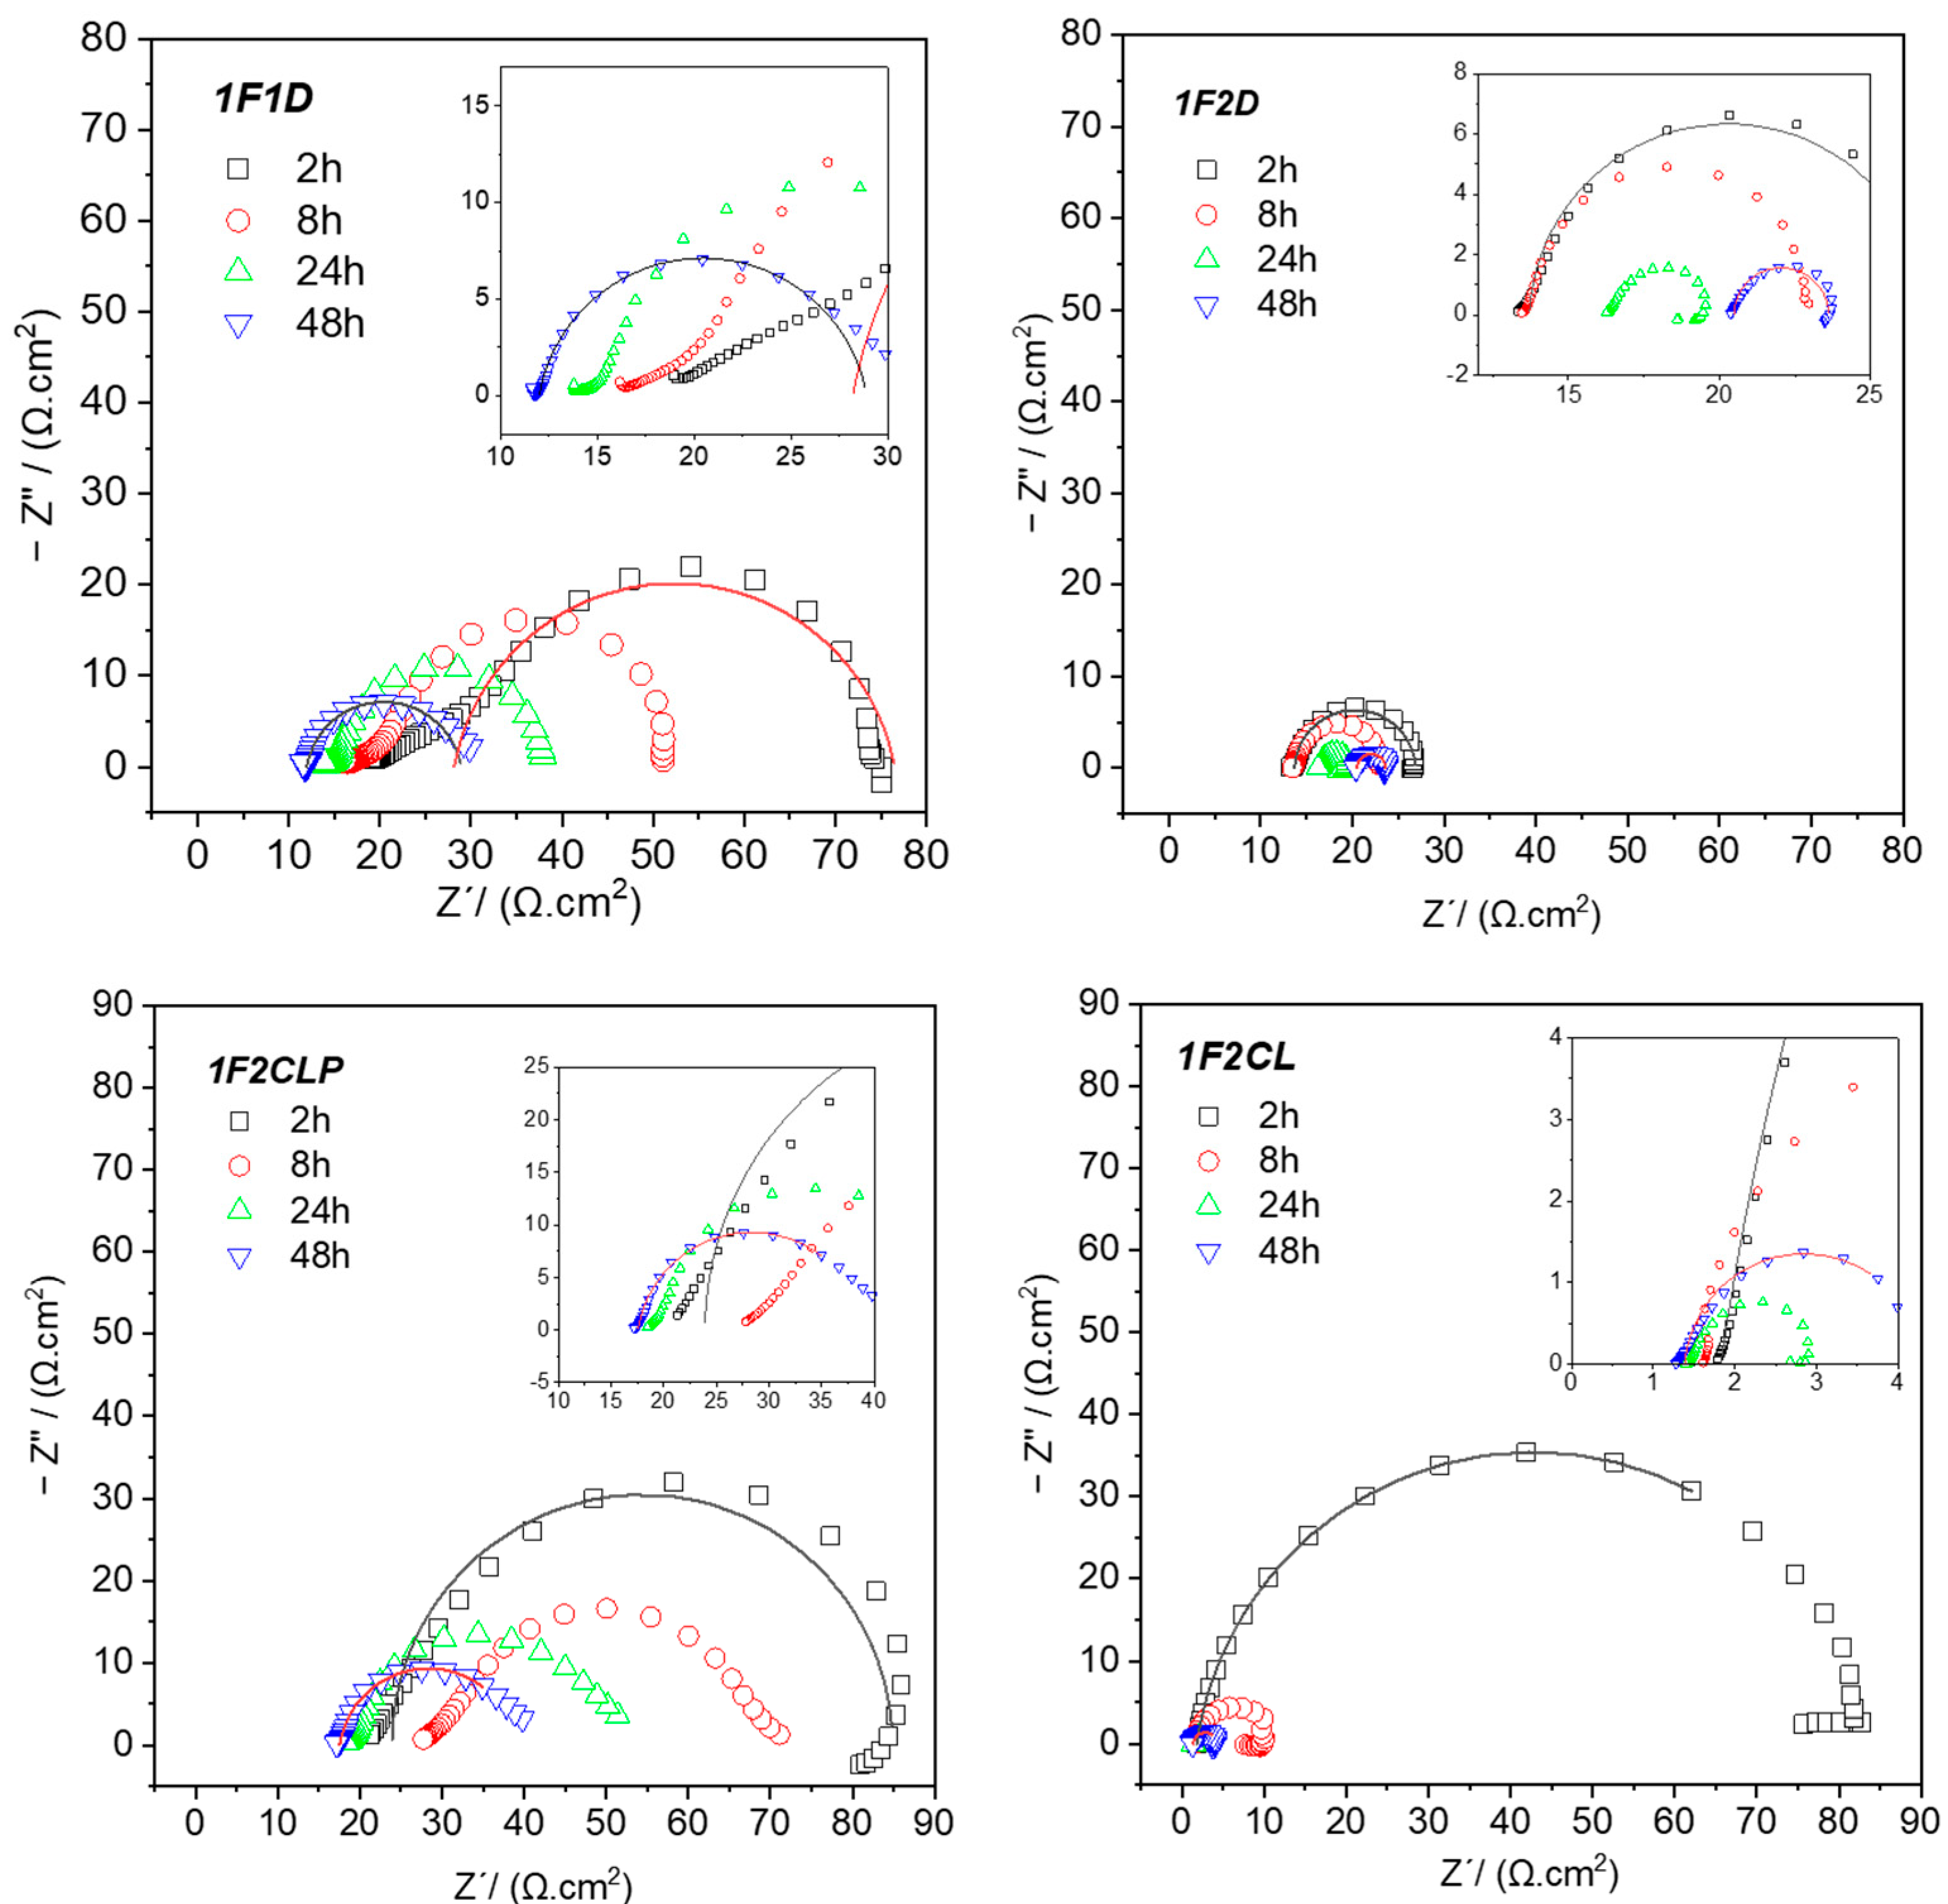
Figure 4 shows the Nyquist plots obtained for the coatings during 48 h of immersion in 2 M HCl at 60 °C. The results indicate a progressive decrease in the overall impedance with immersion time for all four tested samples. This behavior is attributed to the penetration of the electrolyte through the coating, creating conductive pathways to the underlying metal surface. As a result, an increasing fraction of the substrate is exposed to the medium, and corrosion processes are triggered. After only 2 h of immersion, the impedance response is already dominated by the general corrosion of the substrate.
Figure 4.
Nyquist plots for first batch of samples (1F1D, 1F2D, 1F2CL, 1F2CLP) at 2, 8, 24 and 48 h of exposure to HCl 2M (hollow symbols for experimental plots and lines for fitting plots).
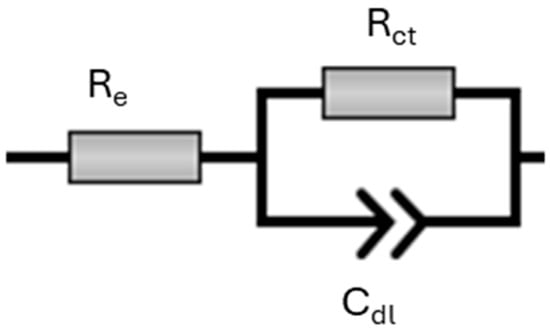
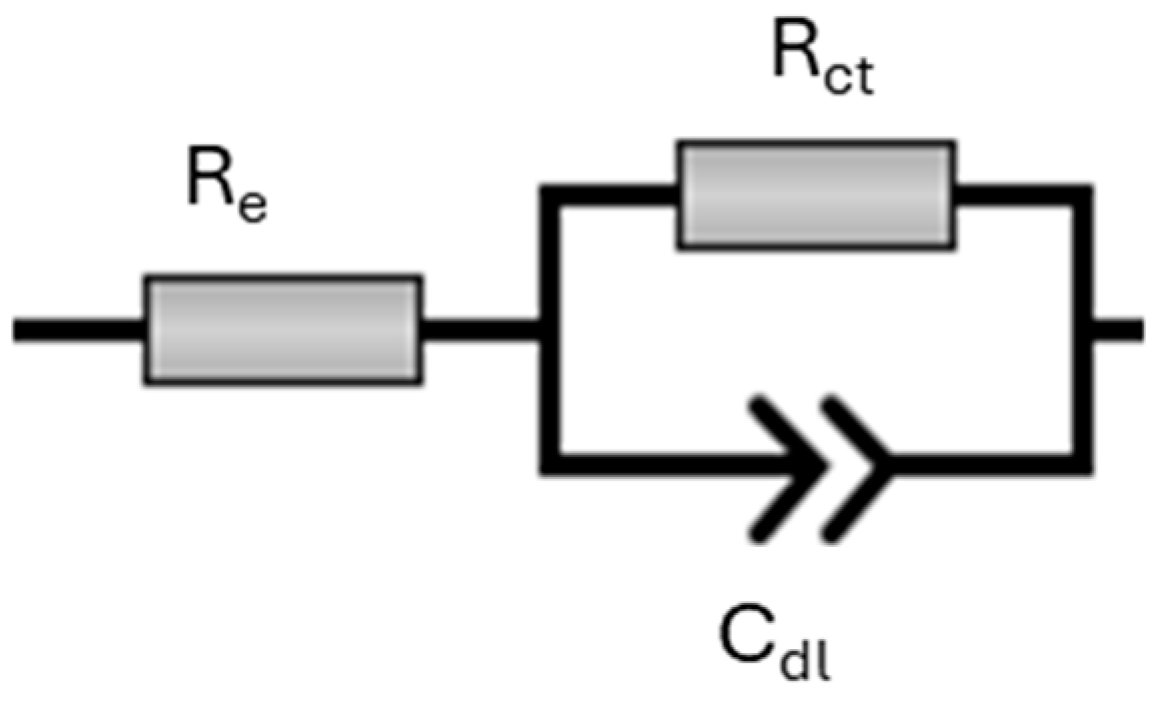
Nyquist plots now exhibit a single time constant (one arc) characteristic of a Randles-like cell, as shown in Figure 5: This response is defined by the polarization or charge-transfer resistance at the surface of the metallic substrate (Rct) and the capacitance of the electrical double layer (Cdl), respectively. The temporal evolution of these parameters reveals noteworthy features that depend again on the specific PDC post-treatment. Table 7 shows the obtained fitting results for these samples.
Figure 5.
One-time constant EEC, used for acidic medium.
Table 7.
Fitting results for first batch of coatings at 2, 24 and 48 h of immersion in acidic medium.
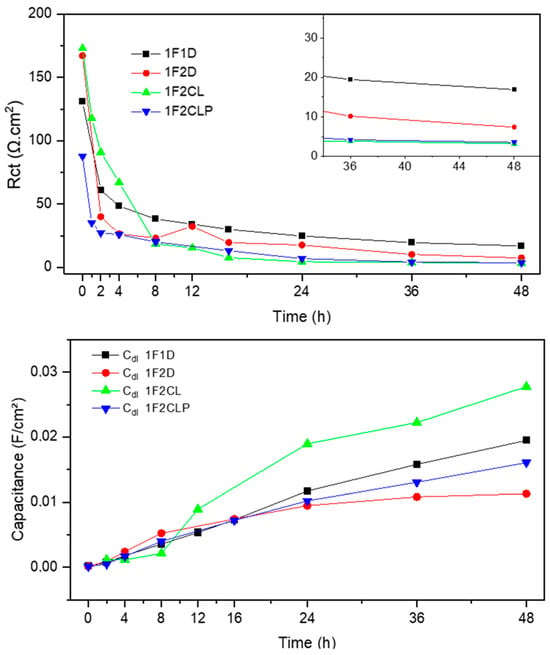
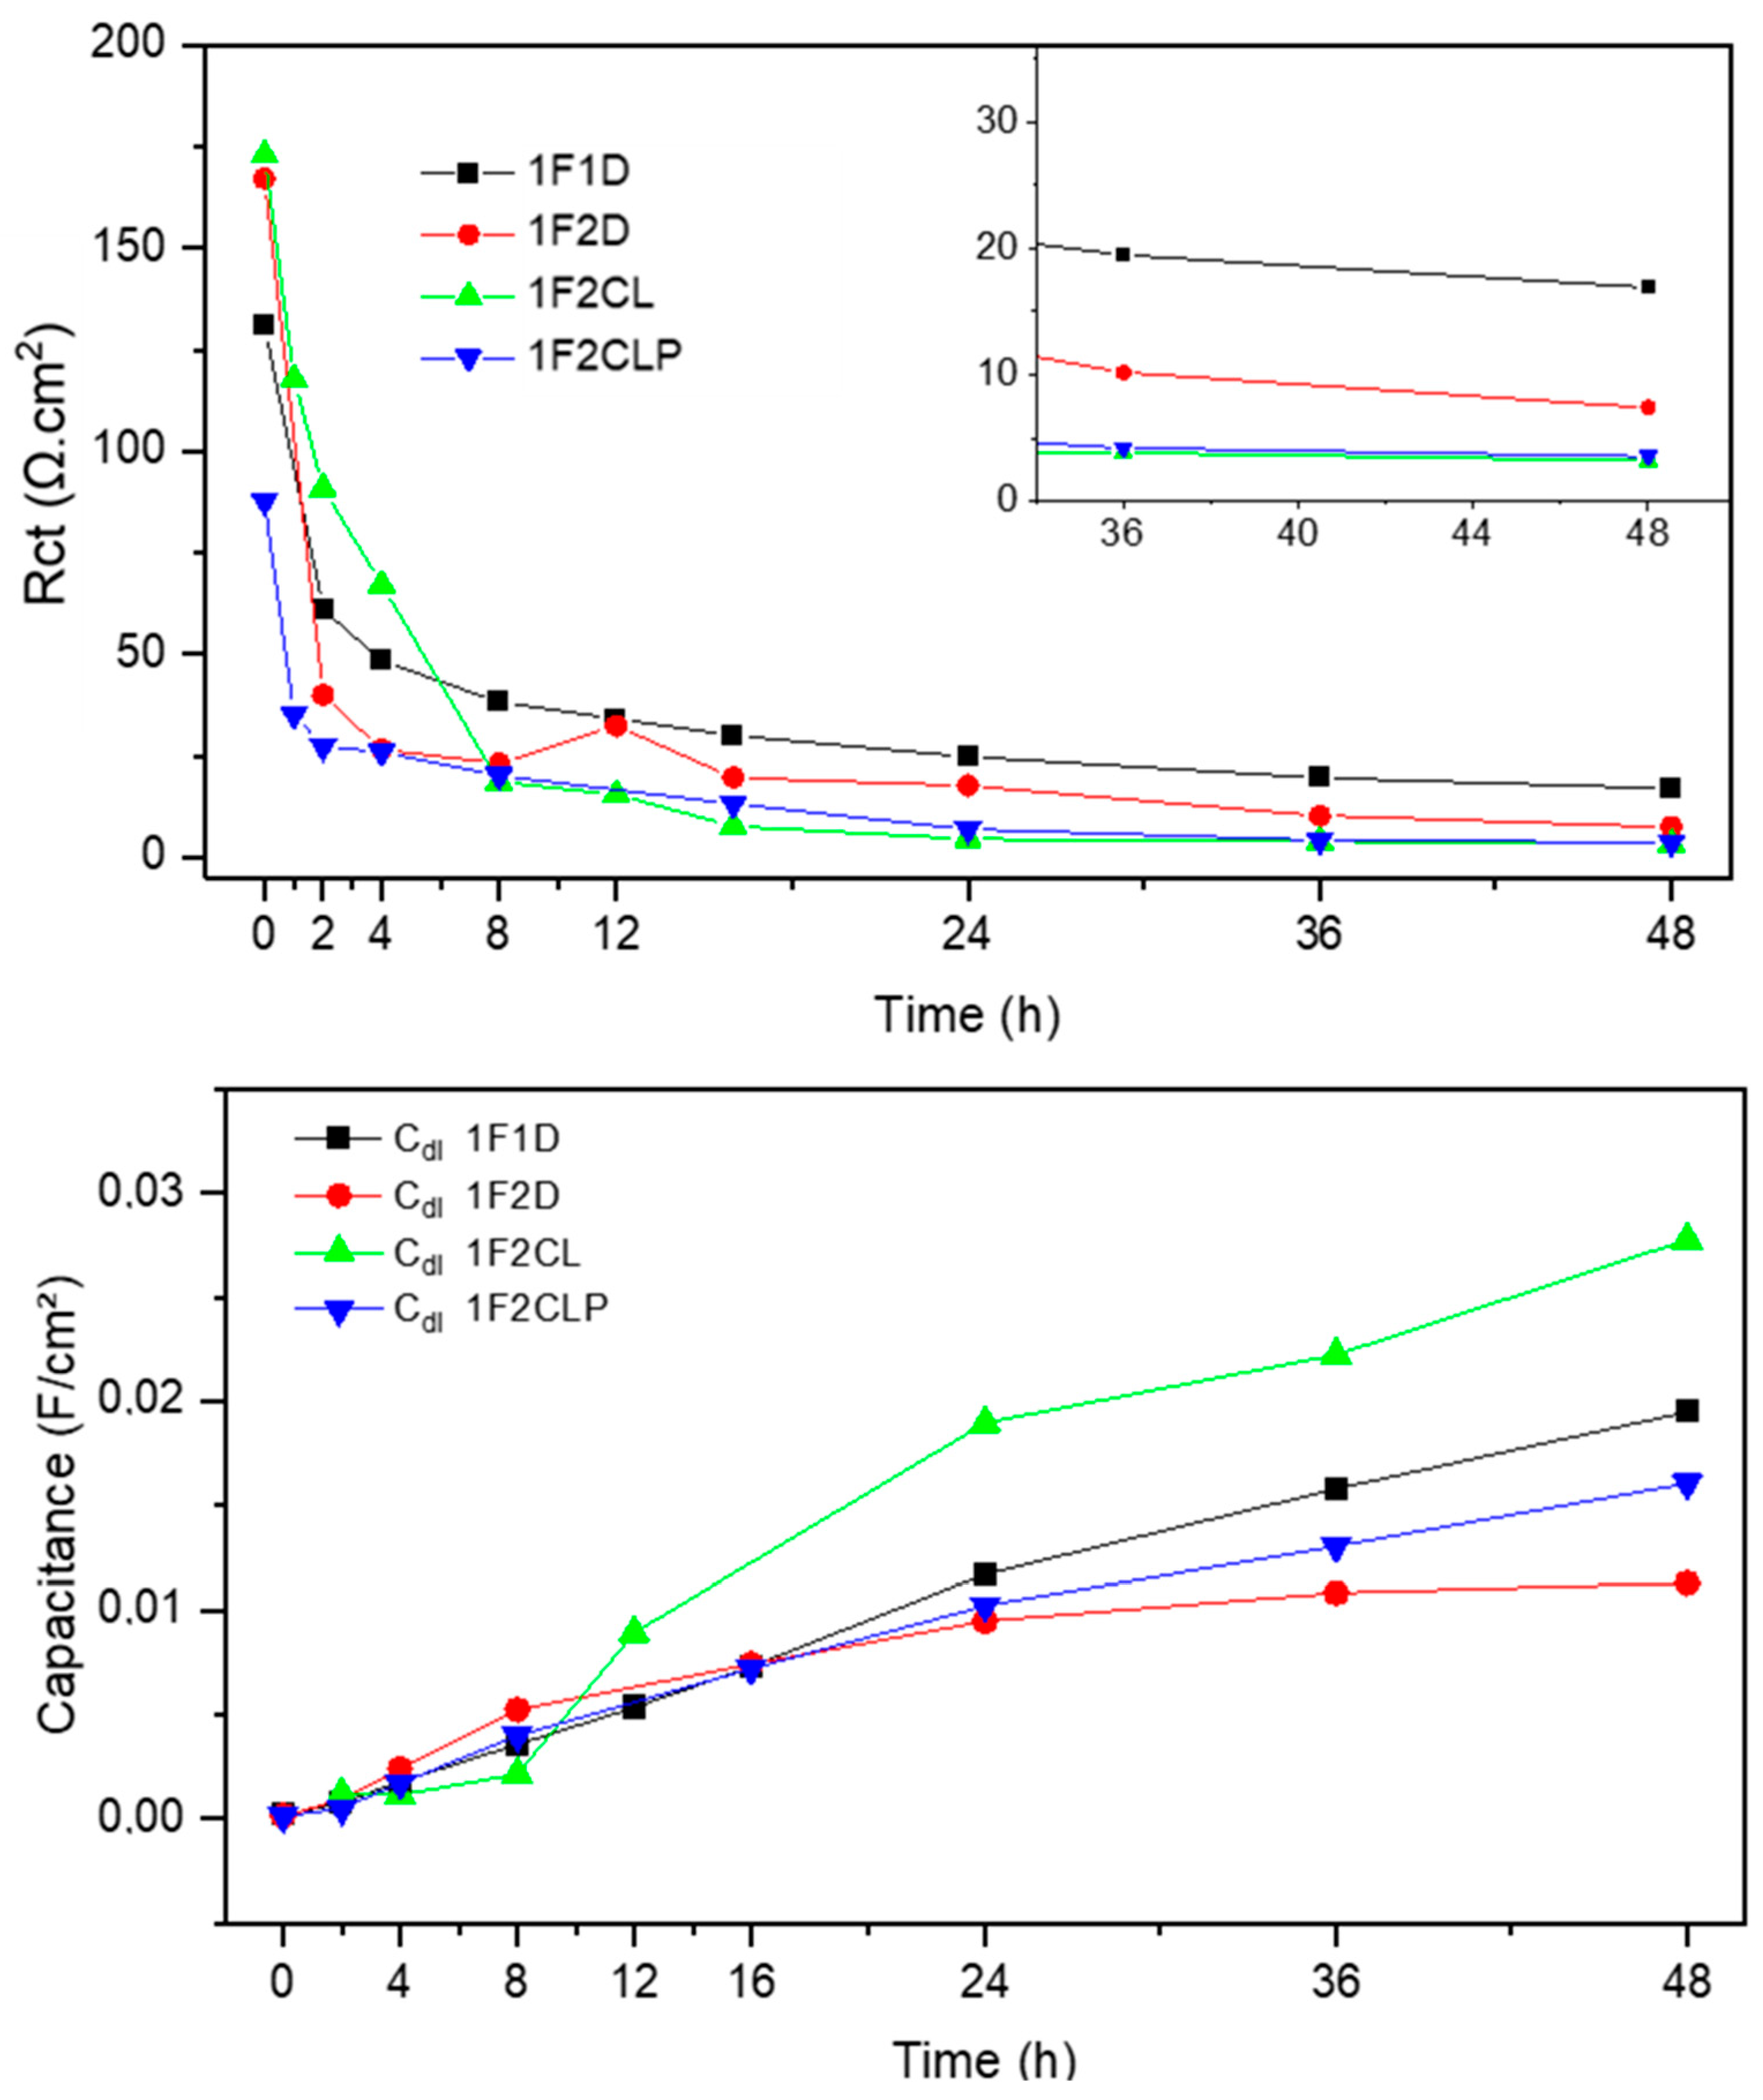
At early stages, Rct shows a decrease markedly within the first 12 h, revealing a clear degradation of the coating caused by the acid electrolyte penetration. This leads to a stable, significantly lower Rct value indicative of the onset of the active corrosion on the stainless-steel substrate. After 4 days of immersion, coatings 1F1D and 1F2D show comparatively higher Rct values than the other formulations (Figure 6). This suggests that, despite the occurrence of active corrosion, the presence of smaller cracks in these coatings helps restrict acid electrolyte penetration at the metal–coating interface, thereby mitigating further degradation.
Figure 6.
Evolution of charge transfer resistance (top) and double-layer capacitance (bottom) through time, first batch of samples.
Importantly, samples subjected to additional post-treatments (1F2Cl, 1F2CLP) consistently exhibit lower Rct values throughout the test period, highlighting their reduced protective performance under these conditions. Both coatings exhibit a more severe deterioration mechanism: active corrosion at the metal surface is accompanied by coating delamination and blister formation. This is evidenced by the increase in Cdl observed during the final stages of immersion. Since Cdl is directly related to the exposed active surface area, its progressive rise confirms the continuous degradation of the coating and the growing extent of electrolyte access with prolonged exposure.
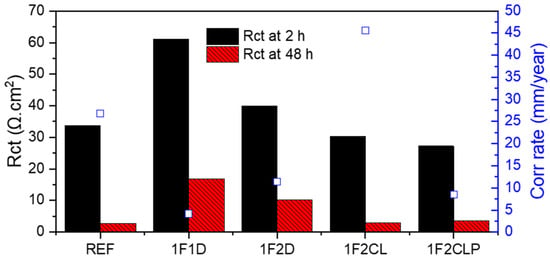
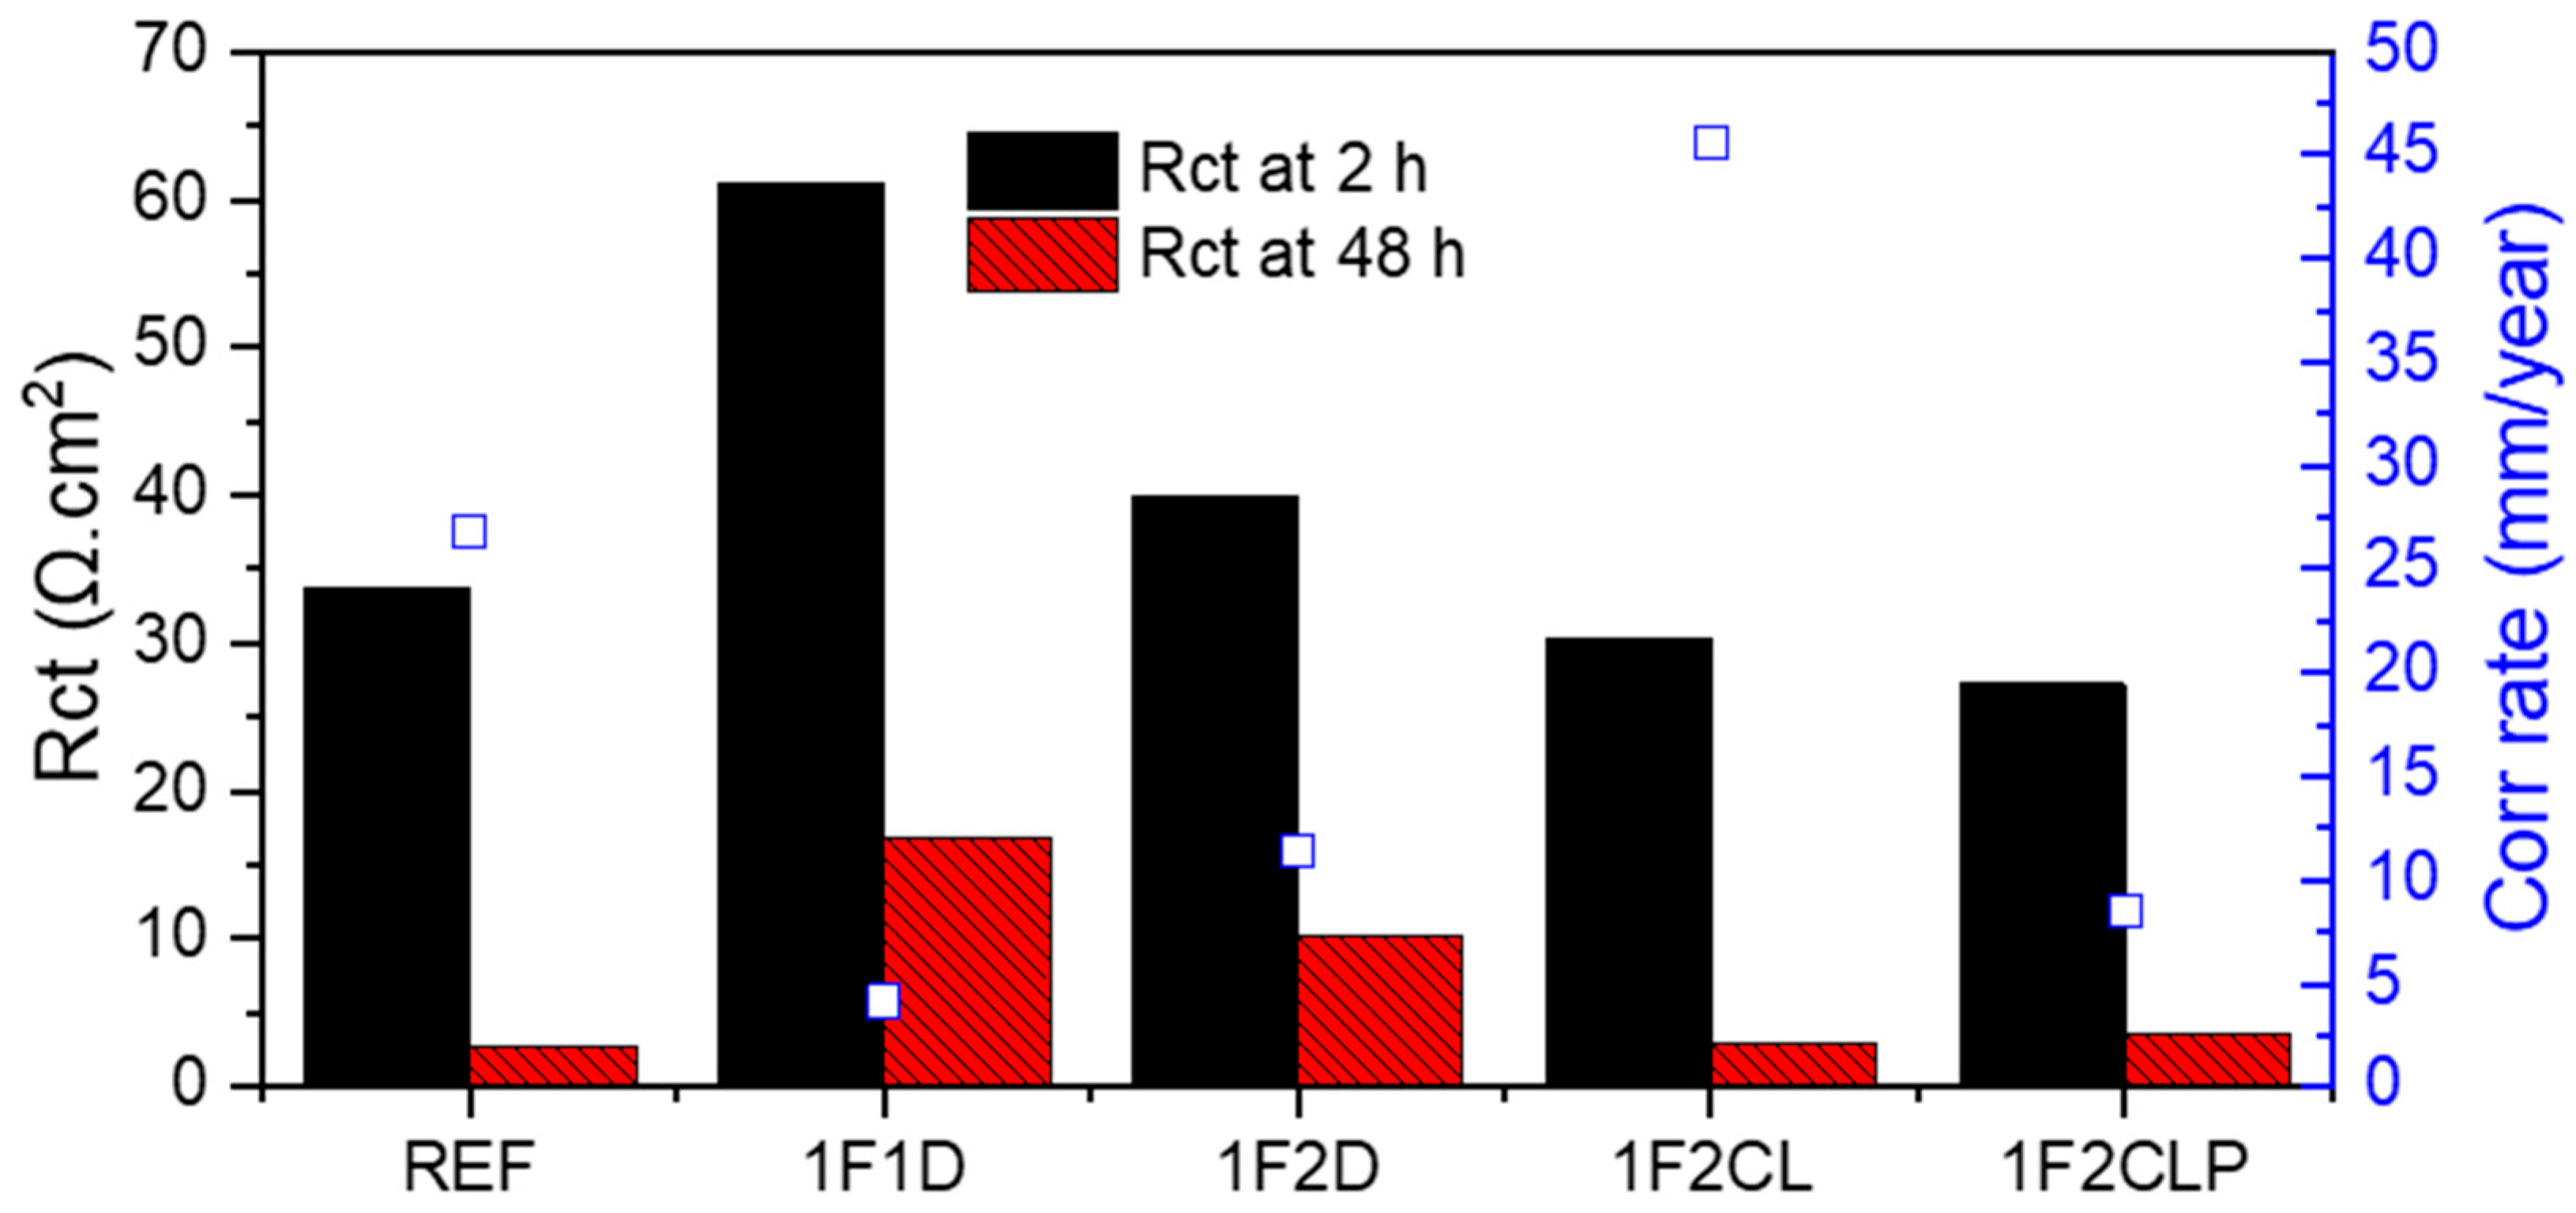
The evolution of the fitting parameters closely aligns with the weight loss and, consequently, with the corrosion rate estimation obtained by the ASTM procedure (Figure 7).
Figure 7.
Comparison of average Rct values vs. corrosion rates of the first batch of coatings.
After 2 h, sample 1F1D has the highest Rct value, suggesting it has the best initial corrosion resistance among all the samples. The other coated samples (1F2D, 1F2CL, 1F2CLP) have lower initial Rct values than 1F1D but are still significantly higher than the reference sample (REF). After 48 h, the Rct values for all coated samples have decreased significantly. This indicates that the coatings have degraded over time, reducing their ability to protect the underlying material. The reference sample’s Rct also decreased, but it started and ended at a very low value. The most notable decrease is for sample 1F1D, whose Rct plummeted from its initial high value to a much lower one, though it still remained higher than the reference. Therefore, the results show that all the coatings provide initial corrosion protection compared to the uncoated reference sample. However, the protective ability of the coatings degrades significantly over time, as evidenced by the large decrease in Rct and the corresponding increase in the corrosion rate after 48 h of exposure. Sample 1F1D initially offers the best protection, but it also experiences a substantial loss of resistance, suggesting a failure mechanism in the coating
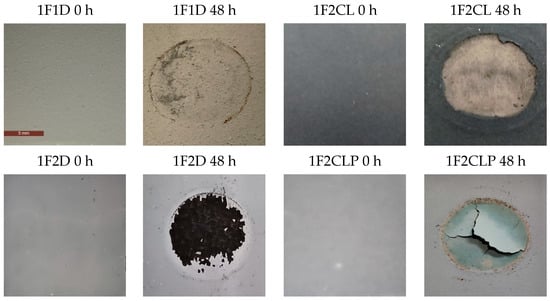
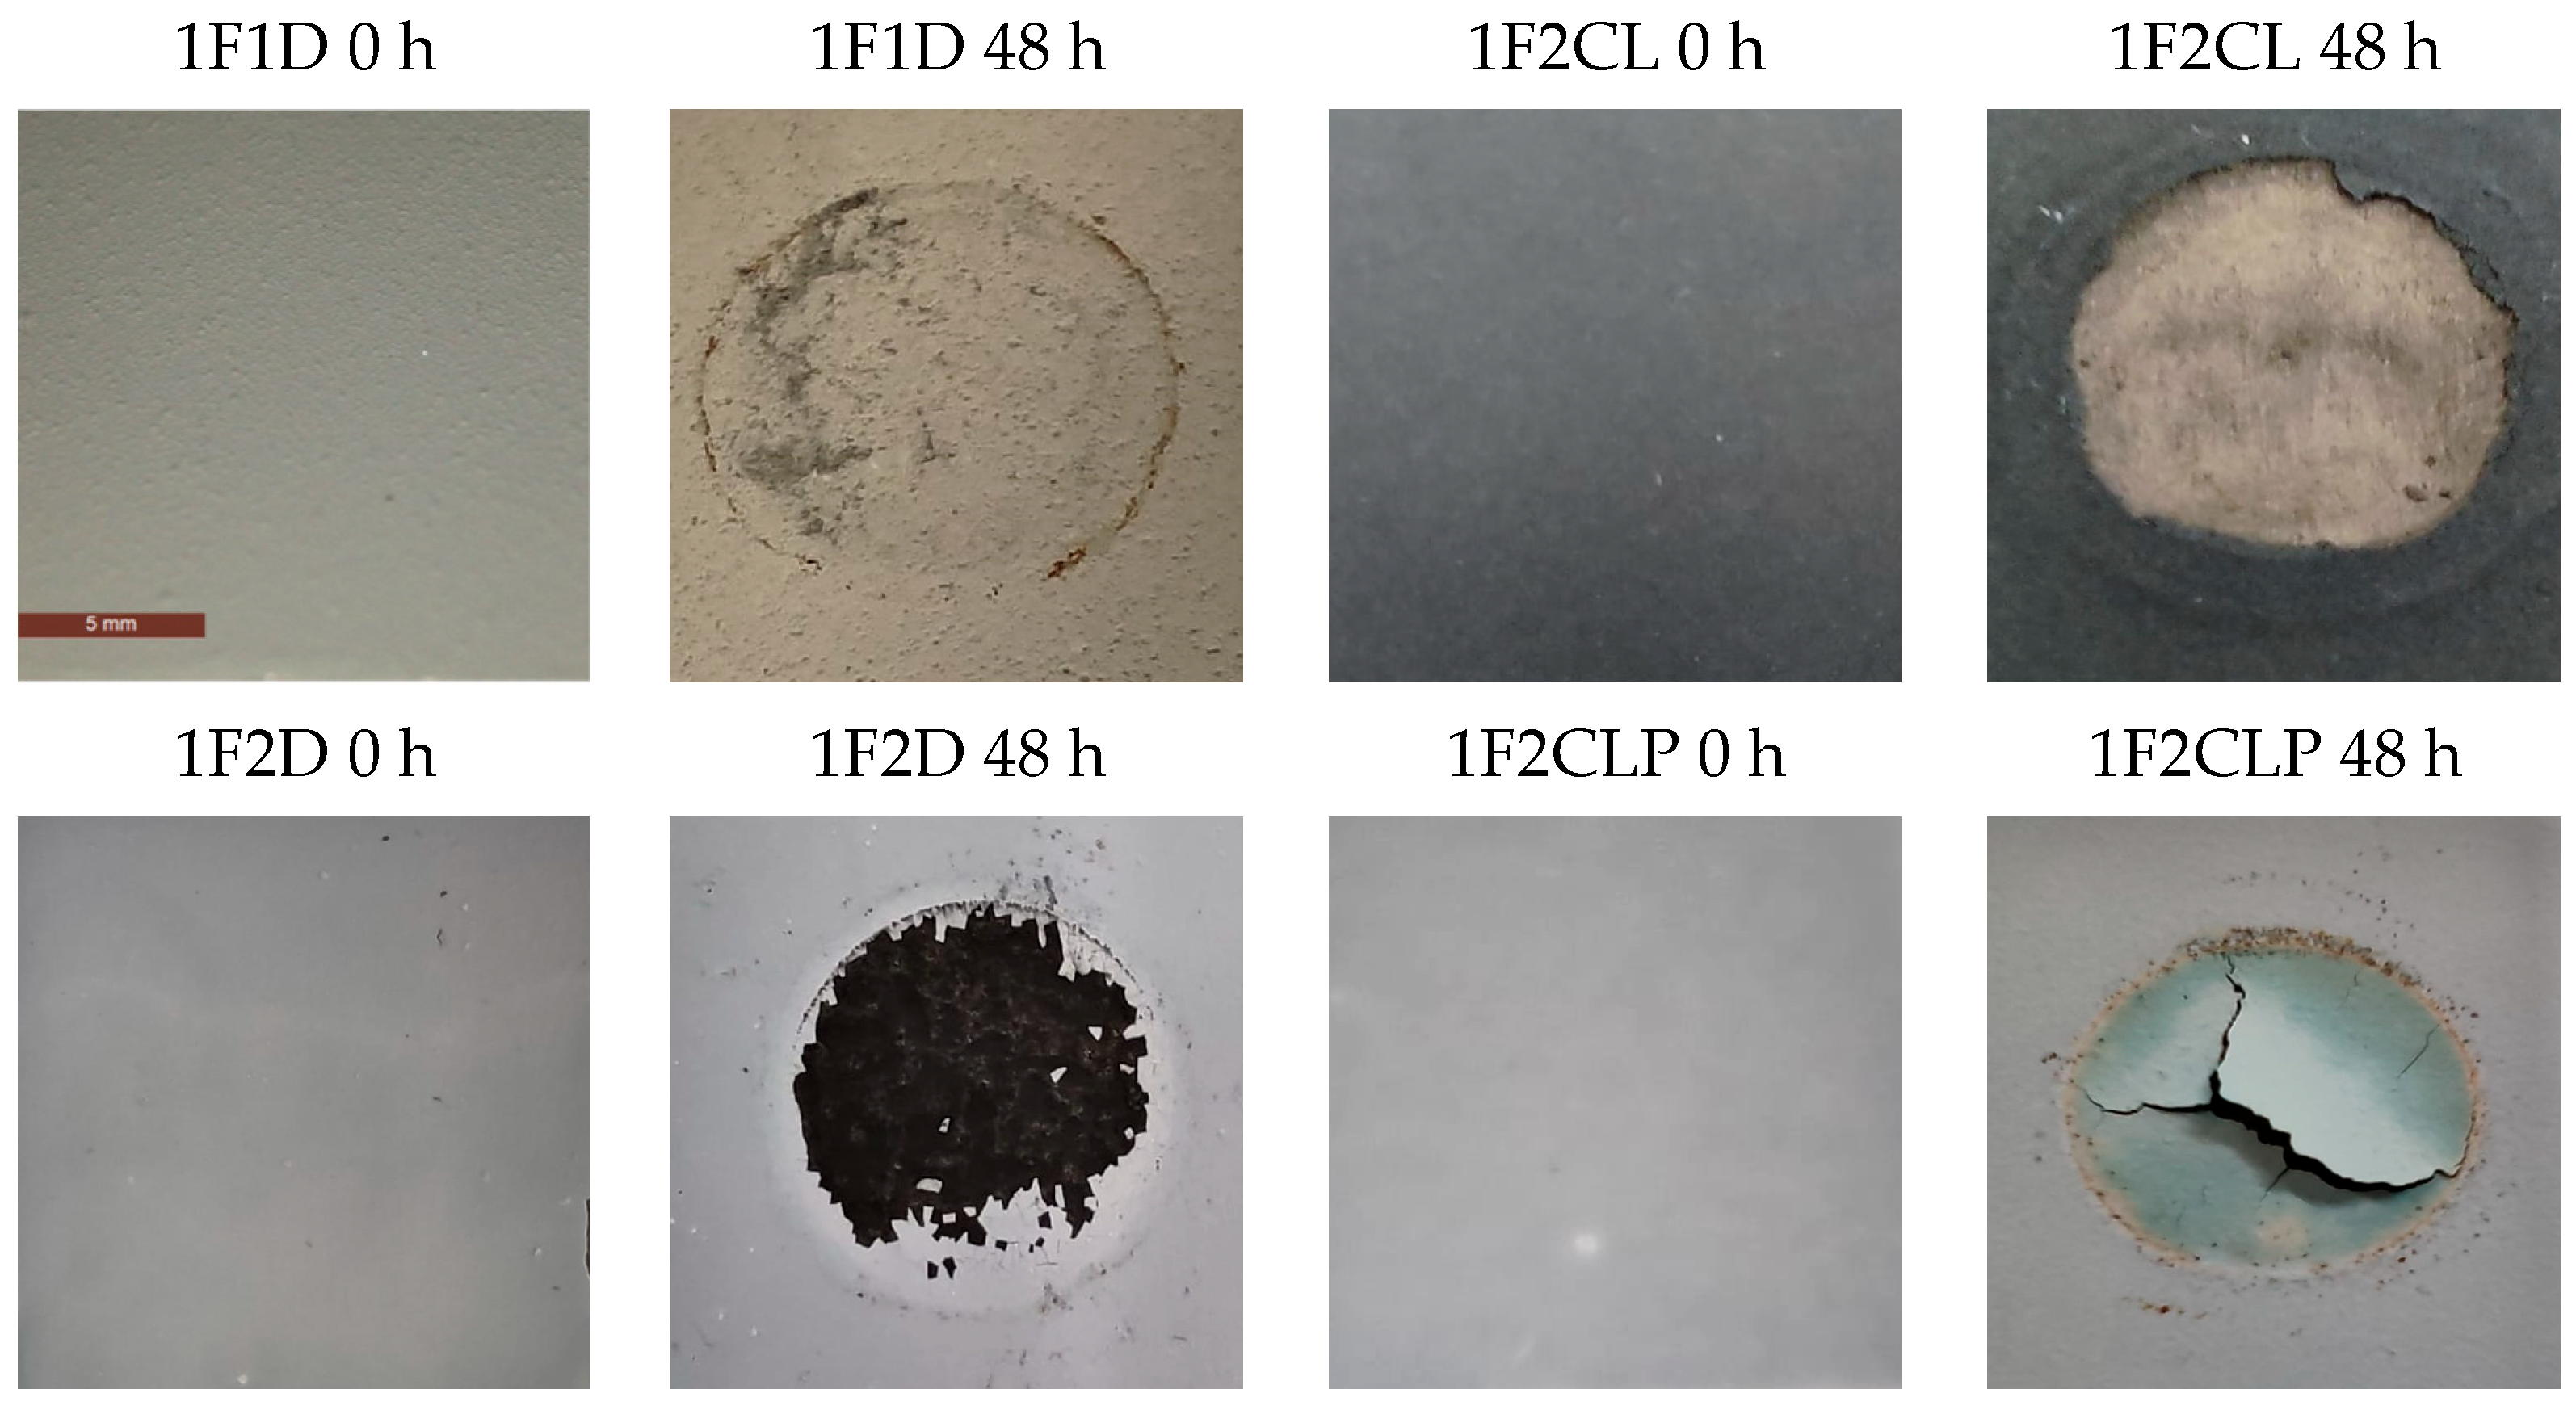
These results were complemented by macrographic analysis (1×, 4× magnification) after 48 h (Figure 8). The visual analysis of these coatings reveals significant deterioration in all of them, which is consistent with the drop in polarization resistance (Rp) seen in the previous graph. In particular:
Figure 8.
Macrographs of the samples before and after 48 h of exposure in HCl 2M.
- Sample 1F2D: Corrosion has penetrated the coating in a localized area, creating a black crater. The protective layer has been completely breached, indicating coating failure and active corrosion of the substrate.
- Sample 1F2CL: There is complete delamination and massive corrosion in a large circular area. The coating has disappeared, revealing the metallic substrate. A layer of rust is visible on the edges of the corroded area.
- Sample 1F2CLP: It shows cracking and delamination of the coating in the test area. The coating has fractured into large pieces, revealing a reddish-brown rust layer underneath. This indicates that water has penetrated to the substrate, causing corrosion and the subsequent detachment of the coating.
The images confirm that all coatings failed in their protective capacity after 48 h of immersion. The failure manifests in different ways (delamination, pitting, cracking), but in all cases, the substrate is exposed to the corrosive environment. This explains and visually demonstrates why the polarization resistance (Rct) values dropped so drastically in Figure 6. Unlike samples 1F2CL and 1F2CLP, which show massive delamination and corrosion over large areas, the corrosion in 1F1D is more localized. The delamination is confined to a smaller area compared to the catastrophic failure of the other samples, which completely detached over wide regions. The coating around the corroded area in 1F1D remains intact and adhered, with no signs of widespread cracking or detachment, as seen in others. This suggests better overall adhesion of the coating to the substrate.
The pronounced degradation of the pyrolyzed coatings (1F2CLP), already observed in tap water tests, is primarily associated with the structural and mechanical changes induced by high-temperature treatment. During pyrolysis, the removal of volatile and organic components leads to significant volumetric shrinkage, which promotes the formation of internal porosity and microcracks. These defects act as stress concentrators and preferential pathways for corrosive species, substantially reducing the barrier effectiveness of the ceramic layer.
In addition, the mismatch in thermal expansion coefficients between the coating and the metallic substrate during heating and cooling cycles generates residual stresses. These stresses weaken the coating–substrate interface, promoting adhesion loss and, in some cases, partial or complete delamination. Residual organic phases may also undergo partial carbonization during pyrolysis, further compromising cohesion and mechanical integrity.
The combined effects of shrinkage, porosity, internal stress development, and adhesion degradation render the pyrolyzed coatings significantly more susceptible to early failure when exposed to aggressive acidic environments.
In summary, although the point of failure for 1F1D is evident, the rest of the coating has withstood the immersion better, making it the sample with the best overall performance compared to the others that show more widespread and severe degradation.
Based on the results of this first test batch, formulation 1F1D (Silres MK PDC (SiO2) mixture with SiC powder) was selected as the most promising composition for further optimization. In addition, since the evolution of the Nyquist spectra revealed that the most significant changes in arc diameter occur within the first 48 h, subsequent test campaigns were limited to this immersion period.
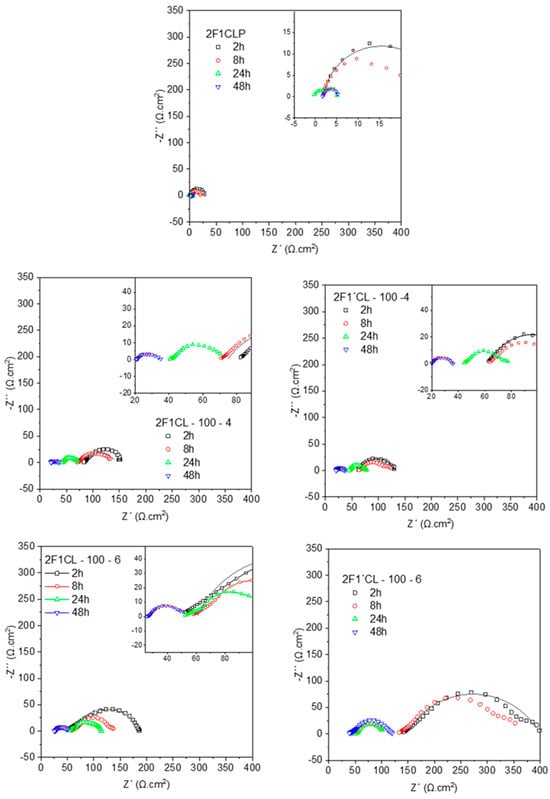
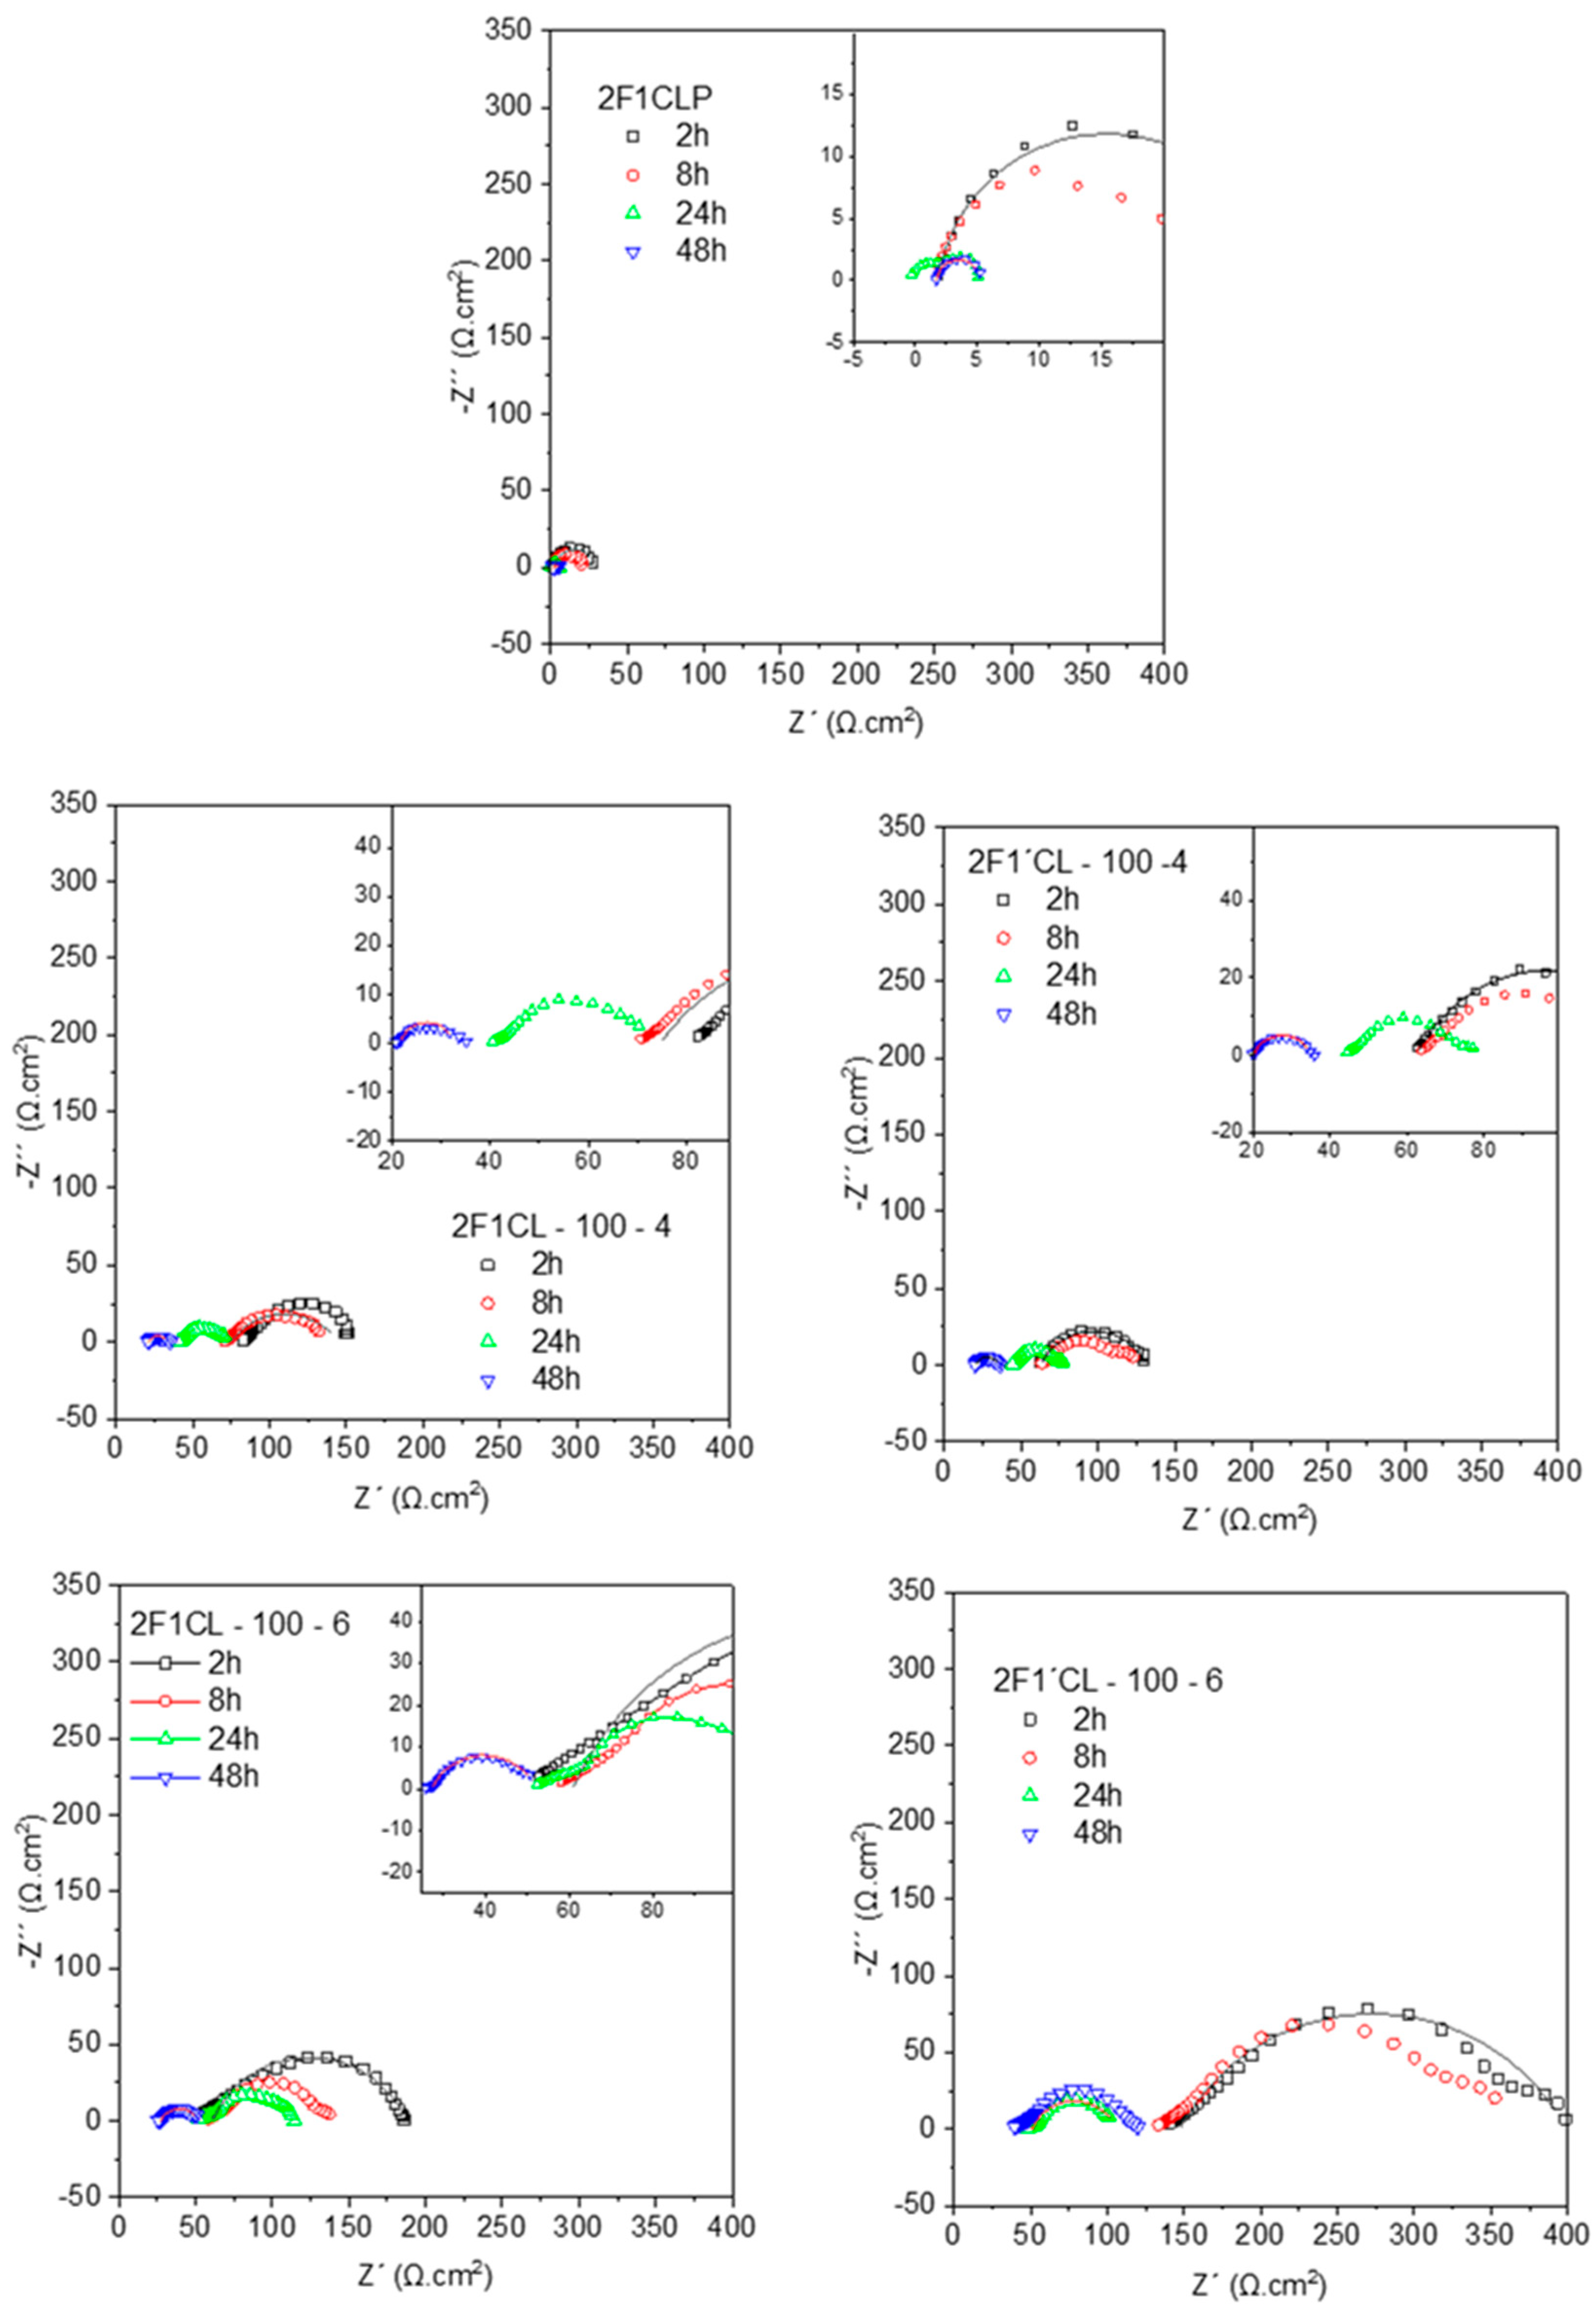
Figure 9 presents the Nyquist plots obtained for the new batch of coatings (results of fitting are summarized in Table 8). In contrast to the previous formulations, most spectra exhibit well-defined flattened arcs, a feature typically associated with diffusion-controlled processes. This behavior suggests that ionic transport, most likely involving H+ and/or Cl− ions, becomes a relevant step in the corrosion mechanism, highlighting the reduced barrier properties of these coatings compared with earlier systems.
Figure 9.
Nyquist plots of second batch of samples at 2, 8, 24 and 48 h of acidic exposure (hollow symbols for experimental plots and lines for fitting plots).
Table 8.
Fitting results for second batch of coatings at 2, 24 and 48 h of immersion in acidic medium.
The evolution of the spectra confirms that corrosion initiates at very early immersion times, as reflected by the rapid reduction in arc diameter. The progressive shrinking of the Nyquist plots indicates a continuous decrease in corrosion resistance, consistent with increased electrochemical activity at the surface. This is most likely driven by electrolyte penetration, leading to localized dissolution of the metallic substrate and the concurrent formation of corrosion products. The latter not only enhance surface conductivity but also facilitate further ionic transport, thereby accelerating the degradation process.
To gain deeper insight into these processes, EIS data were fitted with equivalent circuits. As in the previous batch, the spectra could be described with a single time constant corresponding to a Randles-type cell, defined by the polarization or charge-transfer resistance (Rp) and the double-layer capacitance (Cdl) (Figure 5). Notably, the time constant associated with these arcs remains within the 1–5 Hz range throughout the immersion period, indicating that charge-transfer and double-layer processes dominate the system response. The persistence of this frequency window suggests that, while the coatings initially provide some barrier effect, the rapid onset of diffusion-controlled corrosion limits their long-term protective performance.
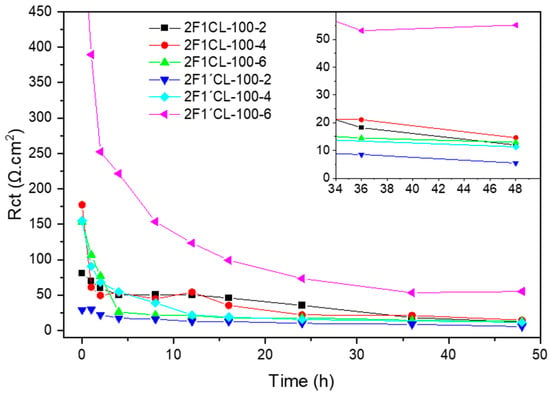
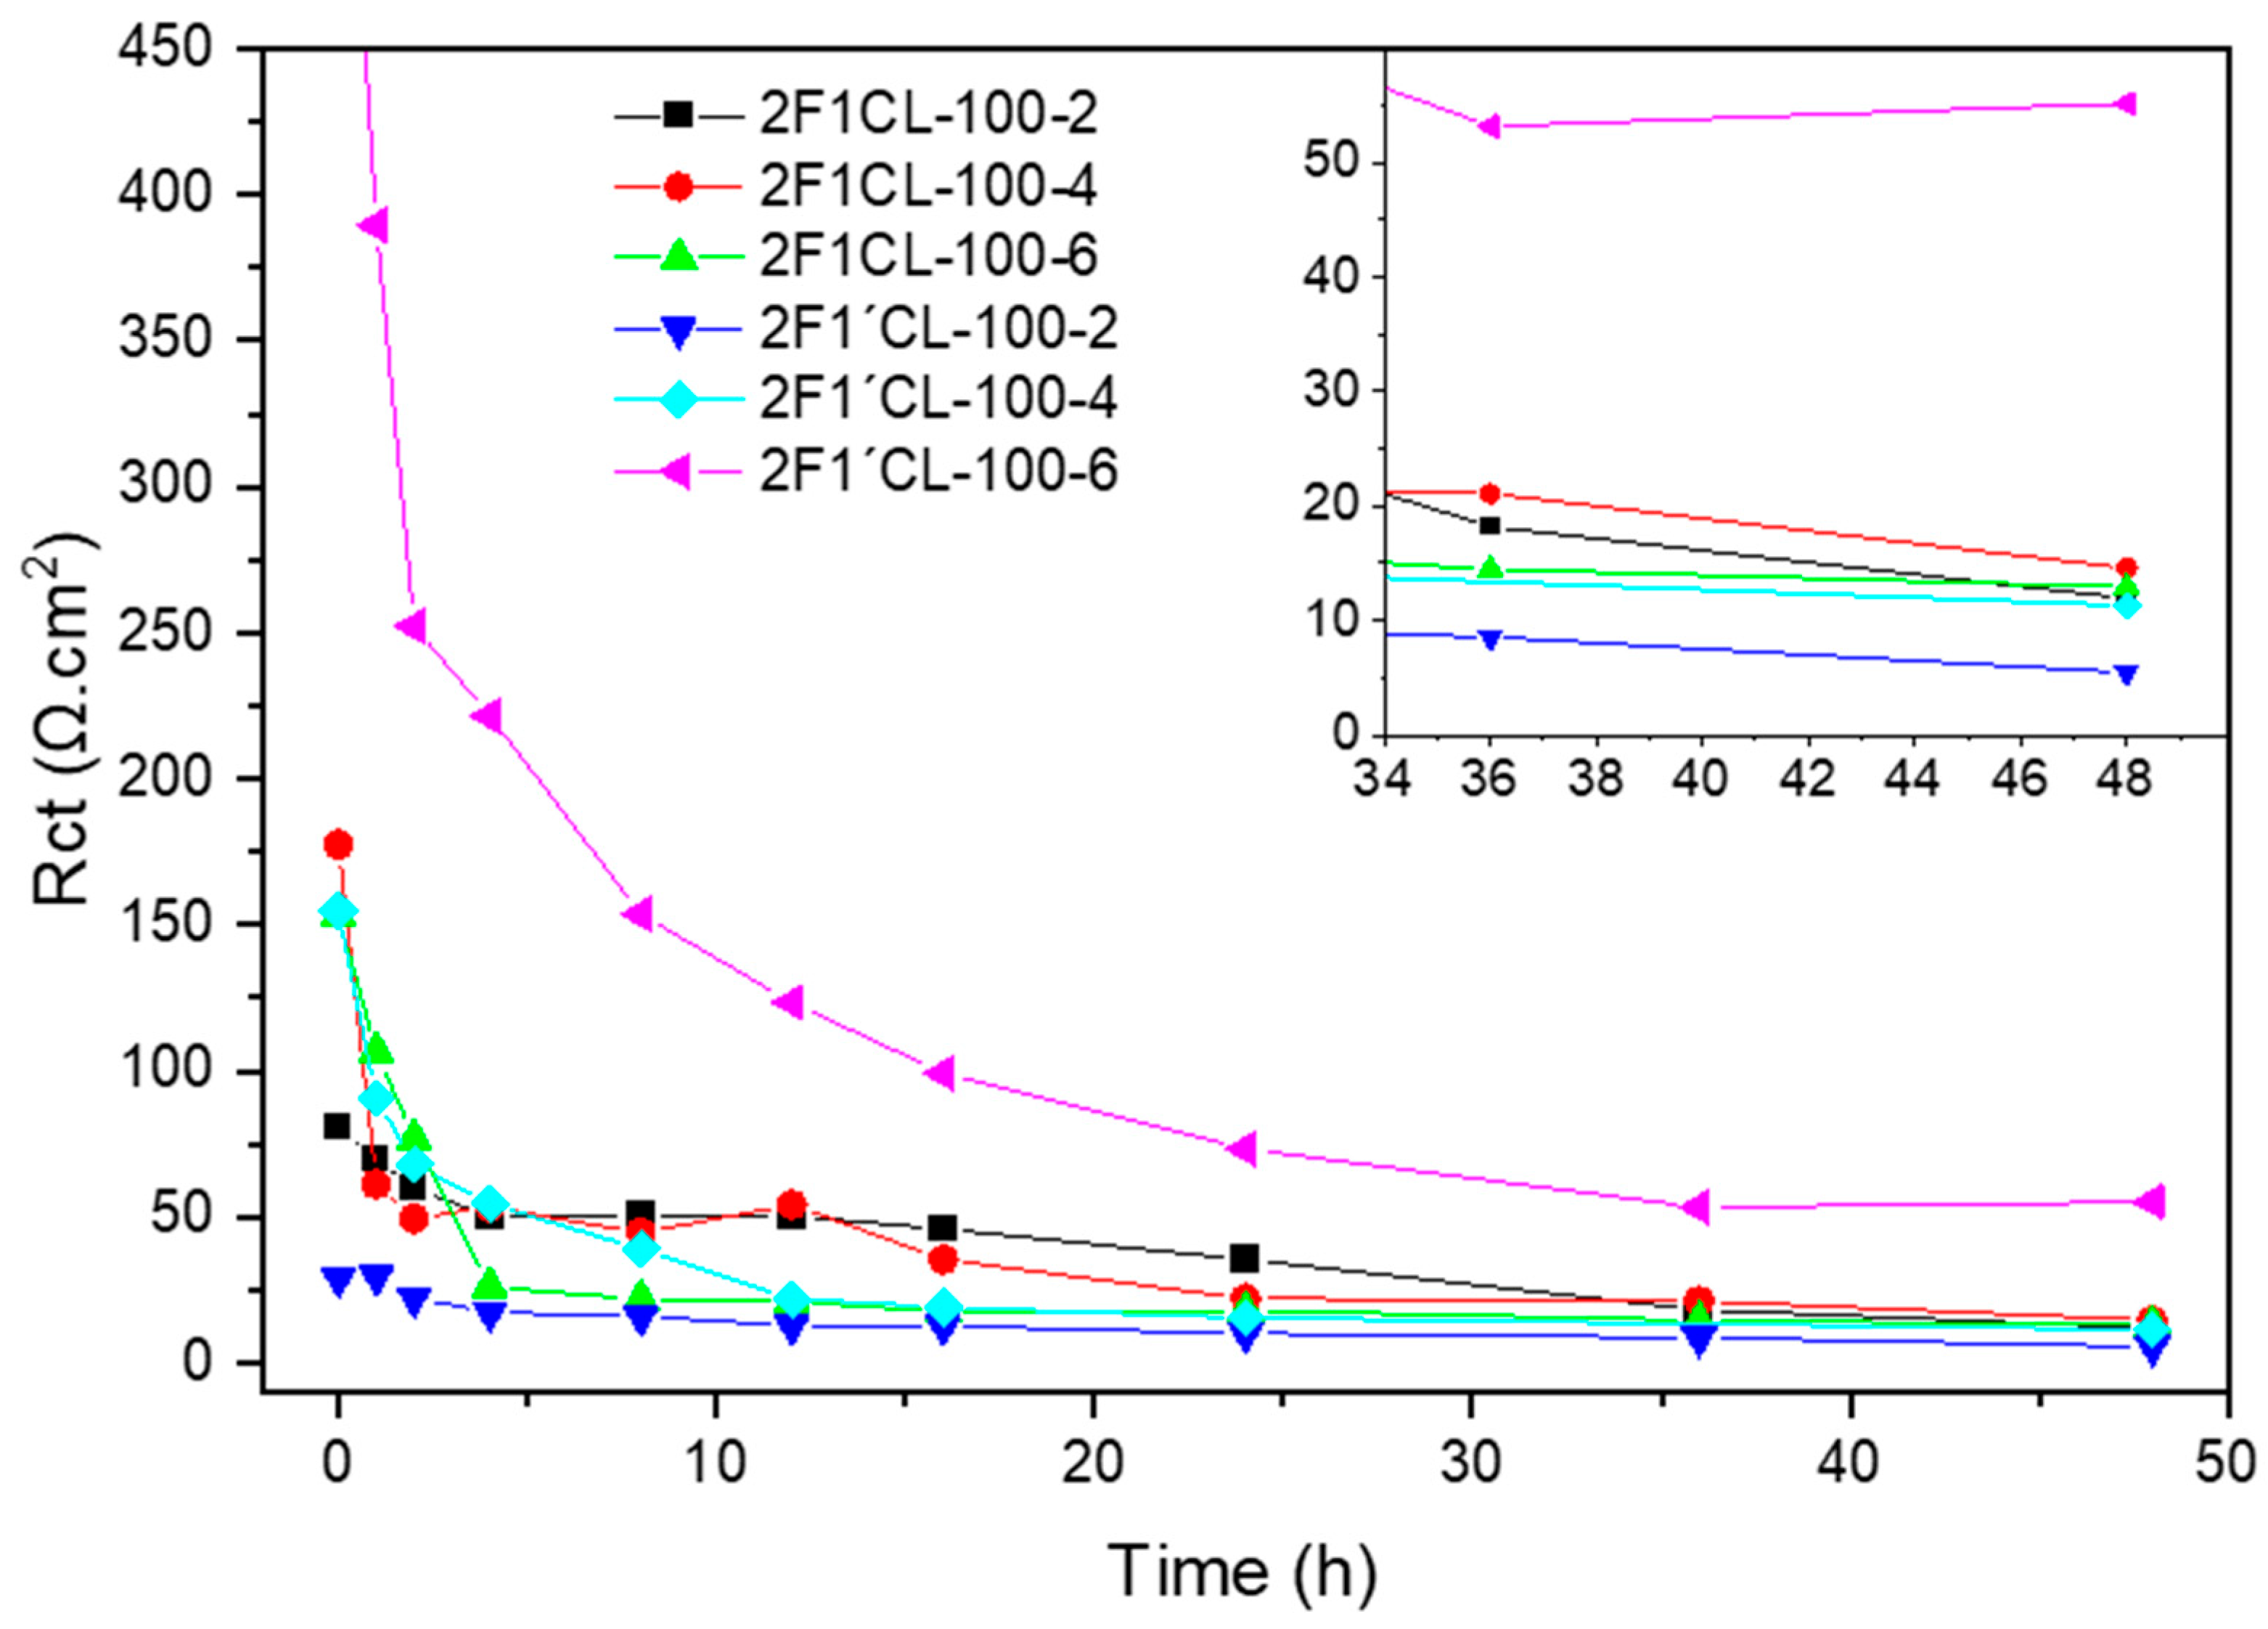
As a general trend, the charge-transfer resistance (Rct) (Figure 10) decreases to values in the range of 10–50 Ω, reflecting for all coatings a sharp initial drop in Rct, indicating that the electrolyte has quickly penetrated through the coating and begun to corrode the metallic substrate. Sample 2F1’CL-100-6 (magenta line) clearly stands out. It starts with an initial Rct value of almost 400 Ωcm2 and, although it decreases, it maintains a significantly higher Rct value than all other samples throughout the entire 48 h period. Its final Rct is around 50 Ωcm2, demonstrating a much superior corrosion resistance. The rest of the samples have much lower initial Rct values (below 100 Ωcm2). Their Rct quickly plummets in the first 10–20 h and stabilizes at very low values, below 20 Ωcm2. This indicates that these coatings offer very limited protection and lose their effectiveness rapidly.
Figure 10.
Rct evolution (obtained by EEC) of the second batch of samples.
Based on those results, Rct tends to increase as the number of coating layers is increased. This behavior can be explained by the fact that additional layers act as physical barriers, effectively reducing the connectivity of defects and microcracks, and thereby limiting the pathways available for ionic transport. Consequently, thicker multilayer coatings provide higher resistance to charge transfer and better protection of the underlying metal.
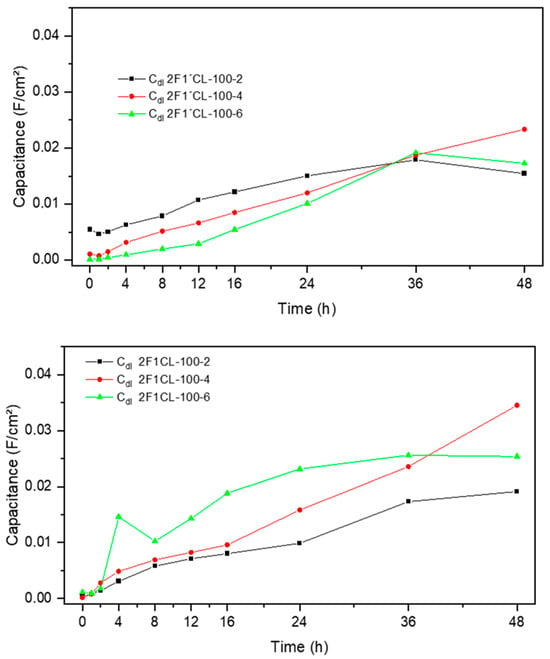
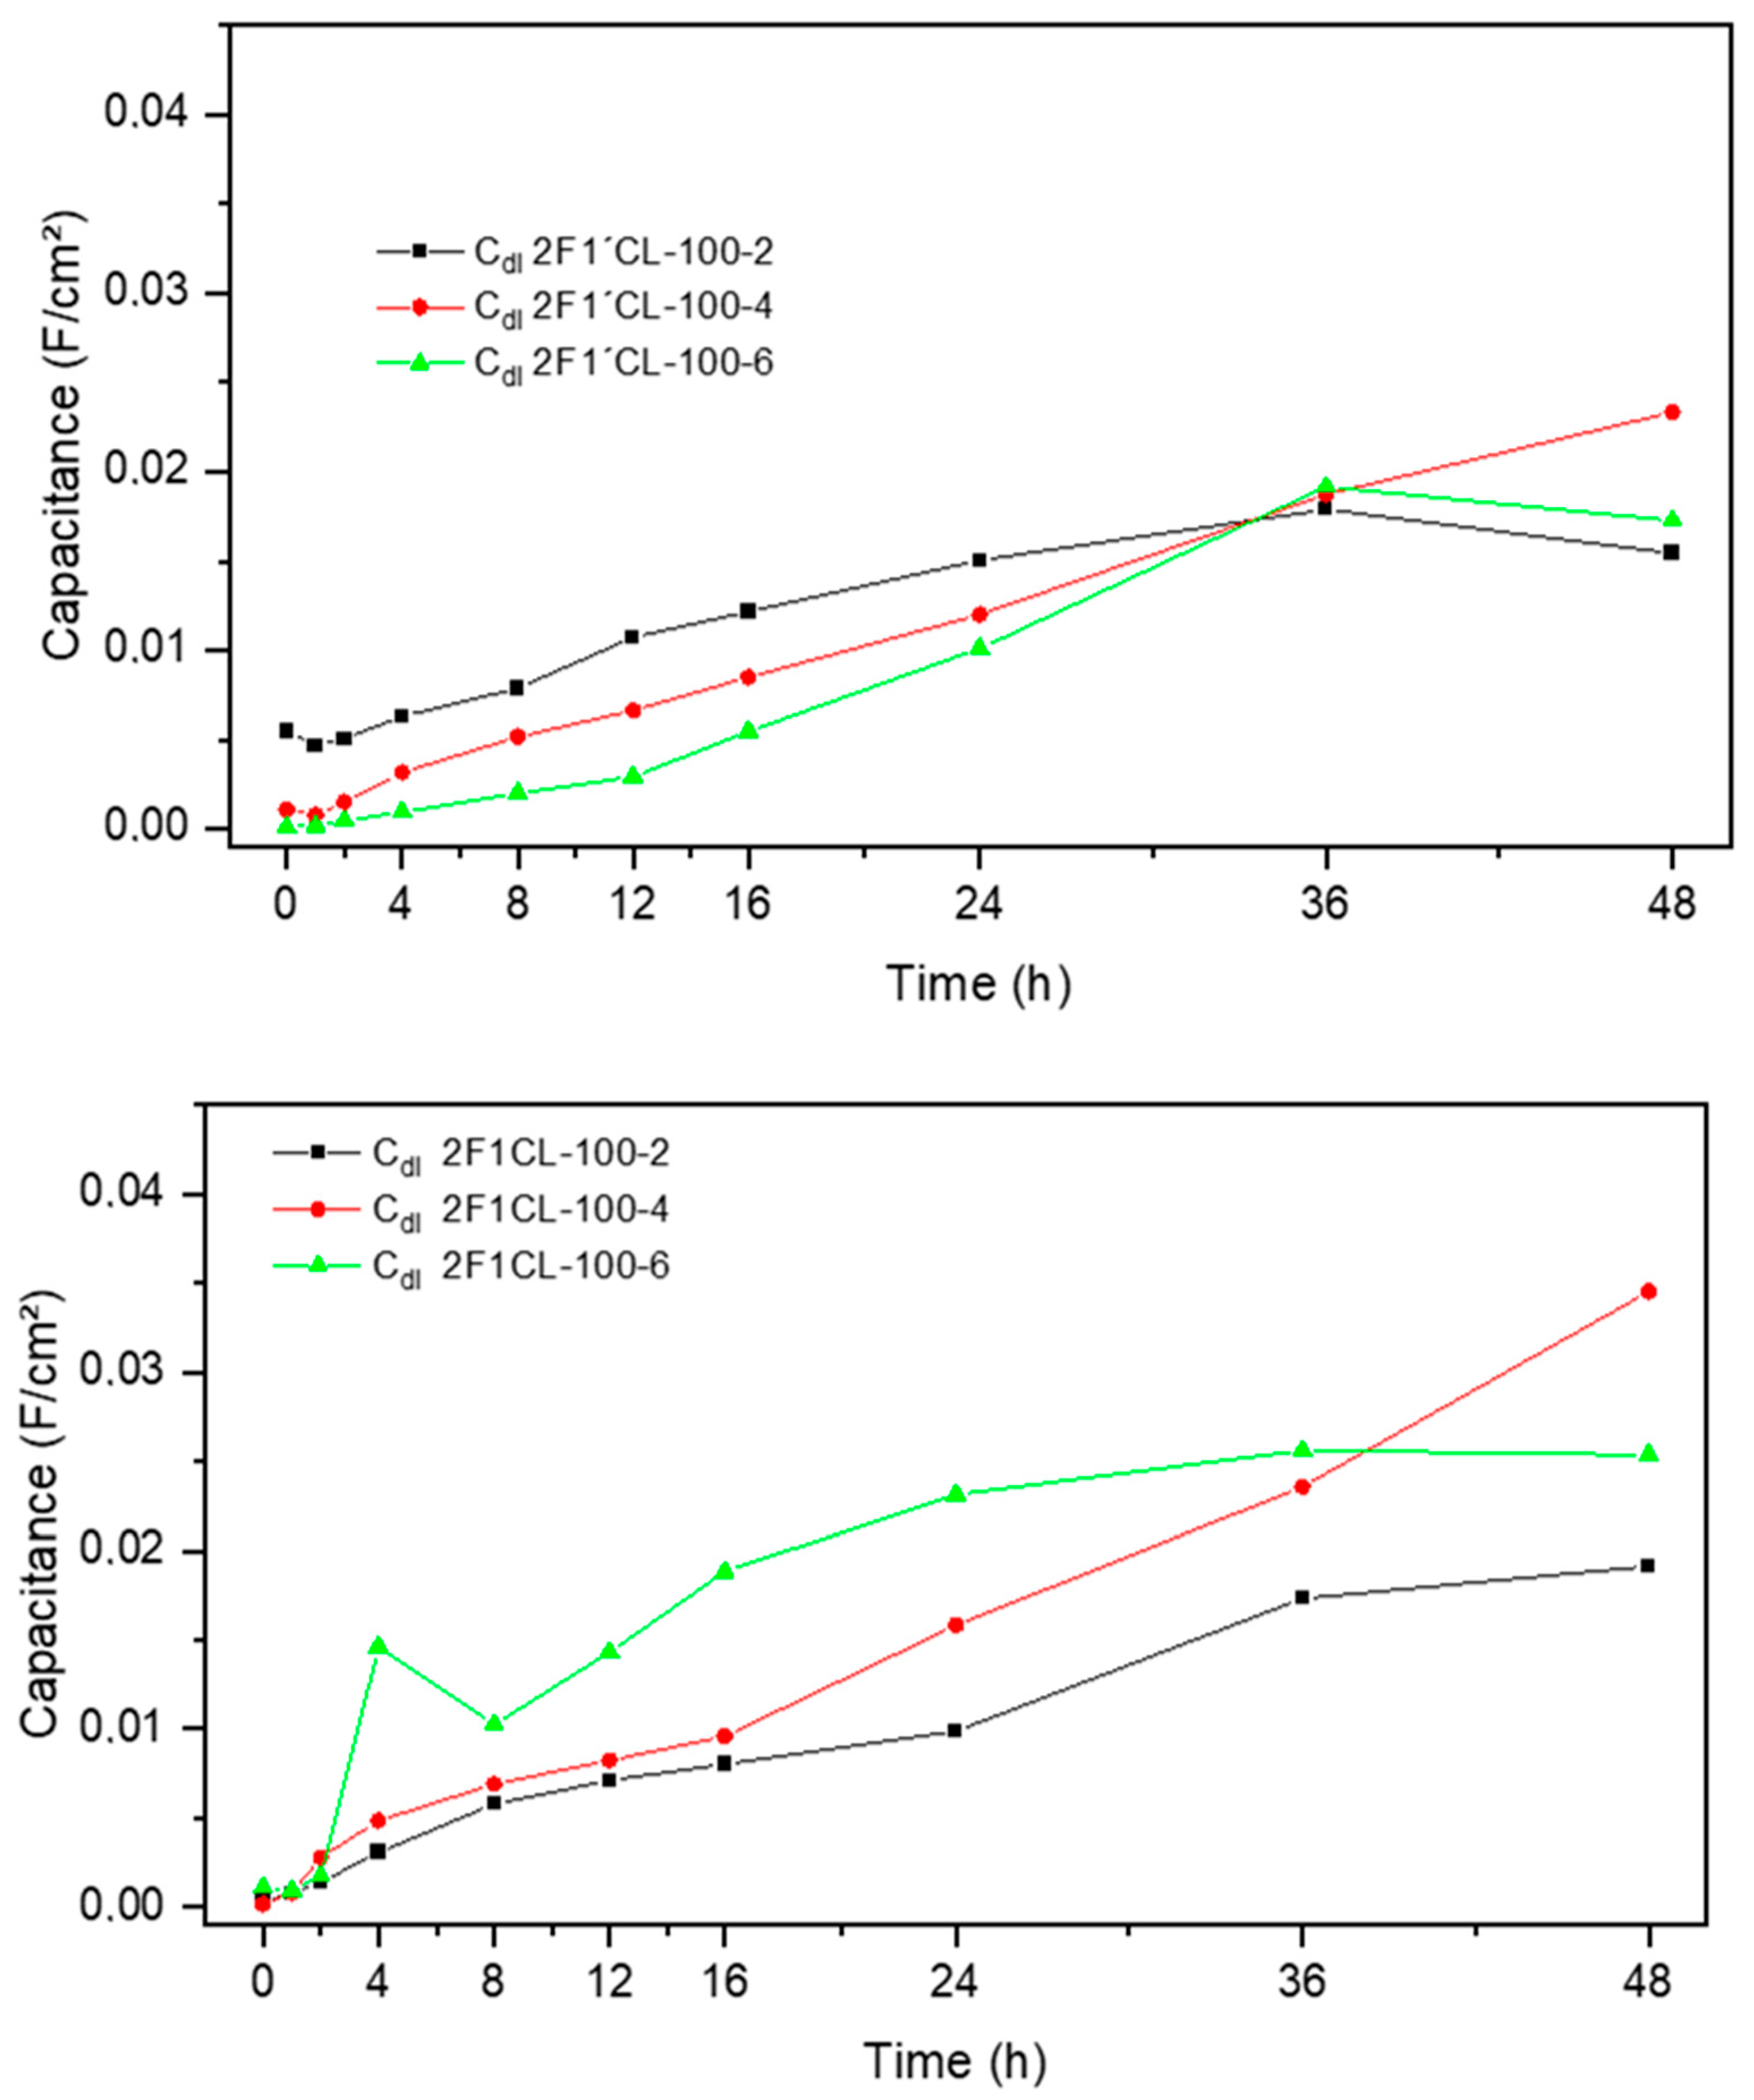
Figure 11 shows the Cdl evolution. All the samples show a sharp increase in capacitance in the first 12 h, followed by a more gradual rise. The sample 2F1′CL-100-6 (green triangles) shows the lowest overall increase in capacitance, starting near zero and reaching a final value of approximately 0.016 F/cm2. This slow and limited rise in capacitance indicates that this coating maintains its barrier properties for a longer period, with minimal exposure of the substrate. This finding is consistent with its superior Rp observed in the previous analysis.
Figure 11.
Evolution of double-layer capacitance through time, second batch of samples.
Correspondingly, Cdl also decreases with the number of layers. Since Cdl is proportional to the electrochemically active surface area, a lower Cdl value indicates that fewer regions of the substrate are exposed to the electrolyte, consistent with a more effective barrier provided by the additional layers. This reduction in Cdl also reflects a decrease in local dielectric constant variations at the interface, as the coating maintains a more uniform and intact structure. A low rate of capacitance increase (as seen for 2F1′CL-100-6) is a strong indicator of a more durable and effective protective coating.
Meanwhile, the electrolyte resistance (Re) which can be directly observed as a shift in the starting point of the Nyquist plots along the real axis (Figure 9), shows a slight increase with more coating layers, as the additional thickness increases the ionic path length and introduces more obstacles to ion transport.
Overall, the combined evolution of Rct, Cdl, and Re demonstrates that multilayer coatings improve corrosion resistance by both increasing the barrier effect and limiting the electrochemically active area exposed to the aggressive medium.
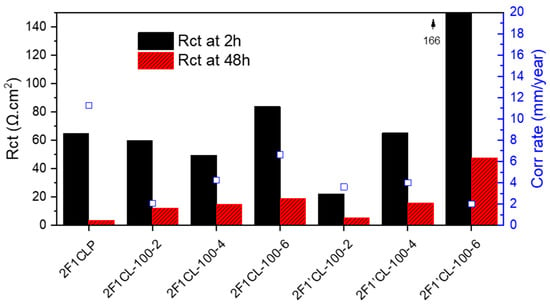
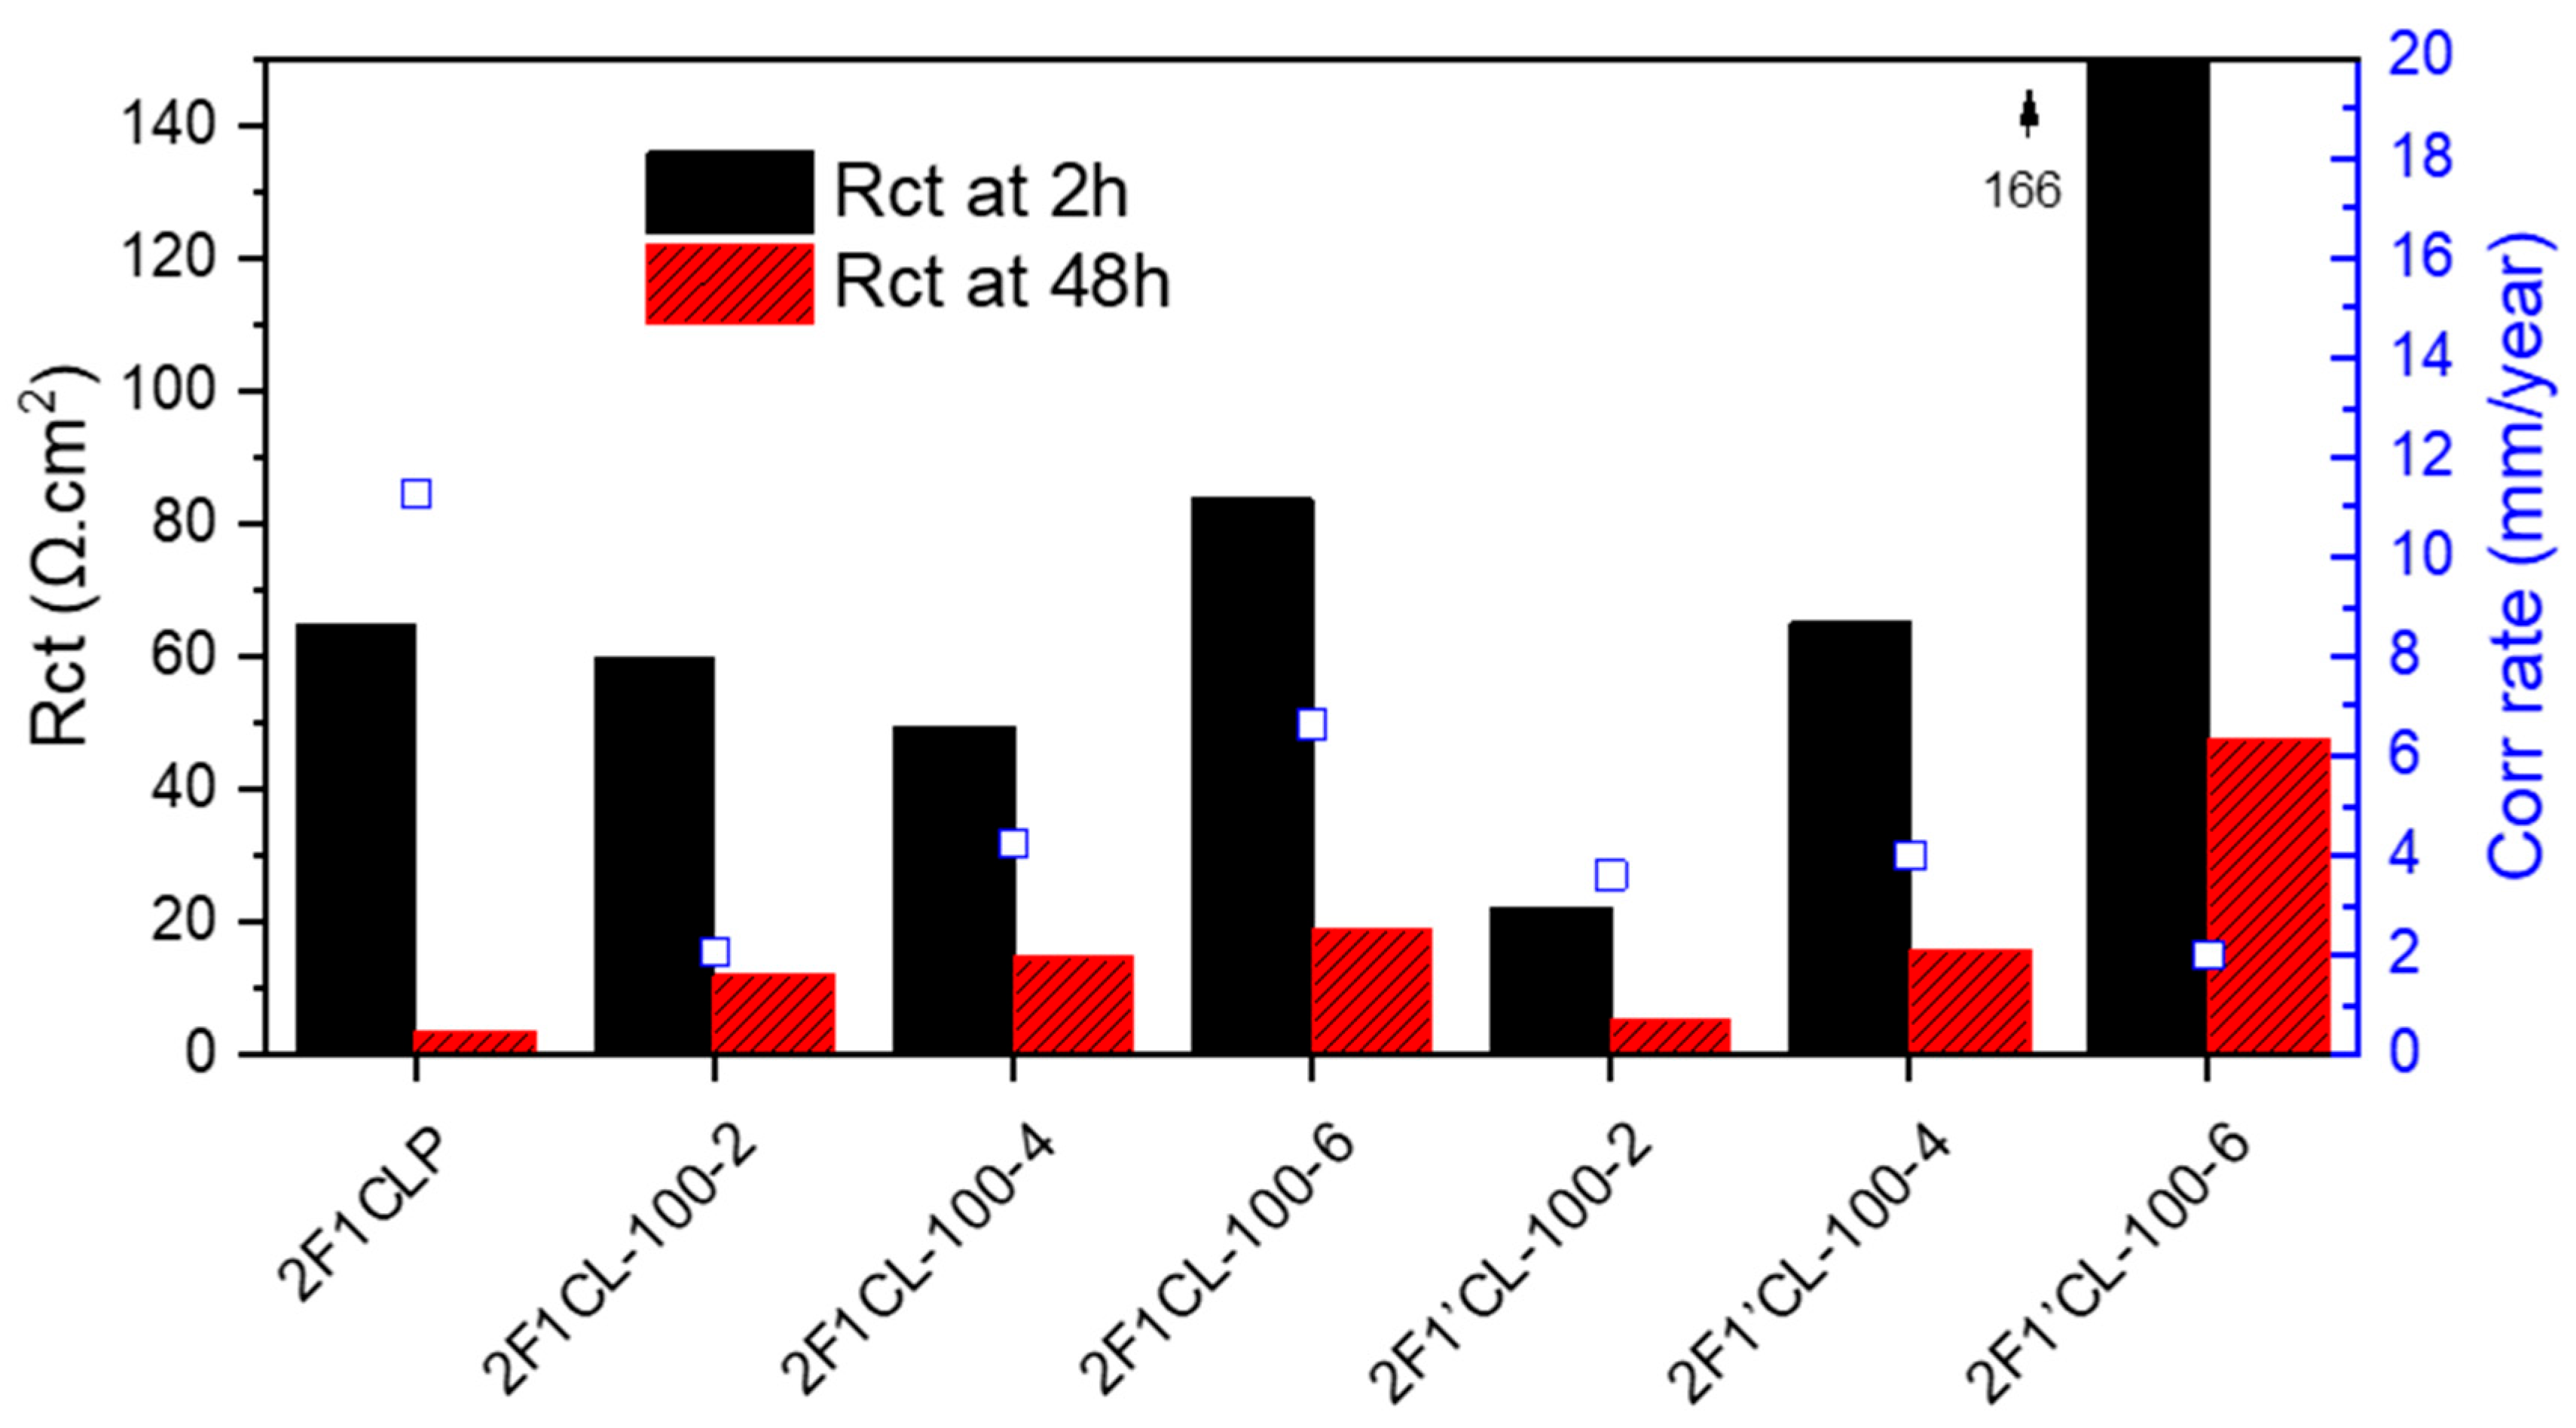
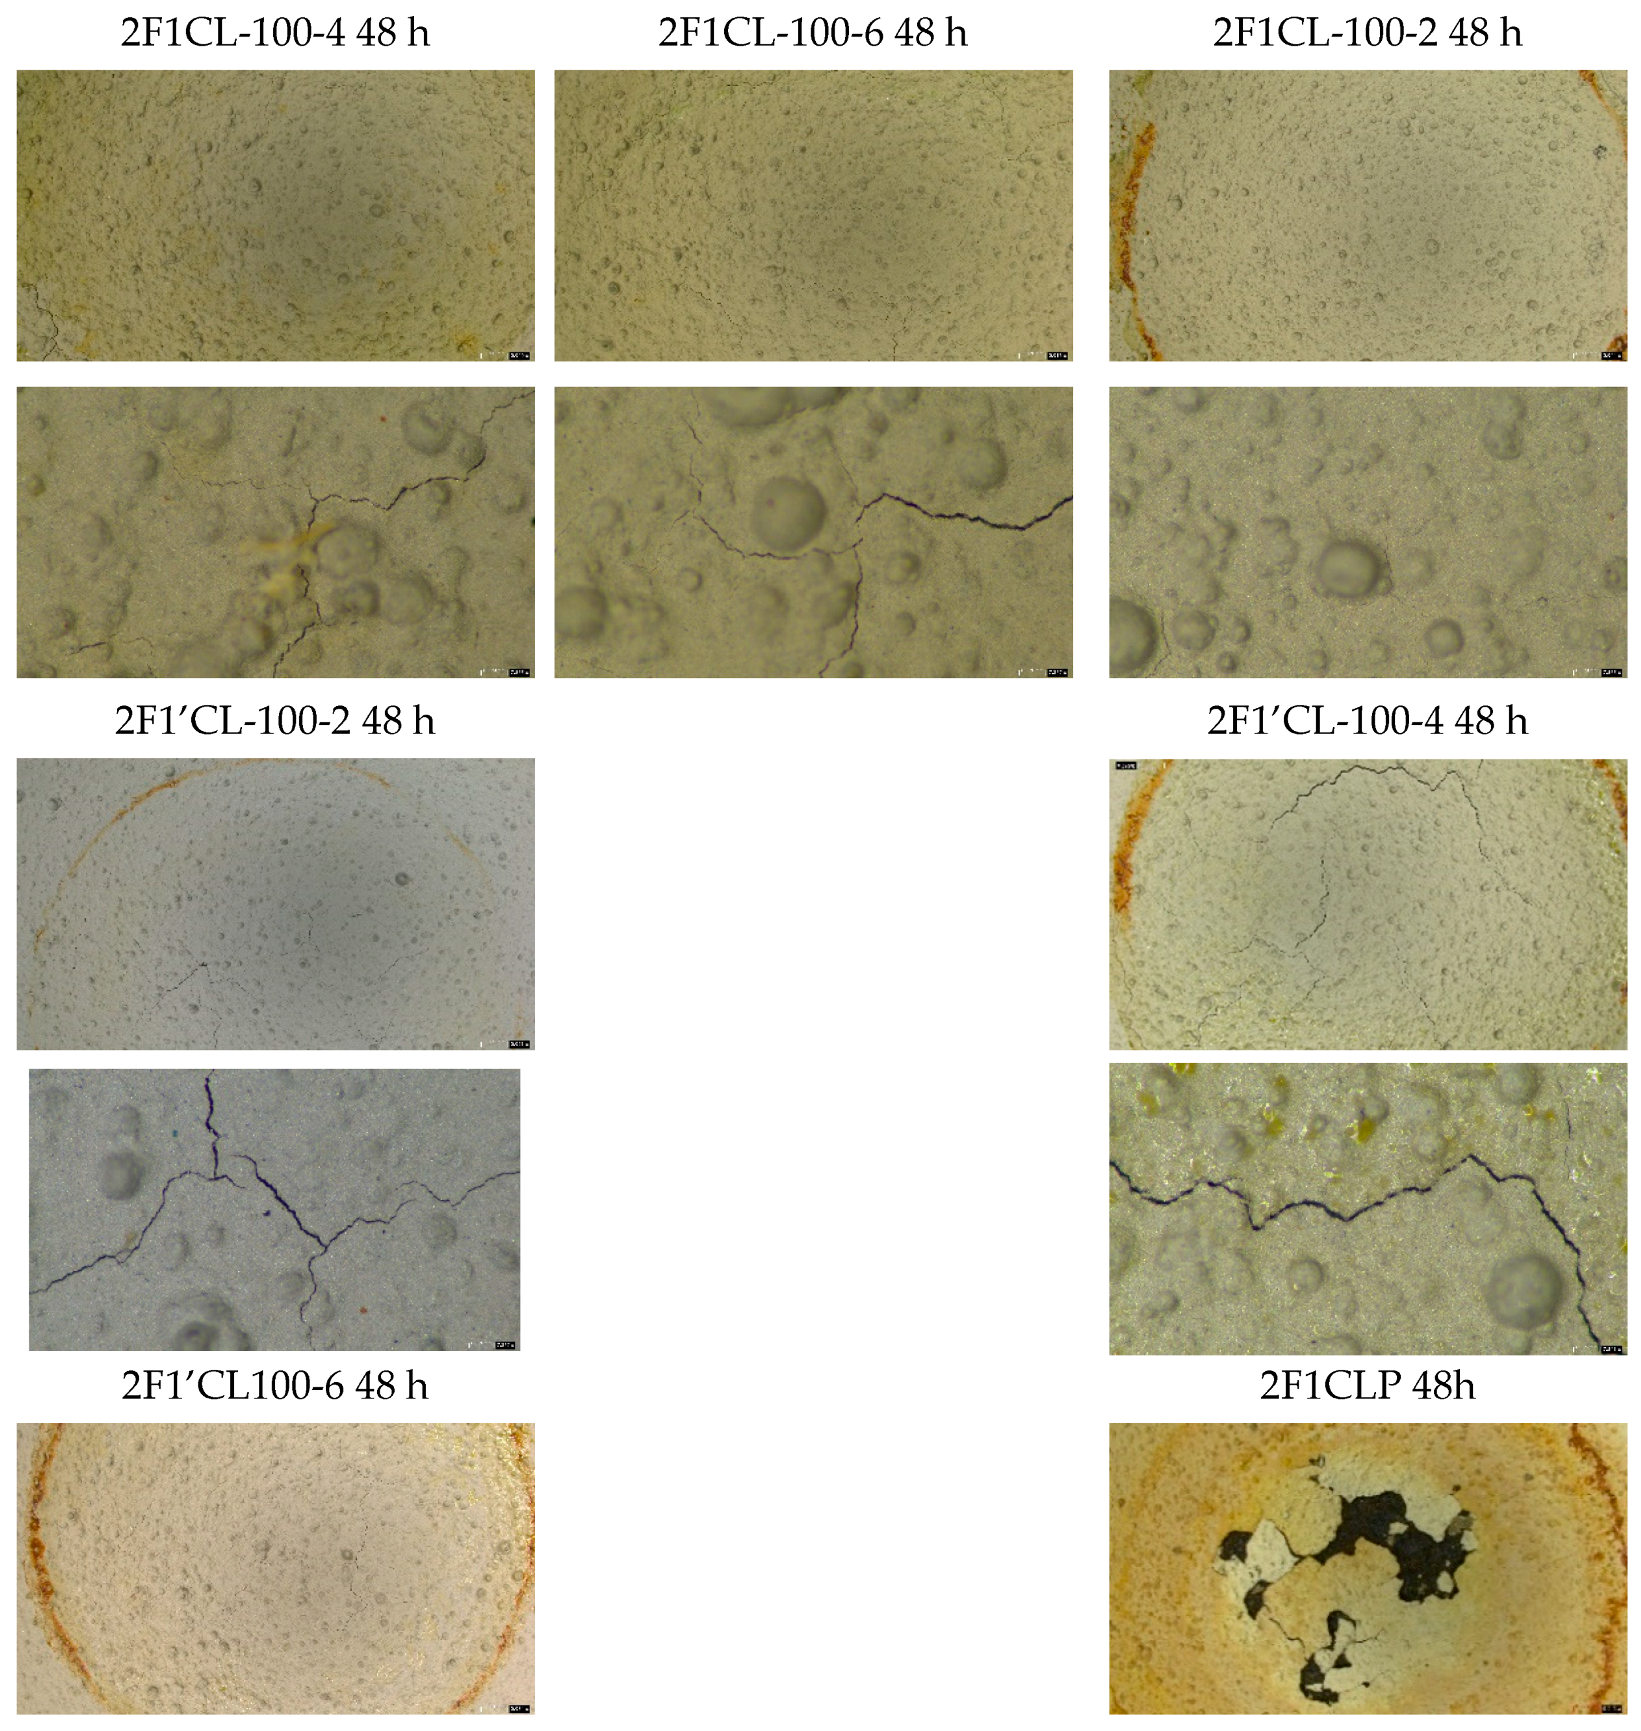
To gain a clearer understanding of the coating’s corrosion behavior, the electrochemical results were complemented with weight-loss measurements (Figure 12) and microscopic analysis (Figure 13).
Figure 12.
Comparison of average Rct values vs. corrosion rates of the second batch of coatings.
Figure 13.
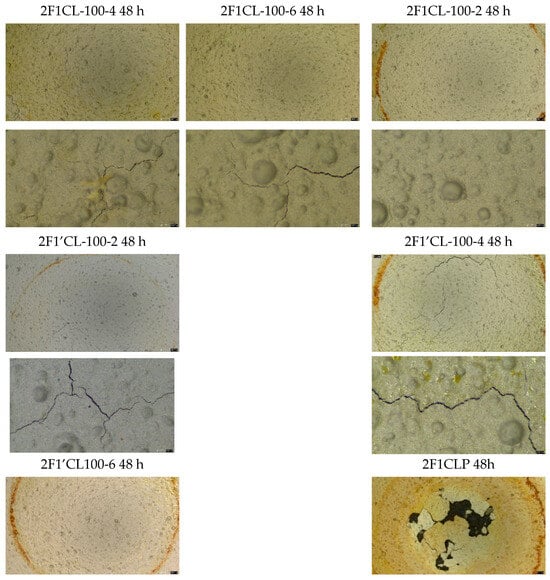
Surfaces of second batch of samples at 1× and 4× magnification, after 48 h of attack.
The weight-loss and corrosion-rate measurements (Figure 12) compare the polarization resistance (Rct) and corrosion rates for the six different samples. All samples show a significant decrease in Rct from 2 to 48 h, which means the coatings’ protective ability deteriorated over time. This is a common phenomenon, as the electrolyte penetrates the coating and reaches the substrate, initiating corrosion.
- Sample 2F1′CLP: This sample starts with a moderate Rp (around 64 Ωcm2) but experiences a dramatic drop after 48 h, with its Rct becoming very low. Its corrosion rate is the highest among all the samples, indicating very poor long-term resistance.
- Samples 2F1CL-100-2, 2F1CL-100-4, and 2F1CL-100-6: These samples have a consistent initial Rp in the range of 50–85 Ωcm2. While they all suffer a considerable loss of protection, their final Rct values are clustered together, showing similar long-term performance. Their corrosion rates are also in a similar mid-range, suggesting they offer a moderate level of protection, but their effectiveness diminishes significantly.
- Samples 2F1′CL-100-2 and 2F1′CL-100-4: These two samples start with moderate Rct values and also show a large drop after 48 h. Their performance is comparable to the 2F1CL series, showing a similar failure pattern.
- Sample 2F1′CL-100-6: This sample is the best performer in this batch. It has an exceptionally high initial Rct of 166 Ωcm2, which is more than double the next-highest value. Although its Rct also decreases after 48 h, it remains the highest among all samples, with a value around 48 Ωcm2. Consequently, its corrosion rate is the lowest in the batch. This indicates that this coating provides the most effective corrosion resistance.
The results show that while all coatings degrade over time, 2F1′CL-100-6 stands out as the most effective coating in this batch. It provides the highest initial corrosion resistance and maintains significantly better performance after 48 h compared to all other samples. The other coatings offer only moderate protection that diminishes rapidly, with 2F1′CLP being the least effective in the long term. Therefore, these are consistent with the trends observed in previous EIS data. The results indicate that thicker, multilayered coatings provide more effective protection against the penetration of acidic electrolytes to the metal substrate. Consequently, increasing the number of coating layers leads to higher charge-transfer resistance (Rct). Among the samples tested, 2F1CL-100-6 exhibited the highest corrosion resistance after 48 h, showing the lowest corrosion rate of approximately 1.53 mm/year.
Microscopic analysis at low magnifications (1×, 4×) (Figure 13) exhibits varying degrees of degradation, primarily in the form of cracking and delamination. In particular:
- Samples 2F1CL100-4, 2F1CL100-6, 2F1CL100-2: These samples show significant surface cracking. The cracks appear to be localized, originating from a central point and propagating outwards. The surface texture also shows signs of a porous or blistered morphology. This suggests that the coating material is susceptible to electrolyte ingress, leading to internal stress and subsequent cracking.
- Samples 2F1′CL100-2, 2F1′CL100-4, 2F1′CL100-6: These samples show a similar pattern of cracking, but the cracks appear to be finer and more widely distributed compared to the 2F1CL100 series. The crack network is more extensive, suggesting a different mode of failure, possibly related to internal micro-stresses or a different formulation. The presence of dark lines within the cracks indicates that the corrosive medium has penetrated the coating, reaching the substrate.
- Sample 2F1CLP: This sample shows a distinctly different failure mechanism. Instead of cracking, it exhibits severe delamination and bubbling of the coating. A large portion of the coating has detached from the substrate, exposing the underlying surface. This indicates a loss of adhesion between the coating and the substrate, which is a critical failure mode in protective coatings. The delamination is likely caused by the formation of an electrochemical cell at the coating–substrate interface, leading to the buildup of corrosive products and subsequent loss of adhesion.
In conclusion, all samples show significant degradation after just 48 h of immersion. Therefore, while the integrity of the protective barrier is compromised by the presence of through-thickness cracks, the ability of the coating to resist complete detachment from the substrate is a positive attribute (with the single exception of 2F1CLP, which exhibited a catastrophic failure of adhesion). This suggests that the primary challenge lies in improving the mechanical properties of the coating film—specifically, its flexibility and resistance to internal stress—rather than addressing a fundamental issue with its adhesive properties.
The observed cracks serve as preferential pathways for corrosive species, but the remaining adhered coating still provides a measure of physical protection, slowing down the overall corrosion rate compared to a scenario of complete delamination. These results combined with electrochemical measurements indicate that the corrosion activity at the metal surface beneath 2F1CL-100-6 is lower than in the other samples. This can be explained by the multilayered structure of the coating, which acts as an additional barrier: although surface cracks are present, the multiple layers reduce the connectivity of the cracks and hinder the diffusion of corrosive species into the interior, thereby maintaining a higher overall corrosion resistance.
The proposed additional annealing post-treatment on the PDC coatings appears to result in poorer performance compared to the crosslinking-only post-treatment. Sample 2F1CLP exhibited the lowest stability in the batch, dissolving almost completely in acid (Figure 13, bottom right corner), and correspondingly showed the lowest Rp and highest corrosion rate values. These findings indicate that this type of thermal treatment is unsuitable for the remaining samples.
In conclusion, considering its superior Rct values over 48 h of testing and the lowest observed corrosion rate (Figure 13), the coating designated 2F1’CL-100-6 (MK/SiC (50%) + 16.6 wt.% solvent, treated at 200 °C in air, 100 cm3, applied in six layers) has been selected as the most promising option for implementation in refinery components exposed to an intense corrosion process.
In a forthcoming phase of the project, this coating will be implemented in a real plant environment (TUPRAS Refinery) and continuously monitored to evaluate its performance under actual operating conditions.
4. Conclusions
A novel PDC coating was successfully formulated and characterized for acid corrosion protection in refinery environments, combining MK/SiC fillers with optimized solvent content. Electrochemical and immersion tests showed that crosslinking treatment alone provides superior corrosion resistance compared to additional annealing at 700 °C, yielding higher Rct values and lower corrosion rates. Among all samples, 2F1’CL-100-6 (MK/SiC (50%) + 16.6 wt.% solvent, treated at 200 °C in air, applied in six layers) exhibited the best performance and has been selected for further implementation. In a forthcoming phase of the project, this coating will be applied in a real plant environment and continuously monitored to evaluate its long-term behavior under actual operating conditions. Overall, these results demonstrate the strong potential of PDC coatings as an effective solution for corrosion protection in the oil and gas industry.
Author Contributions
Conceptualization, L.F., I.E. and M.B.; methodology, M.B. and I.E.; validation, I.E., O.O., C.A. and S.T.; formal analysis, L.F. and M.B.; investigation, M.B. and I.E., writing—original draft preparation, L.F. and I.E.; writing—review and editing, L.F., M.B., O.O. and C.A.; supervision, L.F., C.A. and M.B.; project administration, M.B.; funding acquisition, M.B., O.O. and L.F. All authors have read and agreed to the published version of the manuscript.
Funding
This research was funded by ACHIEF project, GA No 858374.
Institutional Review Board Statement
Not applicable.
Informed Consent Statement
Not applicable.
Data Availability Statement
Data will be made available upon reasonable request.
Conflicts of Interest
Author Orhun Oguz, Cem Aciksari and Safhak Turan were employed by the company Turkiye Petrol Rafinerileri Anonim Sirketi. The remaining authors declare that the research was conducted in the absence of any commercial or financial relationships that could be construed as a potential conflict of interest.
References
- Ma, S.; Lei, T.; Meng, J.; Liang, X.; Guan, D. Contributions of key countries, enterprises, and refineries to greenhouse gas emissions in global oil refining, 2000–2021. Innovation 2023, 4, 100361. [Google Scholar] [CrossRef] [Scilit] [PubMed]
- Gupta, S. Refinery Emissions: Implications of Carbon Tax and Mitigation Options. 2022. Available online: https://www.woodmac.com/news/opinion/refinery-emissions-carbon-tax-and-migration/ (accessed on 15 June 2025).
- Lei, T.; Guan, D.; Shan, Y.; Zheng, B.; Liang, X.; Meng, J.; Zhang, Q.; Tao, S. Adaptive CO2 emissions mitigation strategies of global oil refineries in all age groups. One Earth 2021, 4, 1114–1126. [Google Scholar] [CrossRef] [Scilit]
- European Comission. The European Green Deal Striving to be the First Climate-Neutral Continent. Available online: https://commission.europa.eu/strategy-and-policy/priorities-2019-2024/european-green-deal_en (accessed on 15 June 2025).
- Al-Moubaraki, A.H.; Obot, I.B. Corrosion challenges in petroleum refinery operations: Sources, mechanisms, mitigation, and future outlook. J. Saudi Chem. Soc. 2021, 25, 101370. [Google Scholar] [CrossRef] [Scilit]
- Barroso, G.; Li, Q.; Bordia, R.K.; Motz, G. Polymeric and ceramic silicon-based coatings—A review. J. Mater. Chem. A Mater. 2019, 7, 1936–1963. [Google Scholar] [CrossRef] [Scilit]
- Taghvaei, A.H.; Shokrollahi, H.; Janghorban, K. Magnetic and structural properties of iron phosphate-phenolic soft magnetic composites. J. Magn. Magn. Mater. 2009, 321, 3926–3932. [Google Scholar] [CrossRef] [Scilit]
- Taghvaei, A.H.; Shokrollahi, H.; Janghorban, K. Properties of iron-based soft magnetic composite with iron phosphate-silane insulation coating. J. Alloys Compd. 2009, 481, 681–686. [Google Scholar] [CrossRef] [Scilit]
- Taghvaei, A.H.; Shokrollahi, H.; Janghorban, K.; Abiri, H. Eddy current and total power loss separation in the iron-phosphate-polyepoxy soft magnetic composites. Mater. Des. 2009, 30, 3989–3995. [Google Scholar] [CrossRef] [Scilit]
- Strečková, M.; Sopčák, T.; Medvecký, Ľ.; Bureš, R.; Fáberová, M.; Batko, I.; Briančin, J. Preparation, chemical and mechanical properties of microcomposite materials based on Fe powder and phenol-formaldehyde resin. Chem. Eng. J. 2012, 180, 343–353. [Google Scholar] [CrossRef] [Scilit]
- Colombo, P.; Mera, G.; Riedel, R.; Sorarù, G.D. Polymer-derived ceramics: 40 Years of research and innovation in advanced ceramics. J. Am. Ceram. Soc. 2010, 93, 1805–1837. [Google Scholar] [CrossRef] [Scilit]
- Torrey, J.D.; Bordia, R.K. Processing of polymer-derived ceramic composite coatings on steel. J. Am. Ceram. Soc. 2008, 91, 41–45. [Google Scholar] [CrossRef] [Scilit]
- Trentin, A.; Pakseresht, A.; Duran, A.; Castro, Y.; Galusek, D. Electrochemical Characterization of Polymeric Coatings for Corrosion Protection: A Review of Advances and Perspectives. Polymers 2022, 14, 2306. [Google Scholar] [CrossRef] [Scilit] [PubMed]
- Bongiorno, V.; Michailidou, E.; Curioni, M. Evaluating organic coating performance by EIS: Correlation between long-term EIS measurements and corrosion of the metal substrate. Mater. Corros. 2023, 75, 156–173. [Google Scholar] [CrossRef] [Scilit]
- Fréchette, É.; Compère, C.; Ghali, E. Evaluation of the Corrosion Resistance of Painted Steels by Impedance Measurements. Corros. Sci. 1992, 33, 1067–1081. [Google Scholar] [CrossRef] [Scilit]
- Orazem, M.E.; Tribollet, B. Front Matter. In Electrochemical Impedance Spectroscopy; Wiley: Hoboken, NJ, USA, 2008. [Google Scholar] [CrossRef] [Scilit]
- Freire, L.; Catarino, M.A.; Godinho, M.I.; Ferreira, M.J.; Ferreira, M.G.S.; Simões, A.M.P.; Montemor, M.F. Electrochemical and analytical investigation of passive films formed on stainless steels in alkaline media. Cem. Concr. Compos. 2012, 34, 1075–1081. [Google Scholar] [CrossRef] [Scilit]
- Randles, J.E.B. Kinetics of rapid electrode reactions. Discuss. Faraday Soc. 1947, 1, 11–19. [Google Scholar] [CrossRef] [Scilit]
- GAMRY Instruments. Presentation: EIS for Corrosion & Coatings; GAMRY Instruments: Warminster, PA, USA, 2003. [Google Scholar]
- Šoljić, I.; Šoić, I.; Kostelac, L.; Martinez, S. AC interference impact on EIS assessment of organic coatings using dummy cells, calibration foils and field exposed coated samples. Prog. Org. Coat. 2022, 165, 106767. [Google Scholar] [CrossRef] [Scilit]
- Akbarinezhad, E.; Rezaei, F.; Neshati, J. Evaluation of a high resistance paint coating with EIS measurements: Effect of high AC perturbations. Prog. Org. Coat. 2008, 61, 45–52. [Google Scholar] [CrossRef] [Scilit]
- Freire, L.; Carmezim, M.J.; Ferreira, M.G.S.; Montemor, M.F. The electrochemical behaviour of stainless steel AISI 304 in alkaline solutions with different pH in the presence of chlorides. Electrochim. Acta 2011, 56, 5280–5289. [Google Scholar] [CrossRef] [Scilit]
- Freire, L.; Carmezim, M.J.; Ferreira, M.G.S.; Montemor, M.F. The passive behaviour of AISI 316 in alkaline media and the effect of pH: A combined electrochemical and analytical study. Electrochim. Acta 2010, 55, 6174–6181. [Google Scholar] [CrossRef] [Scilit]



Disclaimer/Publisher’s Note: The statements, opinions and data contained in all publications are solely those of the individual author(s) and contributor(s) and not of MDPI and/or the editor(s). MDPI and/or the editor(s) disclaim responsibility for any injury to people or property resulting from any ideas, methods, instructions or products referred to in the content. |
© 2026 by the authors. Licensee MDPI, Basel, Switzerland. This article is an open access article distributed under the terms and conditions of the Creative Commons Attribution (CC BY) license.