


Abstract
Under the influence of engineering disturbances, the loading rate of surrounding rock is in a state of continuous adjustment. This study conducts experimental investigations on the mechanical response characteristics under different strain rates (10−5 s−1, 10−4 s−1, and 10−3 s−1). During the uniaxial loading process of coal–rock composite specimens, multi-parameter monitoring was implemented, and a systematic study was carried out on the ring-down count induced by microcracks, the energy values of acoustic emission (AE) events, the stage-dependent strain characteristics on the specimen surface, and the surface temperature variation characteristics. Additionally, the stress–strain curve characteristics under different strain rates were comparatively analyzed in stages. The loading process of the coal–rock composite specimens was reproduced using the Particle Flow Code (PFC3D 6.0) simulation software. The simulation results indicate that the stress–strain results obtained from the simulation are in good agreement with the laboratory test results; based on these simulation results, the energy accumulation and dissipation characteristics of the coal–rock composite specimens under the influence of strain rate were revealed. Furthermore, a microscopic damage model considering strain rate was constructed based on the Weibull probability statistics theory. The results show that strain rate has a significant impact on the strength, elastic modulus, and failure mode of the coal–rock composite specimens. At low strain rates, the specimens exhibit obvious progressive failure characteristics and strain localization phenomena, while at higher strain rates, they show brittle sudden failure characteristics. Meanwhile, the thermal imaging results reveal that at high strain rates, the overall temperature rise in the composite specimens is rapid, whereas at low strain rates, the overall temperature rise is slow—but the temperature rise in the coal portion is faster than that in the rock portion. The peak temperature at high strain rates is approximately 2 °C higher than that at low strain rates. The PFC simulation results demonstrate that the larger the strain rate, the faster the growth rate of plastic energy in the post-peak stage and the faster the release rate of elastic energy.
1. Introduction
The exploitation of coal resources is governed by multiple factors, including policy frameworks, economic conditions, and production-related geological settings. Coal–rock composites are often in a complex stress environment, which is very important to the stability of the overlying rock structure of the roadway [1,2]. In the actual mining process, different engineering disturbances (such as mining rate, unloading speed, blasting frequency) will lead to significant differences in the response of coal and rock mass at different strain rates. This change will lead to changes in the loading rate of the coal pillar and its roof and floor composition system [3]. Therefore, it is of great significance to study the mechanical response and deformation characteristics of coal–rock combination under different strain rates to prevent and control the catastrophic instability of coal pillars. Hence, investigating the mechanical behavior and deformation features of coal–rock interfaces under varying strain rates is crucial for mitigating and managing the sudden instability of coal pillars.
To date, scholars at home and abroad have investigated the macroscopic failure characteristics and physical-mechanical properties of rock specimens under varying strain rates. Dai et al. [4] examined the energy evolution characteristics of rock specimens containing multiple fractures under different dynamic loading strain rates. Zhang et al. [5] fabricated hard rock-like specimens and probed into their acoustic emission characteristics under diverse strain rates. Luo et al. [6] conducted research on rock specimens with complex fracture angles, focusing on the loading rate effect on their macroscopic mechanical properties (e.g., tensile and compressive strengths). Li et al. [7] investigated the loading rate effect on mudstone creep and concluded that the pre-creep loading rate exerts a significant influence on creep outcomes. Zhu et al. [8] believes that the peak stress and secant modulus of coal have a strong strain rate effect. Chen et al. [9] showed through uniaxial compression tests that the peak stress of dry coal–rock composites increases linearly with the loading rate, whereas this increasing trend weakens by 68.8% under saturated conditions. Zhang et al. [10] found that coal seam drilling at high strain rate can significantly weaken the burst tendency of coal. Zhang et al. [11] believed that the damage degree of coal measure mudstone is obvious under high strain rate, and the fracture morphology has obvious strain rate effect. Verstrynge et al. [12] revealed through studies on iron-bearing sandstone that a higher water content reduces the sensitivity of the elastic modulus to the loading rate. The above-mentioned scholars have investigated the strain rate effect of various rock samples and complex specimens containing multiple fractures; however, studies focusing on the physical and mechanical behavior of soft–hard composite rock specimens are still relatively scarce.
Both domestic and international studies have examined the macro–micro evolutionary behavior related to specimen size using diverse analytical approaches. Yang et al. [13] examined the mechanical properties of stable silt via digital image correlation (DIC) technology. Cao et al. [14] captured temperature anomalies in damaged regions using thermal imaging techniques, providing a novel pathway for the early warning of instability. Tal et al. [15] optimized the identification formulation for shear strain-induced cracks using digital image correlation (DIC) via a novel algorithm. Zhang et al. [16] validated via PFC3D that the strain energy rate correlates with the loading rate of granite. Different loading rates not only alter the stress–strain response of the material, but also significantly influence the energy input rate, energy conversion ratio, and the final fracture mode. Jiang et al. [17] investigated the energy characteristics of specimens under the influence of loading rates using the FLAC numerical simulation software. Sun et al. [18] found that the rate is related to the energy storage limit through the acoustic emission response characteristics of the rock filling combination. Liu et al. [19] investigated the evolution of wave velocity and acoustic emission (AE) responses of metamorphic sandstone under loading–unloading conditions. Lei et al. [20] elucidated the crack propagation law of granite during triaxial shear tests via acoustic emission (AE) monitoring. Deng et al. [21] investigated the fracture surface morphological characteristics of sandstone under different loading rates via scanning electron microscopy (SEM). Zhang et al. [22,23] calibrated the macroscopic and mesoscopic shear parameters of geotechnical granular materials using the particle flow model and proposed the value ranges for the mesoscopic parameters. Vishal et al. [24] found that gas further amplifies the effect of the loading rate on energy dissipation. Chen [25] used PFC simulations to reveal that the loading rate modulates energy transfer by altering the rate of particle bond breakage.
The Weibull model [26] can authentically reproduce the full process of materials from elastic deformation to gradual damage and eventual macroscopic failure while also effectively describing the damage propagation laws under the combined effects of the stress path and multi-field coupling. Zhi et al. [27] developed a high-temperature loess damage model based on the Weibull distribution, which enables effective prediction of the damage deformation of loess under shear loading. Wang et al. [28], based on the Weibull model, studied the damage characteristics of stabilized crushed stone. It was concluded that the damage factor has an inverse growth trend with the distribution parameters. Zhang et al. [29] extended the model to coal–rock composites, confirming its ability to capture rate-dependent damage evolution.
In summary, the existing research has revealed the influence of the loading rate of single soft rock and single hard rock, but there are few studies on the strain rate effect of hard rock and soft rock composite samples. In addition, the existing micro-damage model fails to consider the influence of strain rate, and there is also a lack of research on the energy transfer characteristics of hard rock and soft rock composite with large difference in compressive strength. In addition, there are few studies on the energy dissipation characteristics of soft and hard rock composite during loading based on thermal imagery. Therefore, this paper analyzes the stage characteristics of stress–strain under the influence of strain rate. At the same time, DIC surface strain monitoring, acoustic emission and thermal imaging are used to quantify the strain rate effect of coal–rock combination, and the micro-damage constitutive model is further improved based on the strain rate effect. Therefore, this paper systematically studies the acoustic emission energy evolution, infrared thermal imaging heat transfer law, strain field, stress field and energy field changes accompanied by the initial local stress concentration of coal pillar bearing structure to the accelerated expansion of cracks and finally to the instability of bearing structure, and introduces strain rate factor on the basis of micro-damage model.
2. Experimental Setup and Methodology
2.1. Specimen Fabrication
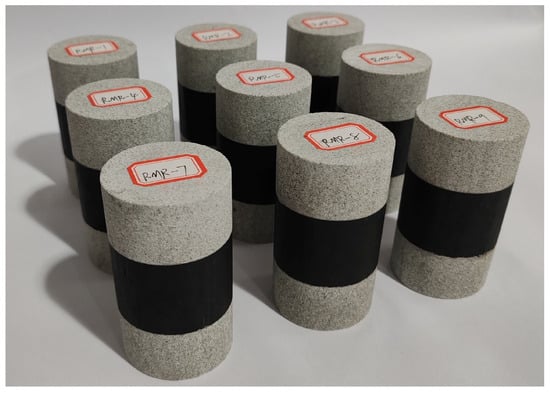
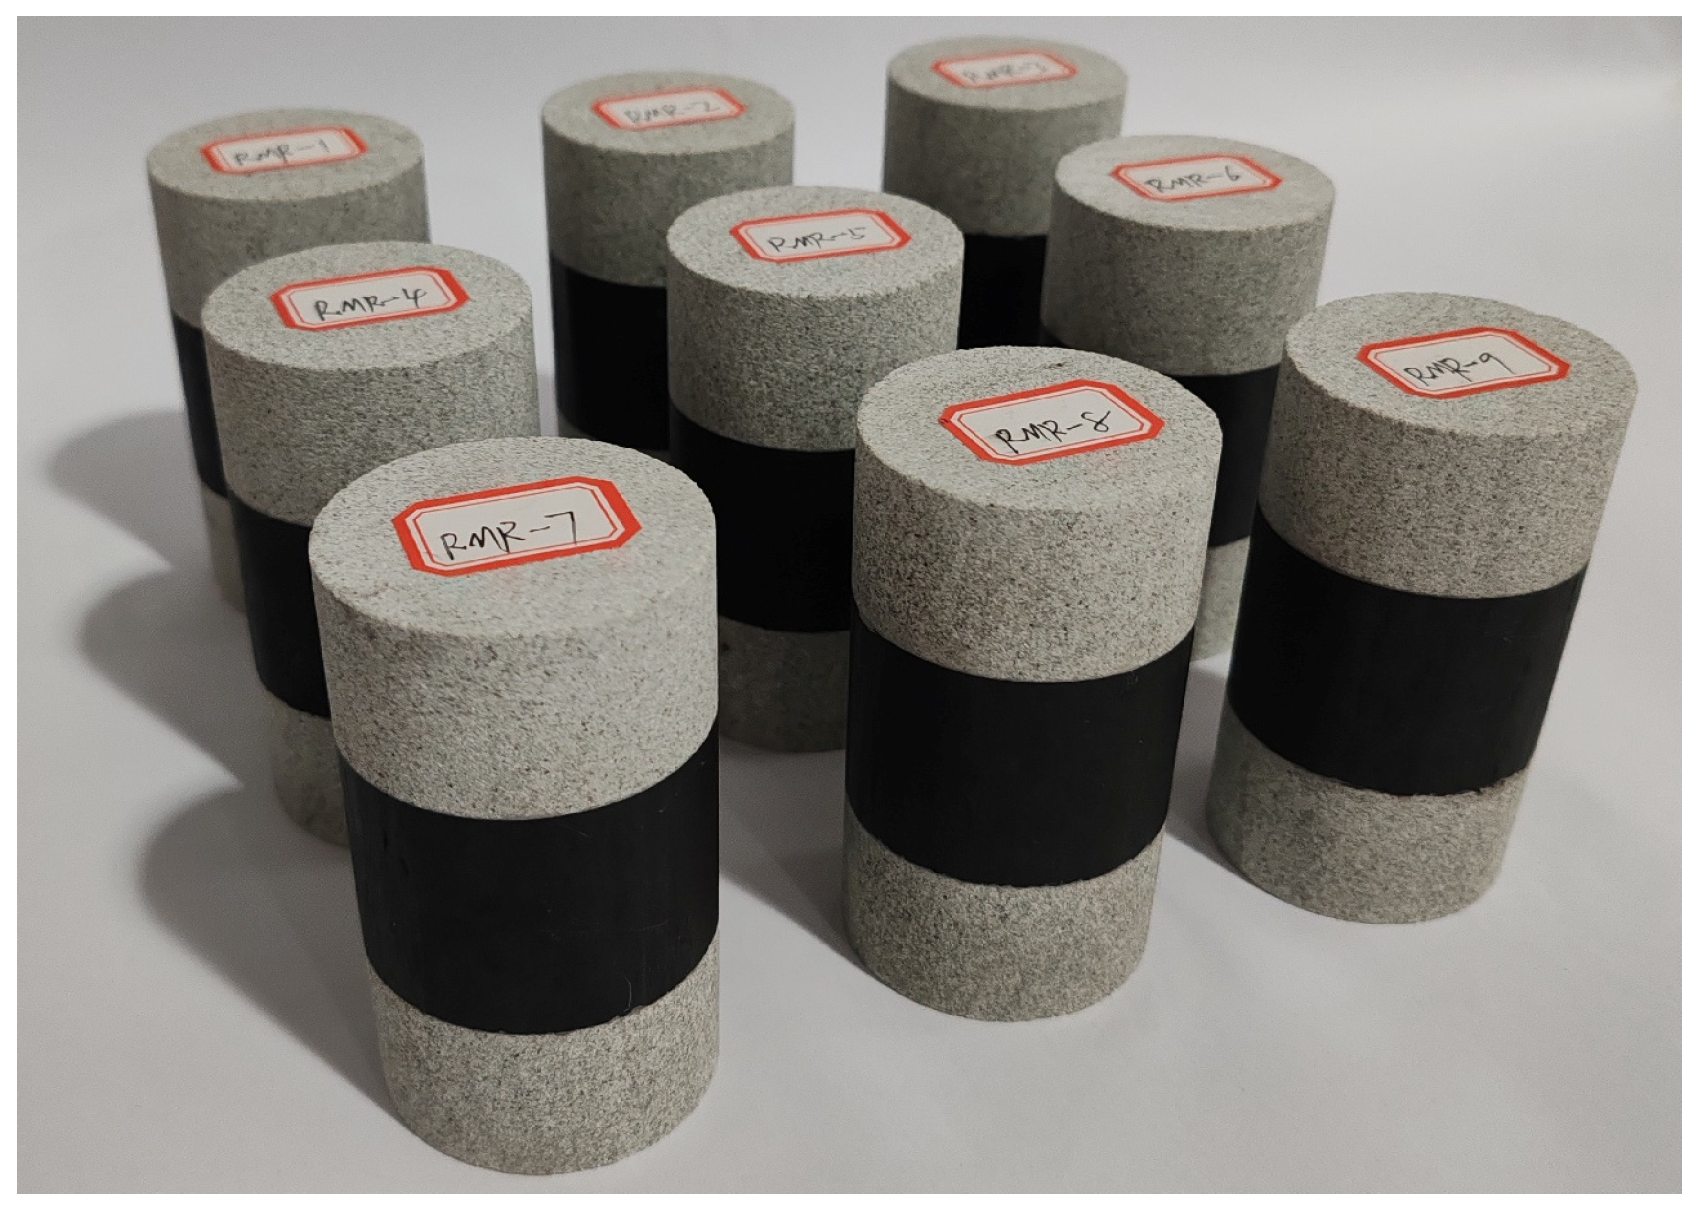
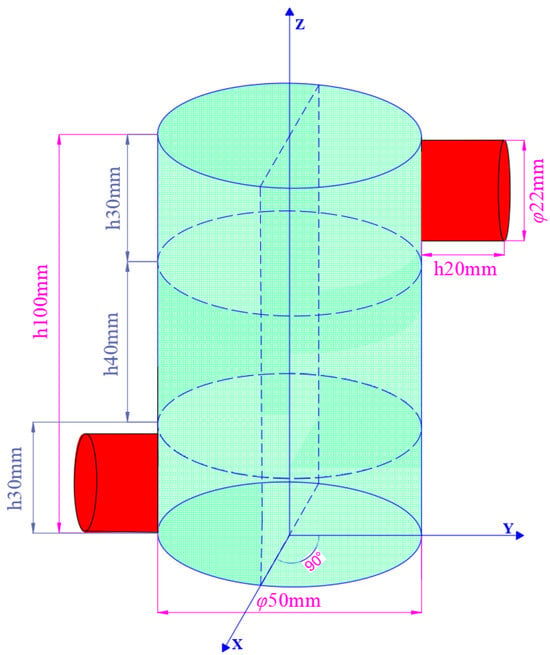
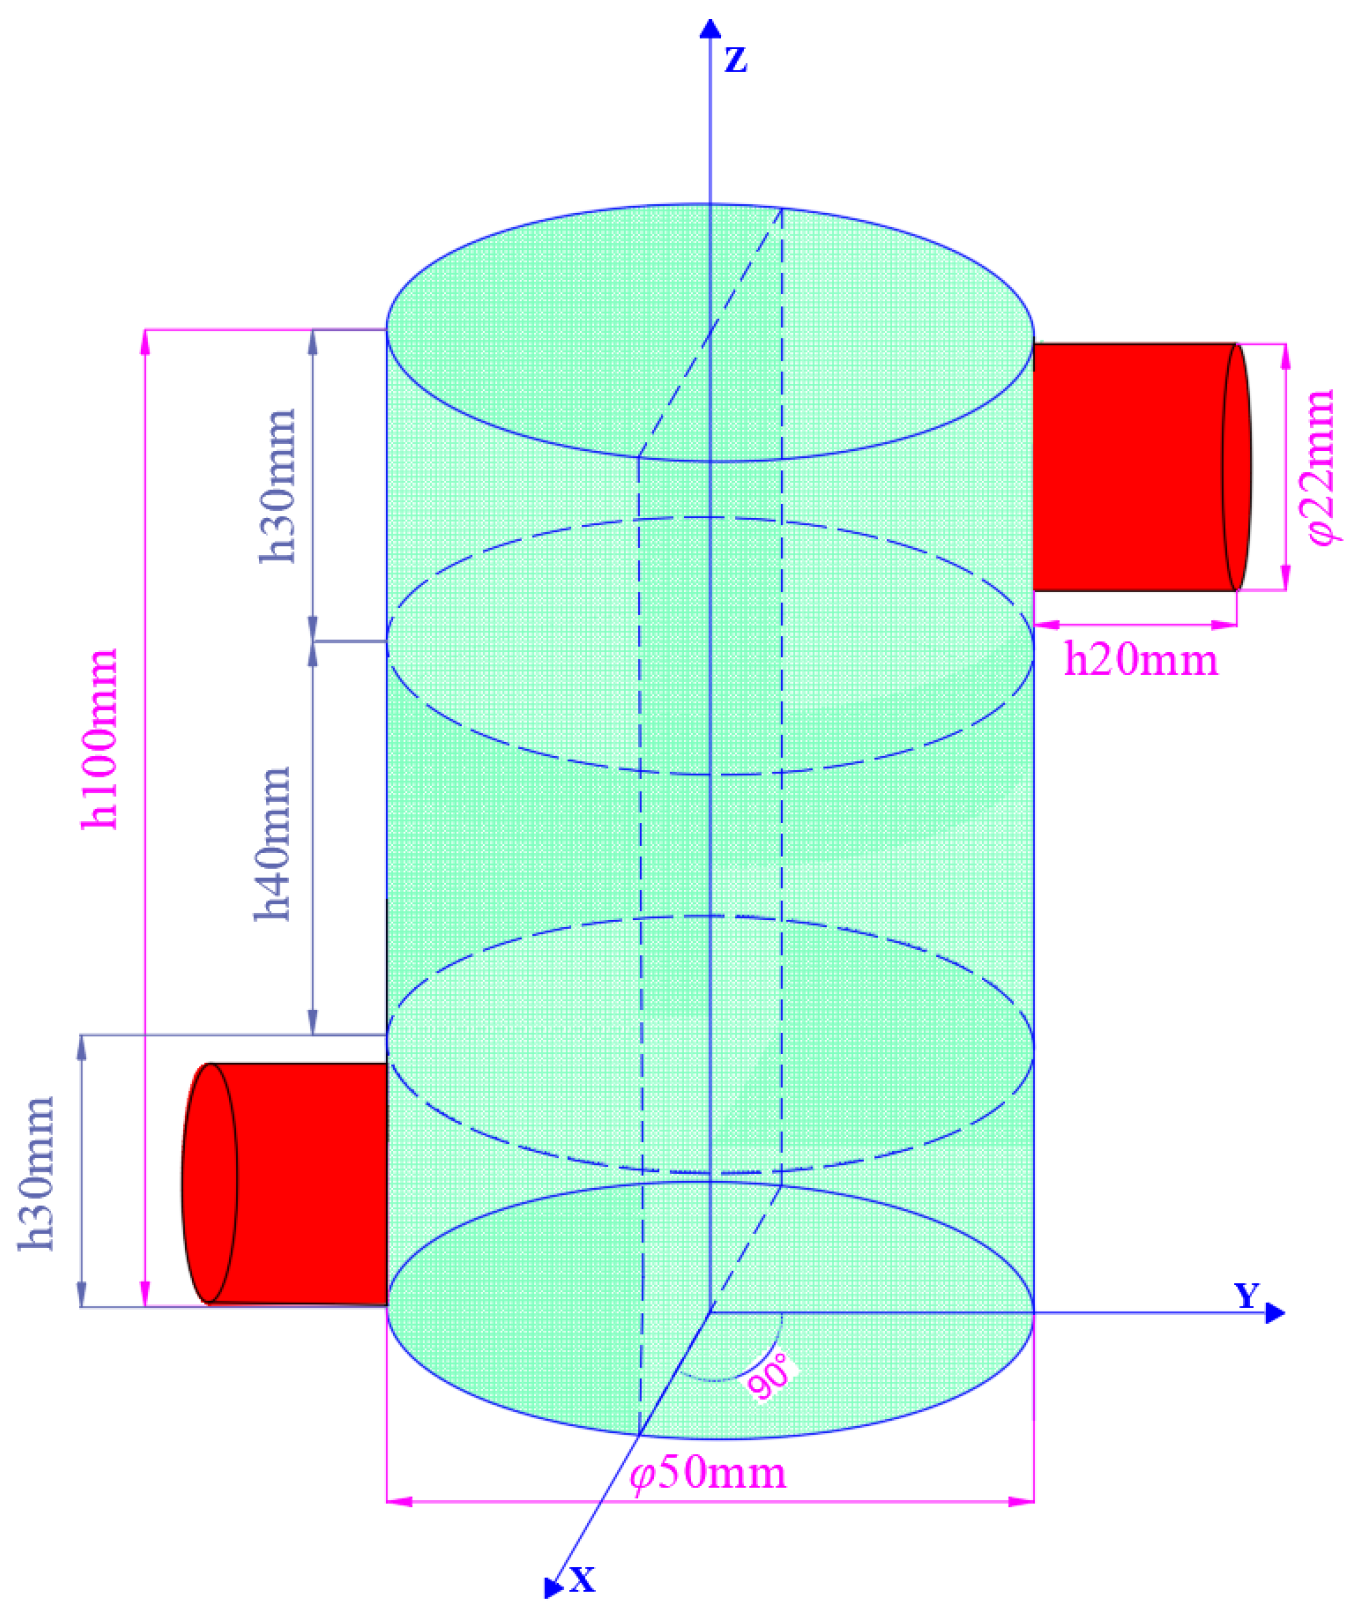
The specimens for this test were taken from the 6303 fully mechanized caving face of Changping Mine in Jincheng City, Shanxi Province. Both the immediate roof and floor of the 6303 working face are sandstone. The retrieved samples were cut into the required sizes using a cutting machine as per the experimental plan, and their P-wave velocities were measured. Specimens with similar P-wave velocities were selected for the study. A total of 9 sandstone–coal–sandstone composite specimens were fabricated, as shown in Figure 1. The processed sandstone and coal samples had dimensions of φ50 mm × 30 mm and φ50 mm × 40 mm, respectively. The parallelism error between the upper and lower end faces was maintained below 0.05 mm, and the diameter variation was limited to within 0.3 mm. Due to the long-term high-temperature and high-pressure conditions during the formation of coal, it is found that the coal seam and the immediate roof are not simply unbonded free modes during mining or tunneling along the roof roadway. Therefore, the popular PVA white emulsion with moderate viscosity is selected as the adhesive in the experiment. The contact surface is cleaned before bonding, and the adhesive layer is controlled by scraping and pressing. After curing for 24 h at room temperature, the test is carried out. The prepared samples are bonded in the order of sandstone–coal–sandstone, and the bonding thickness between the contact surfaces is required to be less than 0.5 mm. In order to eliminate the influence of water content and ensure the accuracy of the measurement results, the bonded samples were placed in an oven at a constant temperature of 60 °C to dry to constant weight. After drying, the samples were sealed and cooled and the test was completed within 24 h.
Figure 1.
Composite specimens.
2.2. Experimental Apparatus
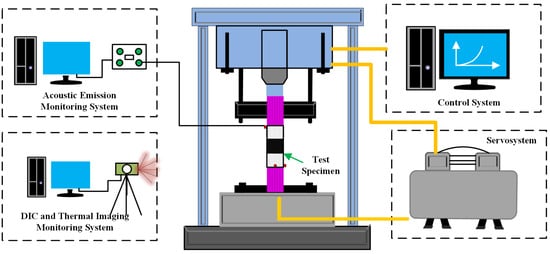
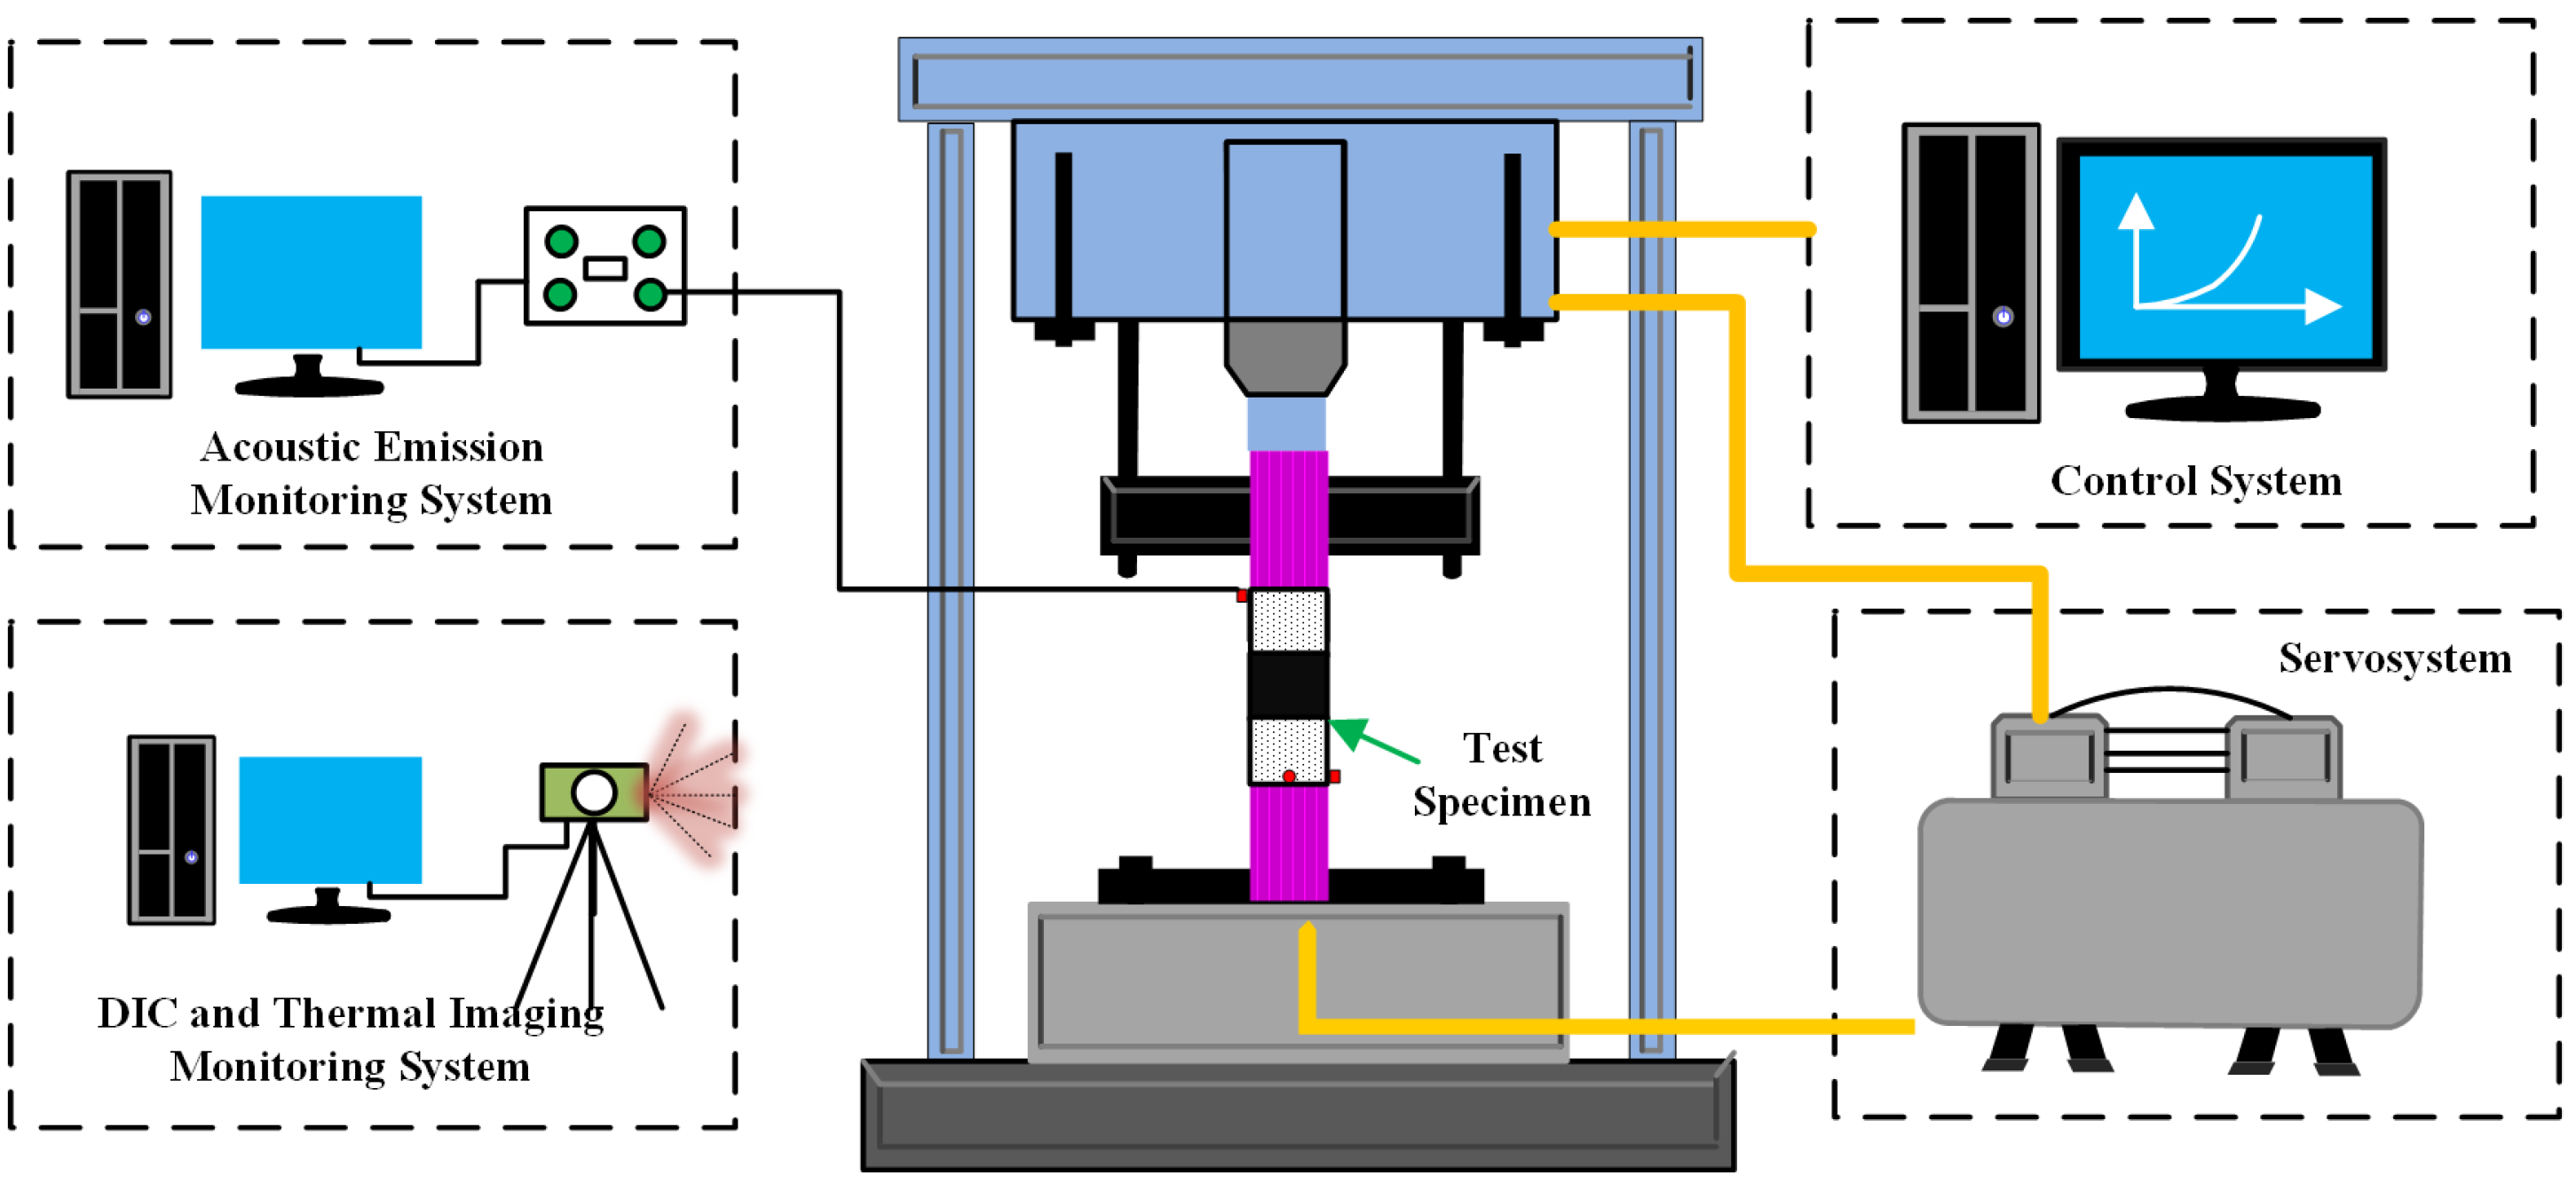
This test and monitoring system consists of an axial servo loading system, a data acquisition system, acoustic emission, DIC, and thermal imaging monitoring systems, as shown in Figure 2. To guarantee accurate axial loading and stable strain-rate control throughout both pre-peak and post-peak stages, uniaxial compression tests were performed using an LDHJ-III high-temperature triaxial creep testing system developed by the research team. The experiments were carried out under the control of an axial servo loading system integrated with a data acquisition and PC-based control platform. In this experiment, the SWAE4 acoustic emission monitoring system was used to arrange two SR105 M acoustic emission sensors to compare and collect the acoustic emission signals during the loading process of the sample. In this study, the acoustic emission event location analysis was not carried out. The specific arrangement of the sensor is shown in Figure 3. The acoustic emission sensor is installed on the side wall surface of the sample. The sensor body is a common cylindrical structure with a diameter of about 22 mm and a height of about 20 mm. The sensor is tightly bonded to the side surface of the sample through the coupling agent to enhance the transmission efficiency of the acoustic emission signal between the sample and the sensor and ensure the stability and reliability of the signal acquisition. To filter out the noise interference from external instruments and the equipment itself, and to improve the effectiveness of the recorded signals, the acoustic emission system employed a 40 dB trigger threshold and a 10 MHz sampling rate, with signal amplification achieved through a 40 dB preamplifier to improve the signal-to-noise ratio. In addition, DIC was also used to conduct real-time monitoring and analysis of the strain field on the surface of the specimens. The DIC system collects deformation images in real time with a high-definition camera, and the strain field is calculated by monitoring the displacement change in the speckles. Compared with traditional extensometers and strain gauges, it has a wider monitoring area and higher monitoring accuracy, and it can identify the precursors of specimen failure from the strain field cloud map.
Figure 2.
Uniaxial compression testing system.
Figure 3.
Schematic of acoustic emission sensor layout.
2.3. Experimental Procedure
Before conducting the test, the surface of the sample should be wiped in advance, and a thin layer of matte white paint should be sprayed on the front. After the white paint dried, matte black paint particles were evenly spread over the white paint surface. The camera was positioned directly facing the speckle-sprayed area to collect the deformation images in real time. Nine specimens were evenly divided into three groups. In order to ensure the accuracy of the test data during the experiment, the problem that the test strain value is too large due to the fact that the press head is not in close contact with the test piece is excluded. Therefore, the press is first loaded to 0.1 Mpa by stress control (the press head is pre-contacted with the test piece), and then the press data is cleared and the data is collected. Then, displacement control was used to apply a load to each group of samples until the residual stage. The strain rates for the three groups of samples were 10−5 s−1, 10−4 s−1, and 10−3 s−1.
3. Experimental Results and Analysis
3.1. Full Stress–Strain Curves and Physicomechanical Properties of Loaded Coal Specimens
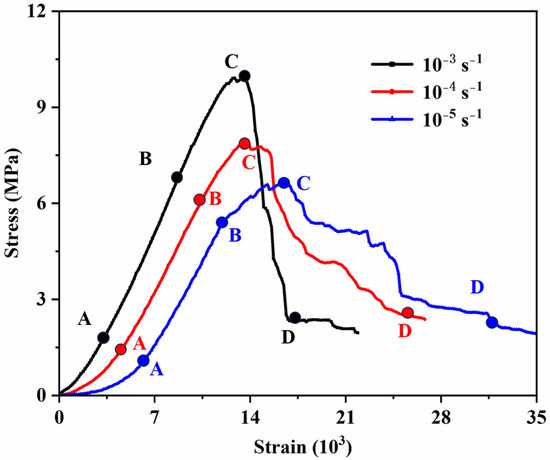
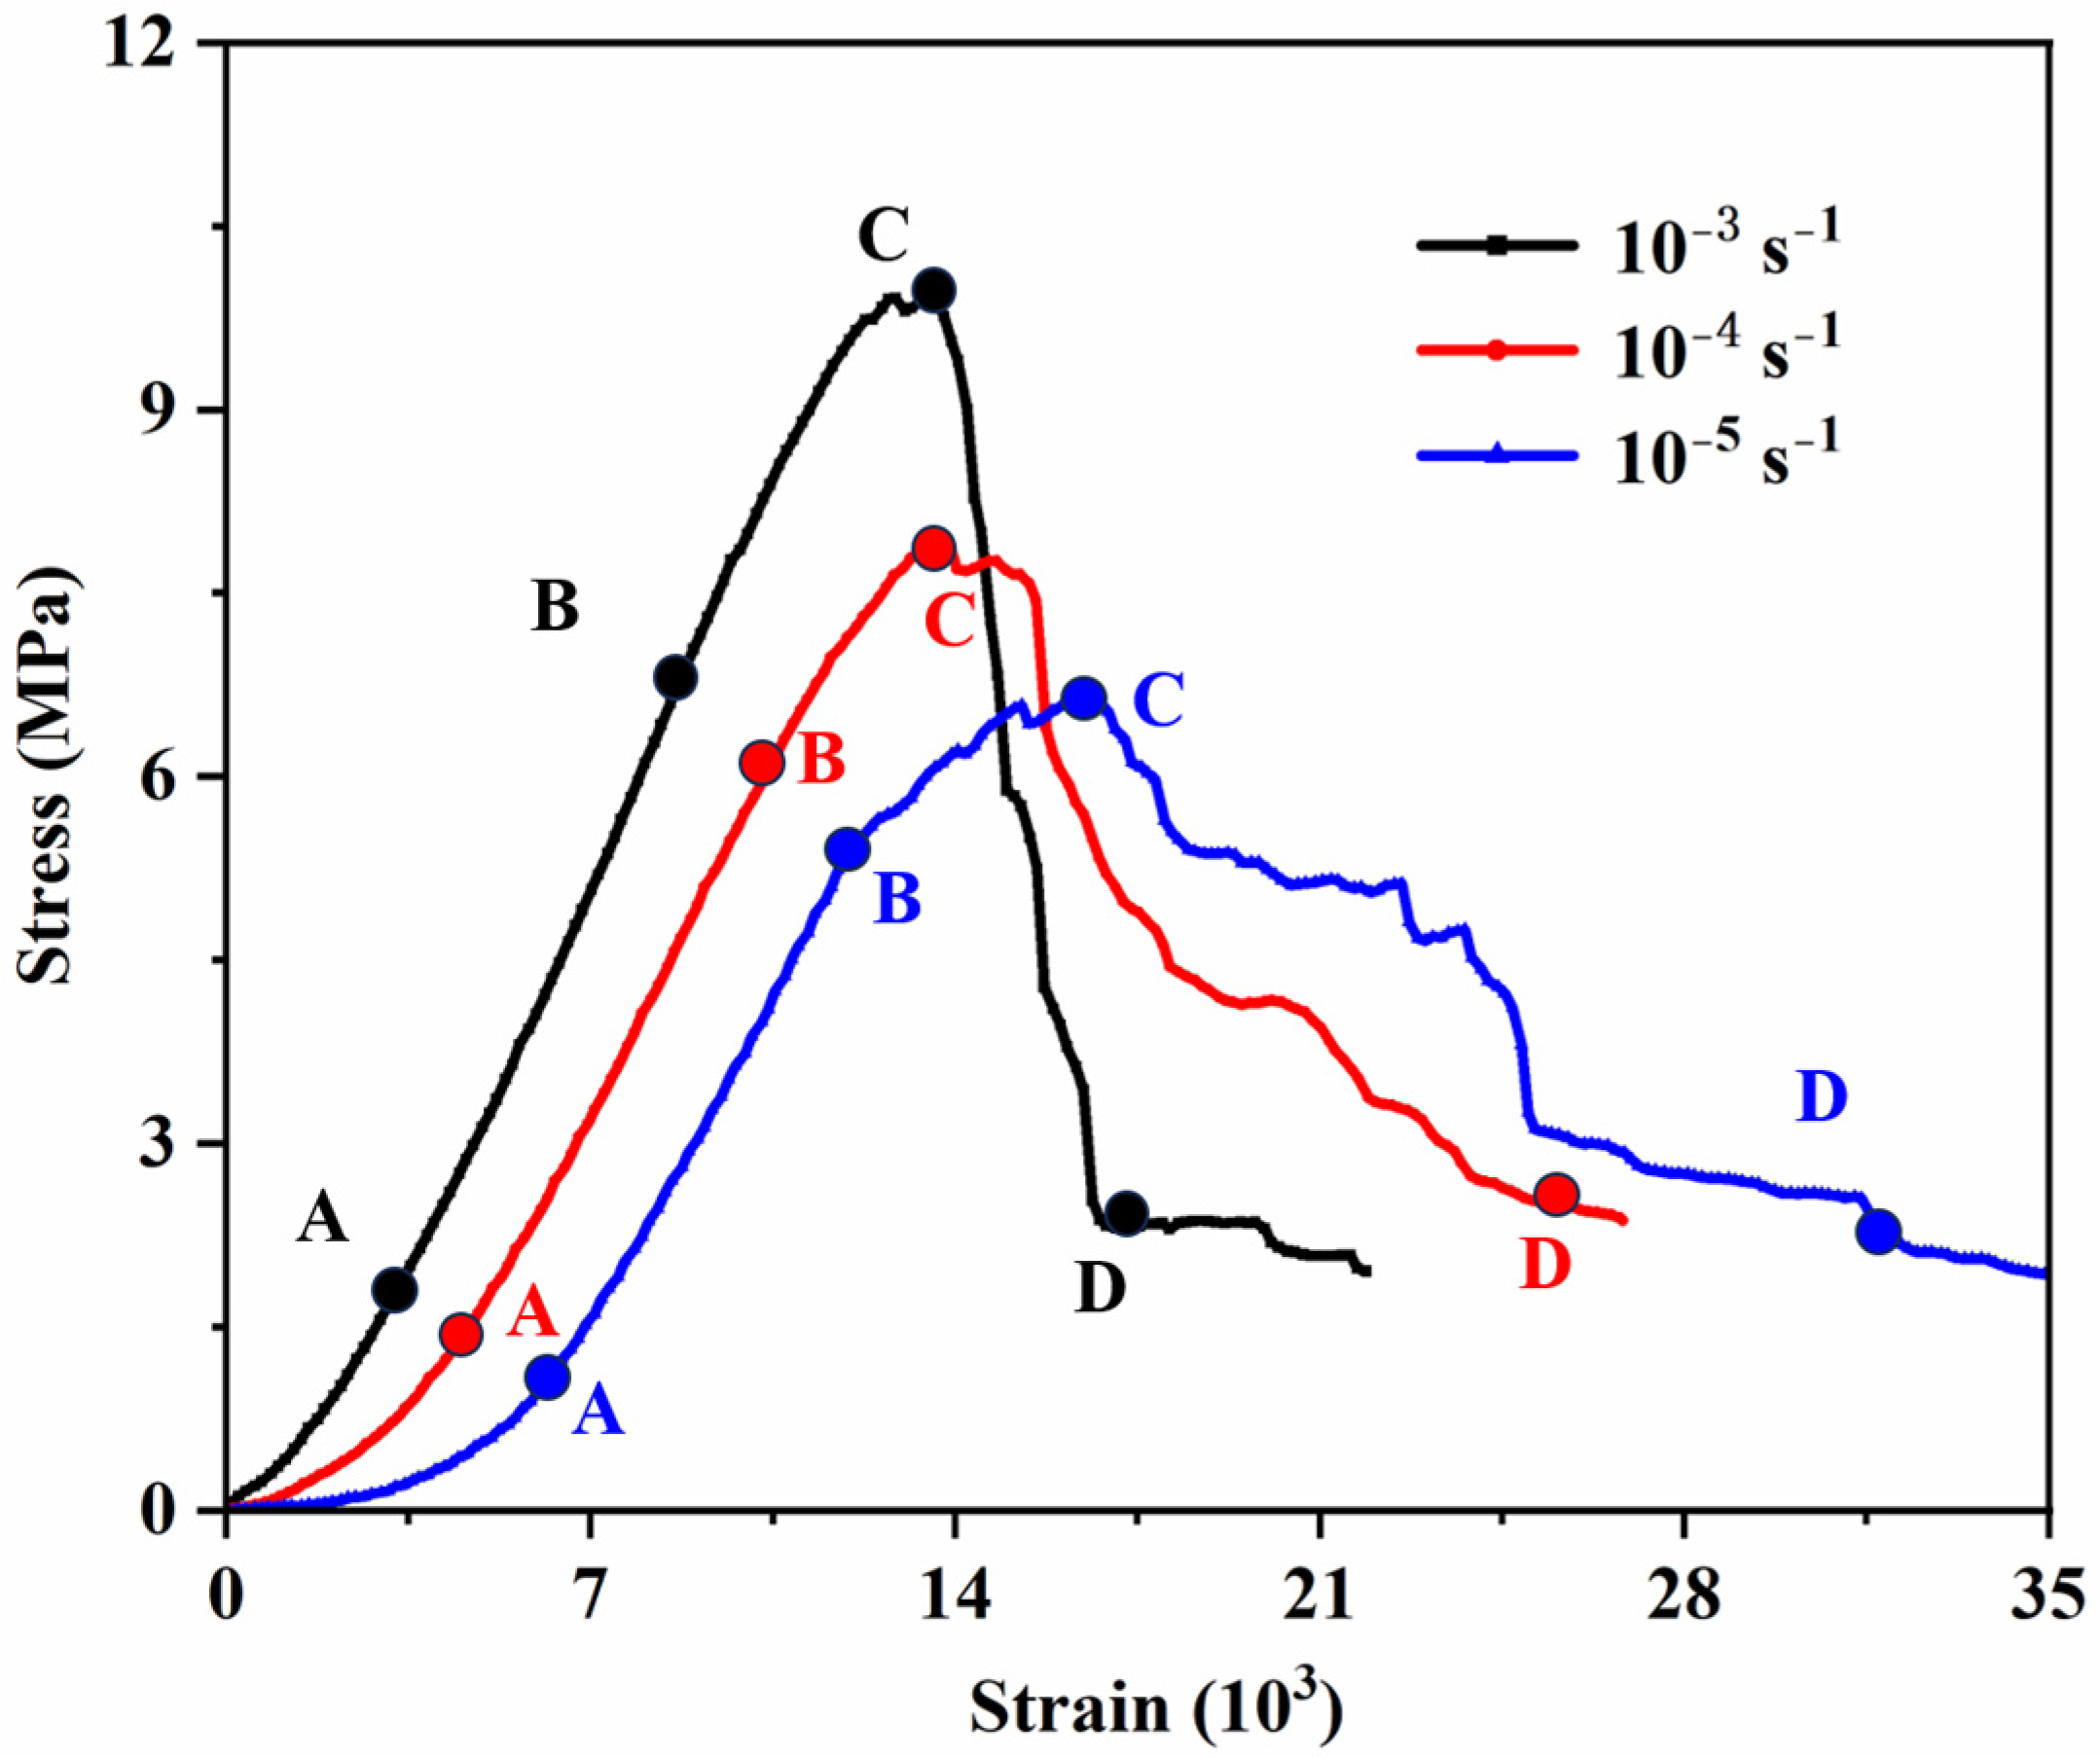
The complete axial stress–strain curves obtained from uniaxial tests at strain rates of 10−5 s−1, 10−4 s−1, and 10−3 s−1 were analyzed, and representative specimens were selected to illustrate the stress–strain responses of the coal–rock composite (Figure 4). The deformation and failure evolution of the sandstone–coal–sandstone composite was thus characterized, and its mechanical response during loading was divided into four typical stages based on observed deformation and fracture features.
Figure 4.
Comparison of stress–strain curves at different strain rates.
(1) The original crack compaction stage (0A segment): In this stage, the internal defects such as the original micro-pores and fractures and the macroscopic contact surfaces of different rock types in the composite are compacted and closed. As the strain rate increases, the interfaces as well as internal pores and microcracks within the composite undergo accelerated closure, leading to a reduction in specimen volume and causing the material to transition into the elastic response stage at an earlier loading stage. The stress value at the starting point A of the elastic stage at a strain rate of 10−3 s−1 is significantly higher than that at the other strain rates. However, the early 0A segment at the three strain rates is not affected by the strain rate and shows a typical nonlinear concave shape.
(2) With increasing axial strain, the axial stress of the composite rises in an approximately linear manner. In this stage, the stress–strain response of the composite is comparable to that of intact rock specimens, exhibiting a near-linear trend. Nevertheless, the elastic modulus shows a pronounced dependence on strain rate. At a strain rate of 10−3 s−1, the elastic modulus reaches 0.94 GPa, which is markedly higher than the values of 0.82 GPa and 0.76 GPa obtained at 10−4 s−1 and 10−5 s−1, respectively. Notably, the modulus at 10−3 s−1 is approximately 1.24 times that at 10−5 s−1, demonstrating a strong strain-rate sensitivity of the elastic modulus for the coal–rock composite. Thus, the faster the strain rate, the less developed the internal fractures in the sample, the stronger the sample’s resistance to deformation, and the greater the elastic modulus. This is highly consistent with the damage evolution law assumed by the damage constitutive model in the following article. At the same time, the strain rate has a significant mechanical response to the coal–rock combination. At a higher strain rate, the elastic modulus of the material is significantly improved. This is consistent with the strain rate effect hypothesis in the following model, which further verifies the assumption that the micro-fracture propagation is limited under high strain rate conditions.
(3) During the elastoplastic stage (Segment BC), the full stress–strain curve resembles that of a single-lithology specimen, transitioning from linearity to nonlinearity. The axial stress exhibits a decelerated growth rate with increasing displacement. Under the action of external loads, local stress concentrations form around the natural defects in the composite, generating new fractures, while the original fractures steadily expand. Point B can be regarded as the starting point of radial expansion. As can be seen in Figure 4, with the increase in the strain rate, the corresponding stress value at the expansion point also gradually increases. At the same time, due to the rapid derivation and expansion of new and old fractures, the load-bearing capacity of the combined specimen all showed a temporary decline. In the BC segment, the stress–strain curves corresponding to different strain rates exhibit a brief stress reduction. During this phase, the overall stress–strain response displays a pronounced concave profile, indicating a gradual transition of the specimen from linear elasticity toward elastic–plastic or fully plastic behavior. As external loading continues, stress concentration develops at crack tips within the composite, promoting the rapid initiation and propagation of numerous microcracks. The coal part of the composite has a relatively weak bearing capacity, with obvious cracks on the surface. The radial expansion of the composite sample is obvious, and the volume strain rate increases. This phenomenon is a common feature of the sandstone–coal–sandstone composite samples. In addition, with the increase in the strain rate, the peak strength at point C also gradually increases. The peak strength of the sample at a strain rate of 10−3 s−1 is 9.95 MPa, while those at strain rates of 10−4 s−1 and 10−5 s−1 are 7.93 and 6.62 MPa, respectively. This is mainly because there are large numbers of original fractures and structural planes in the coal body. The lower the strain rate, the longer the time required for the composite sample to reach the predetermined strength value, the more fully developed the original fractures, and the more secondary fracture structural planes will be derived, resulting in a decrease in the bearing capacity.
(4) Post-failure stage (segment CD): Once the stress state surpasses the peak strength at point C, the load-carrying capacity of the composite declines sharply as axial strain continues to increase. During this stage, internal cracks interact, coalesce, and ultimately connect through the specimen, leading to the formation of a continuous macroscopic fracture plane. The coal body with a relatively weak bearing capacity slides along the macroscopic fractures. After point D, the rate of decrease in axial stress significantly slows down, but the composite body sample still has a certain bearing capacity. Point D can be regarded as the starting point of the residual stage. Additionally, the strain rate effect is not significant in the CD section after fracture.
3.2. Evolution of Surface Strain Fields at Different Strain Rates
DIC is a technology that can measure displacement and strain fields through optical means without physical contact. Its core principle is to extract the displacement and deformation information on the object’s surface by analyzing the gray-scale matching of images before and after loading. This technology usually relies on changes in image gray-scale values to track and calculate the pixel displacement within the region of interest (ROI). A reference subset is constructed within the ROI, and then a matching subset is searched for in the deformed image. The gray-scale correlation is evaluated to determine the displacement vector. Compared with traditional strain gauge technology, the DIC method is easy to operate, has good continuity in measurement results, and has high precision. It is particularly suitable for visualization analyses of crack propagation and mesoscopic damage evolution processes. In two-dimensional DIC applications, only one high-resolution camera is needed to capture images of the specimen’s surface. The setting values of DIC-related parameters are shown in Table 1.
Table 1.
DIC-related parameters set value.
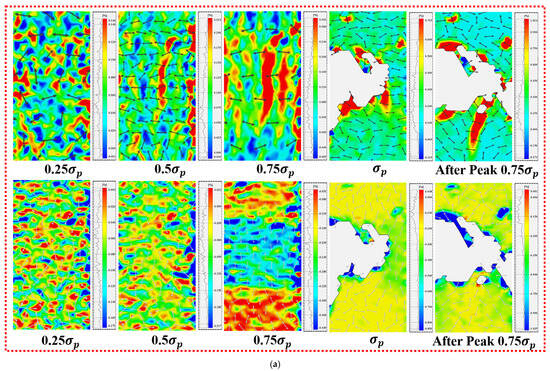
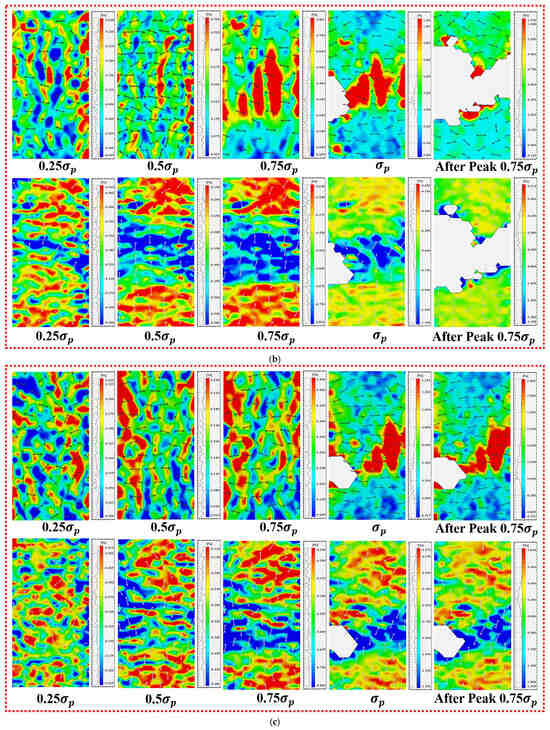
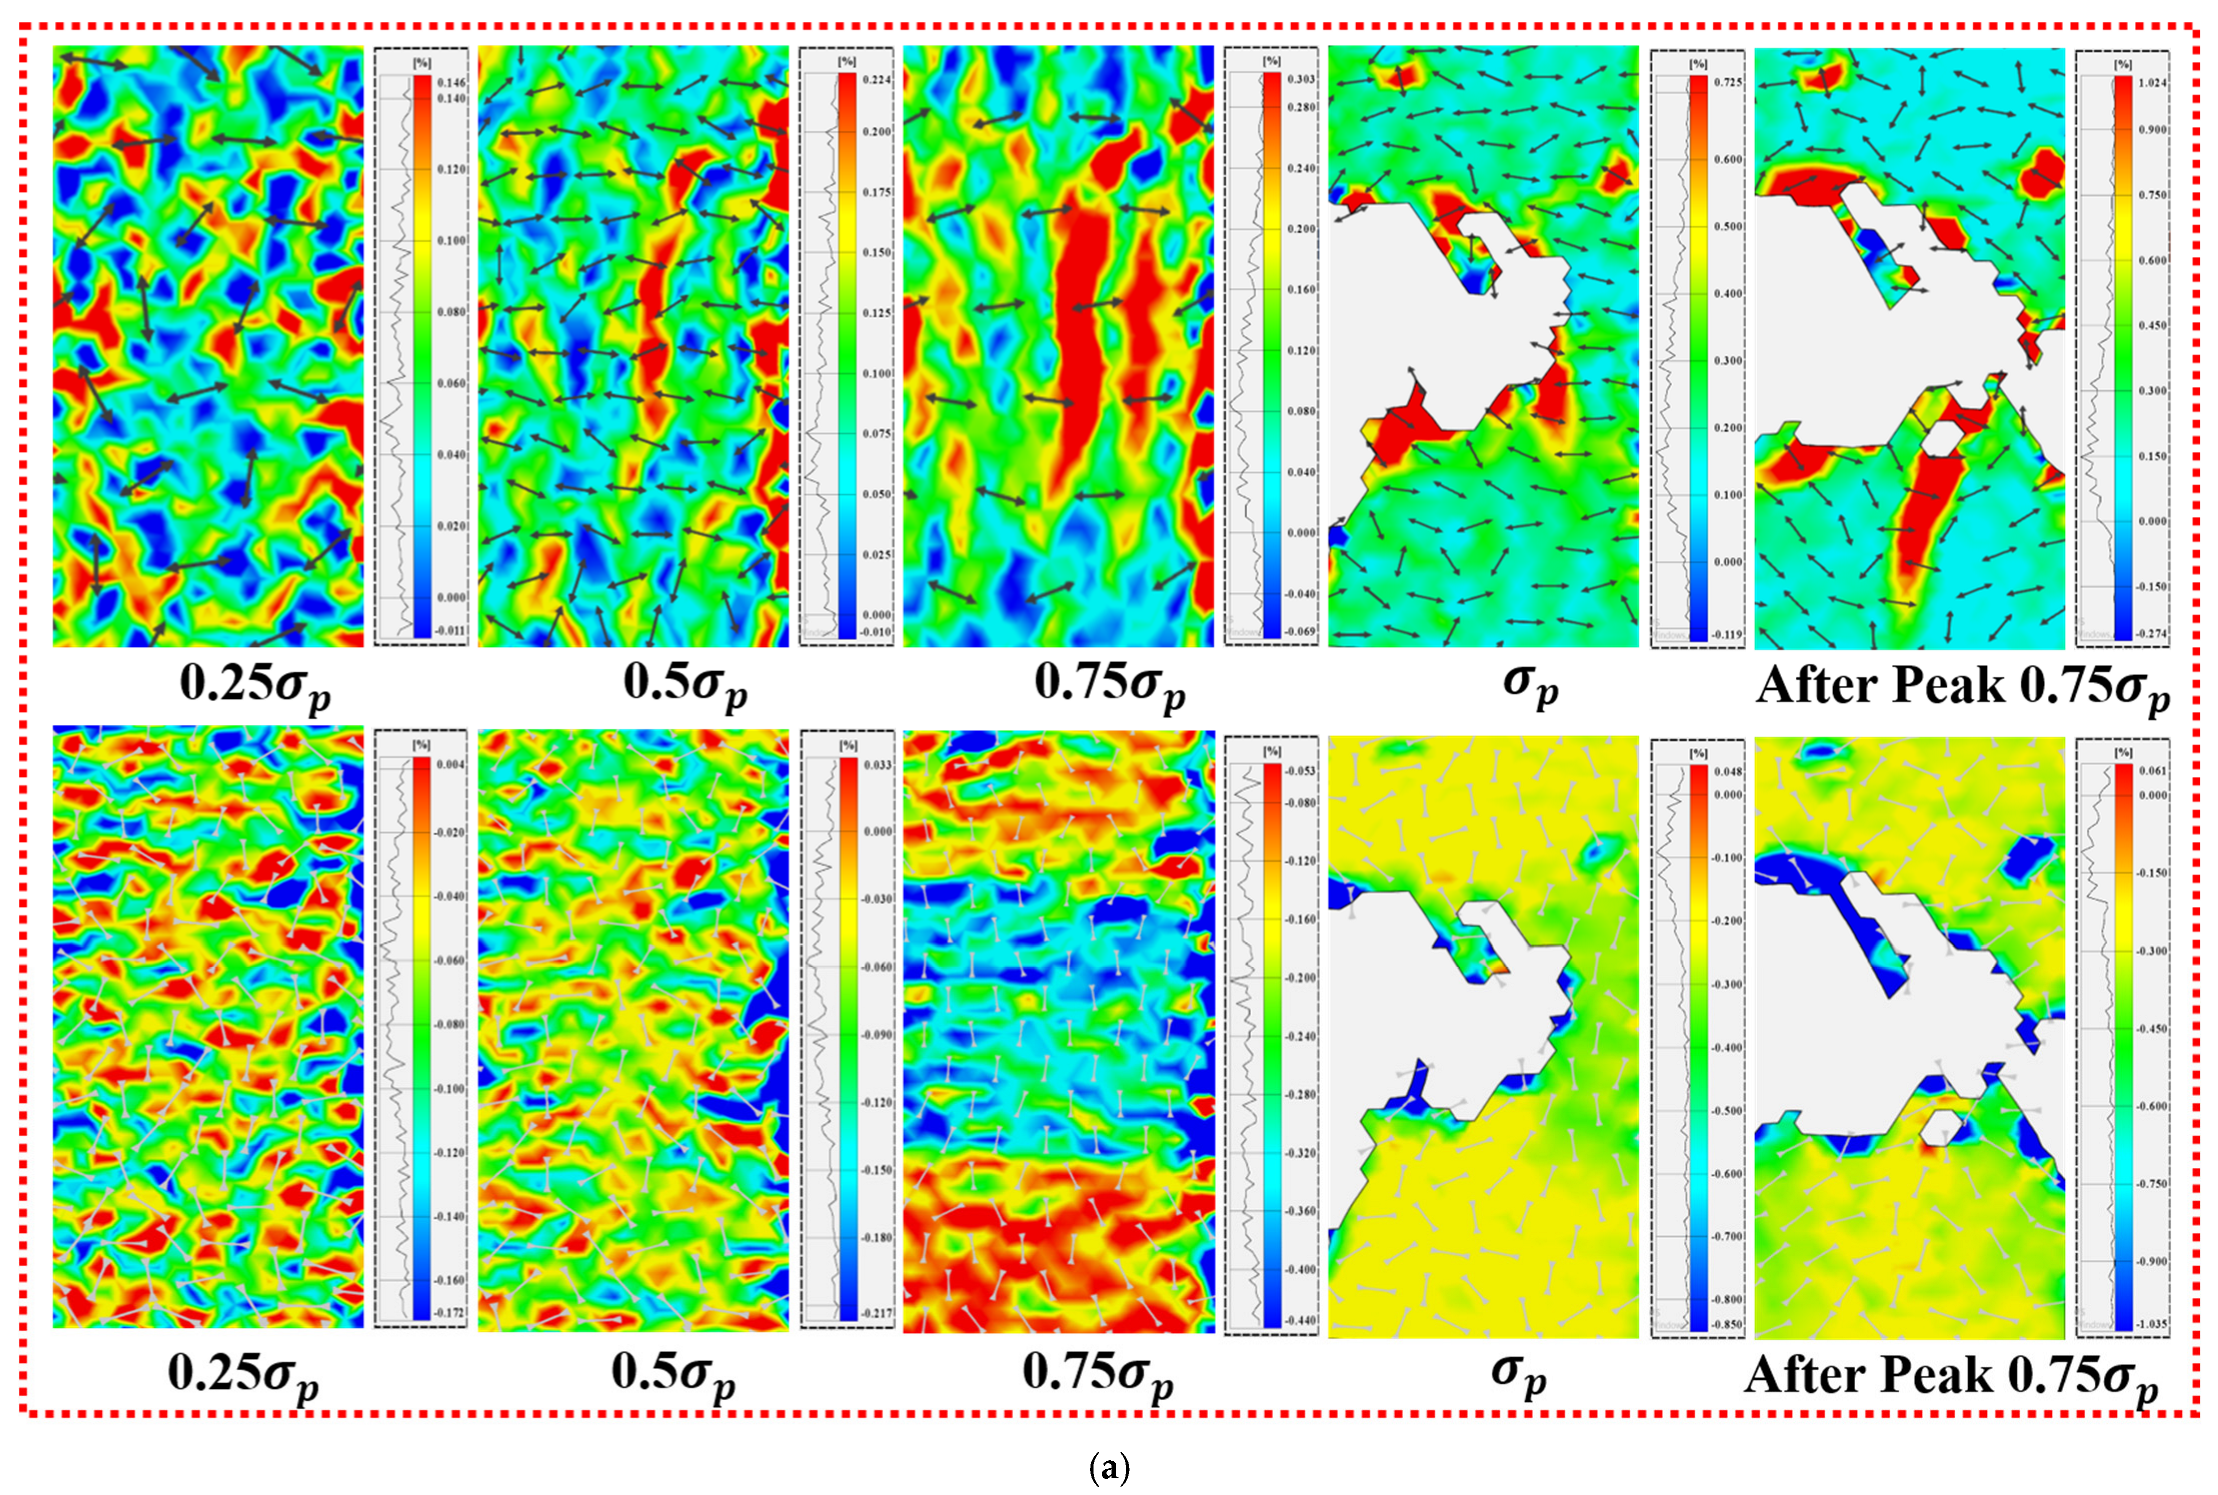
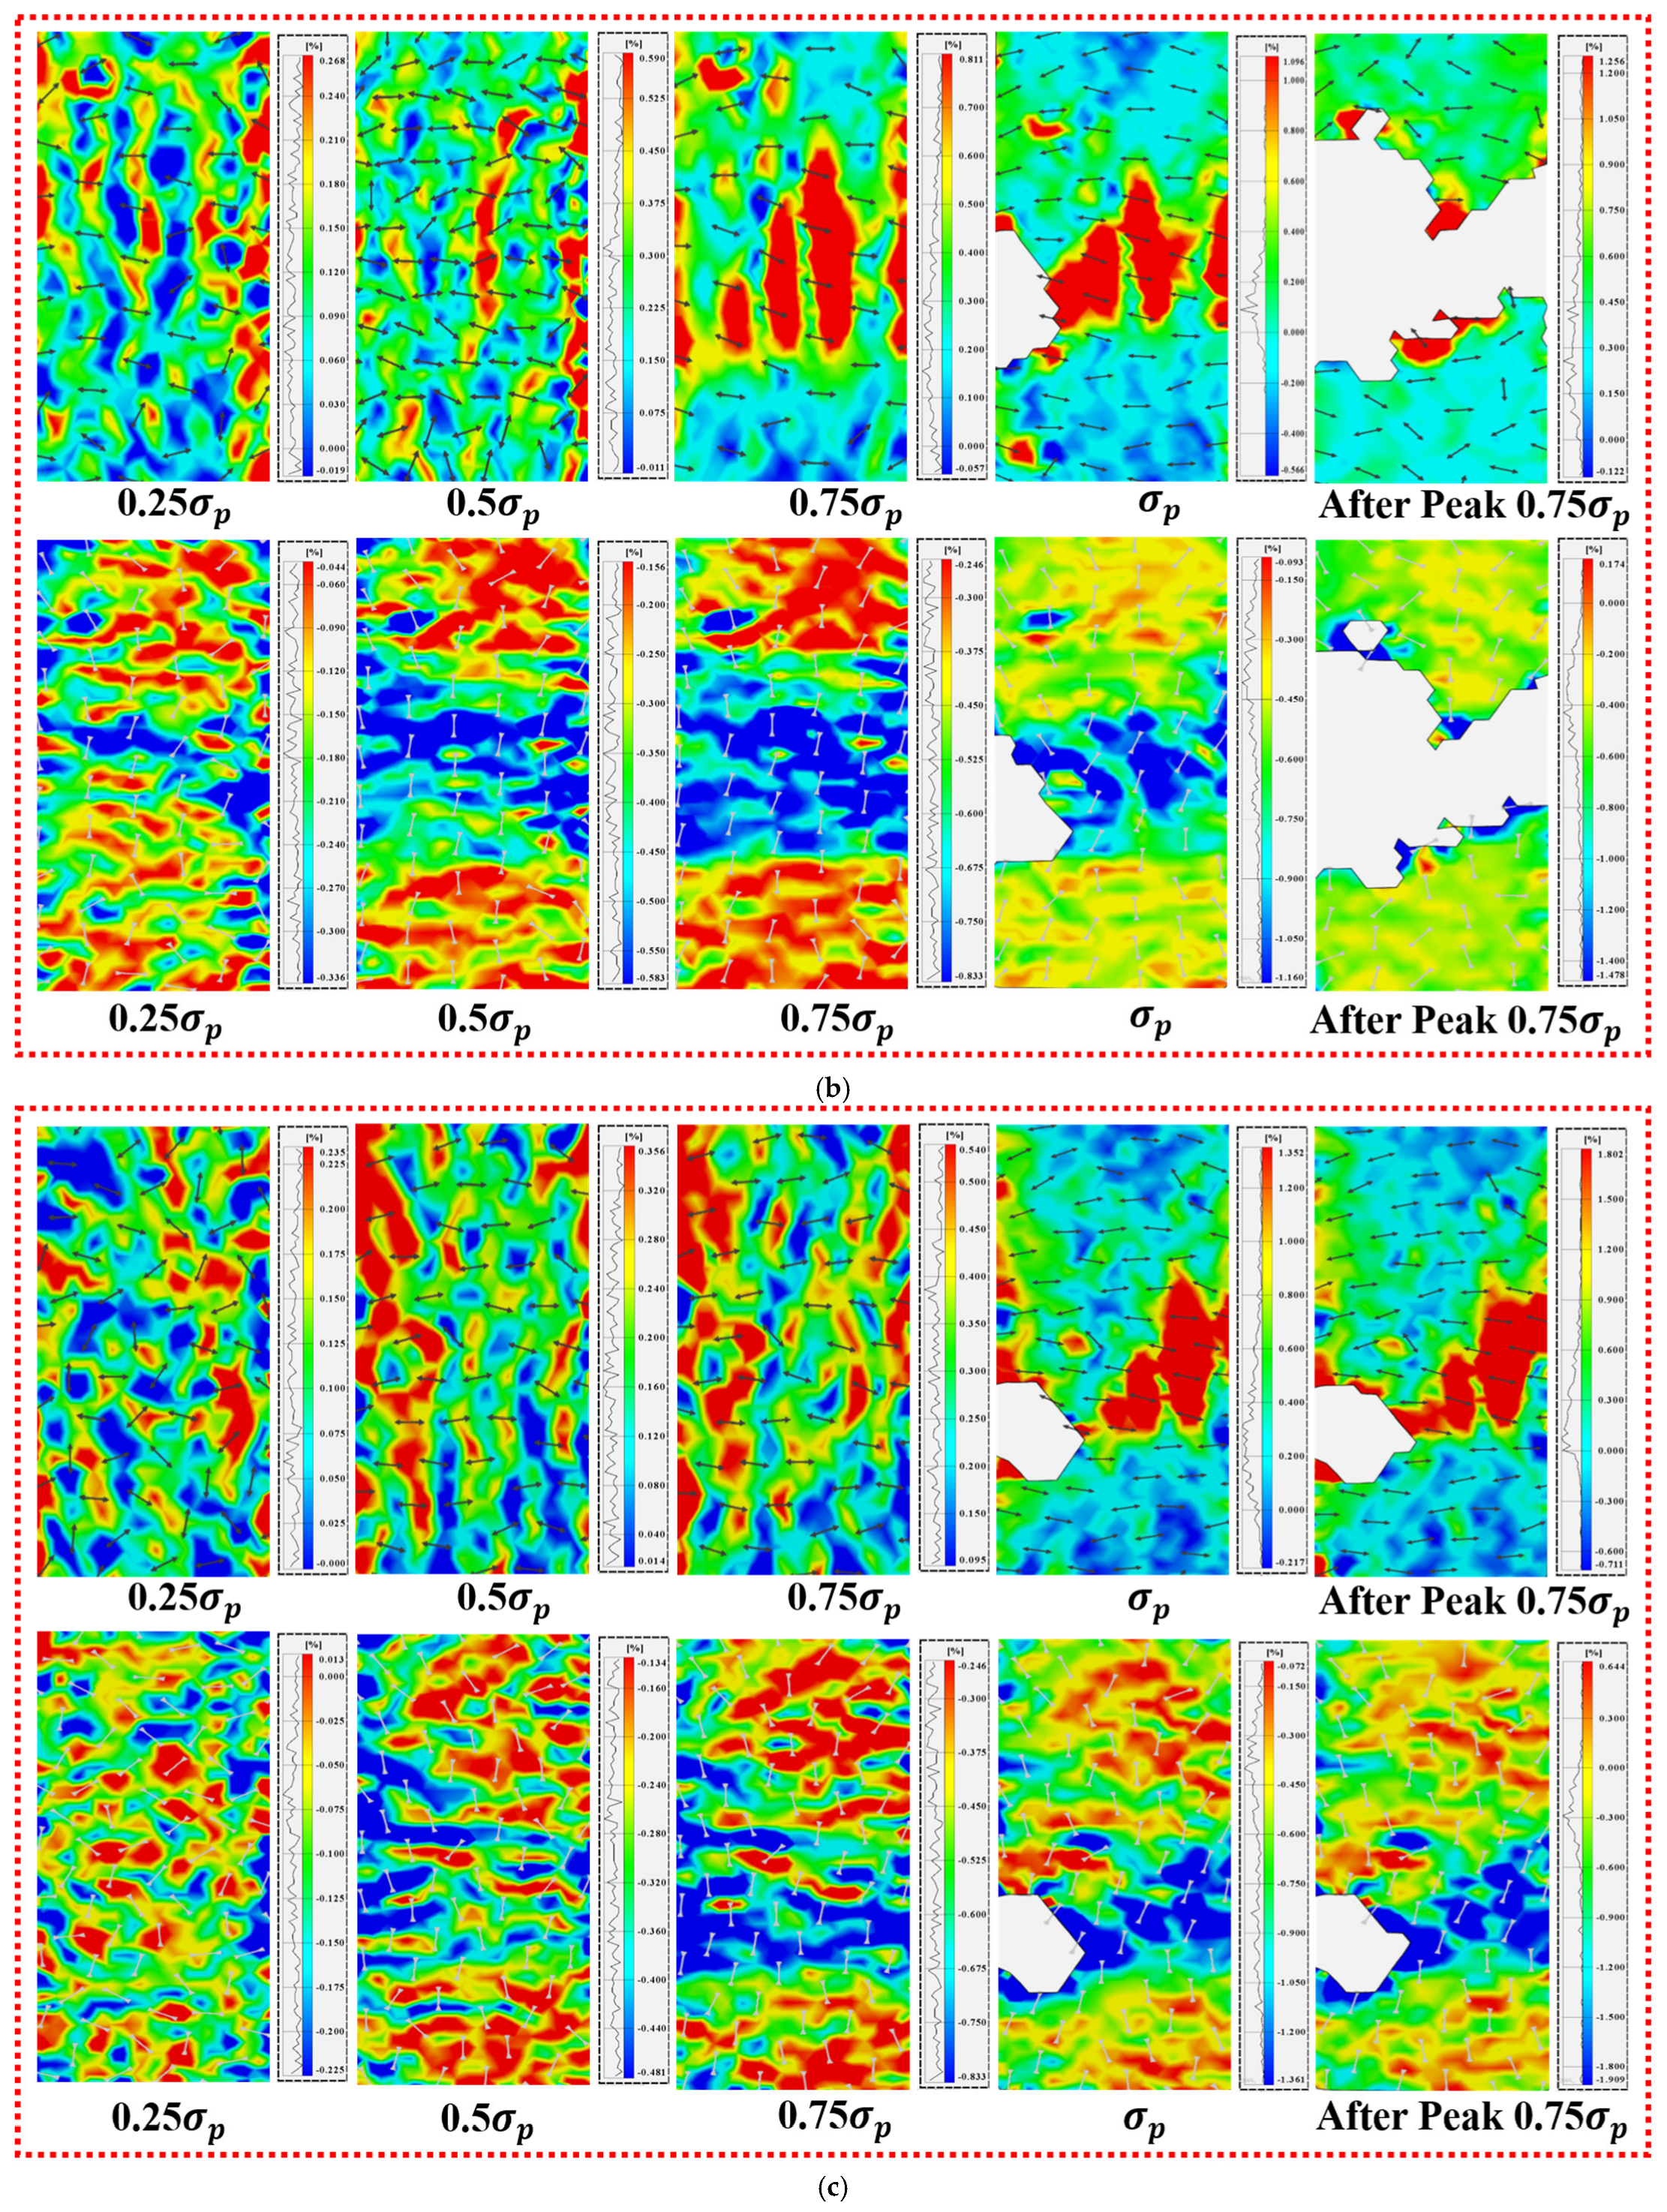
Figure 5 shows evolution cloud diagrams of axial and radial strains at three strain rates; the ROI range of the reference area is φ48 mm × h98 mm. The distance between the reference area and the upper, lower, left, and right boundaries of the actual sample is 1 mm. The ratio of the reference area to the actual sample is 1:1. The black arrows and the light-colored arrows, respectively, represent the radial strain direction and the axial strain direction. Different colors in the cloud diagrams correspond to different strain values in the respective scales, and the wavy lines in the scales represent the area occupied by each strain value in the cloud diagrams. Examination of the strain cloud maps indicates a pronounced strain-rate dependence in the coal–rock composite. Under high strain-rate loading, localized high-strain zones are strongly concentrated, accompanied by abrupt changes in strain orientation, suggesting unstable failure driven by the rapid propagation of cracks. Conversely, at lower strain rates, the strain field exhibits smoother directional transitions and clearer signs of progressive damage development. The arrows represent the principal displacement (or stress/strain increment) directions. Before peak stress, the vectors are relatively uniformly distributed and align with the loading direction, indicating stable deformation. As the stress approaches and exceeds the peak, the vectors gradually rotate and concentrate around the macroscopic fracture zone, reflecting strain localization and crack propagation. Moreover, increasing the strain rate enhances the brittleness of the composite, which is reflected by reduced axial and radial strains at peak stress, together with elevated axial and radial strain rates. The failure process changes from gradual expansion and slow energy release in the coal to sudden and unstable failure in the coal–rock system. At a high strain rate of 10−3 s−1, the strain rate and strain values before the peak are relatively small; this is mainly because the strain rate is fast, internal cracks do not have enough time to fully expand, and plastic flow and expansion do not occur sufficiently.
Figure 5.
Evolution diagrams of axial and radial strains at different strain rates (the upper half displays the radial strain contour map, while the lower half presents the axial strain contour map.): (a) 10−5 s−1; (b) 10−4 s−1; (c) 10−3 s−1.
At a strain rate of 10−5 s−1, the relatively slow loading allows ample time for the closure of microcracks and micropores within the coal, as well as for the initiation and gradual growth of secondary fractures, resulting in a slow and sustained release of energy. Under these conditions, the coal component exhibits a pronounced and continuous dilatational response. Moreover, the strain corresponding to the peak stress of the coal–rock composite decreases as the strain rate increases, indicating a clear negative correlation between peak strain and loading rate.
Due to the significant difference in compressive strength between sandstone and coal in the test, the cementation interface is more likely to become the weak part of the coal–rock combination than the single lithology area. Combined with the DIC strain cloud diagram, it can be seen that the initial cracks of the sample are mostly initiated near the coal-sandstone cementation interface. Based on this, this paper takes the coal–sandstone contact line as the center, selects the banded area of 5 mm above and below as the interface neighborhood ROI, and statistically analyzes the strain evolution characteristics of this area under different loading stages. The results show that under the condition of low strain rate, the strain concentration in the vicinity of the interface gradually develops with the loading process, and the strain difference on both sides of the interface continues to increase, reflecting the gradual accumulation of debonding and shear slip behavior near the interface. Under the condition of high strain rate, the strain of the interface neighborhood is rapidly localized in the pre-peak stage, and the sudden enhancement occurs near the peak, indicating that the interface failure process has more significant brittle characteristics.
3.3. Acoustic Emission (AE) Response Characteristics of Sandstone–Coal–Sandstone Composites
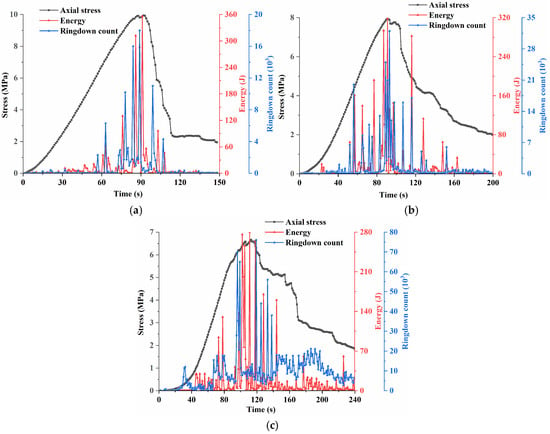
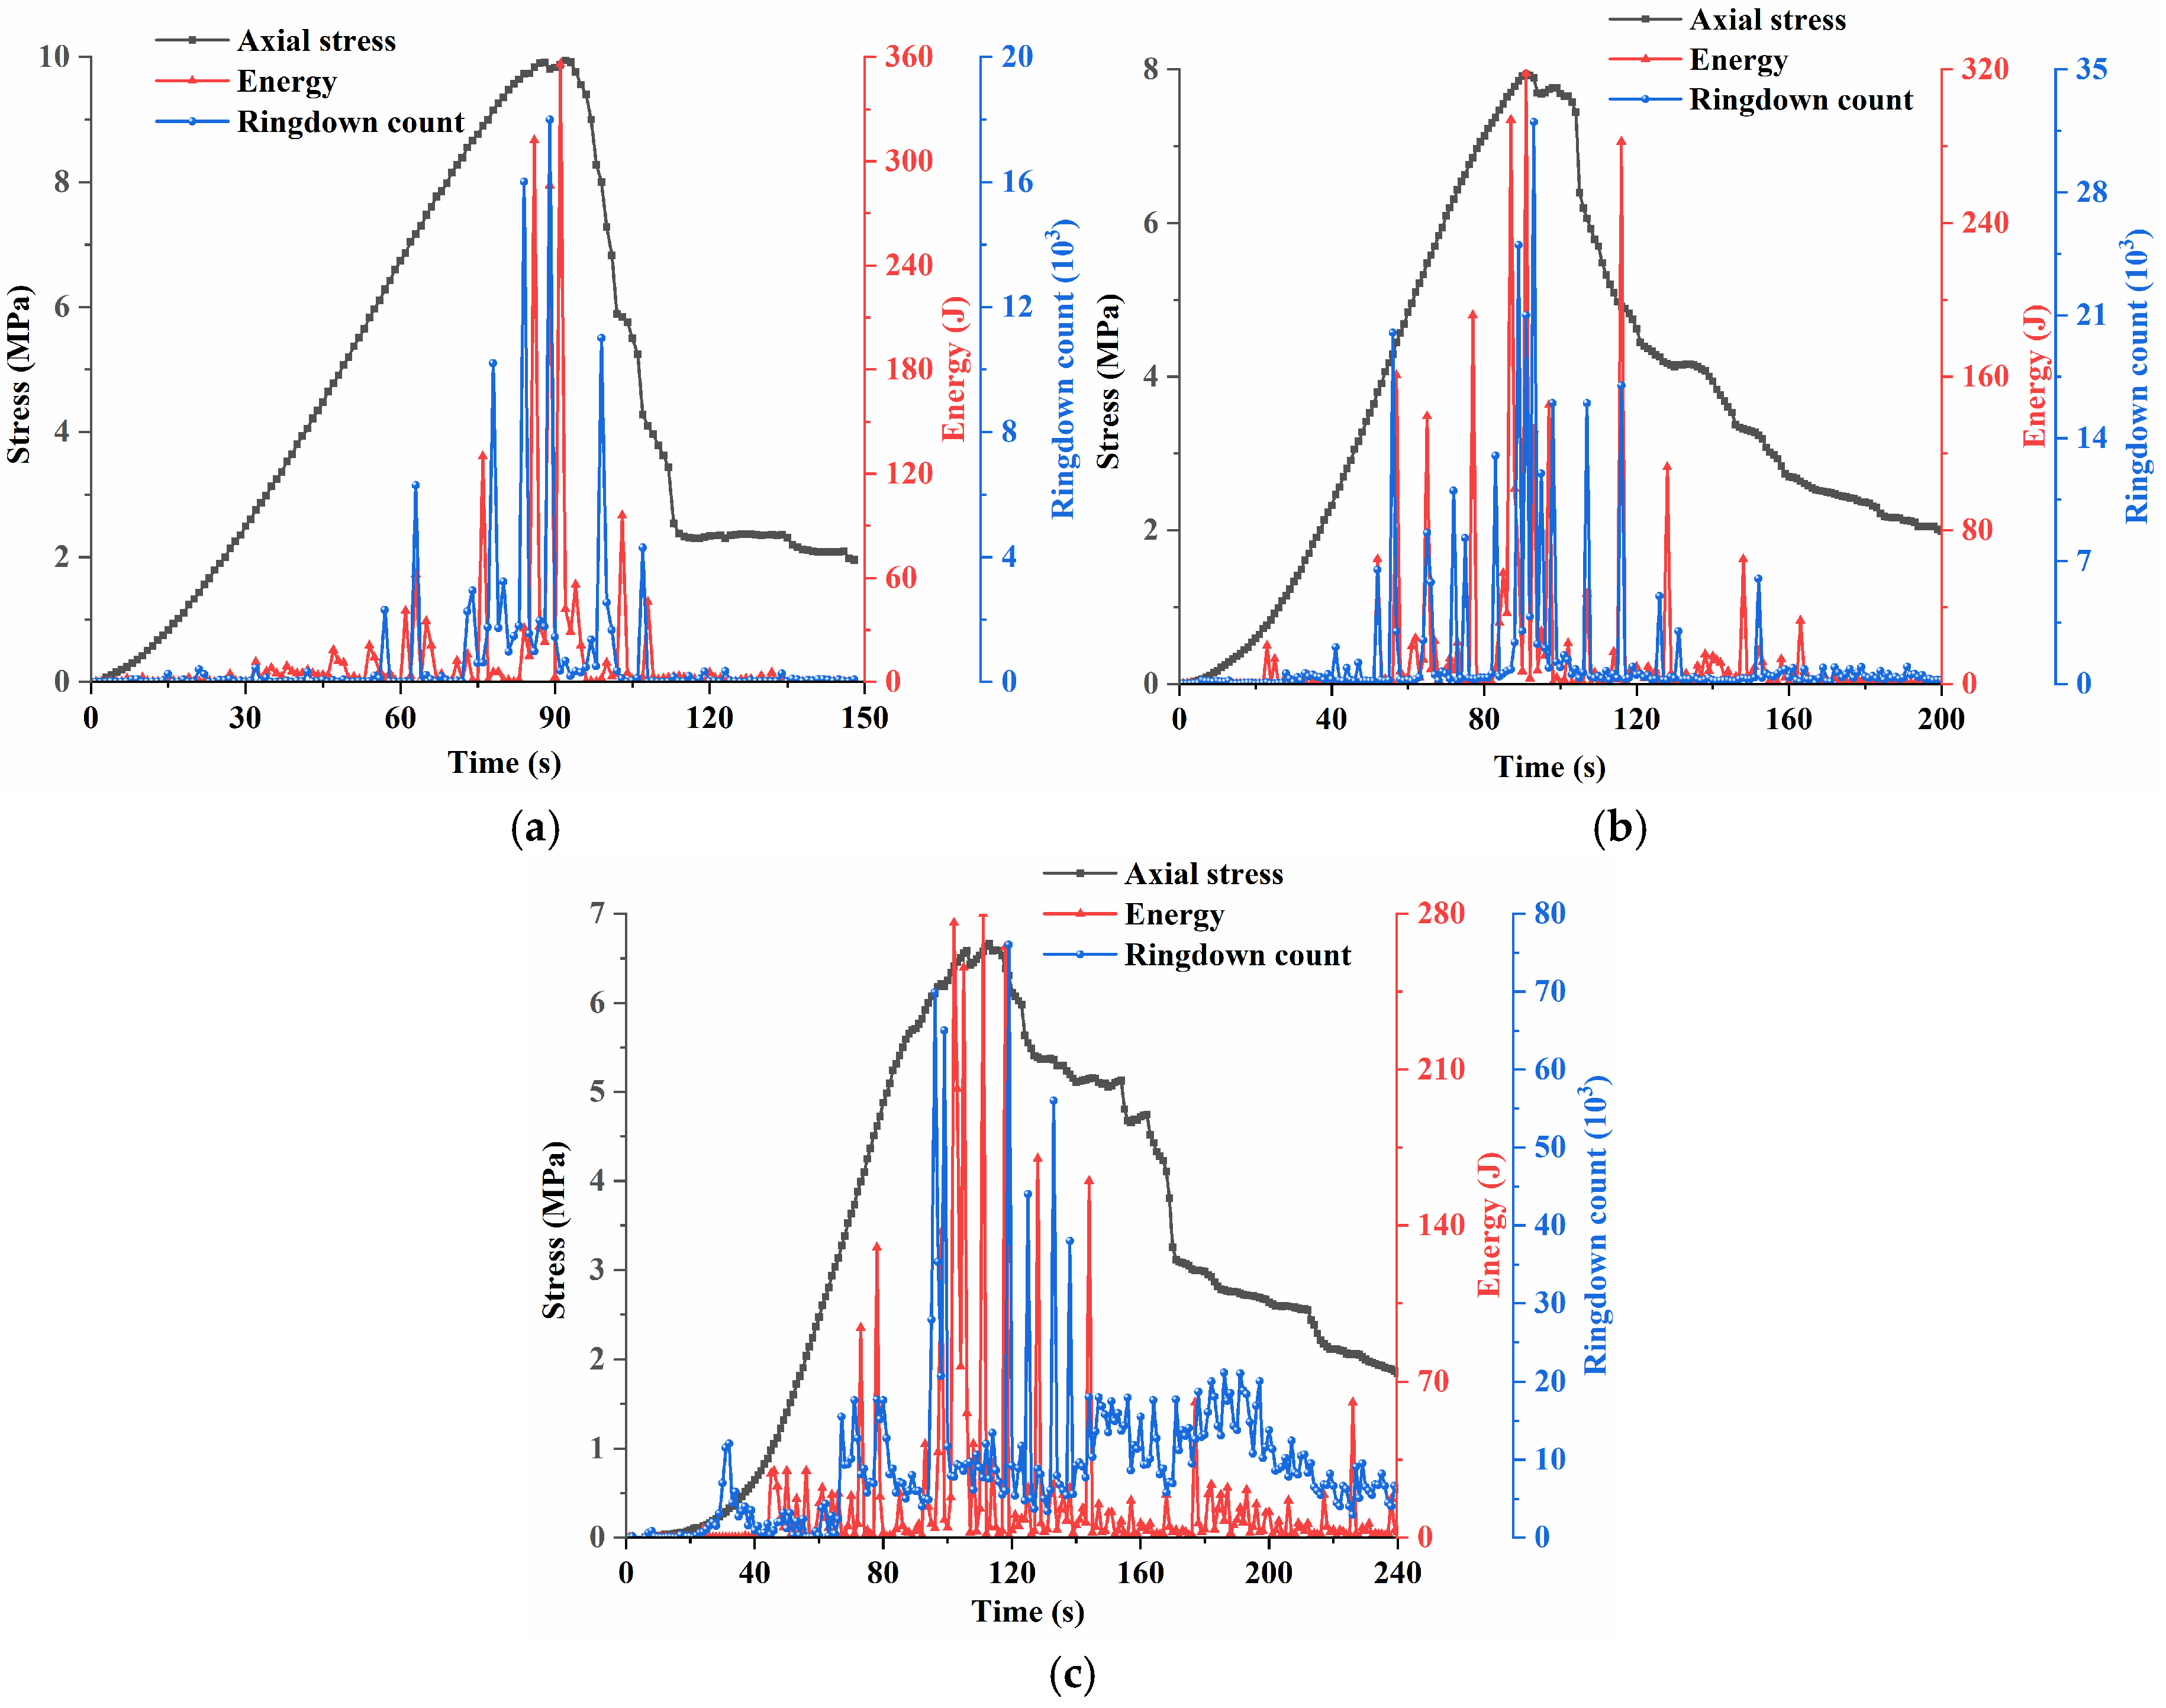
Figure 6 shows the distribution characteristics of the stress–energy–ringing count with the loading time. In this study, the ringing count and energy are used to reflect the activity of internal crack development at each moment. It can be clearly seen in the figure that the accumulation process of the AE energy release and AE ringing count is closely related to the growth trend of axial stress.
Figure 6.
Evolutionary characteristics of multi-parameters in acoustic emission: (a) 10−5 s−1; (b) 10−4 s−1; (c) 10−3 s−1.
Figure 6 shows that at high strain rates, acoustic emission events decrease but single energy release increases, which is consistent with the experimental results. It shows that the crack propagation speed is accelerated at high strain rates, resulting in more concentrated damage and sudden failure process. According to the analysis of Figure 6, with the increase in strain rate, the energy release form of AE changes from swarm type to solitary type, and the impact energy of AE increases greatly at high strain rate, but the cumulative ringing count of AE decreases obviously. The change in strain rate directly affects the evolution mode of internal damage of coal–rock combination. Under lower loading rates, cracks are able to propagate in a stable manner with sufficient time, allowing energy to be released gradually. Correspondingly, both the acoustic emission energy and the ringing count exhibit multiple stage-wise increases throughout the loading process. The internal cracks have developed stably, and a large number of primary cracks have been activated and secondary cracks have expanded. Acoustic emission events occurred in the early stage of specimen deformation, and the final cumulative acoustic emission energy and number of events also increased significantly, revealing the cumulative progressive process of internal damage in the specimen. At high strain rate, the energy value at the peak point of the sample is the largest, reaching 360 J, which is 1.28 times that of 10−5 s−1 strain rate. At the same time, with the increase in strain rate, the energy at the peak point of the sample is positively correlated. At high strain rate, the micro-cracks in the coal–rock combination have not yet completed the expansion and penetration, and a few primary cracks in the coal–rock combination expand rapidly. Consequently, as the strain rate increases, the acoustic emission ringing count recorded during loading gradually declines, while acoustic emission events become more spatially concentrated. In contrast, under low strain rate conditions, both primary and secondary cracks are able to develop progressively, leading to a more dispersed distribution of acoustic emission events and a higher overall ringing count.
3.4. Thermal Imaging Characteristics at Different Strain Rates
To investigate the spatiotemporal evolution of infrared radiation features during the deformation and failure of coal–rock composites under different strain rates, the corresponding infrared temperature fields are analyzed based on infrared thermal imaging data. The setting values of the infrared thermal imager are shown in Table 2.
Table 2.
Setting values for the infrared thermal imager parameters.
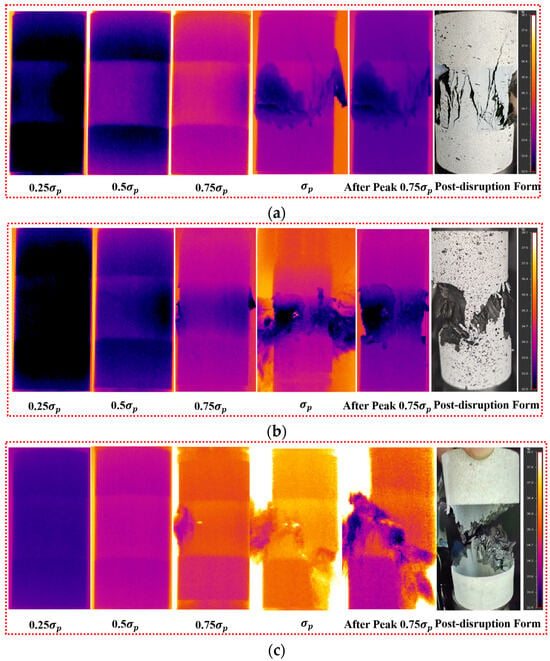
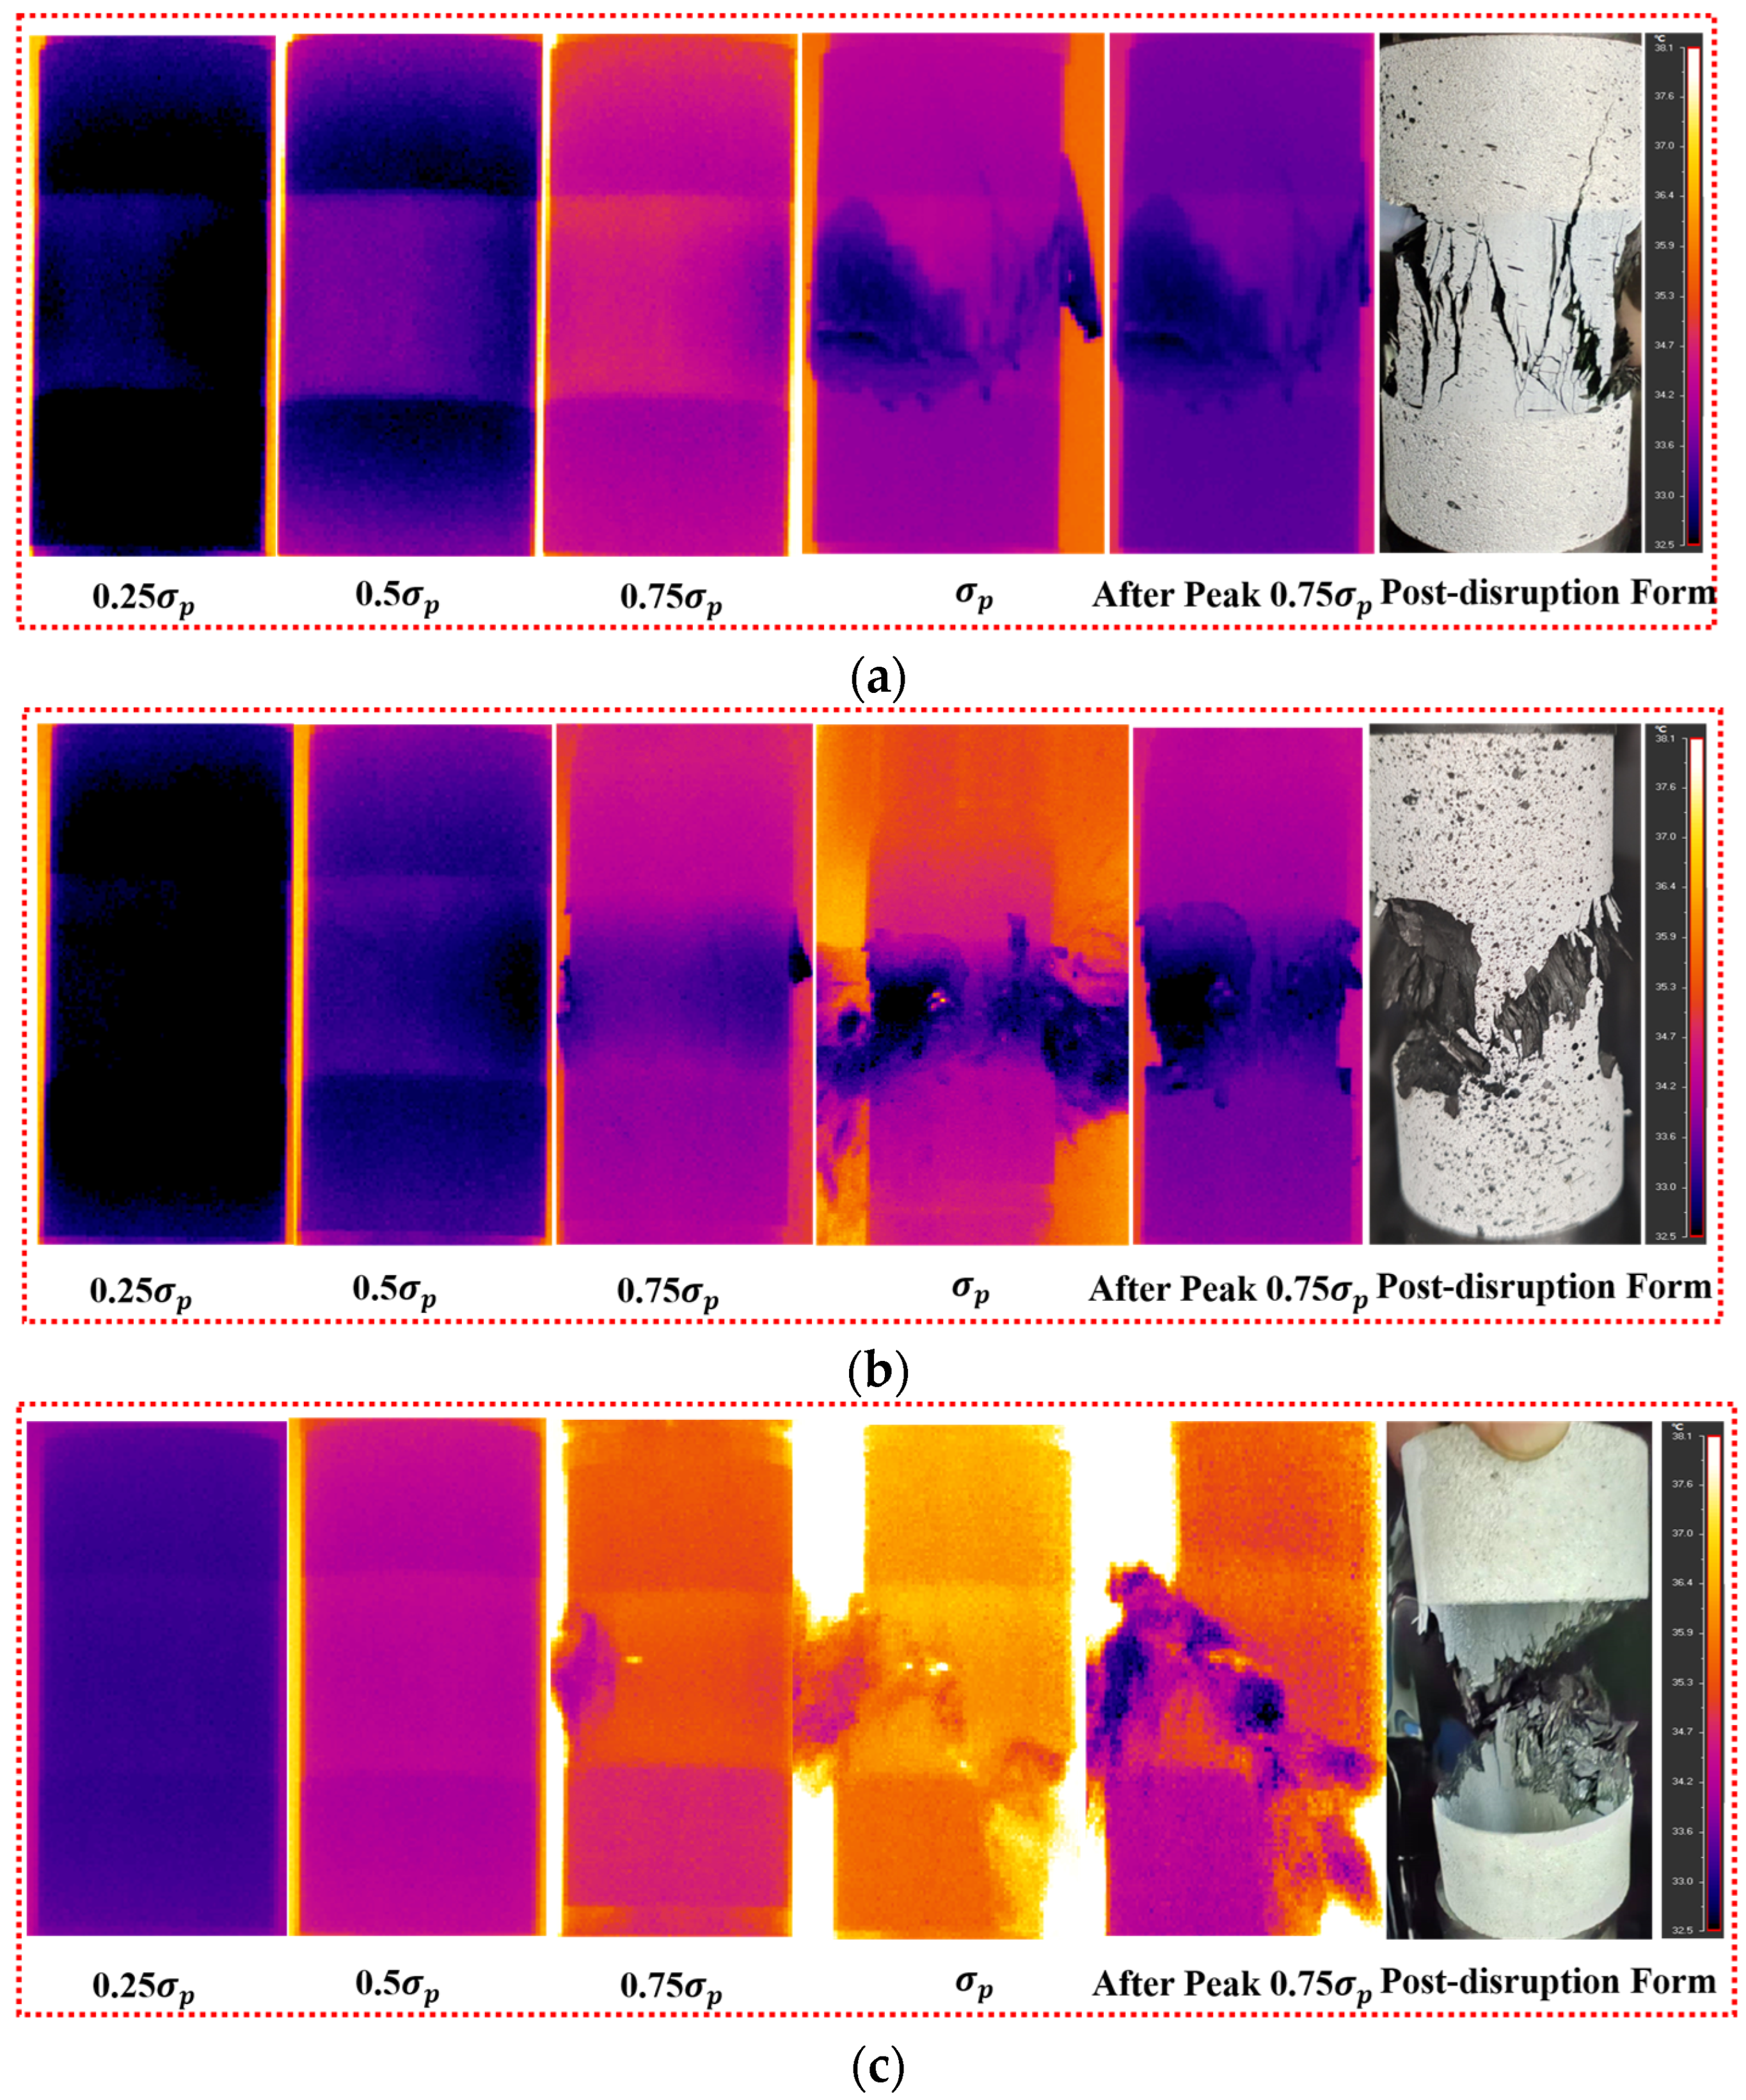
The infrared thermal imaging results shown in Figure 7 reveal that with the increase in strain rate, the temperature of the sample rises faster, which is consistent with the phenomenon that the energy release process is slow at low strain rate and the energy release is violent and rapid at high strain rate. At a low strain rate (Figure 7a), the thermal response shows a progressive evolution process. In the loading stage of 0.25σp, the surface temperature distribution of the sample is uniform, and the overall color of the infrared image is relatively dark. After loading to 0.5σp, a slight thermal accumulation occurs in the middle coal body part and the sandstone near the loading end of the sample, indicating that the energy is preferentially accumulated in the coal body part. When the applied load reaches 0.75σp, a noticeable overall temperature increase is observed across the specimen, and the temperature distribution gradually becomes more uniform. Upon exceeding the peak strength, the temperature within the coal region rises sharply, accompanied by the rapid initiation, coalescence, and penetration of fractures in the coal, ultimately resulting in the formation of prominent macroscopic cracks. The low-temperature areas of the fractures aggregate into a relatively clear high-temperature zone. From the peak to the 0.75σp stage, the overall temperature of the sample decreases, indicating that the sample failure is accompanied by a slow release of energy. After the final rupture, the thermal image shows that the strain concentration area expands to both sides, and the main crack can be observed to penetrate the coal–rock contact interface and traverse the sample in the macroscopic morphology diagram.
Figure 7.
Phase thermal imaging diagram: (a) 10−5 s−1; (b) 10−4 s−1; (c) 10−3 s−1.
In Figure 7b, before the 0.75σp stage, the temperature rise pattern is similar to that in Figure 7a. From the 0.75σp stage, a significant lag in temperature rise begins in the middle coal body part of the sample. The main reason for this is that in the coal body part, the weak structural surface cracks rapidly expand, and the external input energy dissipates through the form of crack expansion, resulting in a significant temperature drop. As the sample is loaded to the post-peak stage, its low-temperature area becomes significantly larger, but its overall temperature is higher than that at the 10−5 s−1 strain rate.
As illustrated in Figure 7c, a marked increase in strain rate leads to a substantially larger temperature rise during the early loading stage compared with the subsequent stages, while the specimen surface exhibits a relatively uniform temperature distribution. After entering the 0.75σp stage, a local, bright, high-temperature area appears in the middle coal body part, indicating that many micro-cracks are generated and tend to undergo unstable expansion at this time. When reaching the peak strength σp, the local temperature reaches the peak, and the yellow–orange alternating distribution area in the image is particularly prominent, indicating that the internal energy of the sample is rapidly dissipated in the form of heat.
The infrared thermal image analysis further shows that the temperature evolution of the interface neighborhood has a good correspondence with the strain concentration behavior. Under the condition of low strain rate, the temperature rise process of the interface is relatively slow, but the temperature level at the interface at each loading stage is higher than that of the high strain rate condition, indicating that the interface friction energy dissipation and the gradual expansion process of micro-cracks are accompanied by continuous heat release. In contrast, the interface thermal anomalies are more concentrated and more sudden under high strain rate conditions, reflecting the rapid accumulation and release of energy in a short time. The above results show that the loading rate not only controls the overall failure mode of the coal–rock combination but also significantly affects the failure evolution path and failure mechanism of the interface neighborhood.
The above analysis indicates that as the strain rate increases, the temperature rise in the sample is significant. At the low strain rate, the temperature rise in the coal body part of the coal–rock combination is faster, while at high strain rates, the specimen heats up uniformly and rapidly as a whole. The peak temperature at high strain rates is nearly 2 °C higher than that at low strain rates. The reason for this is that at low loading strain rates, the heat generated during the loading process can be fully dissipated outward through infrared radiation, air convection, and heat conduction, resulting in a limited overall temperature rise in the specimen. However, at high strain rates, deformation occurs in a short period of time, generating a large amount of heat instantaneously. With less heat dissipation outward, the thermal energy is stored within the specimen, leading to a significant local temperature rise.
4. The Energy Evolution Characteristics of Coal–Rock Composite at Different Strain Rates
4.1. Numerical Model Construction and Mesoscopic Parameters
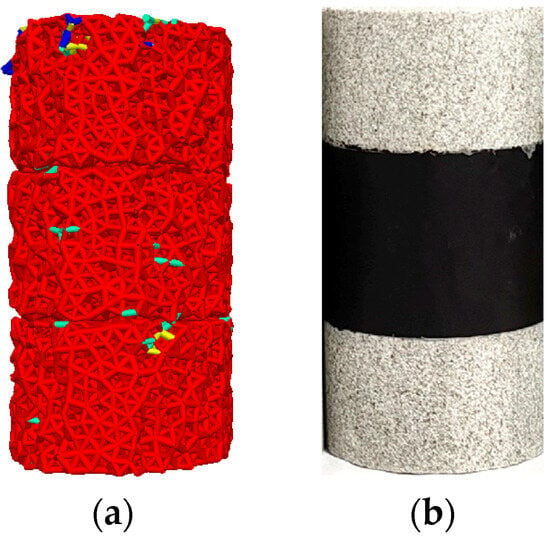
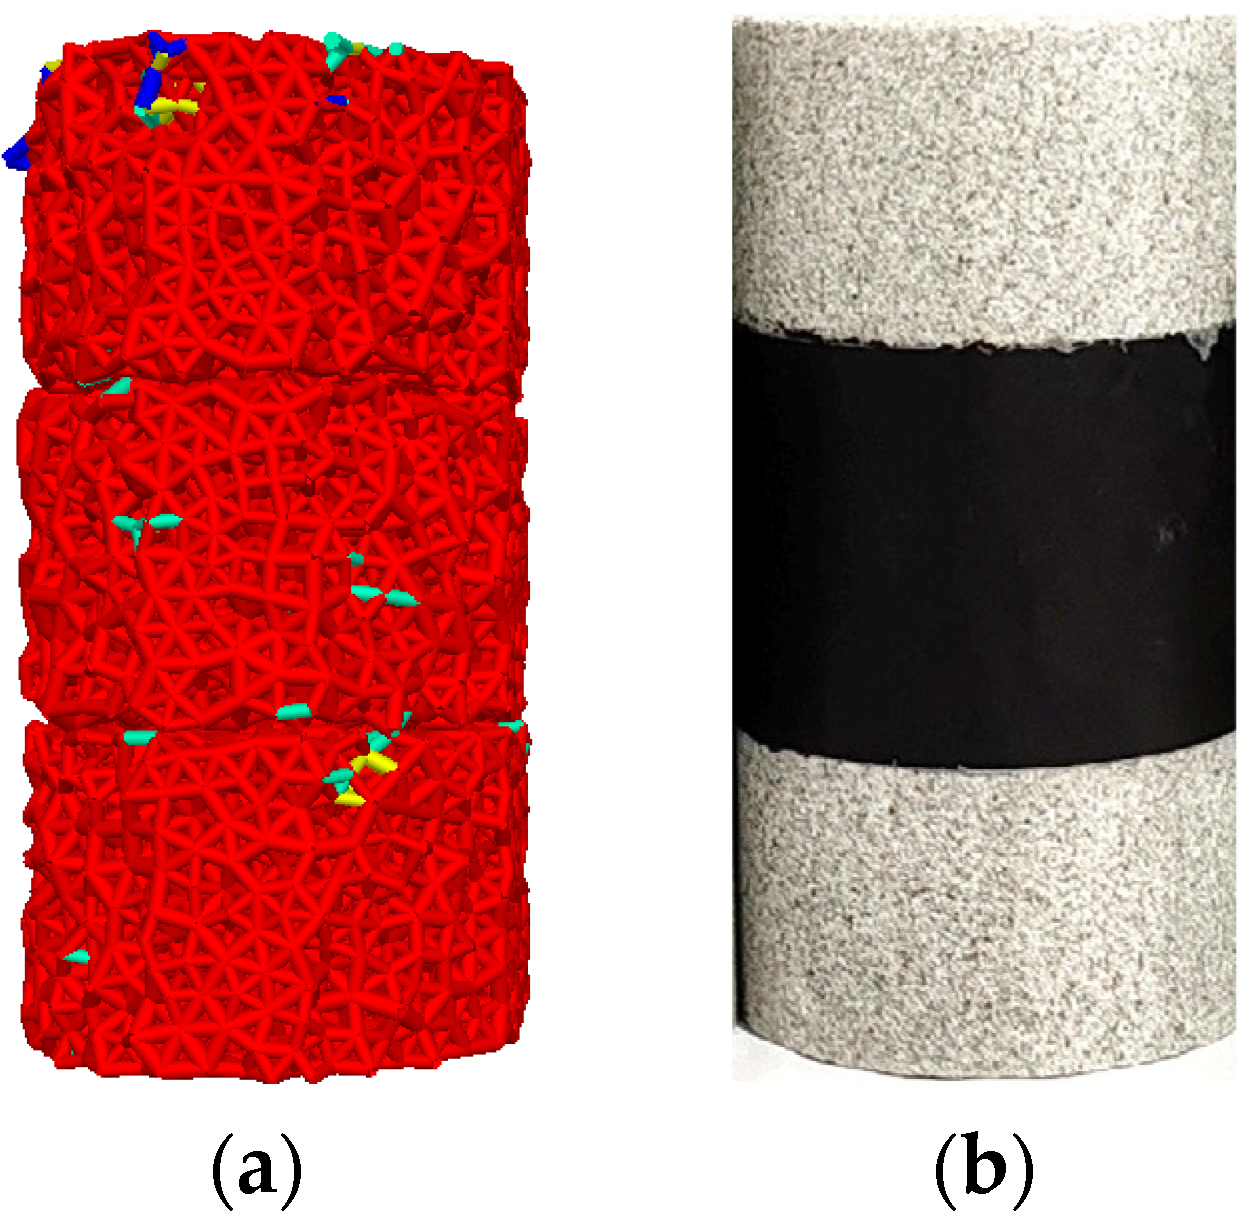
Based on the linear parallel bond framework, contact interactions were assigned to represent the internal cracking behavior of the two lithological specimens. There are significant material heterogeneity and abrupt changes in mechanical parameters in the coal-sandstone combination. The interface region not only plays a connecting role in the loading process but also may become a key part of stress redistribution and deformation coordination. Due to the difference in elastic modulus and strength between coal and sandstone, local strain concentration is easy to occur at the interface. In addition, the adhesive layer, as a thin layer of polymer bonding medium, may occur micro-slip under shear action. Therefore, the Linear model is selected to give the contact. According to the relevant parameters of the complete rock-like specimens, a two-dimensional numerical analysis model consistent with the test size was generated in the program. Figure 8 shows a comparison between the numerical analysis model and the physical model of the fissure body; the size of the numerical model is φ50 mm × h100 mm.
Figure 8.
Specimens of coal–rock composite body and PFC model: (a) PFC model; (b) sample of coal–rock combination. In the PFC model, different colors indicate particles with different contact force magnitudes.
In order to ensure that the PFC numerical model can reflect the macroscopic mechanical response law of coal and sandstone materials, this paper uses the idea of “macroscopic test index-mesoscopic parameter inversion” to calibrate the mesoscopic parameters of the two lithological materials. The linear parallel bond (LPB) model is used to describe the interaction between coal and sandstone particles, and the linear contact model is used to describe the coal–sandstone interface. The mesoscopic parameter calibration is based on the macroscopic index obtained by uniaxial compression test of single material. The calibration process adopts the step-by-step trial and error method to reduce the uncertainty caused by parameter coupling. Firstly, the geometric and inertial parameters such as particle gradation (minimum particle size to particle size ratio) and density are fixed. On this basis, the stiffness parameters are preferentially calibrated. By adjusting the particle contact modulus and the parallel bond modulus and setting the normal/tangential stiffness ratio , the parallel bond strength control parameters (equivalently reflecting the bond tensile/shear resistance) are further adjusted to make the peak strength consistent with the test results. The compressive strength of sandstone is 14 MPa and the compressive strength of coal is 5.5 MPa. Finally, the friction coefficient is adjusted to make the bearing level of the initial section after the peak and the shear slip characteristics after the failure closer to the experimental observation. Each round of adjustment only changes one type of parameters, and the remaining parameters remain unchanged, and the relative error of is used as the main evaluation index until the fitting requirements are met.
The overall particles of the generated specimens are constrained by the boundary wall. The specific microscopic parameters corrected based on the trial-and-error method are shown in Table 3 and Table 4. When conducting numerical simulation tests of fissure bodies at different strain rates, the mesoscopic mechanical parameters of the calibrated fissure body numerical analysis model remain unchanged; that is, the same mesoscopic mechanical parameters are used to conduct the numerical simulation tests of fissure bodies at different strain rates.
Table 3.
Material calibration parameter values of the PFC model in the coal sample section.
Table 4.
Calibration parameter values of PFC model materials for fine sandstone part.
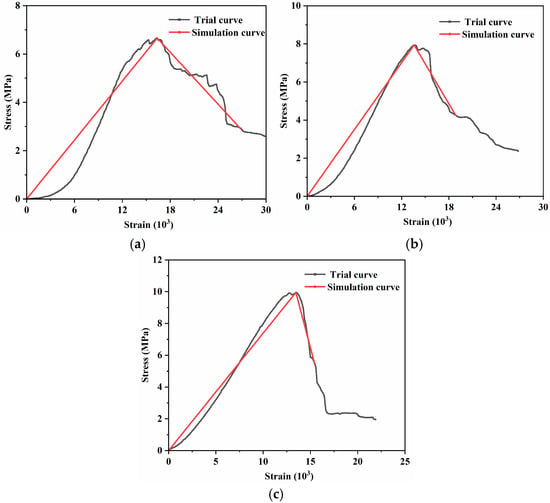
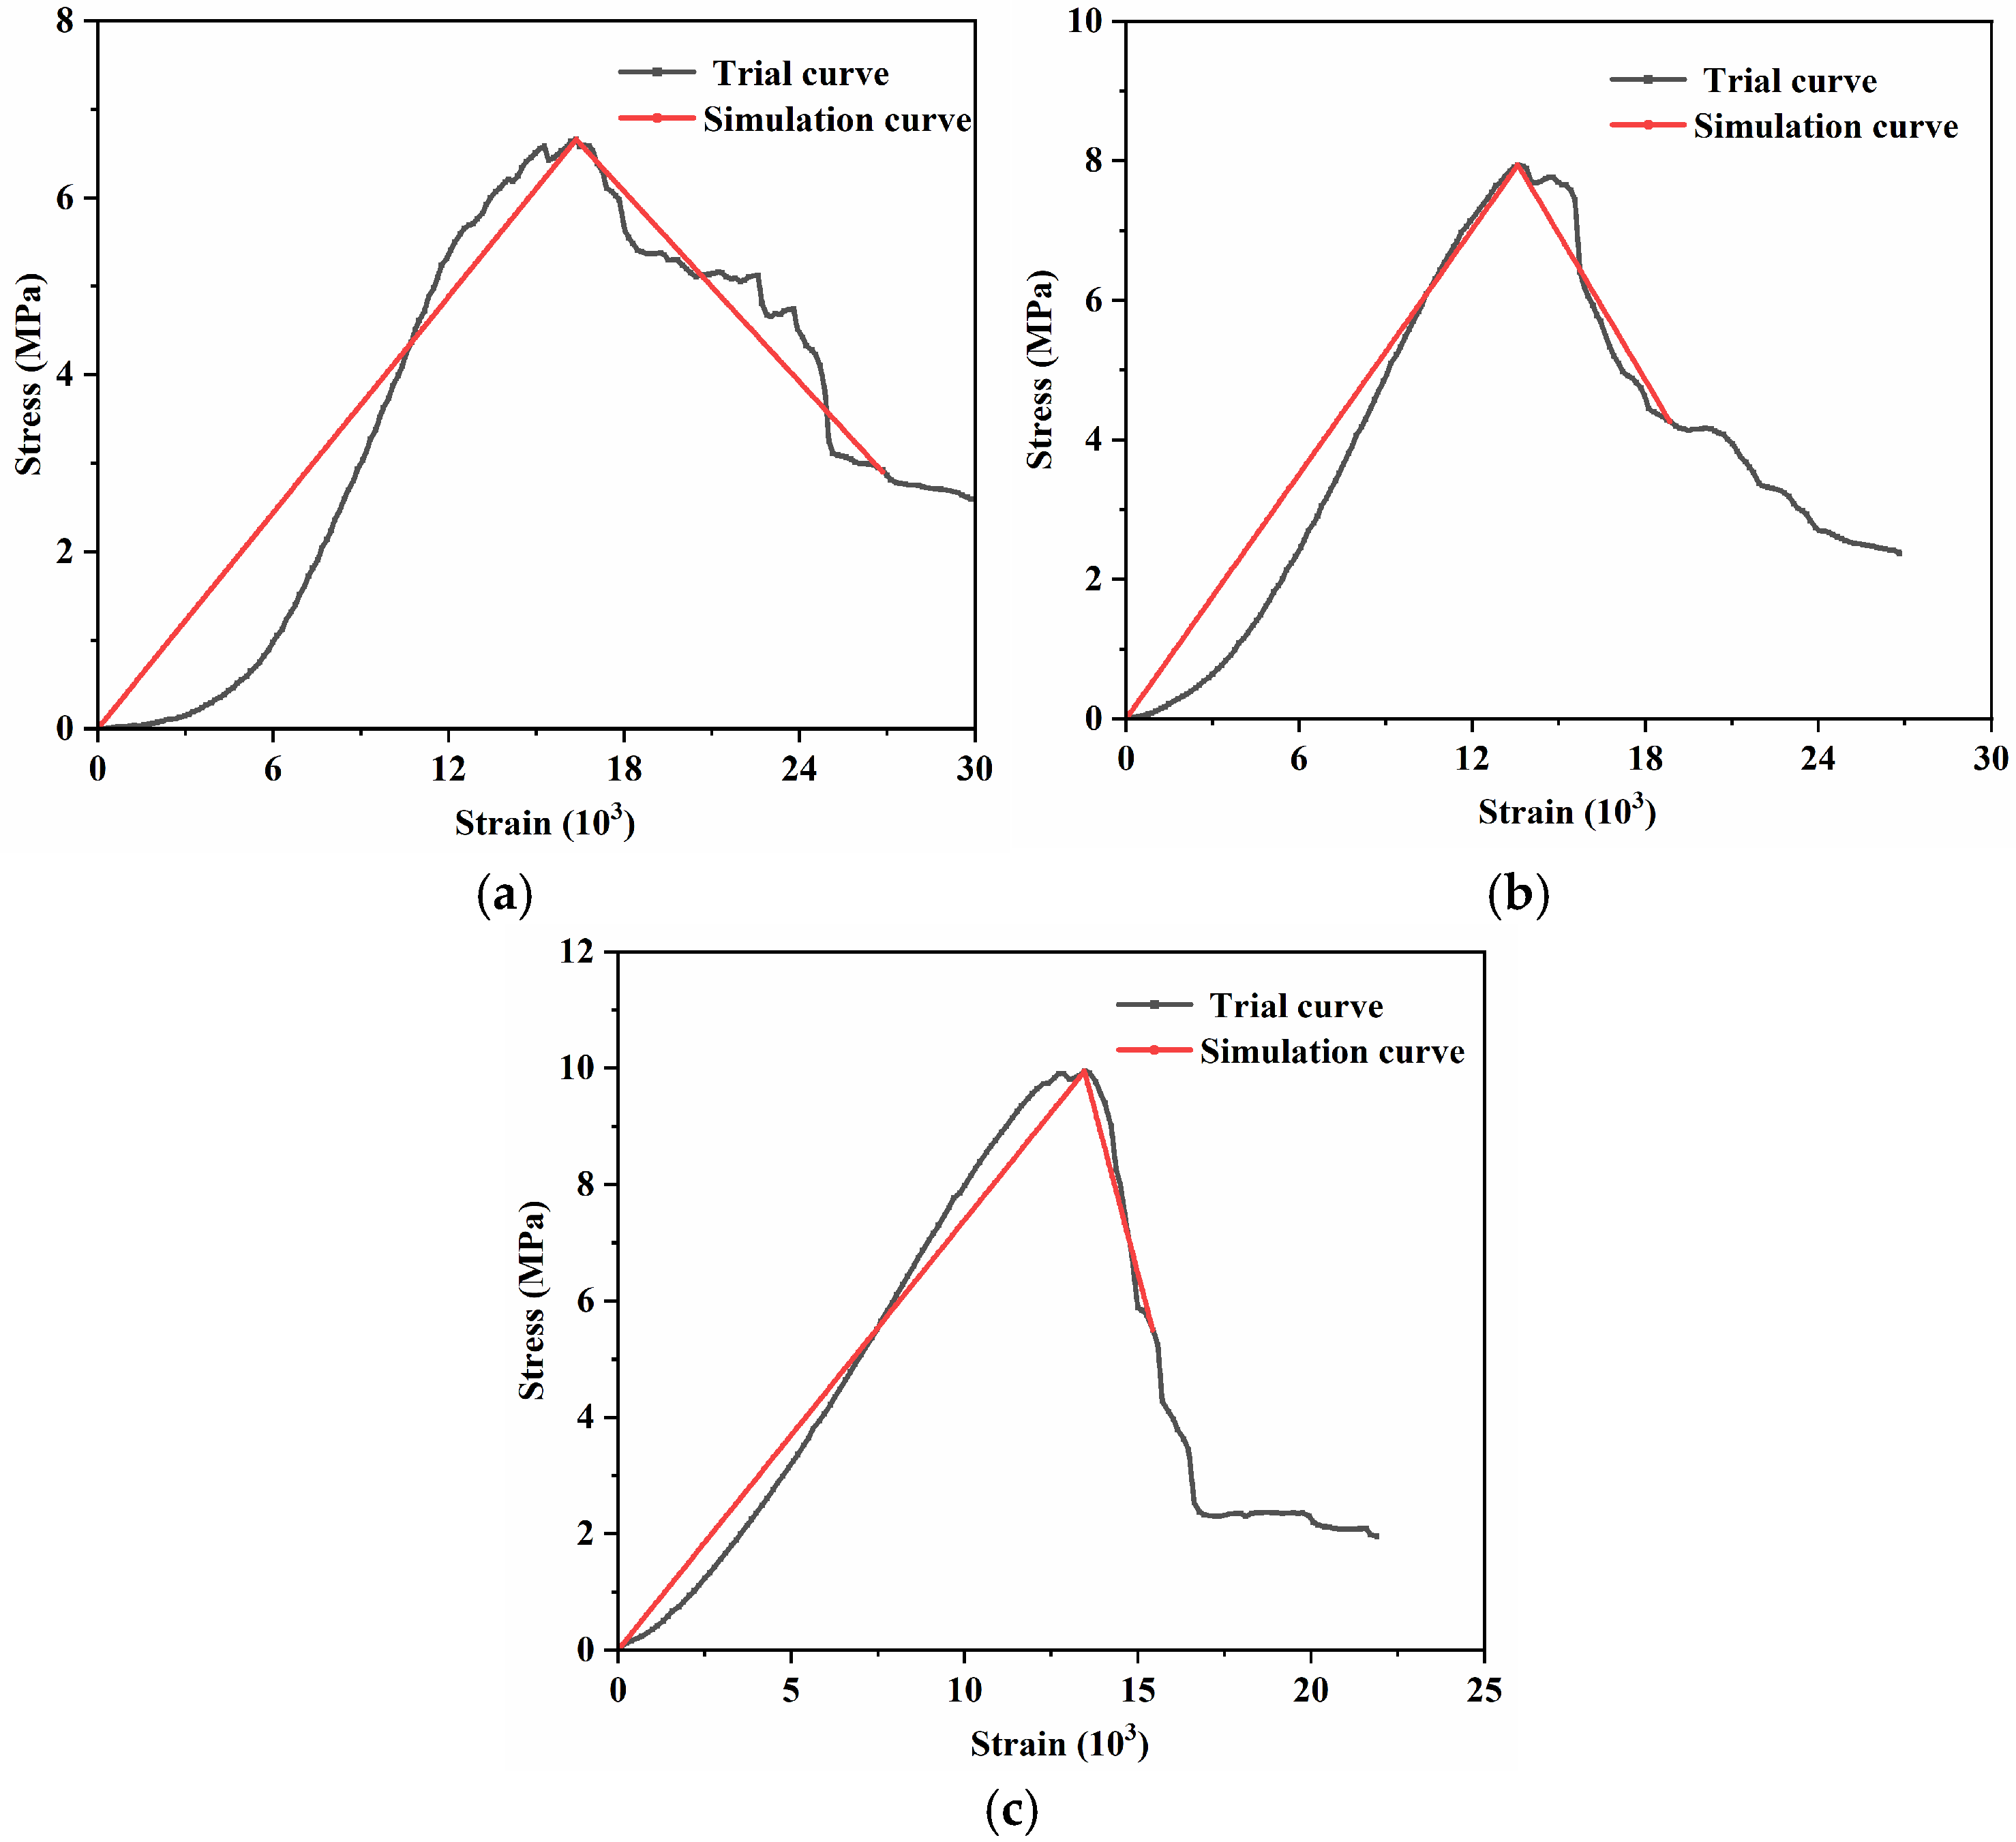
This paper presents a comparison chart of the failure modes and stress–strain relationship curves of complete specimens and numerical analysis models at strain rates of 10−5 s−1, 10−4 s−1, and 10−3 s−1 (see Figure 9).
Figure 9.
Simulation results of stress–strain curve of coal–rock composite: (a) 10−5 s−1; (b) 10−4 s−1; (c) 10−3 s−1.
Using the aforementioned PFC modeling approach and parameter configuration, numerical simulations of the coal–rock composite were performed at three different strain rates. The resulting stress–strain curves from the simulations were then compared with the experimental results presented in Section 3.1 to assess the validity and reliability of the numerical model outputs. Through the analysis, the peak intensities of the three groups of coal samples in the simulation are 9.90, 7.86, and 6.74 MPa. Compared with the test data, the deviations of the peak intensity are 0.05%, 0.01%, and 0.02%, respectively. The adopted model parameters are representative of the material behavior, and the numerical simulation outcomes show strong consistency with the experimental observations. Therefore, the model is suitable for further investigation of the mechanical damage evolution of the coal–rock composite during loading and provides meaningful reference value for engineering applications.
4.2. Energy Evolution Characteristics of Coal–Rock Complexes
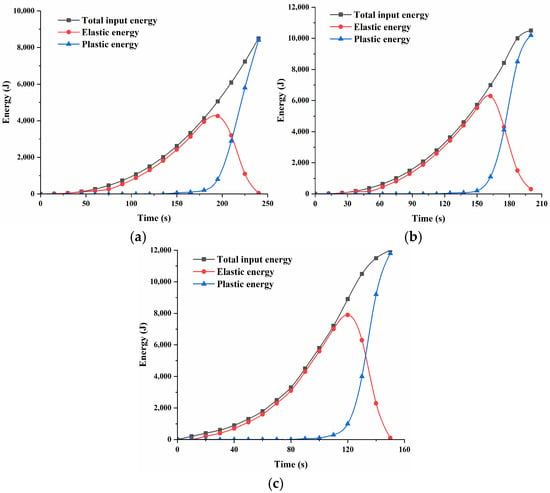
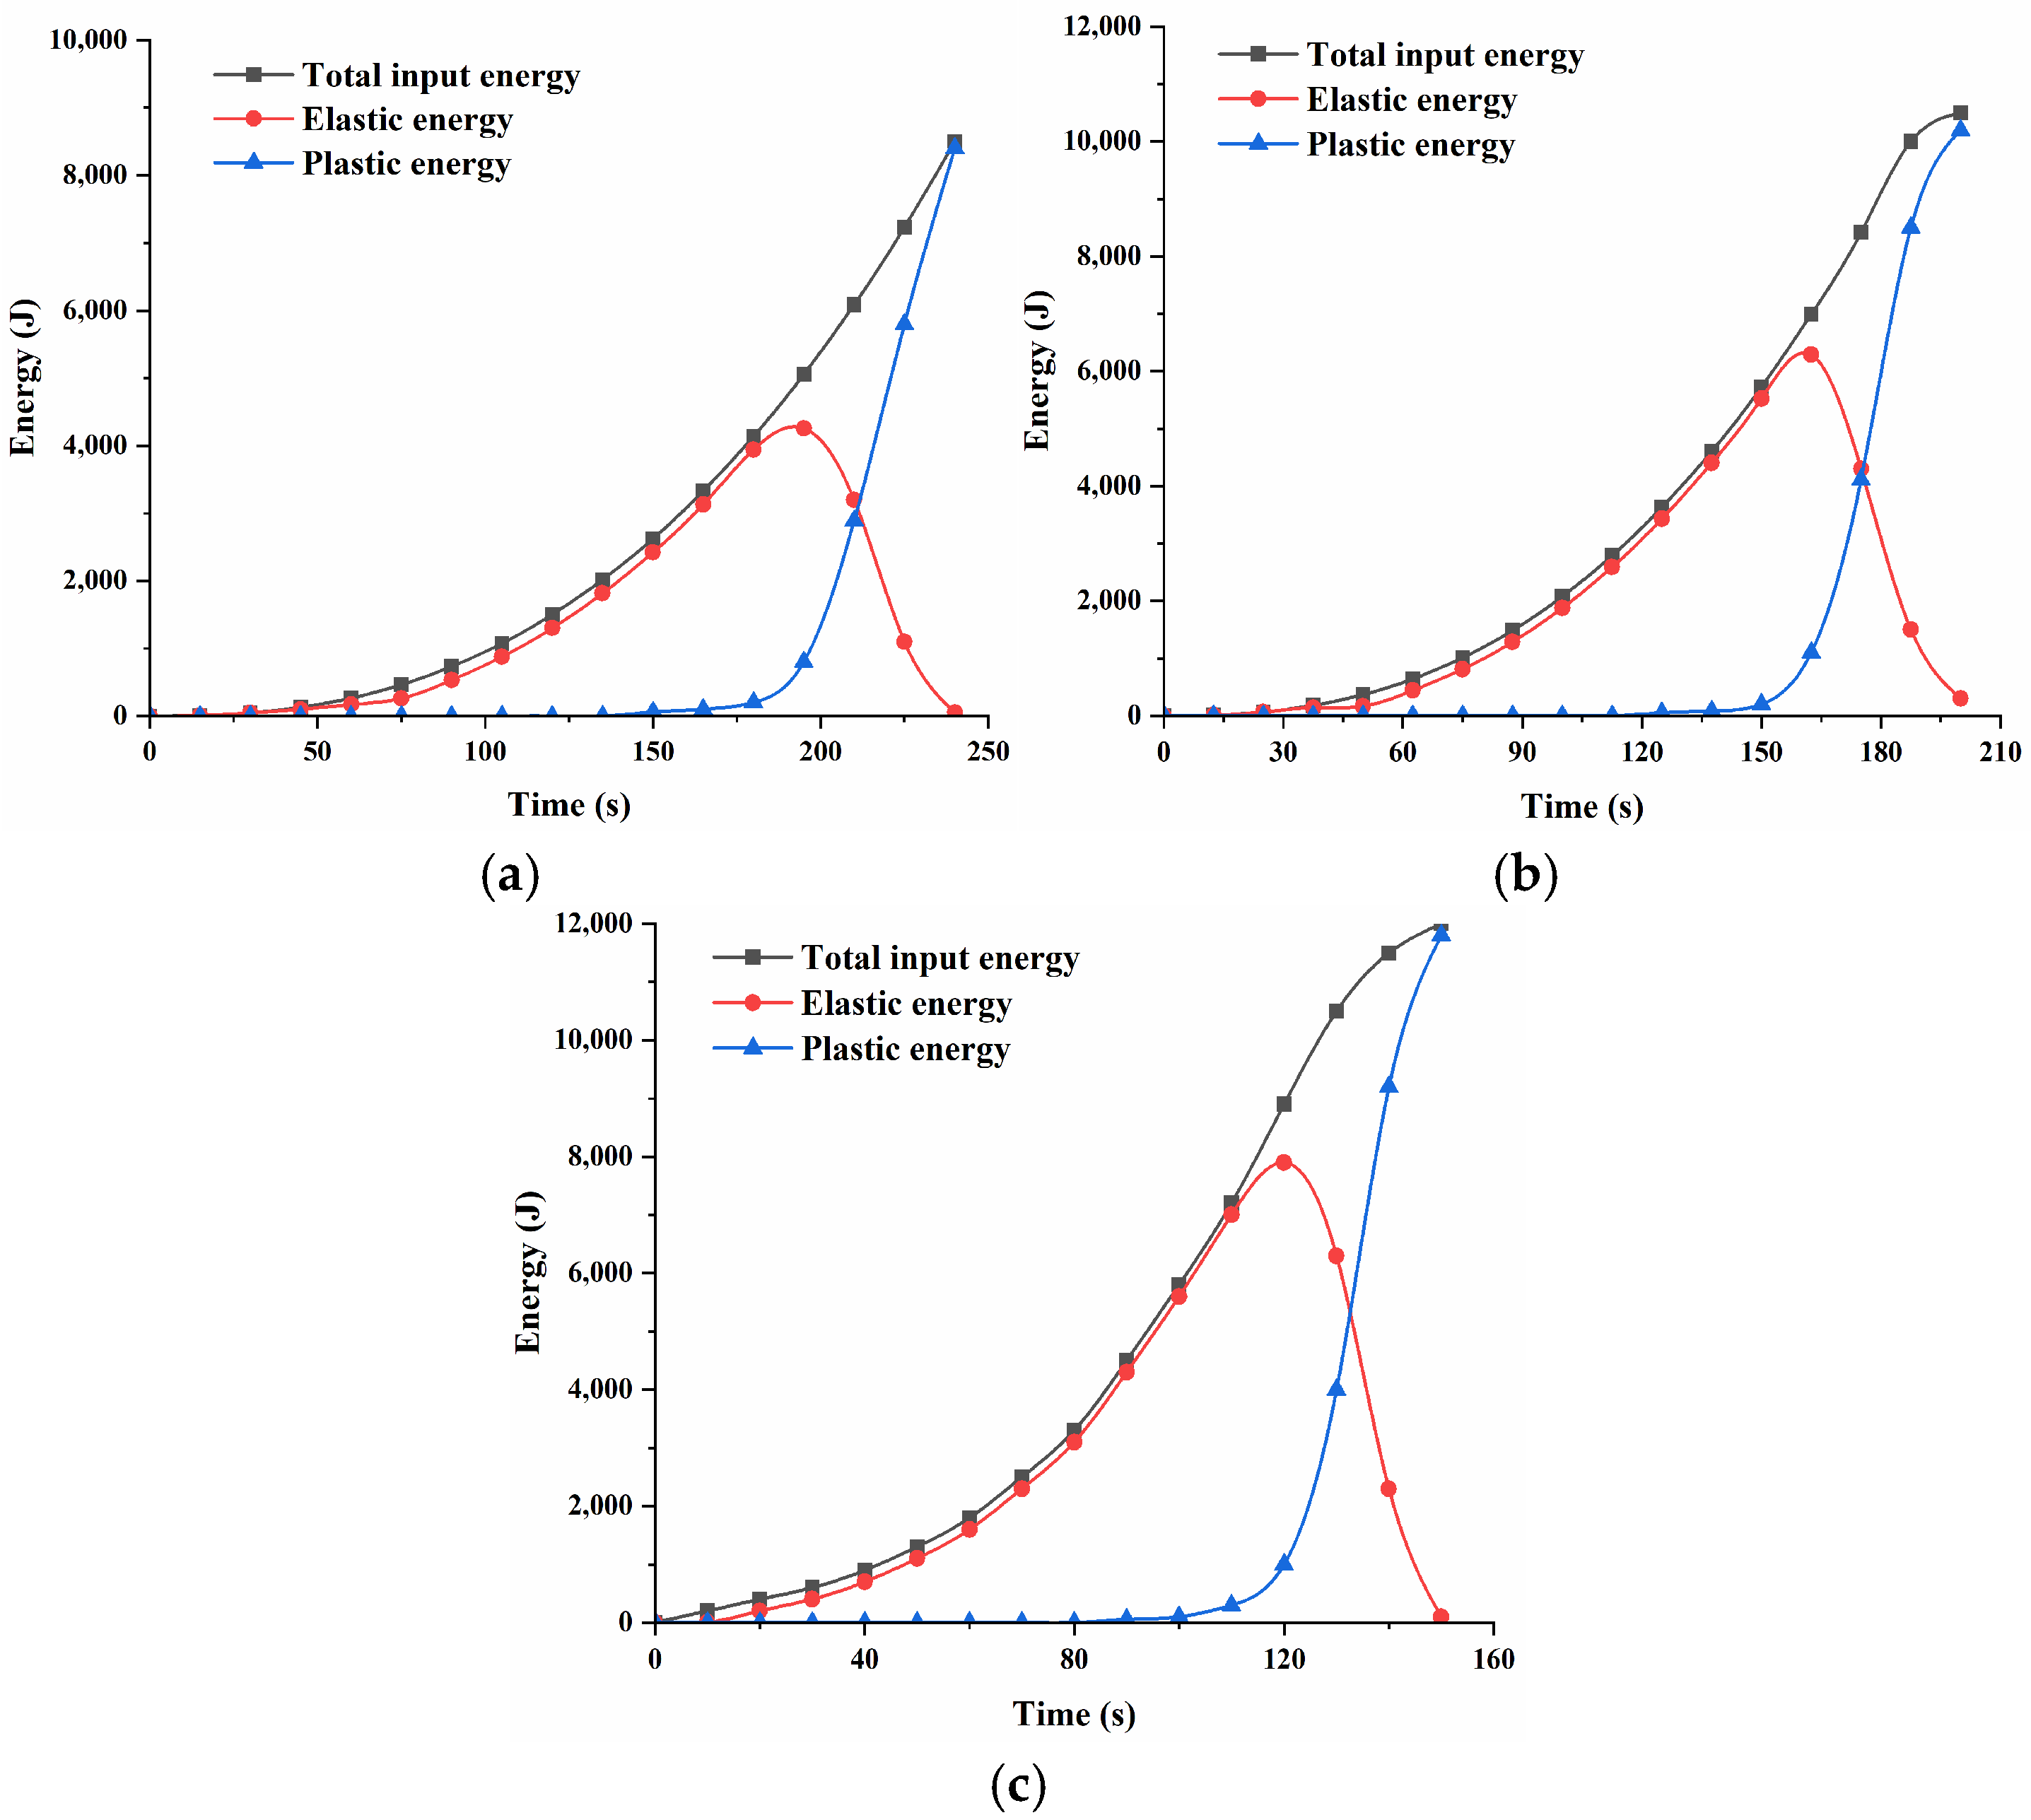
Based on the PFC numerical simulations of coal–rock composite loading under different strain rate conditions, the corresponding energy evolution curves were extracted, as illustrated in Figure 10. The energy release curve in Figure 10 shows that the plastic energy release rate increases with the increase in strain rate, which is consistent with the hypothesis that the higher strain rate inhibits the plastic expansion proposed in the damage model. The figure shows that the total energy at strain rates of 0.001, 0.01, and 0.1 mm/s are 90, 110, and 125 kJ, respectively. This means that with the increase in strain rate, the total input energy increases, the peak strength of the curve is higher at high strain rate, and the total input energy is larger. The main reason for this is that at high strain rates, energy-consuming processes such as crack propagation and frictional sliding within the coal–rock combination are suppressed, and the material exhibits a higher strength and stiffness. A higher stress needs to be applied to achieve failure, and thus, the external force has to do more work.
Figure 10.
Energy evolution characteristics of the combined body at different strain rates: (a) 10−5 s−1; (b) 10−4 s−1; (c) 10−3 s−1.
As the strain rate increases, the accumulation of elastic strain energy exhibits a pronounced upward trend. It is shown that the elastic energy peaks at three strain rates are 45 kJ, 65 kJ and 78 kJ, respectively. The analysis results above show that as the strain rate increases, the elastic modulus of the material increases, which means that, at the same strain, more elastic energy can be stored. In addition, at high strain rates, the dissipation mechanism is suppressed, plastic deformation and crack propagation are insufficient, and a large amount of elastic energy accumulates before the peak strength of the specimen. Following the peak stress, the stored elastic energy is quickly liberated and dissipated through intense plastic deformation. Plastic energy is primarily consumed by irreversible plastic flow, internal damage, frictional heating, and other processes, whereas damping slip energy is dedicated to the propagation of cracks in the specimen. As illustrated in Figure 10, higher strain rates correspond to a more rapid increase in plastic deformation during the post-peak stage. And the faster the release rate of elastic energy indicates that the material is more prone to brittle failure at high strain rates.
5. Research on Microscopic Damage Models of Coal–Rock Composites at Different Strain Rates
Before the external load is applied, the coal–rock composite is composed of particles with a heterogeneous composition, and it simultaneously contains multi-scale mineral structures, initial fractures, and pores. At this point, the overall stability of the particles is mainly maintained by bonding and frictional forces. Under applied loading, interparticle motion occurs through shear slip along contact interfaces, leading to the progressive development of localized damage. Research shows that the characteristic parameters of these micro-element particles as a whole satisfy the two-parameter Weibull statistical distribution law. Based on this statistical characteristic, a microscopic damage evolution model applicable to coal–rock combinations was derived and established [27]:
The formula: represents the Weibull distribution variable when the micro-element structure of the coal and rock mass is damaged, and is the homogeneity coefficient, which controls the inclination degree of damage initiation and the degree of pre-peak softening. The larger the material is, the smaller the statistical discreteness of the material is, and the more sudden the peak damage is. A smaller value indicates greater discreteness, earlier onset of damage, and more pronounced pre-peak nonlinearity. represents the Weibull distribution parameter value corresponding to the elastic density function of the micro-element structure when the coal–rock mass is completely damaged. It reflects the critical scale level at which the internal microstructure of the coal–rock composite begins to undergo significant damage evolution in a statistical sense. Its magnitude indicates the overall resistance capacity of the material to external loads. The larger is, the higher the average strength level of the micro-element is, and the damage initiation is postponed. Macroscopically, this manifests as higher peak strength and more obvious elastic stage. The smaller is, the higher the initial defect or weak structural plane development degree within the material is, and the micro-element is more prone to failure under smaller strains. Damage evolution occurs earlier.
The damage variable can be defined as the ratio of the volume of the damaged part of the coal–rock composite to the total volume of the sample .
The damage variable is expressed as the fraction of the damaged volume within the coal–rock composite relative to the total specimen volume , namely
The effective stress of the undamaged, effective bearing part in the specimen can be expressed as
In the formula, represents the effective bearing stress; is the overall stress of the combined body.
As the strain increases, the micro-element gradually reaches its strength threshold and fails. The damage variable D monotonically increases, and the corresponding macroscopic stress–strain curve transitions from the elastic stage to the nonlinear damage stage. This process is in good agreement with the elastic stage, plasticity stage, and post-peak softening stage revealed by the stress–strain curve mentioned above.
Given that the coal–rock composite body still retains residual strength after failure, a damage factor is introduced to correct the effective stress. This can represent the residual load-bearing effect provided by the macroscopic fracture surface friction and shear slip mechanisms after the macroscopic fractures have extended and connected. The introduction of this damage factor can better describe the slow attenuation trend of the stress after the peak, which is consistent with the non-sudden instability phenomenon observed in the experiments after the peak. can be expressed as
The formula: represents the residual strength of the coal–rock combination, and is the peak compressive strength of the combined body.
Then, the corrected effective stress is
This study assumes that the internal micro-element structure of the combined body satisfies the equivalent stress equation. Then, the damage constitutive model of the combined body can be expressed as
The formula represents the elastic modulus of the combined body, and represents the axial strain of the combined body.
After testing, if the damage variable is a micro-element intensity distribution function, then the relationship between the micro-damage model and the damage variable can be expressed as
Substituting Equation (7) into Equation (6) gives
At this point, the loading time scale is introduced to reveal the changes in the strain rate, and the strain rate is incorporated into the damage evolution process. The strain rate directly controls the time conditions for the initiation, expansion, and interconnection of microcracks. When the strain rate is low, the deformation process of the sample is relatively slow, and microcracks can fully develop and steadily expand. Damage accumulates continuously in the pre-peak stage, and macroscopically, this is manifested as a lower peak strength and relatively gentle post-peak softening characteristics. However, under higher strain rate conditions, the loading time is significantly shortened. Before microcracks have fully evolved, overall instability occurs, and the damage accumulation in the pre-peak stage is inhibited. As a result, the apparent elastic modulus and peak strength increase, and the failure process exhibits obvious brittle characteristics. Based on the material continuity assumption of damage mechanics, the strength distribution of the microelements of the composite is characterized by the distribution. To study the mechanical properties of the coal–rock composite under different strain rates, the strain rate is introduced.
By substituting Equation (9) into Equation (8), the stress–time relationship equation of the microscopic damage of the coal–rock composite body is obtained as
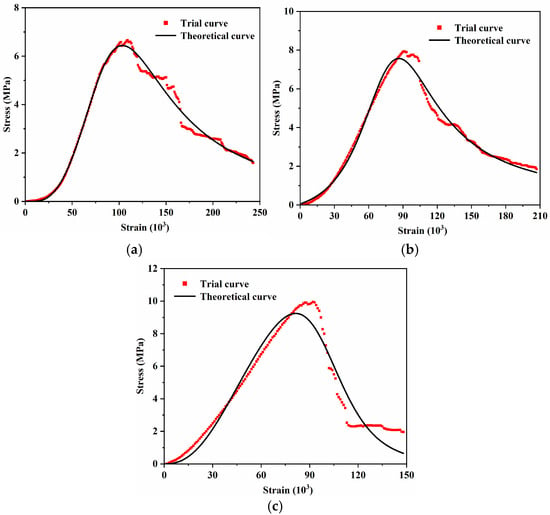
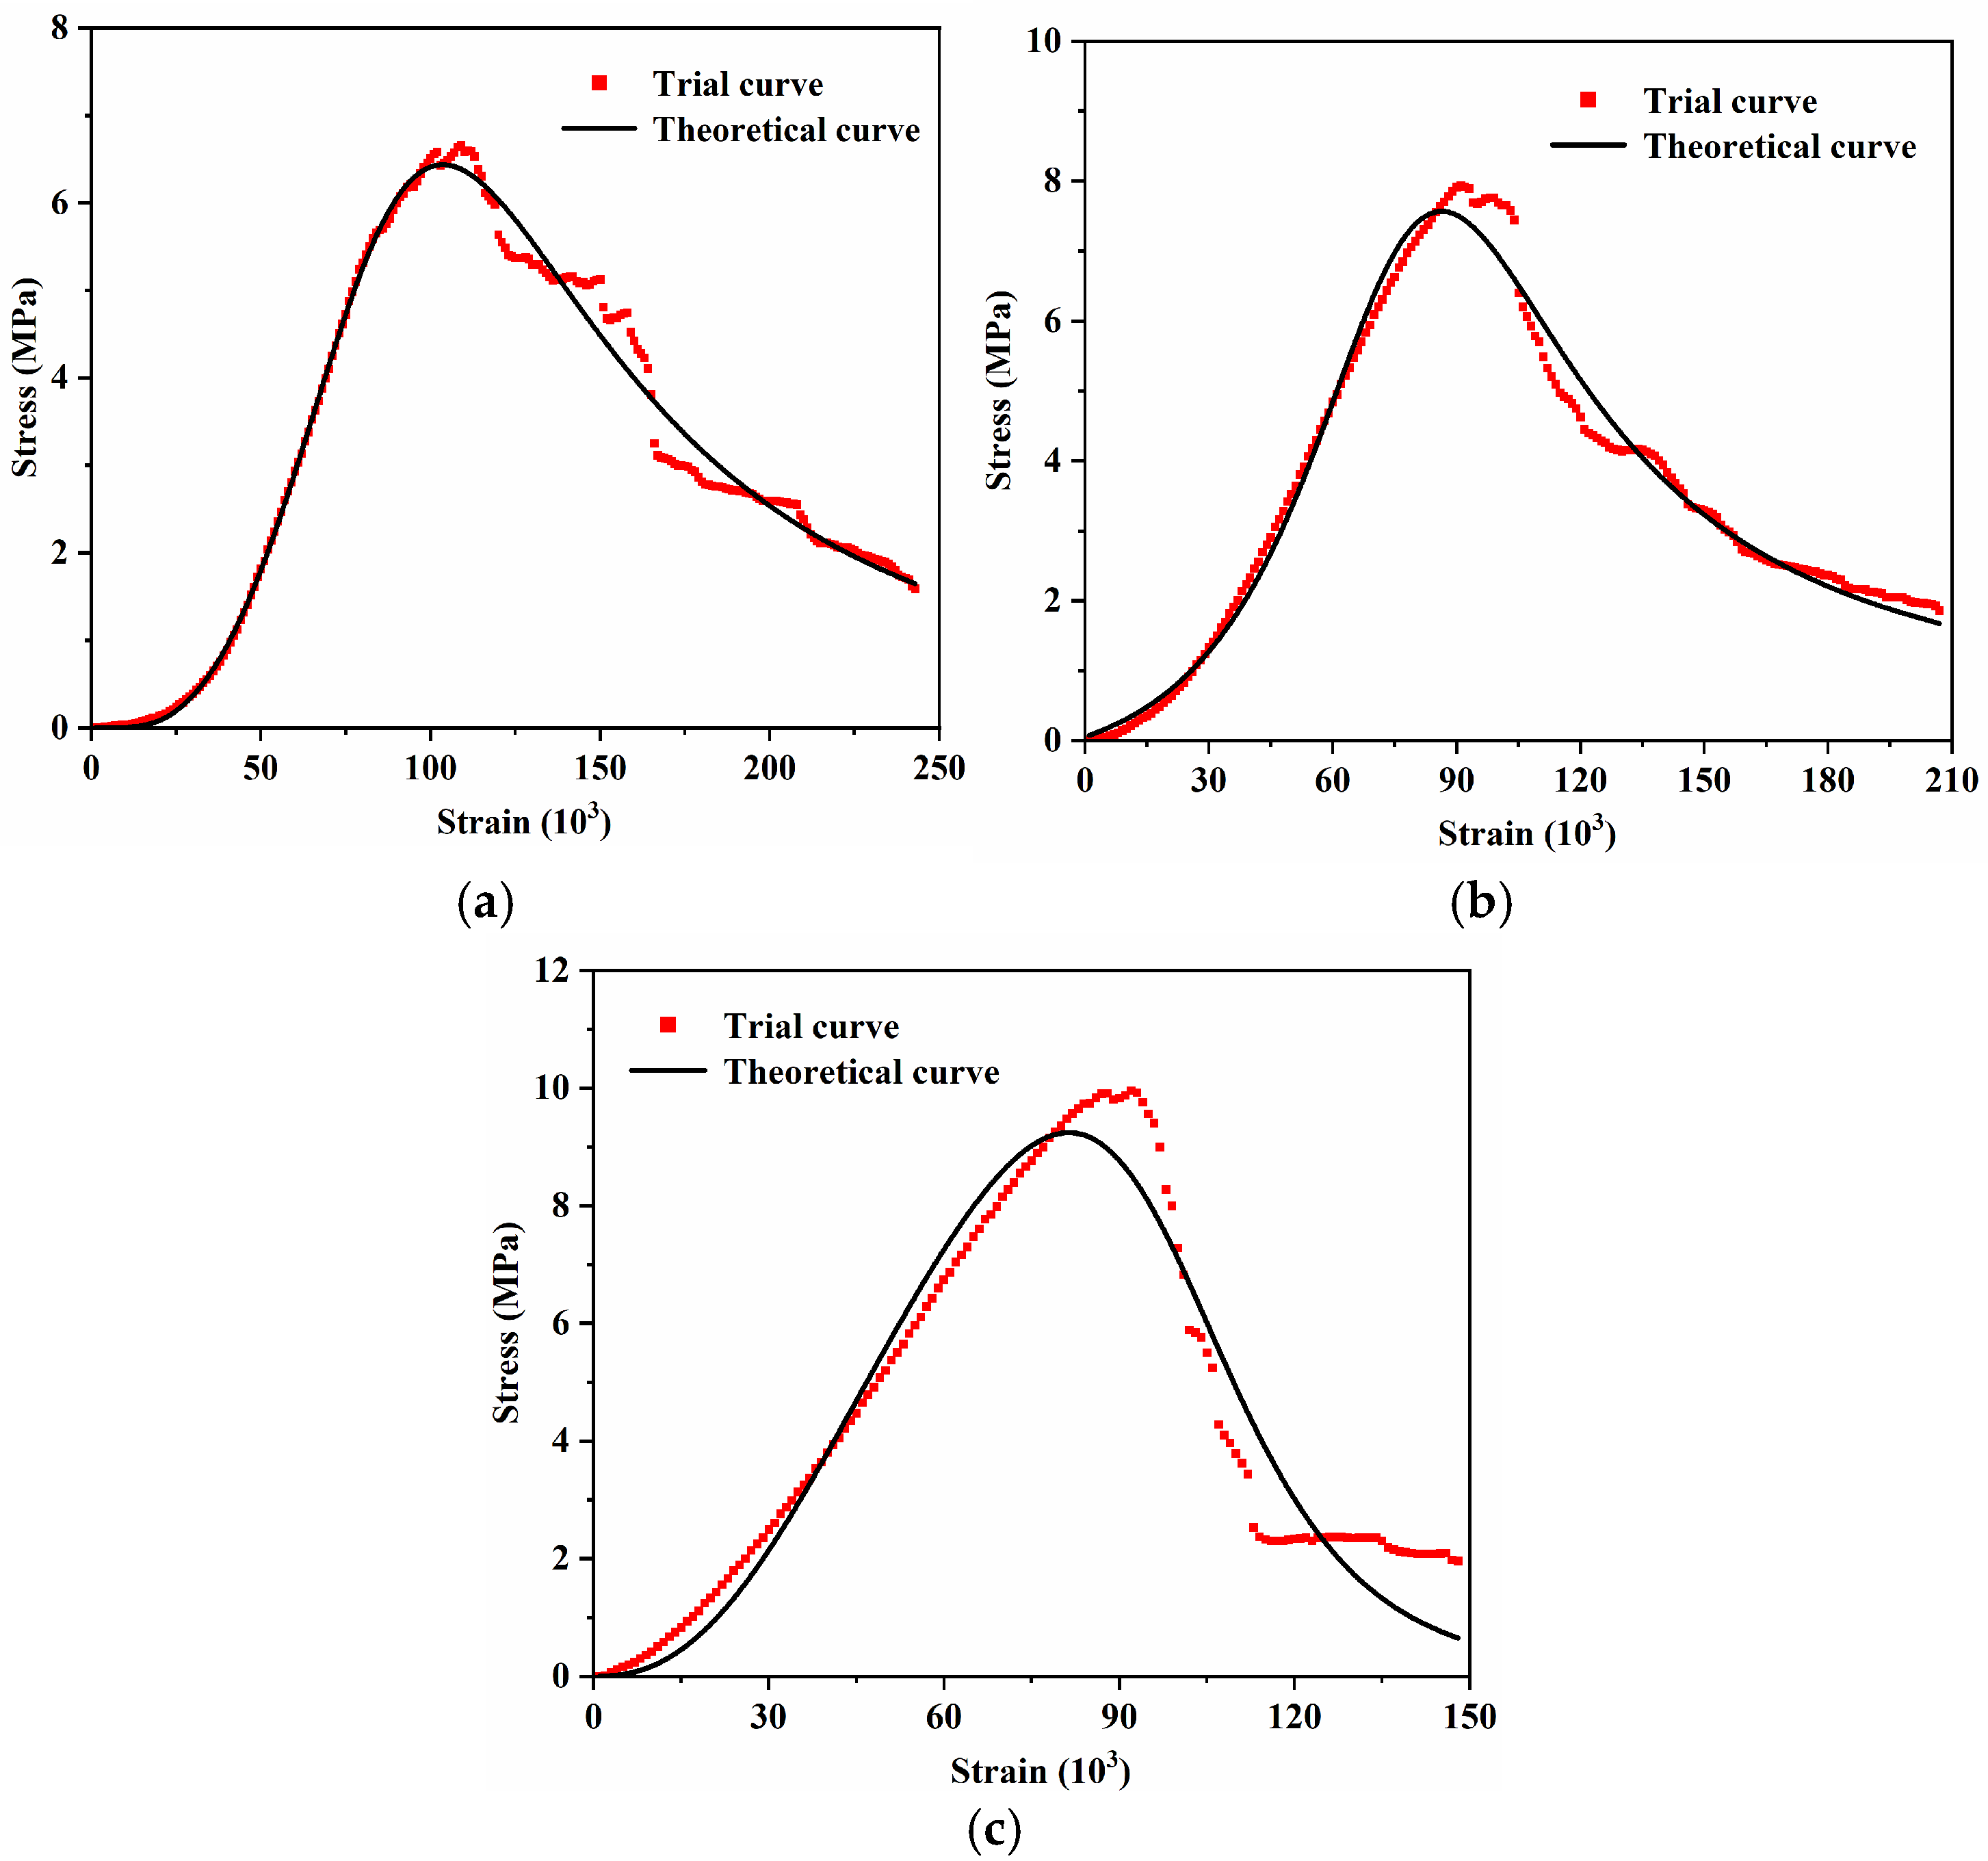
Based on the test parameters, such as the average peak intensity at different strain rates measured in the experiment, a linear fit was performed on Equation (10). The Weibull distribution parameter is 4.62, and is 1.52; strain rate and specimen height were determined according to the test plan. All parameters were substituted into the microscopic damage model, and the theoretical and test stress–time comparison curves were obtained (Figure 11).
Figure 11.
Theoretical curves of damage constitutive equations under different strain rates: (a) 10−5 s−1; (b) 10−4 s−1; (c) 10−3 s−1.
Figure 11 shows that the theoretical stress–strain curves of the three groups of coal–rock assemblages fitted using the damage mechanics model constructed based on the Weibull probability distribution function are highly consistent with the experimental results obtained in the pre-peak stage. It has been demonstrated that the improved micro-damage model used in this study can accurately describe the deformation and failure process of the coal–rock composite body under uniaxial compression. However, during the destructive evolution process after the peak, there is a certain degree of deviation between the two; in particular, the fitting effect of the theoretical curve on the post-peak softening behavior is slightly insufficient. In the above constitutive model, the elastic modulus and peak strength of the coal–rock combination increase with the increase in strain rate. At the same time, the DIC results reveal that the strain field exhibits progressive localized development under low strain rate conditions, while under high strain rate loading, the strain concentration area is rapidly formed and triggers the overall instability. In addition, the acoustic emission results show that the number of AE events is large and the distribution is relatively dispersed during low strain rate loading, while the number of AE events decreases but the single-release energy increases significantly under high strain rate conditions, which is consistent with the model prediction that the damage tends to be more concentrated and more sudden under high strain rate conditions.
It should be noted that although the established statistical damage model can better describe the mechanical response characteristics before and near the peak, there is still a certain degree of fitting deviation in the post-peak stage. This is mainly because the post-peak failure process involves significant discontinuous mechanical behaviors, such as complex mechanisms such as shear slip and interfacial friction energy dissipation after macro-fracture penetration. It is difficult to fully describe the statistical damage model in a single continuous form. The related problems need to be further discussed in the follow-up study by introducing discontinuous damage description or multi-scale coupling method.
6. Conclusions
(1) According to the deformation behavior and failure features of the composite specimens subjected to external loading, the mechanical response can be divided into four distinct stages. The stress–strain curves obtained at different strain rates were analyzed in stages. It was observed that the elastic modulus, stress at the expansion point, and peak strength values of the combined body specimens increased with the increase in the strain rate. An increase in strain rate shortens the duration required for the specimens to attain peak strength, whereas the influence of strain rate on the CD segment becomes negligible after failure.
(2) At high strain rates, the strain direction changed suddenly, which manifested as unstable failure with rapid crack expansion at high strain rates. However, at low strain rates, the strain field direction changed more regularly, and the progressive failure characteristics were obvious. Additionally, as the strain rate increased, the brittle characteristics of the composite body intensified, and the strain at the peak stress point gradually decreased. The axial and radial strain rates increased, and the destruction process changes from the progressive expansion of the coal body to a sudden and coordinated instability of the coal and rock mass. At high strain rates, both the peak pre-strain rate and the strain value were relatively small. At low strain rates, there is a shear slip behavior at the coal–rock interface, while at high strain rates, the localization of the interface neighborhood is more obvious.
(3) The energy at the peak point of the sample was positively correlated with the strain rate. Regarding the ringing count, as the strain rate increased, the ringing count of the acoustic emission accompanying the loading process of the combination gradually decreased, and the distribution of acoustic emission events became more concentrated. However, at low strain rates, the primary and secondary fractures gradually expand, and the acoustic emission events are distributed relatively sparsely, with a relatively high frequency of acoustic emissions collected.
(4) As the strain rate increases, the specimen exhibits a more pronounced temperature rise. Under low strain rate conditions, temperature elevation is primarily concentrated in the coal portion of the coal–rock composite, whereas at higher strain rates, the specimen undergoes rapid and more uniform heating across its entire surface. At peak stress, the specimen tested at a loading rate of 0.1 mm/s shows a temperature approximately 2 °C higher than that recorded at a strain rate of 10−5 s−1, in addition, there is a friction heating phenomenon at the coal–rock interface at low strain rate, and the interface thermal anomaly is more obvious at high strain rate.
(5) Using the PFC particle flow discrete element method, the uniaxial compression tests of coal–rock composites at different strain rates were simulated, and the mesoscopic parameters were calibrated according to the actual physical and mechanical properties. To verify the accuracy of the simulation results, the complete stress–strain response curves obtained from the simulation were compared with the laboratory test results. It was found that the numerical simulation results were in high agreement with the test results. In addition, after analyzing the energy curves at different strain rates, the results indicate that increasing the strain rate leads to a corresponding rise in both the total input energy and the plastic energy accumulated during the post-peak stage. At the same time, a higher elastic energy release rate makes the material more susceptible to brittle failure.
(6) A damage mechanics model considering the strain rate was constructed based on the Weibull probability distribution function, and the rationality of the damage mechanics model was compared and verified based on the indoor test curve. The validation results demonstrate that the theoretical predictions closely match the experimental curves, with particularly strong agreement observed in the pre-peak portion of the stress–strain response.
Author Contributions
Writing—original draft preparation, G.W.; supervision, T.Z. and K.Y.; investigation, J.M., W.Z. and Y.Z.; software, P.L. and L.B.; conceptualization, P.G. All authors have read and agreed to the published version of the manuscript.
Funding
This work was supported by the National Natural Science Foundation of China (grant no. 52404094) and the Natural Science Research Project of Shanxi Province (General Category) (202303021211063).
Institutional Review Board Statement
Not applicable.
Informed Consent Statement
Not applicable.
Data Availability Statement
The data can be obtained from the corresponding author according to reasonable requirements. The data are not publicly available due to privacy.
Acknowledgments
The first author thanks the other author for their research contributions and cited references prior to this work.
Conflicts of Interest
The authors declare no conflicts of interest.
References
- Xie, H.P.; Gao, F.; Ju, Y. Research and Exploration on Deep Rock Mass Mechanics. Chin. J. Rock Mech. Eng. 2015, 34, 2161–2178. [Google Scholar] [CrossRef]
- Wang, K.; Zuo, X.H.; Du, F.; Sun, J.Z.; Zhang, J.W.; Li, K.N.; Zhang, X. Energy evolution behavior and progressive damage characteristics of gas-bearing coal-rock combination under different loads. J. Min. Strata Control Eng. 2025, 7, 54–76. [Google Scholar] [CrossRef]
- Zuo, J.P.; Xu, C.Y.; Zhan, S.F.; Ma, Z.Y.; Yu, X.; Sun, Y.J. True triaxial failure behavior and structure-material synergistic failure mechanism of coal-rock combination. J. China Univ. Min. Technol. 2025, 54, 287–303. [Google Scholar] [CrossRef]
- Dai, B.; Zhao, G.F.; Zhang, L.; Zhang, Z.J.; Liu, Y.; Chen, Y. Experimental Study on Energy Dissipation and Damage Evolution of Rock with Parallel Fractures under Different Loading Rates. Chin. J. Rock Mech. Eng. 2024, 43, 3397–3412. [Google Scholar] [CrossRef]
- Zhang, Z.K.; Song, Z.P.; Cheng, Y.; Huo, R.K.; Song, W.X.; Wang, K.S.; Wang, T.; Yang, T.T.; Liu, W. Characteristics of Acoustic emission and fracture response of hard rock under the influence of loading rate. Coal Geol. Explor. 2022, 50, 115–124. [Google Scholar] [CrossRef]
- Luo, K.; Zhao, G.D.; Zeng, J.J.; Zhang, X.X.; Pu, C.Z. Experimental and numerical simulation of fracture failure of rock-like materials with fractures under the influence of loading rate. Chin. J. Rock Mech. Eng. 2018, 37, 1833–1842. [Google Scholar] [CrossRef]
- Li, F.L.; Yang, J.; Liu, W.Q.; Fan, Z.H.; Yang, Y.G. Research on the Variation Effect of Strain Rate of Mudstone under Uniaxial Compression. Rock Soil Mech. 2021, 42, 369–378. [Google Scholar] [CrossRef]
- Zhu, C.Q.; Wang, L.; Liu, H.Q.; Chen, L.P.; Zhang, S. Dynamic compressive mechanical characteristics of soft coal under different strain rates. Coal Sci. Technol. 2025, 53, 244–254. [Google Scholar] [CrossRef]
- Chen, T.; Yao, Q.L.; Wei, F.; Chong, Z.; Zhou, J.; Wang, C.B.; Li, J. Effects of water intrusion and loading rate on mechanical properties of and crack propagation in coal–rock combinations. J. Cent. South Univ. 2017, 24, 423–431. [Google Scholar] [CrossRef] [Scilit]
- Wang, A.W.; Yang, K.L.; Zhu, S.T.; Fan, D.W.; Xin, Z.Z.; Zhang, W.; Liu, X.F.; Liu, H.Q. Study on dynamic characteristics and anti-scour mechanism of prefabricated borehole coal under high strain rate. J. China Coal Soc. 2025, 42, 164–186. [Google Scholar] [CrossRef]
- Zhang, L.Y.; Wu, P.; Li, M.; Zheng, Y.D.; Li, B. Dynamic mechanical properties and micro-fracture characteristics of coal-bearing mudstone under real-time temperature. J. China Coal Soc. 2025, 50, 192–204. [Google Scholar] [CrossRef]
- Verstrynge, E.; Adriaens, R.; Elsen, J.; Van Balen, K. Multi-scale analysis on the influence of moisture on the mechanical behavior of ferruginous sandstone. Constr. Build. Mater. 2014, 54, 78–90. [Google Scholar] [CrossRef] [Scilit]
- Yang, Z.N.; Wu, X.T.; Cui, Y.X.; Zhang, Y.Y.; Duan, H.F.; Ling, X.Z. Study on the Multi-Scale Evolution Mechanism of Shear Bands and Cobweb Effect in Solidified Silt Considering Strain Rate. Appl. Sci. 2025, 15, 10128. [Google Scholar] [CrossRef] [Scilit]
- Cao, A.Y.; Jing, G.C.; Dou, L.M.; Wang, G.F.; Liu, S.; Wang, C.B.; Yao, X.X. Study on Acoustic Emission Characteristics of Rock sample Damage Evolution at different loading rates. J. Min. Saf. Eng. 2015, 32, 923–928+935. [Google Scholar] [CrossRef]
- Tal, Y.; Rubino, V.; Rosakis, A.J.; Lapusta, N. Enhanced digital image correlation analysis of ruptures with enforced traction continuity conditions across interfaces. Appl. Sci. 2019, 9, 1625. [Google Scholar] [CrossRef] [Scilit]
- Zhang, X.P.; Jiang, Y.J.; Wang, G.; Wang, C.J.; Wu, X.Z.; Zhang, Y.Z. Numerical experiments on rate-dependent behaviors of granite based on particle discrete element model. Rock Soil Mech. 2016, 37, 2679–2686. [Google Scholar] [CrossRef]
- Jiang, Y.D.; Li, H.T.; Zhao, Y.X.; Zhou, K. The influence of loading rate on energy accumulation and dissipation. J. China Univ. Min. Technol. (Engl. Ed.) 2014, 43, 369–373. [Google Scholar] [CrossRef]
- Sun, S.R.; Du, X.J.; Feng, G.R.; Liu, W.H.; Wang, J. Research on the Coordinated Failure Characteristics of Rock-Filled Composites under Different Loading Rates. Rock Soil Mech. 2025, 46, 3501–3512. [Google Scholar] [CrossRef]
- Liu, D.W.; Jiang, S.L.; Tang, Y. Mechanical properties of metasandstone under uniaxial graded cyclic loading and unloading. Appl. Sci. 2022, 12, 6310. [Google Scholar] [CrossRef] [Scilit]
- Lei, X.L. Evolution of b-Value and Fractal Dimension of Acoustic Emission Events During Shear Rupture of an Immature Fault in Granite. Appl. Sci. 2019, 9, 2498. [Google Scholar] [CrossRef] [Scilit]
- Deng, H.F.; Wang, C.X.J.; Li, J.L.; Zhang, Y.C.; Wang, W.; Zhang, H.B. Mechanism of influence of loading rate on Tensile strength of sandstone. Rock Soil Mech. 2018, 39, 79–88. [Google Scholar] [CrossRef]
- Zhang, Z.Z.; Gao, F. Experimental investigation on the energy evolution of dry and water-saturated red sandstones. Int. J. Min. Sci. Technol. 2015, 25, 383–388. [Google Scholar] [CrossRef] [Scilit]
- Zhou, Y.X.; Liang, Y.L.; Huang, X.F. Correlation Study of Macroscopic and Mesoscopic Mechanical Strength Parameters in Numerical Simulation of Spherical Particle Flow. Sci. Technol. Eng. 2015, 15, 61–67. [Google Scholar] [CrossRef]
- Vishal, V.; Ranjith, P.G.; Singht, N. An experimental investigation on behaviour of coal under fluid saturation, using acoustic emission. J. Nat. Gas Sci. Eng. 2015, 22, 428–436. [Google Scholar] [CrossRef] [Scilit]
- Chen, P.Y. Study on the loading Rate Effect of Uniaxial compression in Rock Particle Flow Model. Chin. J. Undergr. Space Eng. 2018, 14, 635–642. [Google Scholar] [CrossRef]
- Li, W.J.; Zhai, D.X.; Li, X.P.; Wang, L.J.; Zhu, Y.W.; Luo, Y.; Liu, T.T.; Meng, F. Study on multi-scale statistical damage constitutive model of reef limestone based on digital core. Chin. J. Rock Mech. Eng. 2025, 44, 3386–3402. [Google Scholar] [CrossRef] [Scilit]
- Zhi, B.; Wang, C.; Wang, S.J.; Li, Z.L.; Bai, H. Constitutive Model of statistical damage of high-temperature structural Loess Based on Weibull Distribution. J. Yangtze River Sci. Res. Inst. 2023, 40, 118–125. [Google Scholar] [CrossRef]
- Wang, G.Y.; Sun, H.X.; Wang, S.P.; Zhang, K. Research on Damage Constitutive Model of Water-Stabilized Gravel Base Layer Based on Weibull Distribution. J. Liaoning Tech. Univ. Nat. Sci. Ed. 2024, 43, 692–698. [Google Scholar] [CrossRef]
- Zhang, C.; Yu, J.; Bai, Y.; Cao, W.G.; Zhang, S.; Guo, Z.G. Statistical damage constitutive model of rock brittle elongation transformation based on strength theory. Chin. J. Rock Mech. Eng. 2023, 42, 307–316. [Google Scholar] [CrossRef]

Disclaimer/Publisher’s Note: The statements, opinions and data contained in all publications are solely those of the individual author(s) and contributor(s) and not of MDPI and/or the editor(s). MDPI and/or the editor(s) disclaim responsibility for any injury to people or property resulting from any ideas, methods, instructions or products referred to in the content. |
© 2026 by the authors. Licensee MDPI, Basel, Switzerland. This article is an open access article distributed under the terms and conditions of the Creative Commons Attribution (CC BY) license.