1. Introduction
The environmental impacts of road transport, in particular air pollution and noise, are receiving increasing attention in urban and regional planning. Pollutants emitted by motor vehicles contribute significantly to air pollution, which has a direct effect on human health and environmental quality. For sustainable transport planning, it is essential to obtain an accurate understanding of how different transport systems affect the environment.
Traffic models provide valuable assistance in this respect, as they can not only predict vehicle movements but also supply detailed information on traffic volumes and speed distributions. These data constitute a robust basis for calculating pollutant emissions, since emission levels are directly related to vehicle type, driving characteristics and traffic environment. By applying such models, it is possible to generate emission maps covering entire transport networks with both spatial and temporal resolution, which are indispensable for effective regulation, targeted interventions and health-conscious urban planning.
The primary objective of this study is to develop and implement a novel, COPERT-based emission calculation module within the PTV-VISUM environment that goes beyond the capabilities of existing built-in tools. Based on this objective, the current emission calculation procedure available in PTV-VISUM was revised and replaced by a more detailed and scientifically grounded methodology. To the authors’ knowledge, such a flexible and modular COPERT-based implementation has not previously been realised within Visum, despite the growing need for integrated traffic emission modelling solutions.
Among macroscopic emission modelling approaches, the COPERT methodology was selected because it provides sufficiently accurate emission estimates using readily available traffic model outputs, while remaining less traffic-situation-specific than approaches such as HBEFA [
1]. This makes COPERT particularly suitable for integration with PTV-VISUM, where link-level average speeds and flows constitute the primary input data. In contrast, traffic-situation-based models such as HBEFA require a higher level of behavioural and operational detail, which is typically not available in large-scale macroscopic traffic models.
The developed module explicitly incorporates multiple emission components, including hot- and cold-start exhaust emissions, evaporative emissions and non-exhaust particulate matter emissions, which are implemented as independent yet interacting submodules. To ensure compatibility with macroscopic modelling, selected COPERT equations were simplified and adapted to operate efficiently at link and zone levels, enabling, among others, zone-level NMVOC estimation. The modular and open architecture allows future extensions and calibration using measured emission data.
The results were validated using pollutant-specific emissions per vehicle kilometre for each vehicle category, taking into account the actual fleet composition represented in the traffic model. The validation confirms that macroscopic traffic model outputs provide sufficient information for reliable emission estimation when combined with an appropriately adapted COPERT methodology. Furthermore, this study demonstrates the timeliness of the topic, as similar developments are expected in future Visum releases, although with more limited flexibility compared to the open architecture presented here. Overall, the proposed approach supports an integrated, transparent and future-proof framework for transport planning and environmental decision-making.
2. Literature Review
The modelling of road traffic emissions has become one of the most intensively developing areas of transport research in recent decades, as road transport is a primary source of urban air pollution in many cities. Research approaches can generally be divided into different scales and methodologies: macroscopic models estimate emissions on the basis of average speed and fleet composition, while microscopic approaches consider detailed vehicle speed and acceleration trajectories.
Several studies have employed macroscopic models, which are particularly suitable for analysing emissions at larger spatial scales. Toșa and colleagues presented a methodology integrating COPERT III with the CUBE VOYAGER transport modelling software to estimate pollutant emissions in suburban areas of Romania, demonstrating how traffic simulation outputs can be combined with emission calculations [
2]. A similar direction was taken by Csikós and Tettamanti [
3], who applied the concept of the Network Fundamental Diagram to formalise emission estimates in urban networks and examined how traffic control strategies can contribute to emission reduction. In Barcelona, Rodriguez-Rey and co-authors [
4] coupled the BCN-VML macroscopic transport model with the HERMESv3 emission system. Their results showed that while macroscopic approaches are applicable at the city scale, discrepancies compared to microscopic models become significant, especially under congested conditions.
Microscopic approaches, in contrast, focus on the detailed behaviour of individual vehicles. De Nunzio and colleagues developed a framework that generates microscopic speed trajectories from macroscopic road network data using machine learning and couples these trajectories with a physics-based emission model. Their results demonstrated that the method substantially reduced estimation errors compared to conventional macroscopic models such as COPERT, particularly for
and
[
5]. Other microscopic models, such as PHEM or its simplified version PHEMLight, are commonly integrated with traffic microsimulators (e.g., Aimsun and PTV-VISSIM) to calculate instantaneous emissions based on vehicle-specific performance and speed profiles.
In recent years, data-driven and big data approaches have also emerged, relying on real-time traffic data to map emissions with high spatial and temporal resolution. Wang and colleagues presented a case study from Hangzhou, China, where the “City Brain” high-performance computing platform was used to build a real-time emission monitoring and visualisation system. By combining vehicle-specific information from video surveillance and radar measurements, the system produced emission maps at a 10–1000 m spatial resolution and hourly temporal resolution, enabling the identification of emission hotspots and the evaluation of traffic management policies [
6].
These directions are reinforced by review papers that synthesise current knowledge. Mądziel [
7] provides a comprehensive overview of emission models and traffic simulators, emphasising the critical role of calibration in achieving reliable results. In addition to these established approaches, recent studies have placed growing emphasis on the importance of harmonised measurement techniques to support and validate emission models, highlighting that consistent empirical data significantly strengthens model-based estimates such as those generated by COPERT [
8].
Similarly, new predictive modelling research shows that machine learning-based traffic and emission forecasting can complement COPERT calculations in data-limited environments, reinforcing the need for flexible and adaptable modelling frameworks [
9]. Applications of COPERT in large metropolitan contexts, such as Bogotá, demonstrate that coupling detailed fleet data with transport models yields accurate bottom-up emission inventories, particularly for identifying dominant pollutants and critical vehicle categories, supporting our approach of integrating COPERT within Visum [
10].
Macroscopic Fundamental Diagram (MFD) research further confirms that aggregated speed profiles can be successfully combined with COPERT factors to estimate network-level emissions, emphasising the importance of careful calibration regarding distance and speed distributions [
11].
European-scale studies analysing the shift to Euro 6d-TEMP/6d standards also underline the broader relevance of updating emission factor databases, demonstrating how COPERT-based fleet transitions lead to measurable
and
reductions across major cities, highlighting the value of maintaining up-to-date factors within integrated modelling tools [
12].
The role of non-exhaust particulate matter emissions is also highlighted in broader review-oriented studies addressing road traffic emissions. Comprehensive overviews of energy- and transport-related emissions underline that, despite continuous reductions in exhaust PM due to stricter emission standards, PM emissions associated with traffic activity remain substantial, largely because of mechanical processes such as tyre, brake and road surface wear. These studies stress that PM emissions increasingly decouple from exhaust-related technological improvements and therefore require explicit consideration in emission inventories and modelling frameworks, even when exhaust emissions are substantially reduced [
13].
In addition, urban-scale emission studies focusing on integrated air quality assessments identify evaporative emissions as an important contributor to hydrocarbon and VOC levels, particularly under warm climatic conditions. These works show that evaporative emissions introduce a strong temperature-dependent component into traffic-related emission patterns and may significantly influence spatial and temporal emission distributions in cities. Although evaporation is not always the central focus of such studies, its contribution is explicitly acknowledged as a necessary element of realistic traffic emission modelling and subsequent air quality analyses [
14].
The recent literature increasingly emphasises the importance of evaporative emissions in road traffic emission modelling, particularly for hydrocarbons (HCs) and volatile organic compounds (VOCs). Evaporation, mainly occurring during parking and as a result of diurnal temperature variations, can account for a substantial share of total traffic-related HC emissions, especially under warm conditions, and is therefore insufficiently represented in exhaust-only approaches [
15]. City-scale studies further show that temperature-dependent evaporation introduces significant spatial and temporal variability in VOC emissions, underlining the need for emission models, such as COPERT, that explicitly account for meteorological effects [
16].
Similarly, particulate matter (PM) emissions from road transport are increasingly dominated by non-exhaust sources, including brake, tyre and road wear. While exhaust PM has been substantially reduced due to stricter emission standards, non-exhaust PM remains largely unregulated and may constitute the majority of
and a significant fraction of
emissions, particularly in urban traffic conditions [
15]. Empirical and modelling studies indicate that these emissions are strongly influenced by driving behaviour and vehicle mass, suggesting that PM reductions may remain limited even under future fleet electrification scenarios [
16].
Overall, the literature confirms that realistic road traffic emission assessments require the combined consideration of exhaust, evaporative and non-exhaust PM sources, supporting the use of integrated COPERT-based modelling frameworks for comprehensive emission estimation.
The international literature therefore confirms that integrating the COPERT methodology into traffic modelling frameworks is in line with current trends. Macroscopic approaches are useful for analysing emissions at the regional or city scale but are less sensitive to the influence of driving dynamics, whereas microscopic and data-driven approaches offer more precise results at the cost of much higher data and computational demands. In this context, a COPERT-based module integrated into the Visum environment provides a balance between detail and practical applicability, and through the possibility of local calibration it fulfils one of the key requirements repeatedly emphasised in international research on reliable traffic emission estimation.
3. Emission Calculation Methods for Transport Modelling
The following section presents the currently applied HBEFA emission calculation module, outlines the essence of the COPERT methodology and compares the two approaches.
3.1. The HBEFA Methodology
One of the additional modules in the PTV-VISUM traffic modelling software is the so-called Environment extension, which allows the estimation of environmental impacts of road transport, such as noise and air pollution. For air pollution, the software applies the HBEFA (Handbook Emission Factors for Road Transport) methodology, which is primarily used in a European context. Emission calculations are based on version 4.1 of HBEFA, released in October 2019 [
17]. However, this version still relies on vehicle fleet data that predominantly reflect vehicle compositions from before the 2000s and therefore cannot represent the current technological and regulatory state of road transport with sufficient accuracy. Although an update of the internal HBEFA database is planned for the next release of the PTV Visum Environment module, such improvements only provide a temporary solution, as similar discrepancies will inevitably reappear within a few years due to the continuous evolution of vehicle technologies and fleet characteristics. To address this limitation, the newly developed emission module was designed to remain fully transparent, calibratable and easily updatable, rather than being a closed built-in component whose internal data cannot be accessed or modified.
3.2. The COPERT Methodology
COPERT (Computer Programme to Calculate Emissions from Road Transport) is an emission calculation tool developed by the European Environment Agency, widely used in Europe for estimating road transport emissions. The method relies on vehicle-specific emission factors that account for vehicle type, size, engine and fuel type and operating conditions, such as average speed, road characteristics and ambient temperature.
A key advantage of COPERT is that it not only calculates hot emissions but also includes cold-start excess emissions, evaporative losses and non-exhaust particle emissions from brake wear, tyre wear and road surface abrasion. This enables the method to provide a much more comprehensive picture of road transport emissions compared to earlier and simpler tools.
3.3. Comparison
Several internationally recognised methods exist for estimating road transport emissions, among which the most frequently applied are HBEFA and COPERT. Both approaches are of European origin, yet they differ substantially in philosophy, operation and applicability.
3.3.1. Level of Detail and Vehicle Categories
HBEFA is based primarily on traffic situations that reflect real driving conditions, distinguishing between specific contexts such as urban congestion, urban free flow or motorway high-speed travel. It assigns emission factors to these conditions, derived from real measurements. Although detailed in terms of vehicle and fuel types, its calibration is focused on European fleets. COPERT, by contrast, is a descriptive model, estimating emissions on the basis of vehicle characteristics and average speed. It incorporates a wider range of vehicle parameters, such as engine size, manufacturing year and powertrain type, and provides detailed treatment of modern technologies, including hybrid, CNG/LNG and electric vehicles.
3.3.2. Emission Types and Computational Complexity
HBEFA focuses mainly on exhaust emissions, in particular , , CO, PM and VOC. Cold-start emissions and non-exhaust sources are treated optionally and in less detail. COPERT in every case accounts for hot emissions, cold-start excess, evaporative losses and non-exhaust PM emissions. Consequently, COPERT offers a more detailed and robust modelling of the full spectrum of transport-related emissions.
3.3.3. Applicability and Integration
HBEFA was originally developed in Germany and Switzerland and is most often applied in static calculations or traffic models tailored to European cities. It is already embedded in Visum but offers limited customisation. COPERT operates as a stand-alone programme but can be readily integrated into modelling systems such as Visum, Cube or EMME, typically through external scripts. Since it uses open emission factor tables, it is flexible and automatable and can easily be aligned with local data.
3.3.4. Regional Applicability
HBEFA emission factors are based on Western European fleets. For Asian, Middle Eastern or African contexts, where fleet composition differs, suitable calibration data are often lacking, which may reduce accuracy. COPERT, due to its flexibility, can be better adapted to different regions if local fleet profiles are available.
3.3.5. Summary
Table 1 summarises the main differences.
HBEFA is well suited for European applications within existing PTV-VISUM integration, particularly when detailed fleet data are not available. COPERT, however, offers a broader emission coverage and is advantageous for analysing complex sources and for applications where local fleet-specific calibration is possible.
4. Integration into PTV-VISUM
4.1. Applicability
The current environmental extension of PTV-VISUM allows emission estimation exclusively through the HBEFA methodology. Although the built-in module enables routine use, its emission databases need updating and its computational logic requires further development. According to PTV’s development plan, a new emission module will be introduced in the future based on COPERT. This direction confirms the relevance of an independent, customisable COPERT module.
Nevertheless, the forthcoming built-in module will remain embedded within the Visum structure and will likely provide only limited configuration options. Such limitations are particularly evident where local fleet composition, climatic conditions or traffic phenomena must be considered.
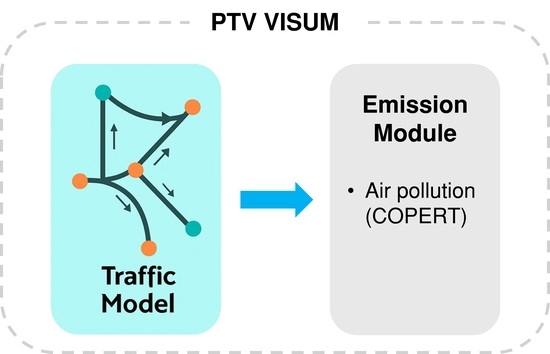
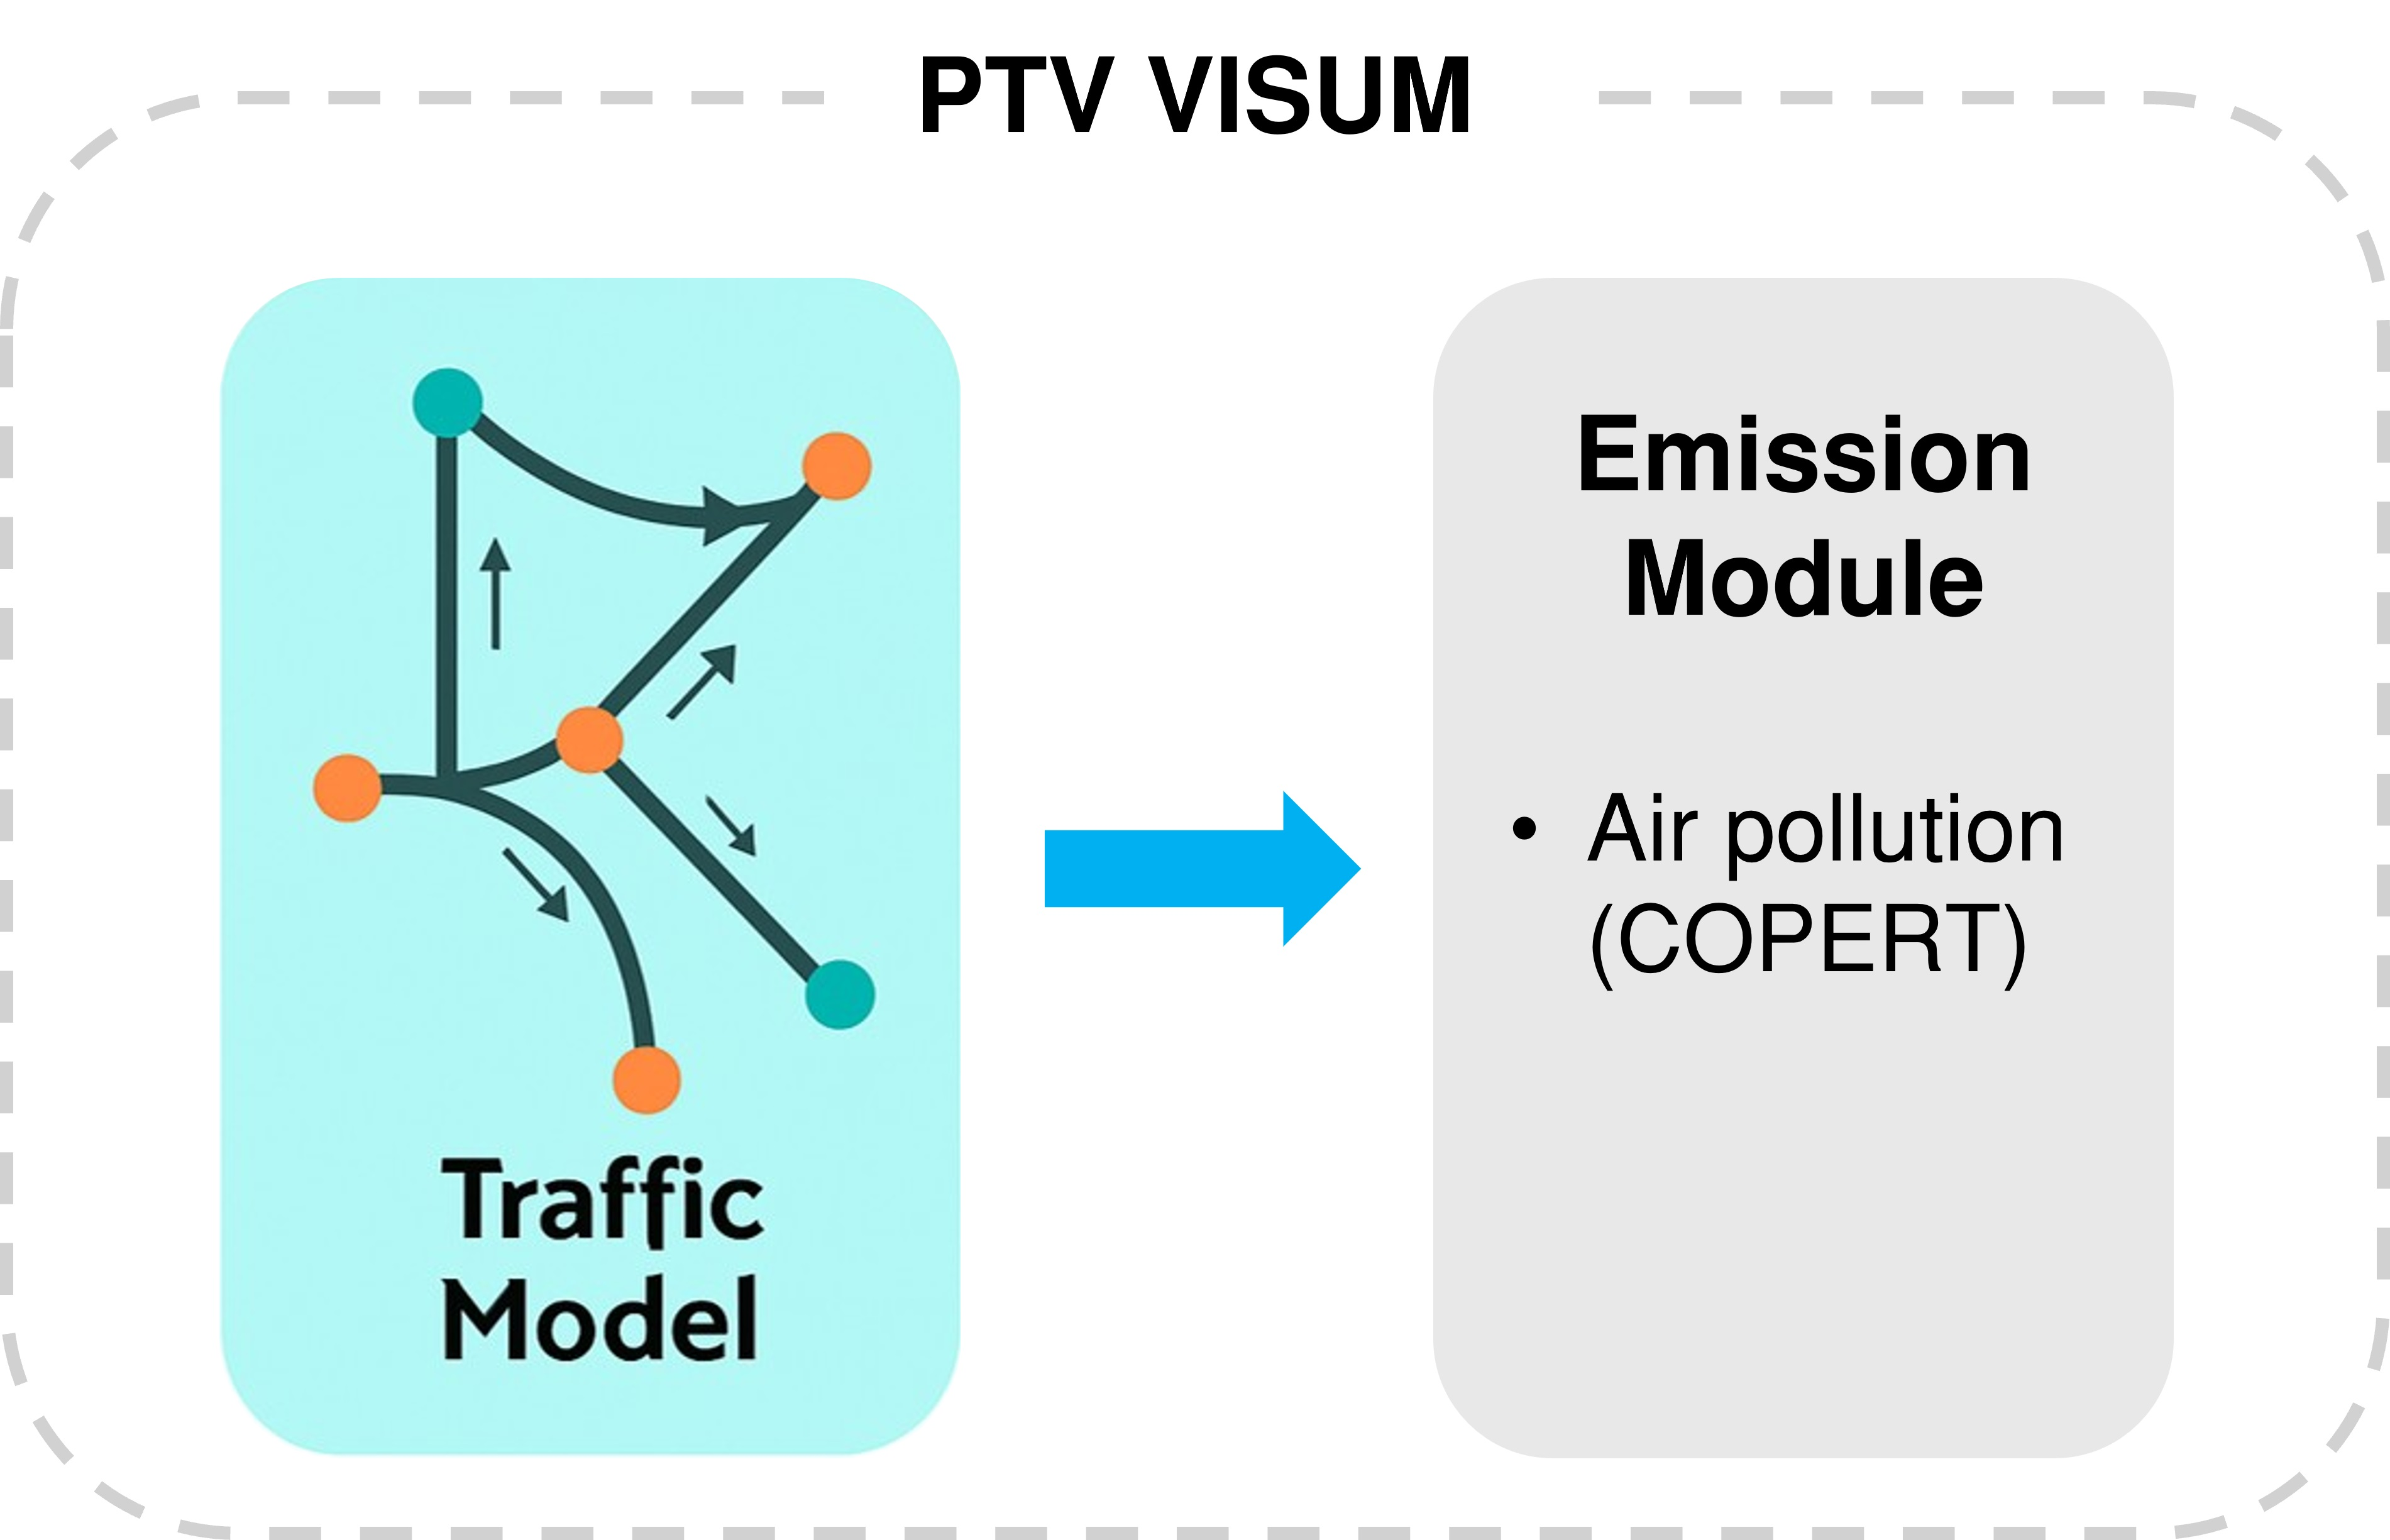
In response to these challenges, an external environmental calculation module has been developed, also based on COPERT, but with full flexibility in handling input parameters and attributes. The module enables emission calculation directly adapted to the traffic model, taking into account its specific structure, vehicle categories, speed distributions and other modelling features.
A key design objective was to provide further fine-tuning possibilities by means of built-in calibration parameters. In this way, the model can be adjusted to locally measured data, allowing urban-, regional- or national-level applications. Thanks to its flexibility, the module can also follow technological development and changing environmental regulations.
4.2. Implementation of the Emission Module
The input parameters required for the applied emission formulas were obtained from the COPERT guideline. For each Euro standard and pollutant type, the corresponding coefficients and components are available and used as variables in the equations. Based on these values, pollutant emissions are typically computed through multifactor functions that depend on traffic volume, average speed and the vehicle fleet composition, which are taken from the used traffic flow model, so neither traffic flow nor vehicle fleet are taken from other data sources like HBEFA.
In most cases, the formulas do not directly yield grams-per-kilometre values for each vehicle category; instead, the exact emission levels are derived as a function of speed. Consequently, the developed calculation module was tested to validate the outputs by comparing the specific emission values against the regulatory limits defined by the relevant Euro standards for each vehicle class.
Components of Air Pollutant Emissions from Road Transport
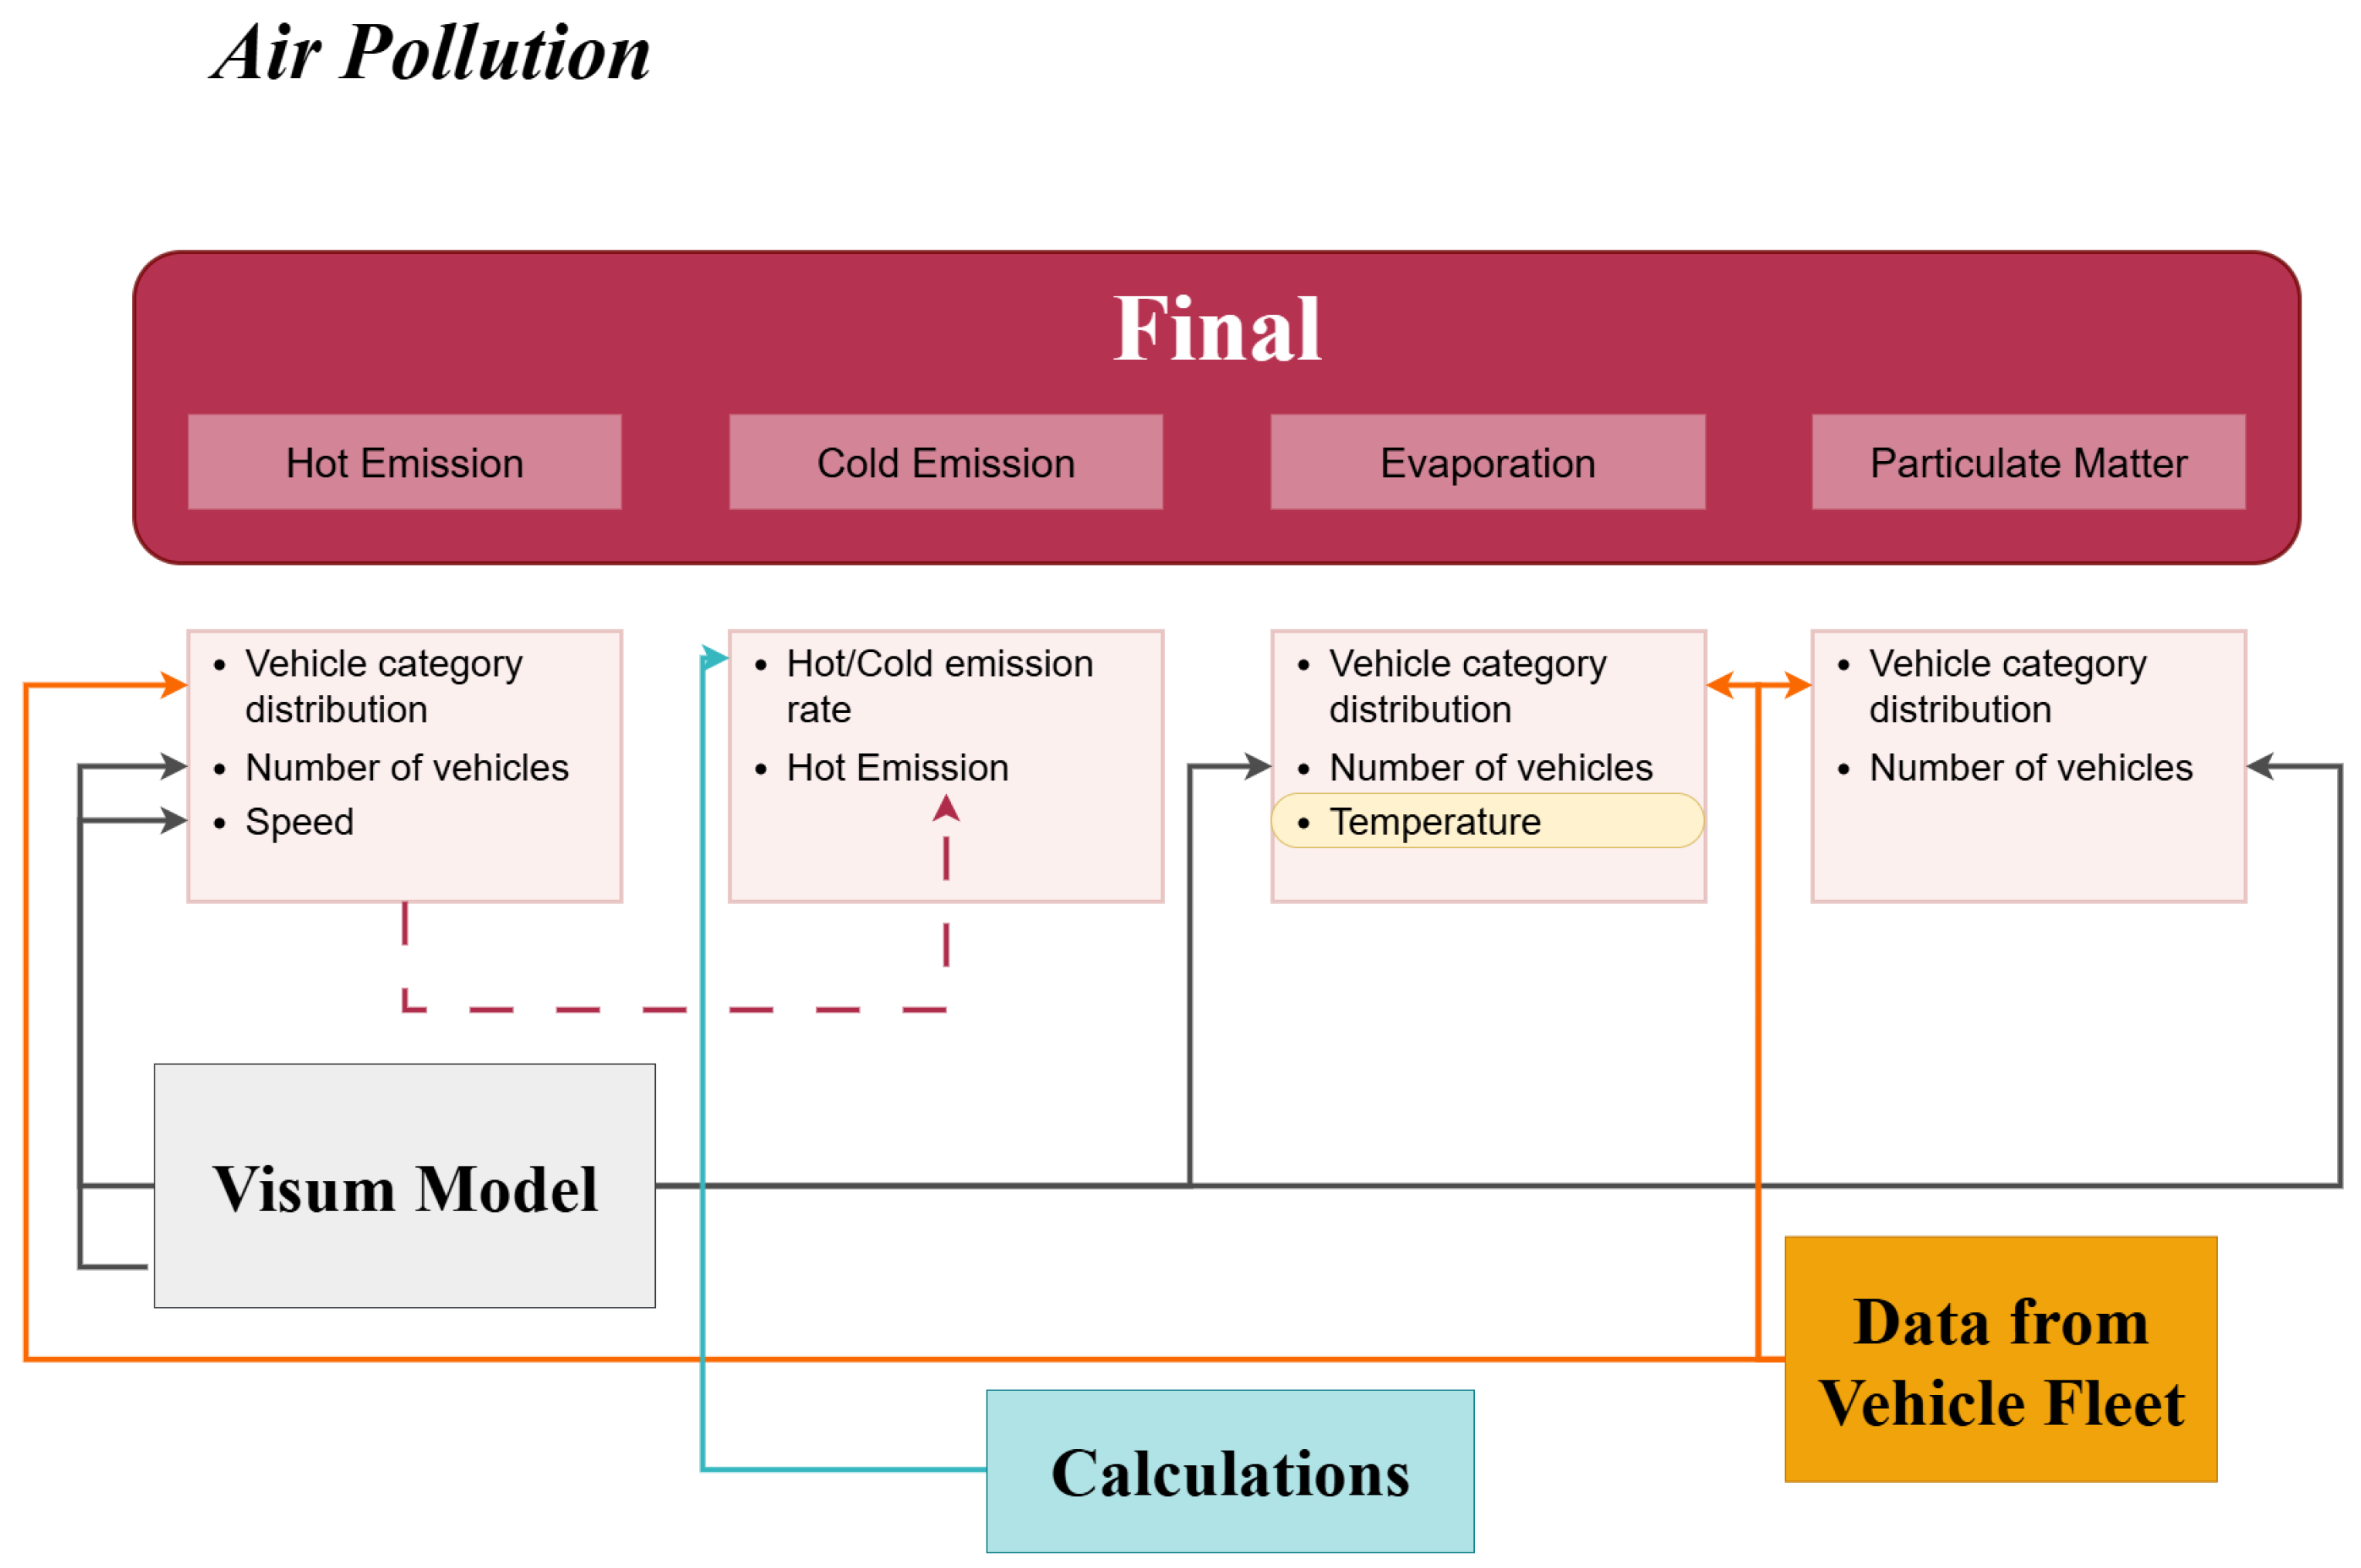
The central element of the developed emission module is the structured and separate treatment of the four main components of air pollutant emissions.
Figure 1 illustrates the logical framework of this system, showing the sources of the input data and how they are linked throughout the calculation process.
In line with approaches widely recognised in the literature, the emission calculation model divides total emissions into four distinct categories: (1) hot emissions, (2) cold-start excess emissions, (3) evaporative losses (VOC) and (4) non-exhaust particle emissions (PM), such as those generated by brake wear, tyre wear and road surface abrasion. Each component has been implemented as an independent submodule, which allows for their separate management, calibration and calculation.
In the figure it can be observed where data is required from the Visum model and where it is required from other data sources, such as vehicle fleet source or given values from users (e.g., temperature). It can be seen that the cold emission part is strongly connected with the hot emission calculations. It will be clarified in the equations what components are used from hot emission.
4.3. Applied Formulas
The computational methodology of the developed module was designed on the basis of the formulas and logical structure proposed by the COPERT program. However, for practical applicability, certain modifications or simplifications were required. This was necessary because not all input parameters are automatically or fully available during traffic modelling, especially in transport models used in daily practice.
Therefore, during the integration of formulas and procedures, a key principle was that emission calculations should rely on realistically available model data, such as section-level speed, vehicle category distribution, road gradient or traffic volume, while preserving the theoretical consistency of the COPERT methodology. In this way, the system remains suitable for scientifically sound estimations without becoming impractical due to excessive data requirements.
This balanced approach allows the module to be flexibly adapted to traffic models of different levels of detail, while retaining the essential elements of the COPERT framework, so the
hot emission can be calculated based on the following:
where N: Number of vehicles—from PTV-VISUM;
: Share of vehicle category k; l: Length [km]—from PTV-VISUM;
: Hot exhaust emissions of the pollutant i, produced in the period concerned by vehicles of technology k driven on network element [g]; and
: Calculated cold rate based on the trips on the network element—from PTV-VISUM.
The hot exhaust emissions of the pollutant i denoted by
can be calculated based on the following:
where a, b, c, d, e, f and g: Parameters of the speed dependency; v: Speed of vehicles [km/h]—from PTV-VISUM; and
: Reduction factor [%].
Similarly to these, the emissions of
cold start can be calculated with the help of the following equation:
where
: Cold-start emissions of pollutant i (for the reference year), produced by vehicle technology k; N: Number of vehicles—from PTV-VISUM;
: Share of vehicle category “k”; l: Length [km]—from PTV-VISUM;
: Hot exhaust emissions of the pollutant i, produced in the period concerned by vehicles of technology k driven on network element [g];
: Calculated cold rate based on the trips on the network element—from PTV-VISUM; and
: Cold/hot emission quotient for pollutant i and vehicles of k technology.
Calculation of the
cold/hot emission quotient for pollutant i and vehicles of k technology can be calculated based on the following:
where A, B and C: Parameters of the speed and temperature dependency; v: Speed of vehicles [km/h]—from PTV-VISUM; and temp: Temperature at that location [°C]—from PTV-VISUM.
Calculation of
evaporation is based on the following:
where
: NMVOC emissions [g] for vehicle type k;
: Number of vehicles—from PTV-VISUM;
: Emission factor [g/vehicle] for type k; and
: Fuel share (fraction of petrol vehicles) for type k.
The result of the evaporation is calculated for zones, and the emission is Non-Methane Volatile Organic Compounds (NMVOCs). The calculation of particulate matter has three parts:
Tyre PM: PM emission from tyre;
Brake PM: PM emission from brake;
Surface PM: PM emission caused by the dust on the surface.
These part can be calculated one by one as follows. The calculation of the tyre part (
tyre PM) can be calculated based on the following:
where
: Base emission rates for tyre, brake and road surface wear [g/vehicle/km];
: Correction multipliers for tyre and brake emissions based on speed; N: Number of vehicles—from PTV-VISUM;
: Share of vehicle category “k”; l: Length [km]—from PTV-VISUM; and
: Proportion of TSP that is
or
for each source (tyre, brake and surface).
The calculation of the brake part (
brake PM) follows the same formula:
The variables are the same for brake PM calculation as for tyre PM calculation. The third part of the particulate matter’s calculation, the surface part (
surface PM), also follows the same formula:
In this case, the equation also uses the same input variables as before, except that it does not include a speed correction factor, since emissions from road surface wear are not directly dependent on vehicle speed.
Based on these parts
particulate matter can be calculated as follows:
5. Results
5.1. Validation
During the validation process, emission estimates were evaluated for all network links represented in the traffic model. The analysis considered the complete set of modelled link-level emissions, ensuring that no road segments were excluded from the assessment. This comprehensive approach allowed the validation to reflect the aggregated emission behaviour of the entire network, rather than focusing on selected locations only, thereby supporting the robustness and representativeness of the validation results.
As mentioned earlier, following the implementation of the emission calculation module, its output values required internal validation within the model framework. Although such validation could, in principle, be performed using real-world air quality measurements, this approach was not applied in the present study. The reason is that background pollution levels would significantly distort the results, making it impossible to isolate the emissions directly attributable to road traffic and, consequently, to provide reliable evidence of the module’s performance.
Therefore, the validation was carried out using specific emission values (g/km). After running the traffic model, all necessary parameters (including traffic volumes, average speeds and the composition of the vehicle fleet) were available. Using these data, the specific emission rates for each pollutant and vehicle category were calculated per kilometre travelled.
Table 2 presents these calculated values.
The obtained results show that all emission values fall within realistic ranges. When compared with the European Union regulatory limits (Euro standards) that each vehicle class must comply with, the results demonstrated good agreement. Based on this comparison, the operation and reliability of the developed emission module were confirmed.
On the input side, the model relies on standardised parameter values consistent with the COPERT methodology, while on the output side it produces realistic emission estimates that reflect the traffic conditions represented in the model. The resulting emissions were compared against calculations obtained using the COPERT Excel tool, and the consistency between the two confirms that the implementation preserves the theoretical basis of COPERT while translating standard inputs into realistic, network-level emission outputs.
5.2. Representation of the Results
The developed emission module was applied to a test network. Results showed that in sections where traffic intensity decreased, emission levels also fell significantly. This confirms the sensitivity of the model and its ability to reflect real traffic conditions. The magnitude of calculated pollutants can be assessed locally and also in relative terms across the network.
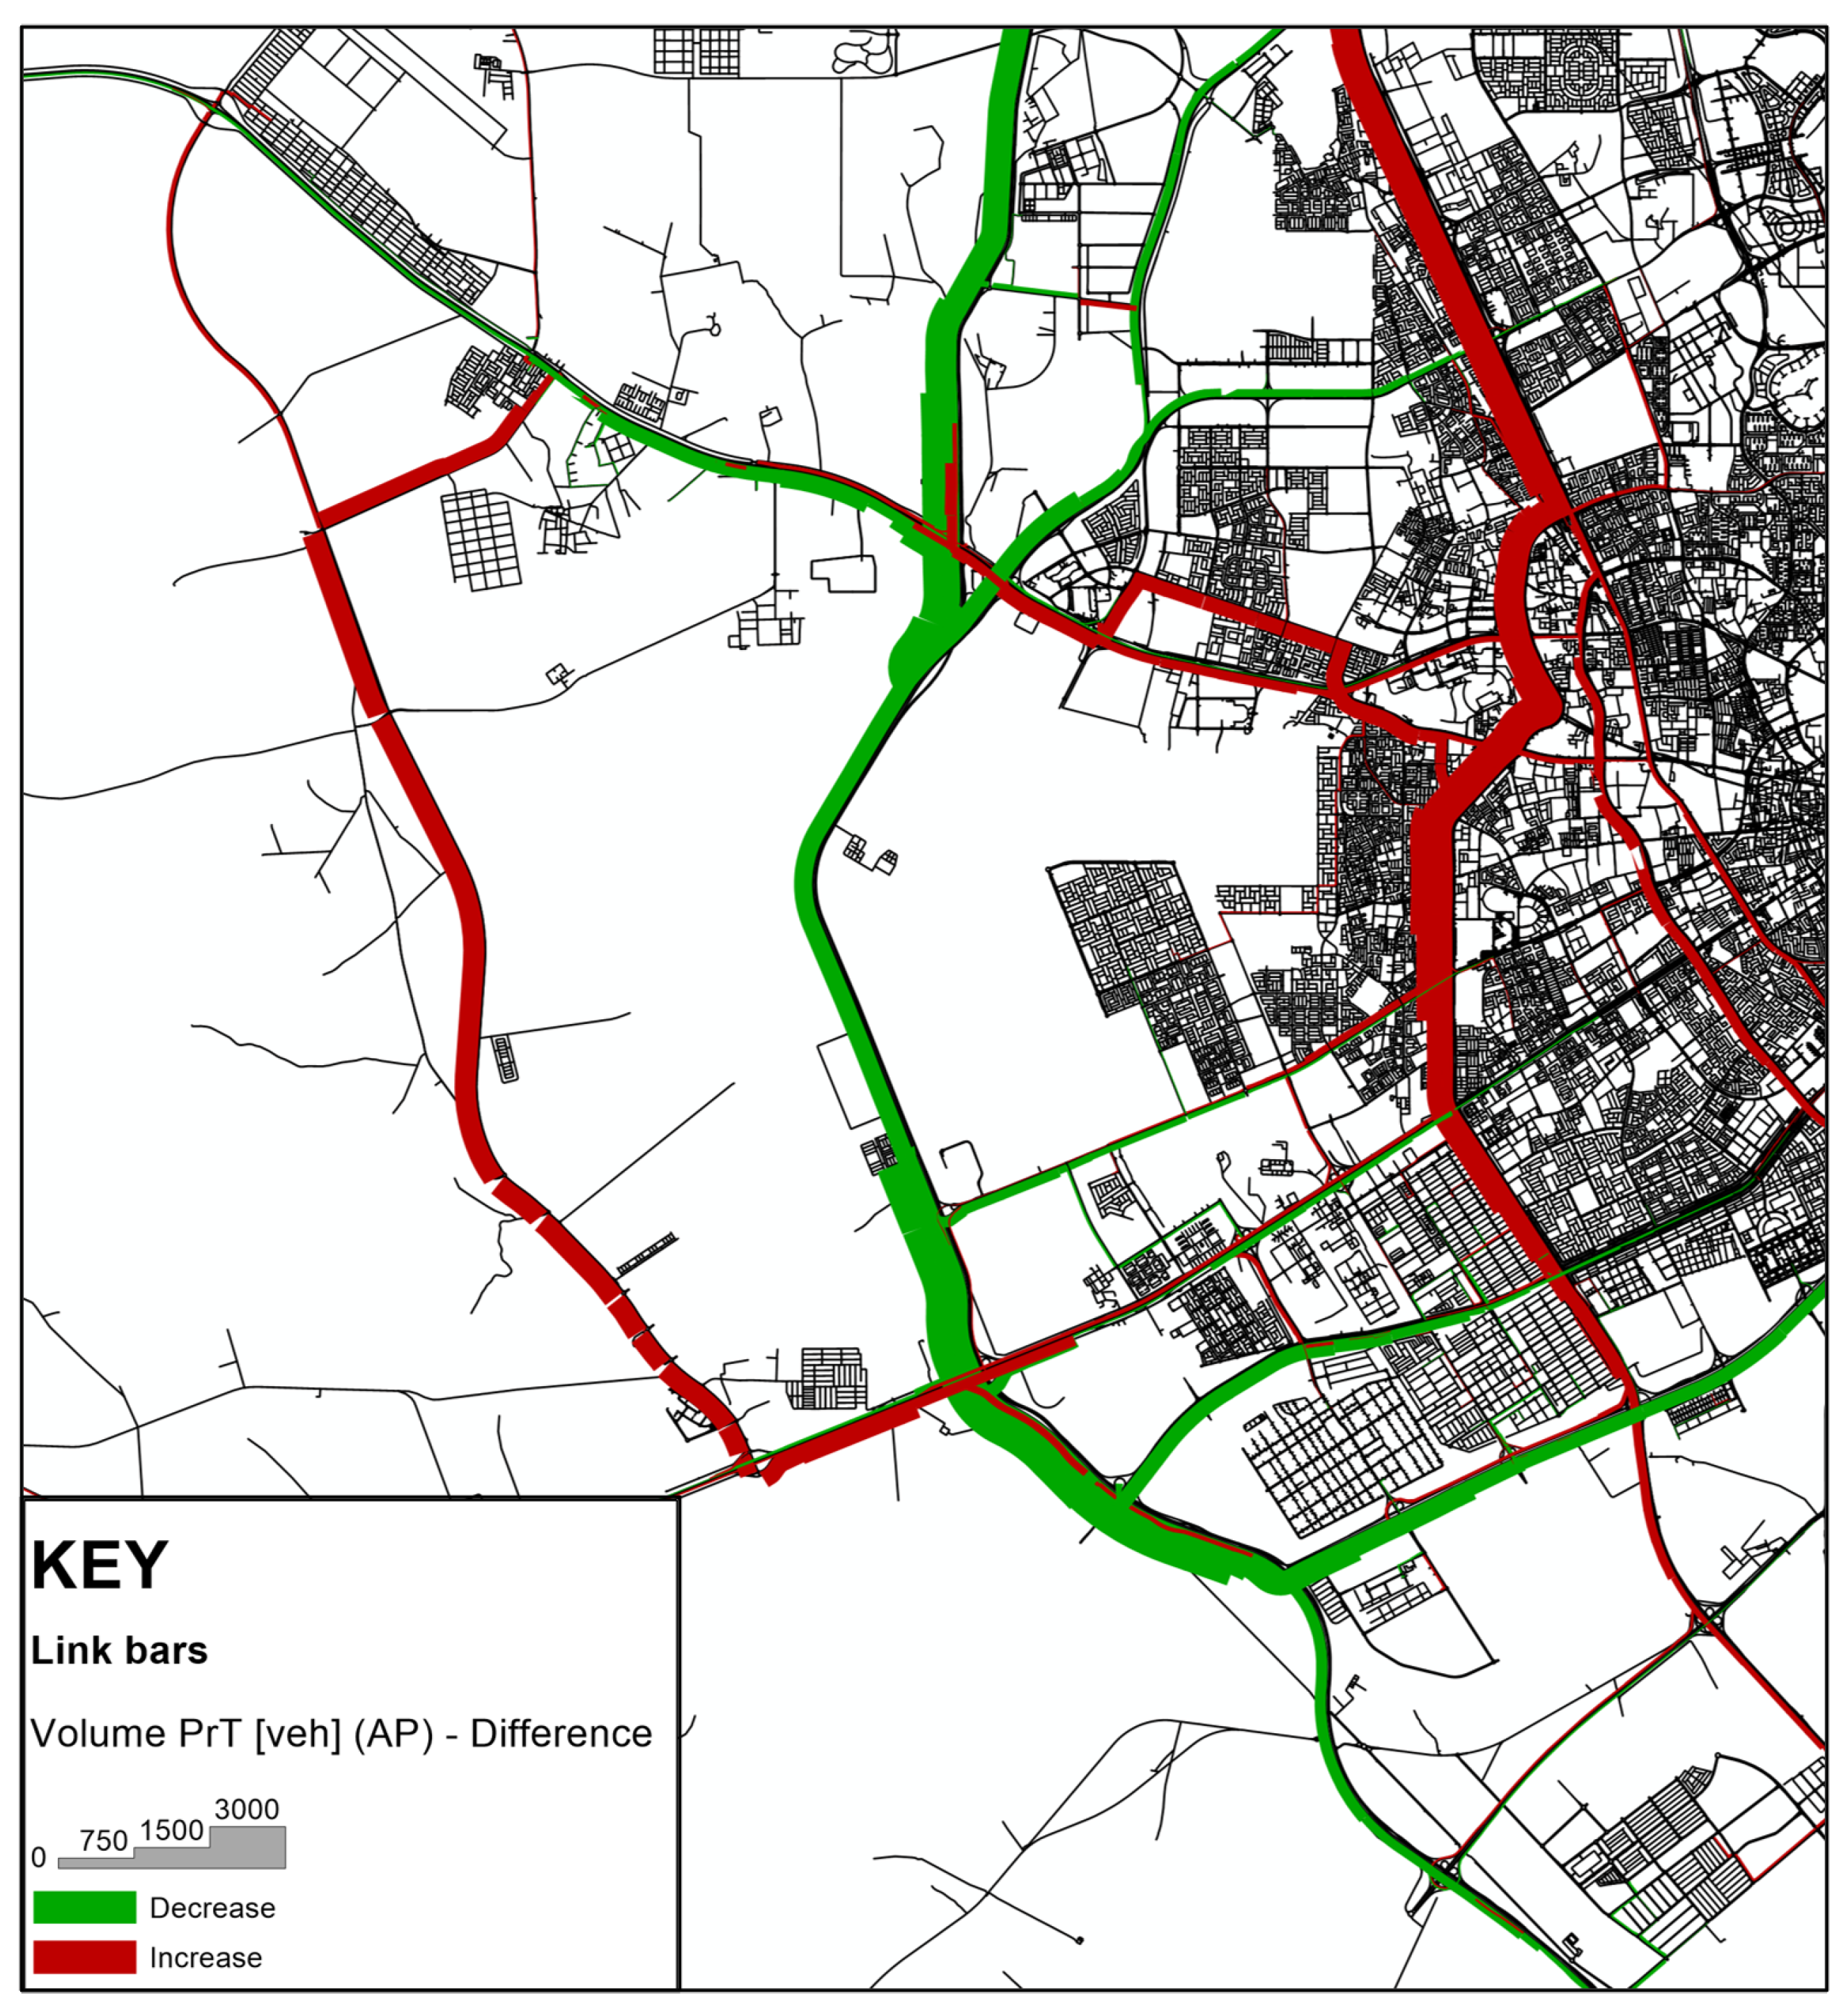
Figure 2 shows changes in traffic volume on the test network, where an increase in volume is marked by red and decrease by green.
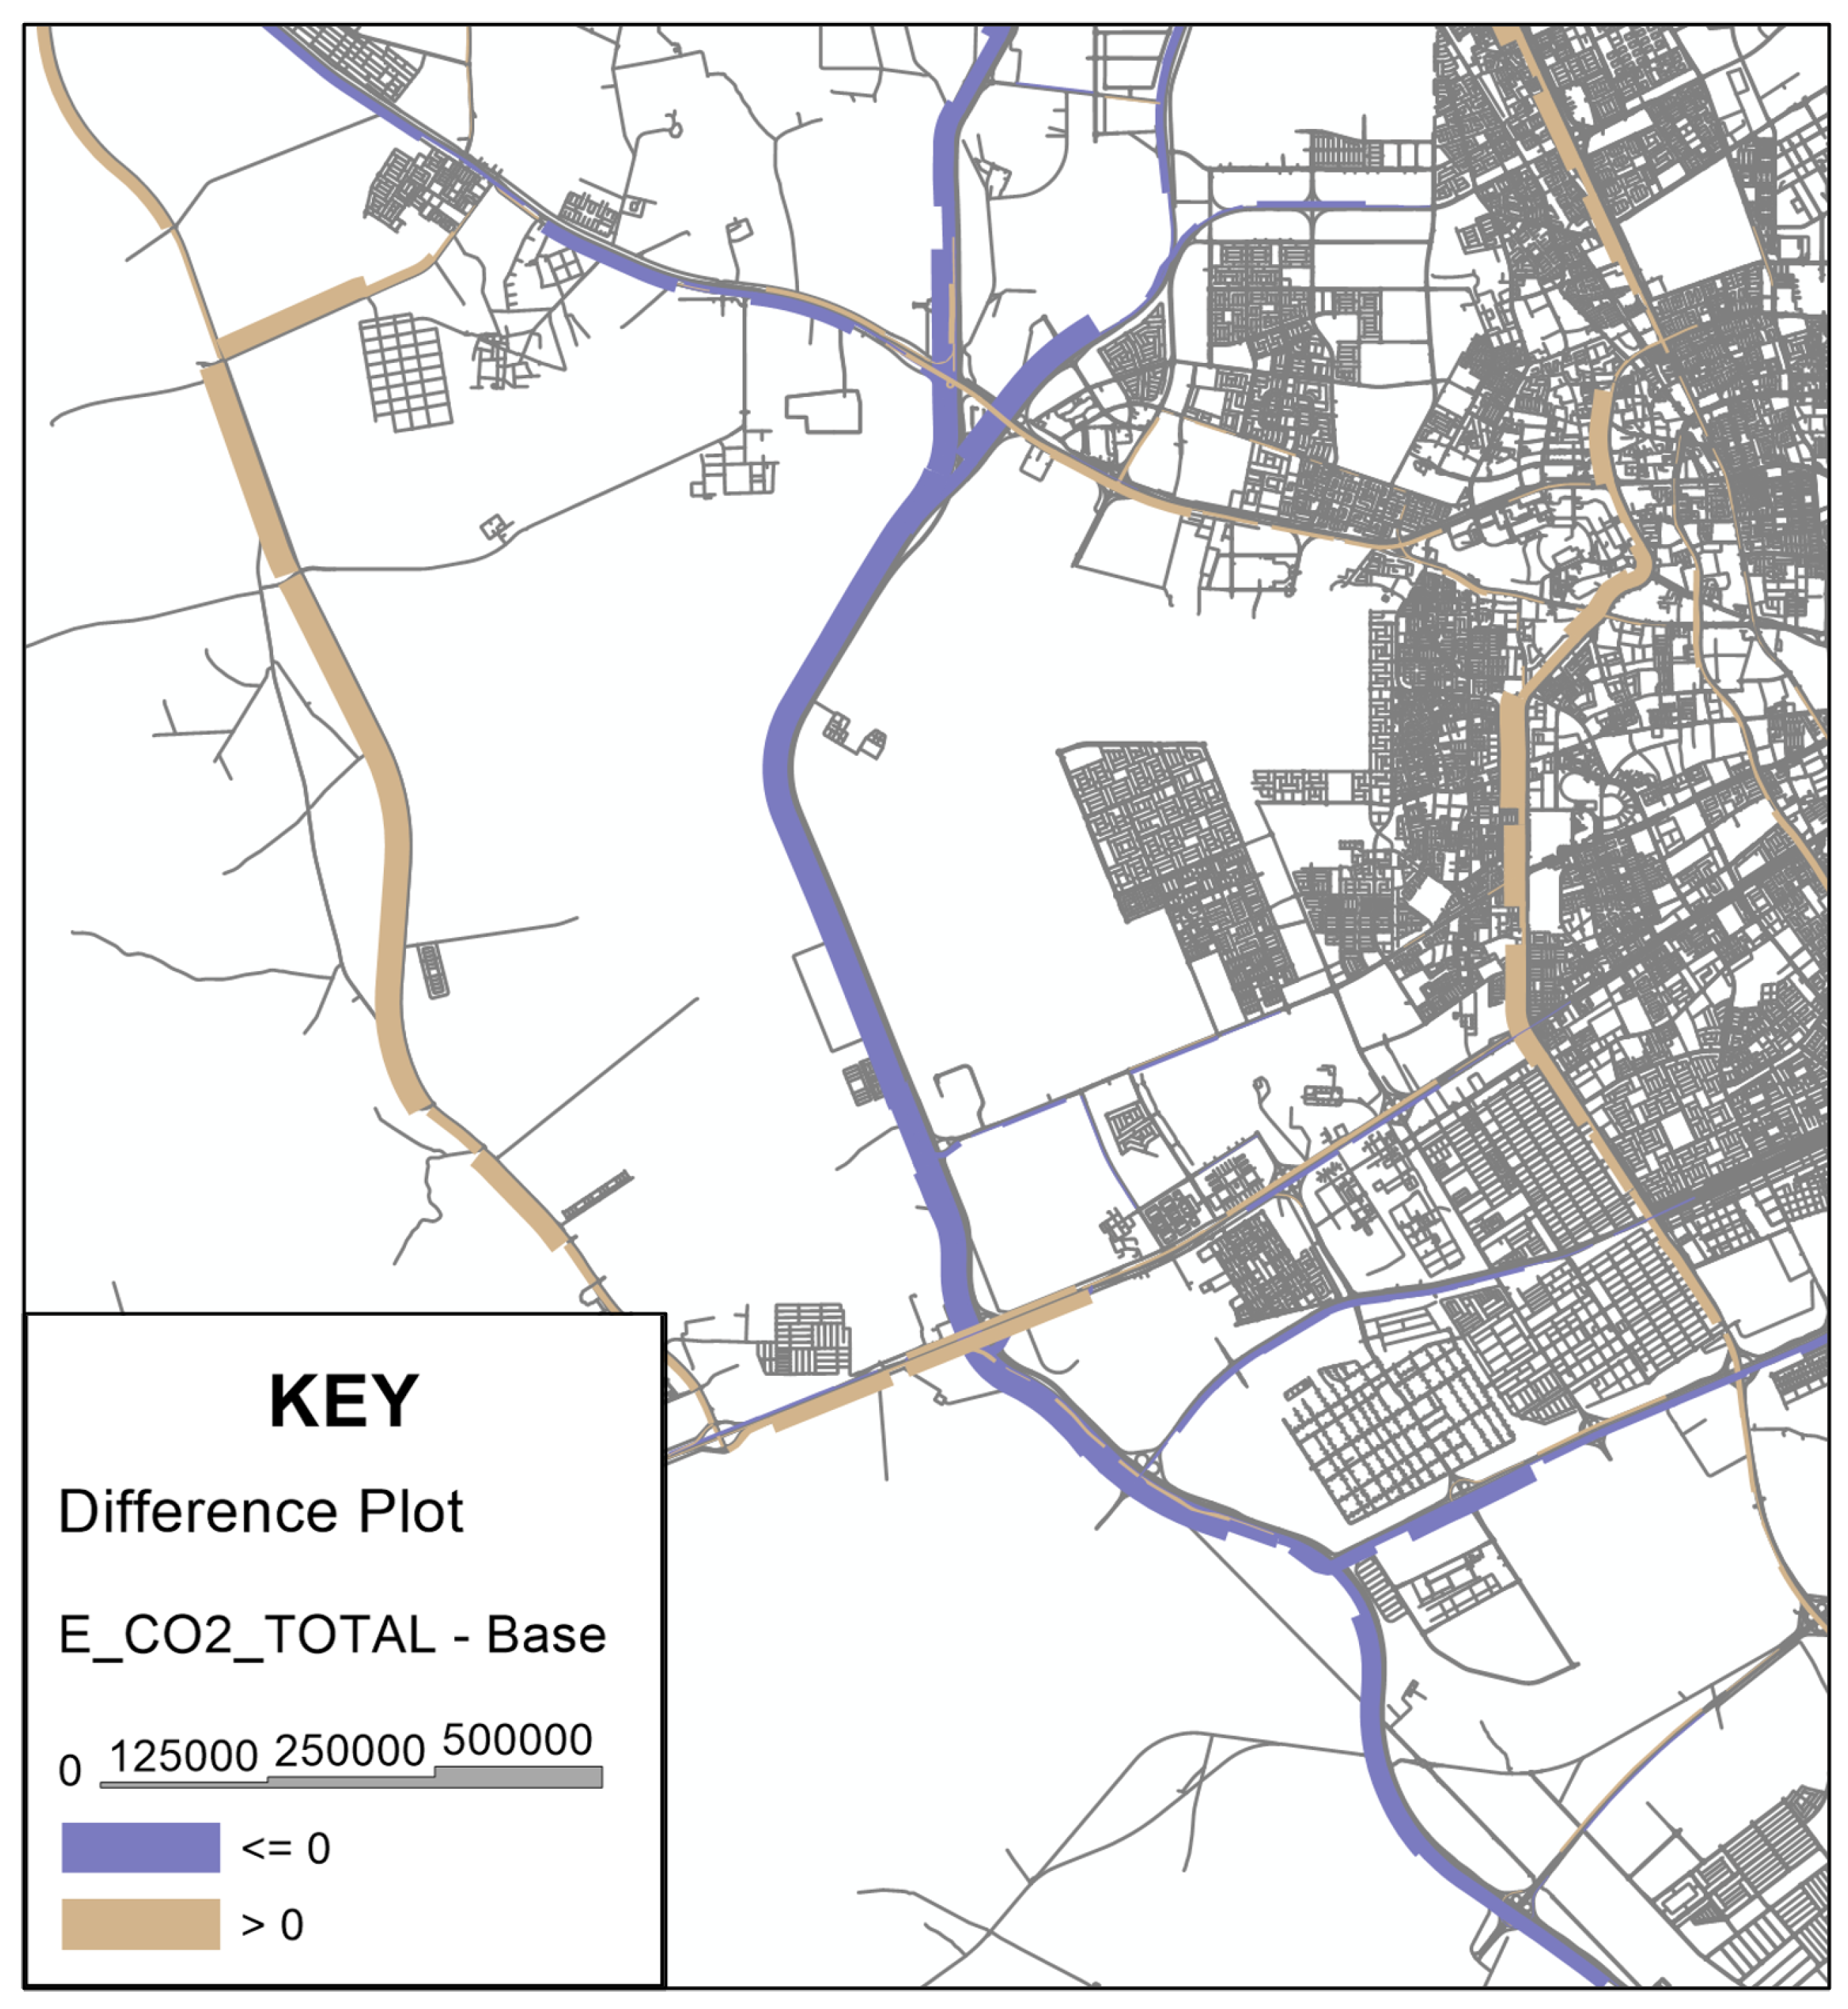
As result of the changes in the traffic volume, emissions will also change; these changes are also indicated by the emission model, as shown in
Figure 3.
Figure 2 shows the modelled traffic on the network elements (“Volume PrT”), and it is given in vehicle numbers (“[veh]”) and for the analysed period (“AP”). In
Figure 3 “KEY” refers to the decoding information in the figure. And “E_CO2_TOTAL–Base” refers to the difference in values of the
emission numbers between the tested scenario and the base version. The figure serves as an illustration of how modifications to specific road segments can lead to corresponding changes in emission levels. Therefore, the reference for the comparison (base version) is the model in which the road segment is present and not closed. The test version is compared against this base case and represents the scenario with the closure applied. This is indicated by the “Base” label in the legend of the figure.
Table 3 indicates the number of network links included in the validation and in the sensitivity test.
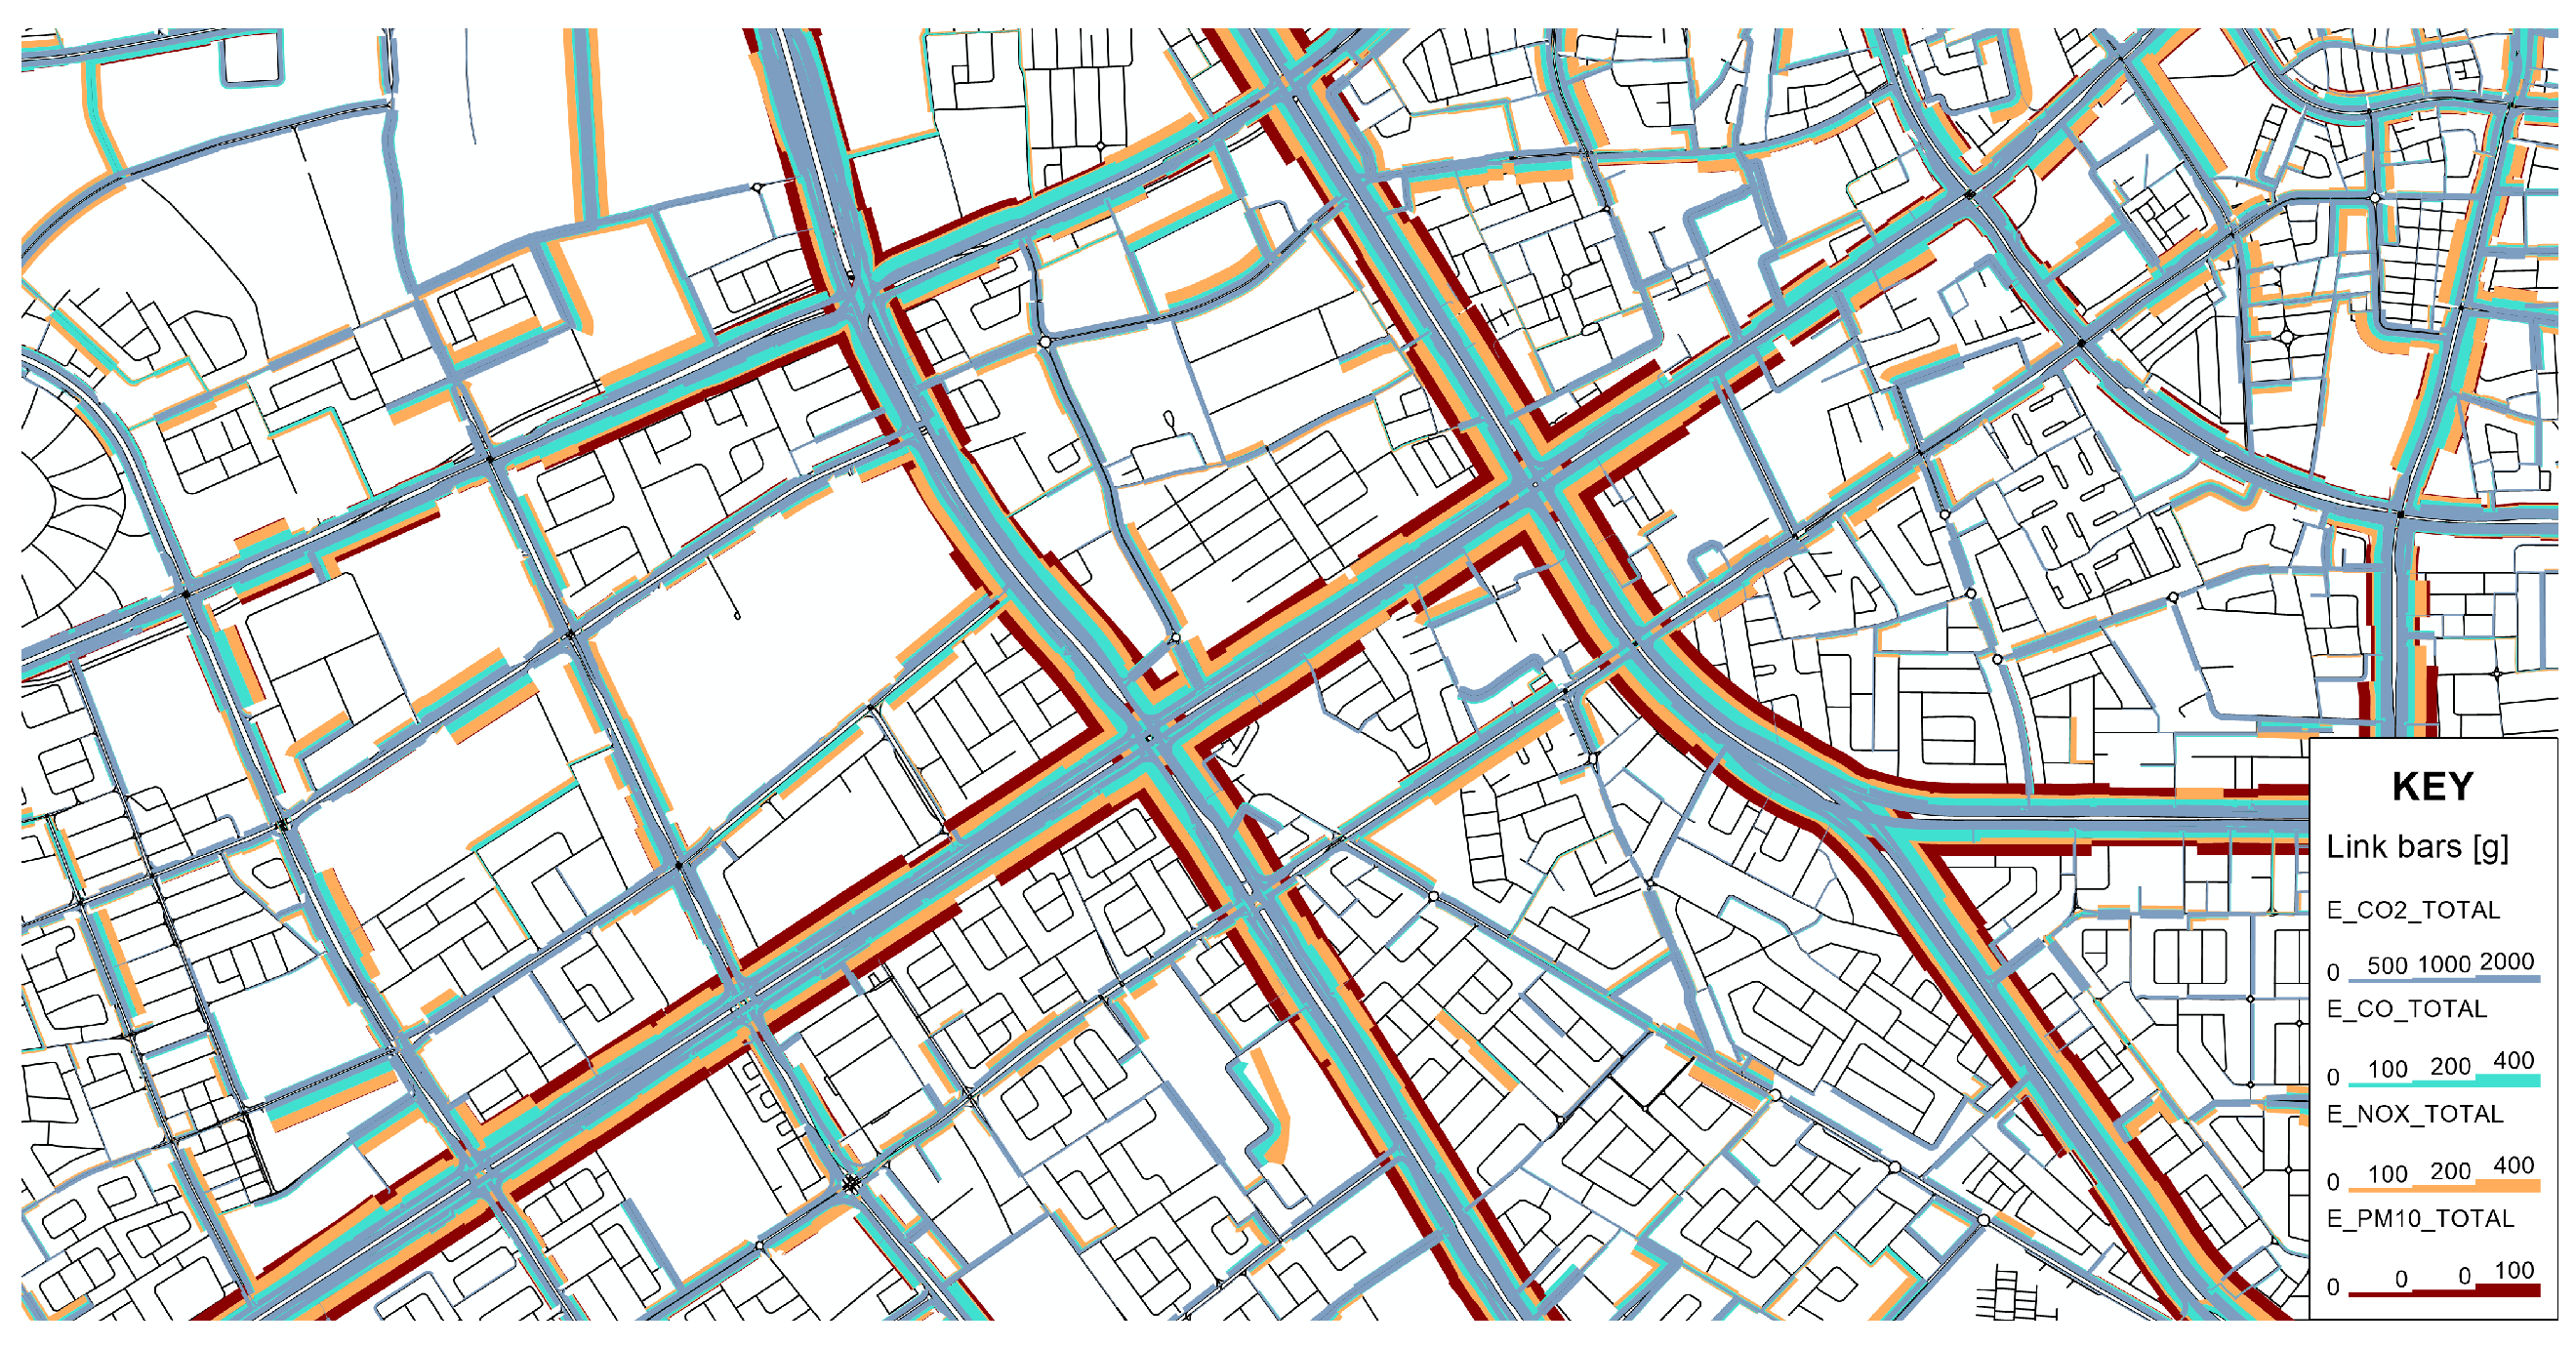
The units of the calculated pollutants can be identified locally and analysed on a specific basis along individual sections of the network. This is illustrated in
Figure 4.
The results obtained from the fleet composition tests were consistent with expectations. A general decrease in emissions was observed as newer vehicle categories were introduced. The Euro 1, Euro 2 and Euro 3 class vehicles were replaced and the average emission values decreased. It is important to mention that the traffic did not change on the network elements, only the emission. And the average emission values stayed in a relevant range. The results can be seen by vehicle types (Bus; Car; HGV: Heavy Goods Vehicle; LGV: Light Goods Vehicle; and MC: Motorcycle) in
Table 4,
Table 5 and
Table 6.
Most of the values decreased due to the more environmentally friendly technologies, but some values increased a little. This is due to the fact that newer cars are heavier and they have other disadvantages. These changes can occur due to the fact that vehicle fleets are different in the two traffic models.
5.3. Calibration—Applicability in Other Countries
Differences in driving behaviour, traffic dynamics and local operating conditions can introduce systematic deviations in emission estimates when applying standard emission factors. Although the proposed methodology is fundamentally based on the COPERT framework, which represents average European driving conditions, local driving habits such as acceleration patterns, stop-and-go frequency or compliance with speed limits may significantly influence real-world emissions. For this reason, the inclusion of calibration parameters is considered essential to improve the representativeness of the results at local and regional scales.
Within the presented approach, these deviations can be addressed by applying calibration coefficients derived from local measurement data, allowing the COPERT-based emission estimates to be adjusted without modifying the underlying formulation of the model. The open and modular structure of the implementation enables the straightforward integration of such calibration multipliers through external scripts. As the emission module is not fully embedded into the core software, calibration can be performed flexibly and transparently, facilitating adaptation to site-specific conditions and supporting future model refinement based on empirical evidence.
6. Conclusions
This study presents an emission calculation module that can be integrated into traffic models and provides detailed estimates of pollutants emitted by road vehicles. The development builds on the COPERT methodology, which accounts not only for exhaust emissions such as , and PM, but also for non-exhaust emissions from brake wear, tyre wear, road abrasion and evaporation. The calculation is structured along four independent components, ensuring flexibility, calibration and transparency.
The technical design considers practical limitations of traffic models. Equations and parameters do not follow COPERT in every detail but apply an adapted version consistent with available traffic data. This ensures applicability in diverse urban and regional contexts without excessive data requirements.
The scientific relevance of this approach is underlined by several above-cited international studies, which have investigated how traffic conditions can be translated into emission estimates, especially in congested urban areas. Different modelling tools such as SATURN, Aimsun and HERMESv3 have been used, leading to similar conclusions: detailed traffic inputs, accurate fleet composition and adequate spatial and temporal resolution are essential for reliable emission modelling.
The presented system has an open architecture, enabling further customisation, particularly when local measured data are available. Calibration parameters and component-based logic already built in ensure that the model can be applied not only in Europe but also globally, accounting for different transport patterns, fleets and environmental conditions. This contributes to building a stronger, data-driven link between transport planning and environmental protection.
The COPERT methodology has proven suitable for accurate emission forecasting while maintaining low data requirements. As discussed in the referenced comparative study, it provides sufficiently precise results for urban-scale modelling without relying on complex traffic state or congestion data. This characteristic represents a key advantage over the HBEFA approach, which depends on detailed congestion and traffic situation inputs that are often unavailable or difficult to obtain in practice. Consequently, COPERT offers an optimal balance between accuracy and data demand, making it an efficient and robust solution for large-scale or data-limited applications.
It is important to note that some input data are required for running and applying the module. Since vehicle-related data are directly derived from the traffic model, no data gaps are expected in that part. However, a certain amount of information is needed for defining the vehicle fleet. An approximate fleet composition must be provided for proper operation, while the emission factors for each vehicle category can be directly copied from the latest COPERT database.
In the absence of site-specific measurements, the calibration parameters can be set to a default value (such as 1). Even with these default values, the module produces realistic results and remains fully functional.