


Abstract
Arctic marine traffic is increasing as ice conditions change, creating greater risks of vessel collisions and groundings. To address the need for more reliable quantitative risk evaluation, this paper presents a new safety risk index tailored to Arctic maritime operations. The index integrates fuzzy-logic linguistic scoring with Multi-Criteria Decision-Making (MCDM) methods to convert expert judgements into a consistent numerical measure. The methodology involves defining qualitative criteria, assigning fuzzy membership functions, constructing expert-driven rule bases, and aggregating results through an MCDM approach. These components are calibrated using expert workshops to improve accuracy. Validation using historical Arctic collision and grounding cases shows that the index reduces false-negative alerts compared with traditional threshold-based tools. Sensitivity analysis identifies which criteria most strongly influence risk outcomes. Overall, the proposed index provides a more objective, transparent, and operationally useful assessment framework to support planners and bridge teams navigating Arctic waters.
1. Introduction
As Arctic sea ice continues to thin and seasonal shipping routes become more viable, maritime traffic in the High North, including Arctic Ocean, North Atlantic, Baltic Sea, and North Sea waters, is rising rapidly. This shift brings increased navigation uncertainty: uncharted ice hazards, limited surveillance infrastructure, sparsely monitored sea lanes, and scarce search-and-rescue assets. Recent analyses by EU Horizon 2020 and climatology bodies indicate enhanced risk exposure for vessels in these regions. (AI-ARC, the EU’s Innovative Virtual Control Room project, was initiated precisely to address such operational vulnerabilities in Arctic maritime surveillance).
Traditional tools used by industry and regulators, such as IMO’s Polar Code risk calculators or standard AIS-based alert systems, rely heavily on binary rules and static thresholds. These frameworks often fail to account for the ambiguity and variability intrinsic to Arctic conditions (e.g., fluctuating ice concentrations, unpredictable sea-state changes, crew-specific factors). Prior academic studies, such as the improved fuzzy AHP method by [1], begin to model navigational risks using expert-weighted fuzzy criteria but remain limited to static assessments and offline analysis. Similarly, [2] applied fuzzy AHP to route choice decisions rather than real-time risk index computation for collision or grounding scenarios in Arctic waters.
To address this gap, the present paper introduces a dynamic Arctic-Maritime Risk Index Service developed as part of the AI-ARC Horizon 2020 project. It combines real-time environmental and vessel data, fuzzy linguistic assessments, and expert-derived weights via the Analytic Hierarchy Process (AHP). This system translates subjective assessments (e.g., “high ice regime”, “limited manoeuvrability”) into a nuanced, five-level risk index. It is integrated into the AI-ARC Virtual Control Room (VCR) platform as an intuitive color-coded alert for coast guard operators and bridge teams. Unlike past methods, our service adapts in real time, supports sensitivity analysis, and enables recalibration based on observed incident frequencies and severity.
Specifically, this paper examines three main research questions:
RQ1: How can intelligent risk assessment improve resilience of Arctic maritime transportation systems under environmental and geopolitical uncertainty?
RQ2: How does integrating expert knowledge and dynamic operational data improve maritime risk awareness compared with conventional approaches?
RQ3: What risk factors most influence transportation resilience across different Arctic operational scenarios?
The methodological contributions of this paper are:
- Development of a cascaded hierarchical fuzzy tree architecture capable of combining dynamic AIS data, environmental information, and expert judgments within a computationally efficient framework.
- Integration of AHP-based multi-criteria decision making with fuzzy inference systems to incorporate vessel-type-specific severity and frequency information into real-time risk assessment.
- Development of an operational risk-index service capable of supporting resilience-oriented maritime decision making through continuous risk monitoring and sensitivity analysis.
In this study, resilience is defined as the ability of an Arctic maritime transportation system to anticipate, monitor, respond to, and recover from disruptive navigational events. The proposed service contributes to intelligent resilience through three mechanisms. First, it continuously updates risk assessments using streaming AIS and environmental data, thereby enhancing anticipatory capabilities. Second, it combines expert knowledge with operational data through fuzzy reasoning and AHP-based prioritization, enabling adaptive decision support under uncertainty. Third, its real-time risk visualization supports faster and more informed interventions by coastguards and vessel operators. Consequently, the service acts as an intelligent resilience-support mechanism rather than a conventional static risk assessment tool.
2. Literature Review
2.1. Outline
Maritime safety, particularly in challenging environments like the Arctic Ocean, is a rapidly evolving field where advanced technologies, including fuzzy logic, play a crucial role. This literature review explores the advancements and challenges in maritime risk assessment systems, focusing on the Arctic region, and compares these developments with this paper’s methodologies and objectives.
2.2. Importance of Maritime Risk Assessment
The Arctic region presents unique challenges for maritime operations, including harsh weather, ice conditions, and remoteness. Satellite observations, particularly Synthetic Aperture Radar (SAR), provide valuable Arctic coverage. However, the present implementation prioritized low-latency processing and operational deployment using AIS and meteorological data streams that are continuously available and computationally lightweight. Satellite information will be explored in future versions of the service as an additional source of resilience-enhancing situational awareness.
This is compounded with an atmosphere of inhospitable climate in terms of ice, and hence, we included the iceberg collision as a case study. In addition, due to climate change, Arctic conditions are becoming more navigable, increasing the risk of collision and grounding; hence, we also included cases of container shipping, grounding, collisions, and oil spills. The authors of [3] emphasize the importance of AI in enhancing maritime situational awareness and safety in these conditions. Similarly, Mjelde et al. [4] discuss AI’s capability in accurately modelling emissions and discharges, addressing environmental concerns in the Arctic. An example of a marine collision risk index, but not related to Arctic conditions, can be found in [5]. They combine dimension data from the automatic identification system (AIS) and velocity obstacle approach from the margin of projected collision (MPC) index. A further work relating to harbor traffic collision incidents using the Marine Traffic Hazard Index is given in [6]. The Harbour Traffic Hazard Map uses Gaussian influence functions to calculate dynamic continuous measurement for risk at a point. These values can be plotted as contour lines, points with the same index score, on a map of the area of interest. The dynamic, real-time aspect of this index is determined by values for vessels taken from AIS, which allows the inclusions of multiple ships and also a small spatial resolution (0.05 NM x 0.05 NM). Another recent advancement is the development of a real-time vision-based risk assessment framework for ship collision in situations when the AIS data are either inaccurate or missing [7]. Another development is related to utilizing AIS data for machine routes extraction [8]. A collision risk index, utilizing DCPA and TCPA, was developed based on Dempster-Shafer theory [9] and for the path planning for Maritime Autonomous Surface Ships (MASS) in constrained waterways [10].
Table 1 provides a summary of a comparative literature review.
Table 1.
Summary of the comparative literature review.
Existing studies either focus on static assessments, lack Arctic-specific adaptation, or do not integrate MCDM-based prioritization with dynamic risk computation. This gap motivates the present study. Therefore, these advancements underscore the critical role of AI-based systems, like the AI-ARC project, in improving maritime safety and decision-making in the Arctic.
2.3. The Role of AIS and Fuzzy Logic
Automatic Identification System (AIS) data have become integral to maritime safety research. The authors of [13] illustrate how combined AI capabilities, including trajectory fusion and early notification modules, enhance maritime safety in a common information-sharing environment. This aligns with the AI-ARC project’s use of AIS data, combined with environmental factors, for risk assessment. Fuzzy logic, used in both the AI-ARC project and other studies like the MARISA project, is instrumental in handling the uncertainty and complexity inherent in maritime risk assessment [11].
2.4. Comparative Analysis with Existing Systems
In comparing the focus of this present work with existing maritime risk assessment systems, both similarities and unique contributions become evident. The reliance of the current investigation on AIS data and fuzzy logic for risk assessment aligns with approaches used in other studies, such as the MARISA project [11]. This common use of AIS data highlights its significance and reliability in maritime safety applications across various projects. Similarly, the employment of fuzzy logic in both the current work and MARISA indicates a shared understanding of its effectiveness in handling the uncertainties and complexities inherent in maritime risk assessment.
However, the work in the current paper distinguishes itself by incorporating additional factors like traffic calculation and maneuverability data into its risk assessment model. This aspect of the methodology represents a significant advancement over existing systems. While projects like MARISA focus on individual ship risk factors, this current paper extends this by considering the dynamic interactions between multiple vessels and their ability to maneuver in response to potential risks. This comprehensive approach is particularly crucial in the Arctic maritime environment, where navigational challenges are compounded by extreme weather conditions and the remoteness of the region.
Furthermore, the specific focus of the current paper on the Arctic maritime environment sets it apart from other systems. The Arctic poses unique risks due to its extreme weather, emerging navigational routes resulting from climate change, hazards of iceberg collision, and remote location. This specificity in focus is not as pronounced in systems like MARISA, which were designed with a more general maritime context in mind. Hence, the proposed tailored approach to the Arctic environment demonstrates its potential to significantly enhance maritime safety in these challenging waters.
2.5. Data Integration and Analysis
The Risk Index Computation Service exemplifies the integration of AIS data with other environmental factors, a key aspect in maritime risk assessment. This service was developed using data analysis tools in MATLAB Ver 2024b and Python 3.11, aligning with the forefront of maritime data processing and analysis trends. MATLAB’s robust computational abilities are essential for handling complex algorithms required in risk computation, similar to the applications found in maritime surveillance systems designed by [14]. This aligns with the Risk Index Service’s need for sophisticated data processing capabilities.
Python’s role in the Risk Index framework complements MATLAB Ver 2024b by providing versatility in data handling and pre-processing. This ensures data quality and reliability, a critical factor in maritime risk assessment. Python’s efficacy in maritime applications is demonstrated in the work of [15], who utilized it for high-performance scientific applications in numeric computations.
The Risk Index system’s approach to categorizing risk and communicating it in real-time to stakeholders is a significant advancement over existing systems. This methodology enhances decision-making for maritime professionals and supports proactive risk management, especially crucial in the dynamic Arctic environment.
2.6. Research Gaps and Future Directions
In assessing the risks associated with vessels at sea it is vital to consider a comprehensive set of risk factors was provided by [16]. These factors can be broadly categorized into four groups [16]:
- Static Risk Factors: These encompass the unchanging characteristics of a vessel, such as its size, ownership, classification status, age, flag, and crew. These elements are foundational to any risk assessment as they represent the inherent qualities of the ship.
- Voyage-Related Risk Factors: This group pertains to variables specific to each voyage. Factors include the type of cargo, and the departure and destination ports, which may influence risk due to port congestion or historical accident rates. The political and crime situation in the departure and destination countries also plays a role.
- Dynamic Risk Factors: These factors are changeable aspects that can vary during a voyage. They include real-time variables like meteorological conditions, proximity to other vessels, and the reliability of communication systems as evidenced by the consistency of AIS messages.
- History-Related Risk Factors: A vessel’s historical data provides insights into its risk profile, considering previous behavioral anomalies, ownership changes, records of port state controls, past accidents, and ports visited.
The Formal Safety Assessment (FSA) process, consisting of hazard identification, risk assessment, the identification of risk control options, cost/benefit assessments, and decision-making recommendations, relies on these factors. Analytical tools such as Fault Tree Analysis, Event Tree Analysis, Bayesian Networks, Correlation Analysis, and fuzzy logic are instrumental in dissecting and understanding these risks, often by combining several methods for a comprehensive evaluation [16].
The authors of [11] incorporated the fuzzy logic analytical tool to complete a maritime risk assessment. This approach was a step forward in maritime safety; the hierarchical fuzzy systems used were simple and modular, and the model incorporated some available AIS and weather data, as well as historic data about the vessels. However, the implementation did not include expert dynamic judgements and multi-criteria decision-making for ship types, and the risk assessment was not focused on specific types of accidents but was an instead overall risk assessment. The absence of these factors in the model potentially limits the precision of the risk index in reflecting real-time situations and varying vessel characteristics. These judgements are crucial for adapting the assessment to the unique conditions and behaviors that influence maritime safety. Moreover, the lack of focus on specific types of accidents means that the model may not fully account for the nuances of different accident scenarios, which can vary significantly in terms of causes, risks, and appropriate response measures.
The implementation by [11] also does not integrate dynamic expert judgements, an aspect crucial for real-time and context-sensitive risk evaluations. The model does not fully leverage the extensive vessel data available through the Automatic Identification System (AIS), missing out on a rich source of real-time maritime traffic information. Additionally, its application does not extend to the unique and challenging Arctic environment, which presents distinct risks such as ice navigation hazards and severe meteorological conditions. These limitations indicate that the model, despite its advancements, could be significantly enhanced by incorporating these dynamic and region-specific elements to provide a more comprehensive and accurate maritime risk assessment.
The authors of [12] refined the Maritime Risk Assessment (MARISA) from the [11] approach by incorporating new risk factors related to speed evolution and shipping lanes. However, this service still did not incorporate multi-criteria decision-making for ship types and dynamic expert data.
Finally, the collision risk from [17] proposes a novel algorithm to evaluate navigational collision risks, addressing a critical gap in previous research that often-neglected navigational conditions and external environment factors in real-time situations. The algorithm employs fuzzy logic to assess basic collision risk and integrates various vulnerability factors like bad weather, tidal currents, accident-prone areas, traffic congestion, operator fatigue, and fishing boat operating areas. Such integration is key to improving collision risk assessments, especially for non-SOLAS (Safety Of Life At Sea) ships, which include coastal operating ships and fishing vessels that often do not fall under the same stringent regulations as larger international vessels.
The study advances the field by utilizing the Analytical Hierarchy Process (AHP) method to synthesize the vulnerability factors into a comprehensive risk assessment. This is done by summarizing expert opinions through brainstorming sessions with captains and officers, thus reflecting a significant degree of industry knowledge and experience. The AHP method helps to not only rank each vulnerability risk factors but also provides an average value, offering clear information on traffic and environmental conditions that are challenging to combine and judge otherwise.
Because the proposed model relies upon expert knowledge for the construction of membership functions, fuzzy rules, and AHP weights, several measures were employed to reduce subjectivity. First, experts were drawn from multiple national coastguard organizations including the UK, Iceland, Norway, and Sweden, thereby reducing organizational bias. Second, responses were aggregated rather than relying on individual opinions. Third, AHP provides a structured mechanism for transforming qualitative judgements into consistent quantitative priorities. Nevertheless, the model remains sensitive to expert interpretation and may reflect cognitive biases such as availability bias, anchoring effects or overconfidence. Future work should therefore incorporate larger expert panels and learning mechanisms capable of updating membership functions and weights from operational incident data.
However, there are limitations to this approach. While the use of weights in multicriteria decision-making is a step forward, it is applied as a posterior output rather than integrating the hierarchical capabilities of AHP, which might limit the depth of analysis that can be performed. Moreover, the AHP is used linearly, considering only alternatives but not criteria, which may not fully capture the complexity of risk factors involved. The model does not incorporate dynamic expert judgements in evaluating risk based on types of vessels, a crucial aspect for tailoring risk assessments to specific vessel vulnerabilities. Additionally, similar to previous studies by [11,12], this approach has not been applied to the Arctic, an area with unique and extreme navigational challenges that could significantly affect risk assessment outcomes.
Addressing the gaps highlighted in current maritime risk assessment research, especially the need for better dynamic and region-specific models, this study introduces a new approach. It aims to improve upon previous methods by adding real-time expert judgment capabilities and a multi-criteria decision-making framework. This will enable a more accurate representation of the complex factors affecting maritime safety, particularly in the challenging Arctic region.
The goals of this research are straightforward. Firstly, to create a model that makes full use of the live data from the Automatic Identification System (AIS), providing a dynamic and responsive tool for risk assessment. Secondly, to adapt this model for the Arctic, where unique environmental risks demand a specialized approach to ensure safety and navigability.
This research will use a practical methodology, based on an improved version of the fuzzy logic system, to include expert systems that can evaluate and prioritize dynamic risk factors as they happen. This methodology is designed to be flexible, suitable for a variety of scenarios like collisions or groundings, and it can be adapted swiftly to new situations as they arise, fulfilling the need for a versatile risk assessment tool in the maritime industry.
The expected outcome from this research includes a user-friendly framework for dynamic risk assessment, a customized tool for Arctic maritime operations, and a set of implementation guidelines. This work aims to equip the maritime industry with better tools for understanding and managing the risks of Arctic navigation, ultimately leading to safer maritime operations. While there are hurdles such as data collection and the integration of expert insights, the research plan includes multiple stages of testing and refinement to ensure the model is both effective and accurate.
Table 2 summarizes the comparison of the proposed model in this paper with respect to existing risk assessment models.
Table 2.
Comparative analysis with the most relevant existing risk assessment models.
Risk assessment models are varied as they may apply to both safety and security, where the main difference between them is existence of intent in the security domain. Risk assessment may also be influenced by, and have an influence on, other related fields such as situation awareness, and more specifically in maritime traffic situation awareness (MTSA) [18].
The incorporation of rules in the modelling provides a solid foundation for explaining the rationale behind decisions taken and hence can be easily tracked and audited. This is in line with the recent attention in explainable AI for operational research (XAIOR) proposed by [19] in terms of being performance, attributable, and responsible.
3. Methodology
3.1. Overview
The research carried out aims to significantly enhance maritime safety and situational awareness in the Arctic region. A pivotal component of this paper is the development of the Risk Index Computation Service, designed to address the unique challenges and increasing maritime activities in the Arctic. This escalation in maritime traffic, primarily due to climate change and the consequential melting of Arctic ice sheets, introduces new navigational hazards. To mitigate these risks effectively, our project leverages cutting-edge technology and innovative data processing techniques.
The developed Risk Index stands at the forefront of this initiative, offering an advanced, fuzzy-logic-assisted early warning system that integrates and analyses diverse data sources to provide real-time maritime risk assessments. The core of this service is a sophisticated Cascaded Hierarchical Fuzzy Tree Structure, developed in MATLAB Ver 2024b and Simulink, that processes and interprets complex maritime data with a high degree of accuracy and reliability. This system is particularly adept at handling the uncertainties and dynamic conditions characteristic of the Arctic maritime environment.
A crucial aspect of our methodology is the seamless integration of data processed in Python with the Simulink fuzzy logic models. This integration is key to the functionality of the Risk Index, as Python is utilized for initial data processing, including the collection, cleaning, and normalization of various data streams. These data streams include Automatic Identification System (AIS) data, weather data, and shoreline data, each playing a vital role in the comprehensive risk assessment process. The processed data from Python then feed into the Simulink models, where the advanced fuzzy logic techniques are applied to compute the risk indices.
Ensuring real-time capability and accuracy, the Risk Index Service continuously processes incoming data, generating timely and actionable insights. These insights are then communicated via XML messages to the Virtual Control Room (VCR), where they are visualized and used to alert maritime stakeholders to potential risks. This real-time visualization is crucial for proactive maritime safety management, particularly in the remote and challenging conditions of the Arctic maritime region.
The methodology also encompasses testing and validation processes, ensuring the reliability and accuracy of the Risk Index. The integration of Python and Simulink, along with the comprehensive approach to data analysis, represents a significant advancement in maritime risk assessment technology.
3.2. Collision Use-Case Calculations
For the collision use-case, calculating vessel traffic is a critical component. The Redis geospatial database plays a crucial role in this aspect of risk assessment. Redis was selected because of its in-memory architecture and geospatial indexing capabilities. AIS positions were stored as geospatial objects indexed by vessel MMSI, latitude, longitude, speed and timestamp. The database supported near-real-time spatial queries for traffic density estimation and nearest-vessel detection. Utilizing the “geosearch” command, the service can efficiently determine the number of vessels within a certain distance from the location reported in the current AIS message. This capability allows for an accurate count of vessels in a specified radius, ensuring up-to-date traffic analysis. To maintain the relevance of the data, the system is configured to automatically remove entries that have not been updated for more than 30 min, thus eliminating outdated geospatial data from the traffic estimation process. The “geosearch” command in the Redis geospatial database not only enables the assessment of vessel traffic but also identifies the nearest vessel, which is a crucial factor for collision risk assessment.
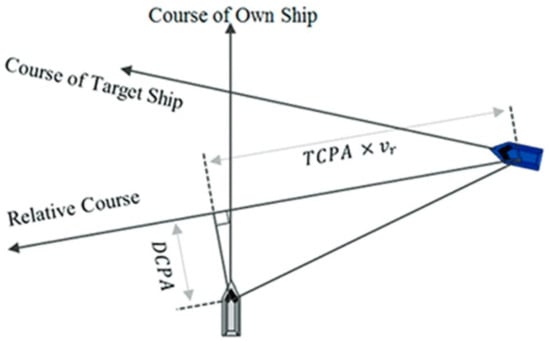
In the collision use-case analysis, calculating the Distance to the Closest Point of Approach (DCPA) and Time to the Closest Point of Approach (TCPA) is paramount [9], and this is where specific AIS data such as Speed Over Ground (SOG) and Course Over Ground (COG) come into play. These data points are instrumental in determining the relative motion between two vessels, which is essential for predicting potential collision scenarios as depicted in Figure 1.
Figure 1.
Concepts of DCPA and TCPA, adapted from [20].
For TCPA, which signifies the time until the closest approach based on current trajectories, the vessels’ SOG and COG are utilized to define their velocity vectors. The mathematical formula for TCPA when considering two vessels, A and B, with positions and and velocities and is as follows:
Here, represents the relative position vector between vessel A and vessel B, and is the relative velocity vector. The dot product and magnitude calculations are performed in the coordinate system where the vessels’ position and velocities are defined.
DCPA is the minimum distance between two vessels along their paths of travel if they don’t alter their speed or course. It gives an idea of how close the vessels will come to each other and is essential for determining the severity of a potential collision situation. The formula for DCPA is based on the relative position at the TCPA and is given by:
Equation (2) uses the TCPA to project the motion of the vessels forward in time to find their positions at the closest point of approach. The norm of the resulting vector gives the DCPA.
Both TCPA and DCPA are calculated using the vessels’ known positions and velocities, which can be gathered from AIS data. In practice, these calculations are performed by the Python script, which then feeds the results into the MATLAB Ver 2024b-based fuzzy tree structures for risk assessment.
3.3. Grounding Use-Case Calculations
In the grounding use-case for the Risk Index, the calculations for distance to shore and the vessel’s bearing relative to the shore are essential. These calculations are intricately performed using the haversine formula and advanced data processing techniques.
The grounding-risk model developed in this study uses a high-resolution shoreline database rather than bathymetric depth measurements as its primary geographical reference. The database consists of approximately 80,000 georeferenced shoreline points covering the coastal regions relevant to the Baltic and Arctic demonstration scenarios. These shoreline positions were extracted from digital nautical chart and coastline datasets and stored as latitude–longitude coordinates for efficient spatial querying. The dataset provides sufficient spatial granularity for nearest-shore calculations used in real-time risk assessment, while maintaining computational efficiency for operational deployment.
For each incoming AIS record, the vessel position is compared against the entire shoreline dataset using vectorized NumPy operations to identify the nearest shoreline location. The resulting nearest-shore point is then used to calculate both the distance-to-shore and bearing-to-shore metrics that serve as inputs to the grounding fuzzy inference system.
It should be noted that the present version of the Risk Index does not explicitly incorporate bathymetric depth data, tidal information, under-keel clearance, or vessel draught. Consequently, the grounding assessment should be interpreted as a proximity-based early warning indicator rather than a hydrographic grounding prediction model. The integration of electronic navigational chart (ENC) bathymetry, real-time tidal data, and vessel-specific draught information would provide a more comprehensive representation of grounding hazards and is planned as a future enhancement of the service.
The service first tackles the challenge of finding the closest point on the shore to the vessel. To do this, it employs a detailed dataset containing about 80,000 shoreline positions. Each of these positions is a potential point of comparison to determine the vessel’s proximity to land. By leveraging the NumPy python library and its vectorization capabilities, the service can efficiently compare the vessel’s current position with all these shoreline positions simultaneously. This approach significantly speeds up the process, allowing for quick identification of the nearest shore point.
Once the closest point on the shore is determined, the distance to this point is calculated using the haversine formula. The haversine formula shown in Equation (3) is a well-established mathematical equation used to calculate the great-circle distance between two points on a sphere based on their longitudes and latitudes. It considers the spherical nature of the Earth and provides an accurate measure of distance over its surface. This calculation is crucial as it gives a quantifiable measure of how close the vessel is to potential grounding.
- is the radius of the Earth.
- are the latitudes of point 1 and point 2, respectively, in radians.
Additionally, the bearing calculation plays a pivotal role in the grounding risk assessment. The bearing, which is the compass direction from the vessel’s position to the closest point on the shore, is derived using trigonometric functions as shown in Equation (4), where
- are the altitude and longitude of the first point in radians,
- are the latitude and longitude of the second point in radians,
- is the difference in longitude.
Together, these calculations of distance to shore and bearing form a critical part of the grounding risk analysis. By integrating these computations into the fuzzy logic models, the service offers a thorough and nuanced assessment of grounding risks.
Once the calculations for both use-cases are complete, the MATLAB Ver 2024b methods responsible for computing the risk indices are invoked, with the necessary arguments passed to them. The details of the fuzzy tree structures and their role in the risk assessment will be discussed in a later section of this paper. The output of the risk calculation is a numerical value ranging from 0 to 1. This value is then interpreted into linguistic terms Low, Medium, or High, representing the assessed risk level. Subsequently, an XML message containing the risk information is created and published to a Kafka topic named “Risk”.
3.4. Incorporating an Analytic Hierarchy Process for Ship Types
The developed Risk Index integrates a survey with selected coast guards from different countries and based on a decision-making grid (DMG) that is then extend to multiple criteria decision-making (MCDM) methodology based on the Analytic Hierarchy Process (AHP) technique to quantify the severity and frequency of maritime accidents associated with various ship types. This approach has been adopted to harness expert knowledge, providing a structured mechanism for incorporating their insights into the risk assessment model.
A research study has been conducted where maritime experts were surveyed to evaluate the likelihood and impact of collision or grounding incidents across different vessel categories. These professionals provided detailed feedback on questions regarding how often and how severe accidents are for specific ship types. The findings from this study have been critical in assigning precise values to the risk levels for different types of vessels, which are factored into the risk index calculations.
For each use-case, whether for collision or grounding, the service employs these AHP-derived values to inform the risk model. By doing so, the risk index generated is reflective not only of real-time data but also of comprehensive expert evaluations on maritime safety.
This integration of AHP outcomes enables the service to offer nuanced risk assessments, aligning with the project’s aim to enhance maritime safety and situational awareness, especially in the Arctic region. As the service processes incoming data, it now has the capability to produce insights that are both timely and enriched with the depth of expert analysis, essential for proactive risk management in the Arctic’s dynamic maritime conditions.
3.4.1. Risk-Based Decision Grid
The basic idea of decision grids is that they aim to provide a visual representation based on two or more criteria, and hence the term ’multiple criteria’, and they therefore directly address the prescriptive requirement in strategic decision-making. Examples of such grids are the Decision-Making Grid (DMG) [21] and Jack-Knife Diagram (JKD) [22]. For a review of both the DMG (3 × 3 grid) and JKD (2 × 2 grid), see [23].
In our methodology, we construct a revised structure of the DMG and employ a variation of the JKD to determine the position of the thresholds between categories in the grid. The grid is based on the data collected from a survey carried out among coastguard experts (UK Maritime and Coastguards, Iceland Coastguards, Norwegian Coastguards, and Swedish Coastguards), and who are also partners of the AI-ARC project. This took place during the AI-ARC workshops and bi-weekly online meetings between 2022 and 2023. Table 3 shows the types of data collected from the experts (coastguards) in terms of prioritization of various types of risks. This data was also collected during initial scoping workshops and meetings, which took the form of brainstorming exercises.
Table 3.
Survey about prioritization of risks (completed by coastguards).
The data in the survey relate to two dimensions of: (1) the importance to coast guarding and (2) frequency at sea. These were then mapped into a prescriptive on the grid. Here, the importance and severity are used interchangeably, which is a legitimate criterion to select, since any AI solution has to address an area that is of significance to the users (coastguards). In terms of frequency, the rationale behind choosing this dimension is that it can help researchers in AI to classify suitable AI approaches based on the frequency of events and hence availability of data.
It can be noticed that such grid is similar to a risk assessment of frequency x severity, or some would rather frame it instead as explained in Equation (5). However, the main difference is that here it is of a ‘prescriptive’ nature. As in a classical risk assessment, a score of high-frequency and low-severity is equal to a score of high-severity and low-frequency, whereas in a prescriptive approach, both types of risk require different strategies.
In designing the survey, we initially looked at related recent literature in assessing risks within the arctic such as [24], as well as CASP Insight Analysis.
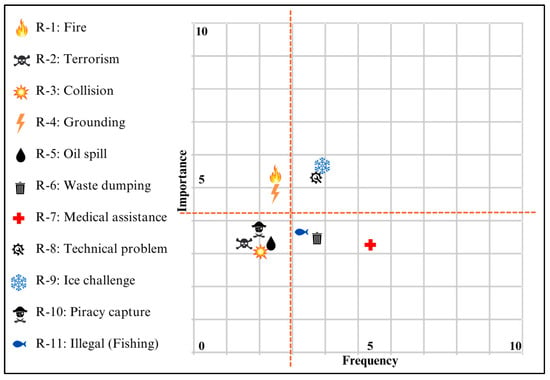
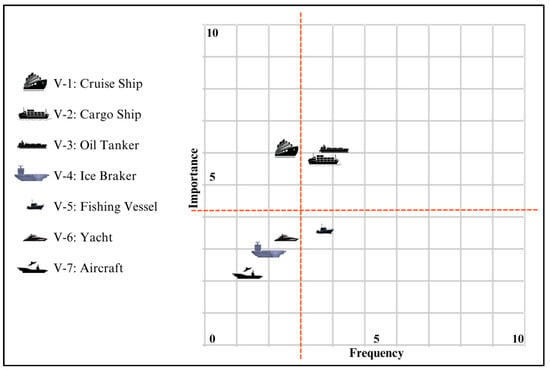
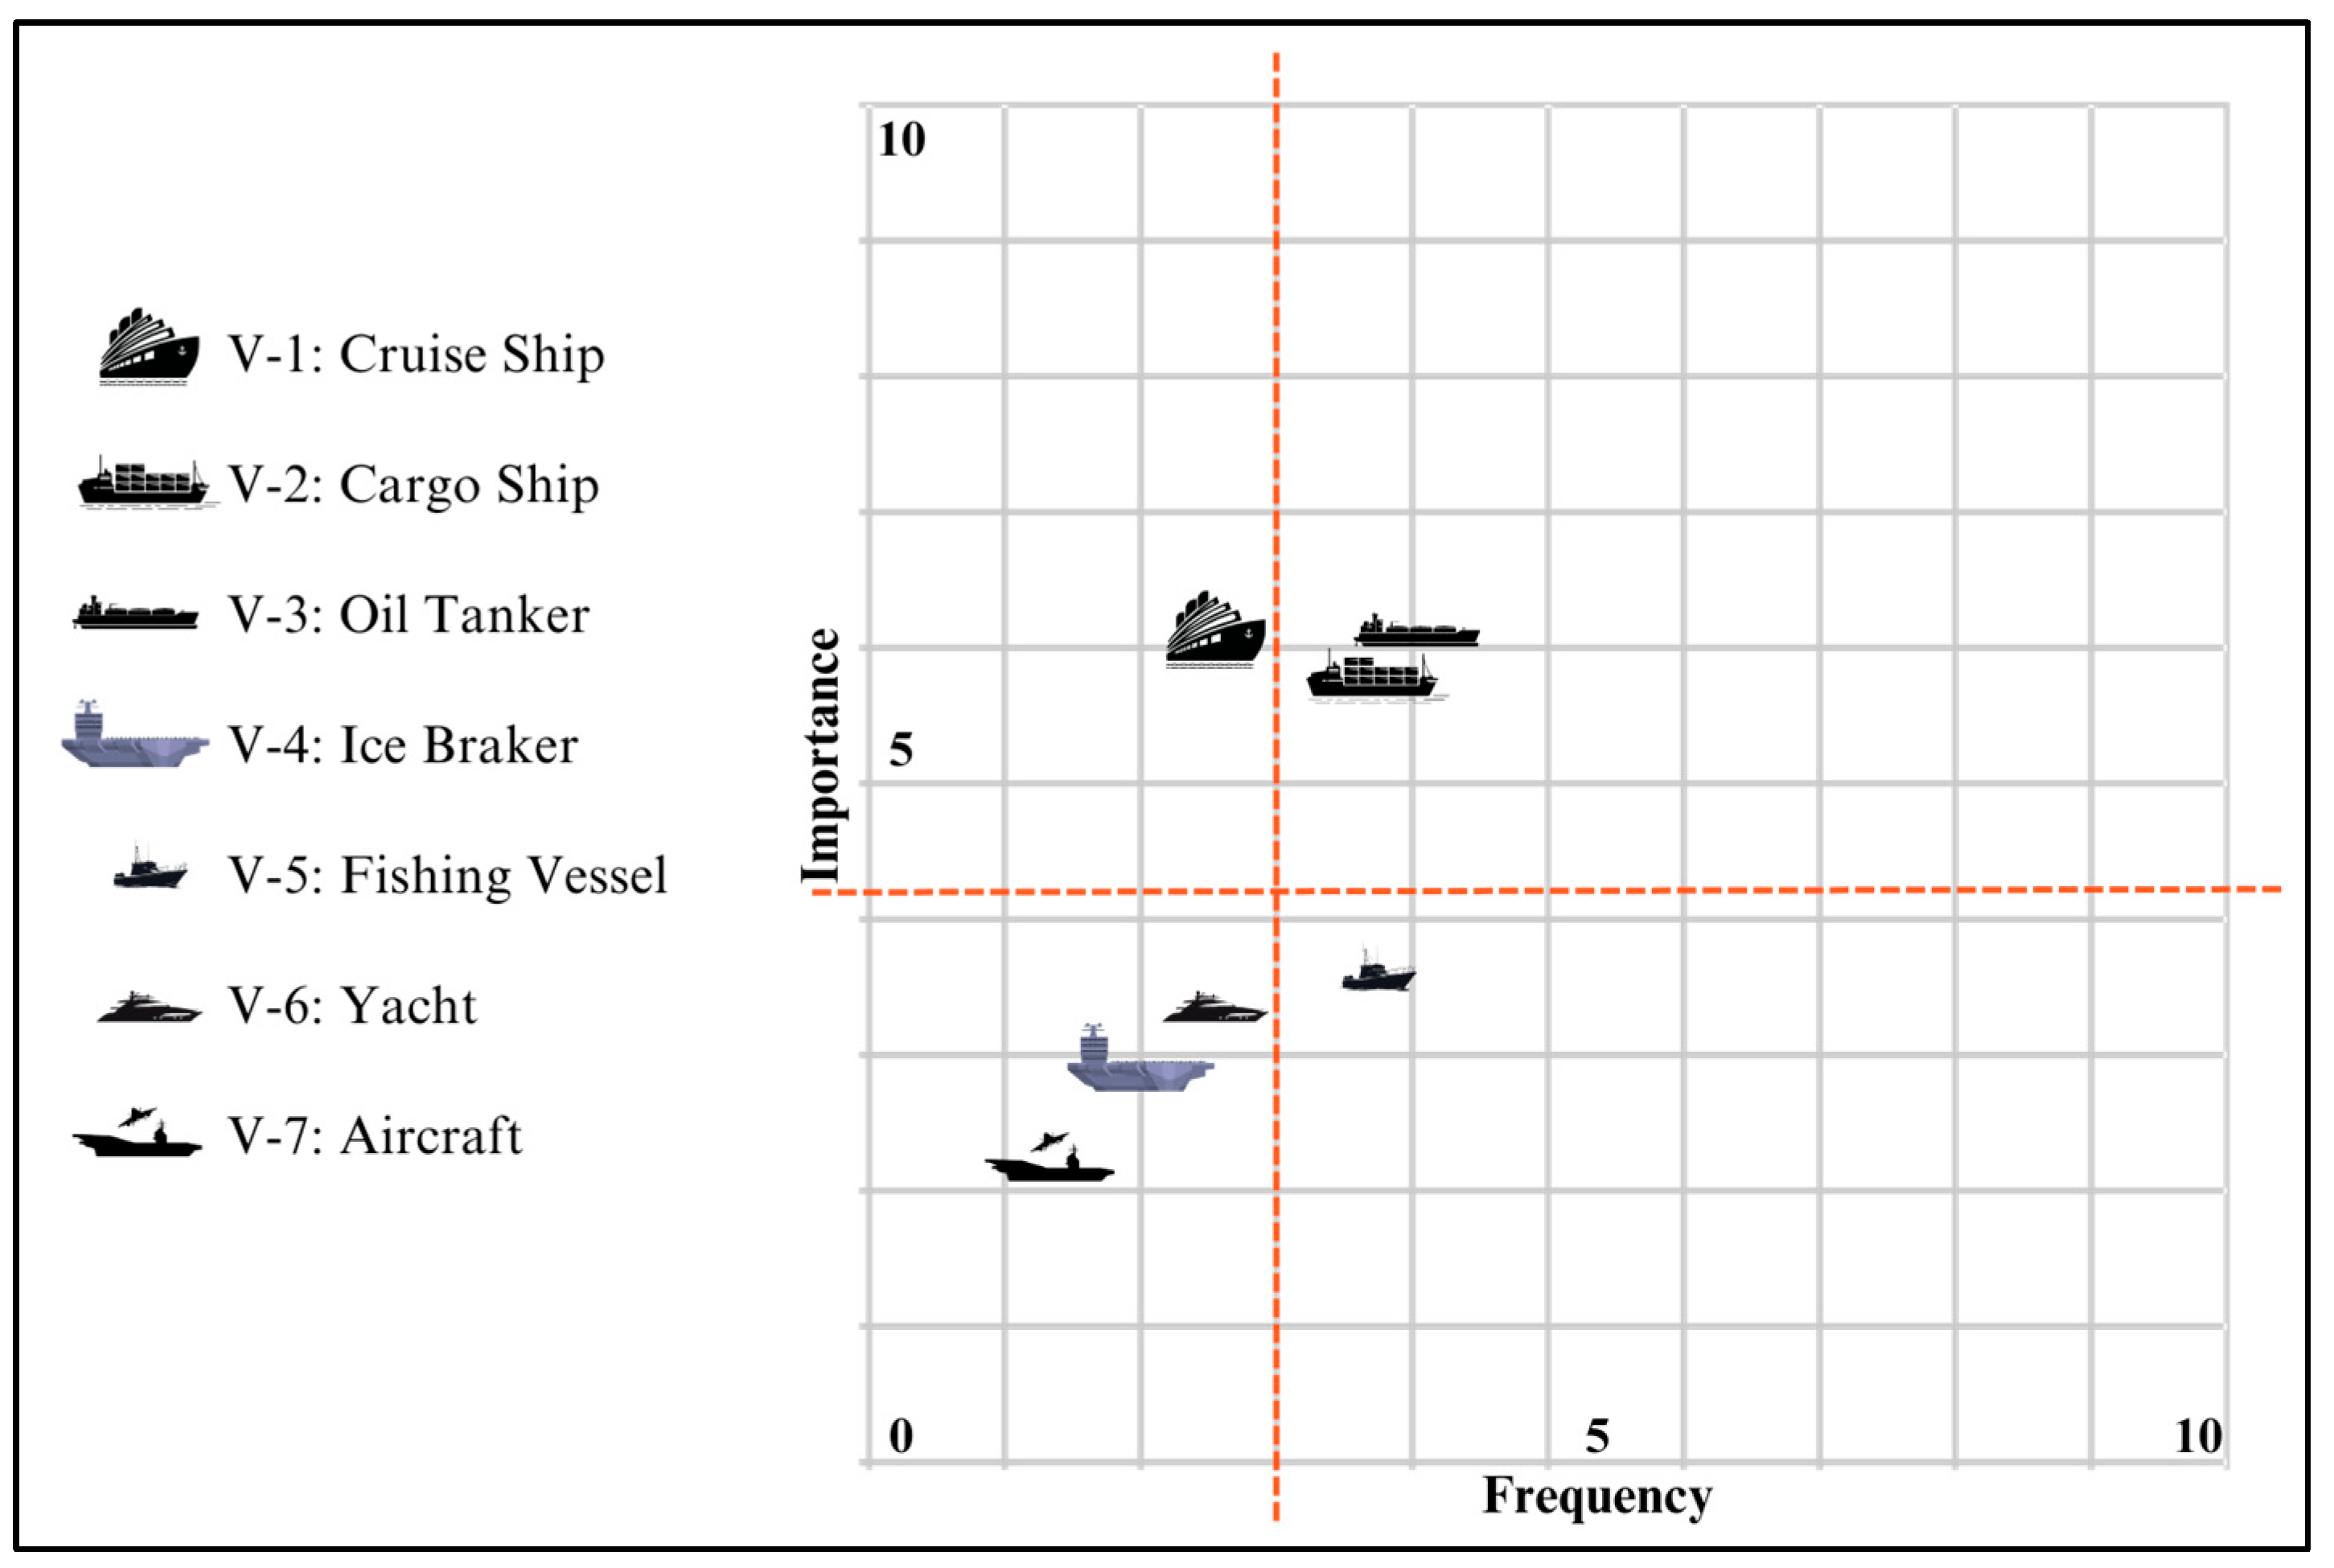
Results from the coastguards were then mapped according to both types of risk in Figure 2 and types of vessels in Figure 3, respectively.
Figure 2.
Results of types of risk from the coastguards’ perspectives.
Figure 3.
Results of types of vessels from the coastguards’ perspectives.
From a risk type aspect, results in Figure 2 indicate that in terms of high importance risks they are related to: ‘(i) Ice challenge’, ‘(h) Technical problems’, ‘(a) Fire,’ and ‘(d) Grounding’ are of high importance to the coast guards. Whereas in terms of frequency of events, and hence availability of data, risks related to ‘(g) Medical assistance’, ‘(f) Waste dumping’, ‘(h) Technical problems,’ and ‘(i) Ice challenge’ are frequent events.
From a risk type aspect, results in Figure 3 indicate that in terms of vessel types the importance of them tend to be high for these types of vessels: ‘V1: Cruise Ship’, ‘V3 Oil Tanker’, and ‘V2: Cargo Ship,’ respectively. Whereas in terms of frequency of events, and hence, availability of data, risks related to ‘V3 Oil Tanker’, ‘V2: Cargo Ship,’ and ‘V5: Fishing vessels’ are frequent events.
3.4.2. Multiple Criteria and Sensitivity (What If) Analysis
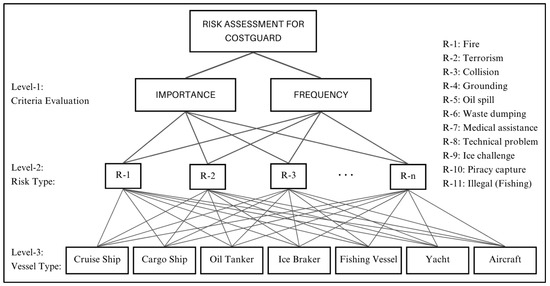
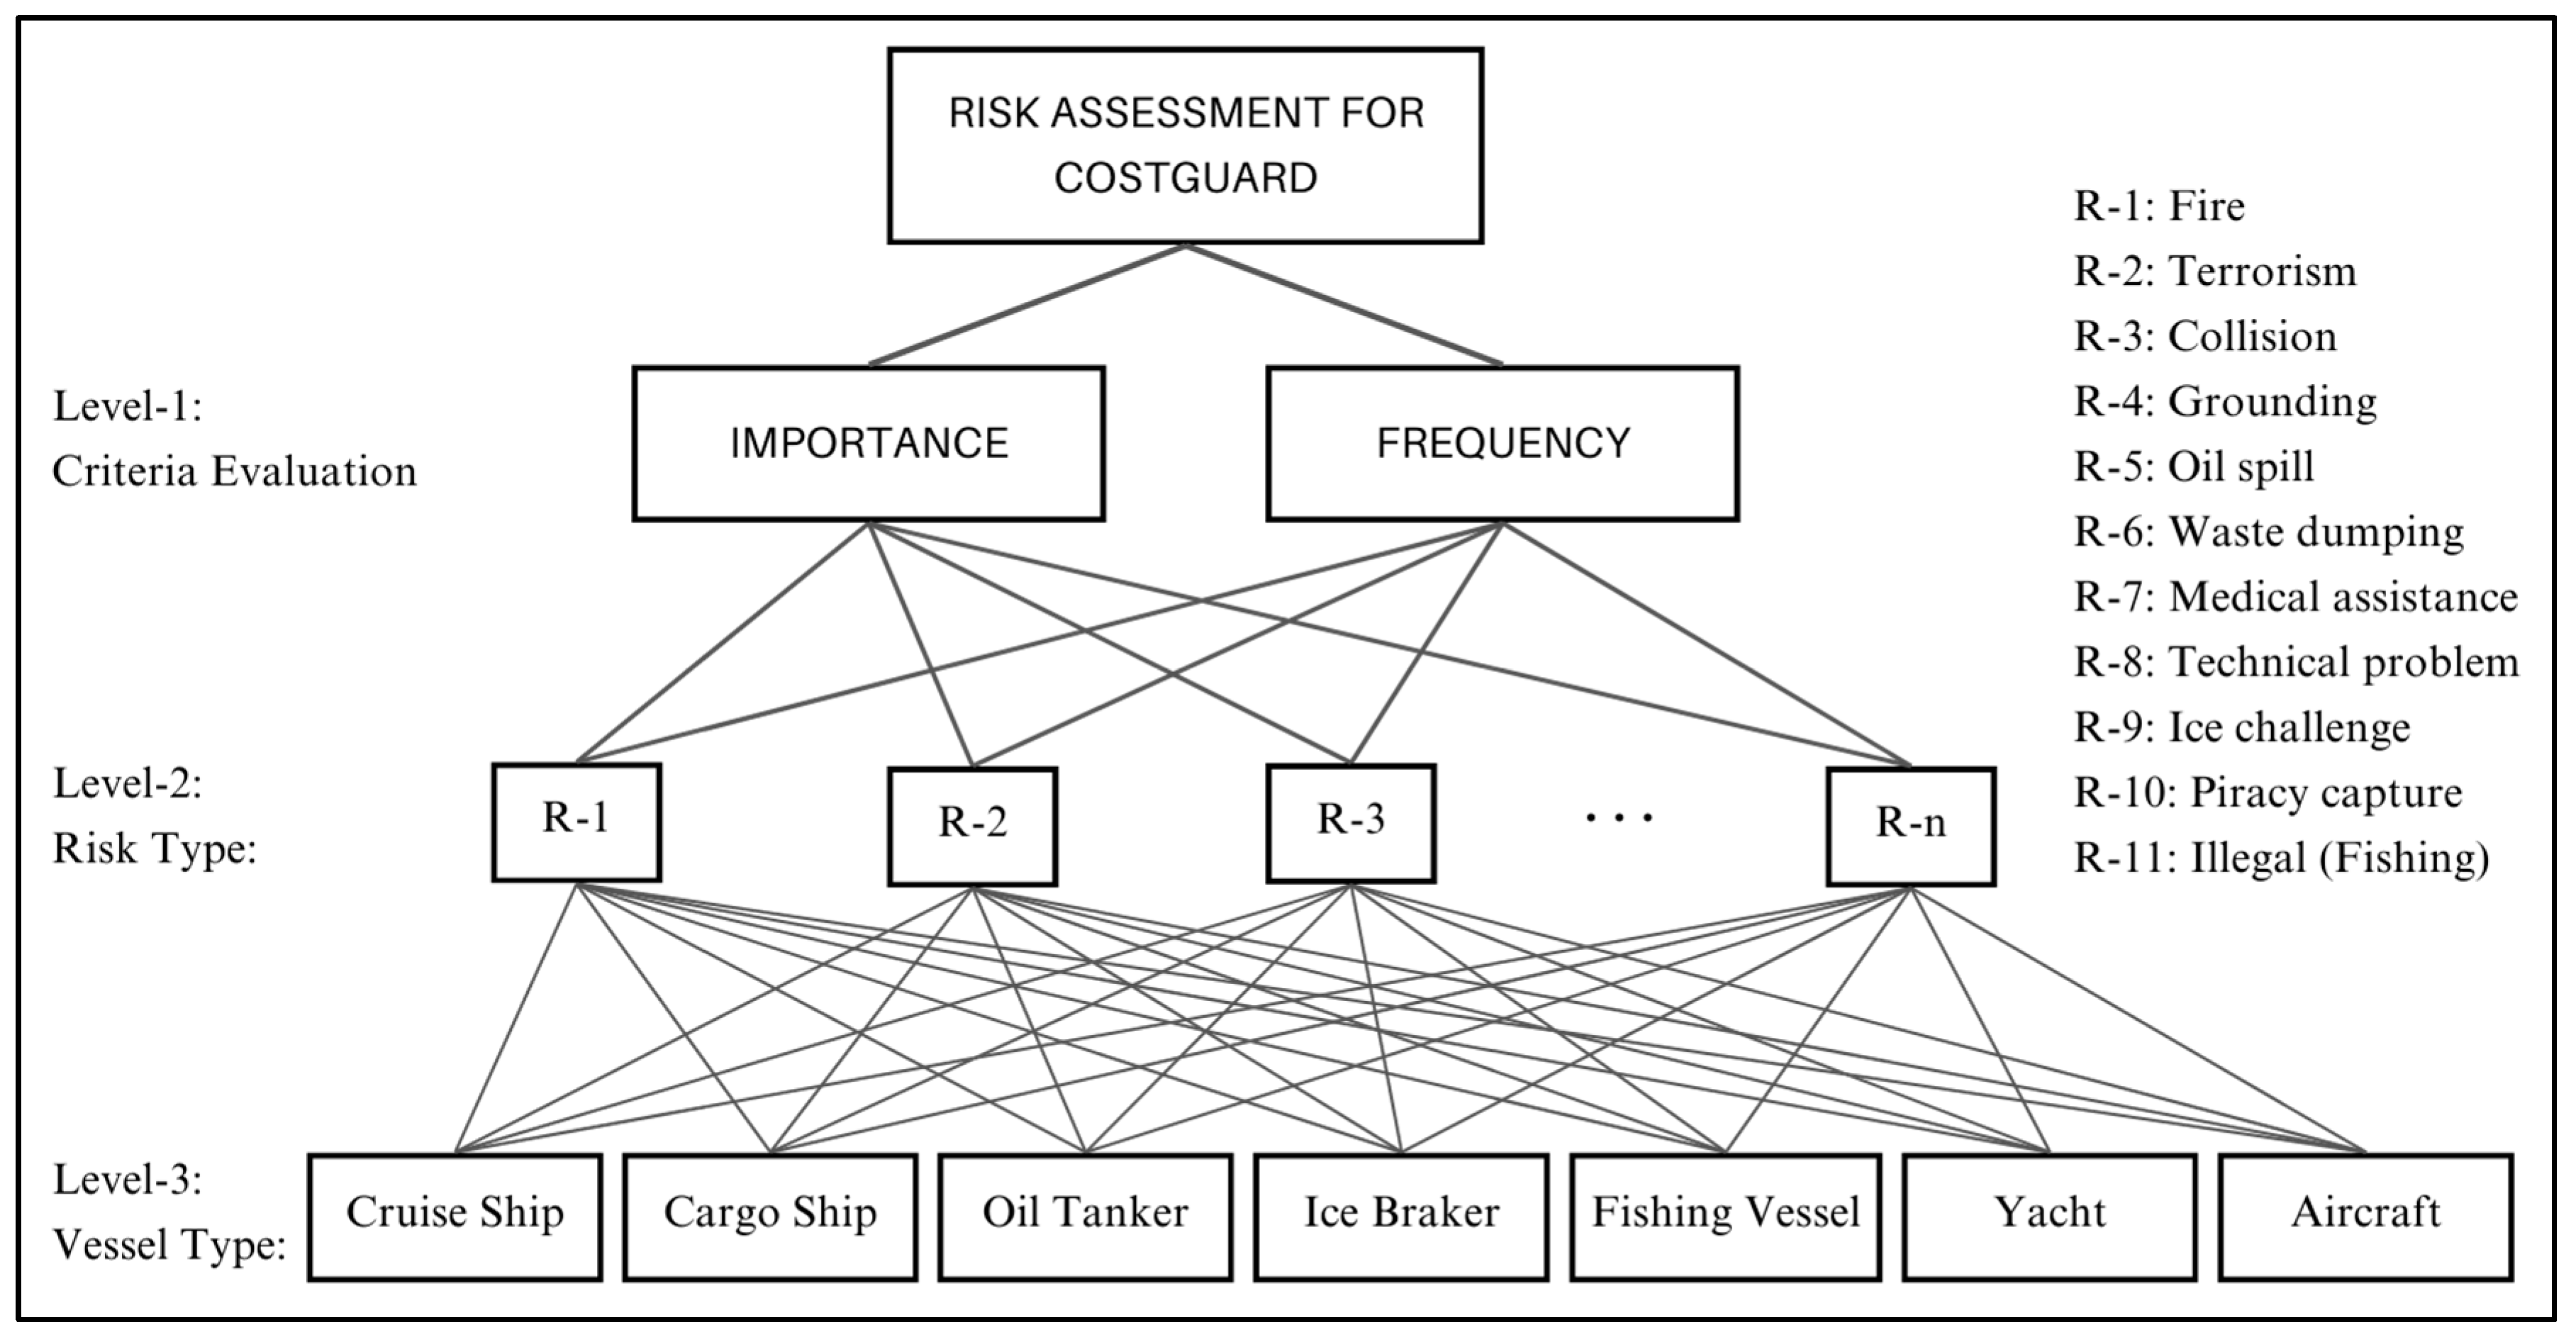
The data was then modelled using a method for prioritization called the Analytic Hierarchy Process (AHP), where a model was constructed, as shown in Figure 4.
Figure 4.
Multiple criteria ranking model based on AHP.
Such modelling approach serves three purposes: (i) it provides an overall picture of rankings of risks taking into consideration types of risk, types of vessels, severity, and frequency; (ii) it provides an ability to perform a sensitivity (what if) analysis, which provides a better and deeper understanding of different factors; and (iii) it acts like a roadmap, where AI solutions (services) can be targeted depending on importance of risks, types of vessels, and availability of data.
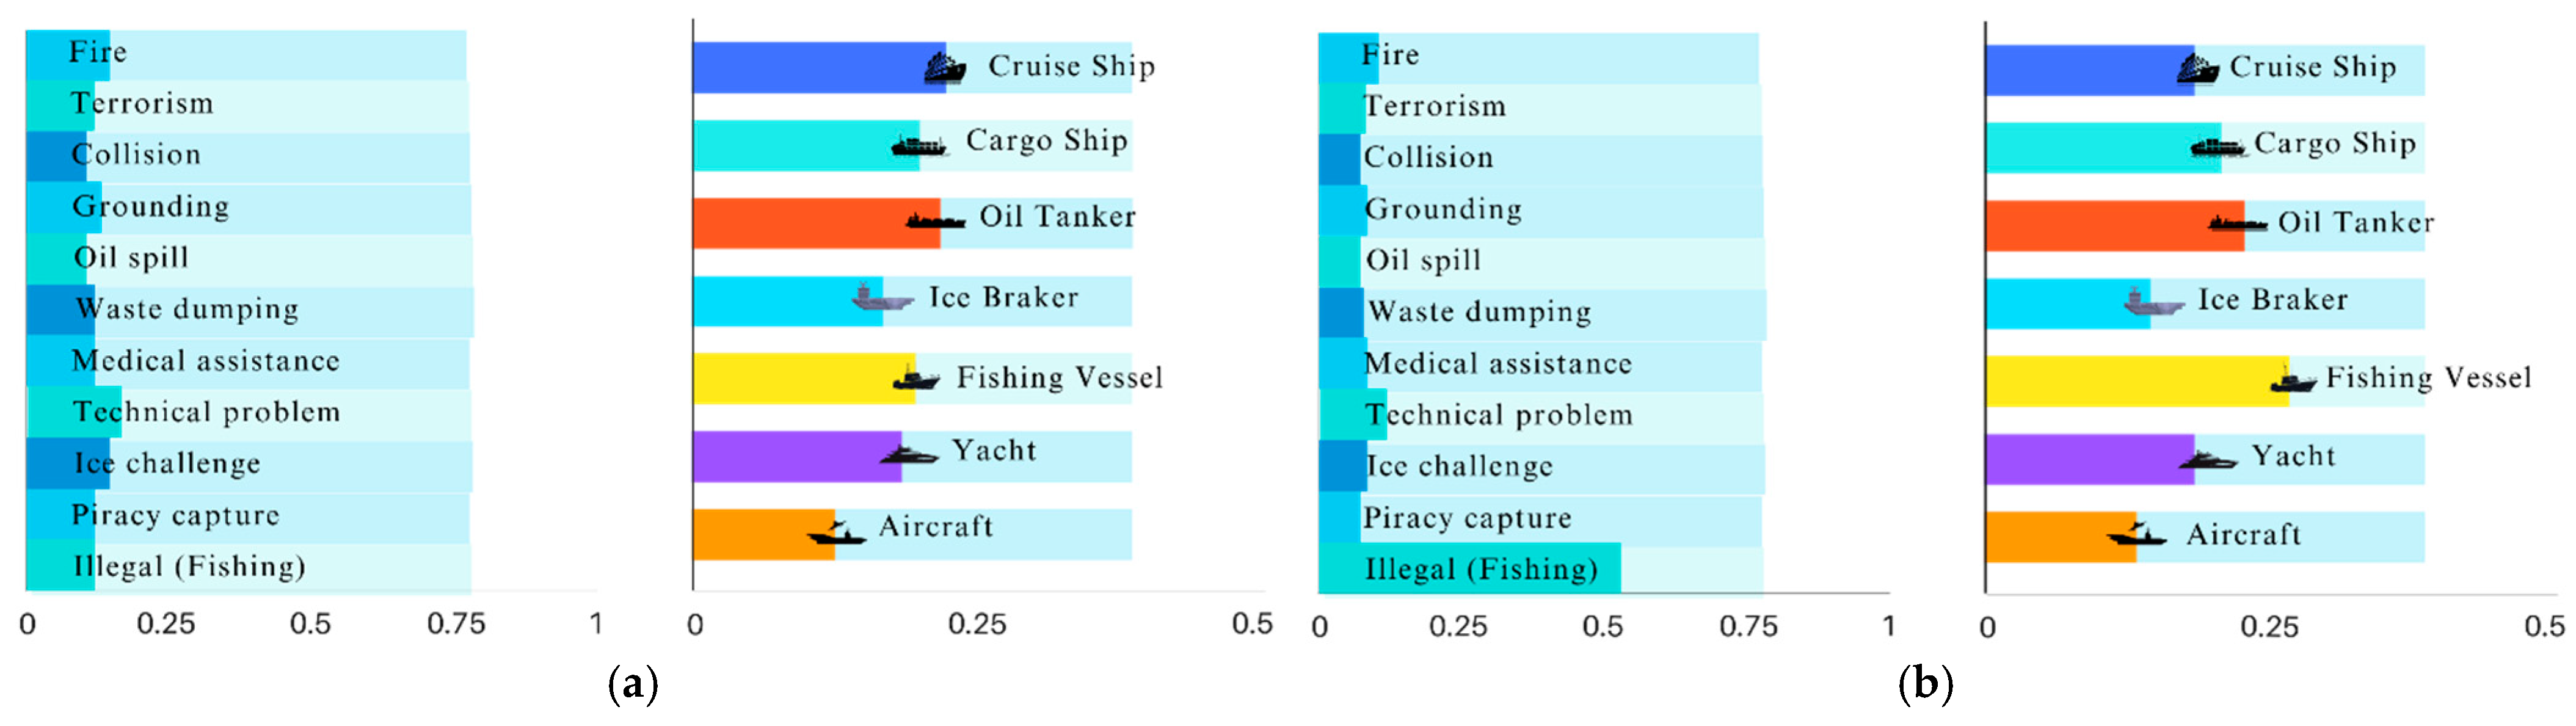
In order to demonstrate sensitivity analysis, Figure 5 shows ranking of risks with respect to level of importance on the left side, and accordingly, the ranking of the types of ships on the left side.
Figure 5.
Sensitivity analysis of risks: (a) original, (b) high importance of “Illegal Activity” risk.
The idea of sensitivity analysis is to show how the alternatives’ priorities change when the objectives’ priorities increase or decrease. For example, if we assign more weights (emphasis) on risk type, say ‘(k) illegal activity,’ then the types of vessels will be prioritized to have more weights allocated to fishing vessels. This is shown in the left and right sides of Figure 5.
It is clear from Figure 5 that if we assign more weight (emphasis) for risk type ‘(k) illegal activity,’ i.e., extending the bottom line on the left towards right, then the priorities of the types of vessels will be adjusted to reveal that in this case the highest priority of vessel type should be a ‘Fishing vessel.’ Note that such sensitivity analysis (what if) analysis can be performed for every type of risk.
Having studied and analyzed different risks by type of risk and type of vessels and in terms of both importance and frequency, this provides us with a better understanding of the needs of the end users. Also, the understanding is significantly enhanced when we use sensitivity (what if) analysis that can generate different rankings based in various scenarios.
So, as a summary, the inclusion of an MCDM method, such as AHP with its sensitivity analysis capability, provides the flexibility for the proposed framework to be extended to deal with additional other types of hazards if needed. The prioritization based on AHP is then integrated with the rule-based system using the hierarchical fuzzy tree structure, which will be explained in the next section.
3.5. Implementation of the Cascaded Hierarchical Fuzzy Tree Structure
Fuzzy logic provides a flexible approach to risk assessment, especially suited to the maritime domain where data can be uncertain or imprecise. Fuzzy logic departs from traditional binary logic by embracing a range of truth values, rather than merely true or false, which aligns better with human decision-making processes [25]. This is particularly relevant in dynamic and unpredictable environments such as the Arctic, where the conditions can change rapidly and are often only partially known or understood.
The developed Risk Index harnesses this capability to assess maritime risks, using fuzzy logic to process a variety of inputs, from AIS data to expert judgments on vessel types and accident severities. By applying fuzzy logic, the service can handle the ambiguity and vagueness inherent in real-world scenarios, providing a risk assessment that is robust and adaptable. The hierarchical fuzzy tree structure was selected for risk index computation due to its effective handling of numerous dynamic and static factors. The complexity of a fuzzy system escalates exponentially with the addition of inputs, leading to an increased number of fuzzy rules. Utilizing the fuzzy tree architecture described in this paper, the rule count remains minimal despite the extensive input range [26]. This strategy, therefore, guarantees that the service operates with optimal computational efficiency.
The following sections will dissect the specific components of the Fuzzy Inference Systems (FIS) utilized in this service. The analysis will cover the base model’s structure, which integrates various data sources and lays the groundwork for specialized assessments for grounding and collision risks. These use-cases illustrate the system’s comprehensive approach, blending data-driven insights with expert knowledge to safeguard maritime operations.
3.5.1. Base Model
The base model of the developed Risk Index focuses on evaluating maneuverability risks and visibility, which are key factors in maritime safety. The base model’s tree structure depicted in Figure 6 serves as the foundational framework for the comprehensive risk index, designed with modularity in mind to ensure seamless integration into various risk index calculations. It synthesizes static AIS data about vessel characteristics and dynamic weather data to assess the capability of a vessel to navigate safely under various conditions.
Figure 6.
Base model fuzzy tree structure.
The maneuverability assessment is performed using a Fuzzy Inference System (FIS) that incorporates the length and net tonnage of the vessel to determine stability risks, while also considering the wind direction relative to the vessel’s course and wind speed to evaluate the overall wind risk, as depicted in Figure 6.
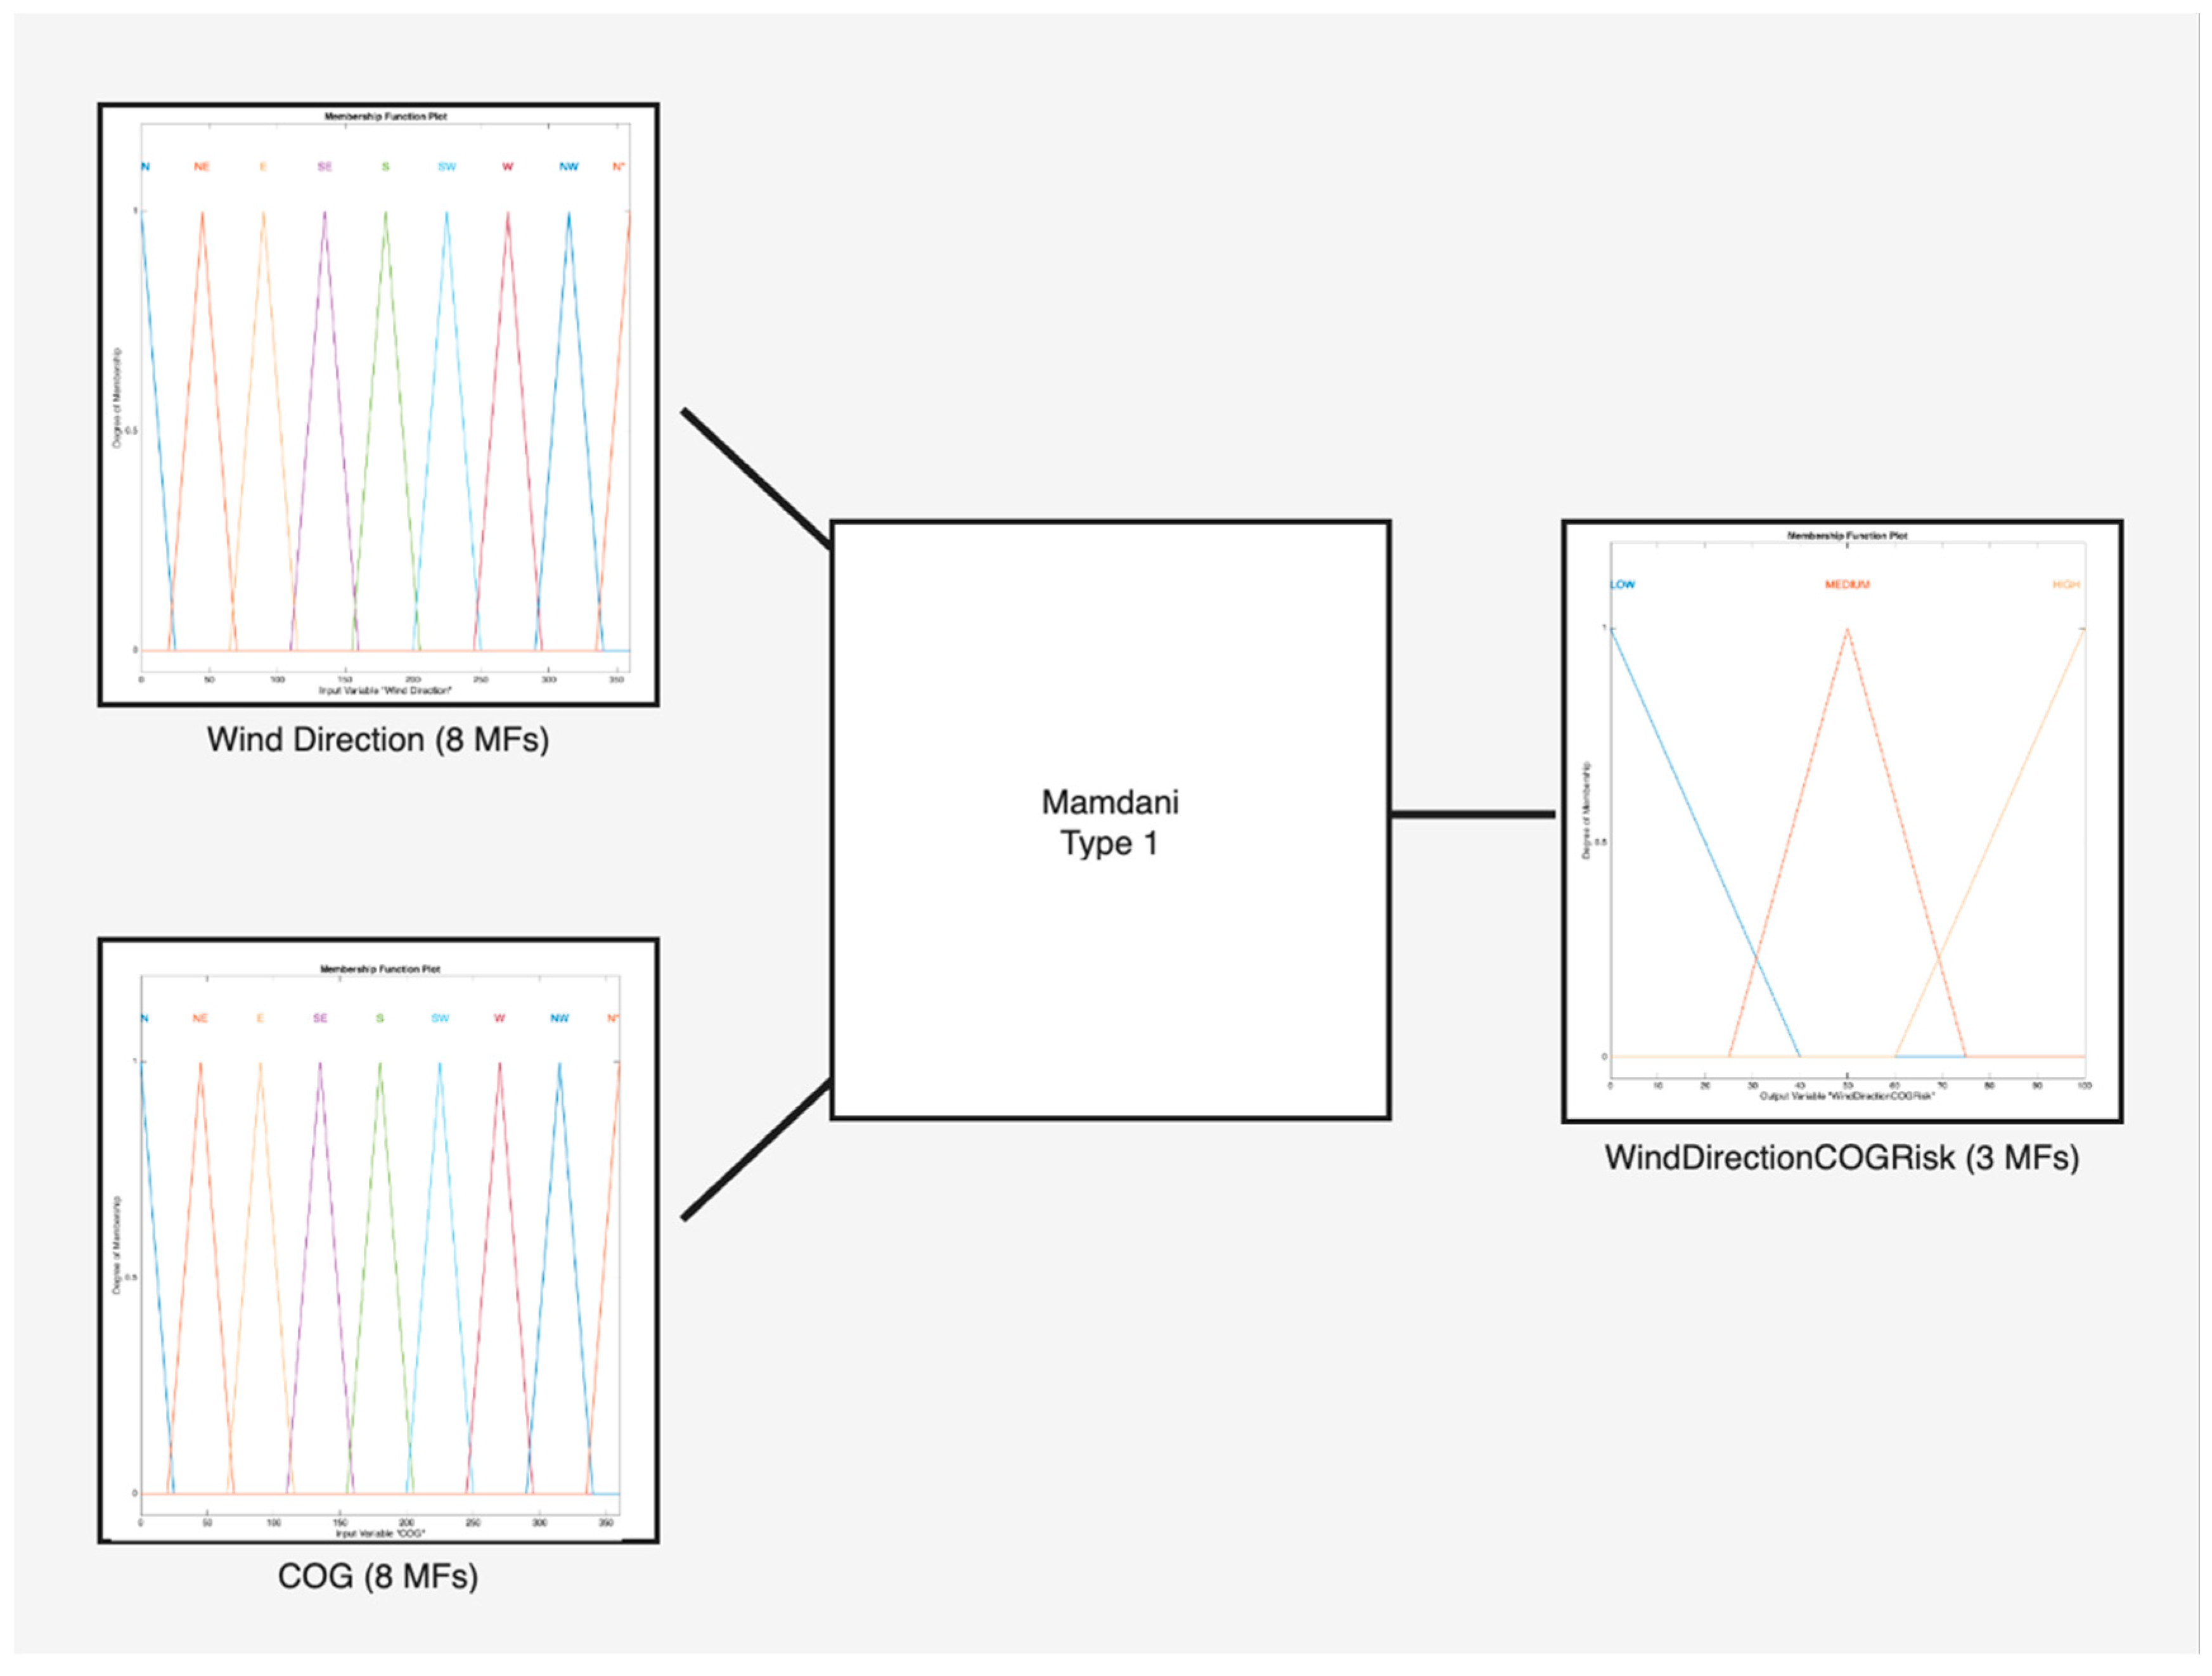
At the core of the maneuverability assessment lies the Wind Direction Risk fuzzy system. This system evaluates the interplay between the vessel’s course over ground (COG) and wind direction, crucial factors that influence a ship’s navigational control. By utilizing eight distinct membership functions that represent the compass points, as depicted in the Figure 7, the system can precisely categorize the wind direction in relation to the vessel’s COG. A comprehensive set of 64 fuzzy rules allows the system to cover every potential combination of wind direction and COG.
Figure 7.
Wind Direction—COG fuzzy system.
The Wind Risk FIS receives inputs from the Wind Direction Risk FIS output and the wind gust values to assess their combined effect on navigational safety. The system acknowledges the critical role of wind gusts in maritime navigation, recognizing that gusts can significantly impact a vessel’s handling due to their sporadic and powerful nature. Unlike average wind speeds, which a vessel may be equipped to manage, gusts can present sudden challenges to stability and course maintenance. The Wind Risk FIS aims to quantify this impact, providing a crucial layer of analysis for the service’s comprehensive risk evaluation.
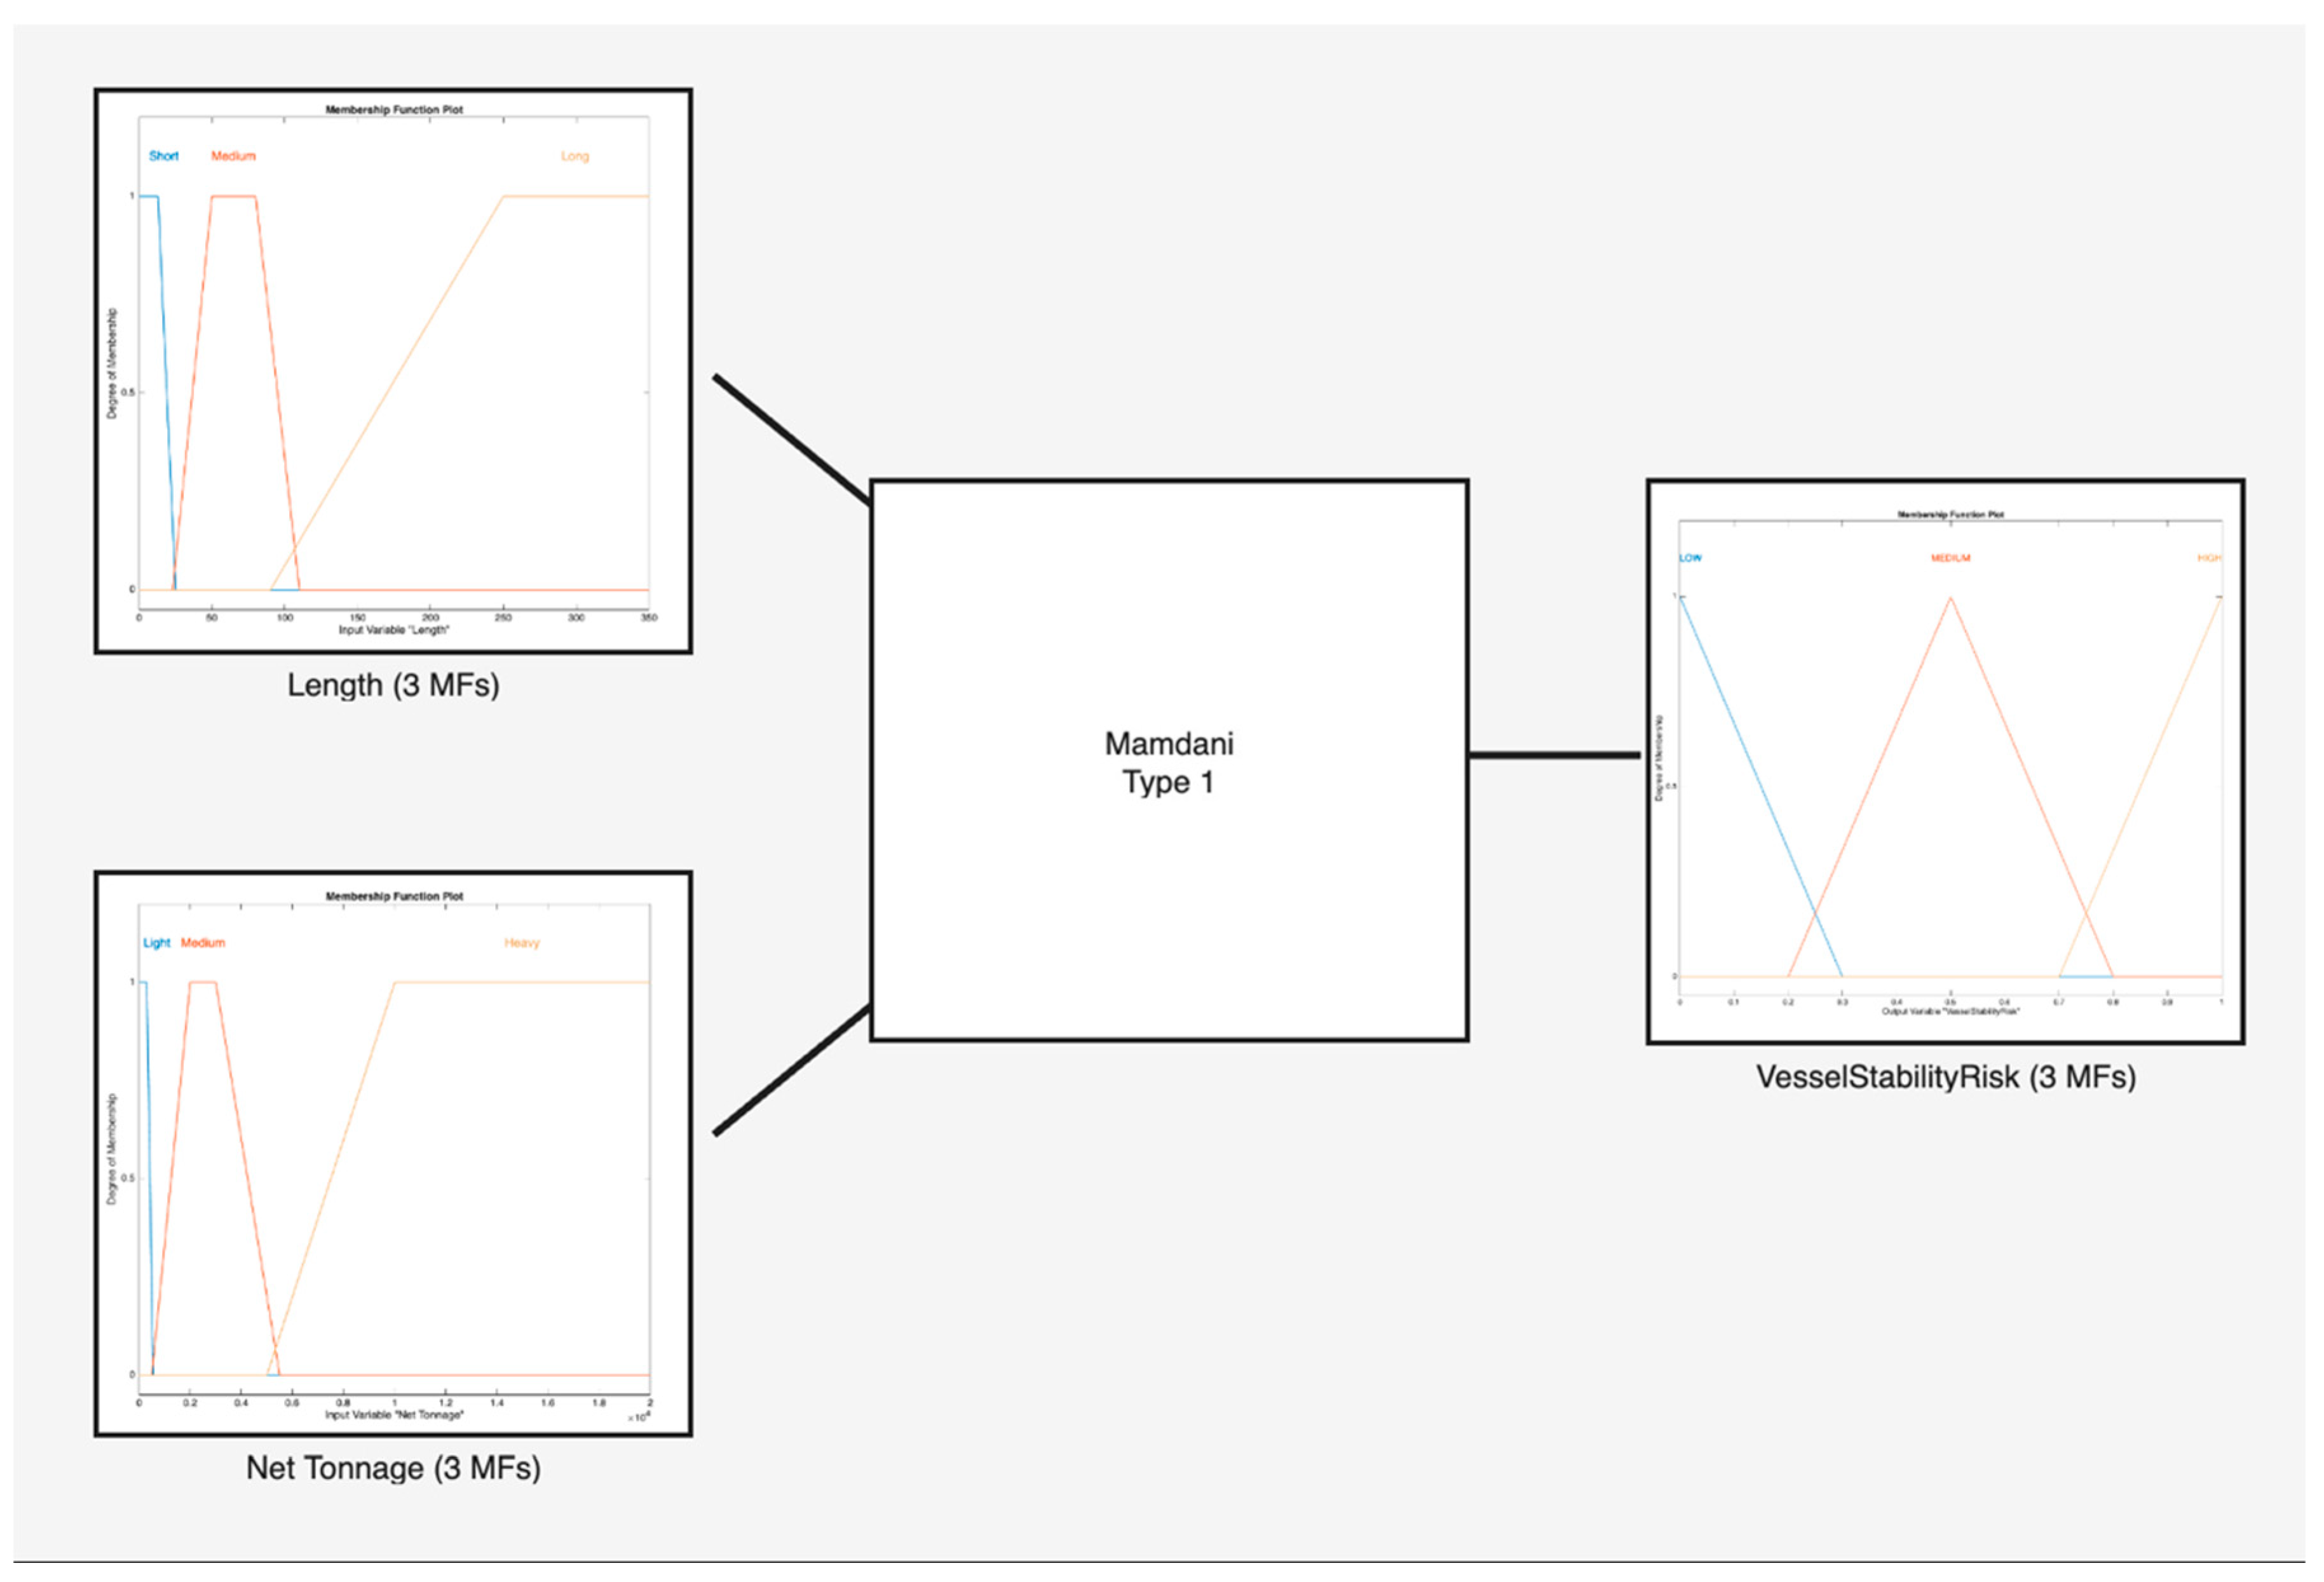
Before reaching the Maneuverability FIS, there is the Vessel Stability FIS, which incorporates static data of the vessel and, in particular, the length and the net tonnage of the vessel. In Figure 8, the Vessel Stability FIS is depicted with the membership function of vessel length, net tonnage, and vessel stability risk.
Figure 8.
Vessel Stability Fuzzy System.
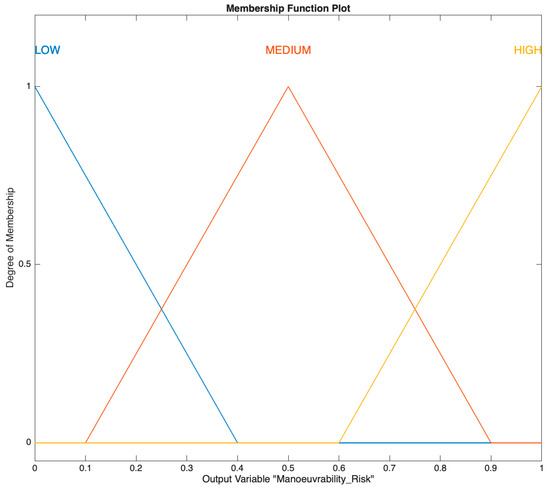
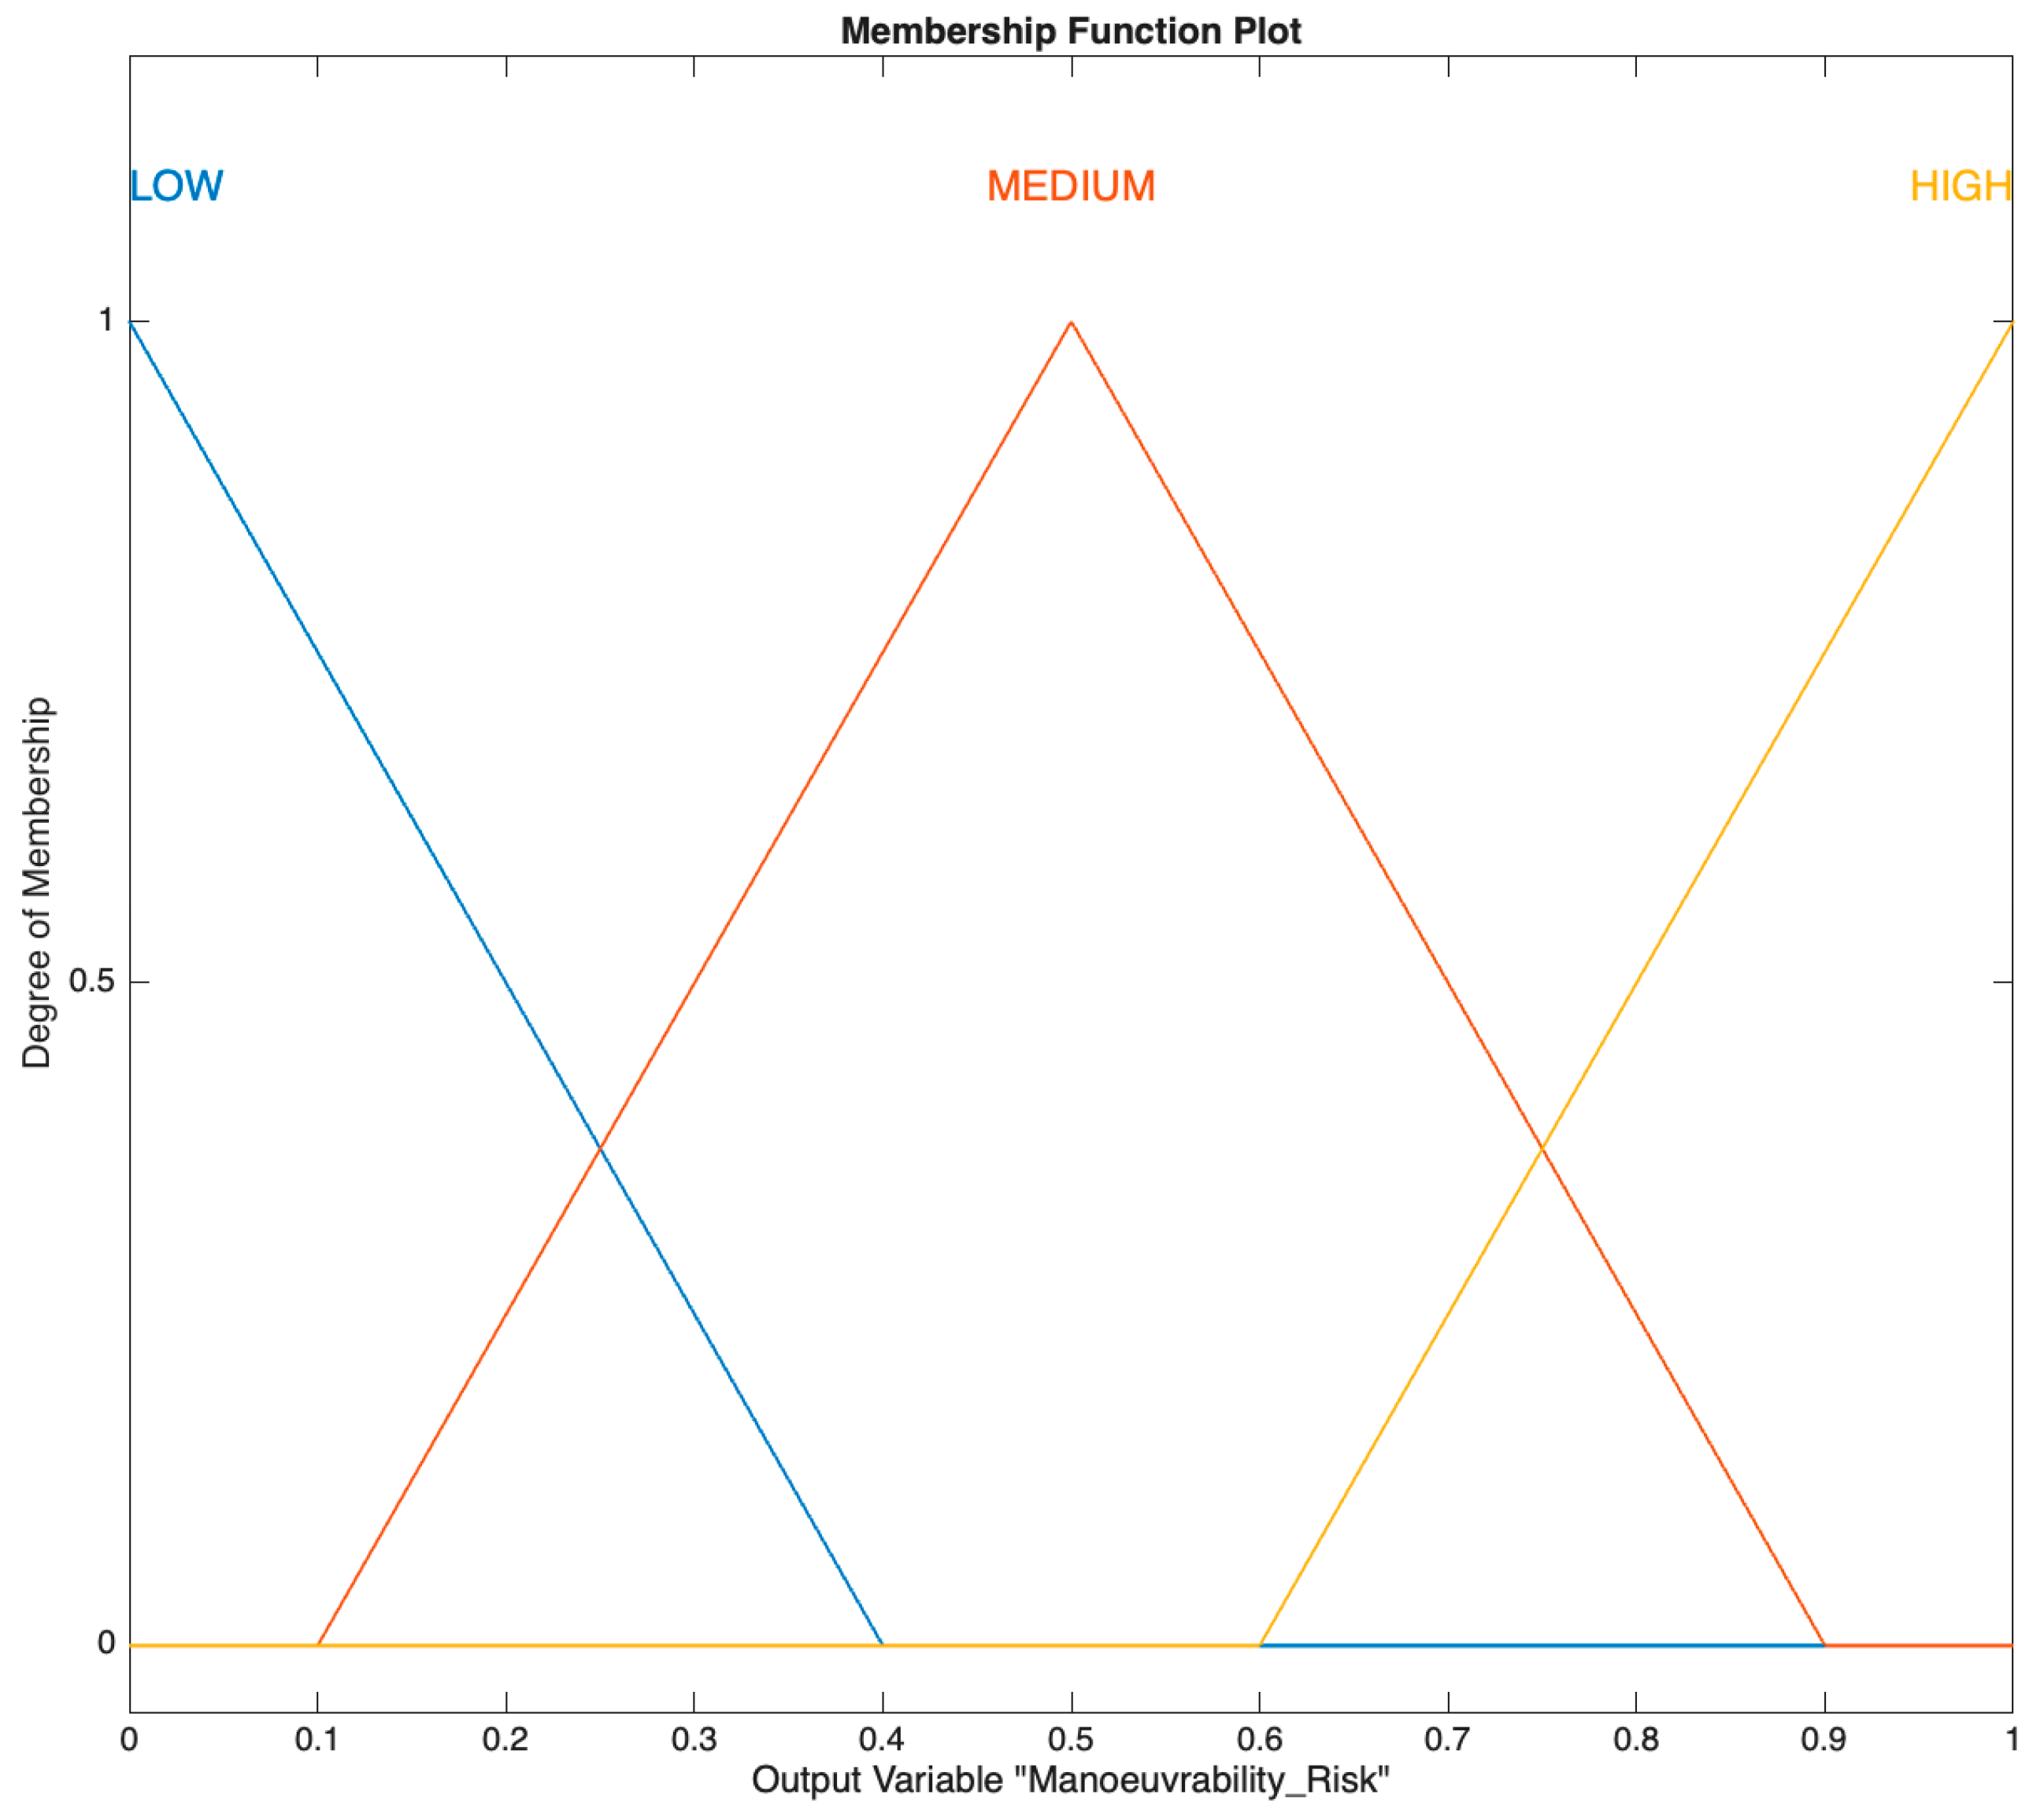
Progressing further in the base model’s hierarchy, the Maneuverability Risk Fuzzy Inference System (FIS) integrates the outcomes of the Wind Risk FIS and the Vessel Stability FIS to assess a vessel’s navigational capability. The output of this FIS is illustrated in the membership function depicted in Figure 9, which visualizes how different levels of wind and stability risks combine to inform the overall maneuverability risk.
Figure 9.
Maneuverability risk membership function.
3.5.2. Collision Use-Case
The collision use-case in the Risk Index focuses on spotting potential collision risks among vessels. In addition to the base model mentioned earlier it uses a dedicated fuzzy tree structure that is designed to process dynamic interactions between vessels and their immediate environment. By evaluating factors such as vessel proximity, relative speed, and course, the system provides a nuanced assessment of collision probability, aiding in the prevention of maritime accidents. This section will explore the structure and functionality of the collision use-case’s fuzzy systems and their integration into the overall risk assessment framework.
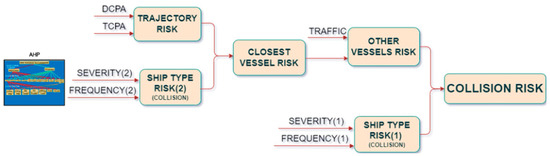
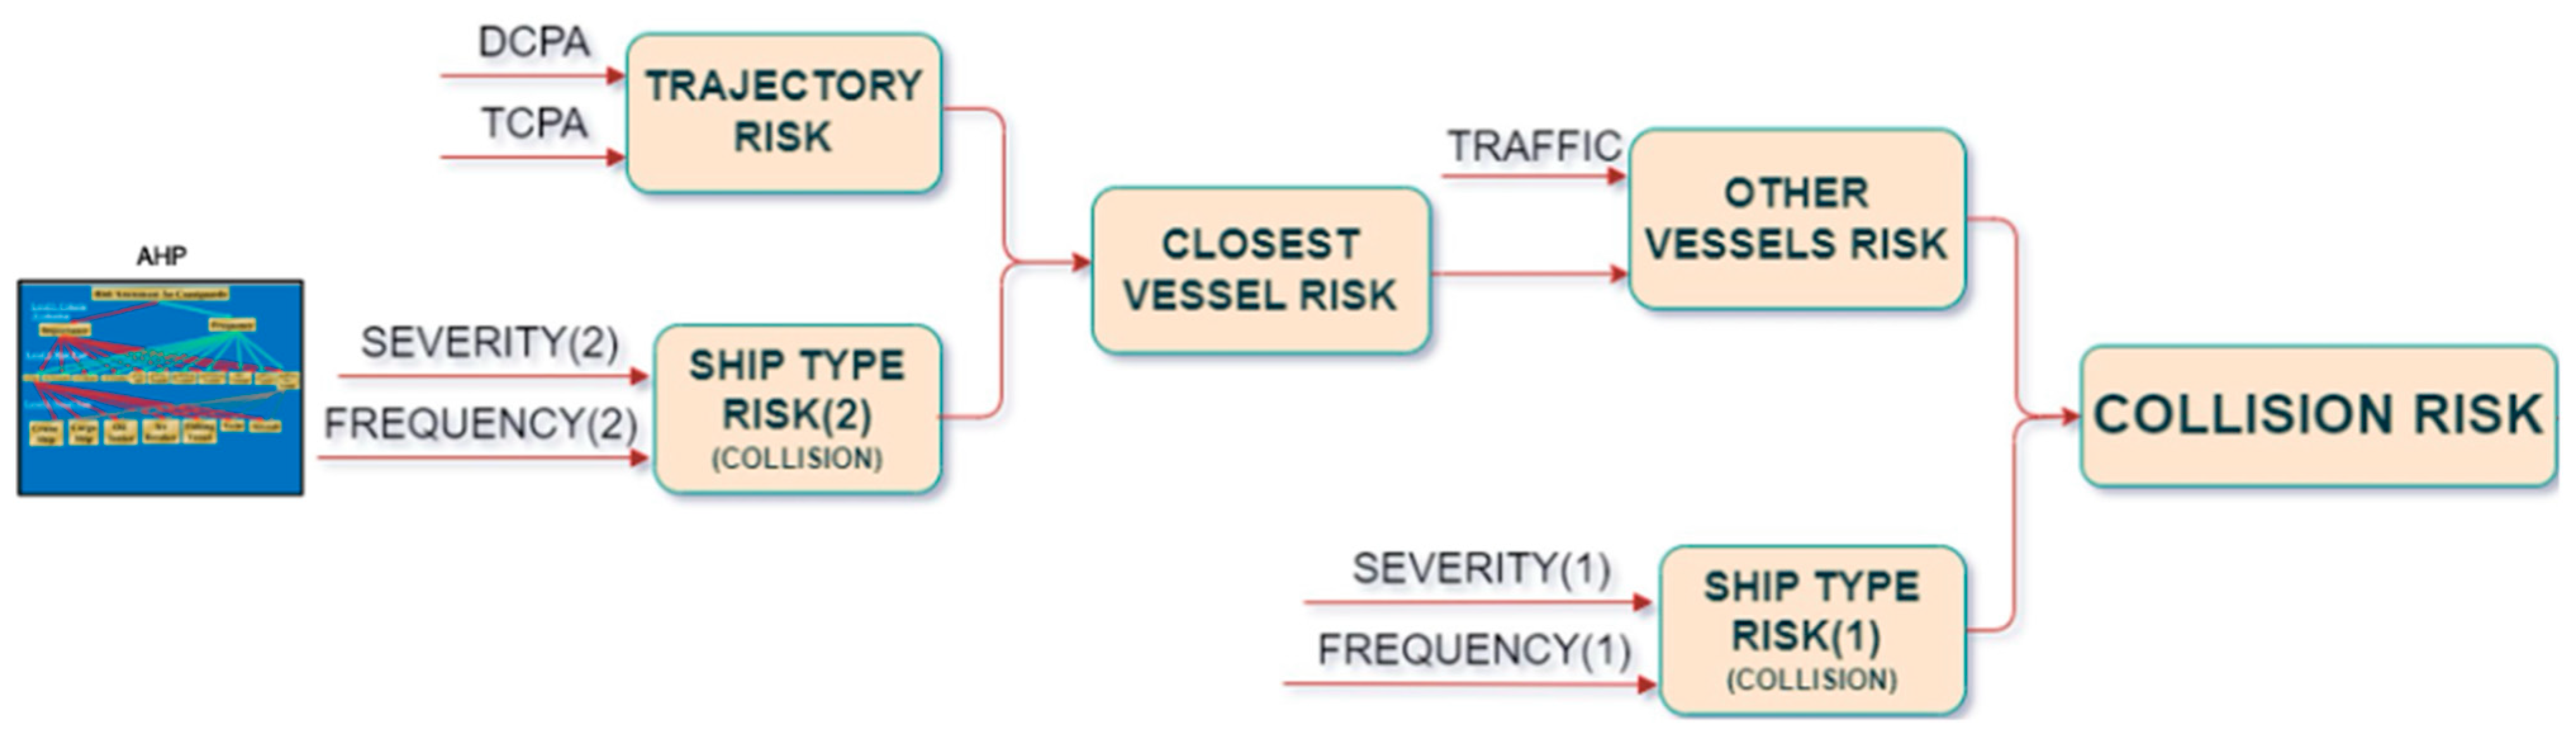
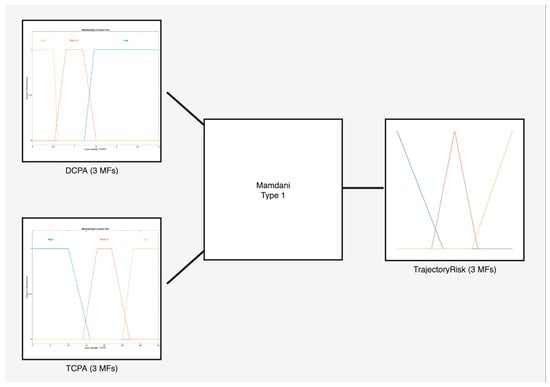
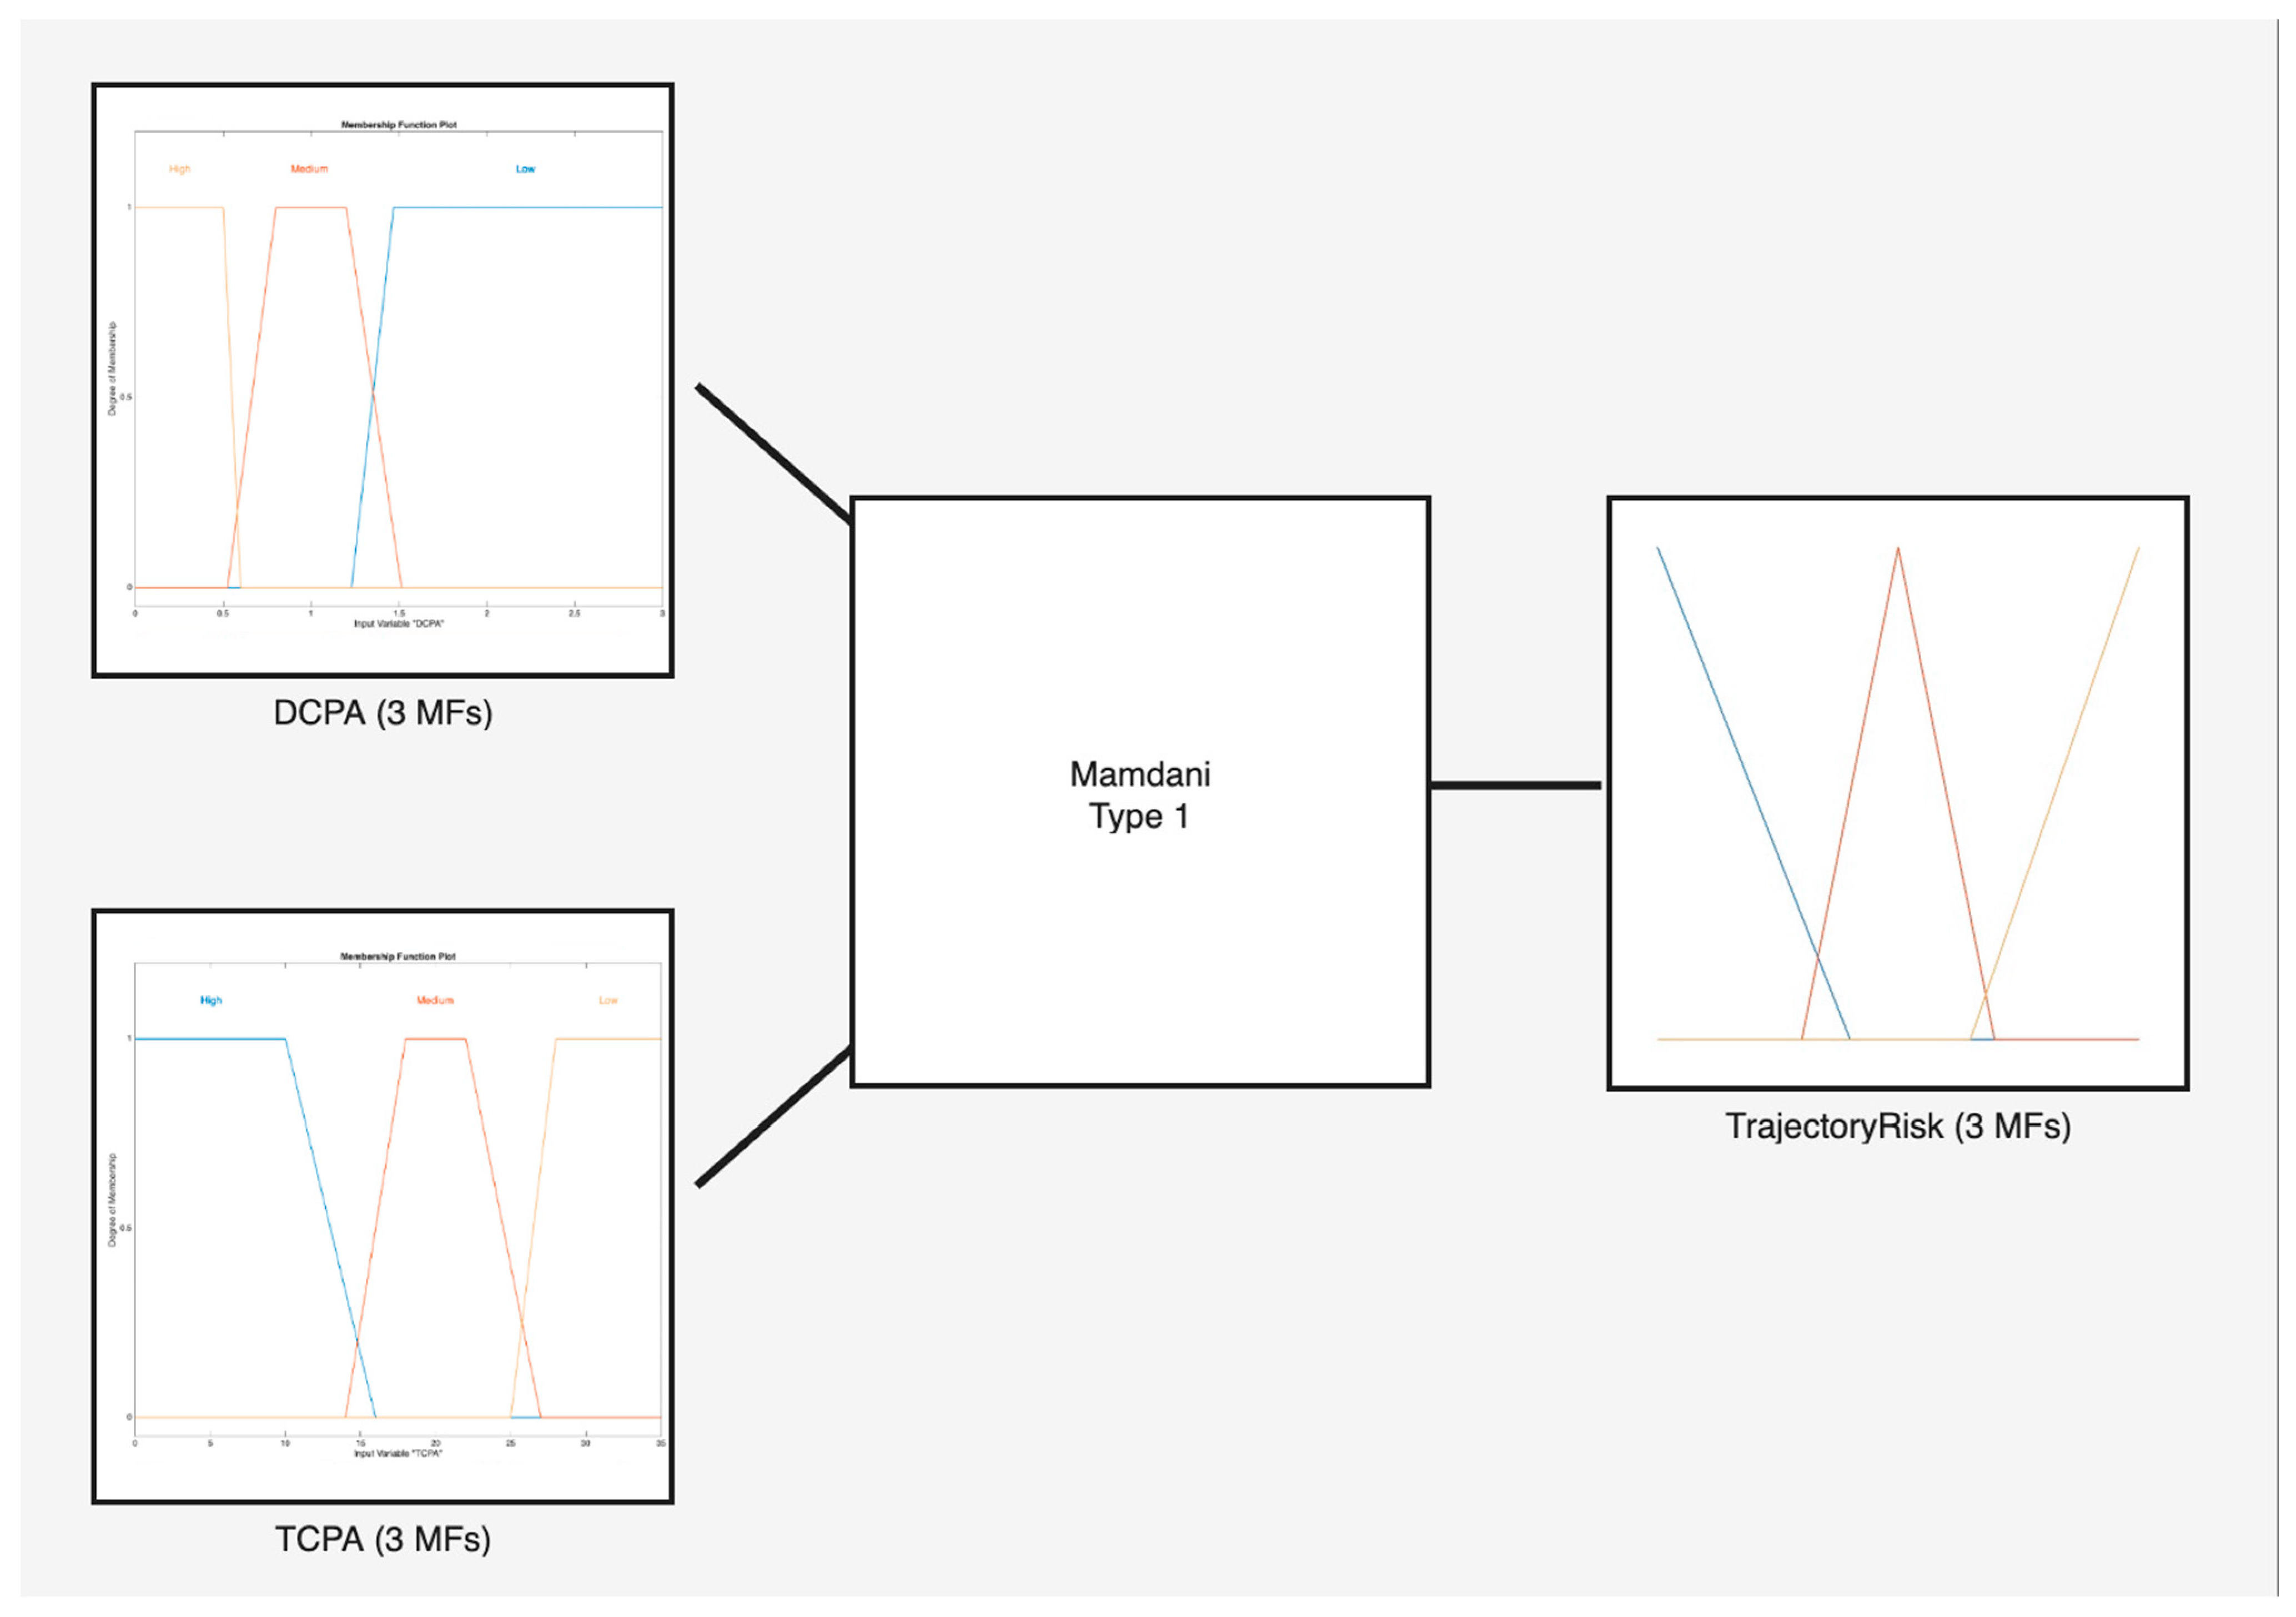
The collision tree structure consists of six interconnected fuzzy inference systems (FIS) as depicted in Figure 10. Starting with the Trajectory Risk FIS, it has two very crucial inputs for the system, the DCPA and TCPA, which are the distance and time to the closest point of approach, respectively, and are the main parameters that estimate how likely it is for two vessels to collide with each other; the membership functions of each input can be seen in Figure 11, where High, Medium and Low are the linguistic terms that represent the level of risk of each value. For example, a High Risk of DCPA is a value less than 0.6 nautical miles, and a High Risk of TCPA is a value of less than 16 s but greater than 0 s.
Figure 10.
Collision use-case fuzzy tree structure.
Figure 11.
Trajectory Risk Fuzzy System.
Threshold selection was established in consultation with coastguard experts and calibrated using historical incident scenarios. A DCPA value below 0.6 nm is generally regarded as representing insufficient separation in congested maritime environments. The TCPA threshold reflects situations requiring immediate navigational intervention. These values should not be considered universal operational limits, but rather calibration parameters for the present Arctic risk-index application.
The membership functions and fuzzy rules were designed with expert knowledge elicited from coastguards. The fuzzy rules of the Trajectory Risk FIS are listed in Table 4. Membership functions were designed through a structured elicitation process involving coastguard experts, maritime operators and project stakeholders. Experts participated in workshops where operational thresholds corresponding to low-, medium-, and high-risk conditions were identified. These thresholds were subsequently translated into triangular and trapezoidal membership functions in MATLAB Ver 2024b. Fuzzy rules were then developed collaboratively and iteratively reviewed to ensure consistency with operational maritime practice.
Table 4.
Fuzzy rules of trajectory risk FIS.
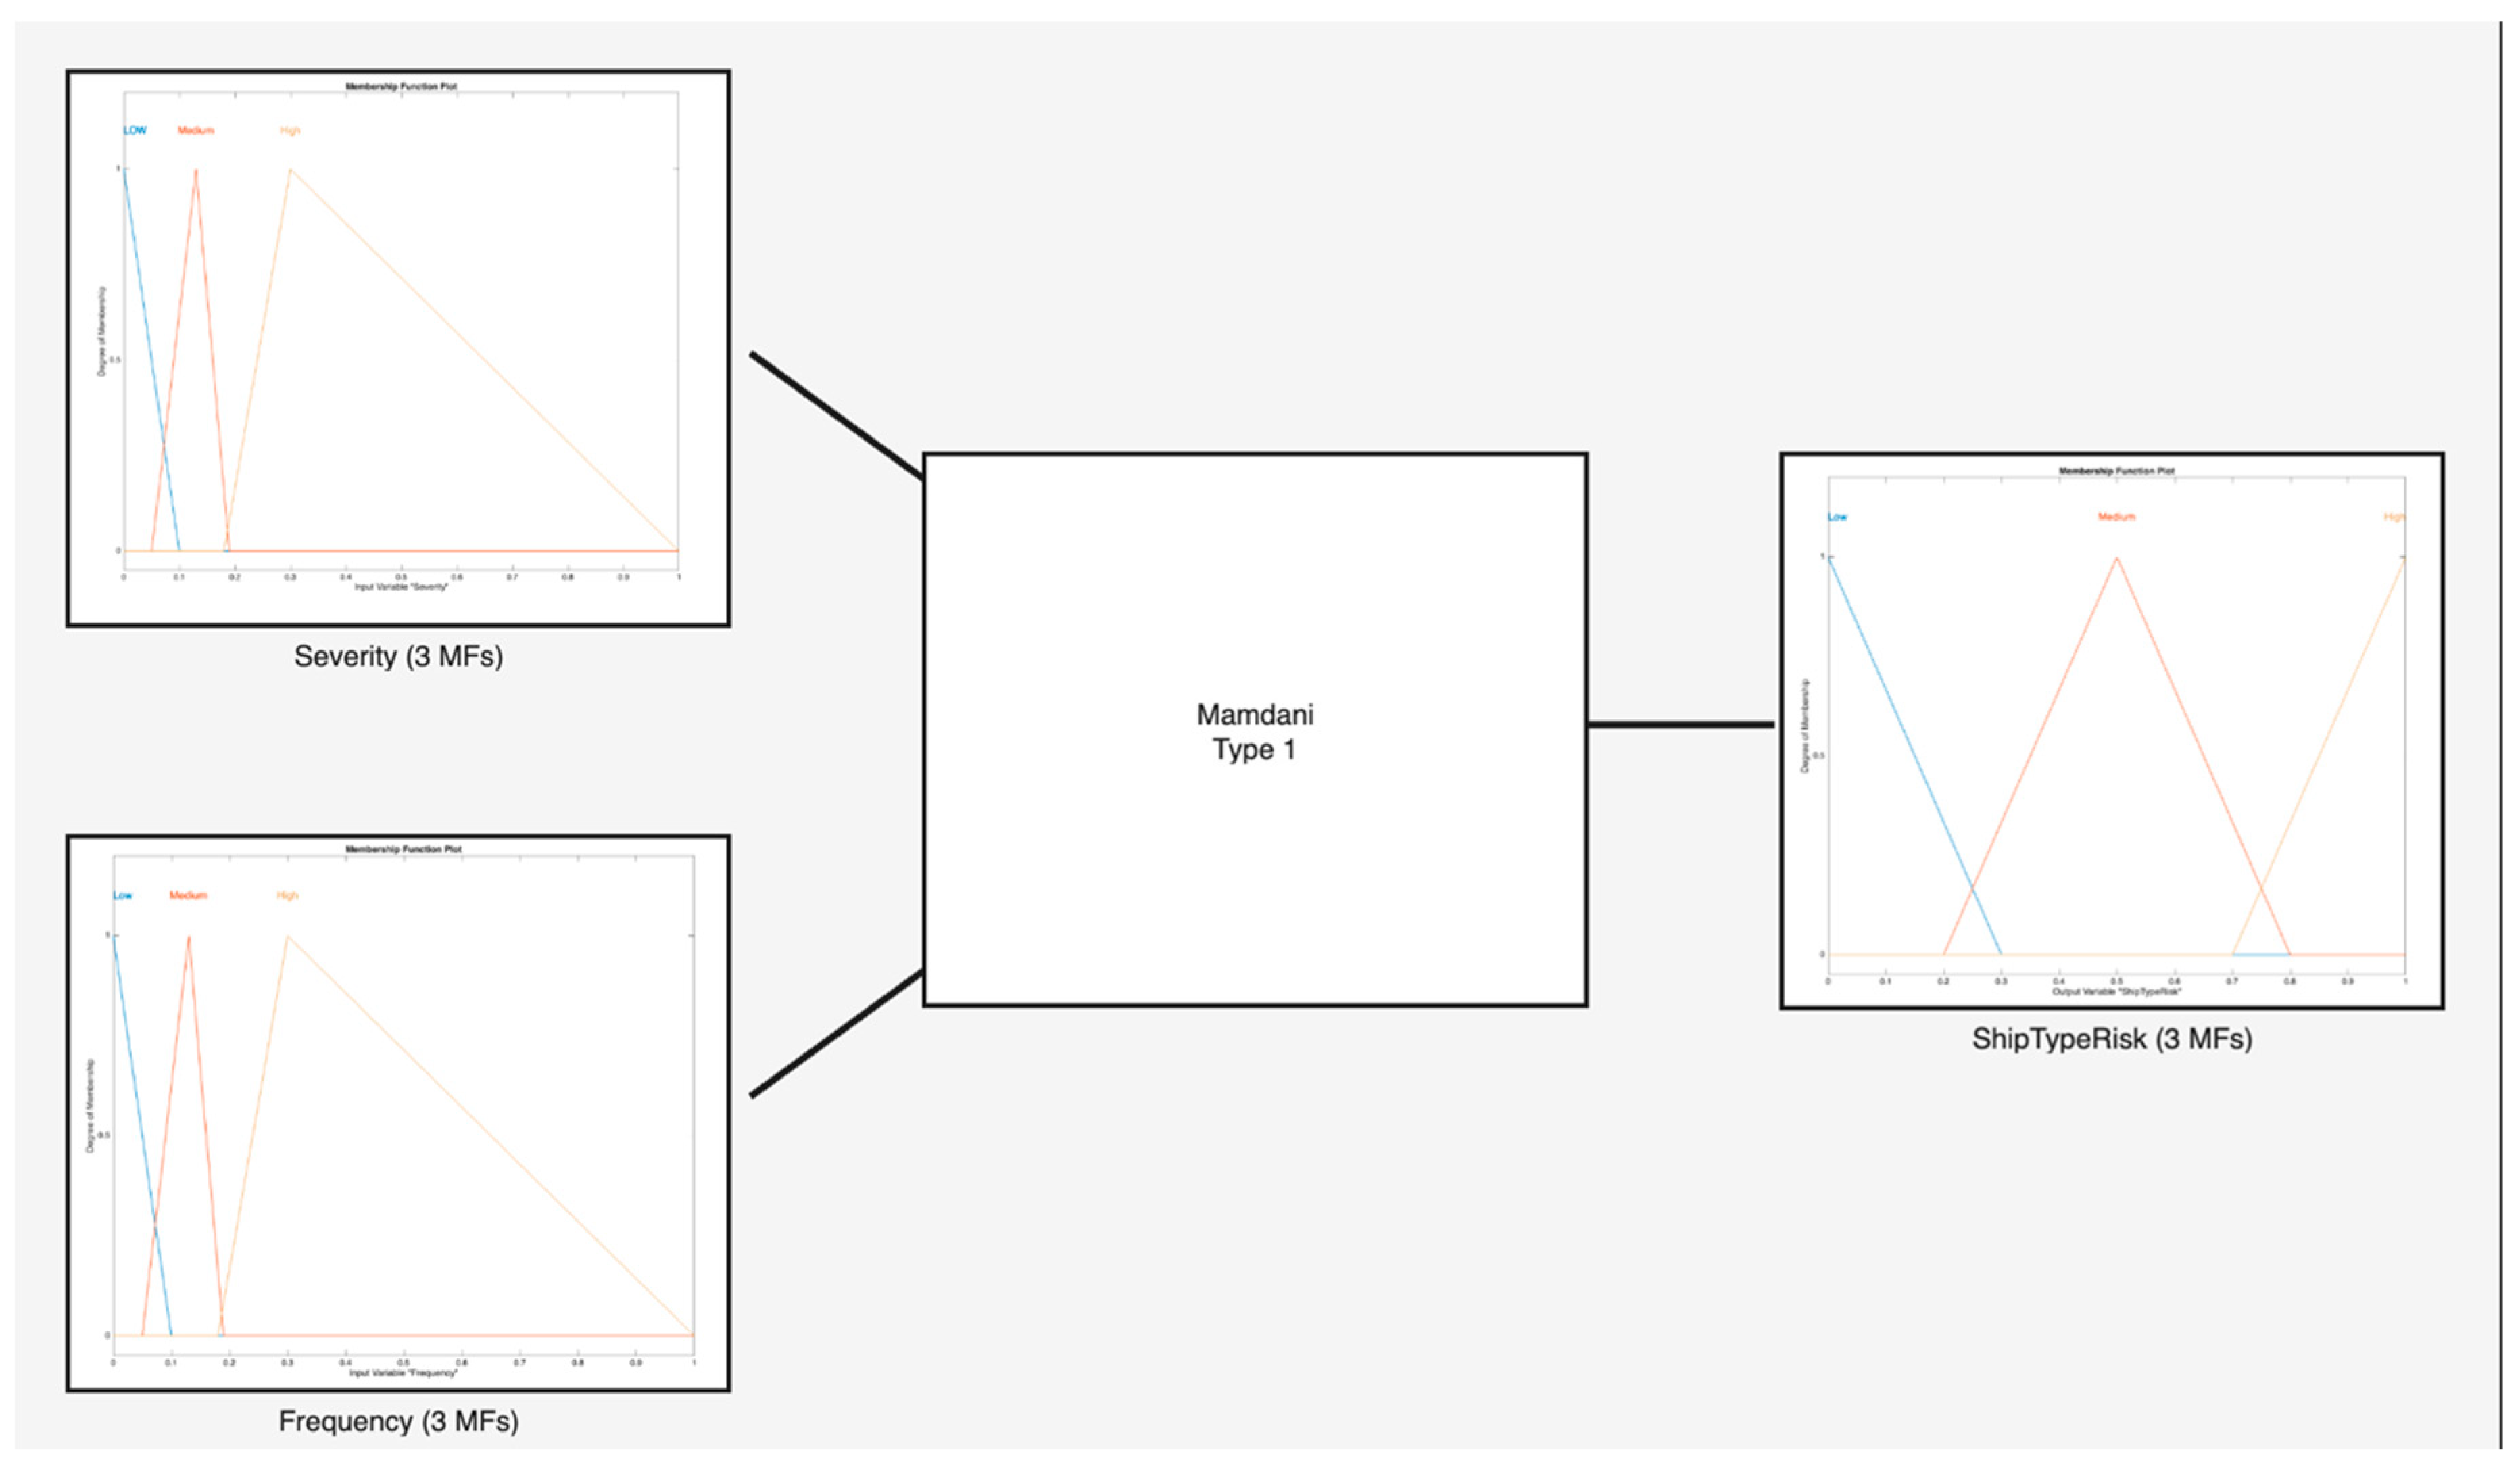
Continuing with the analysis, we examine the Ship Type B Risk Fuzzy Inference System (FIS), which incorporates two inputs: the severity and the frequency of collision incidents specific ship type of the target vessel. The data for this fuzzy system were derived through the Analytic Hierarchy Process, as detailed in a previous section, and were gathered via a questionnaire completed by coastguards. Table 5 and Table 6 display the assigned weights for the severity and frequency of collision incidents respective to each ship type. It is these data that were instrumental in constructing the membership functions for the fuzzy system.
Table 5.
Severity (consequence) of collision accidents for ship types.
Table 6.
Frequency (probability) of collision accidents for ship types.
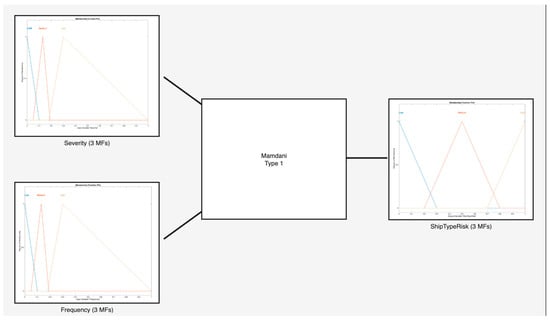
The membership functions relevant to Ship Type Risk B are illustrated in Figure 12 as long as the fuzzy system itself, showcasing the allocation of the weights from the above tables into degrees of membership denoted by the linguistic terms ‘Low,’ ‘Medium,’ and ‘High’ risk.
Figure 12.
Ship Type Risk FIS.
Continuing, the Closest Vessel Fuzzy Inference System (FIS) integrates the outputs from the Trajectory FIS with those from the Ship Type Risk B FIS. This fuzzy system refines the evaluation of collision risk by considering critical factors such as the speed, course, position, and type of the ship closest to the current vessel.
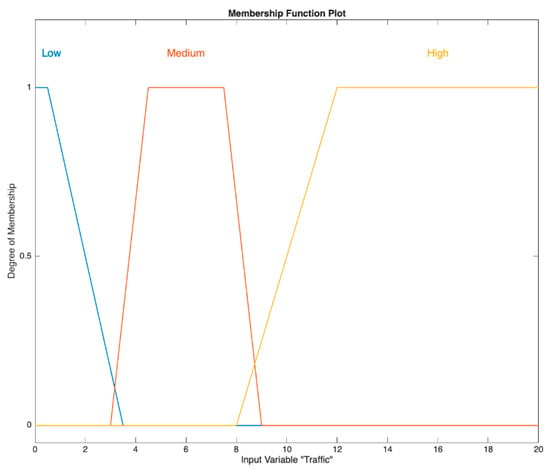
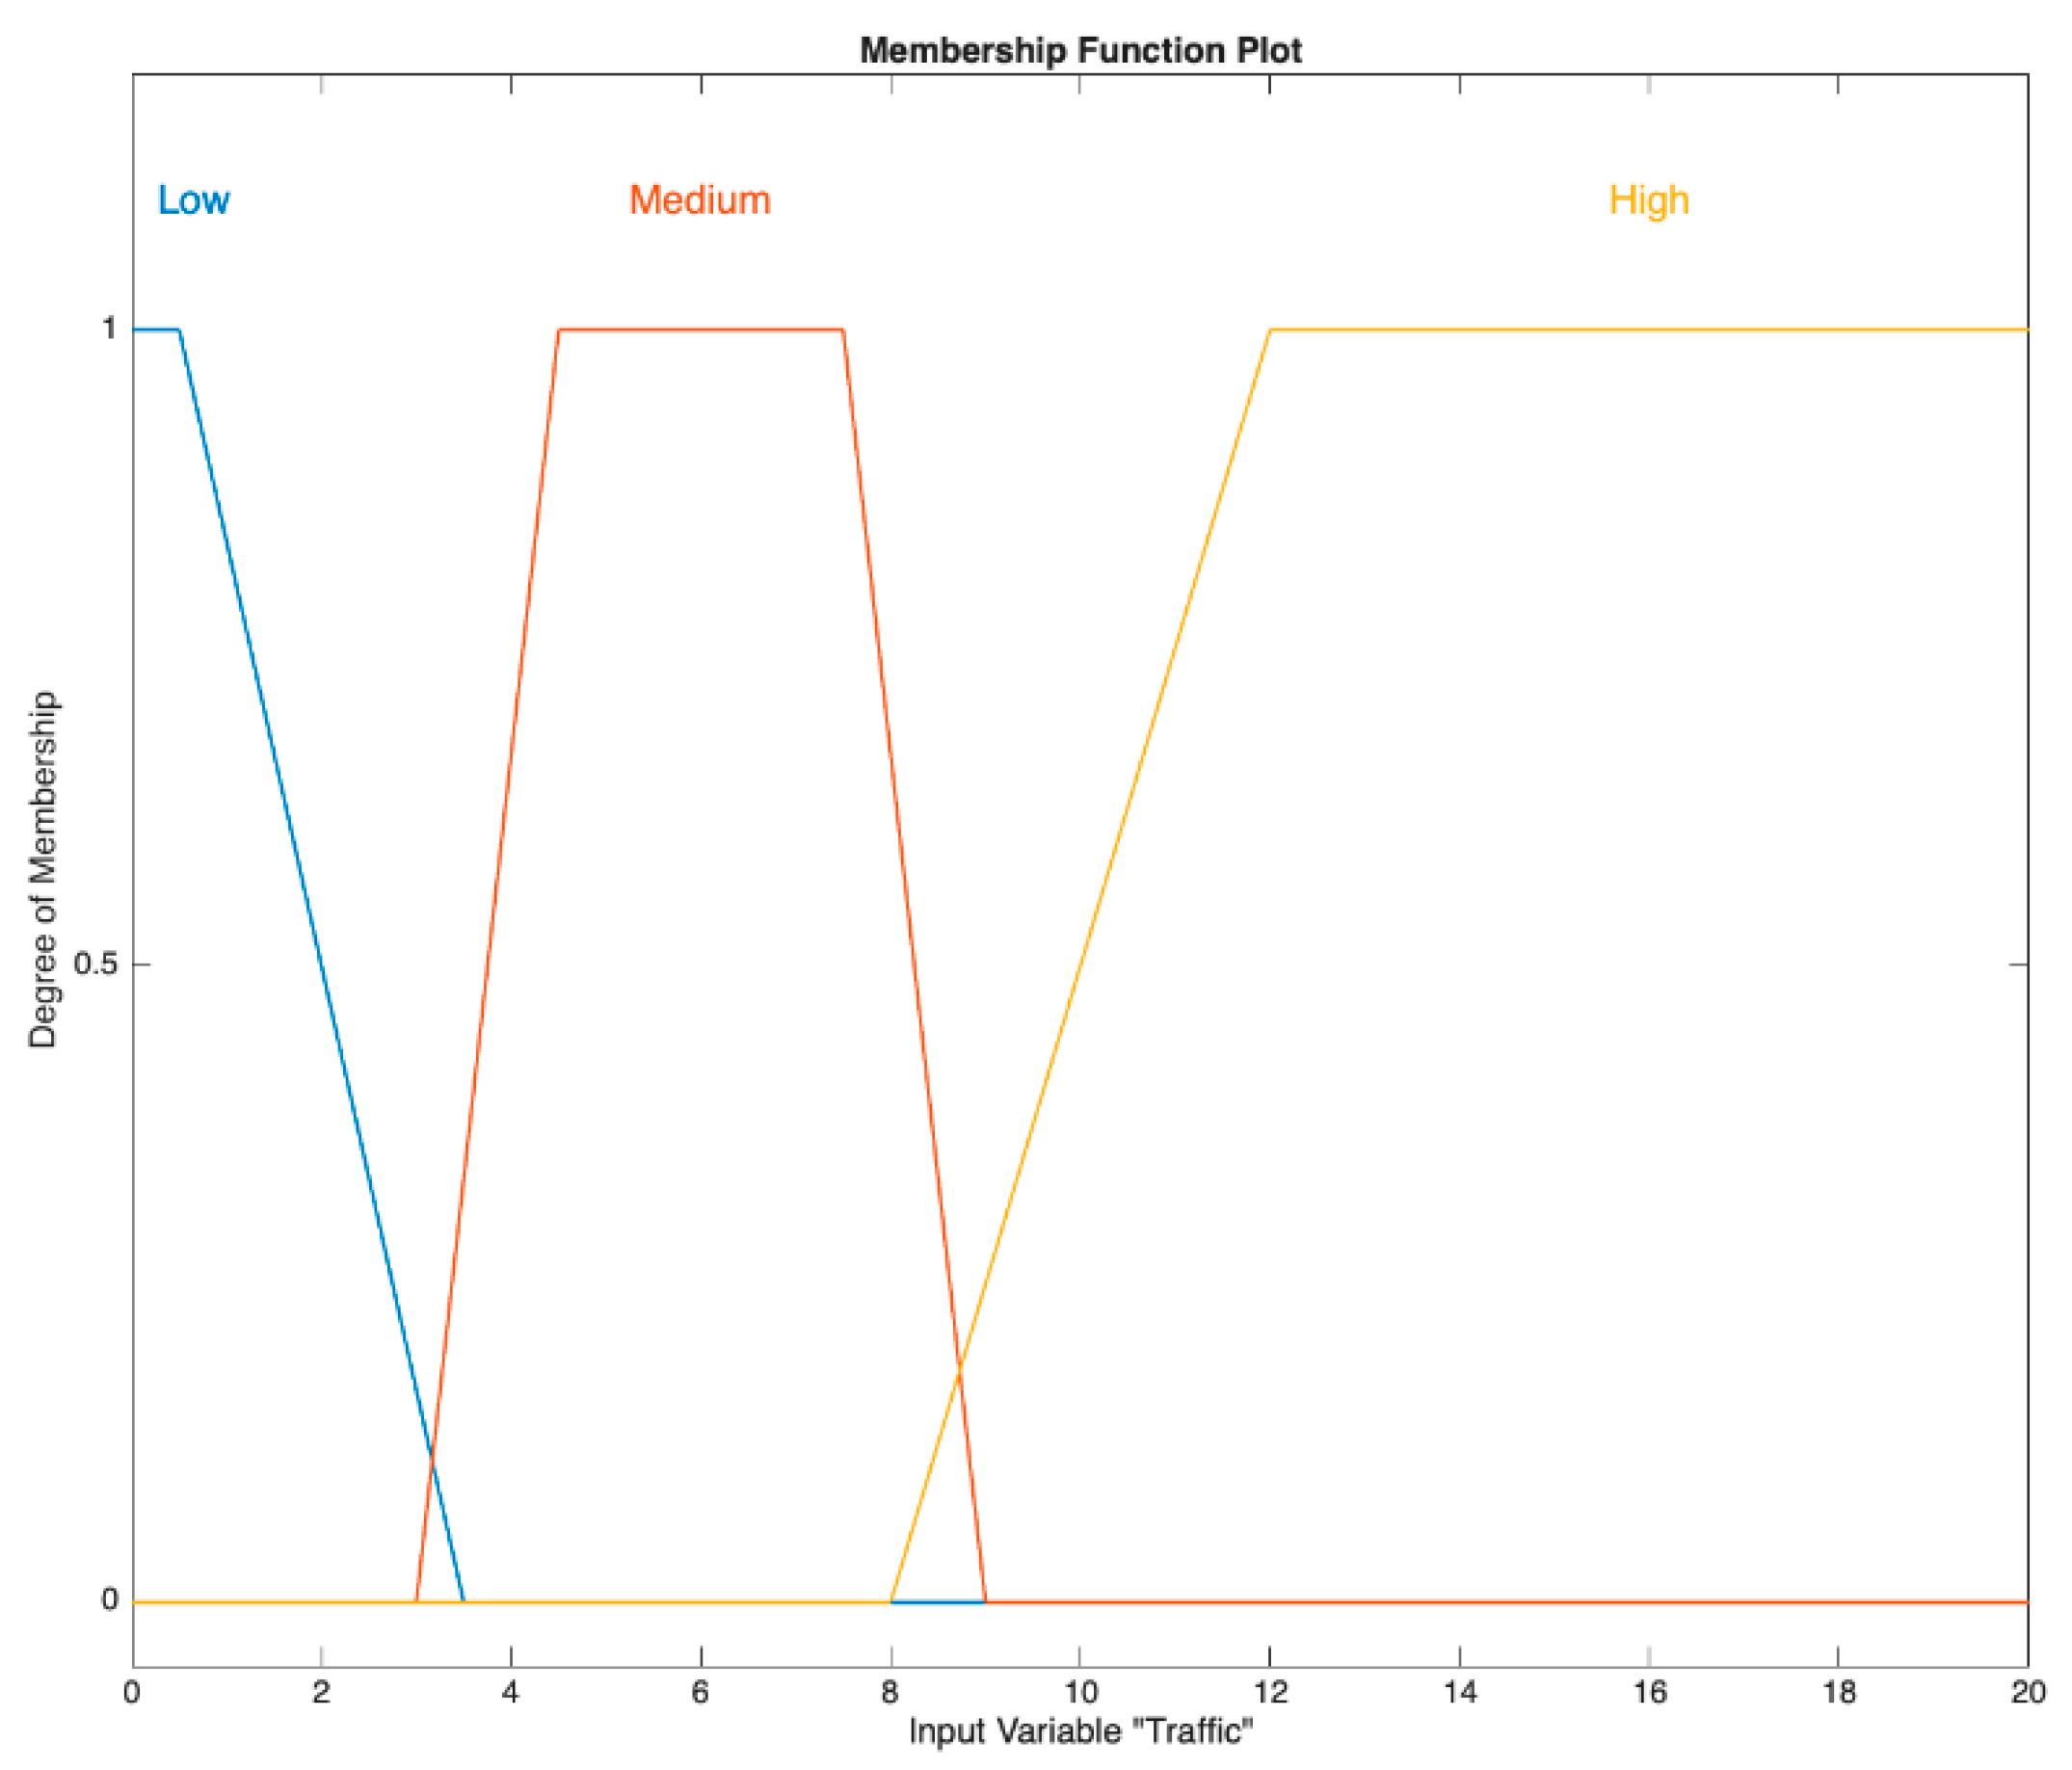
Next, the analysis introduces the Other Vessels Risk Fuzzy Inference System (FIS), which processes two inputs: the Traffic value and the output from the Closest Vessel Risk FIS. Within this system, ‘Traffic’ refers to the count of vessels within a 5-nautical-mile radius of the current ship. Expert insights from coastguards have been utilized to classify the number of surrounding vessels into various levels of membership degrees, which are depicted in Figure 13.
Figure 13.
Traffic risk membership function.
The Collision Risk FIS is a crucial element in the system designed to prevent collisions at sea. It evaluates risk by considering two main factors: the level of danger from other ships nearby and the type of the ship it is assessing, known as Ship Type Risk A. This assessment is similar to Ship Type Risk B, which evaluates the risk based on the type of other, or target, vessels.
This system methodically processes the risk information from both the ship’s environment and its own characteristics. It uses specific fuzzy rules, which are listed in Table 7. These rules help the Collision Risk FIS to calculate a risk score, which is essential for determining whether there is a high chance of a collision and if actions need to be taken to avoid it.
Table 7.
Collision risk fuzzy rules.
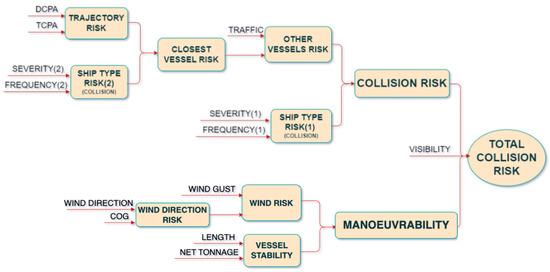
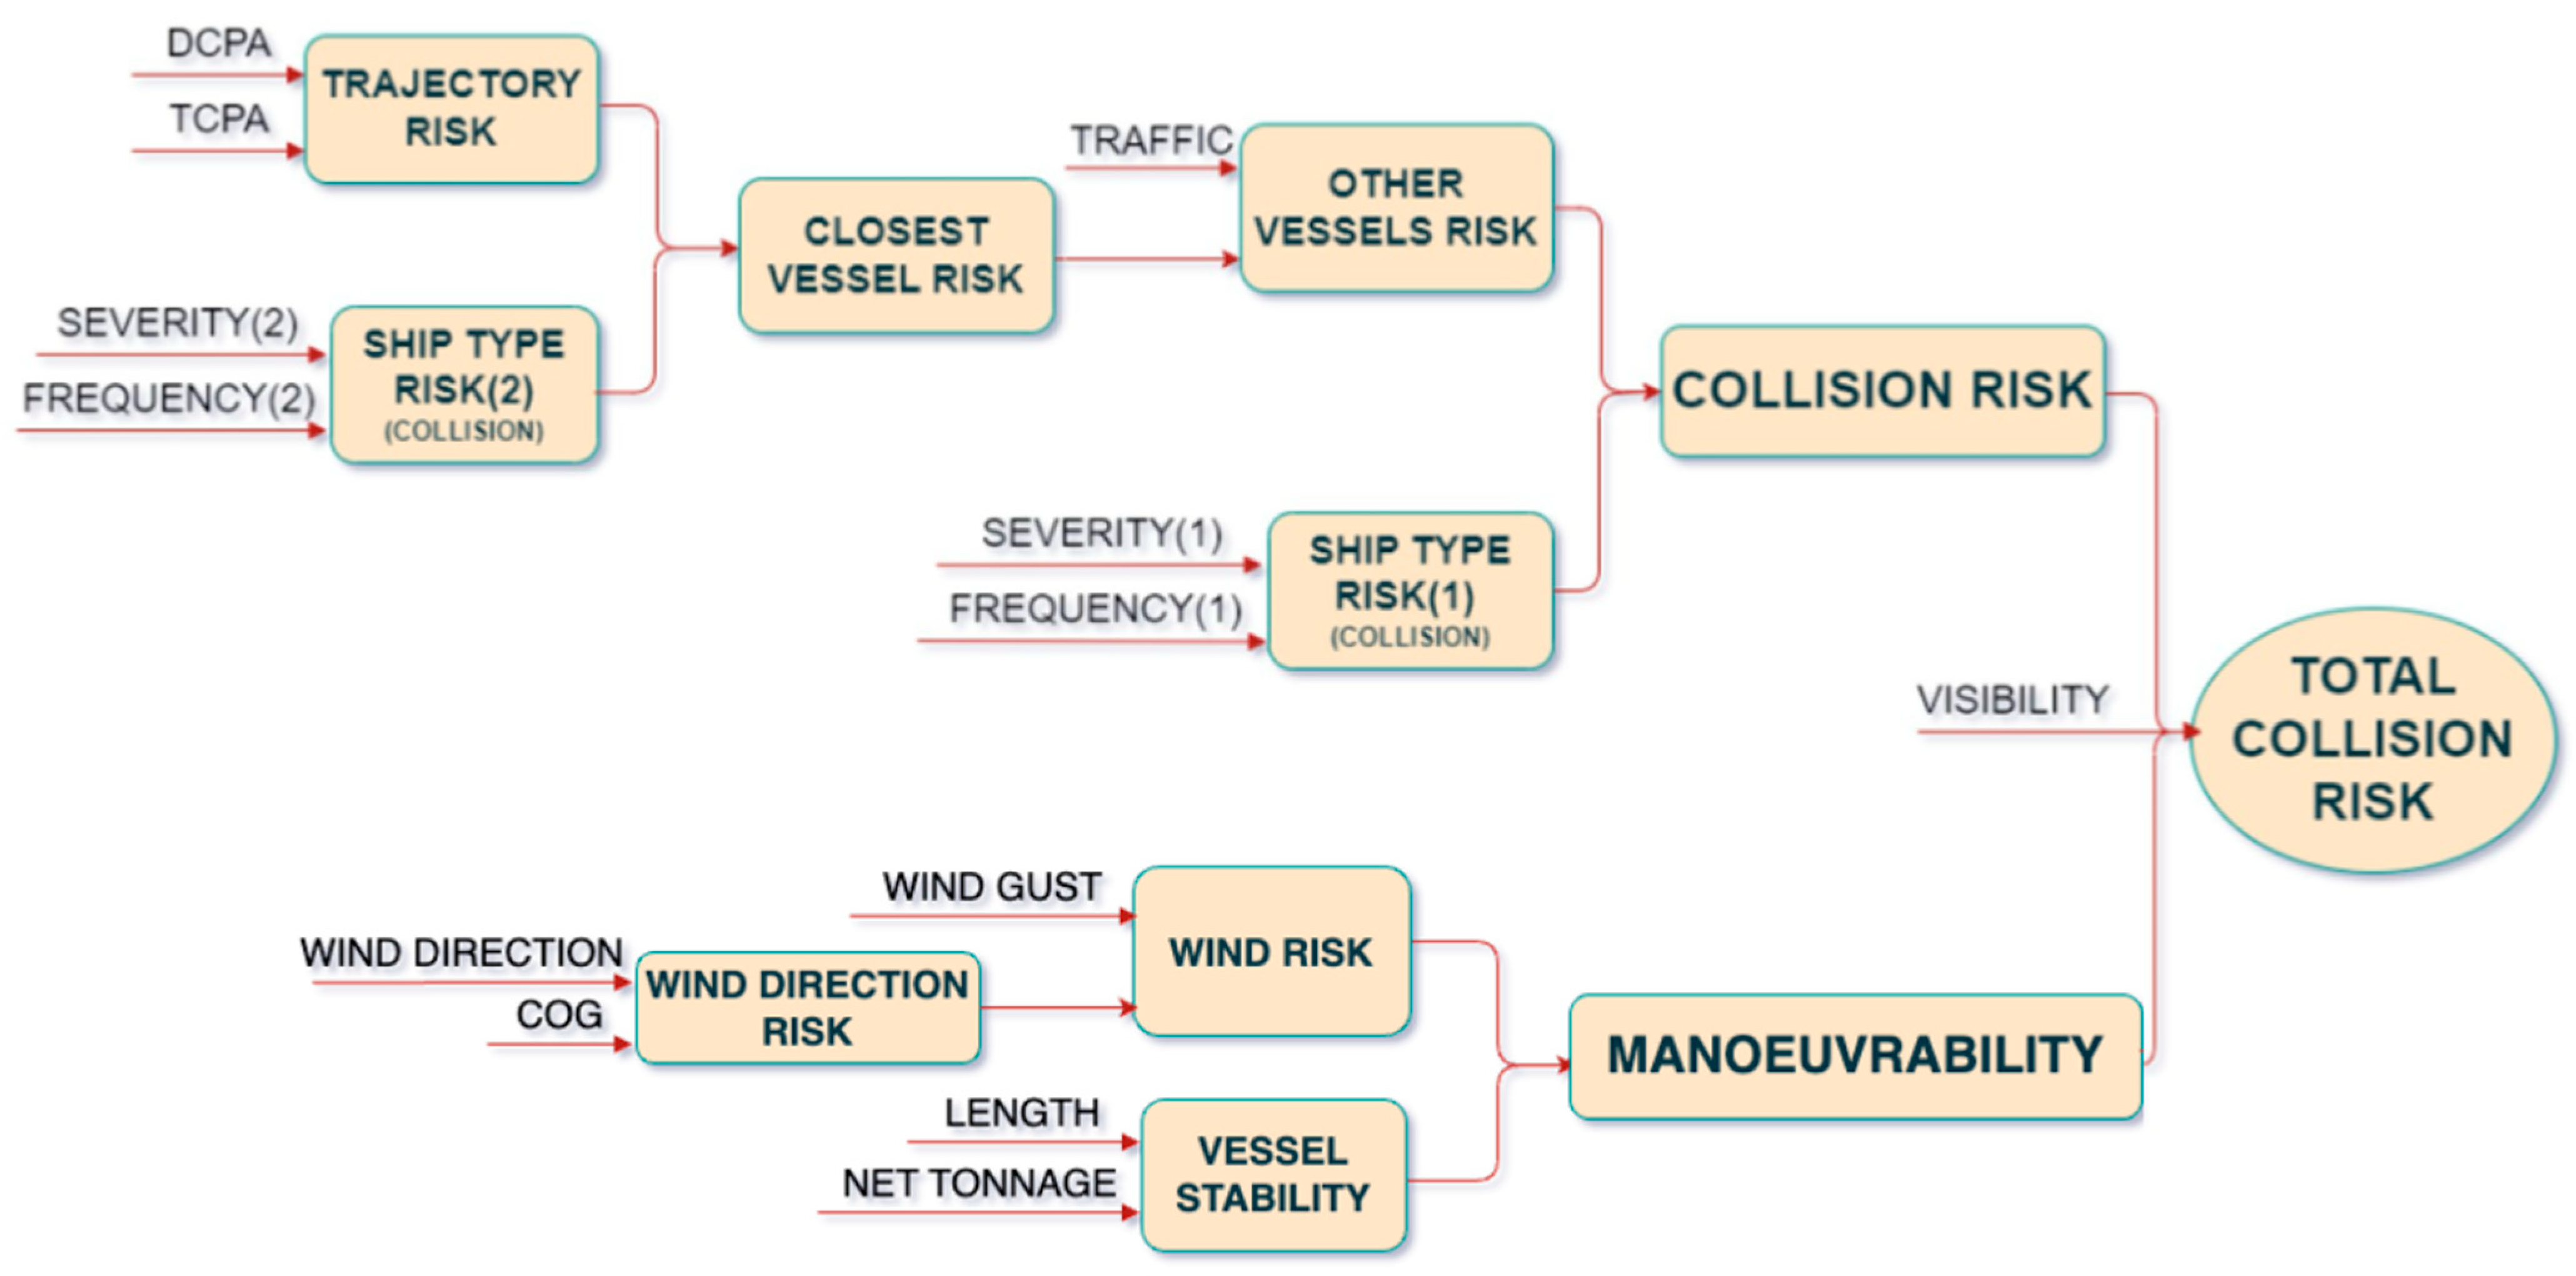
The total risk index for the collision use-case is completed with Total Collision Risk FIS, which combines the Collision Use-Case fuzzy tree structure with the Base Model fuzzy tree structure as depicted in Figure 14.
Figure 14.
Total collision risk fuzzy tree structure.
3.5.3. Grounding Use-Case
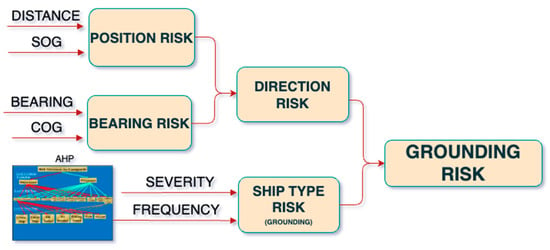
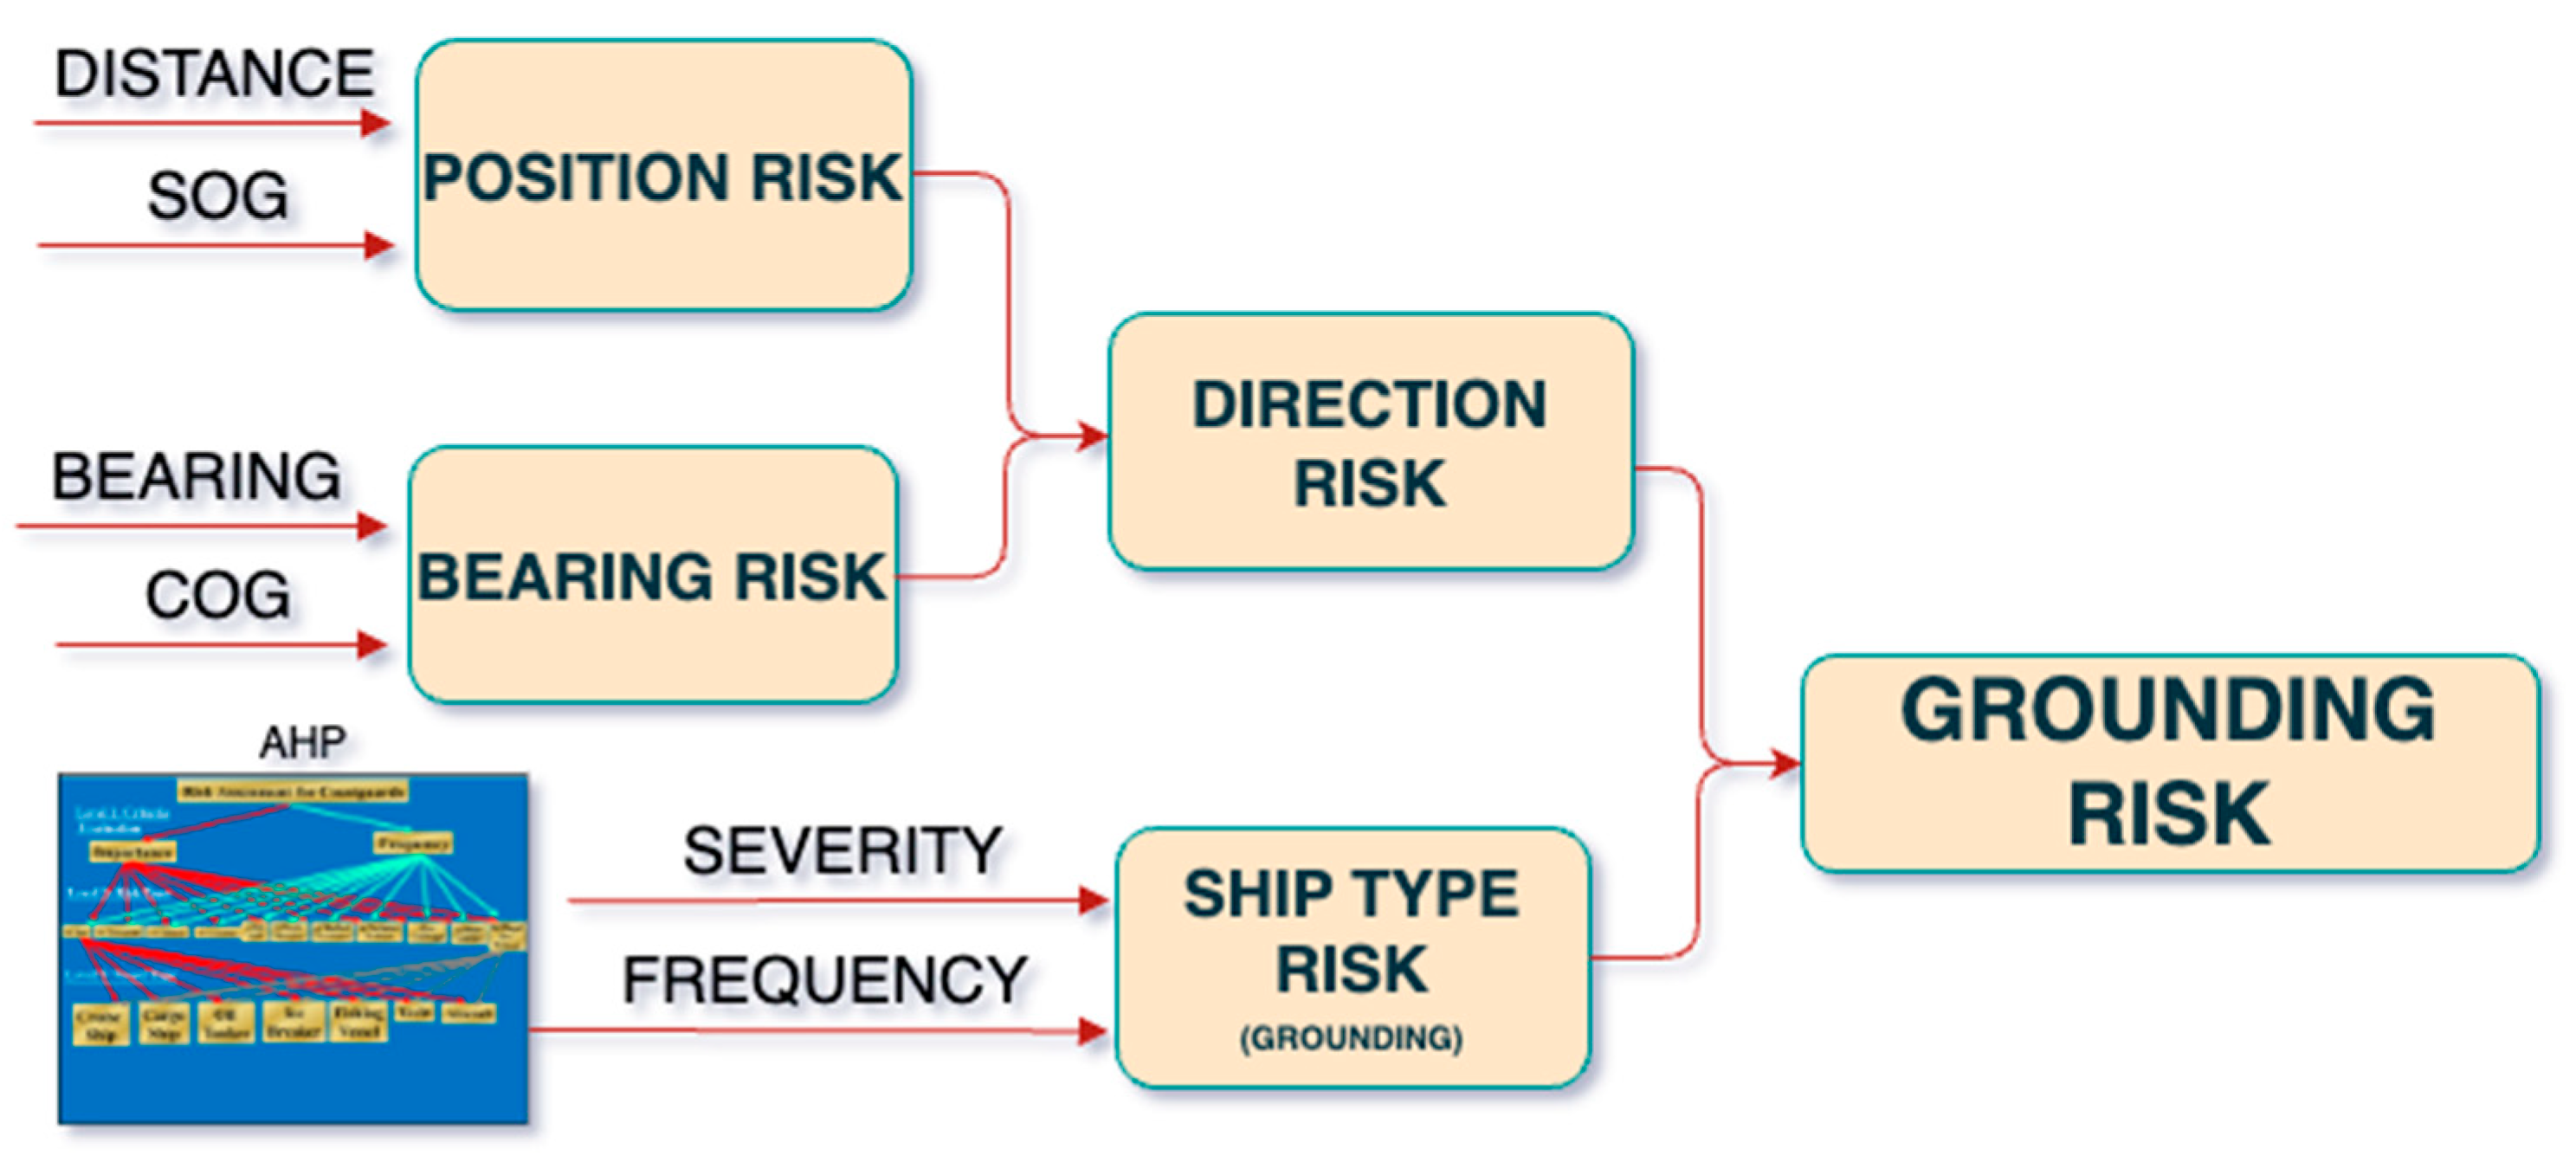
The final element of the Risk Index is the grounding use-case, which assesses the risk of vessels running aground. Analogous to the collision use-case, the grounding fuzzy tree structure, in conjunction with the Base Model fuzzy tree, completes the risk assessment. This provides critical information to coastguards, Joint Rescue Coordination Centers (JRCCs), and mariners to proactively prevent catastrophic grounding events that could result in loss of life, environmental damage from oil spills, and significant economic losses. The fuzzy tree structure of the grounding use-case is consisted of five interconnected fuzzy inference systems (FIS) as depicted in Figure 15.
Figure 15.
Grounding use-case fuzzy tree structure.
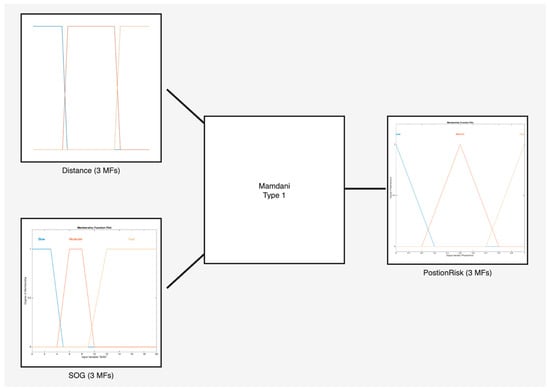
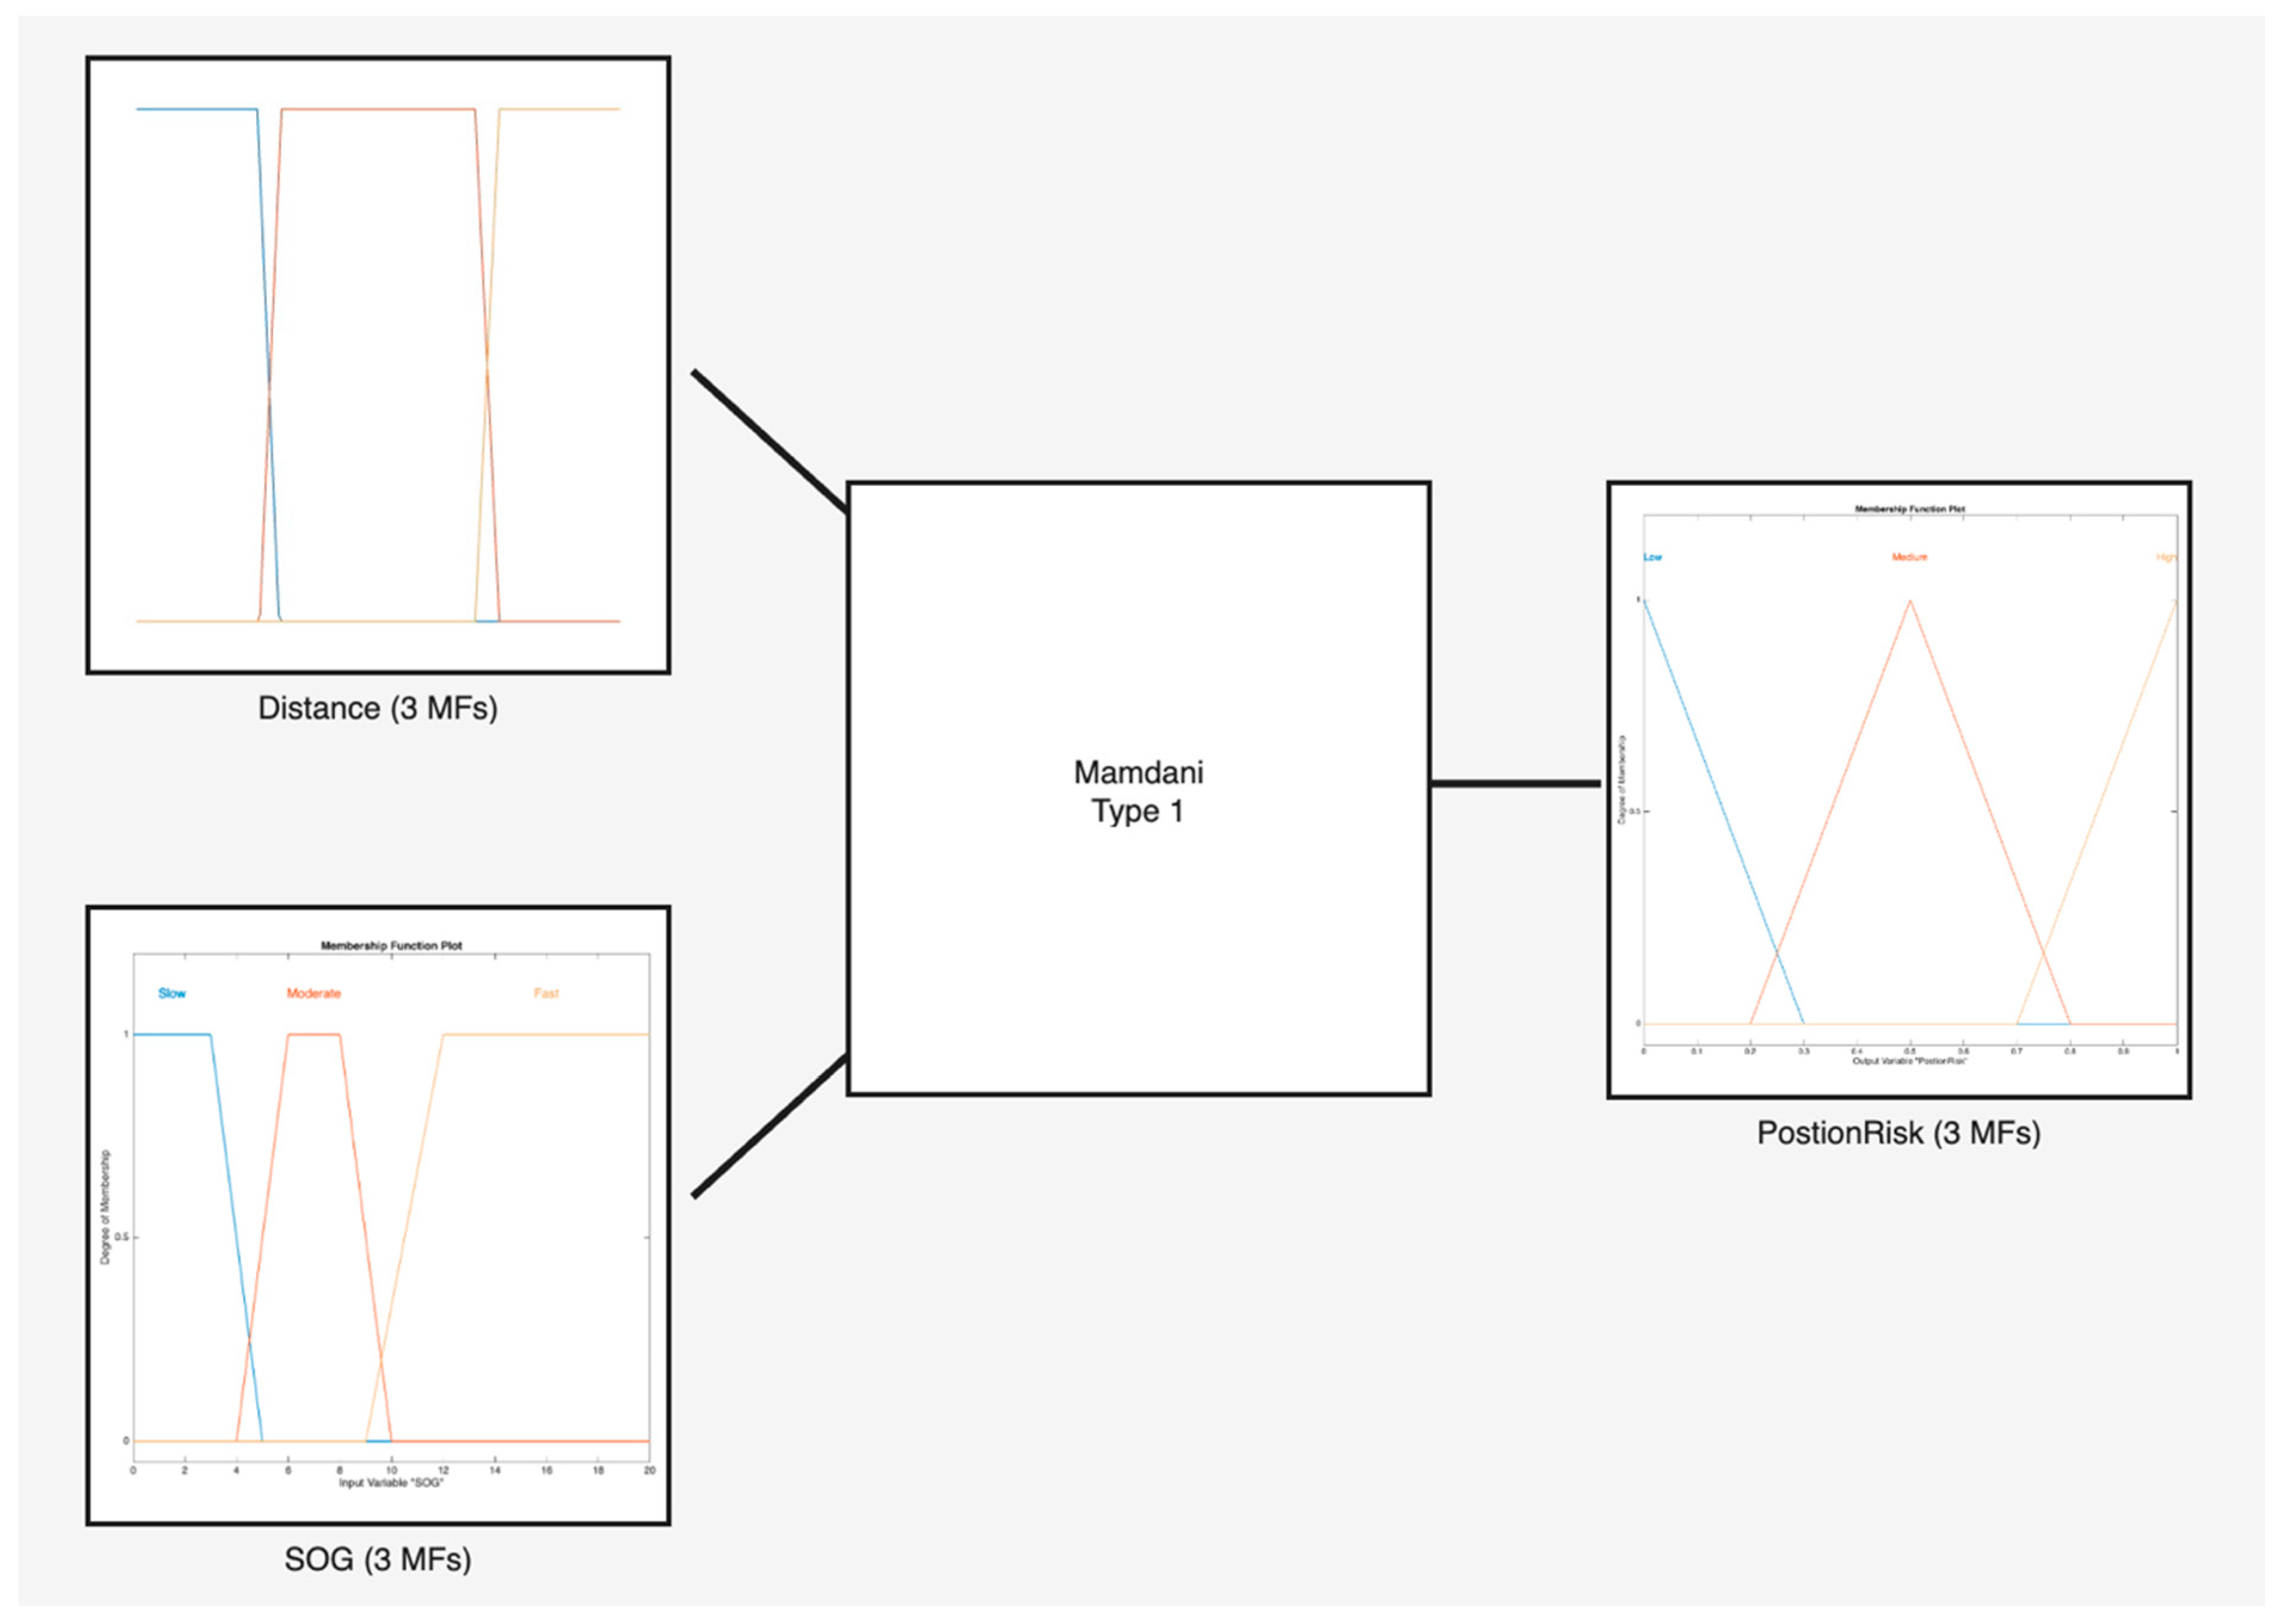
The Position Risk Fuzzy Inference System (FIS) initiates the risk assessment by processing two critical inputs, the vessel’s distance to the nearest point of interest on the shore and its Speed Over Ground (SOG). These factors are essential to determine the level of risk associated with the vessel’s position and velocity. The functions that define how distance and SOG relate to risk are depicted in Figure 16 with the structure of the Position FIS. Through these figures, the system translates the continuous nature of distance and speed into specific risk levels for further analysis.
Figure 16.
Distance—SOG FIS.
Moving on the Bearing Risk FIS plays a vital role in grounding risk assessment by evaluating the vessel’s orientation and navigational path. It analyzes the vessel’s bearing, which is the direction from the vessel to a point of interest, like the shoreline, and compares it with the Course Over Ground (COG), indicating the vessel’s actual travel direction. This comparison is crucial to determine if the vessel is heading towards a potential hazard and to assess the need for corrective maneuvers to maintain a safe distance from dangers such as shallow waters or rocky shores.
This FIS categorizes its inputs using membership functions that correspond to the eight principal compass points, simplifying the continuous range of possible directions. The system has a detailed set of 64 fuzzy rules, developed from pairing the eight cardinal and intercardinal directions for bearing with the same number of directions for the Course Over Ground (COG).
The Wind Direction Risk FIS is a key part of the navigation safety system. It takes the risk information about a ship’s location and speed from the Distance Risk FIS and combines it with the direction and path data from the Bearing Risk FIS. This combined information helps to accurately assess how dangerous the ship’s current path is.
Much like the approach taken for collision scenarios, the grounding risk framework includes a Ship Type Risk FIS. This system evaluates risk by integrating information about how often and how severely different types of ships are involved in grounding incidents. The data feeding this FIS originate from the Analytic Hierarchy Process, thoroughly detailed and examined in Section 3.4 of the paper.
The Grounding Risk FIS is the final FIS of the grounding use-case and is an important part of the developed Risk Index, connecting the information from the Wind Direction Risk FIS and the Ship Type Risk FIS. It combines the risks related to the ship’s course and position with the specific risks that come from the type of ship being used. This approach creates a detailed picture of the potential for grounding, considering both the immediate risks from the ship’s navigation and the longer-term risks associated with the ship’s design and characteristics.
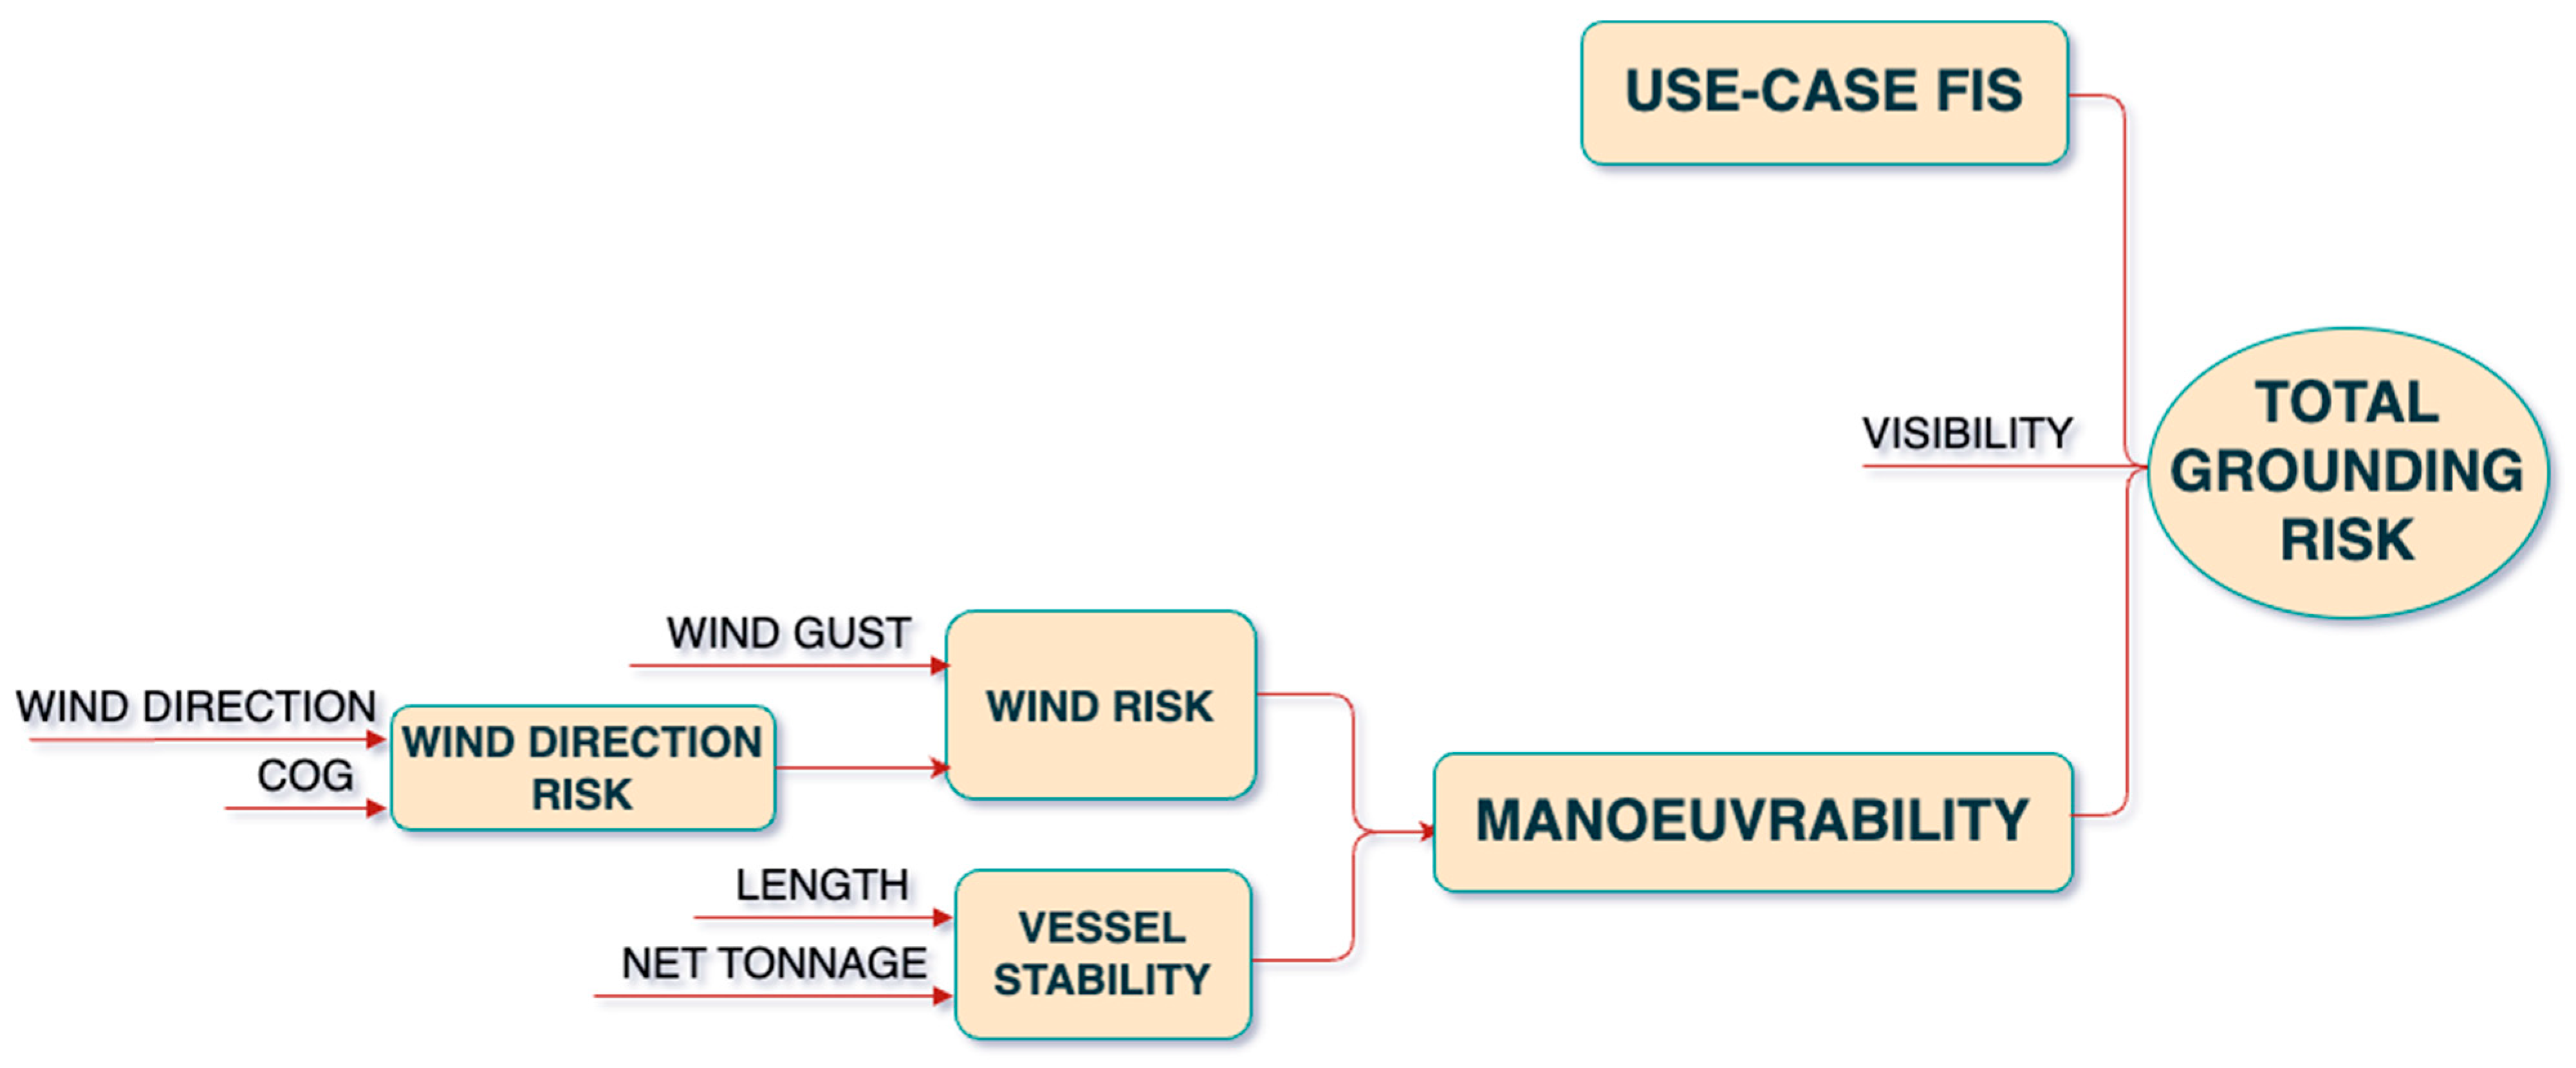
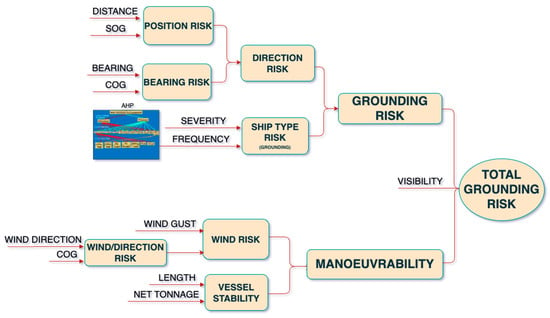
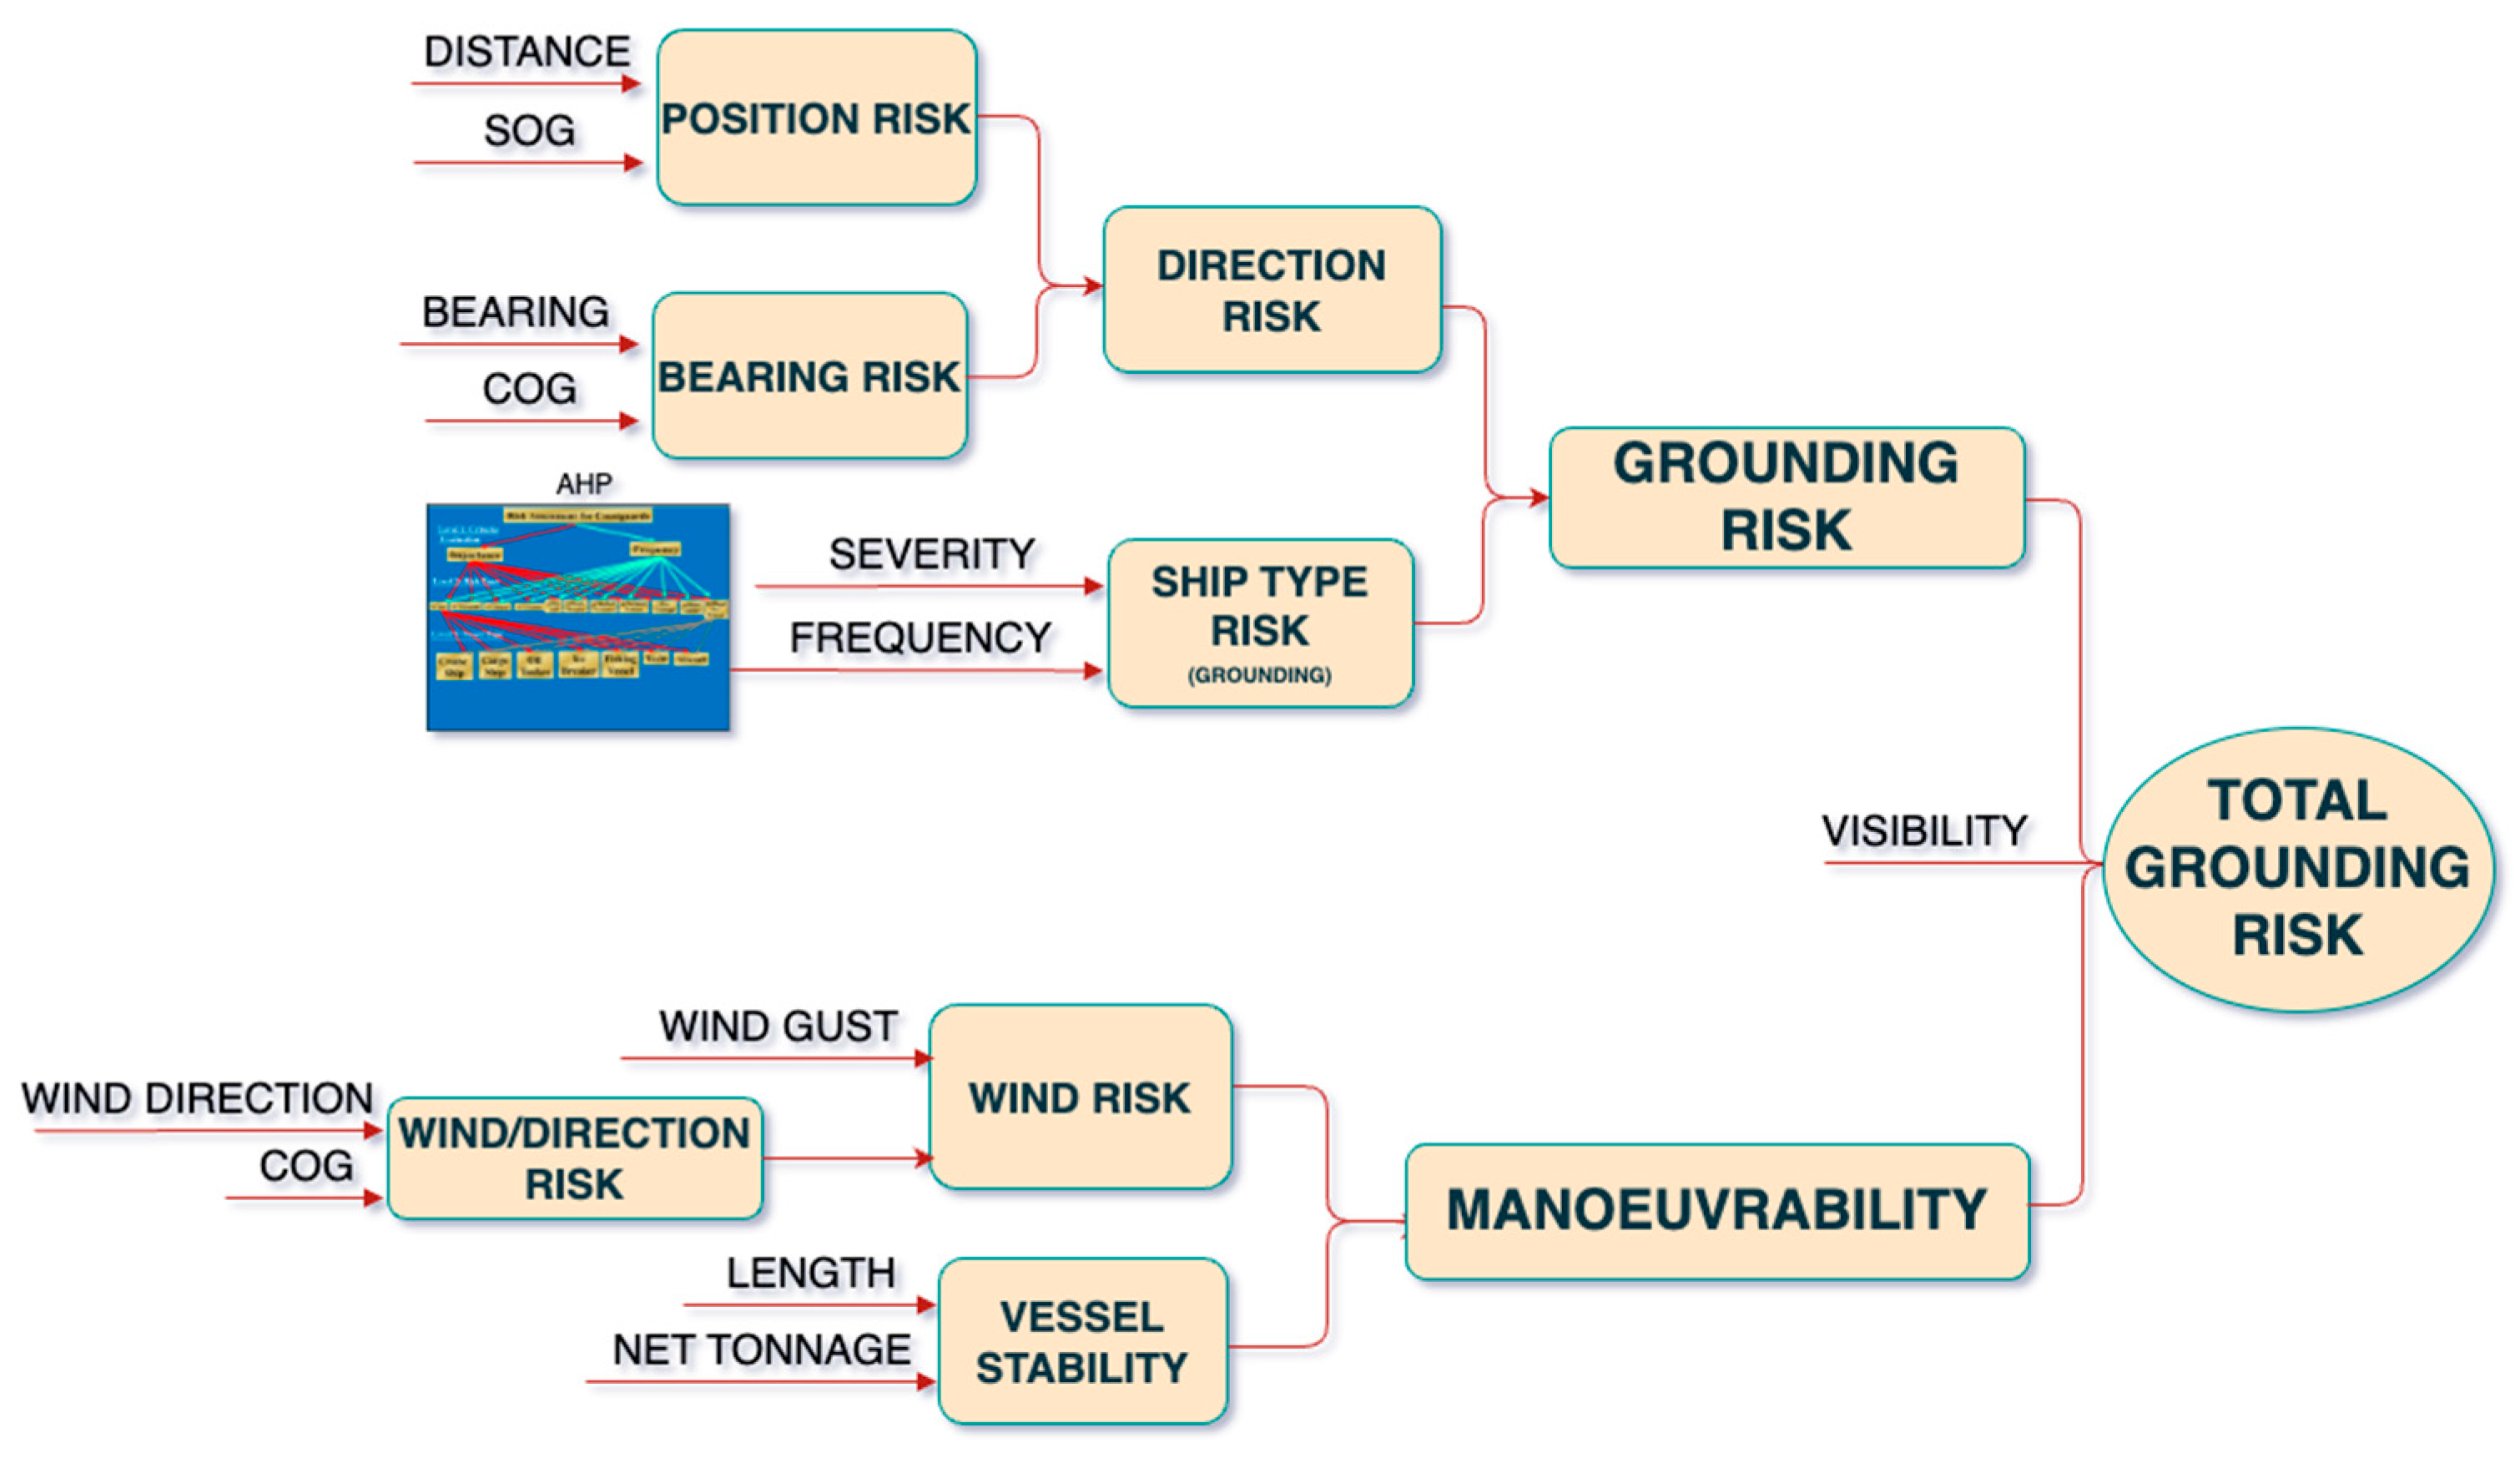
The Grounding Risk FIS, integrated with the Base Model Tree Structure, leads to the development of the Total Grounding Risk FIS. This is the concluding analytical stage for grounding risk, offering an aggregate risk assessment. It compiles insights from the ship’s navigational behavior, type, and essential factors such as weather data and the vessel’s static data, to generate an overall risk figure. This figure is pivotal for navigators to gauge the immediacy and severity of grounding risks. The final tree structure with the combined trees is depicted in Figure 17.
Figure 17.
Total grounding risk fuzzy tree structure.
4. Results
4.1. AI-ARC Demonstrations of Model Performance
The AI-ARC project conducted two demonstrations that provided an opportunity for testing, showcasing, and expert review of all the technical services, including the Risk Index. These demonstrations took place in Karlskrona, Sweden, during September 2023, for the Baltic Demo, and in Reykjavik, Iceland, for the Arctic Demo during October.
4.1.1. Baltic Demonstration
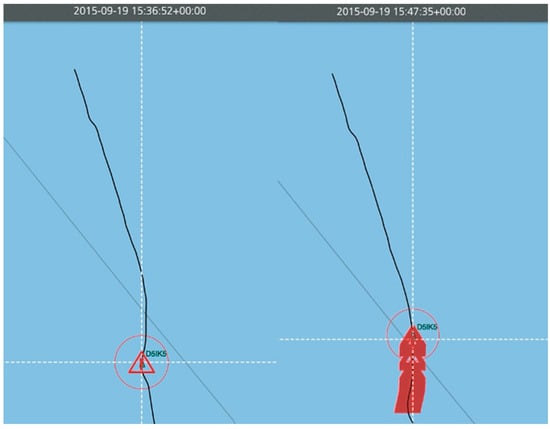
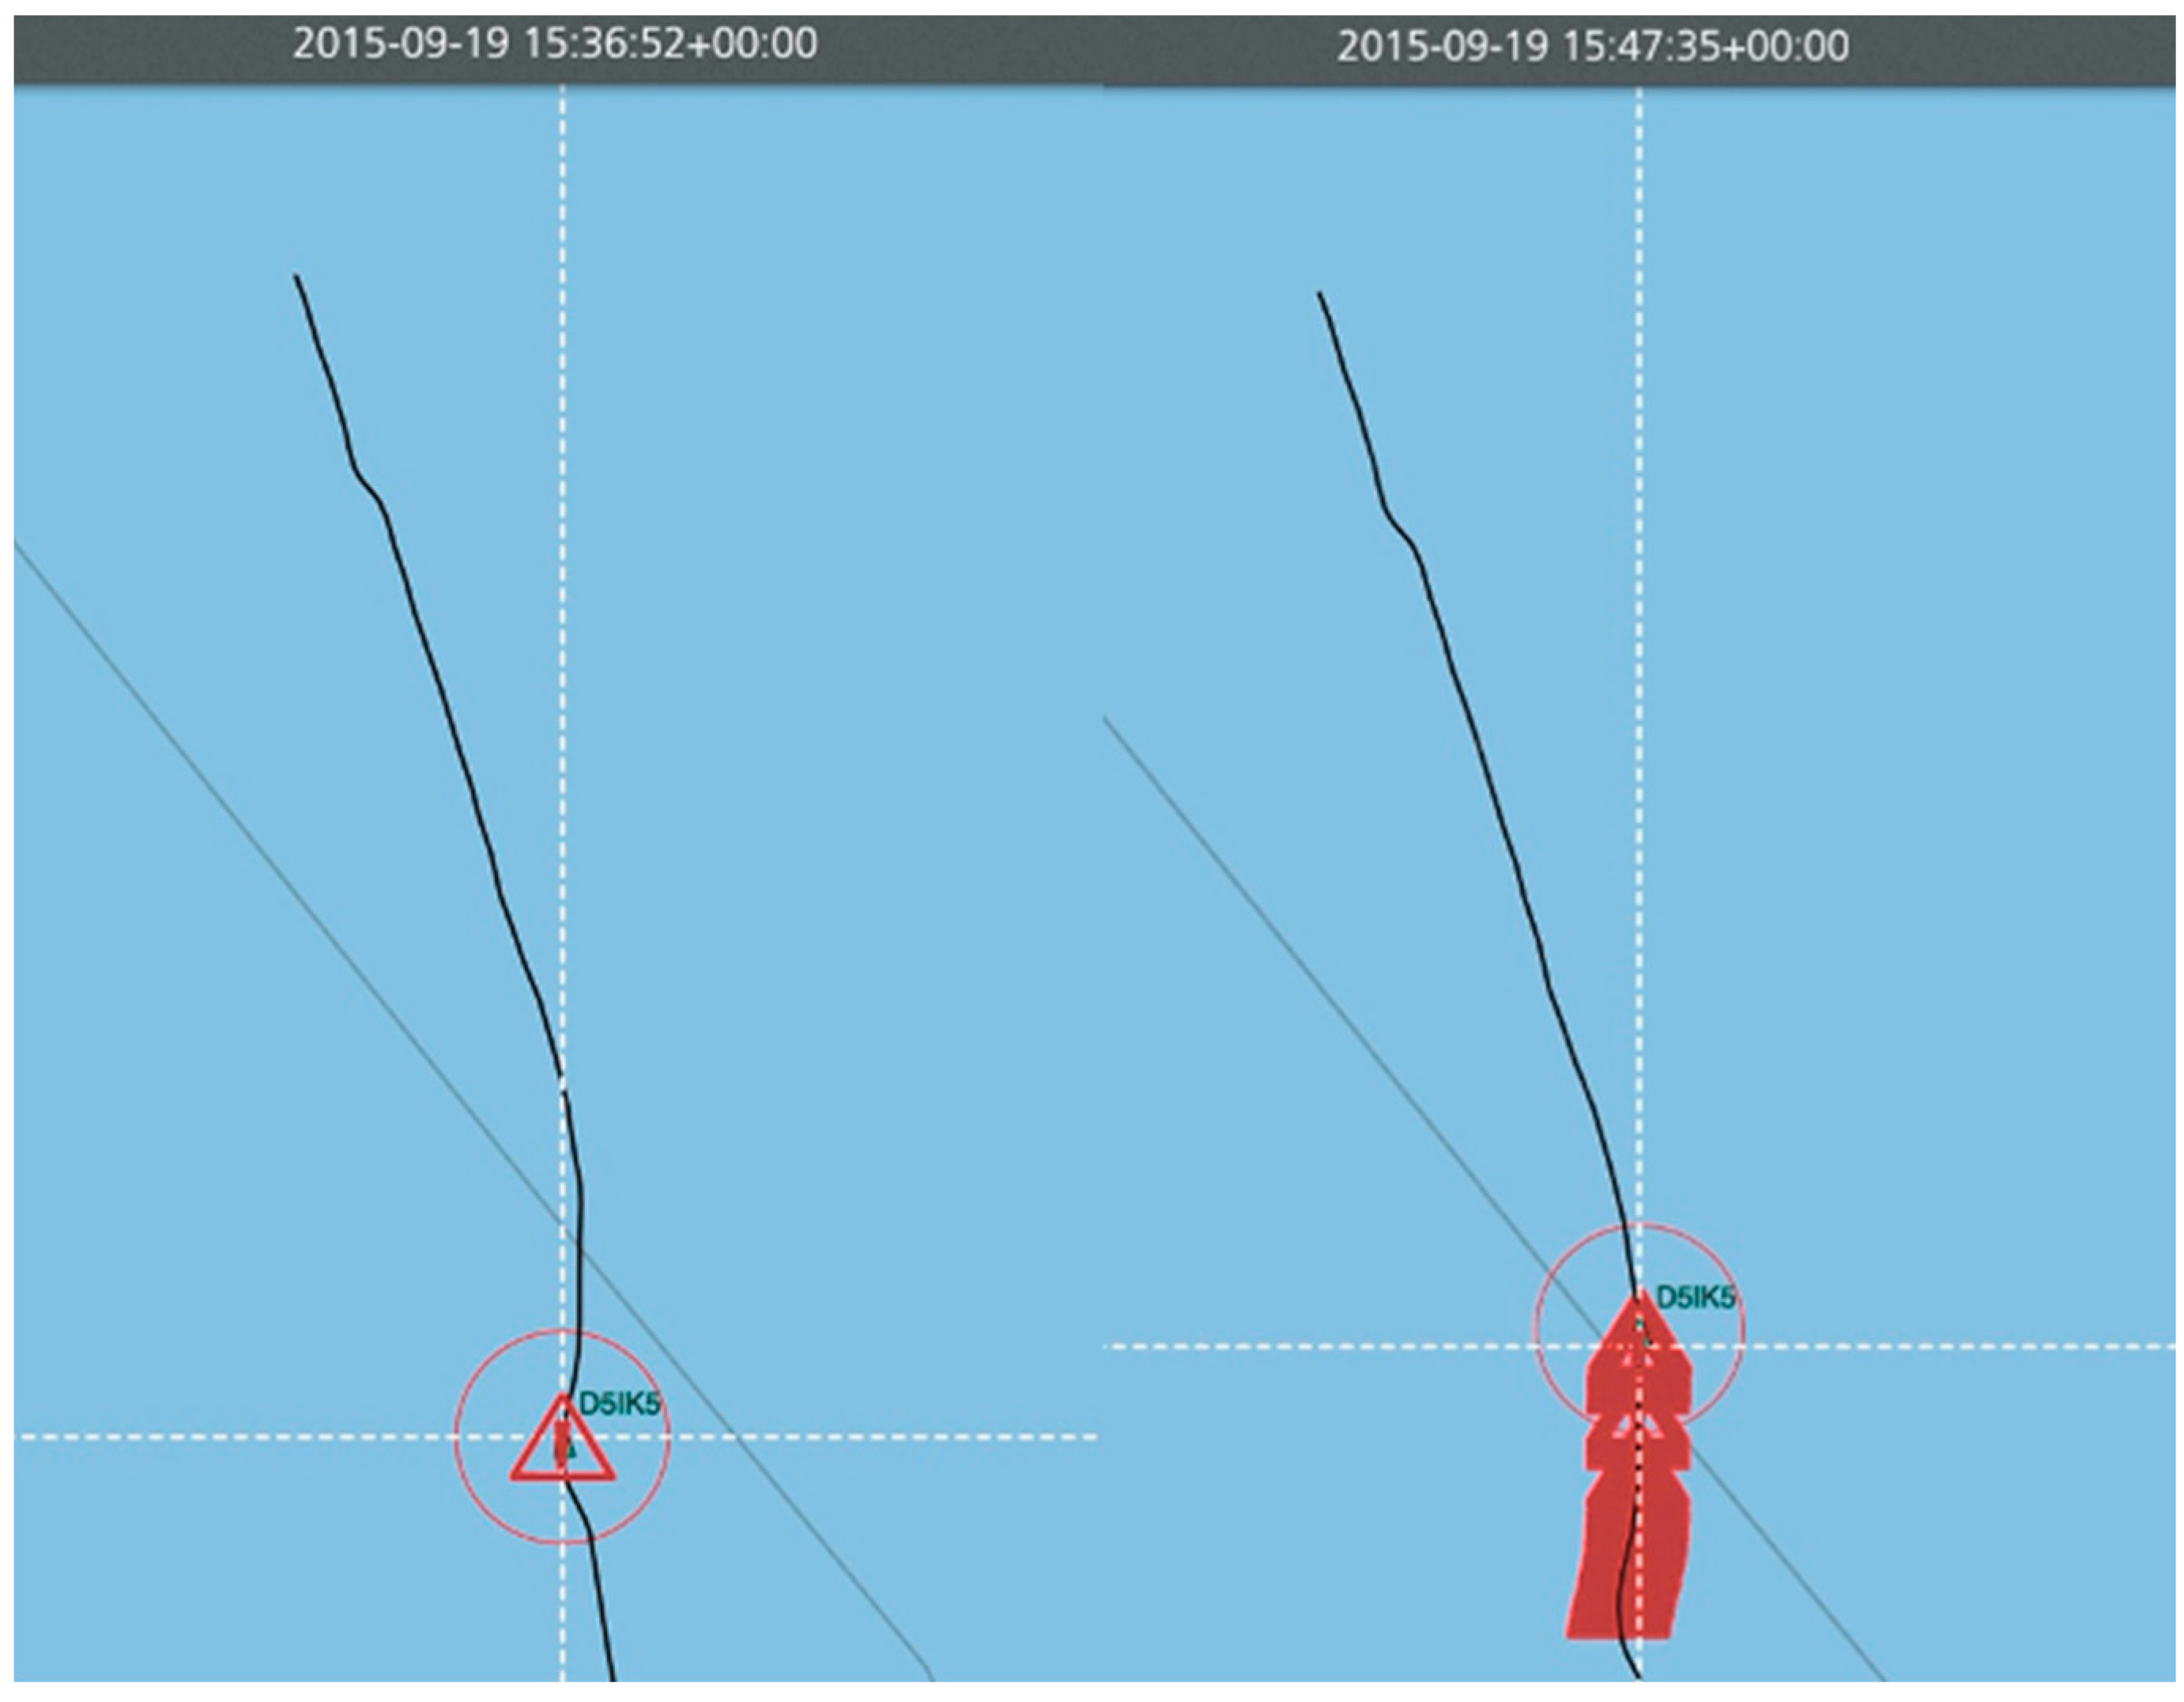
During the Baltic Demo, the grounding risk scenario was illustrated using a case study of the Portuguese-flagged container ship Victoria, which ran aground in Danish waters between Antwerp, Fredericia, Aarhus, and Copenhagen on 9 February 2015 [27]. The demonstration was supported by AIS data replay provided by the Research Institute of Sweden, enabling the grounding service to demonstrate its effectiveness. The service successfully issued High-Risk alerts, marked by red exclamation point triangles, from 15:36 to 15:47 on the same day, from 55 to 28 min prior to the grounding incident at 16:31, as shown in Figure 18.
Figure 18.
Victoria grounding—first and last High-Risk alert for grounding.
The Baltic demonstration utilized a replay of a real grounding incident involving the container vessel Victoria. The vessel was navigating in coastal Danish waters characterized by relatively constrained navigation channels and proximity to shoreline hazards. As the vessel deviated from a safe navigational corridor and progressively approached the coastline, the grounding-risk model continuously recalculated the risk index using AIS-derived vessel position, speed over ground, course over ground, distance to shore, bearing to the nearest shoreline location, and prevailing environmental conditions. The dynamic nature of the model enabled the risk level to increase progressively as the vessel moved closer to the shoreline while maintaining a trajectory associated with an elevated grounding probability.
The transition to a High-Risk state approximately 55 min before the actual grounding event demonstrates the capability of the proposed approach to provide an early warning of deteriorating navigational conditions. As the vessel continued its approach towards the shoreline, the reduction in distance-to-shore and the persistence of an adverse bearing relationship resulted in sustained high-risk assessments. This behavior is consistent with the intended design of the grounding-risk model, which aims to identify hazardous trends before a grounding event becomes imminent.
4.1.2. Arctic Demonstration
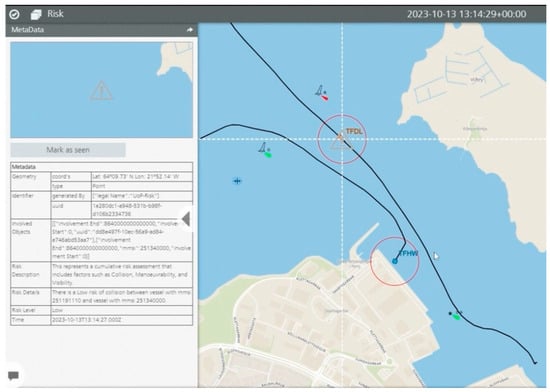
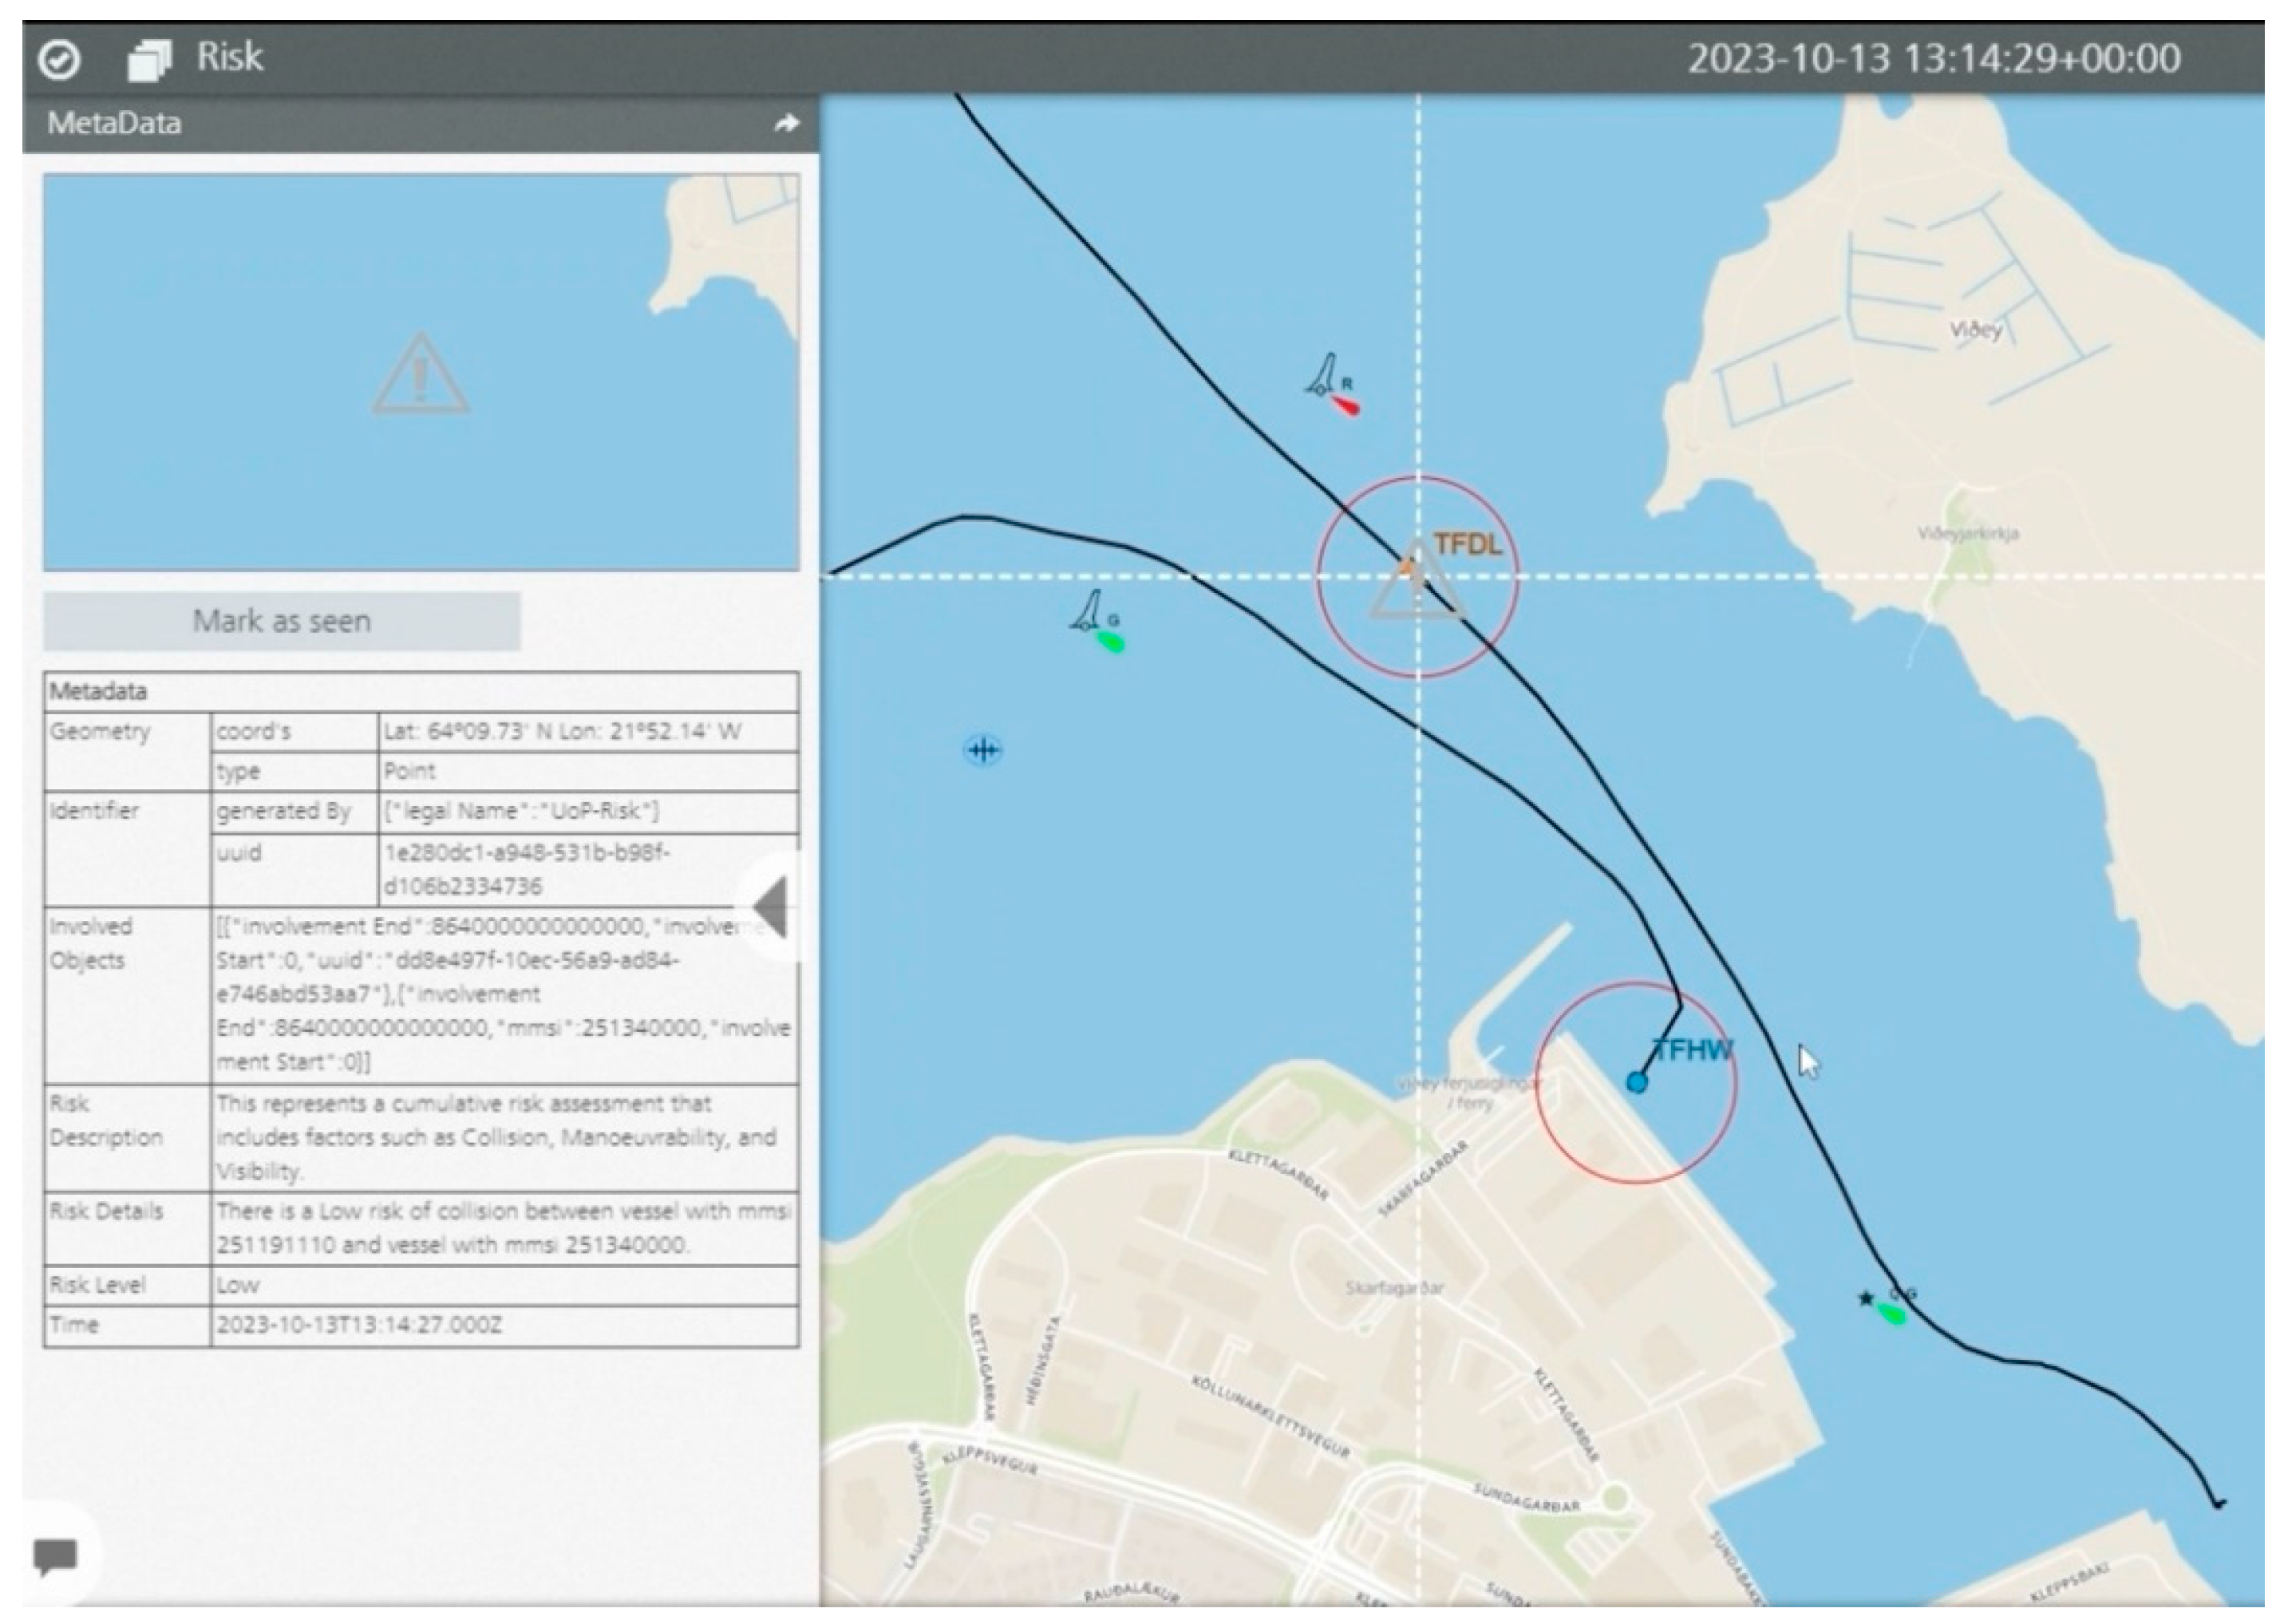
During the Arctic Demo, a collision use-case was presented to demonstrate the capabilities of real-time risk assessment in maritime operations. The scenario depicted a vessel, identified by the call sign “TFDL,” entering Skarfabakki Harbour in Reykjavik. The system actively assessed the collision risk, dynamically updating the risk level based on the relative positions of the participating vessels. In Figure 19, as the vessel “TFDL” makes its way into the port, a Low-Risk alert is displayed, indicated by a grey exclamation point triangle. This alert signifies a low probability of collision with the target vessel, labelled “TFHW.”
Figure 19.
First low-risk alert for collision.
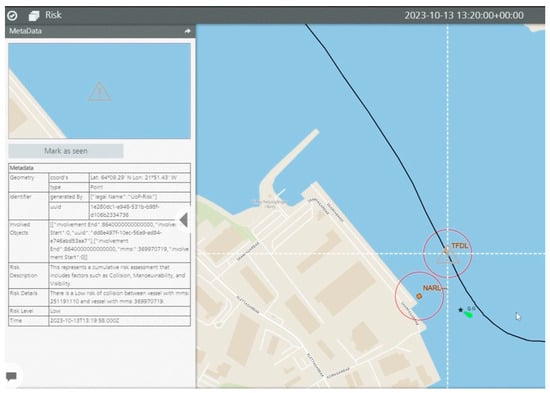
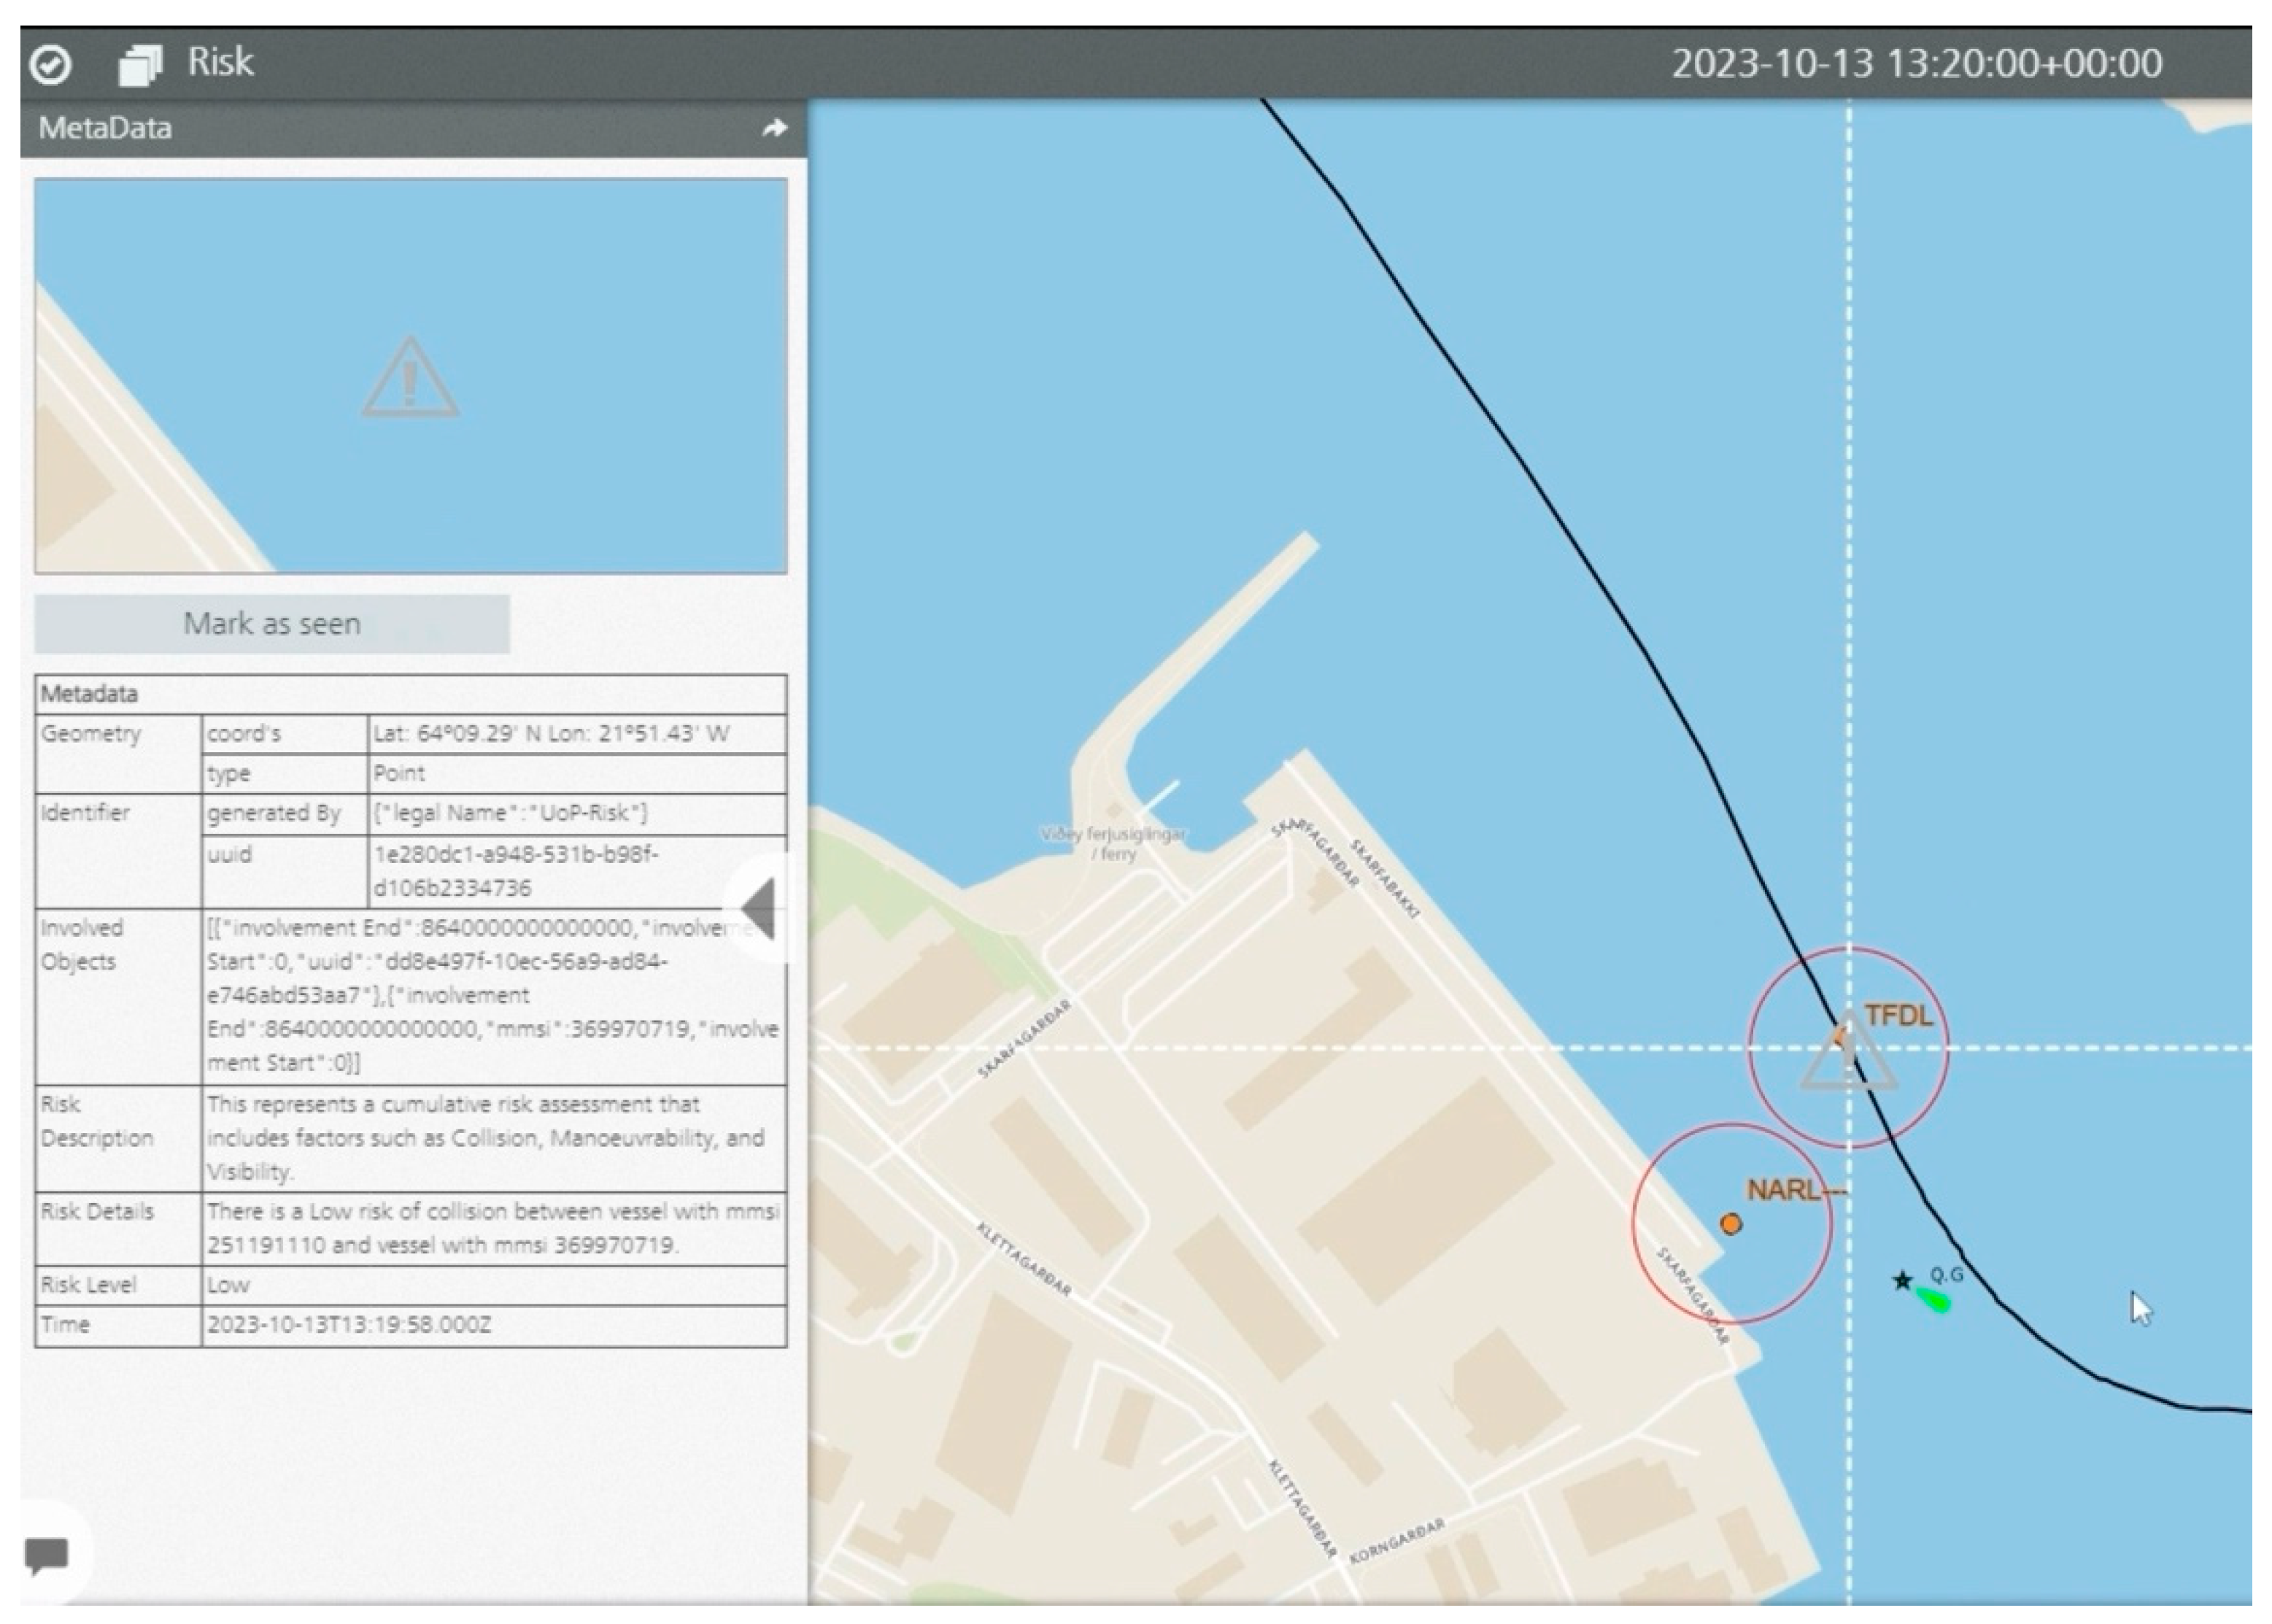
As the demo progressed and the “TFDL” vessel moved further into the port, another Low-Risk alert was generated, this time with respect to a different vessel, indicated by the call sign “NARL,” as depicted in Figure 20.
Figure 20.
Second lo- risk alert for collision.
In both instances, the risk level is communicated effectively alongside the metadata presented on the left side of each figure. This metadata includes critical information such as the risk description, which lists the Maritime Mobile Service Identities (MMSIs) of both the own vessel and the target vessel and confirms the assessed risk level as low. This demonstration effectively showcases the system’s ability to adaptively monitor and report potential collision risks in a dynamic maritime environment.
5. Discussion and Conclusions
5.1. Evaluation
The case studies demonstrated the practical applicability and adaptability of the proposed Risk Index in representative maritime operational scenarios. In the Baltic region, the grounding use-case revealed the service’s adept handling of the area’s unique challenges. Integrating AIS data, shoreline data, environmental conditions, and expert insights, it provided an accurate and dynamic assessment of grounding risks in an actual maritime incident.
This case study demonstrated the capability of the proposed framework for real-time decision-making and its significant impact on enhancing navigational safety and operational efficiency.
In the Arctic maritime environment, the collision use-case emphasized the service’s flexibility and situational awareness. Despite the absence of data from an actual collision, the service effectively calculated real-time collision risks with the nearest vessel, showcasing its potential as a crucial tool for navigating challenging environments.
However, the presence of false positives in these scenarios indicates room for improvement. This issue can be mitigated through further testing in real-life incidents and the use of higher quality AIS data. Such advancements are expected to improve the service’s precision, minimize false positives, and enhance its reliability.
The service’s applications demonstrate its comprehensive approach and its significant role in improving maritime safety and decision-making processes. Its adaptability, evident in its ability to incorporate new use-cases into the existing model, validates the capacity to grow according to the maritime industry’s needs. The results indicate that the framework could benefit from further development and validation using a broader range of operational scenarios.
Although AIS data are useful as a platform for conducting further research, there are some inherent limitation of AIS data, as discussed by [19] which are generally related to the trajectory extraction of ships due to possibility of inconsistency of intervals of data sent; unreliability of data transmissions, which may be intentional or unintentional; and confusion that may arise due to high congestion of traffic, especially near ports. Therefore, the scalability of the proposed work in this paper can be enhanced to consider triangulation approaches of obtaining data other than just relying on AIS and weather, such as marine radar sensor data, data from satellites, extracting features from video data [18], or through adding some redundancy in the data generated through relying on enhanced machine learning features, and analytics such as Bayesian networks.
5.2. Future Work and Concluding Remarks
Expanding the application scope of the Risk Index provides opportunities for further methodological development and additional operational applications. Additional use-cases, such as iceberg collision avoidance and oil spill risk assessment, represent promising extensions of the proposed framework. The modular architecture of the proposed framework facilitates the incorporation of additional risk assessment scenarios. By leveraging the base model of our fuzzy systems, we can significantly enhance situational awareness for each calculation. This adaptability enables the development of context-specific maritime safety assessments tailored to different operational environments.
Integrating a high-resolution weather API is essential. The limitations of the free service used thus far restricted data points and calls, underscoring the need for a more robust solution to accurately gauge weather impacts at specific vessel locations.
Finally, the development of a software interface that allows mariners to adjust fuzzy system parameters is a practical enhancement to the developed Risk Index. This tool will allow users to modify membership functions and fuzzy rules to reflect their own experience and judgment. With the changing landscape of Arctic navigation paths, such a flexible system ensures the service remains relevant and user-friendly, facilitating an easier transition for mariners facing new and shifting requirements.
To sum up, while the Risk Index has demonstrated substantial promise, reaching the desired technological readiness level hinges on fulfilling several key advancements: obtaining more precise AIS data, expanding sea chart data for critical Arctic navigations, gathering a broader range of expert opinions, engaging in extensive testing with maritime authorities, and upgrading to a more sophisticated weather API for granular, accurate weather data. These enhancements are crucial for the service’s full potential to be achieved.
One of the core requirements of a risk index development based in part on expert opinion is to ensure diversification of experts as input. The expert opinion input into this project was limited to a number of experts from different coastguards in the Arctic and other Northern European locales. For future developments, this pool of experts can be increased to enrich the fuzzy system designs. Long-term evaluation involving coastguard personnel and mariners would provide valuable feedback for further model refinement.
A longer-term development would be to expand the sources of learning so that the system can head towards becoming a generative AI-based index. Such sources may include future major incident reports. However, by definition, a major disaster has two properties: low frequency and high severity. Hence the number of incidents available, especially in the Arctic conditions, may be quite limited by definition. Therefore, to maximize exposure to learning opportunities, learning sources and feedback to the system may include near-miss incidents, as well as outcomes of simulation exercise, such as tabletop (TTXs) or live exercises (LIVEXs). This is in line with the argument that ‘the more the model becomes like the real system, the more it also acquires the properties of the real system’ [28]. Such a feedback mechanism could support the recalibration of fuzzy rules, membership functions, and AHP weights. It will also debias any existing cognitive biases within the experts [29,30]. Another area of future research is to investigate integration of Explainable AI (AI (XAI) principles more explicitly with respect to rue traceability and user-adjustment parameters. This aligns with recent trends and enhances trust in a decision support system.
An important limitation of the current grounding-risk model is that it relies primarily on shoreline proximity rather than hydrographic variables such as seabed depth, tidal height, under-keel clearance, and vessel draught. Although the model demonstrated useful early-warning capability during the Baltic demonstration, future versions should integrate bathymetric information from Electronic Navigational Charts (ENCs) together with dynamic tidal and vessel-draught data to improve the physical realism and predictive accuracy of grounding-risk assessments.
Author Contributions
Conceptualization, A.L. and I.M.; methodology, A.L., D.J. and P.S.; software, A.I. and A.K.; validation, A.L. and D.M.; formal analysis, A.L., D.J., A.K., A.I. and K.O.W.; investigation, A.I. and A.K.; resources, K.O.W.; data curation, A.I. and A.K.; writing—original draft preparation, A.I. and A.K.; writing—review and editing, A.L. and I.M.; visualization, A.I.; supervision, A.L.; project administration, A.L., I.M. and P.S.; funding acquisition, I.M., A.L. and P.S. All authors have read and agreed to the published version of the manuscript.
Funding
This research was funded by the European Union’s Horizon 2020 Research and Innovation Programme through the project AI-ARC (Artificial Intelligence-Based Virtual Control Room for the Arctic) under Grant Agreement No. 101021271.
Institutional Review Board Statement
Not applicable.
Informed Consent Statement
Not applicable.
Data Availability Statement
The original contributions presented in this study are included in the article. Further inquiries can be directed to the corresponding author.
Conflicts of Interest
The authors declare no conflicts of interest.
Abbreviations
| VCR | Virtual Control Room |
| DCPA | Distance to the Closest Point of Approach |
| TCPA | Time to the Closest Point of Approach |
| AHP | Analytic Hierarchy Process |
| DGM | Decision-Making Grid |
| JKM | Jack-Knife Diagram |
| MCDM | Multiple Criteria Decision Making |
| JRCC | Joint Rescue Coordination Centre |
| AI | Artificial Intelligence |
| MARISA | Maritime Risk Assessment |
| FSA | Formal Safety Assessment |
| SOG | Speed Over Ground |
| COG | Course Over Ground |
| SOLAS | Safety of Life at Sea |
| AIS | Automatic Identification System |
| API | Application Programming Interface |
| FIS | Fuzzy Inference System |
References
- Sahin, B.; Kum, S. Risk assessment of Arctic navigation by using improved fuzzy-AHP approach. Int. J. Marit. Eng. 2015, 157, 241. [Google Scholar] [CrossRef] [Scilit]
- Tseng, P.-H.; Cullinane, K. Key criteria influencing the choice of Arctic shipping: A fuzzy analytic hierarchy process model. Marit. Policy Manag. 2018, 45, 422–438. [Google Scholar] [CrossRef] [Scilit]
- Goldsmit, J.; McKindsey, C.W.; Schlegel, R.W.; Stewart, D.B.; Archambault, P.; Howland, K.L. What and where? Predicting invasion hotspots in the Arctic marine realm. Glob. Chang. Biol. 2020, 26, 4752–4771. [Google Scholar] [CrossRef] [Scilit] [PubMed]
- Mjelde, A.; Martinsen, K.; Eide, M.; Endresen, Ø. Environmental accounting for Arctic shipping—A framework building on ship tracking data from satellites. Mar. Pollut. Bull. 2014, 87, 22–28. [Google Scholar] [CrossRef] [Scilit] [PubMed]
- Zhao, L.; Fu, X. A novel index for real-time ship collision risk assessment based on velocity obstacle considering dimension data from AIS. Ocean Eng. 2021, 240, 109913. [Google Scholar] [CrossRef] [Scilit]
- Luong, T.N.; Hwang, S.; Im, N. Harbour Traffic Hazard Map for real-time assessing waterway risk using Marine Traffic Hazard Index. Ocean Eng. 2021, 239, 109884. [Google Scholar] [CrossRef] [Scilit]
- Ding, H.; Weng, J.; Shi, K. Real-time assessment of ship collision risk using image processing techniques. Appl. Ocean Res. 2024, 153, 104241. [Google Scholar] [CrossRef] [Scilit]
- Yan, Z.; Xiao, Y.; Cheng, L.; He, R.; Ruan, X.; Zhou, X.; Li, M.; Bin, R. Exploring AIS data for intelligent maritime routes extraction. Appl. Ocean Res. 2020, 101, 102271. [Google Scholar] [CrossRef] [Scilit]
- Abebe, M.; Noh, Y.; Seo, C.; Kim, D.; Lee, I. Developing a ship collision risk Index estimation model based on Dempster-Shafer theory. Appl. Ocean Res. 2021, 113, 102735. [Google Scholar] [CrossRef] [Scilit]
- Wang, Z.; Im, N. Enhanced artificial potential field for MASS’s path planning navigation in restricted waterways. Appl. Ocean Res. 2024, 149, 104052. [Google Scholar] [CrossRef] [Scilit]
- Balmat, J.F.; Lafont, F.; Maifret, R.; Pessel, N. MAritime RISk Assessment (MARISA), a fuzzy approach to define an individual ship risk factor. Ocean Eng. 2009, 36, 1278–1286. [Google Scholar] [CrossRef] [Scilit]
- Džolić, B.; Tošić, N.; Orlić, V.; Veinović, M. Visualisation Tools for Design of Maritime Surveillance System. In Proceedings of the International Scientific Conference on Information Technology and Data Related Research, Belgrade, Serbia, 20 April 2019; pp. 546–552. [Google Scholar] [CrossRef] [Scilit]
- Paladin, Z.; Kapidani, N.; Lukšić, Ž.; Mihailović, A.; Scrima, P.; Jacobé de Naurois, C.; Laudy, C.; Rizogiannis, C.; Astyakopoulos, A.; Blum, A. Combined AI capabilities for enhancing maritime safety in a common information sharing environment. In Proceedings of the 35th Bled Econference Digital Restructuring and Human (RE) Action, Bled, Slovenia, 26–29 June 2022. [Google Scholar]
- Balmat, J.-F.; Lafont, F.; Maifret, R.; Pessel, N. A decision-making system to maritime risk assessment. Ocean Eng. 2011, 38, 171–176. [Google Scholar] [CrossRef] [Scilit]
- Ranjani, J.; Sheela, A.; Meena, K.P. Combination of NumPy, SciPy and Matplotlib/Pylab—A Good Alternative Methodology to MATLAB—A Comparative Analysis. In Proceedings of the 2019 1st International Conference on Innovations in Information and Communication Technology (ICIICT), Chennai, India, 25–26 April 2019; pp. 1–5. [Google Scholar] [CrossRef] [Scilit]
- Stróżyna, M.; Abramowicz, W. A Dynamic Risk Assessment for Decision Support Systems in the Maritime Domain. Stud. Ekon. 2015, 243, 295–307. [Google Scholar]
- Chen, X.; Zheng, J.; Li, C.; Wu, B.; Wu, H.; Montewka, J. Maritime traffic situation awareness analysis via high-fidelity ship imaging trajectory. Multimed. Tools Appl. 2024, 83, 48907–48923. [Google Scholar] [CrossRef] [Scilit]
- Hu, Y.; Park, G.-K. Collision risk assessment based on the vulnerability of marine accidents using fuzzy logic. Int. J. Nav. Archit. Ocean Eng. 2020, 12, 541–551. [Google Scholar] [CrossRef] [Scilit]
- Chen, X.; Chen, W.; Wu, B.; Wu, H.; Xian, J. Ship visual trajectory exploitation via an ensemble instance segmentation framework. Ocean Eng. 2024, 313, 119368. [Google Scholar] [CrossRef] [Scilit]
- DeBock, K.W.; Coussement, K.; De Caigny, A.; Słowiński, R.; Baesens, B.; Boute, R.N.; Choi, T.-M.; Delen, D.; Kraus, M.; Lessmann, S.; et al. Explainable AI for operational research: A defining framework, methods, applications, and a research agenda. Eur. J. Oper. Res. 2024, 317, 249–272. [Google Scholar] [CrossRef] [Scilit]
- Woo, J.; Kim, N. Vision-Based Target Motion Analysis and Collision Avoidance of Unmanned Surface Vehicles. In Proceedings of the Institution of Mechanical Engineers Part M: Journal of Engineering for the Maritime Environment; SAGE Publications: Thousand Oaks, CA, USA, 2016; Volume 230, pp. 566–578. [Google Scholar] [CrossRef] [Scilit]
- Labib, A. Learning from Failures: Decision Analysis of Major Disasters; Butterworth-Heinemann: Oxford, UK, 2014; pp. 1–321. [Google Scholar] [CrossRef] [Scilit]
- Knights, P.F. Rethinking Pareto analysis: Maintenance applications of logarithmic scatterplots. J. Qual. Maint. Eng. 2001, 7, 252–263. [Google Scholar] [CrossRef] [Scilit]
- Seecharan, T.; Labib, A.; Jardine, A. Maintenance Strategies: Decision Making Grid vs. Jack-Knife Diagram. J. Qual. Maint. Eng. 2018, 24, 61–78. [Google Scholar] [CrossRef] [Scilit]
- Marchenko, N.; Andreassen, N.; Borch, O.J.; Kuznetsova, S.; Ingimundarson, V.; Jakobsen, U. Arctic Shipping and Risks: Emergency Categories and Response Capacities. TransNav Int. J. Mar. Navig. Saf. Sea Transp. 2018, 12, 107–114. [Google Scholar] [CrossRef] [Scilit]
- Zadeh, L.A. Fuzzy Sets. Inf. Control. 1965, 8, 338–353. [Google Scholar] [CrossRef] [Scilit]
- MathWorks. FIS Trees. In MATLAB Guide 2019; MathWorks: Natick, MA, USA, 2019. [Google Scholar]
- Swedish Coastguard. 2017. Available online: https://gcaptain.com/victoria-salvage-continues-off-sweden/ (accessed on 26 January 2024).
- Ale, B.J.; Hartford, D.N.; Slater, D.H. Dragons, black swans and decisions. Environ. Res. 2020, 183, 109127. [Google Scholar] [CrossRef] [Scilit] [PubMed]
- Montibeller, G.; von Winterfeldt, D. Cognitive and motivational biases in decision and risk analysis. Risk Anal. 2015, 35, 1230–1251. [Google Scholar] [CrossRef] [Scilit] [PubMed]

Disclaimer/Publisher’s Note: The statements, opinions and data contained in all publications are solely those of the individual author(s) and contributor(s) and not of MDPI and/or the editor(s). MDPI and/or the editor(s) disclaim responsibility for any injury to people or property resulting from any ideas, methods, instructions or products referred to in the content. |
© 2026 by the authors. Licensee MDPI, Basel, Switzerland. This article is an open access article distributed under the terms and conditions of the Creative Commons Attribution (CC BY) license.