


Abstract
The present study focuses on the design and stress analysis of an air intake system of an unmanned aerial vehicle (UAV), which plays a critical role in the aerodynamic performance and thermal management of the propulsion system. The structural design considered the main requirements for a small aircraft air inlet where the aerodynamic loads were calculated through a computational fluid dynamics (CFD) analysis. The pressure distribution and accelerated flight were applied as design and analysis loading conditions. The structural safety was investigated by performing stress analysis of the scoop that was fabricated from carbon fiber composite materials. The commercial finite element analysis software ANSYS was employed to obtain stresses and strains developed in the scoop, while its structural stability was verified through a buckling analysis. The final structural design results were found to have safety. This study presents the design results obtained by applying composite materials. The resulting design achieved a weight reduction of more than 55% compared with the conventional metallic structure.
1. Introduction
Recent research on the application of composite materials to small aircraft, including UAVs, has primarily focused on reducing structural weight, while improving manufacturing efficiency and overall performance. Carbon fiber-reinforced plastics (CFRPs) have become the dominant structural materials for these platforms because of their high specific strength and stiffness. More recently, increasing attention has been directed toward the replacement of conventional thermosetting resin systems with thermoplastic composites owing to their superior manufacturability, weldability, recyclability, and damage tolerance. The adoption of advanced composites has enabled significant reductions in airframe weight, leading to improved energy efficiency, increased payload capacity, and extended flight endurance, which are critical performance requirements for electrically powered small aircraft.
In recent years, substantial investments have been made worldwide in the development of small aircraft for both military and civilian applications. Although these platforms have traditionally been developed for defense purposes, their use has rapidly expanded into civilian sectors, including aerial surveillance, precision agriculture, infrastructure inspection, environmental monitoring, and logistics. Among these platforms, UAVs have emerged as one of the most promising technologies because of their operational flexibility and broad application potential. The present study focuses on the air intake system of a UAV, which plays a critical role in the aerodynamic performance and thermal management of the propulsion system. To establish the technical background for this work, previous international studies on air intake design and optimization for small aircraft were comprehensively reviewed and analyzed.
Recent research has focused on modeling, optimization, aerodynamic performance, and operational reliability. Xiao Yuan et al. developed and compared nonlinear data-driven models for nacelle inlet distortion using a typical narrow-body commercial aircraft as a case study [1]. Xiaobin Yang et al. optimized nacelle intake performance under crosswind conditions and demonstrated significant differences in flow separation between coupled fan–intake and intake-only simulations [2]. Bin Wang et al. investigated the effects of a baffle board on the aerodynamic and stealth performance of a double S-duct caret intake [3]. Pedro David Bravo-Mosquera et al. assessed the aerodynamic integration of an inverted rectangular upper fuselage intake for a conceptual air-to-ground fighter aircraft [4]. Vittorio Vercillo et al. examined the icing characteristics of stainless steel protection grids used in rotorcraft and turboprop engine air intakes [5]. Bagnoli et al. conducted the study on failure analysis of an aircraft auxiliary power unit air intake door [6]. The new air intake doors, in terms of design as well as material, have been introduced, thus obtaining the necessary functional improvements. Radek Doubrava et al. conducted research on bird strike tests, analyses, and design optimization of a tilt rotor aircraft composite inlet. Bird impact tests were performed on simple manufactured composite plates. An FE impact model was constructed and simulated using the impact test results [7]. Roberta Fusaro et al. performed a study entitled “Liquid Metals Heat-Pipe solution for hypersonic air-intake leading edge: Conceptual design, numerical analysis and verification”. In their work, integrated design methodology with multi-fidelity modelling and simulation techniques was investigated [8]. Shuliang Jing et al. performed a numerical study on the icing hazard zone of engine intake components under anti-icing conditions. The numerical simulation of hot air anti-icing considering the full physical process was carried out [9]. Nobuyuki Suzuki et al. conducted a study on double cylinder forming by die-less shear spinning for air intake lip skin of aero jet engine nacelle. A forming process was proposed to prevent the sheet thickness decreasing in the inner skin by using this forming technique [10]. Rajkumar et al. performed study on lightweight design and structural analysis of air intake manifold using composites. This research presents a finite element analysis (FEA)-based investigation into the structural performance of an air intake manifold made from different materials [11]. Haechang Jung et al. conducted study on off-design characteristics of a scoop-type streamline-tracing scramjet inlet. This study investigated the off-design characteristics of a scoop-type streamline-tracing inlet, focusing on identifying its operable envelope using numerical and experimental methods, with experiments primarily conducted for validation purposes [12]. S. Rea et al. studied the electromagnetic modeling of an aircraft air inlet scoop. The attenuation/transmission characteristics and hence High-Intensity Radiated Field (HIRF) immunity of a jet engine nacelle air vent, called a NACA (National Advisory Committee for Aeronautics) Scoop, were reported [13]. John M. Abbott performed study on the aeroacoustic performance of a scoop inlet. The result of a low-speed wind tunnel test program was presented, which demonstrated the aerodynamic and acoustic performance of a scoop inlet [14]. Qiang, X et al. conducted a study on the inlet distortion of a rear engines concept aircraft and its effect on a fan. The blades used were horizontal-axis blades. The paper investigates the BLI (Boundary layer-ingesting technology) inlet distortion of a REC (Rear engine concept) aircraft and its effect on the fan performance by commercial software CFX [15]. E. Nilolaou et al. performed a study on the thermal management of unmanned aerial vehicle power systems using ducted forced convection and computational fluid dynamic validation. The presented methodology demonstrates that the early integration of surrogate-based optimization in UAV inlet design can significantly improve aerodynamic and thermal performance [16]. Z. Li et al. conducted a study on the structural optimization of the aircraft NACA inlet based on BP neural networks and genetic algorithms. The BP neural networks and genetic algorithms were studied to optimize the design of the ram air inlet system. It was proven to be a novel approach, and the efficiency can be highly improved [17]. O. D. Almeida et al. performed study on a numerical approach for implementing air intakes in a canard-type aircraft for engine cooling purposes. Numerical studies via computational fluid dynamics were performed with the air intakes installed in the aircraft fuselage [18]. P. S. Drezek et al. conducted study on Kriging-based framework applied to a multi-point, multi-objective engine air intake duct aerodynamic optimization problem. This research focused on developing an aerodynamic optimization framework suited for multi-objective studies of small aircraft engine air intake ducts in multiple flight conditions [19]. J. Ren et al. performed an experimental study of the aerodynamic performance and flow characteristics of an integrated UAV inlet with double 90° bends. This study presents an experimental investigation of the aerodynamic performance and swirl flow characteristics of a UAV inlet with double 90° bends, which is also integrated with an aircraft fuselage as well as a volute [20]. G. Arena et al. performed a study on the design and testing of a passively adaptive inlet. In this paper, they exploited the taxonomy of post-buckling behaviors of a glass fiber panel to design an adaptive air inlet that passively regulates the fluid flow into a connected duct [21].
This review of previous research indicates that numerous studies have investigated the aerodynamic performance of different aircraft air intakes; however, relatively few have examined their design and structural behavior when fabricated from composite materials. To address this research gap, the present work determines the design loads through aerodynamic load analysis and applies the resulting load conditions to develop a carbon fiber composite air intake structure for small aircraft.
2. Aerodynamic Analysis
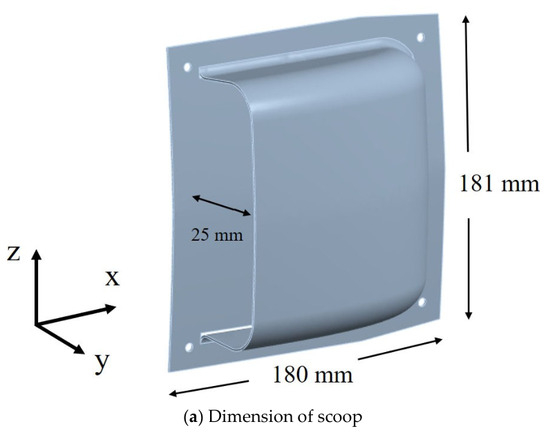
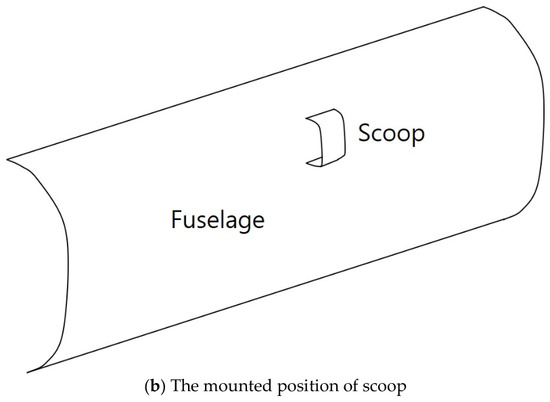
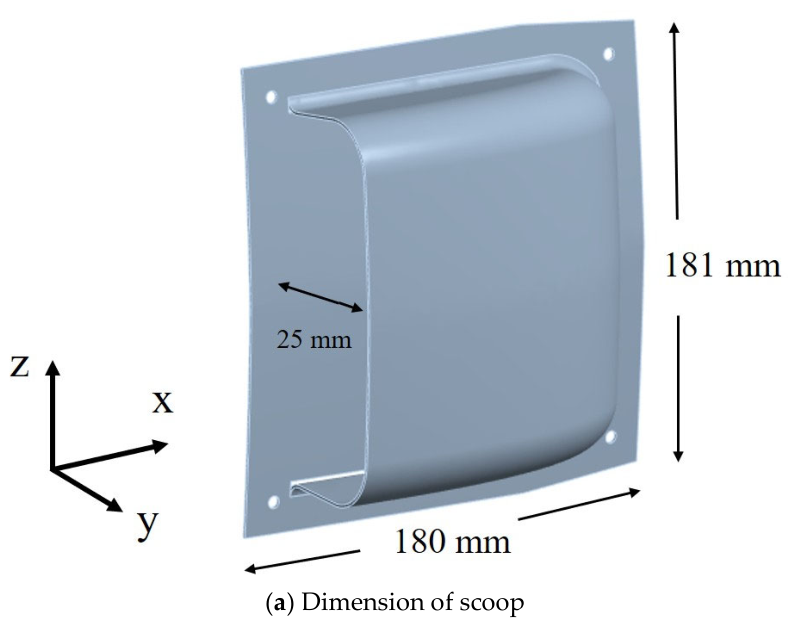
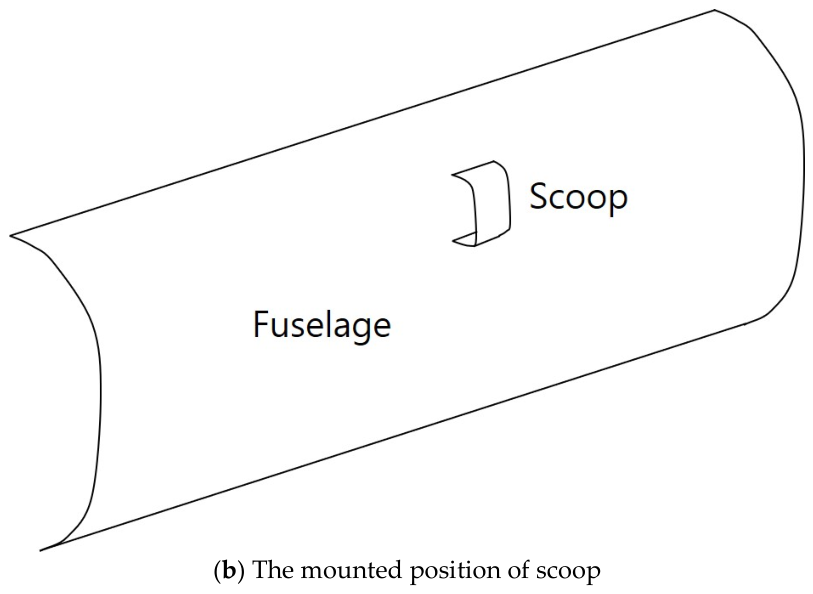
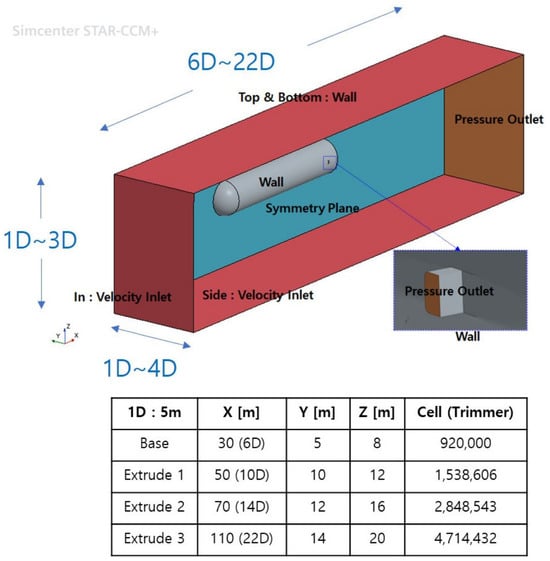
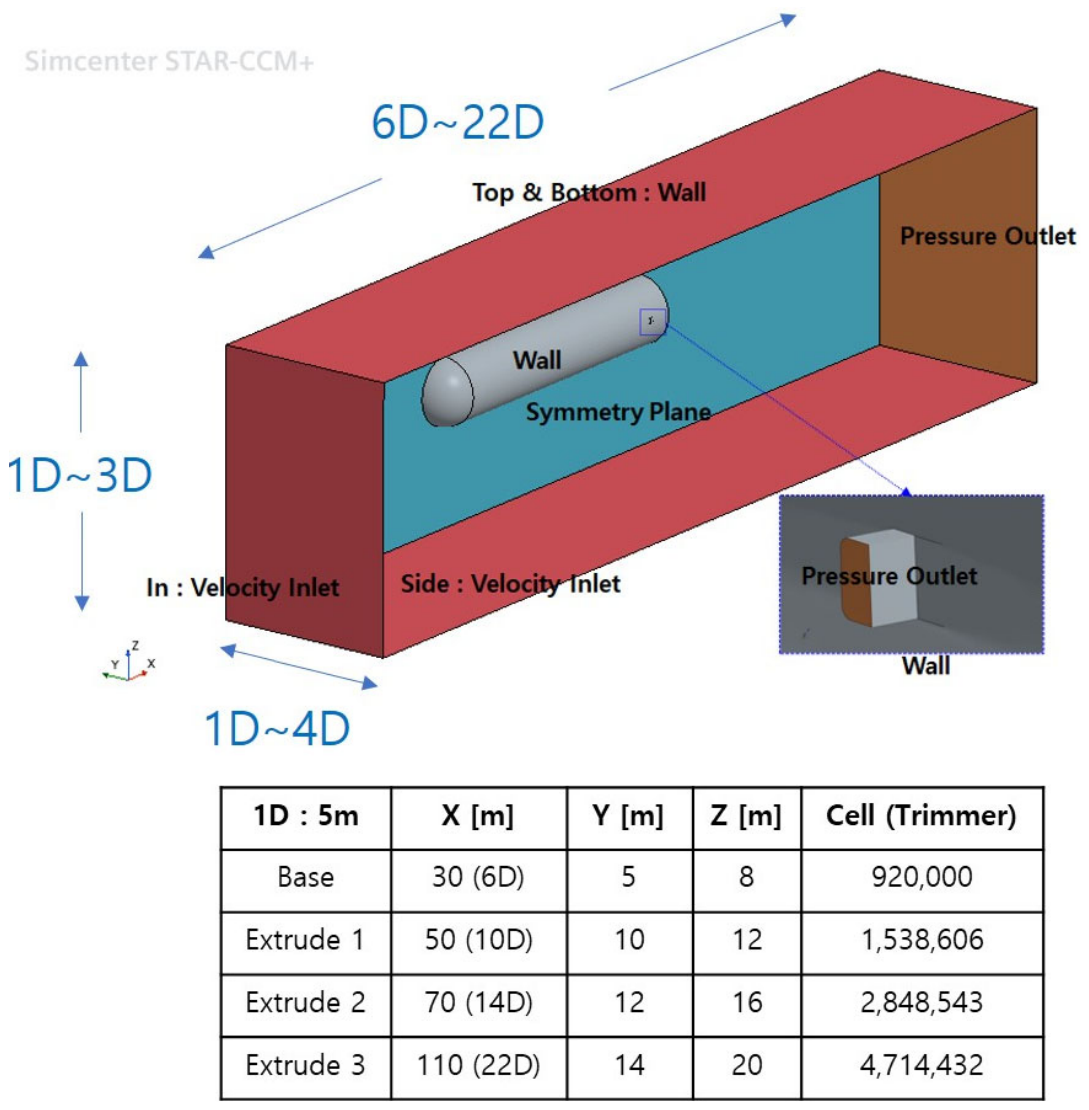
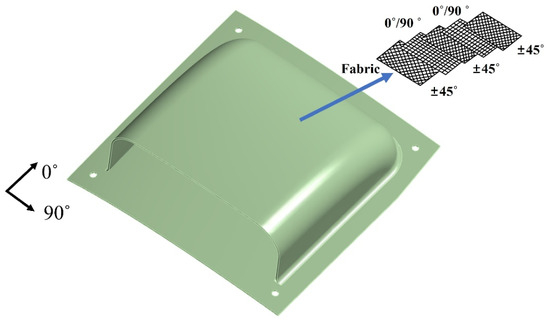
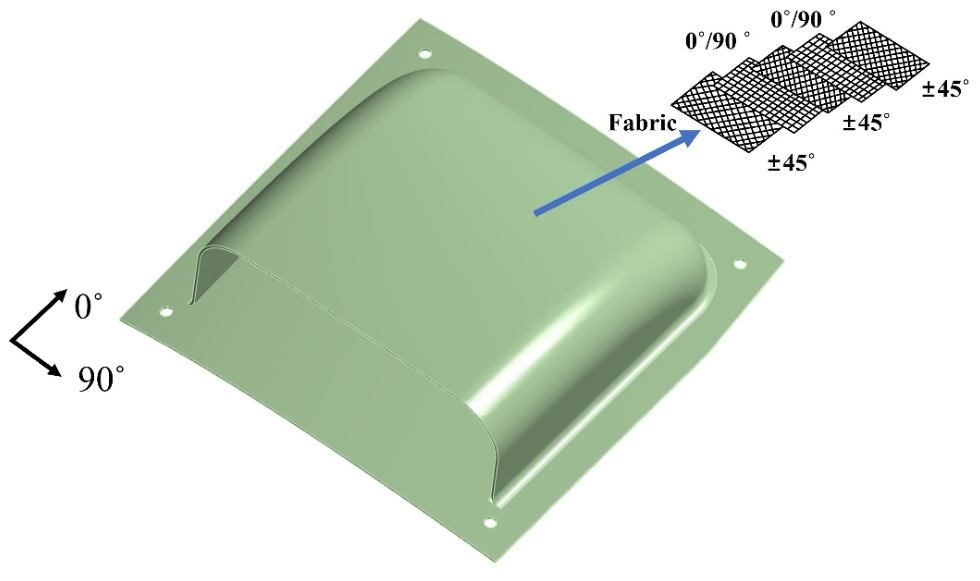
The maximum flight velocity of the target UAV is 280 km/h. Therefore, an aerodynamic analysis was performed by analyzing the aerodynamic shape. Figure 1 shows the shape of the scoop structure. The scoop structure is mounted on the side of the upper fuselage of the UAV. The commercial software package Simcenter STAR-CCM+ 2025 was used for aerodynamic analysis. Figure 2 shows the boundary condition and numerical dimension of the CFD analysis.
Figure 1.
The shape of the scoop structure.
Figure 2.
Boundary condition and numerical dimension for CFD analysis.
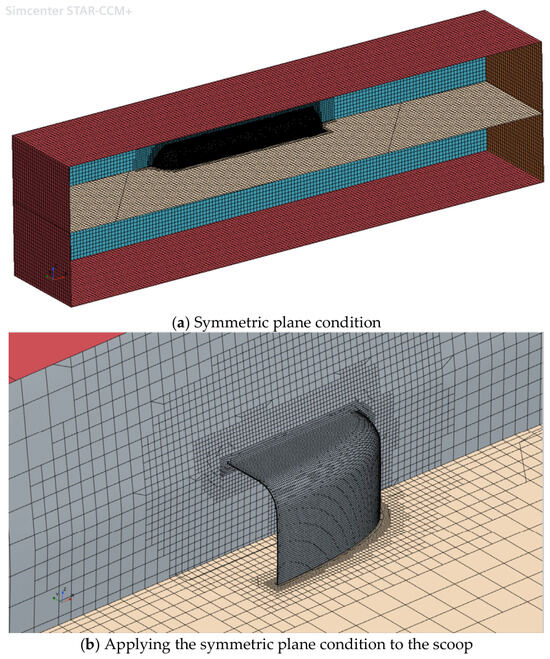
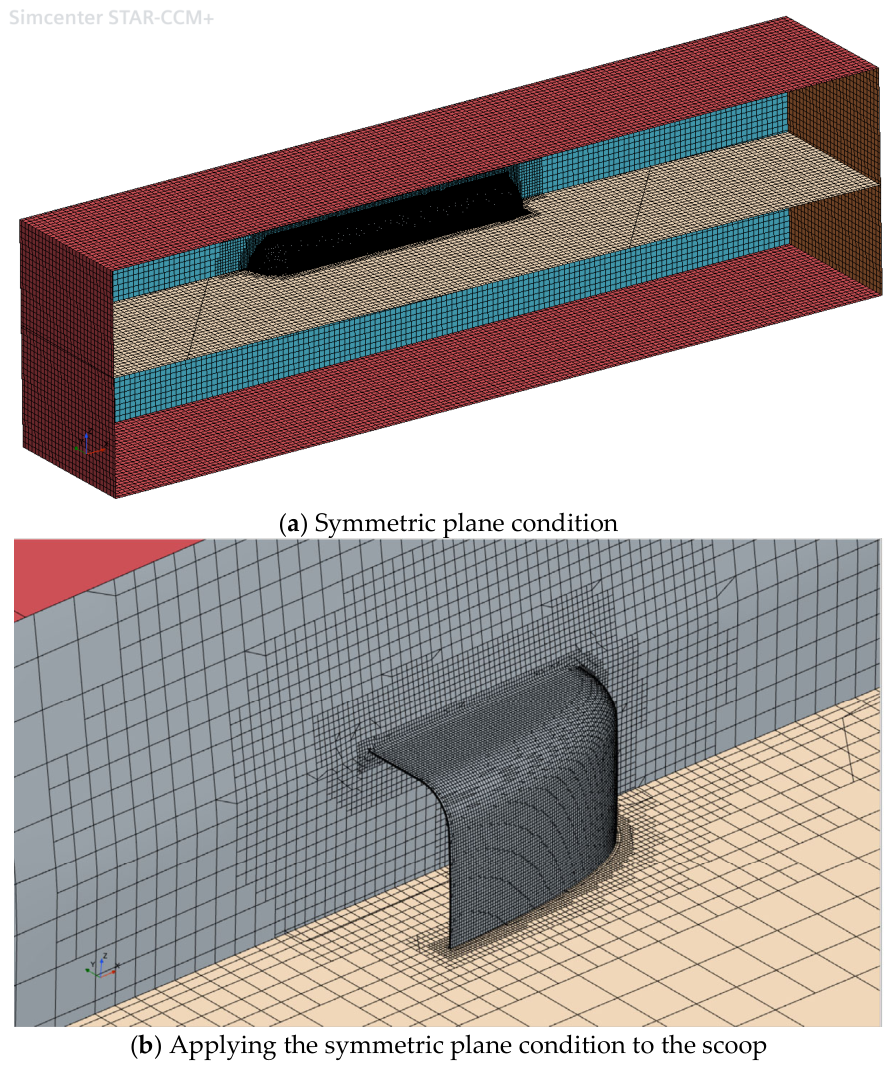
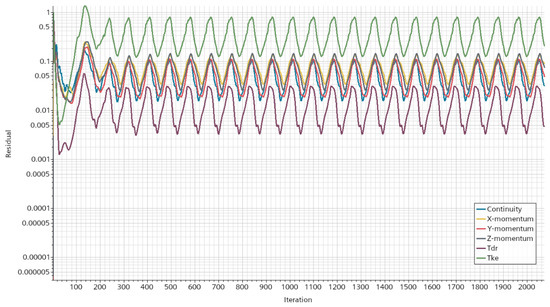
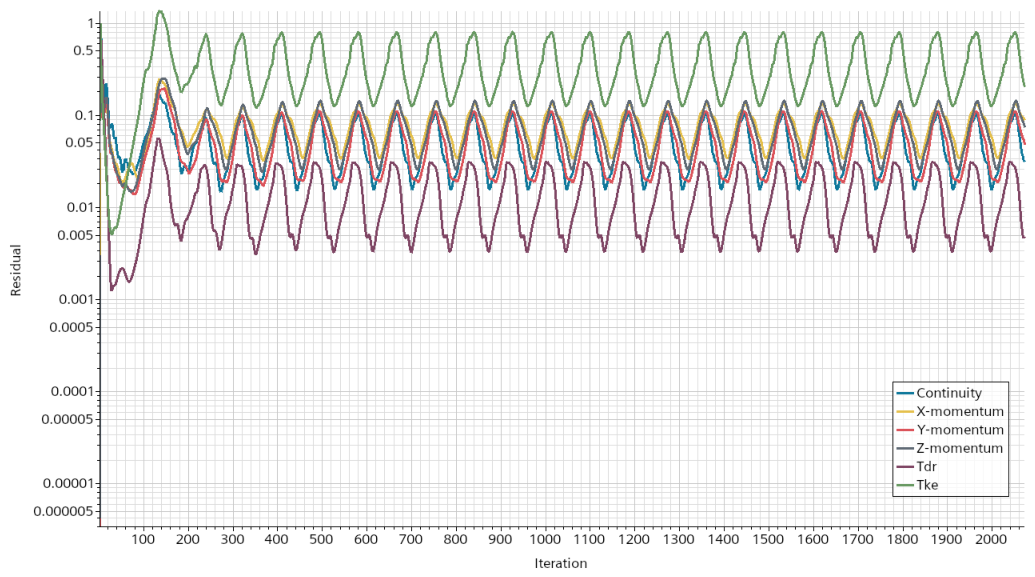
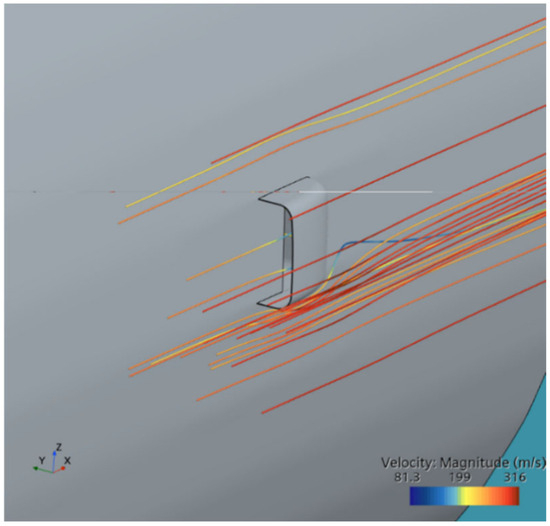
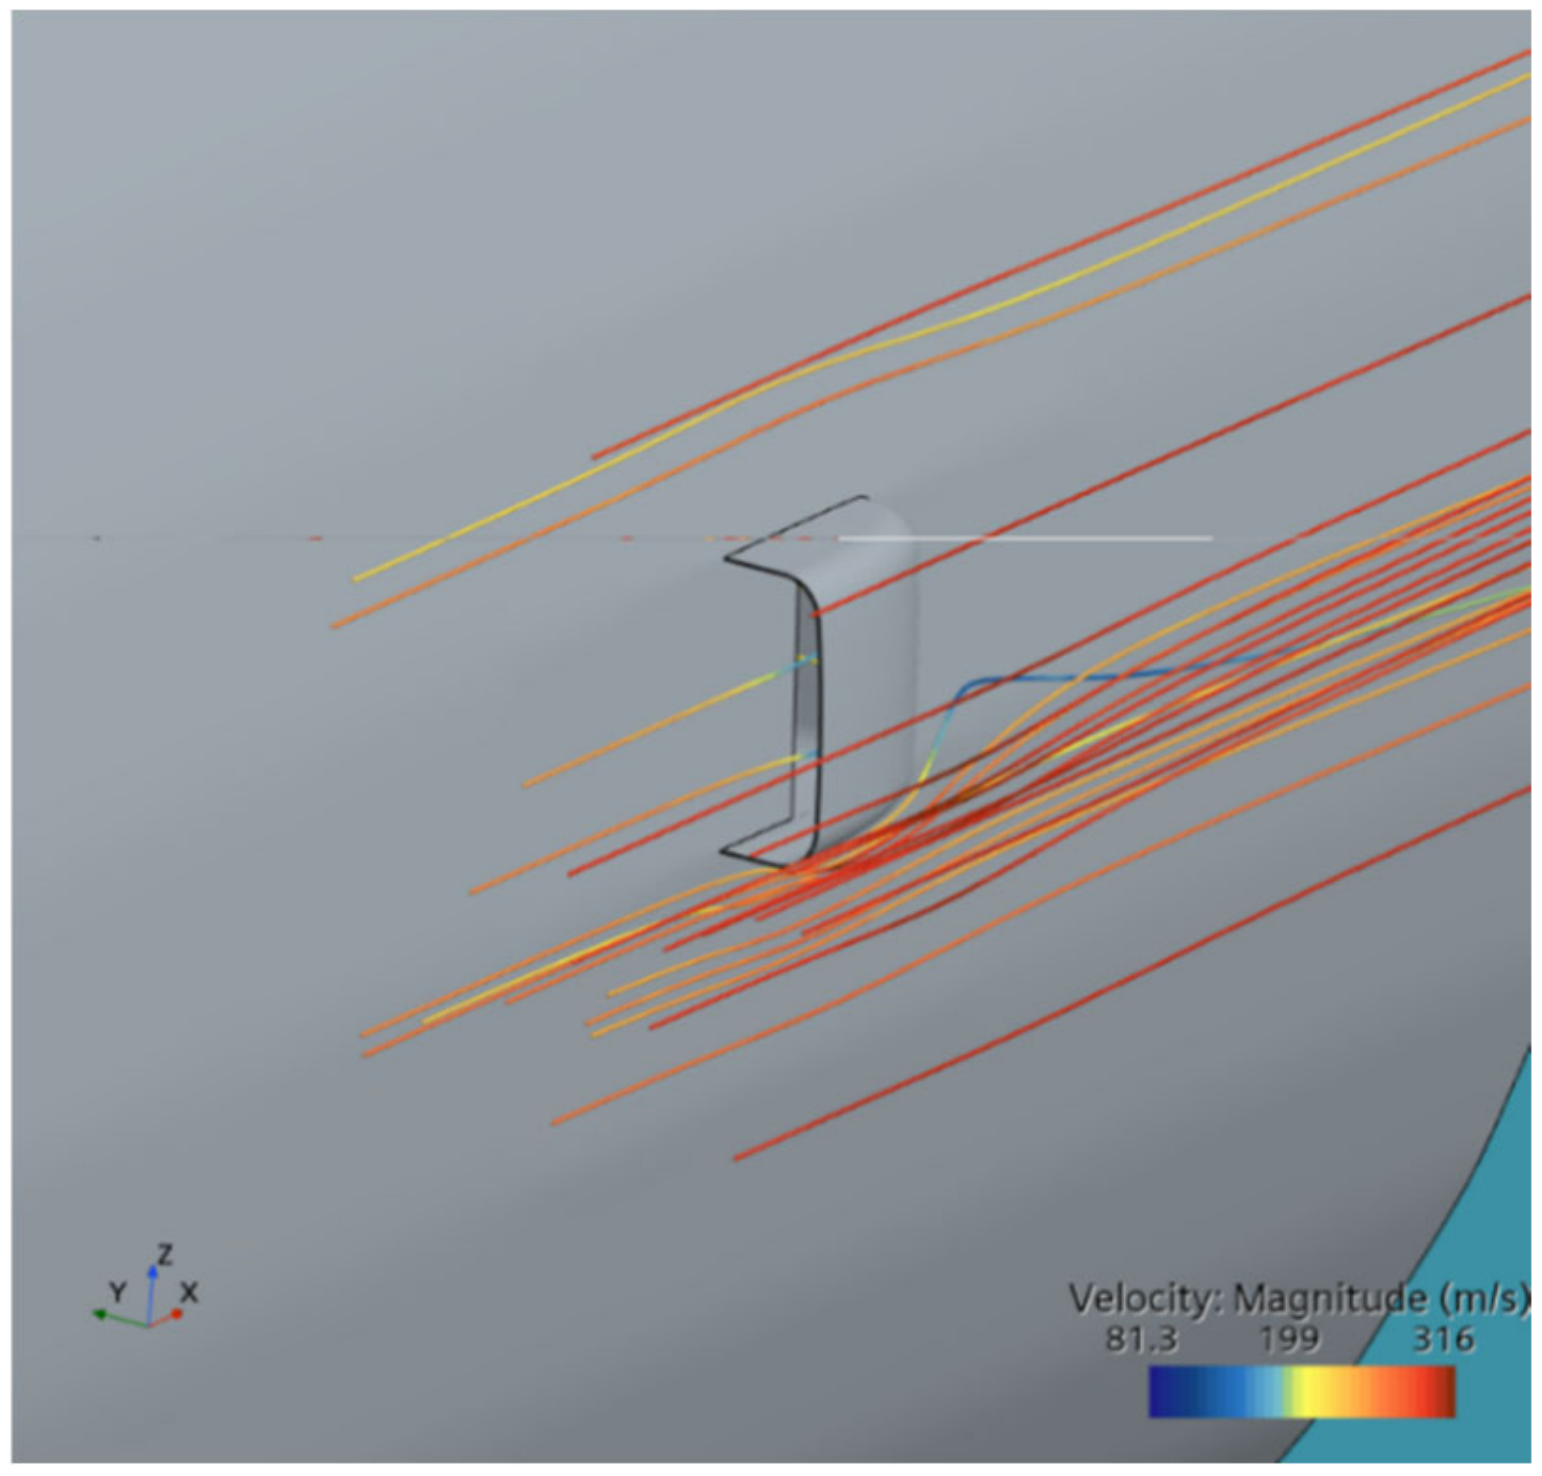
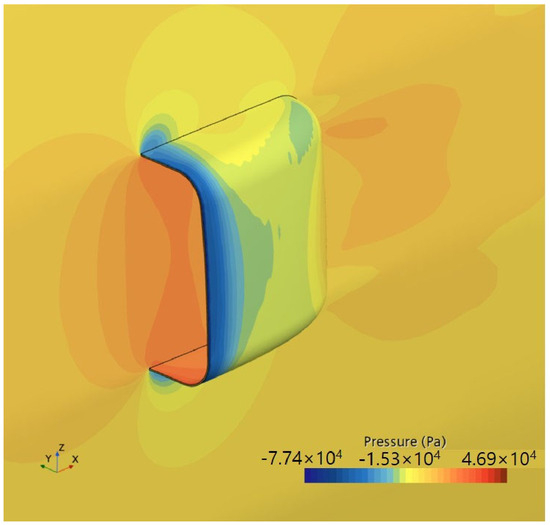
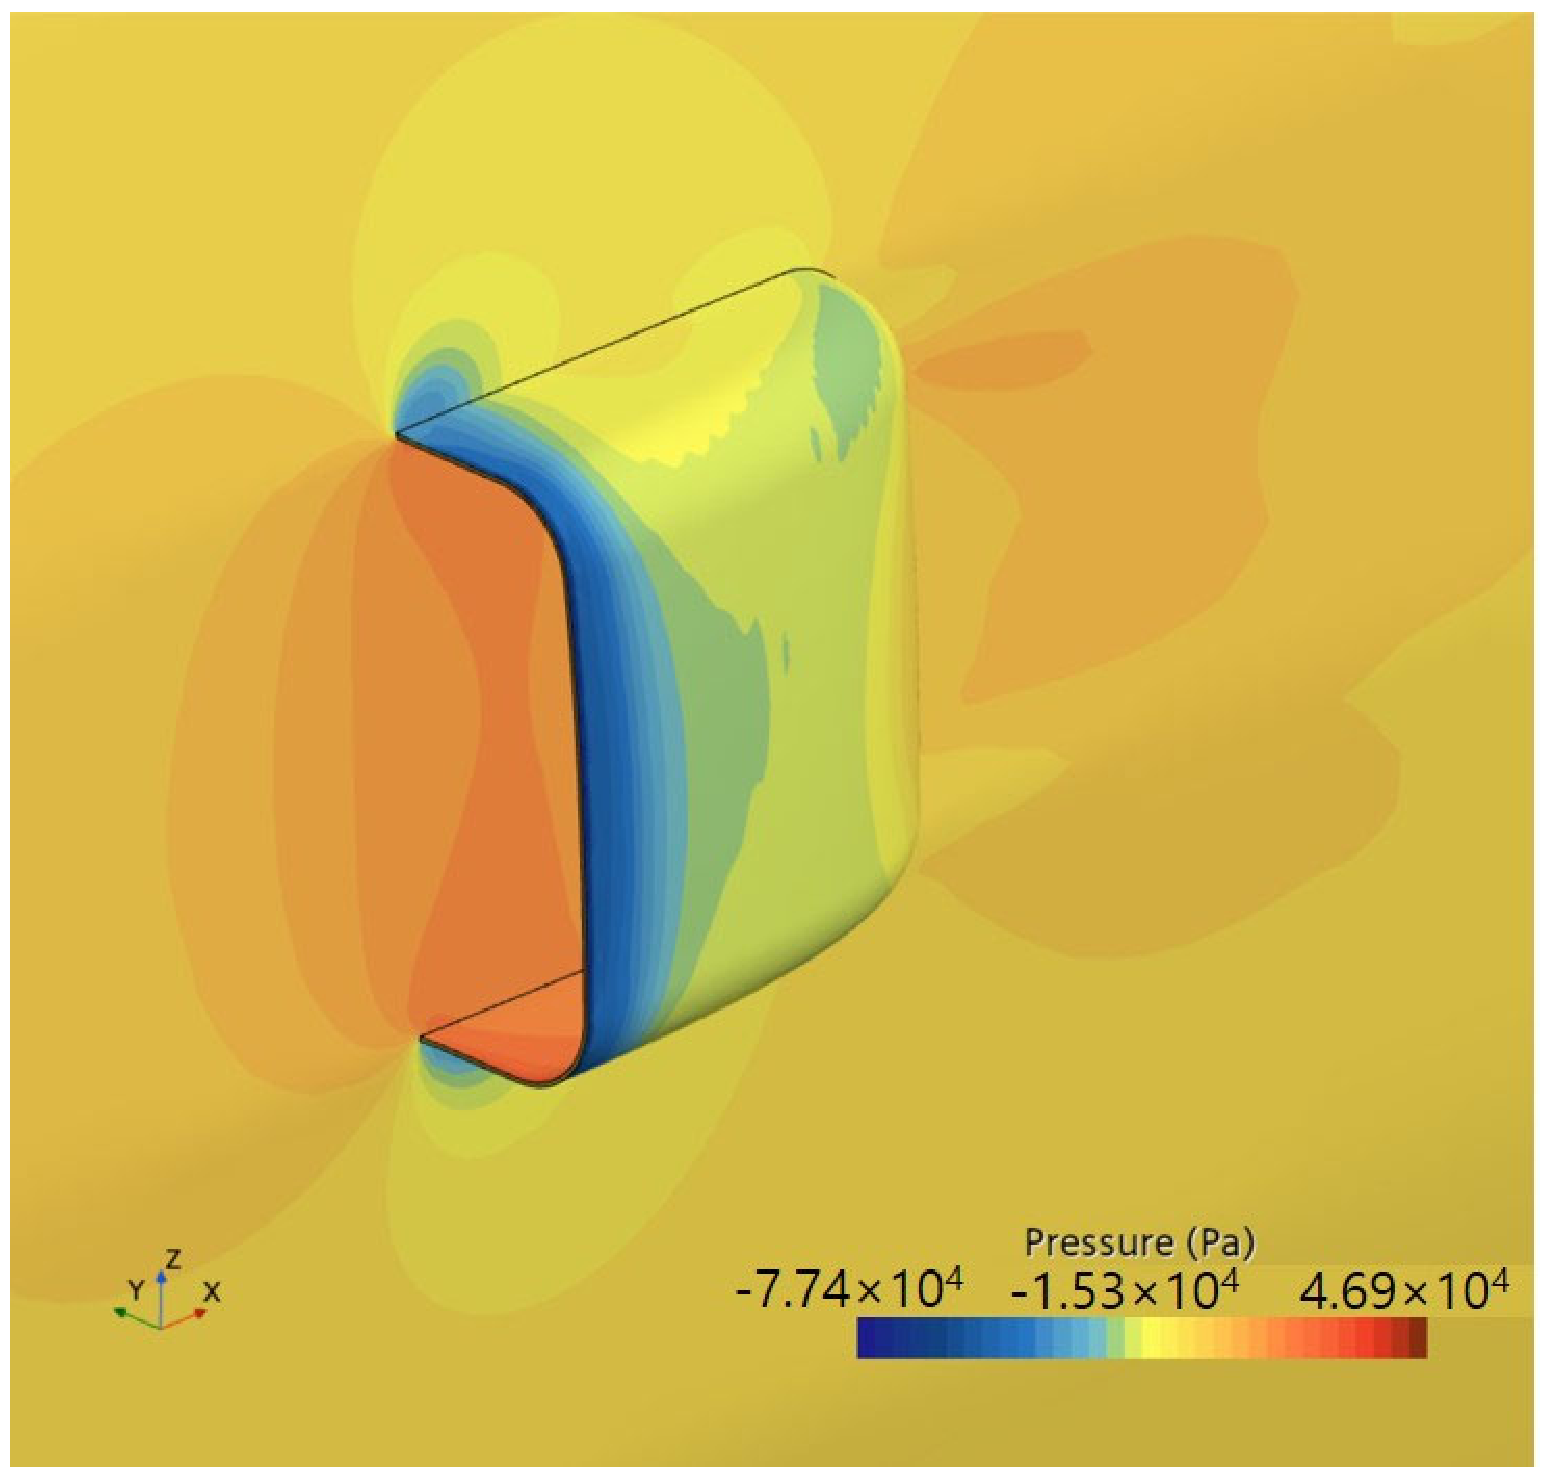
The convergence of the solution was first verified for the CFD analysis. The second-order numerical analysis was performed. The maximum number of steps is 4000 iterations. An analysis of 2000 iterations was performed. The numerical convergence was verified. To enhance the efficiency of numerical analysis, the CFD analysis was performed only on the 1/2 model due to its symmetrical shape. The wall conditions were configured for the inside and outside parts. Numerical analysis was performed by applying inlet and outlet conditions in the direction of flight velocity. The turbulence model is a realizable K-Epsilon two-layer. The wall treatment is two-layer all y+ wall treatment. The workstation was used as the equipment for the CFD analysis. The CPU was an Intel Xeon silver 4216 (2.10 GHz). The GPU was an NVIDIA Quadro P1000 (4 GB). Figure 3 shows the mesh generation for CFD analysis. Figure 4 shows the CFD simulation to verify numerical convergence. Figure 5 shows stream line result through numerical analysis. The streamline results show that the freestream remains relatively uniform away from the structure, whereas significant flow deflection and velocity gradients develop near the leading edge and lower corner of the scoop. A low-velocity region is formed near the windward surface because of flow deceleration, while the flow locally accelerates as it passes around the lower edge. The pronounced streamline curvature near the sharp corner indicates a strong pressure gradient and a potential for flow separation. Therefore, the lower lip and the junction between the scoop and the vehicle surface are identified as the critical regions governing aerodynamic loss and local pressure loading. The analysis results were confirmed to be valid. Figure 6 shows the pressure distribution results obtained through numerical analysis. The structural design loads were investigated based on the results of the aerodynamic load analysis. Figure 5 shows the trajectories and velocity variations of the flow captured by the intake and the flow diverted around the exterior. Figure 6 presents the corresponding surface static pressure distribution. The flow accelerates as streamlines converge and refract at the outer edge. As a result, the static pressure drops, creating a low-pressure region indicated in blue. For the flow entering the interior, the dynamic pressure is recovered as static pressure through duct expansion and deceleration, resulting in relatively higher pressure on the internal surface. Furthermore, no large-scale separation or vortices, such as closed streamlines or reverse flow, are observed. The pressure also recovers gradually and locally, indicating that the flow remains stably attached. Therefore, the velocity and pressure variations shown in the two figures are physically consistent with each other, confirming that the pressure distribution in Figure 6 is a valid result.
Figure 3.
Generated mesh for numerical analysis.
Figure 4.
The CFD simulation to verify numerical convergence.
Figure 5.
The configuration of stream line through CFD analysis.
Figure 6.
The pressure distribution results obtained through numerical analysis.
A symmetric half-model was employed to improve computational efficiency, yielding approximately 920,000 trimmed cells. To accurately resolve the rapid pressure variations near the duct edge, the minimum grid size was established at 2 mm. Four computational domain sizes were subsequently evaluated for boundary independence. In terms of computational turnaround time, the configuration with the smallest grid count was preferred. The difference between the domain sizes (Extrusions 3 and 2) remained within approximately 0.6%, demonstrating that domain sensitivity is negligible. Accordingly, the first case was selected for the fluid–structure interaction (FSI) process. Considering the characteristics of turbulent flow analysis based on RANS, a grid resolution of 2 mm applied to the main pressure distribution area was found to be sufficient for examining the main characteristics of the flow field. To properly reflect the near-wall effect within the boundary layer, the realizable k-ϵ Two-Layer model was adopted. It is a subsonic region where the inlet flow velocity is at the level of 280 m/s and no shock wave is generated. A segregated flow technique with excellent computational stability and efficiency was adopted.
The abnormal pressure values shown in the current analysis results are due to the boundary conditions being set without fully reflecting the actual detailed geometry inside the duct and the pressure drop of the system within the duct. The total pressure and static pressure distributions were overestimated due to the simplified path that did not account for flow losses caused by internal structures.
3. Structural Design and Analysis
The pressure distribution obtained through CFD analysis was applied as a structural load. The structural design was performed by analyzing structural design loads. Structural design was performed using carbon composite materials. Structural loads derived from aerodynamic analysis were applied for the design, and carbon fabric composite materials were utilized. Epoxy resin was applied. The structural design constraints were designed by considering strain limitations. The carbon/fabric compression strain limit condition was 0.3%.
In this study, the design was performed with consideration of compressive strain limit condition. The initial structural design applied a simplified composite design approach in which only the fibers aligned with the load direction are assumed to carry the load. The design result obtained from this simplified method was improved using a rule of mixture design approach [22]. The rule of mixture design method is a lightweight composite design theory. It is a theory that assumes fibers arranged in directions other than the direction of the load contribute 10% to the original strength. The target structure has a curved shape. Therefore, the structure is a thin shell type structure. The design philosophy was based on buckling strength. The initial design was based on classical lamination theory [22]. The stacking sequence of the composite laminated structure was defined as follows: Laminate sequence is [(±45°)/(0°/90°)/(±45°)/(0°/90°)/(±45°)]. The [0°/90°] plies carry the longitudinal bending and membrane loads along the flow direction of the scoop. The [±45°] plies placed at the outer/inner surfaces and mid-plane provide in-plane shear stiffness and torsional rigidity, which dominate in the doubly curved dome under asymmetric pressure. The joints are fastened with bolts. Therefore, fixed boundary conditions were applied to the fastening regions. This approach provides a more conservative assessment. After structural design, stress analysis was performed using the commercial software ANSYS 2024 R2.
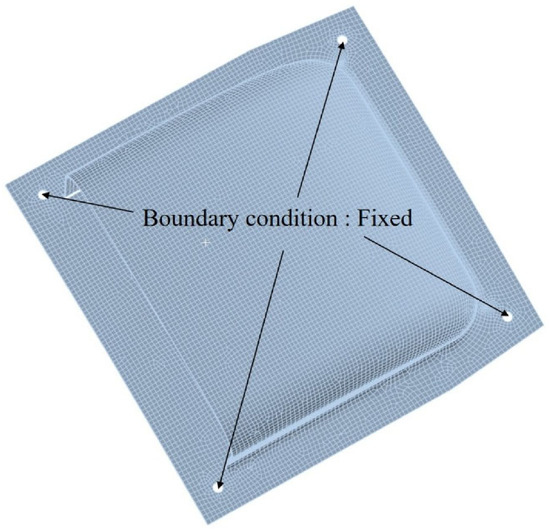
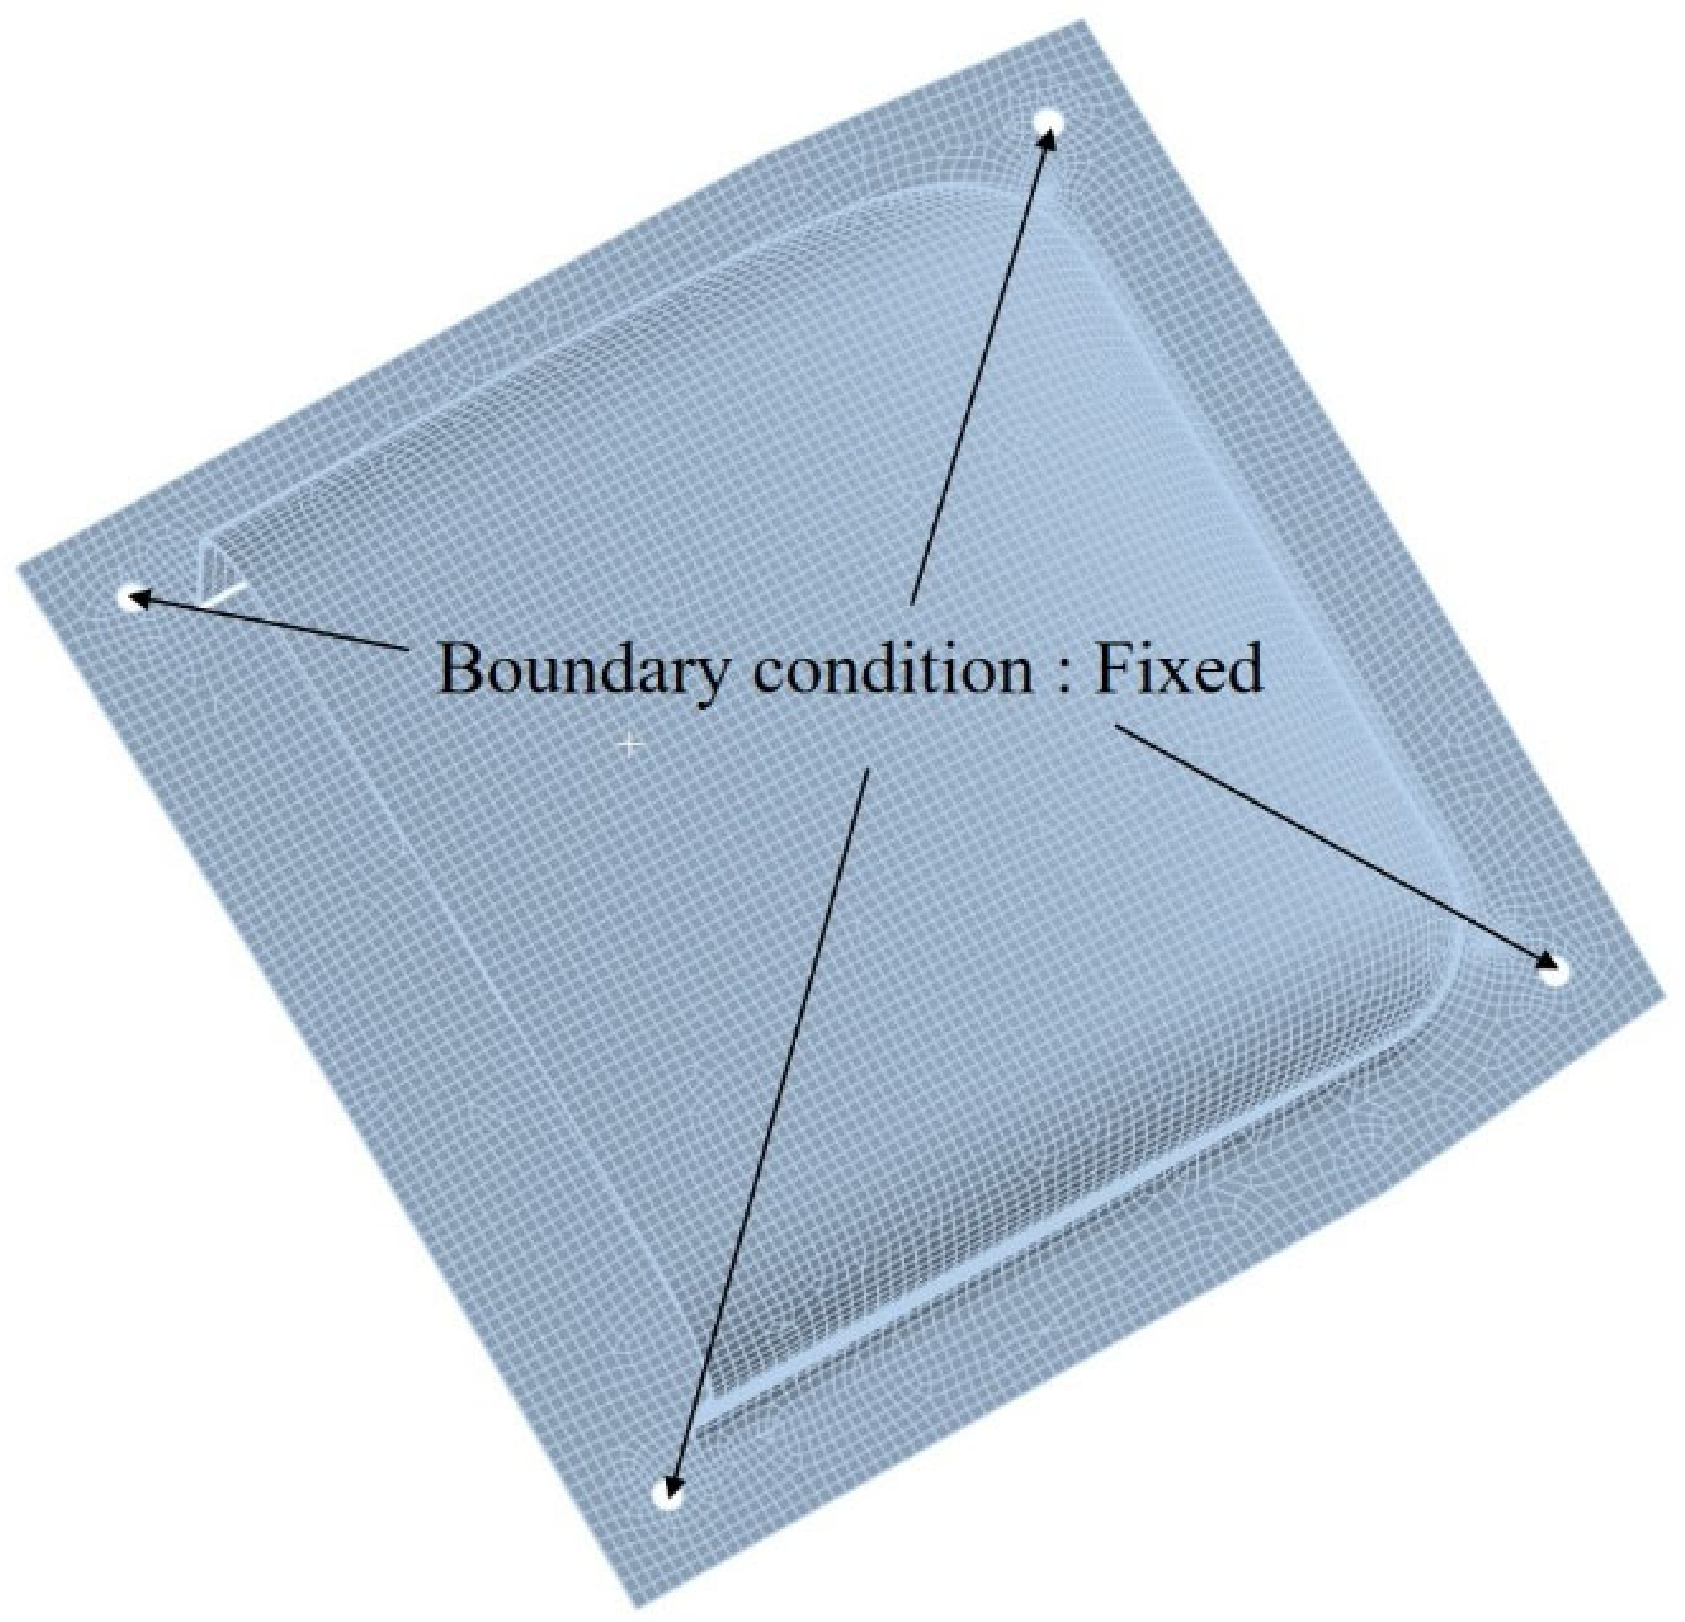
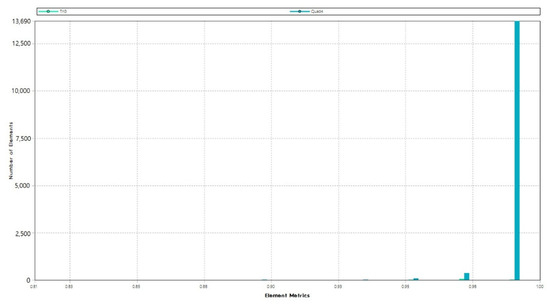
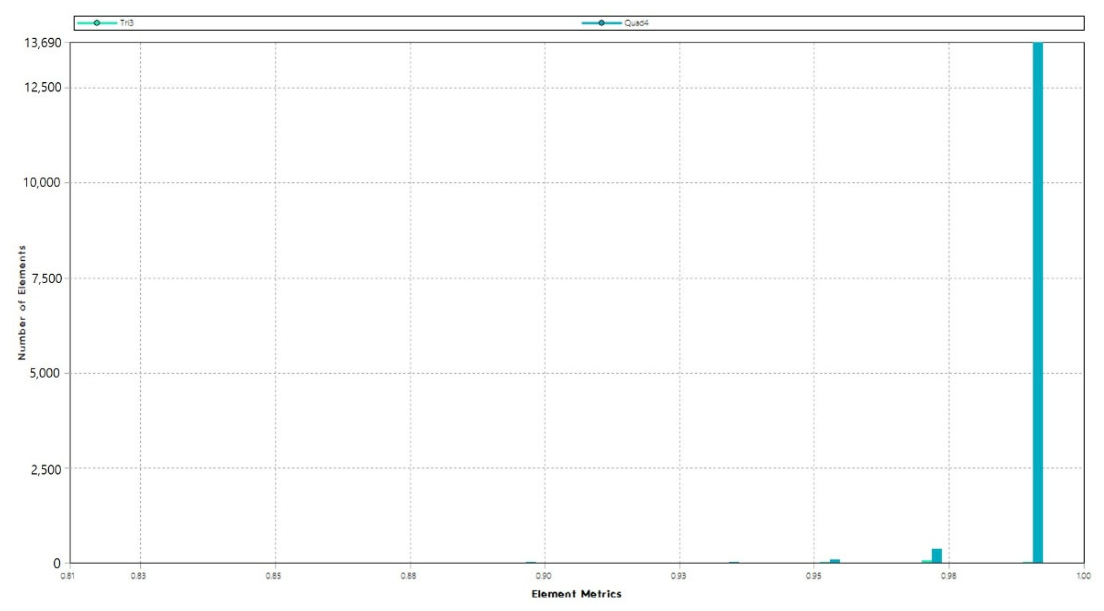
The structural design results were evaluated for safety through structural analysis. A finite element analysis model was generated by analyzing the 3D geometry of the structure subject to analysis. Figure 7 shows the finite element analysis model generated for the structural analysis in this study. A total of 282,310 elements were generated for the structural analysis. The shell elements were used for the finite element model. Both three-node and four-node shell elements were employed. The connection points on the four sides of the bottom section were fixed for boundary conditions. These boundary conditions are shown in Figure 7. The mesh quality of the model was validated for finite element structural analysis. The Figure 8 shows mesh quality of the FE model. Structural analysis was performed by applying a safety factor of 1.5 to the loads, taking into account both distributed pressure loads and acceleration conditions. The load conditions are specified in Table 1. The applied acceleration conditions were provided by Korea Aerospace Industries (KAI), the UAV manufacturer. In the design and testing of UAV, the 20 G acceleration condition serves as a highly valid and widely accepted standard that aligns with operational objectives and environmental specifications. The 20 G condition represents the standard acceleration value for “Functional Shock” as defined in MIL-STD-810G (Method 516.6)—the U.S. Department of Defense’s environmental test standard—and DO-160, the standard for equipment installed on civil aircraft [23].
Figure 7.
The finite element modeling for structural analysis.
Figure 8.
The mesh quality of the FE model.
Table 1.
Applied loading conditions.
The aerodynamic pressure distribution obtained from the converged CFD solution was transferred to the structural finite element model through a one-way fluid–structure interaction (FSI) mapping procedure. Surface pressure data extracted from the CFD domain on the scoop and internal surfaces were exported and mapped onto the corresponding nodes of the composite shell structure using ANSYS System Coupling. Because the CFD mesh and the structural mesh were generated independently and therefore possess non-conforming topologies, a nearest-neighbor or profile-preserving interpolation scheme was applied to project the pressure field onto the structural surface while preserving the spatial gradient and local peak values of the load distribution, particularly in regions prone to flow separation or high curvature.
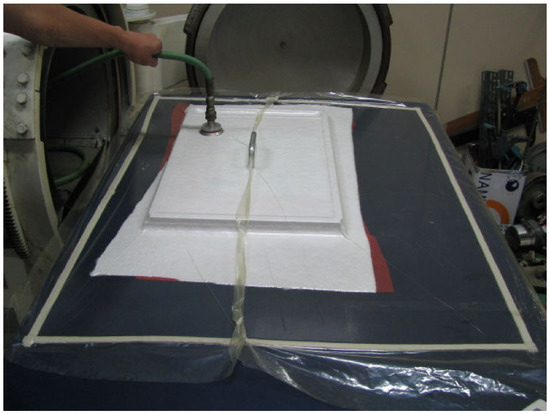
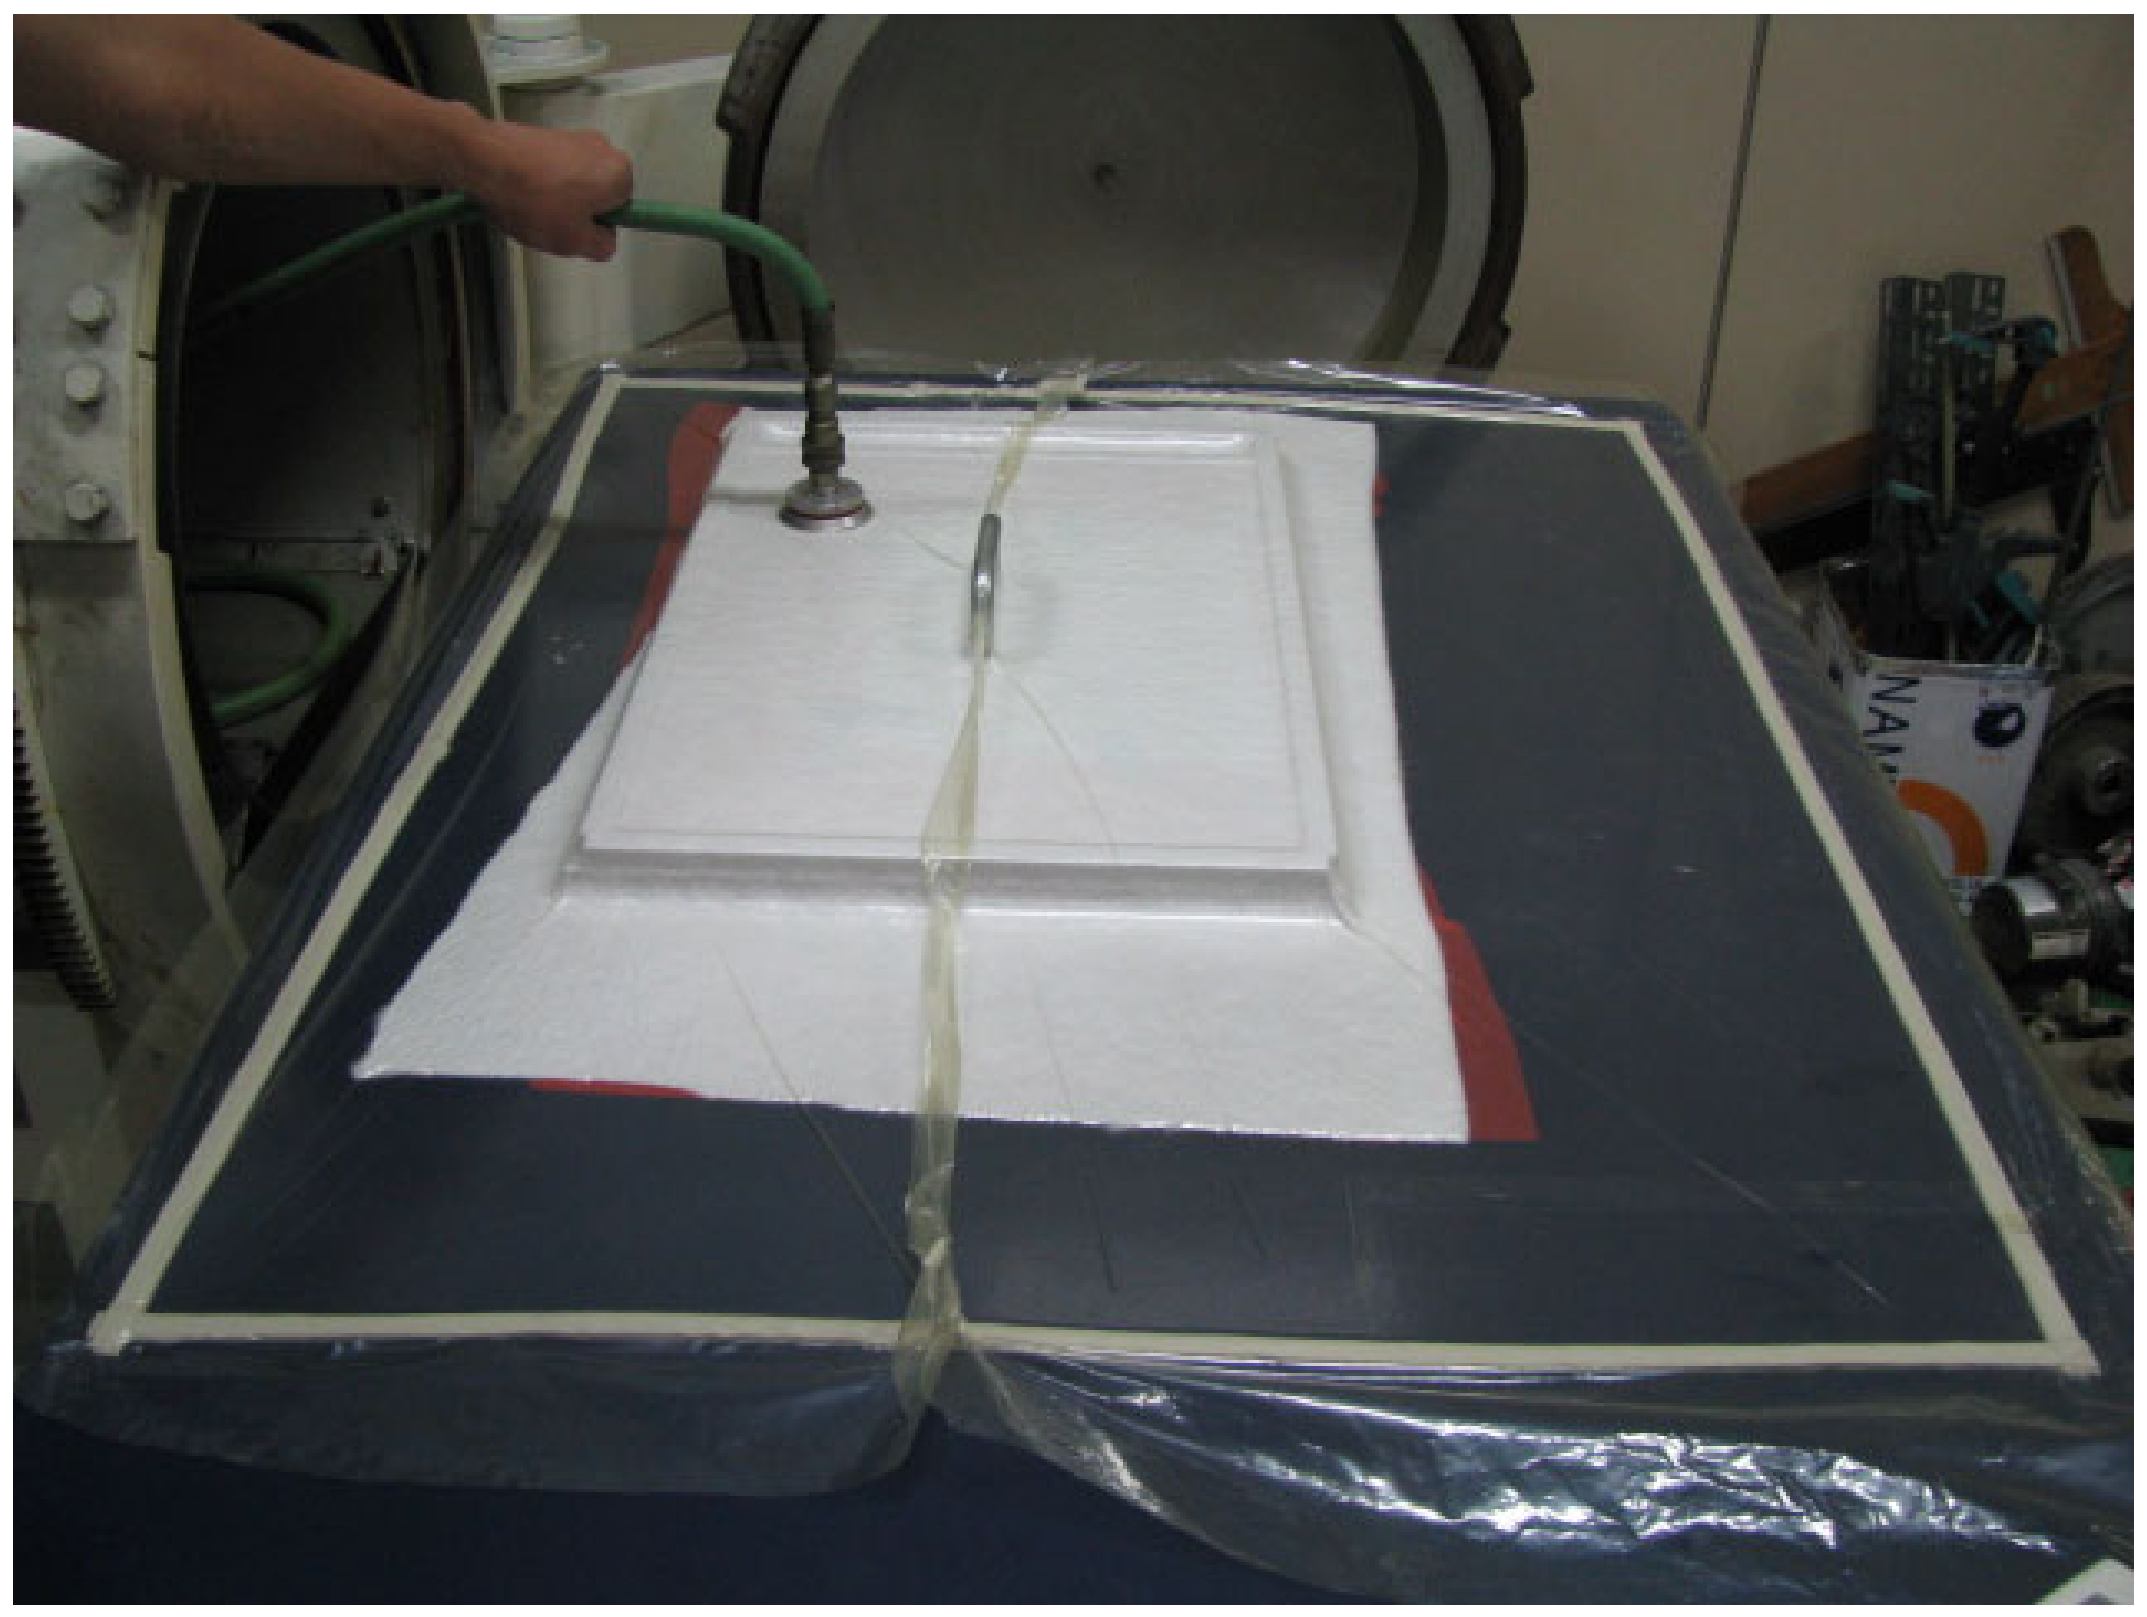
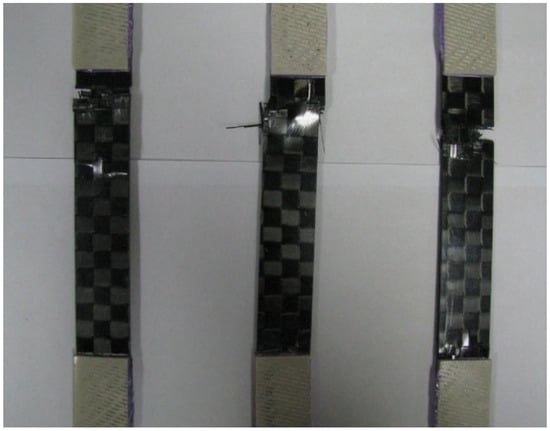
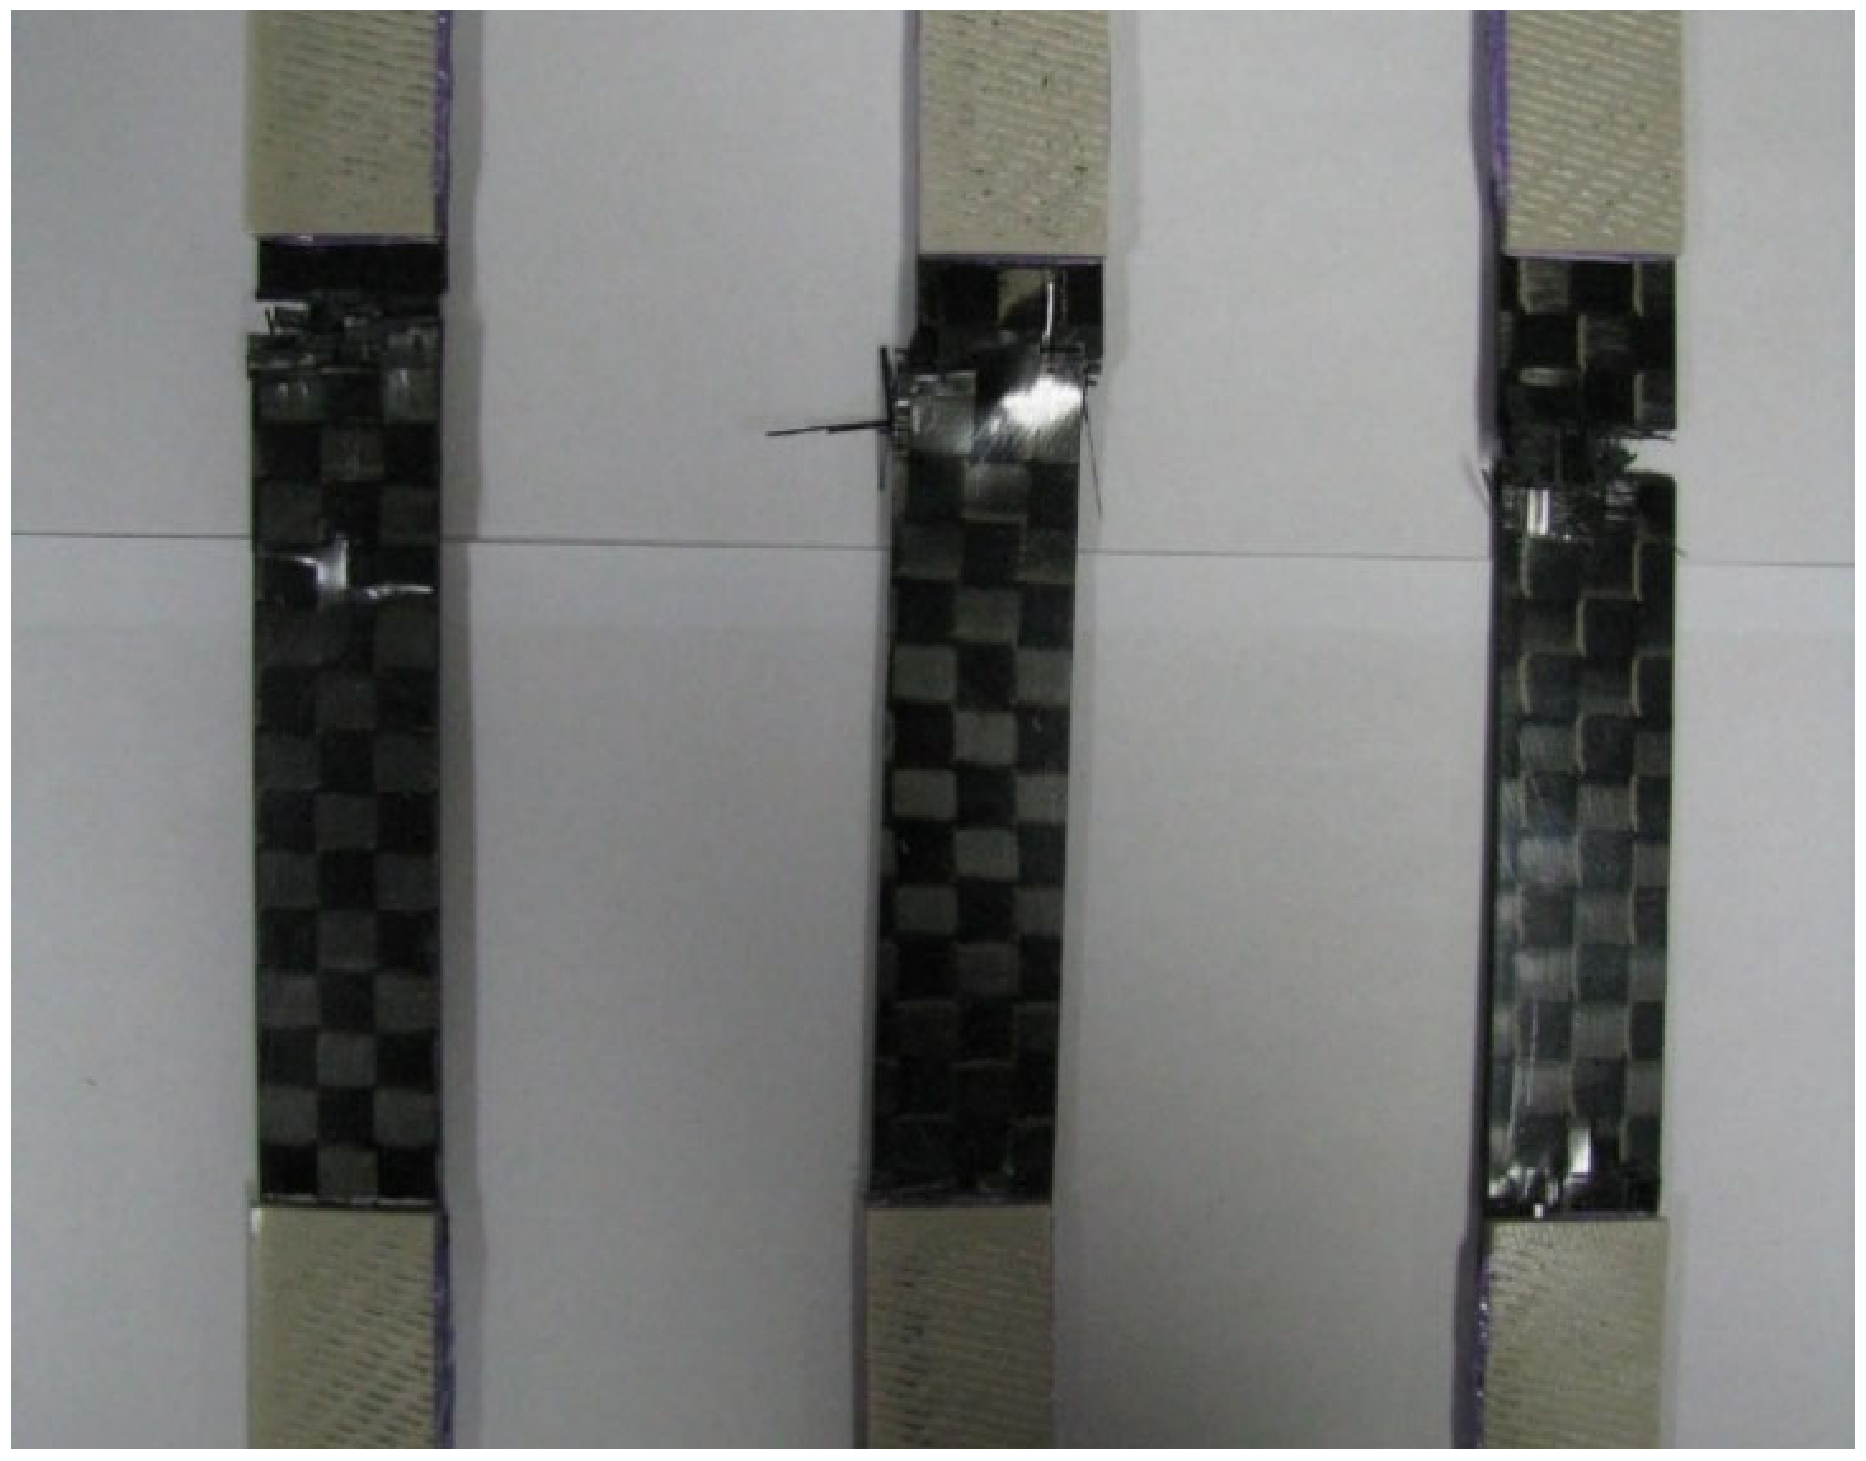
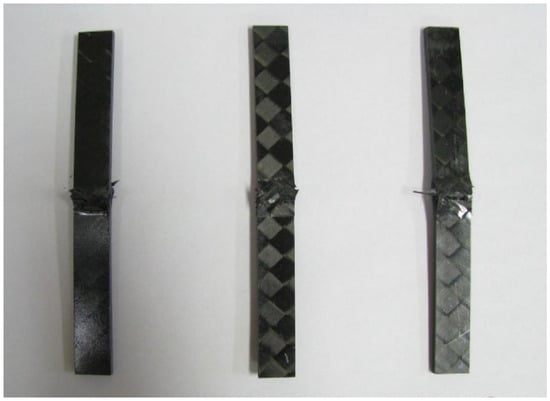
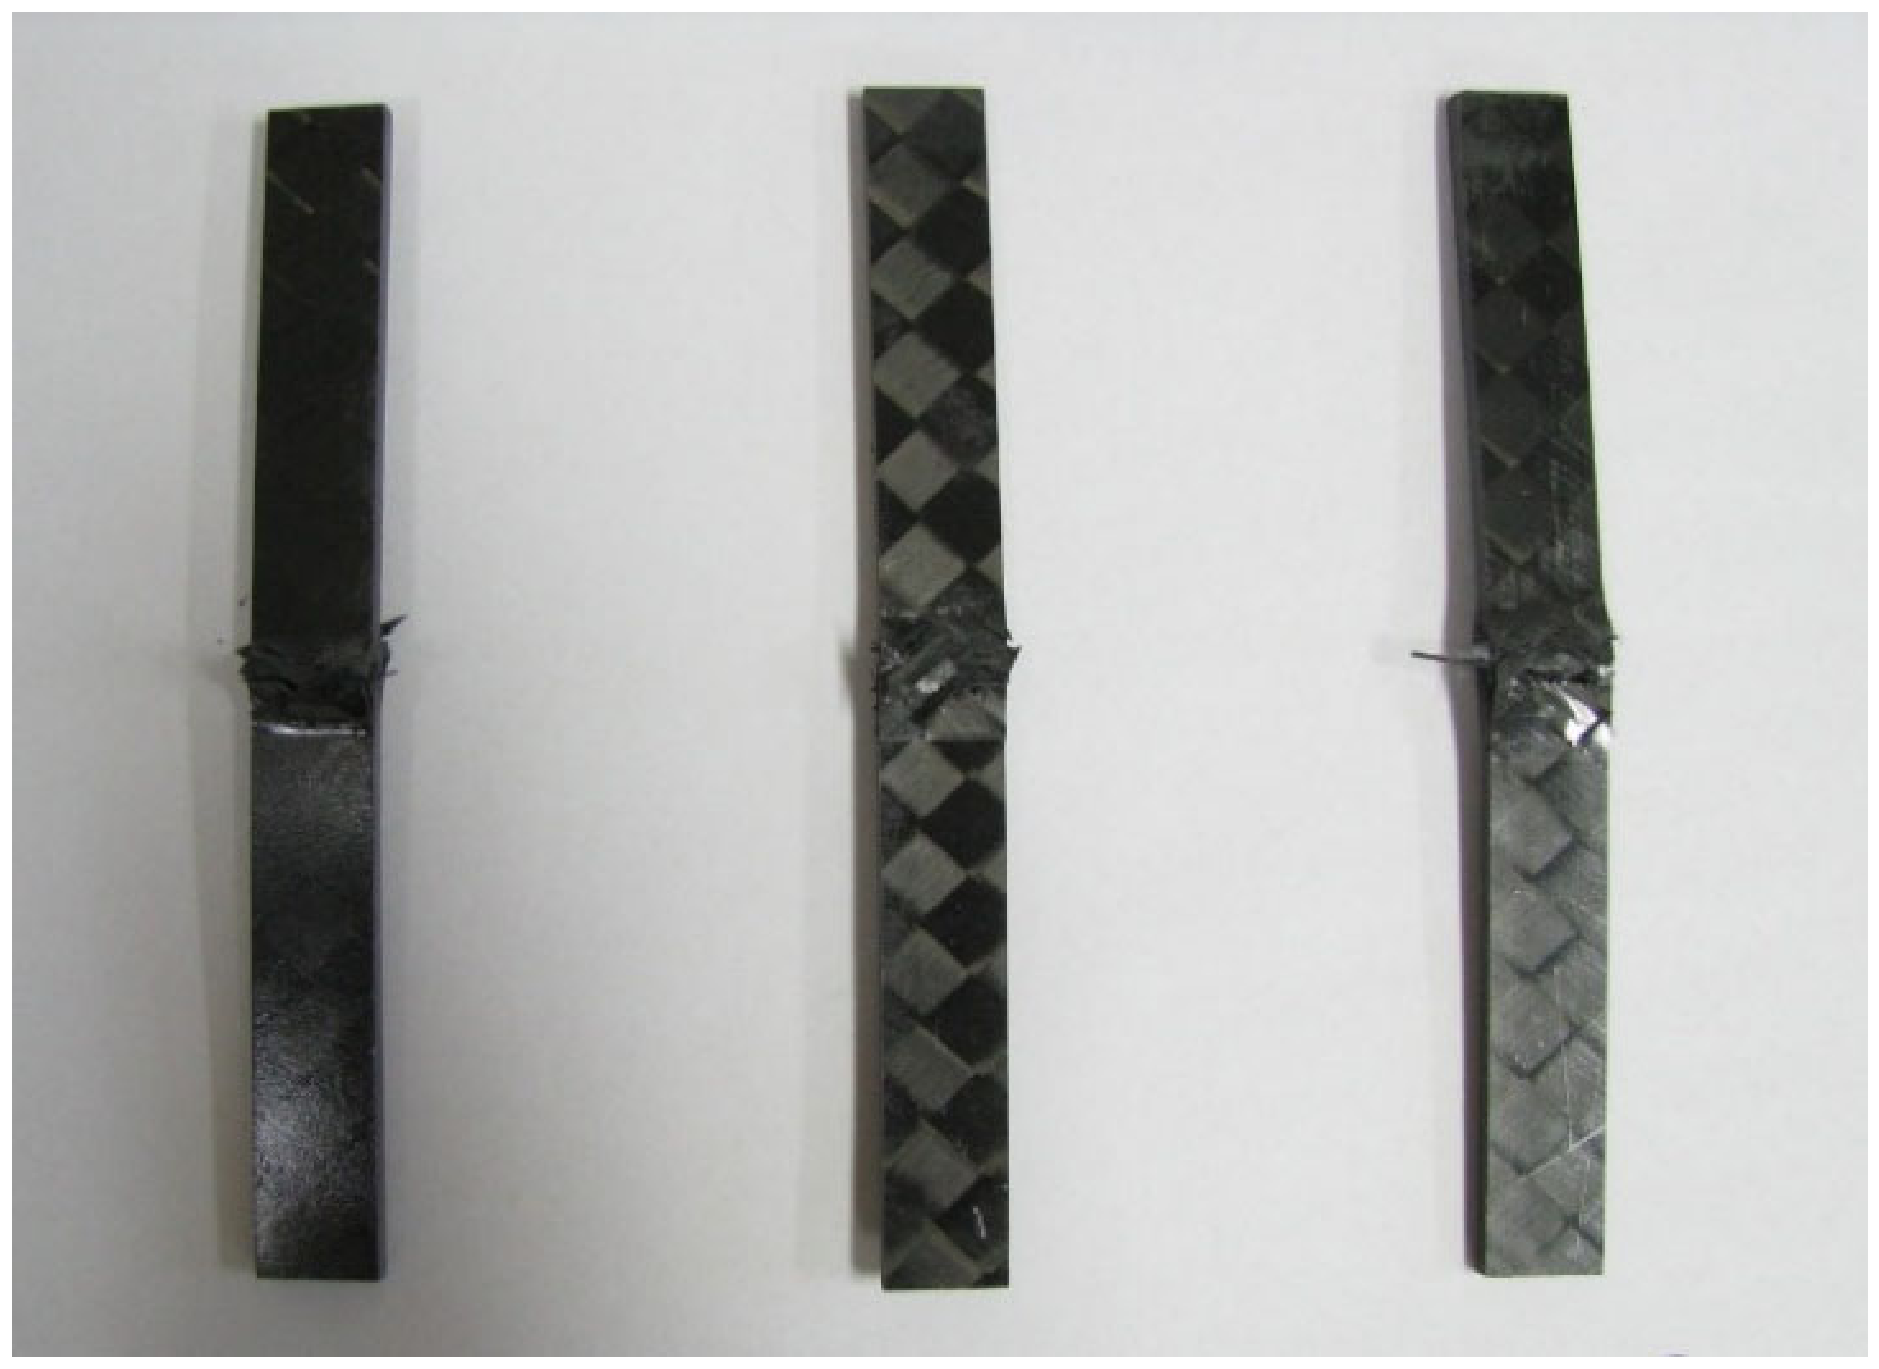
The carbon/epoxy material was used for the structural design and analysis. Based on prior research regarding materials for small aircraft manufacturing, the material properties of Toray’s carbon/epoxy fabric prepreg (F6273C-07M, TORAY Industries Inc., Tokyo, Japan) were applied. This specimen was manufactured using an autoclave at the Dept. of Aerospace Engineering, Chosun University, Gwangju city, Rep of Korea. The specimen test was performed using static material testing system NFEC-2007-10-001003 at Future Mobility Platform Reliability Core Center in Kunsan National University, Gunsan city, Republic of Korea. Table 2 presents the mechanical properties of the material investigated through specimen testing. Figure 9 shows manufacturing process for laminate. The specimen of tensile and compressive test was shown in Figure 10 and Figure 11. Figure 12 shows structural design results.
Table 2.
Mechanical properties of composite material.
Figure 9.
Manufacturing of carbon/epoxy fabric laminate using Autoclave.
Figure 10.
Specimen of tensile test for mechanical properties [24].
Figure 11.
Specimen of compression test for mechanical properties [25].
Figure 12.
Laminate sequence of target structure.
Load case 1 is a −6 G acceleration condition for the z-axis. The structural analysis results of load case 1 indicate that the maximum stress in the outermost external layer 1 is 2.642 MPa in tension and 3.985 MPa in compression. For internal layer 2, the stresses are 1.580 MPa in tension and 1.896 MPa in compression, while for the innermost layer 5, the stresses are 4.927 MPa in tension and 1.666 MPa in compression. Therefore, the result of structural analysis confirms that the design is sufficiently safe. The displacement analysis shows a maximum displacement of 0.405 mm at the edge, which is also within a safe range. Buckling stability was evaluated by examining the buckling load factor. A buckling load factor is the multiplier that shows how much applied loads must increase to cause a structure to buckle. The result of buckling analysis indicates that the first buckling load factor is 33.656, demonstrating that the structure is sufficiently stable against buckling.
Load case 2 corresponds to +3 G acceleration in the z-direction, and the results were found to be similar to result of load case 1. The structural analysis shows that the maximum stress in the outermost external layer 1 is 2.694 MPa in tension and 1.703 MPa in compression. For the internal layer 2, the stresses are 1.440 MPa in tension and 1.139 MPa in compression, while for the outer layer 5, the stresses are 0.571 MPa in tension and 1.807 MPa in compression, confirming that the structure is sufficiently safe. Displacement analysis was performed. The maximum displacement is 0.397 mm at the edge, which is also within a safe range. The buckling analysis shows that the first buckling load factor is 34.335, demonstrating that the structure is sufficiently stable against buckling.
Load case 3 is +2 G acceleration in the y-direction. The structural analysis shows that the maximum stress in the outermost layer 1 is 2.451 MPa in tension and 3.819 MPa in compression. For the internal layer 2, the stresses are 2.280 MPa in tension and 2.748 MPa in compression. For the internal layer 5, the stresses are 3.766 MPa in tension and 2.285 MPa in compression, confirming that the structure is sufficiently safe. The displacement analysis indicates a maximum displacement of 0.418 mm at the edge, which is also within a safe range. The buckling analysis shows that the first buckling load factor is 32.571, demonstrating that the structure is sufficiently stable against buckling.
Load case 4 is +20 G acceleration in the x-direction. The structural analysis results indicate maximum stresses in the outer layer. The tensile stress is 7.501 MPa. The compressive stress is 6.951 MPa. For the inner layer 2, the tensile stress is 3.815 MPa and the compressive stress is 3.606 MPa. In the inner layer 5, the tensile stress is 4.333 MPa and the compressive stress is 4.360 MPa. The structure was confirmed to be sufficiently safe. The displacement analysis result is a displacement of 0.363 mm at the edge. The structural safety was confirmed. Buckling analysis was performed. The first-order buckling load factor is 48.840. Therefore, the structure was determined to be sufficiently stable against buckling.
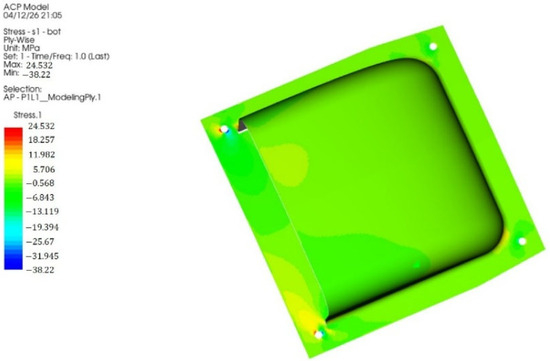
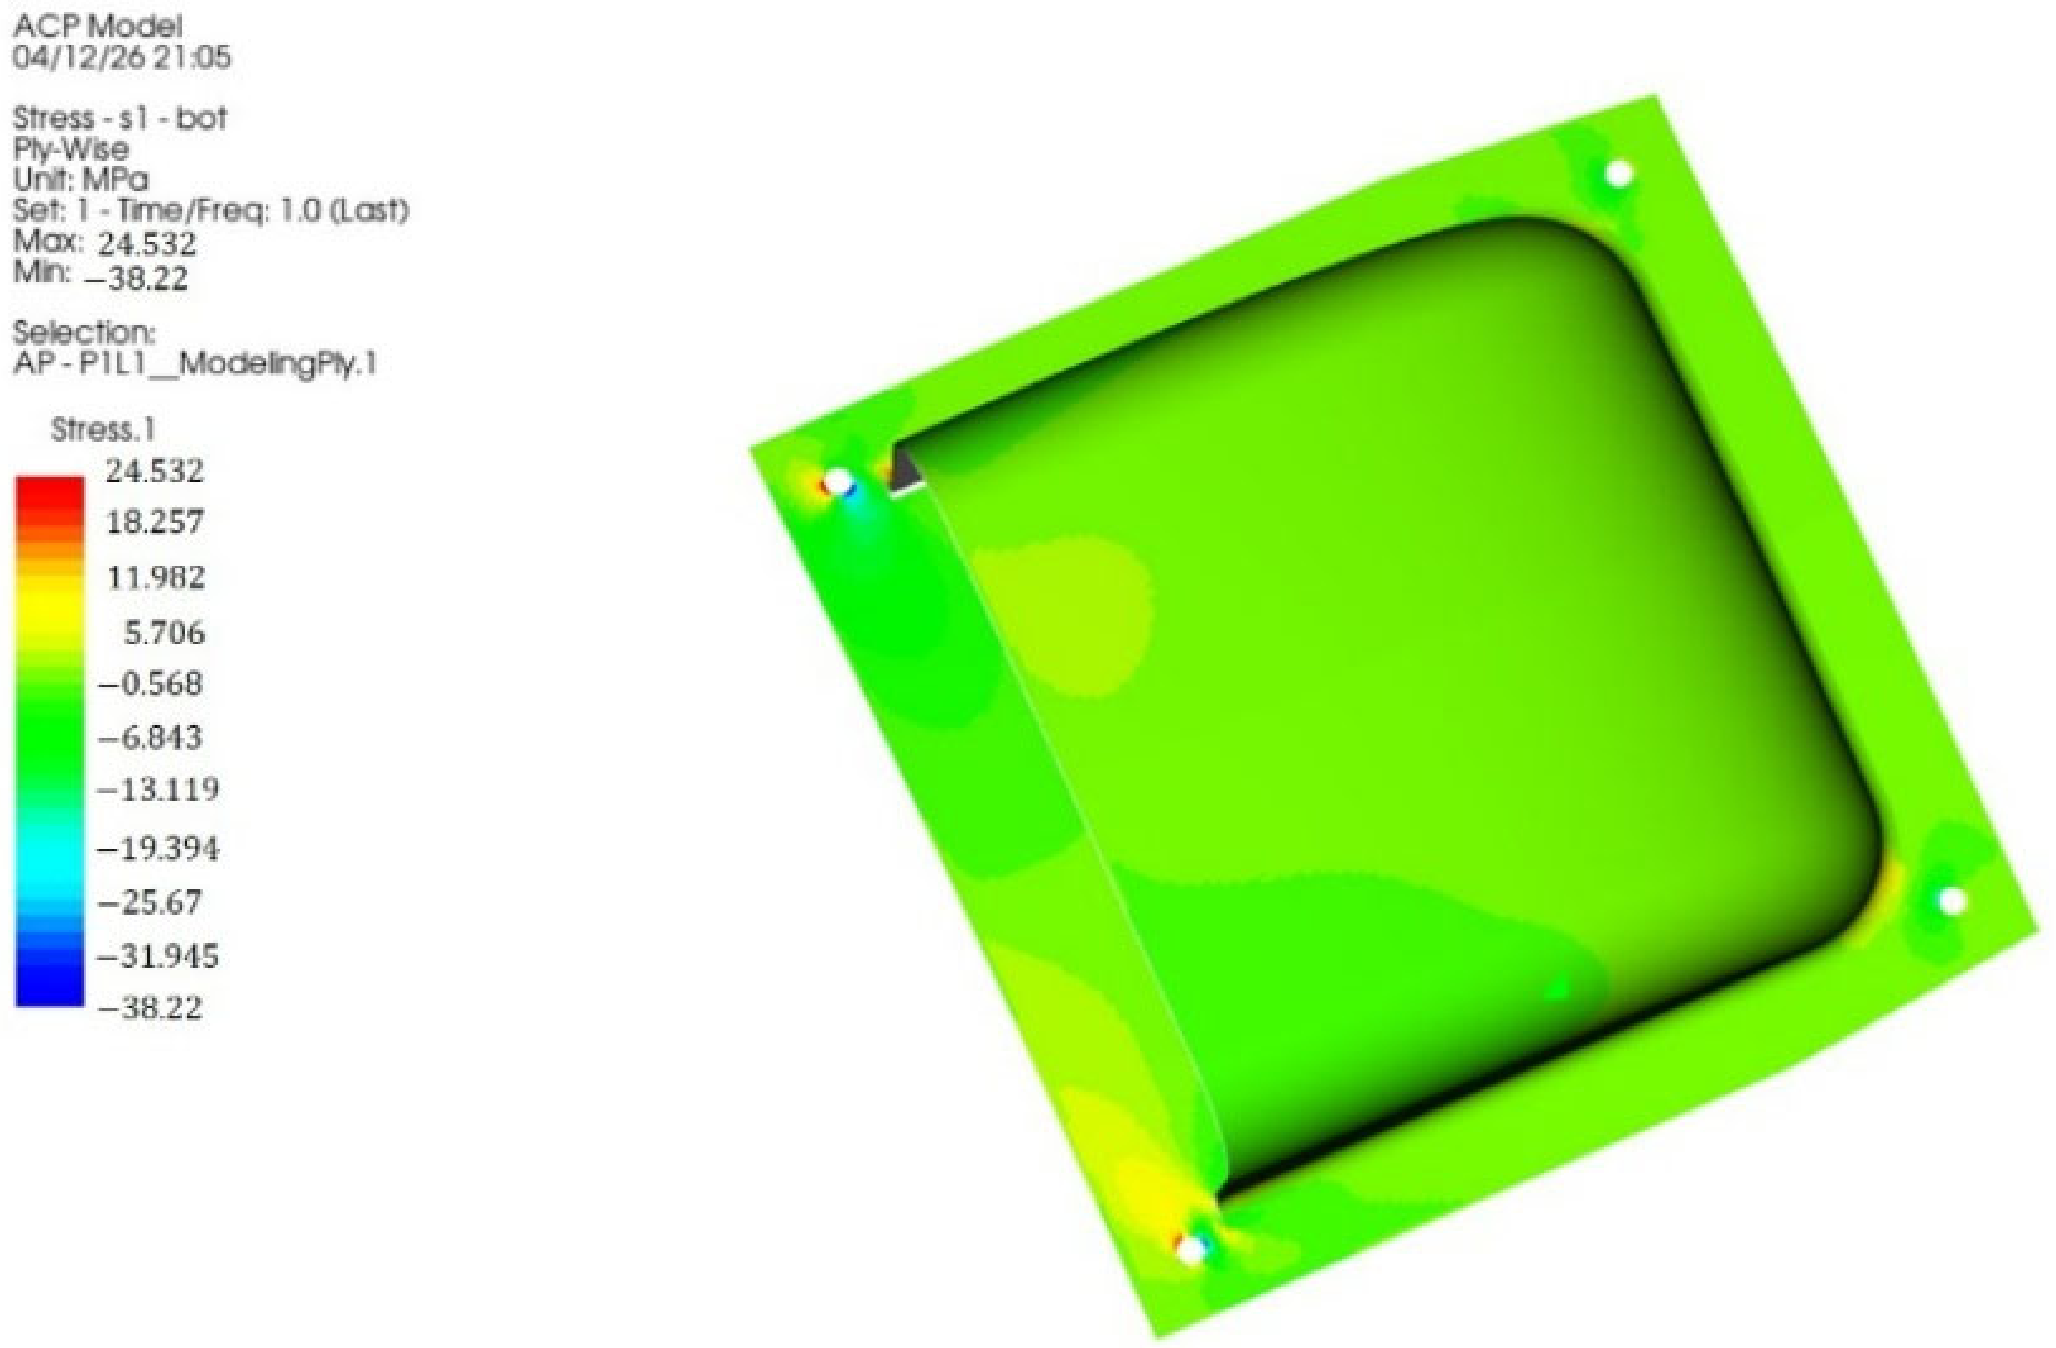
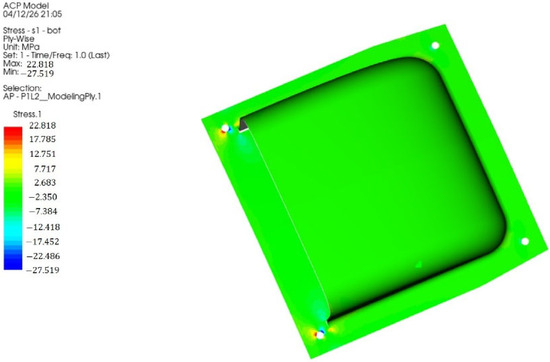
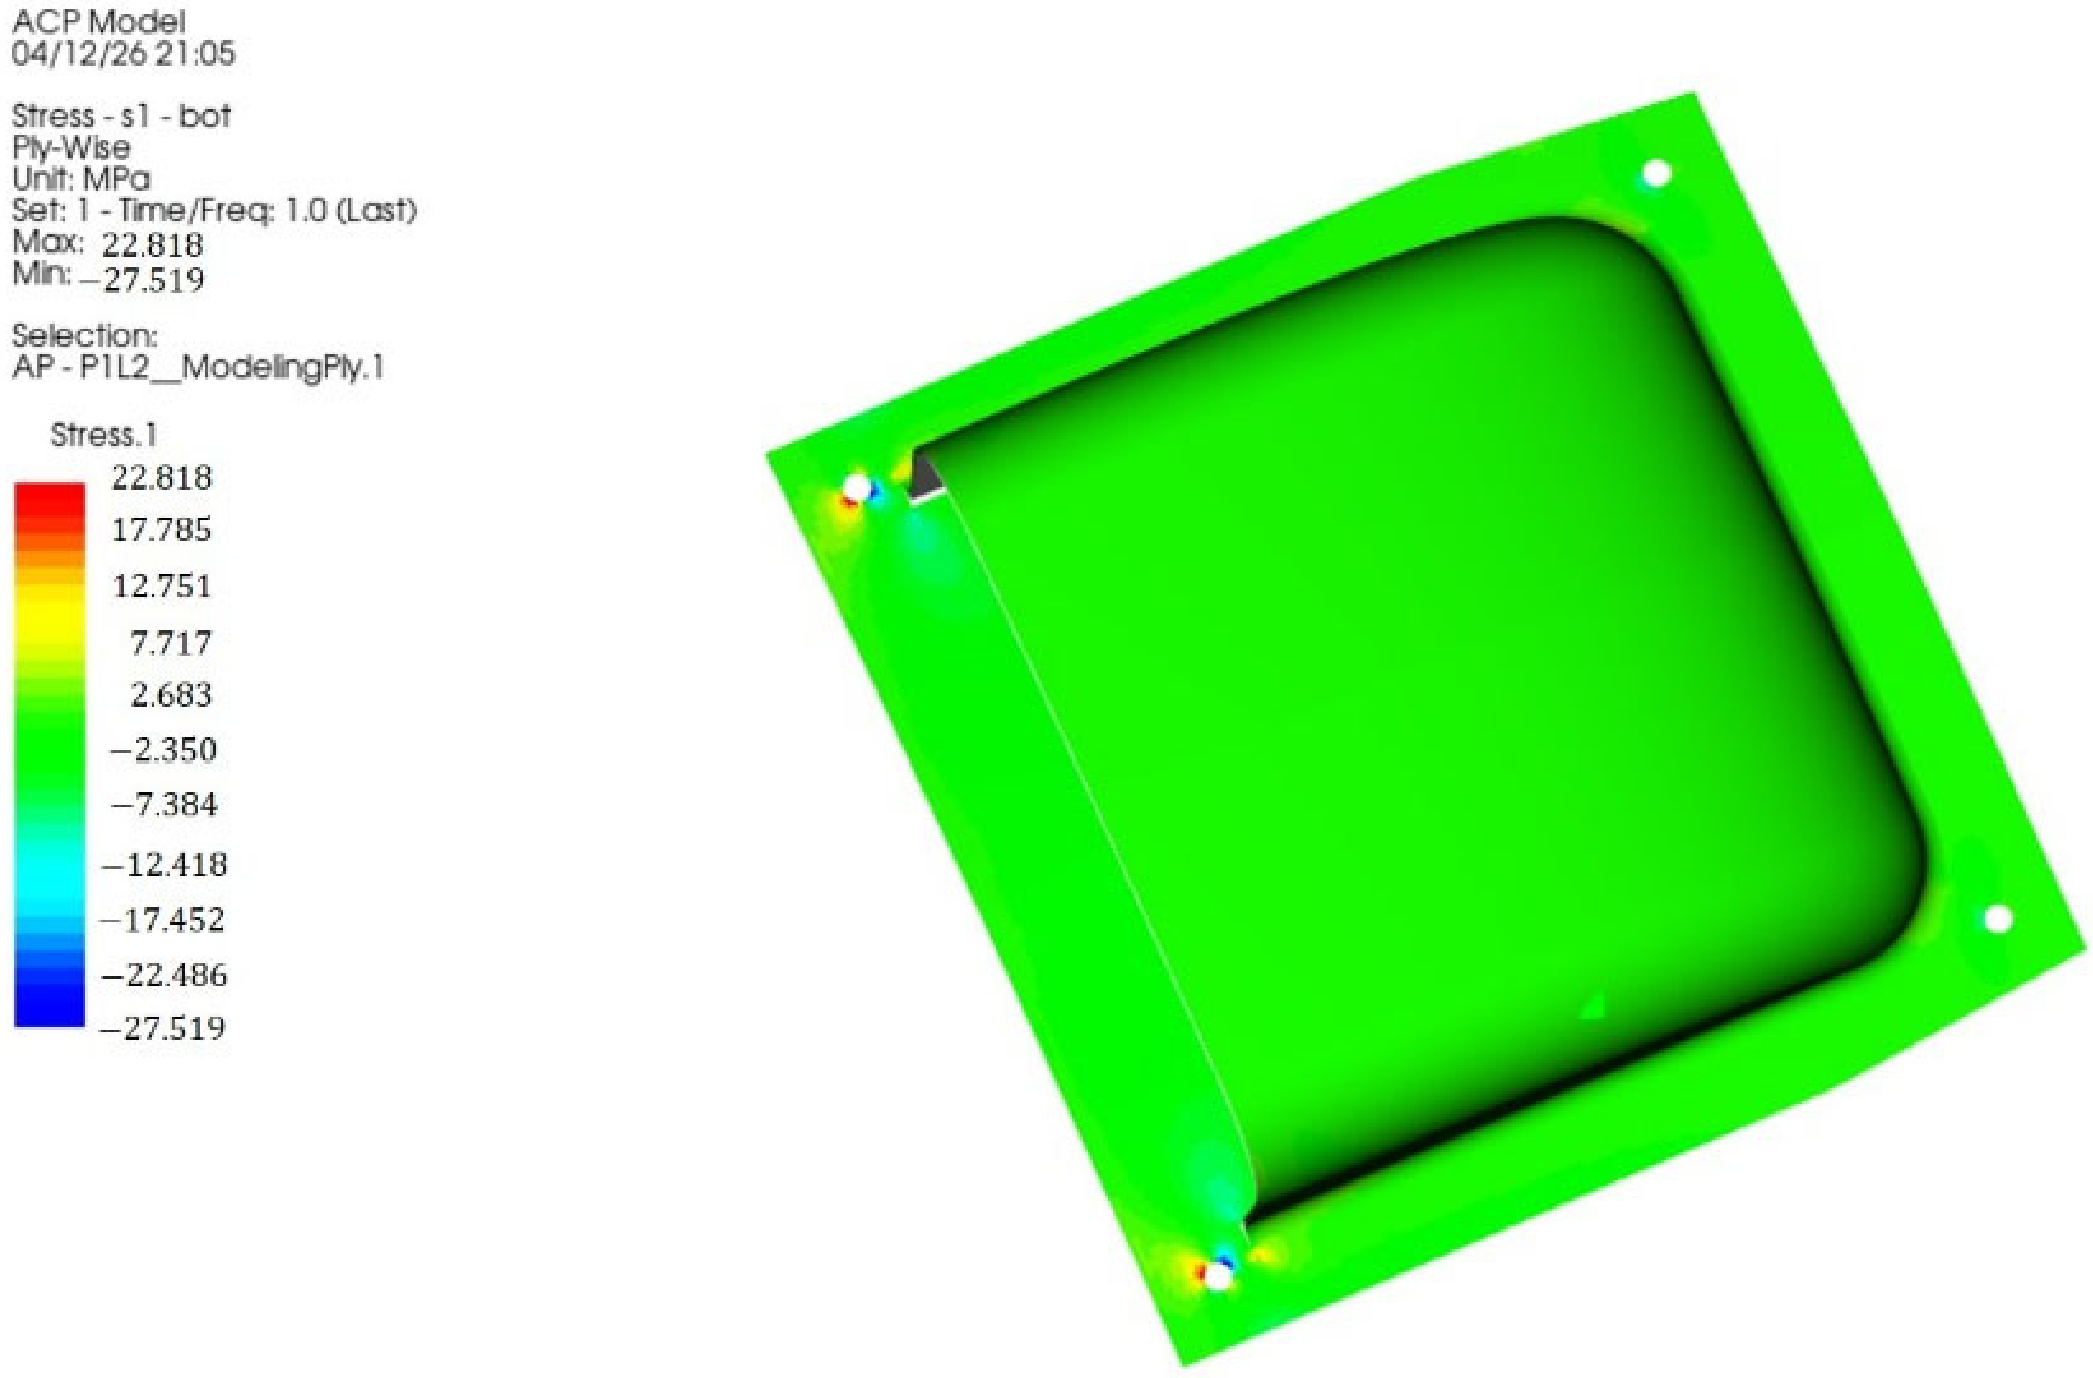
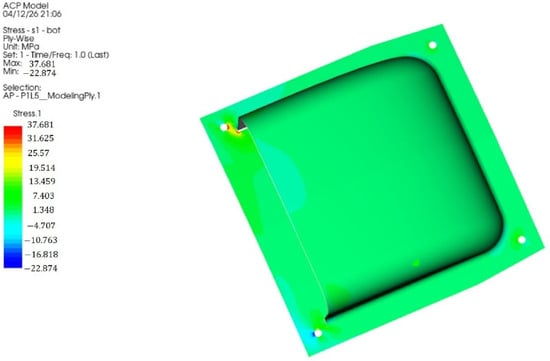
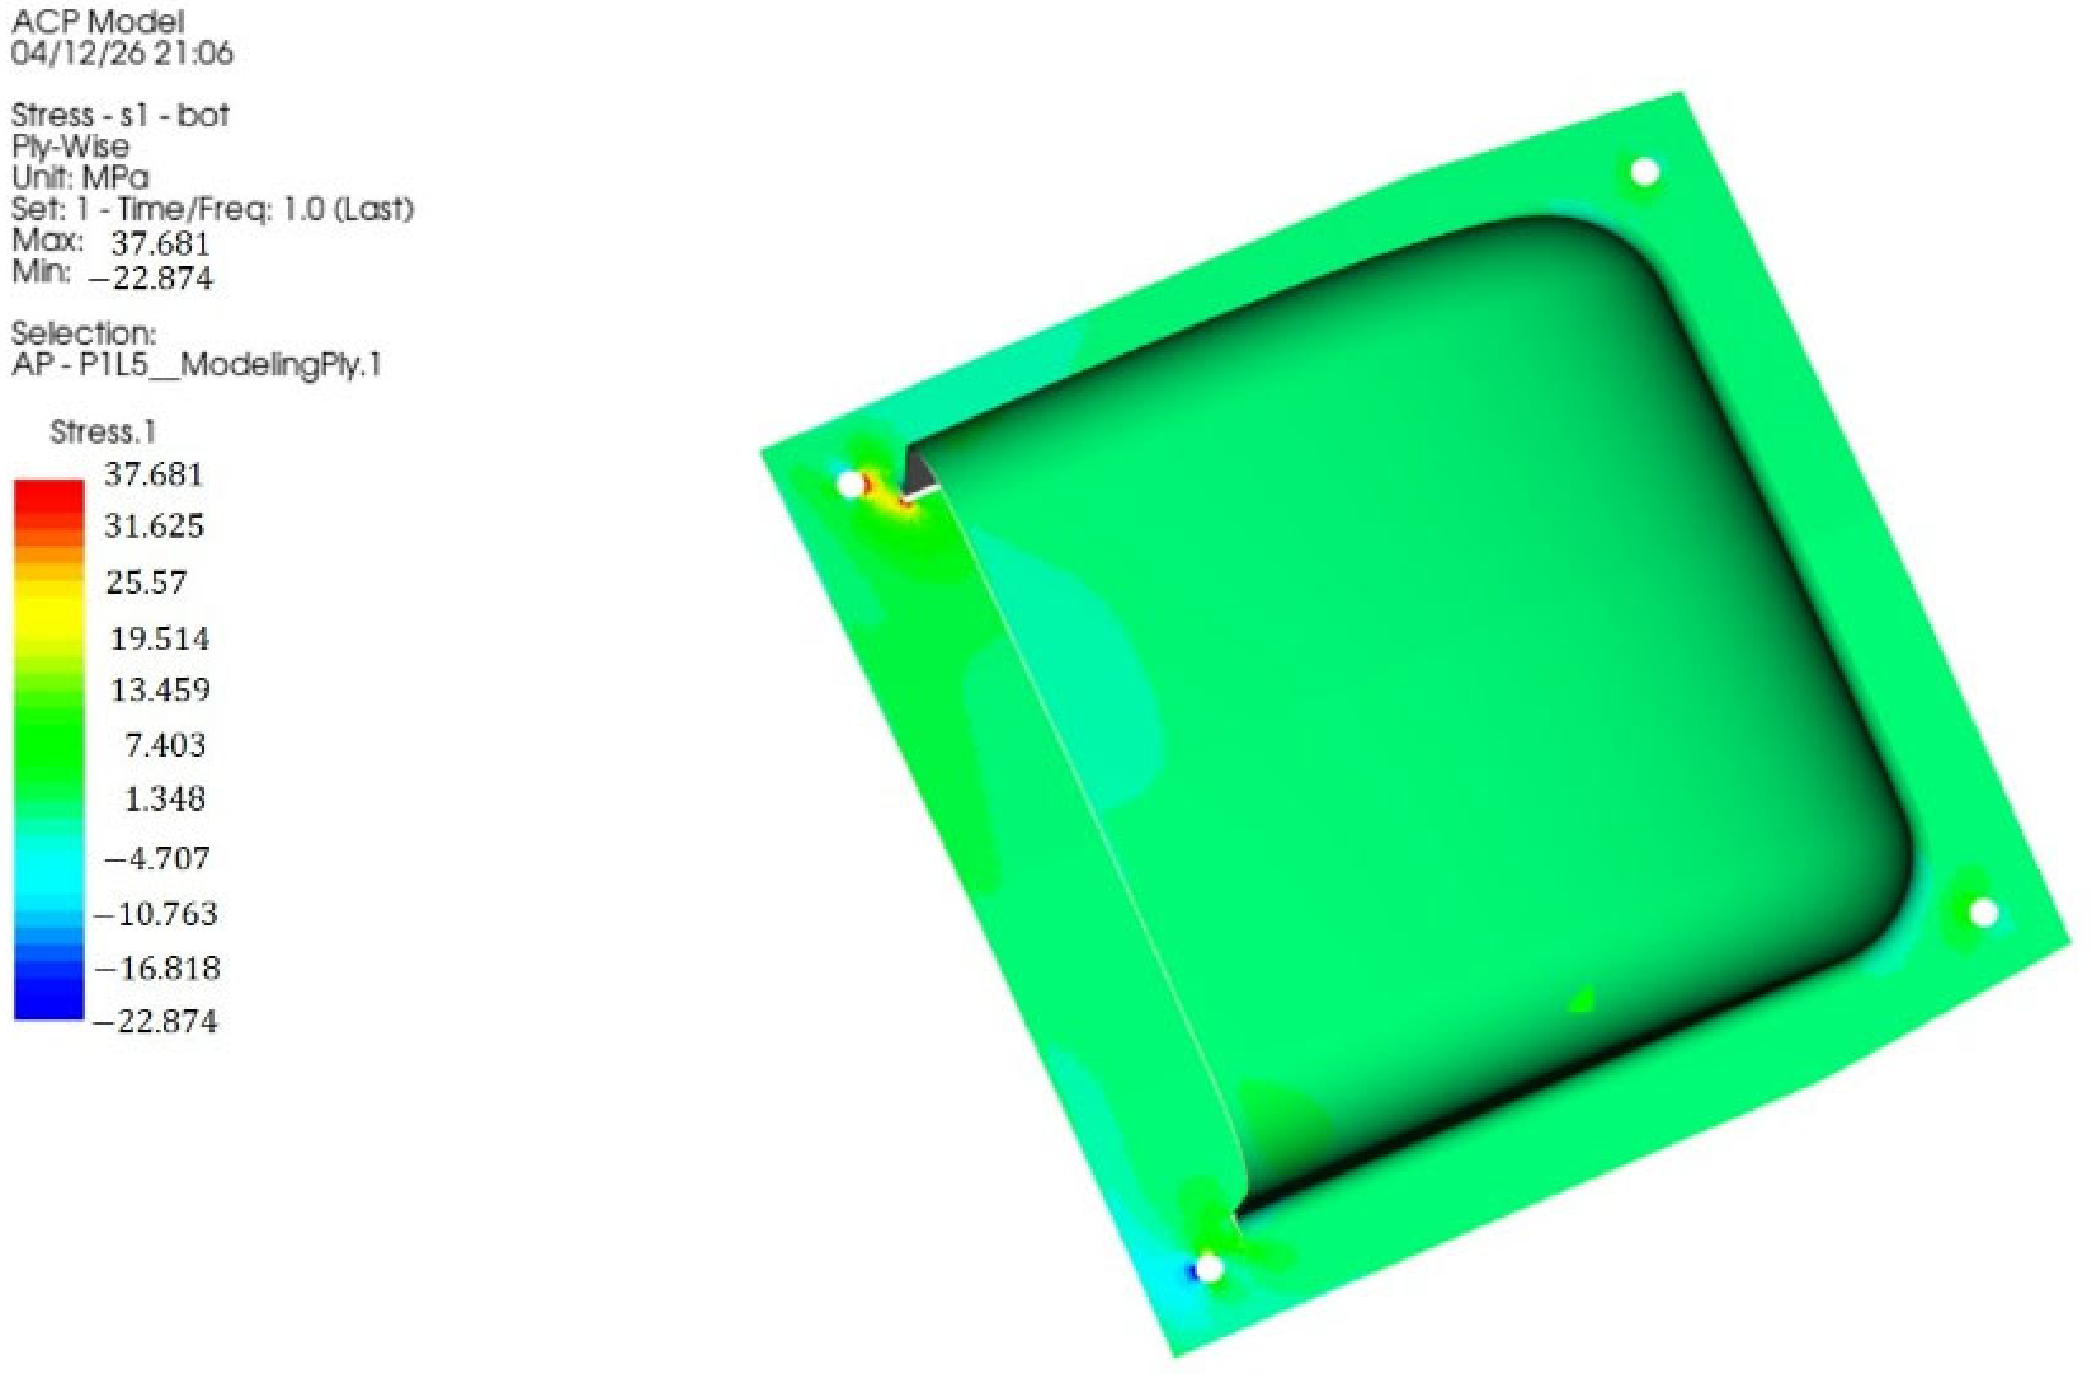
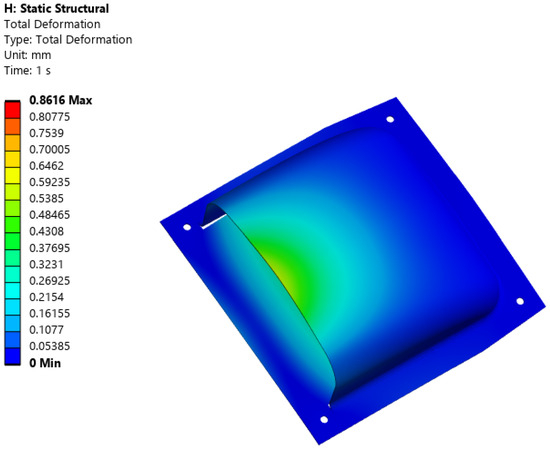
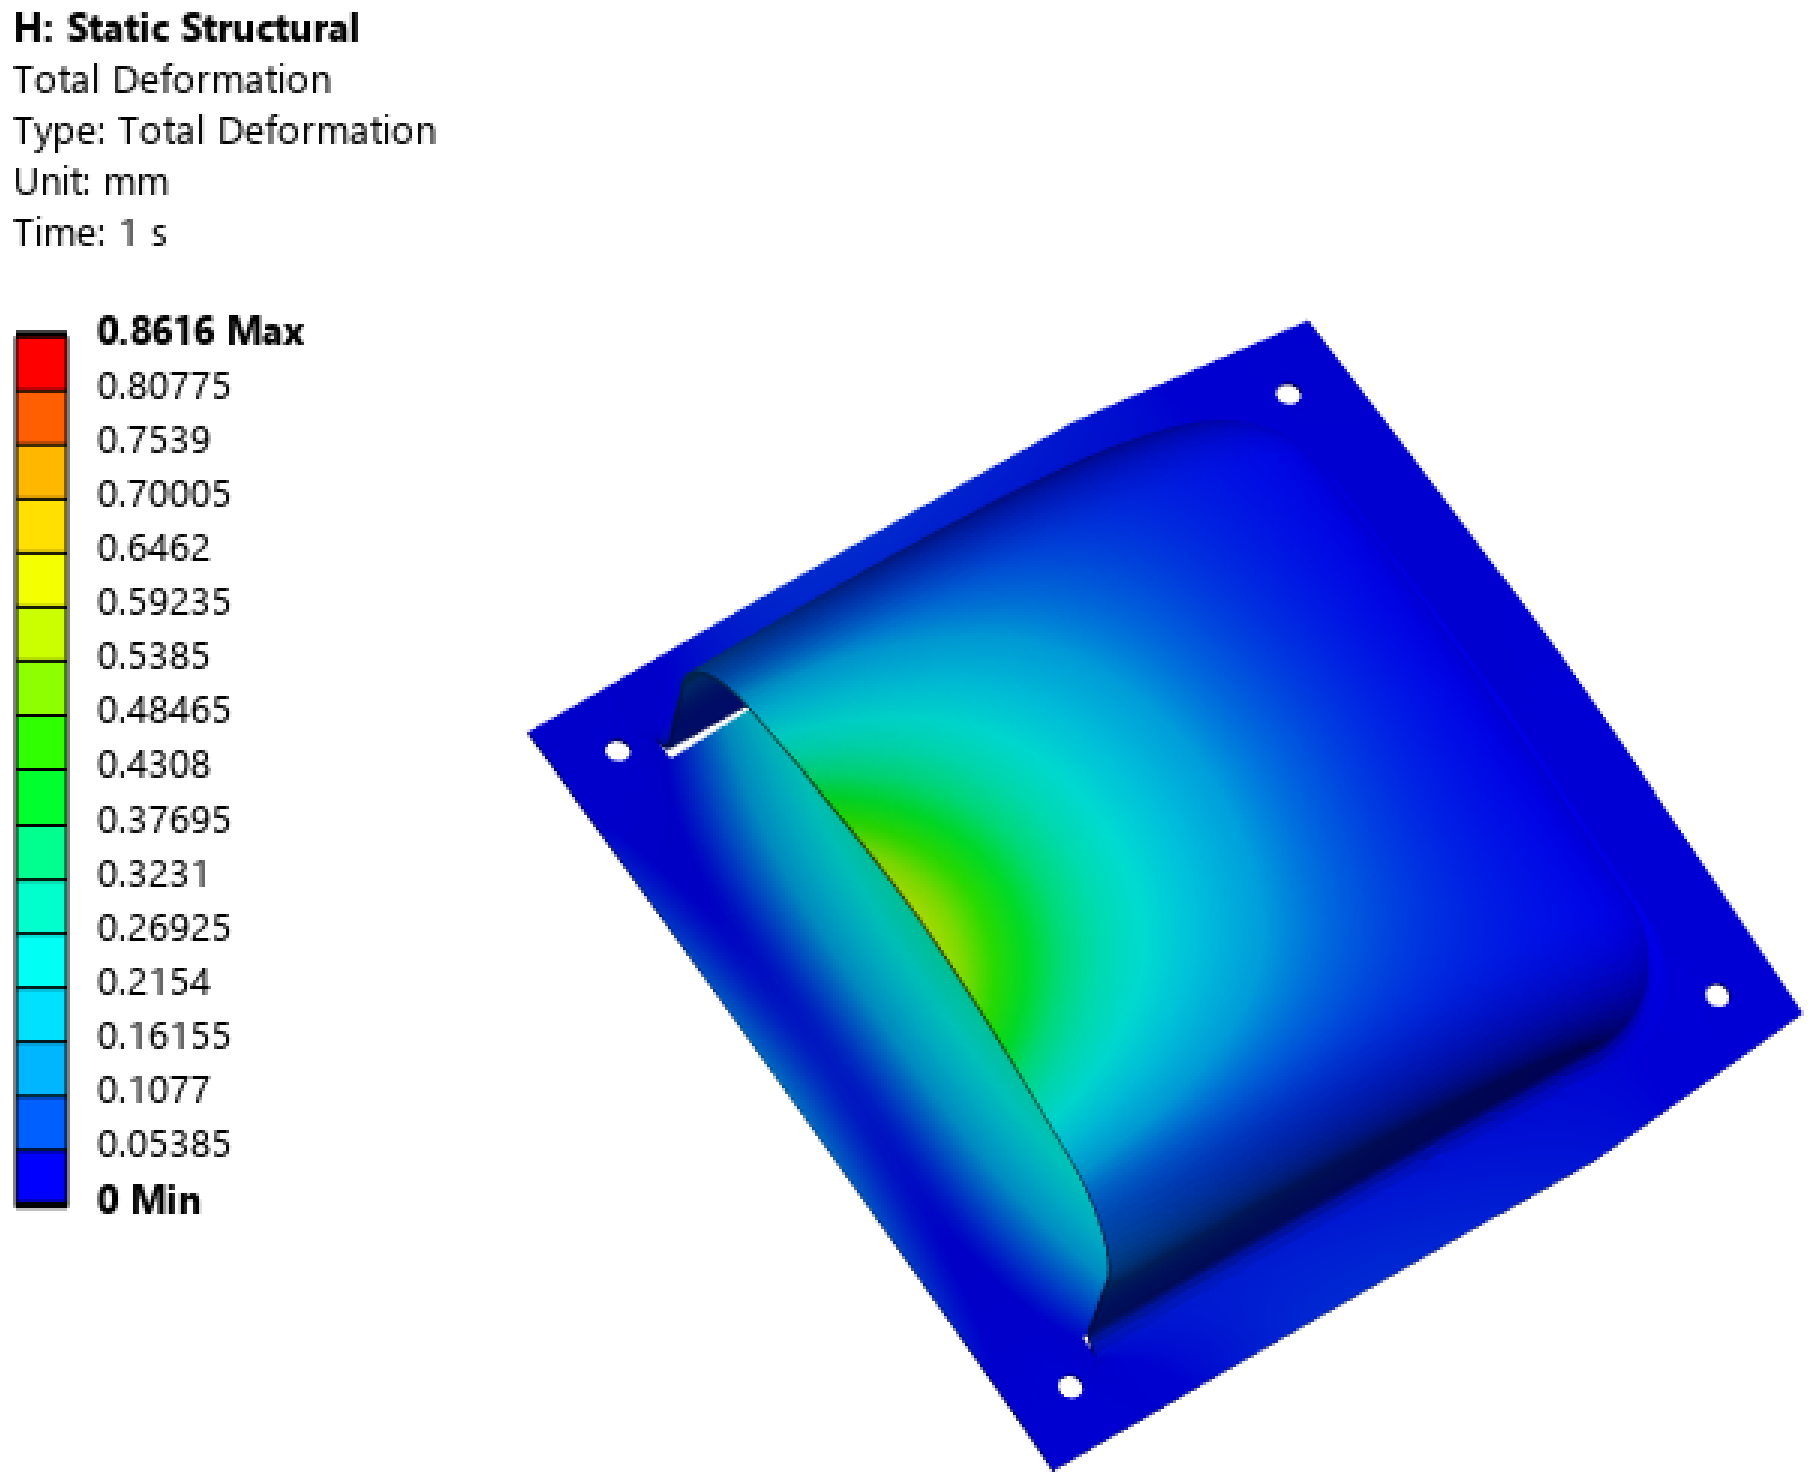
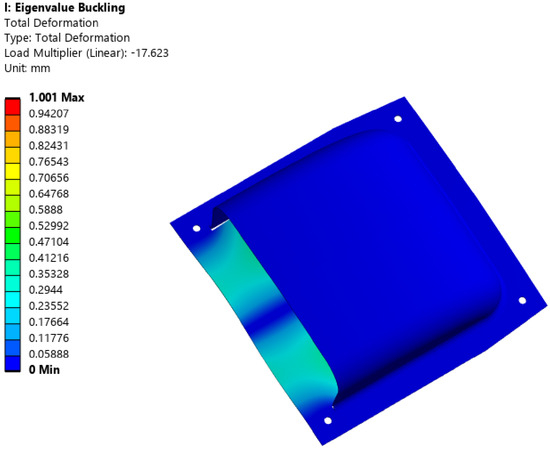
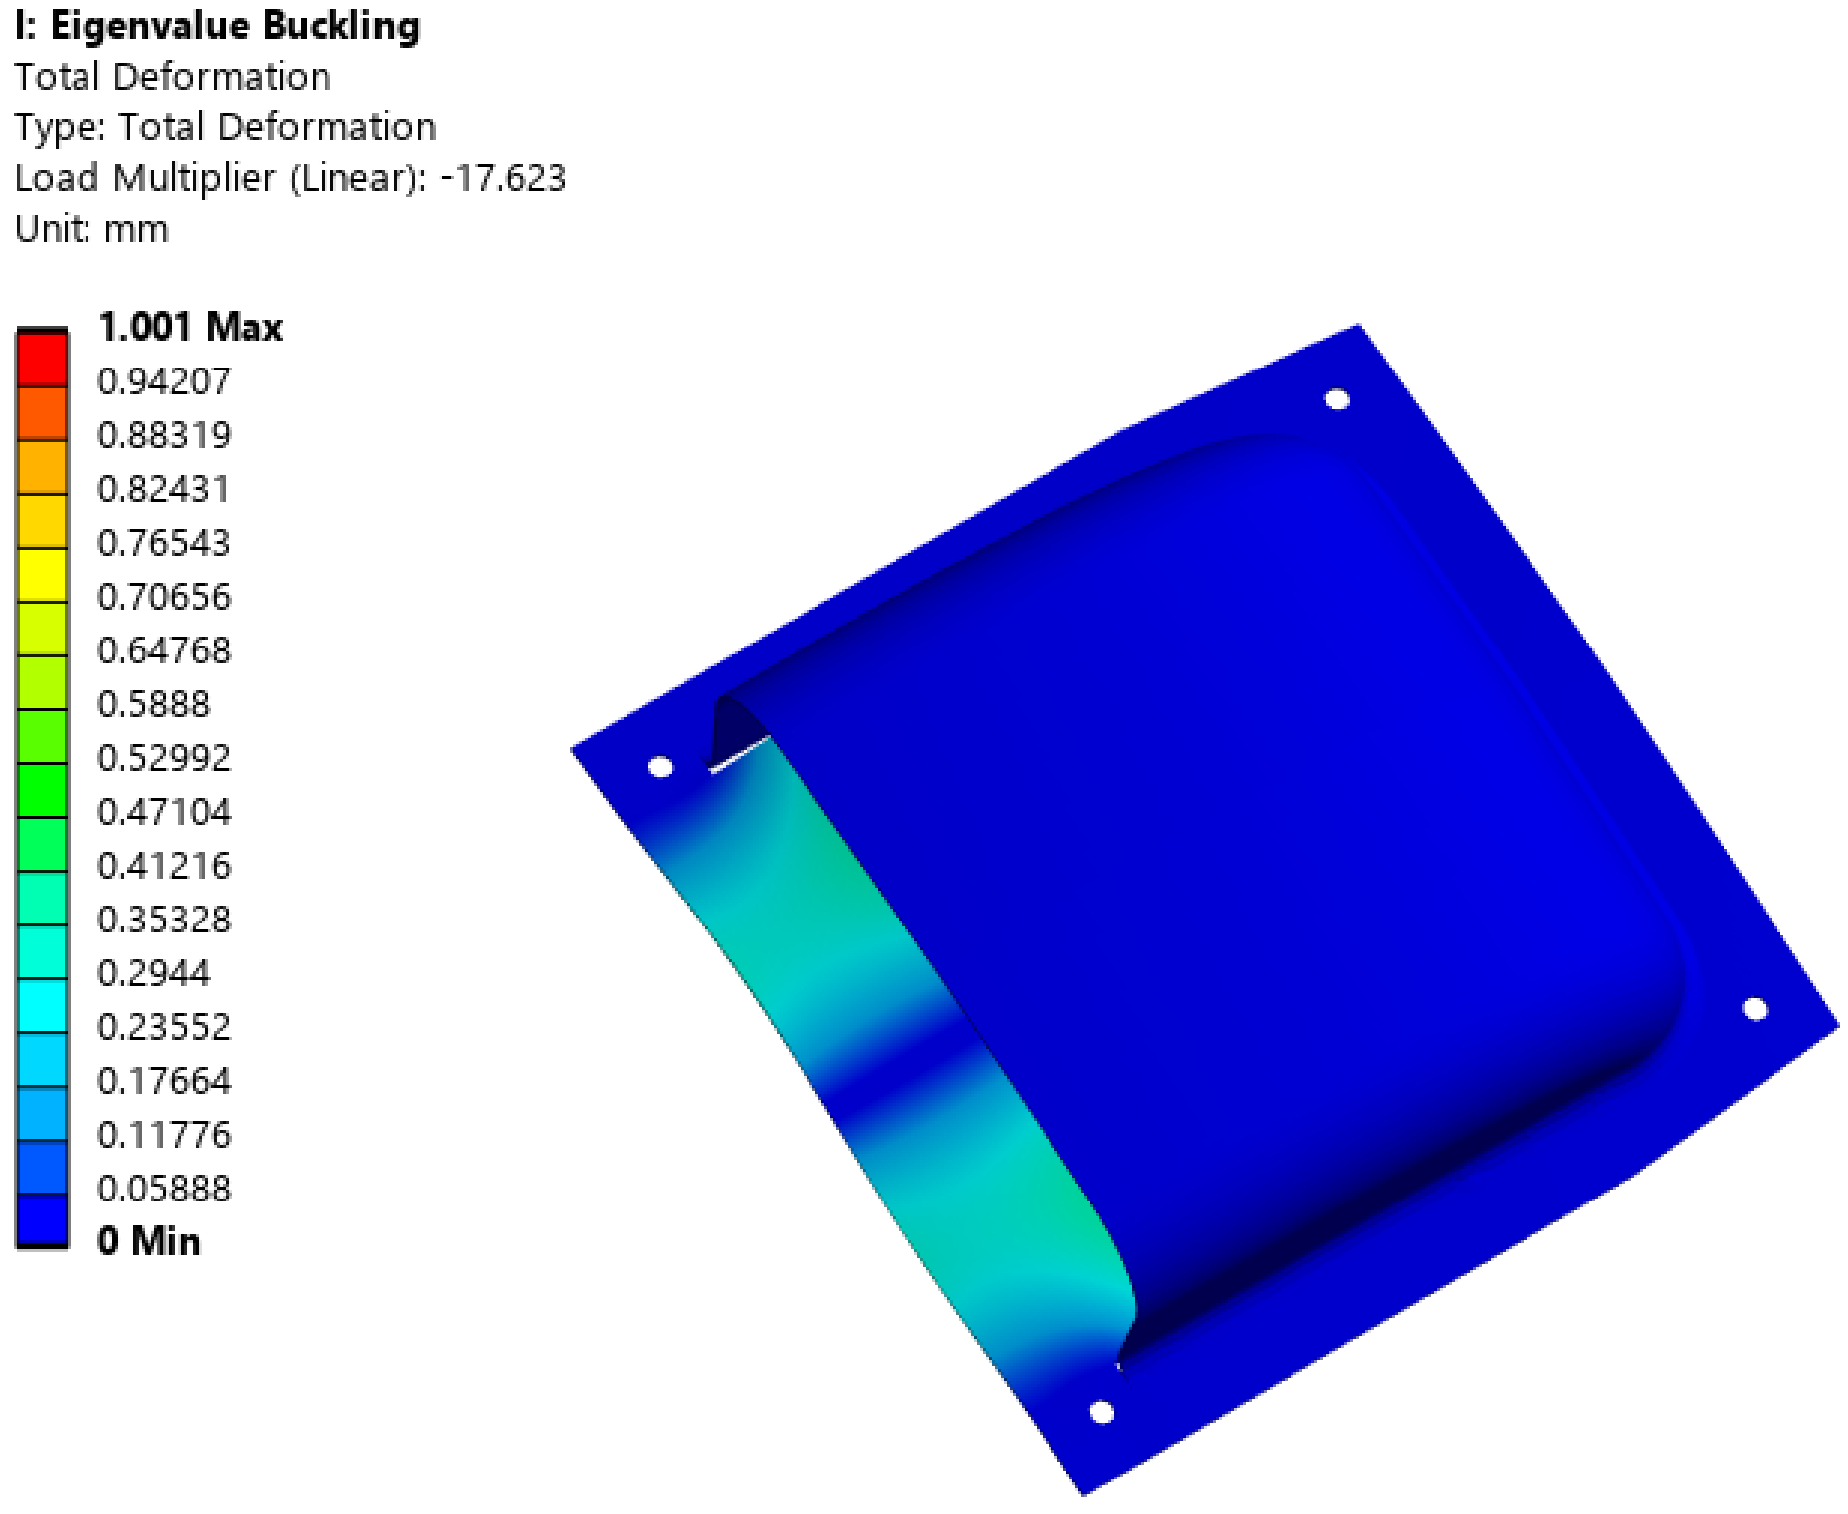
Load case 5 is +20 G acceleration in the y-direction. The structural analysis results indicate that the maximum stress occurred in layer 1, with a tensile stress of 24.532 MPa and a compressive stress of 38.220 MPa. In the inner layer 2, the tensile stress is 22.818 MPa and the compressive stress is 27.519 MPa. For the inner layer 5, the tensile stress is 37.681 MPa and the compressive stress is 22.874 MPa. The structural analysis confirms that the structure is sufficiently safe. The displacement analysis showed a value of 0.861 mm at the edge, confirming that the displacement is within safe limits. The first-order buckling load factor is 17.623. Therefore, the structure was determined to be sufficiently stable against buckling. Figure 13, Figure 14 and Figure 15 show the stress analysis results of load case 5. The displacement analysis result was shown in Figure 16. The buckling analysis result was shown in the Figure 17.
Figure 13.
Stress analysis result of load case 5: Layer 1.
Figure 14.
Stress analysis result of load case 5: Layer 2.
Figure 15.
Stress analysis result of load case 5: Layer 5.
Figure 16.
Displacement analysis result of load case 5.
Figure 17.
Buckling analysis result of load case 5 (Mode 1).
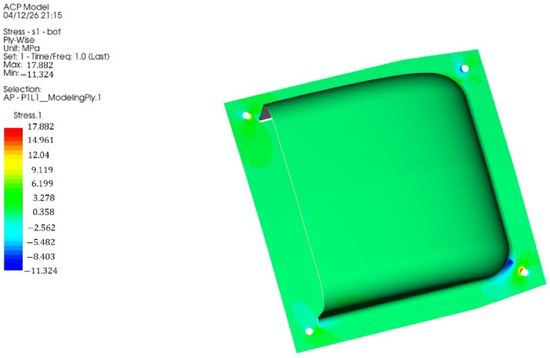
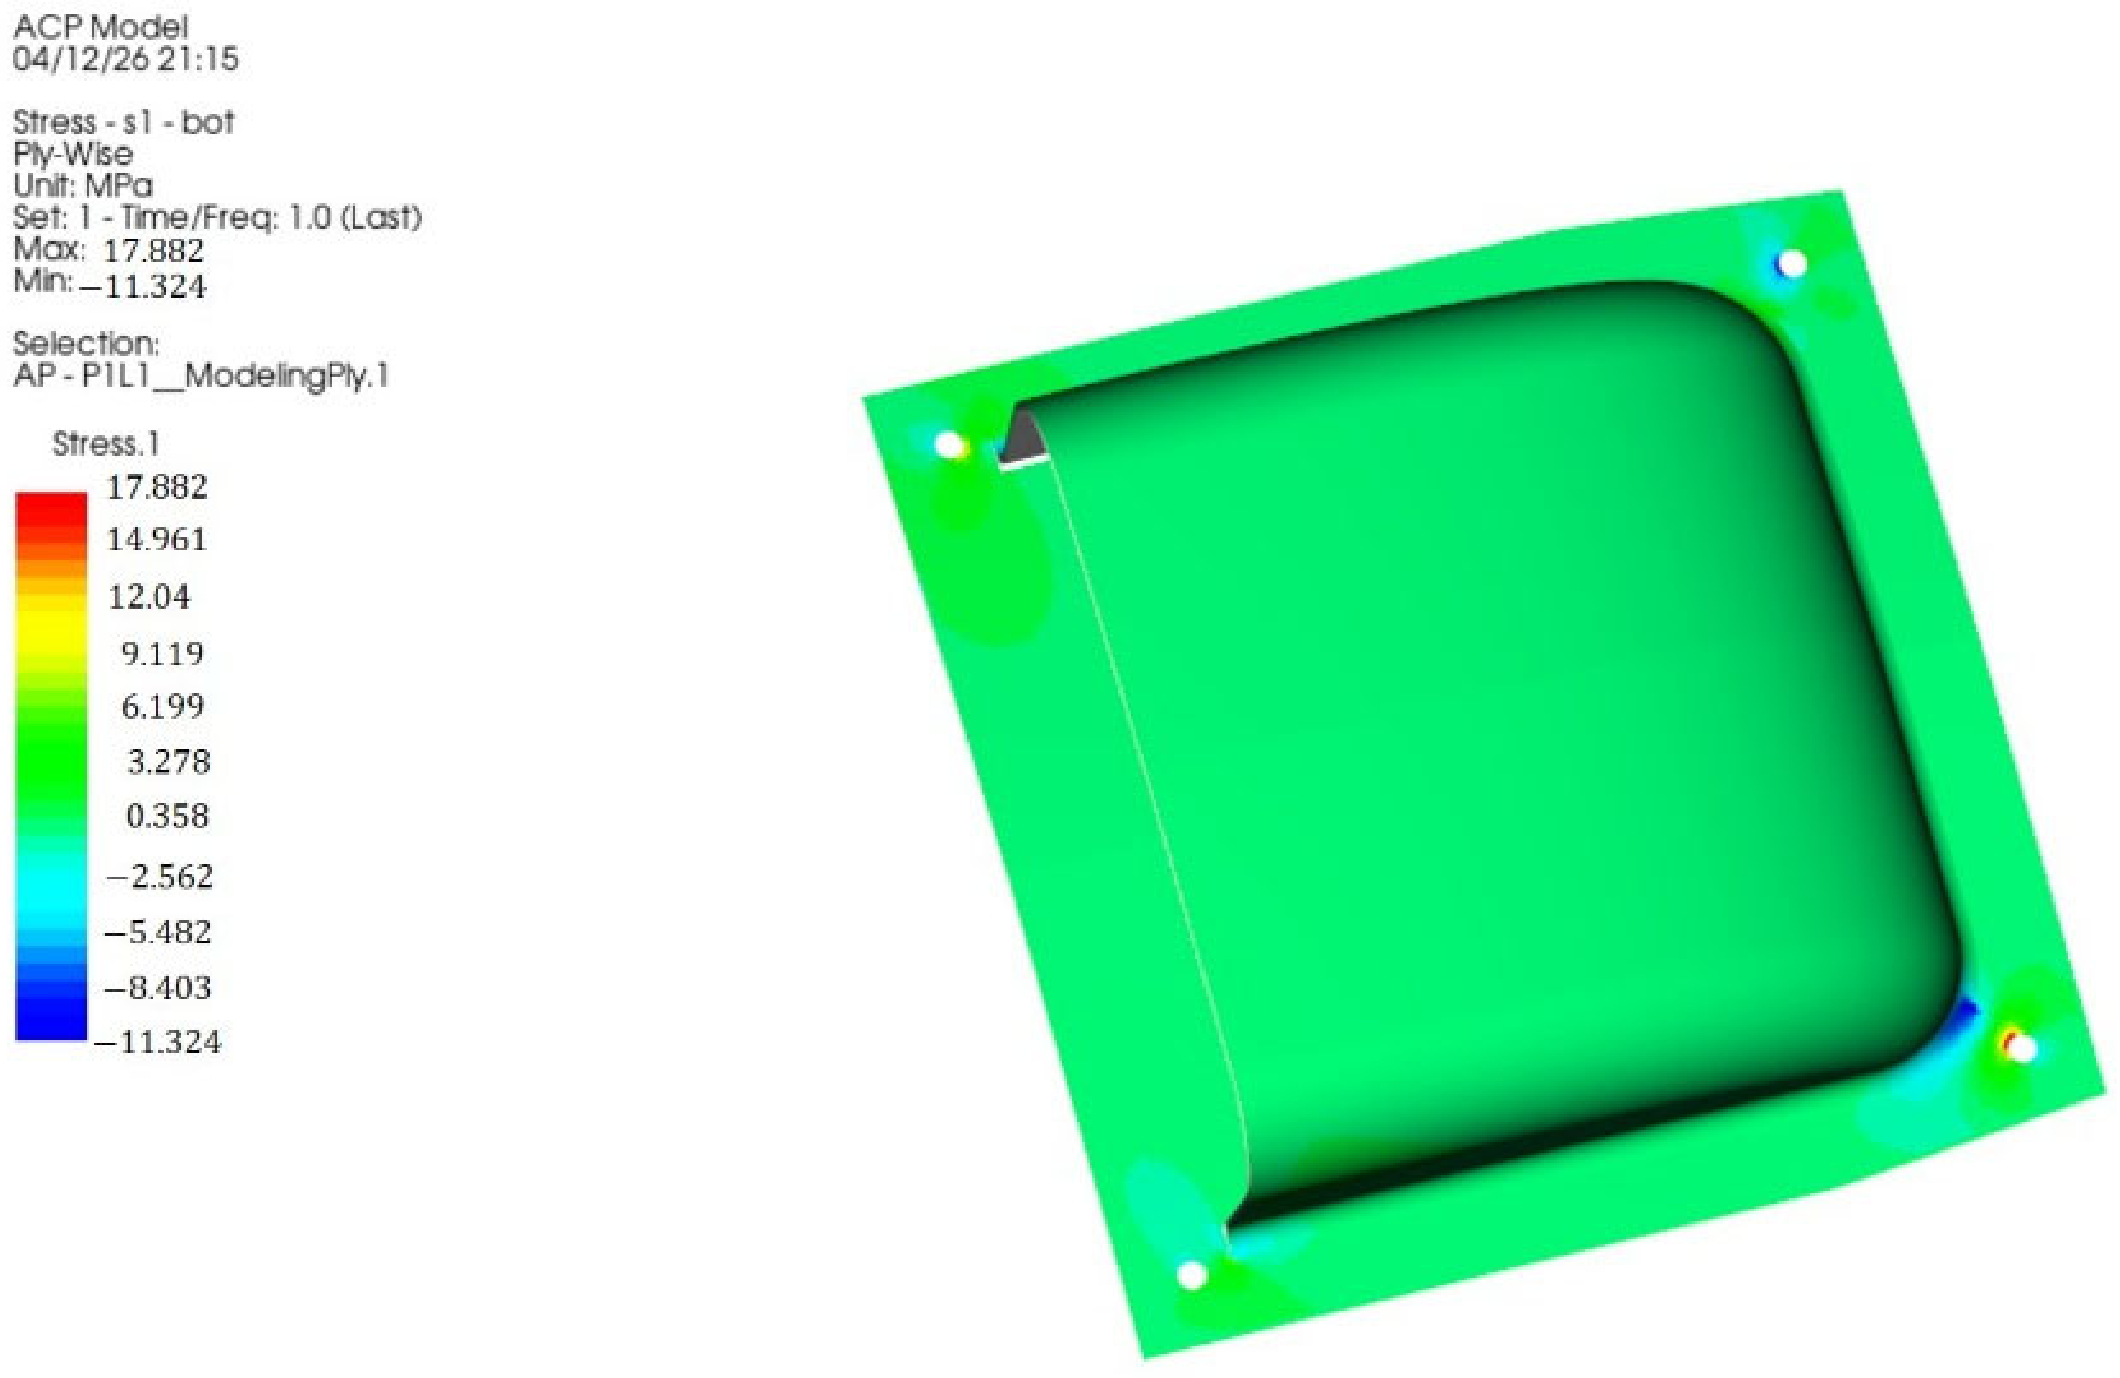
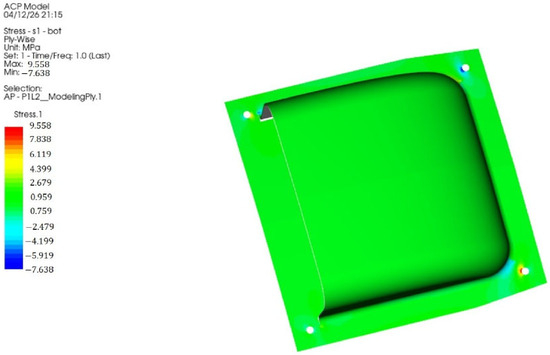
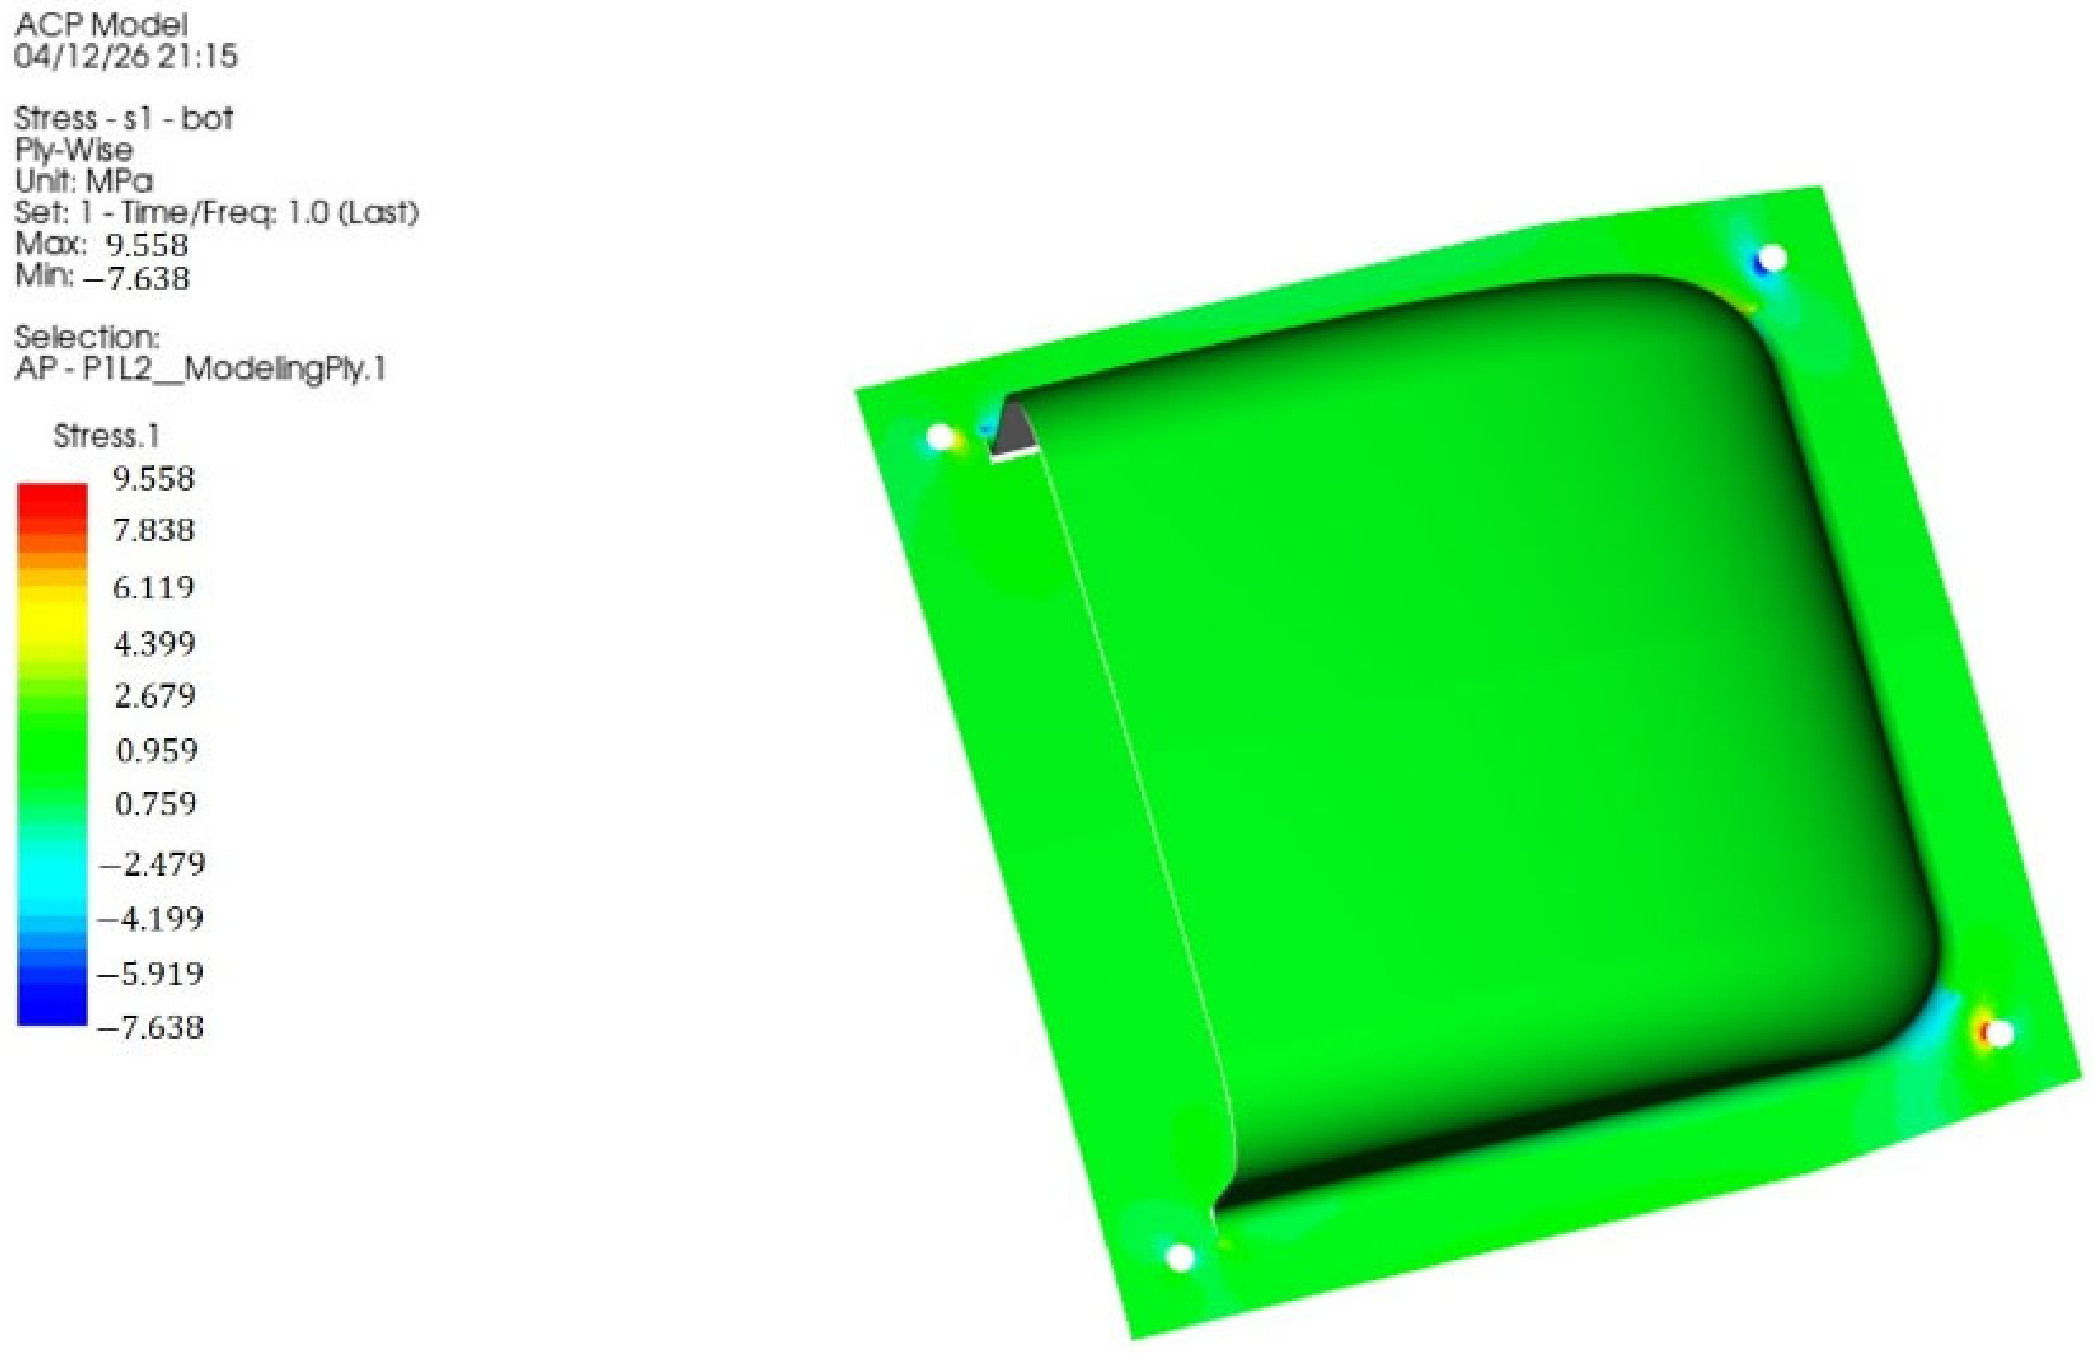
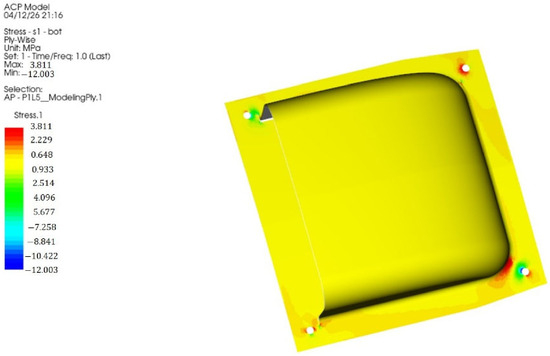
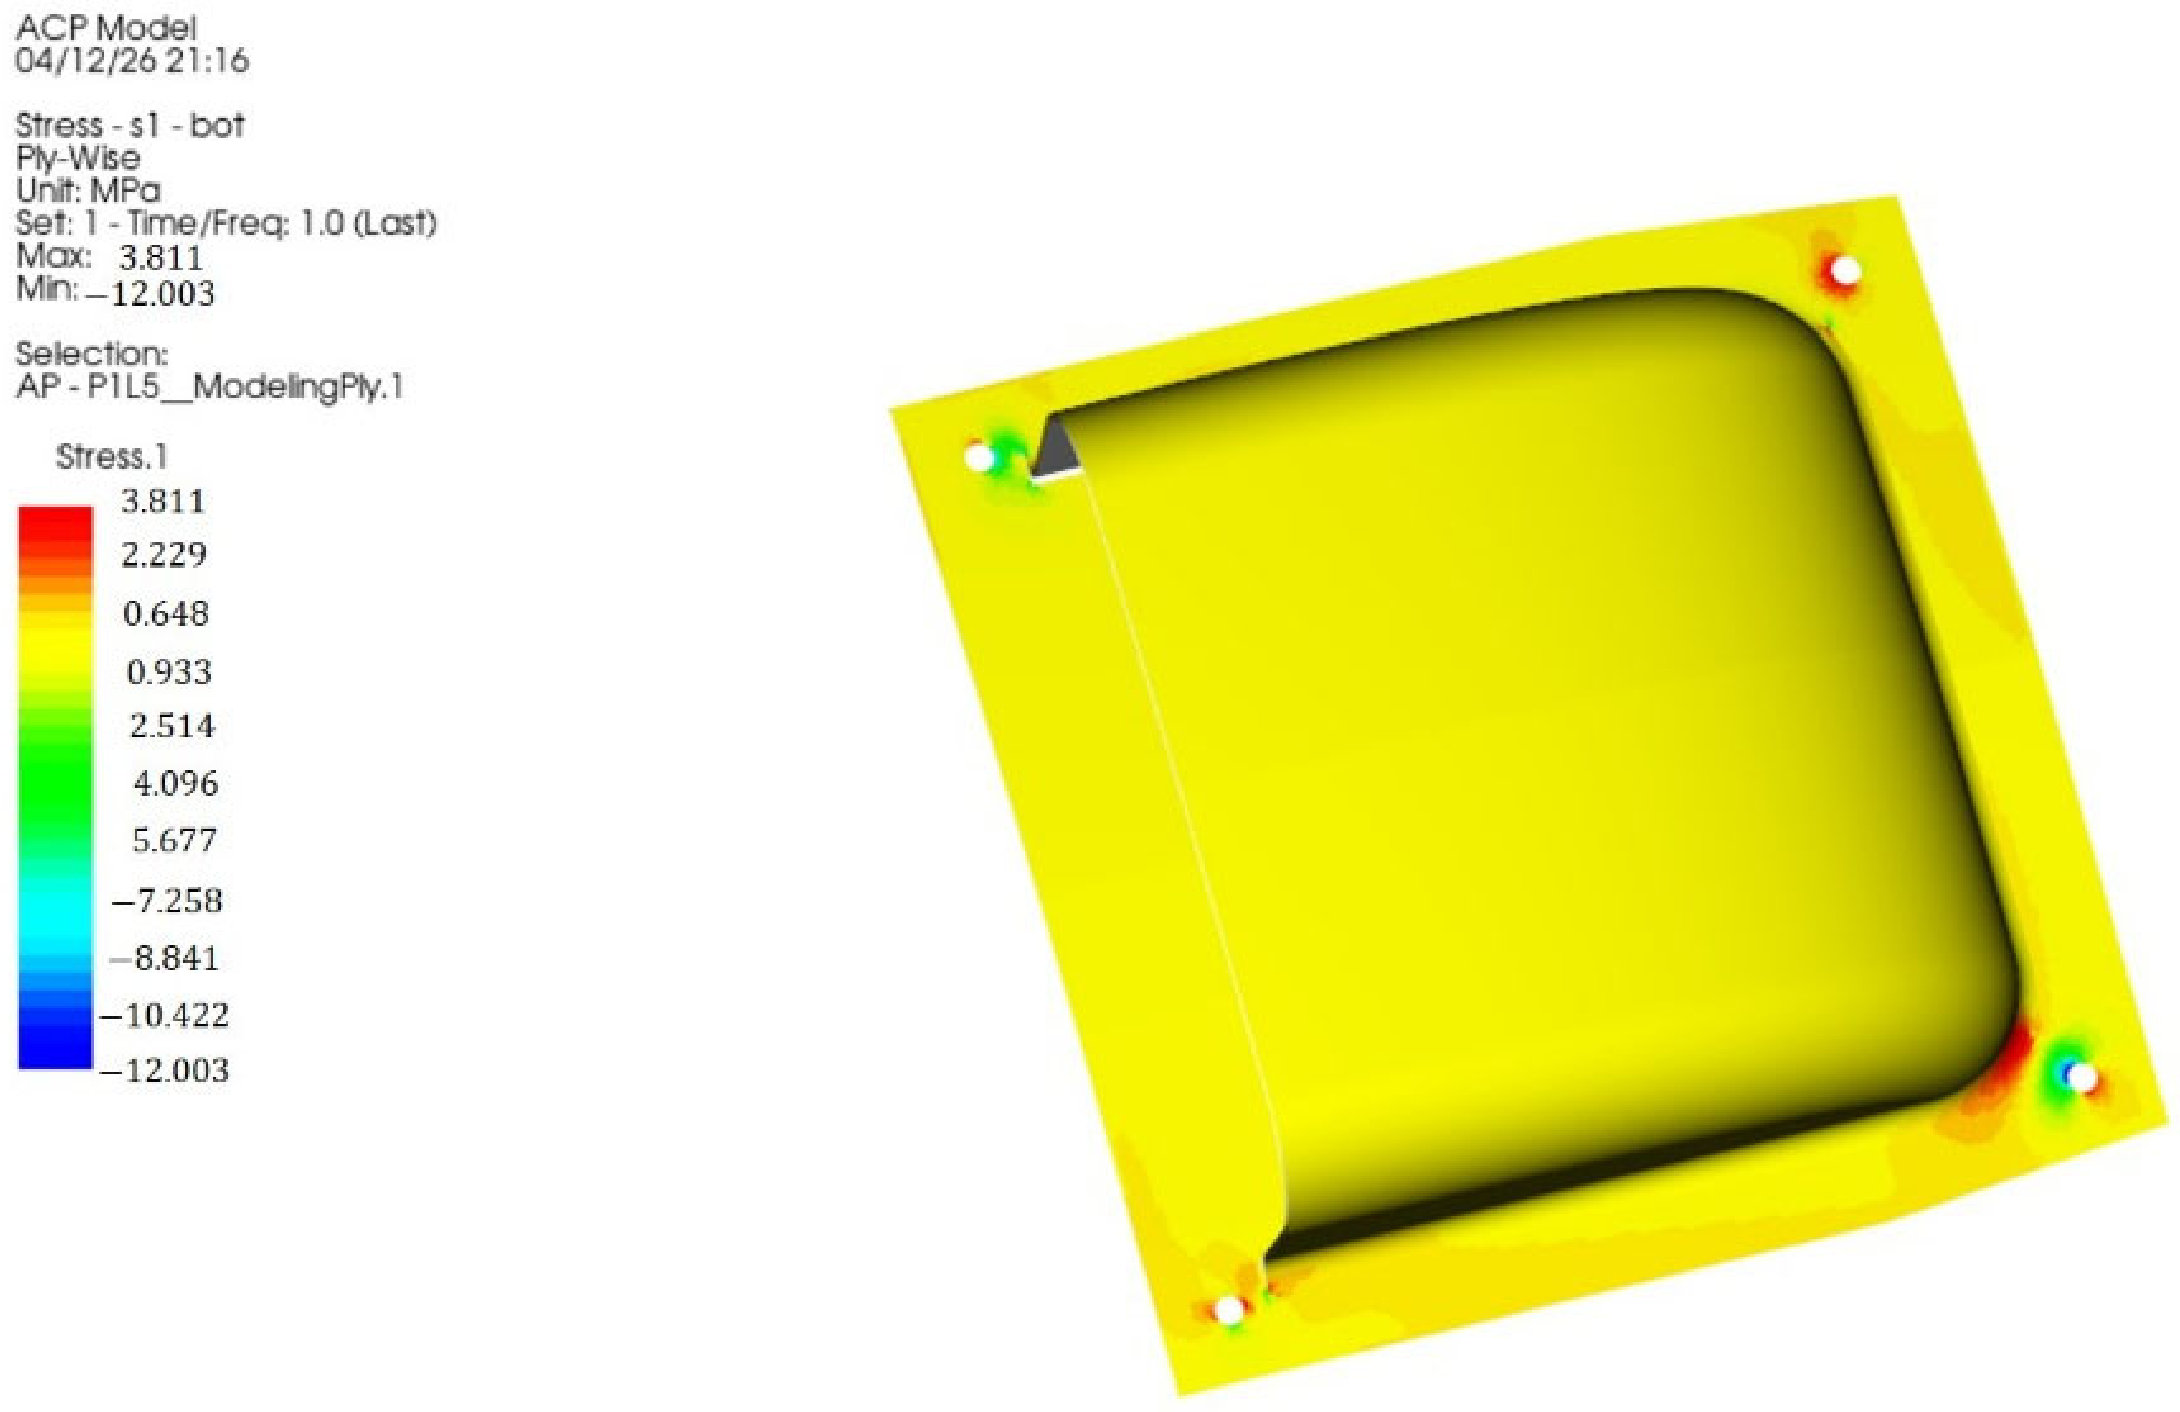
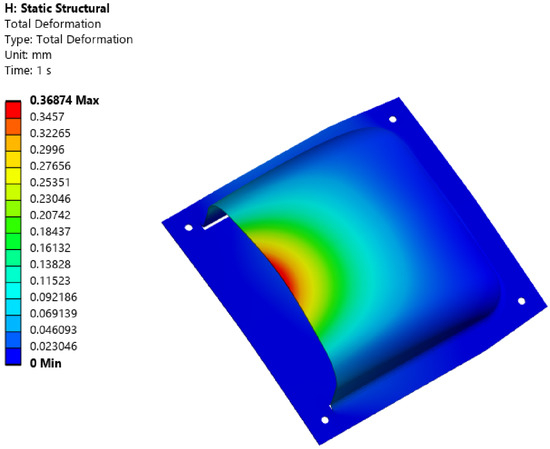
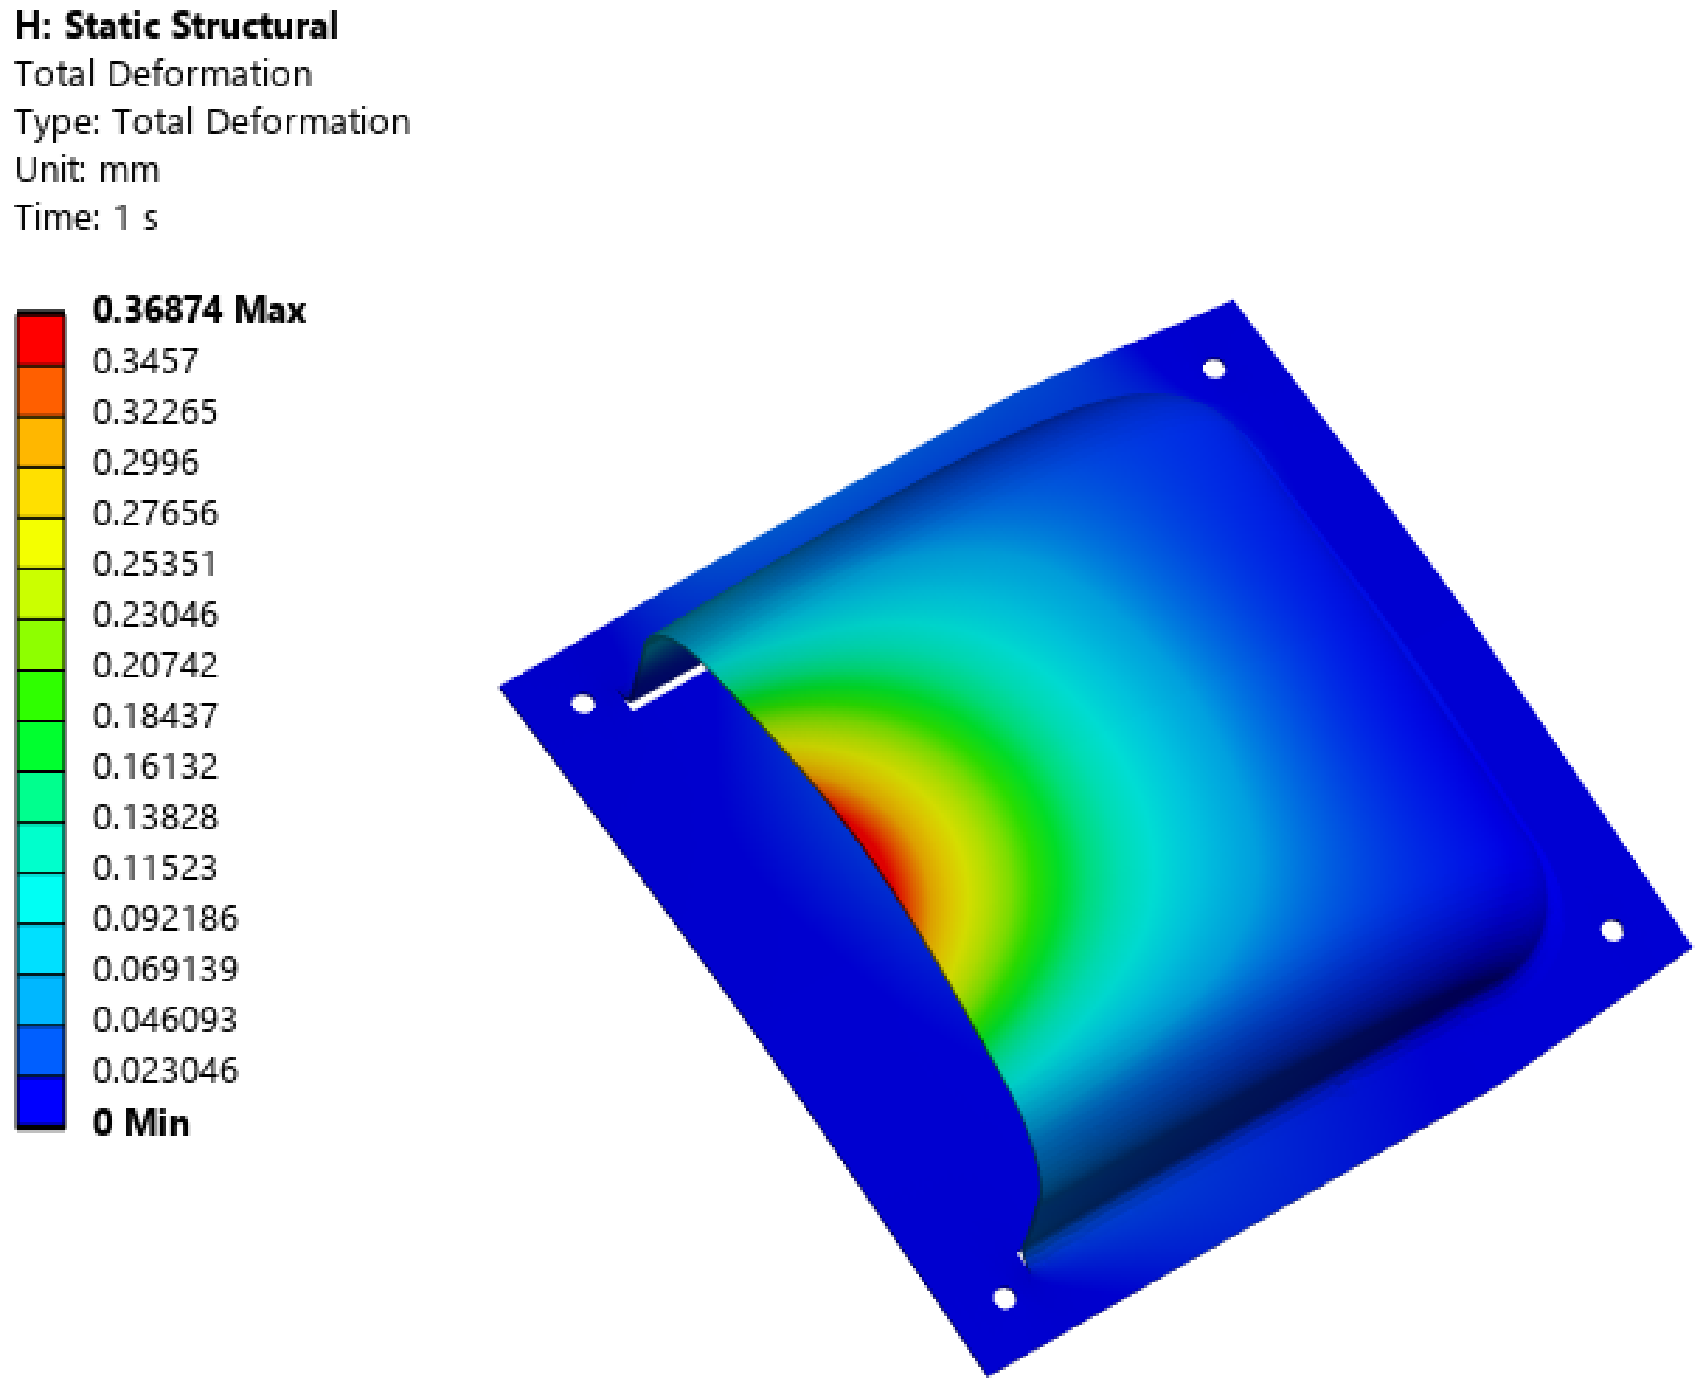
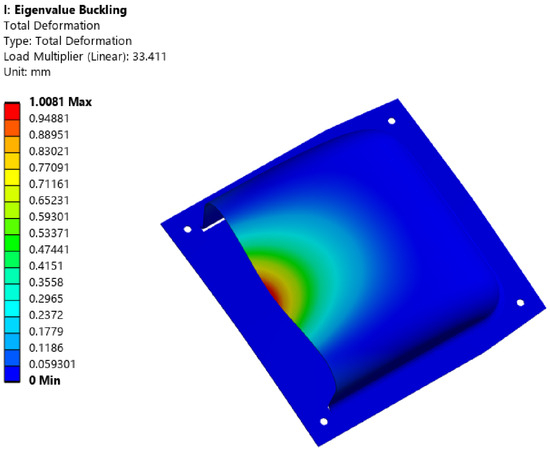
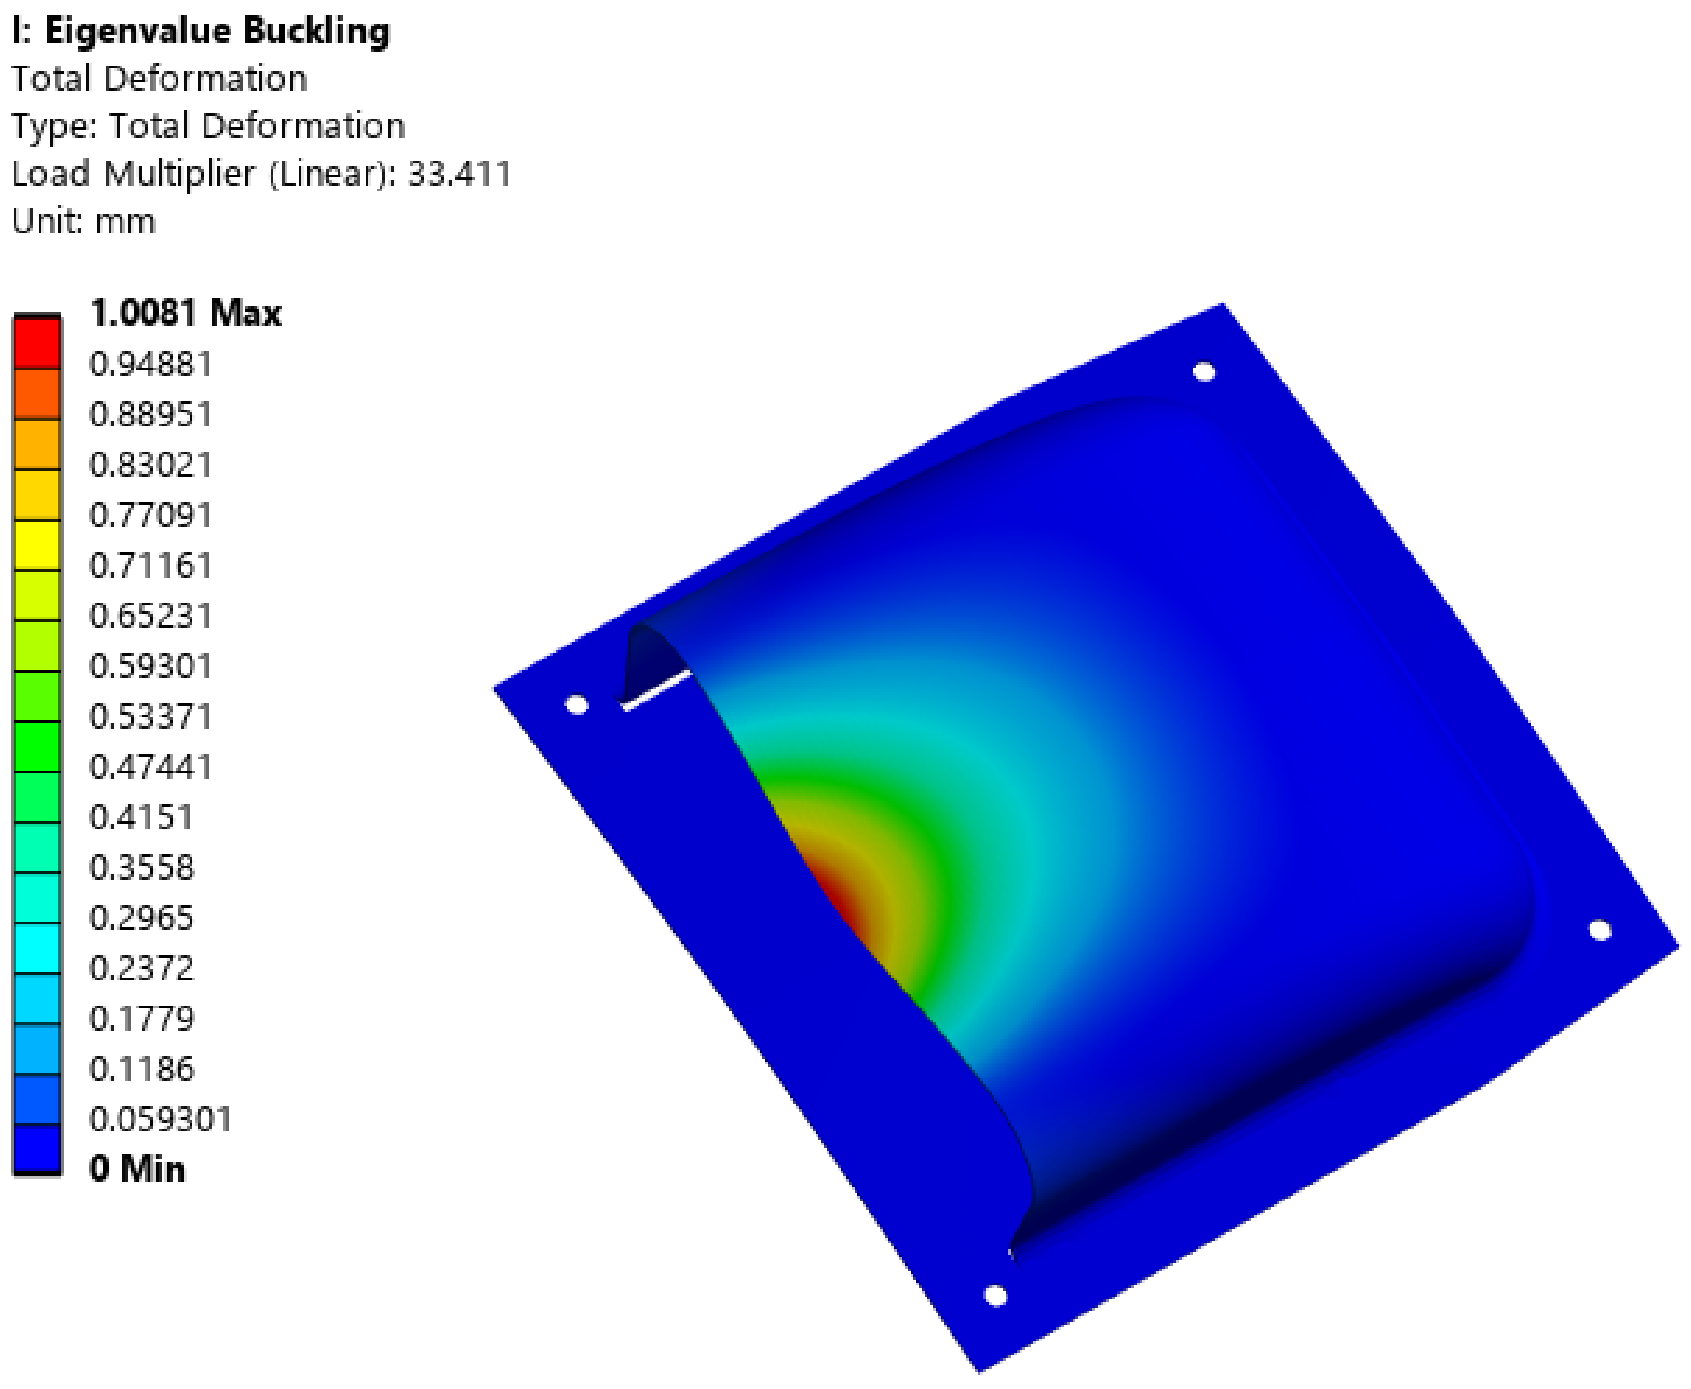
Load case 6 is +20 G acceleration in the z-direction. It was confirmed to be similar to load case 4. The structural analysis results showed that the maximum stress occurred in outer layer 1. The tensile stress is 17.882 MPa, and the compressive stress is 11.324 MPa. Inner layer 2 has a tensile stress of 9.558 MPa. The compressive stress is 7.638 MPa. The tensile stress of internal layer 5 is 3.811 MPa, and the compressive stress is 12.003 MPa. Therefore, the structural design was confirmed to be sufficiently safe. A displacement analysis was performed. The displacement at the edge was determined to be 0.368 mm. Therefore, the displacement was confirmed to be well within safe limits. A buckling analysis was carried out. The buckling analysis results show a first-mode buckling load factor of 35.411. Therefore, the structure was determined to be sufficiently stable against buckling. Table 3 shows summary of structural analysis results for each load case. Among the structural analysis results, the results for load cases 5 and 6, which exhibited the highest stresses, are presented. Figure 18, Figure 19 and Figure 20 show the stress analysis results of load case 5. The displacement analysis result was shown in Figure 21. The buckling analysis result was shown in the Figure 22.
Table 3.
Summary of structural analysis results.
Figure 18.
Stress analysis result of load case 6: Layer 1.
Figure 19.
Stress analysis result of load case 6: Layer 2.
Figure 20.
Stress analysis result of load case 6: Layer 5.
Figure 21.
Displacement analysis result of load case 6.
Figure 22.
Buckling analysis result of load case 6 (Mode 1).
The tensile strength of material is 917.59 MPa, and its compressive strength is 708.86 MPa. The maximum tensile stress is 37.68 MPa, and the maximum compressive stress is 38.22 MPa. Therefore, it is safe as the material strength is not exceeded.
In this study, tensile and compressive stresses were investigated. After the stress analysis, the safety factor was evaluated. The classical lamination theory was applied as the fundamental theory [26]. The Tsai–Wu failure theory was applied as the failure criterion for investigating the safety factor [27,28]. Tsai and Wu assumed that the failure surface in stress space is as below, where is strength tensor of second rank and is strength tensor of fourth rank. It is defined as follows: , , . Equation (2) is the expression for plane stress. The first-order stress term applies to cases where tensile and compressive strengths differ. The second-order term is an ellipsoid in stress space. stress interaction between direction 1 and 2.
where if tensile stress , Equation (2) becomes as follows:
where if compressive stress , Equation (2) becomes as below. Equations (7) and (8) are also derived using the same method.
For a unidirectional ply, positive and negative shear stresses relative to the ply axis yield the same result. Since cannot be determined from any uniaxial test, a biaxial test must be performed. is the coefficient of . When the biaxial tensile stress is applied in Equation (2), with all other stress components set to zero, the result given in Equation (11) is obtained.
In the absence of experimental data, Equation (13) becomes as follows:
If we assume that , the Tsai–Wu failure criterion takes the following form:
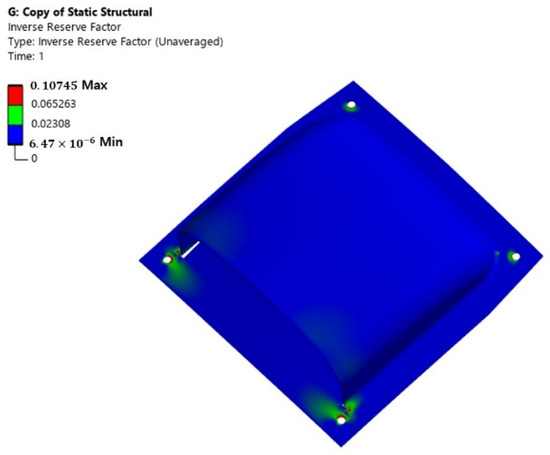
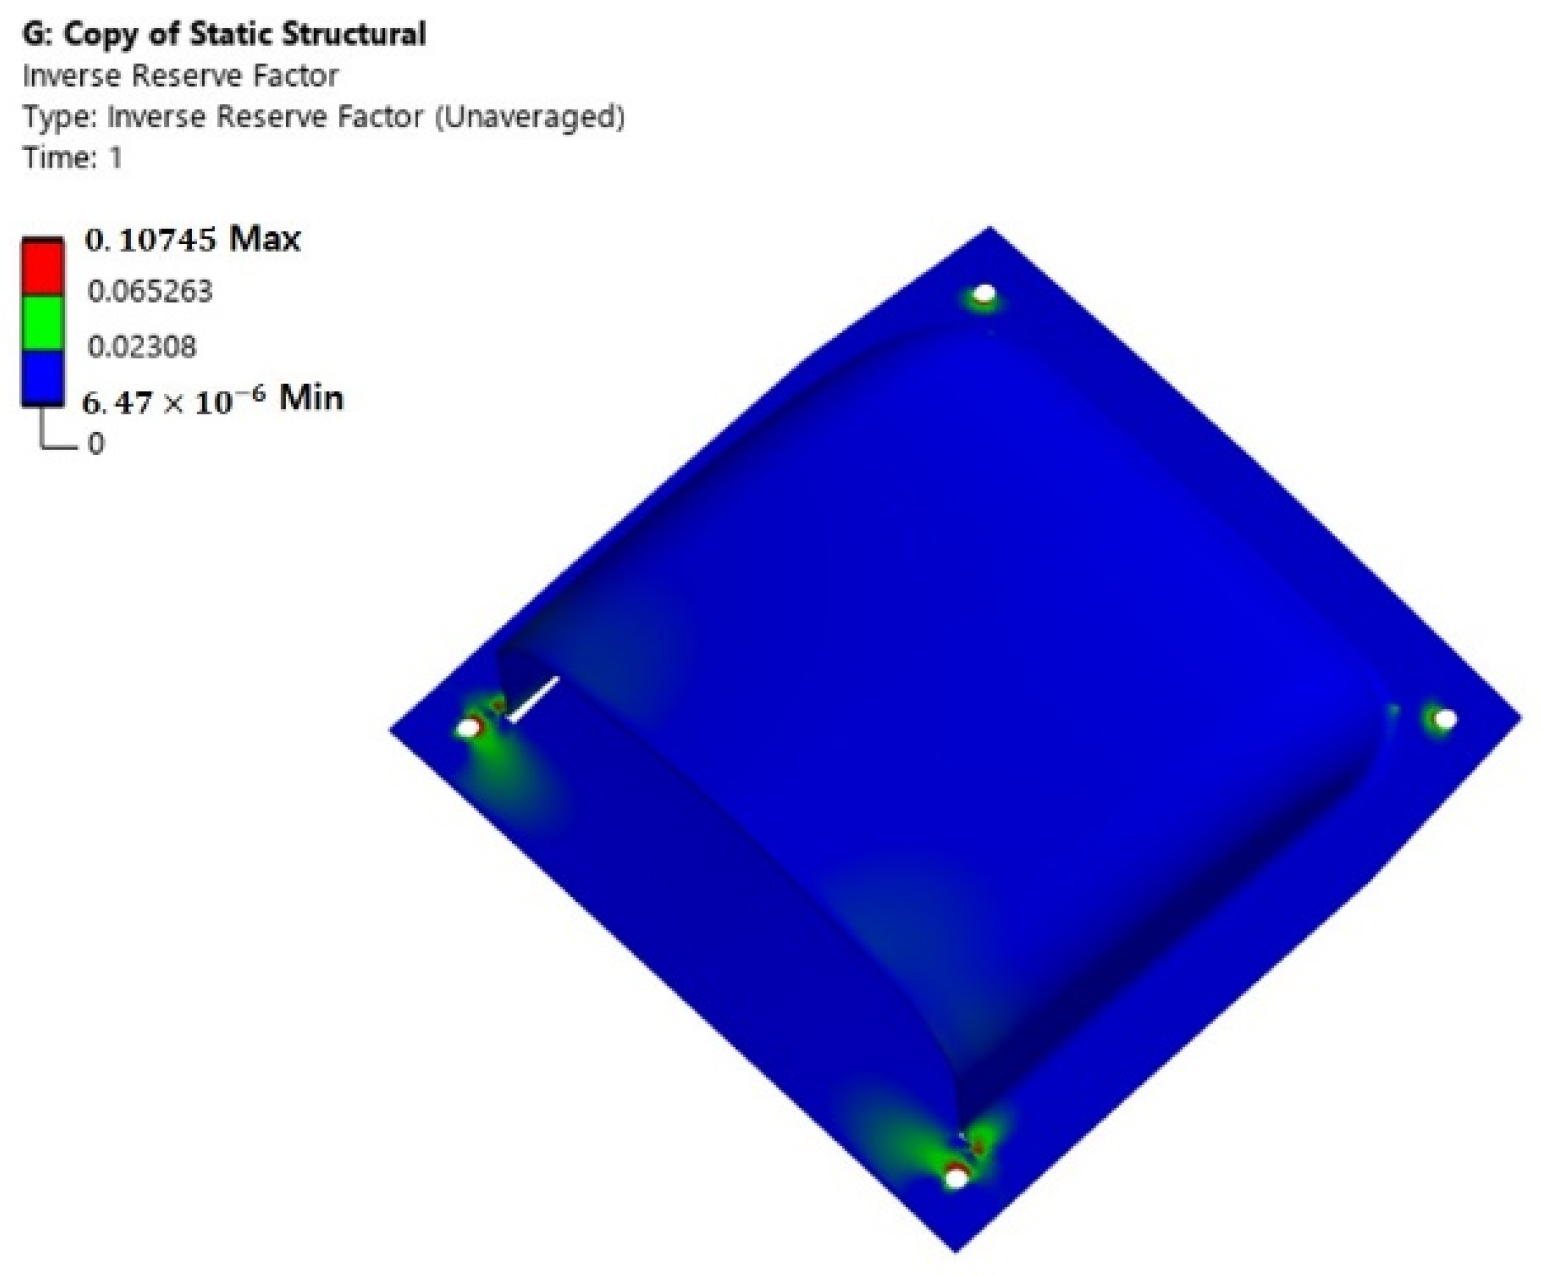
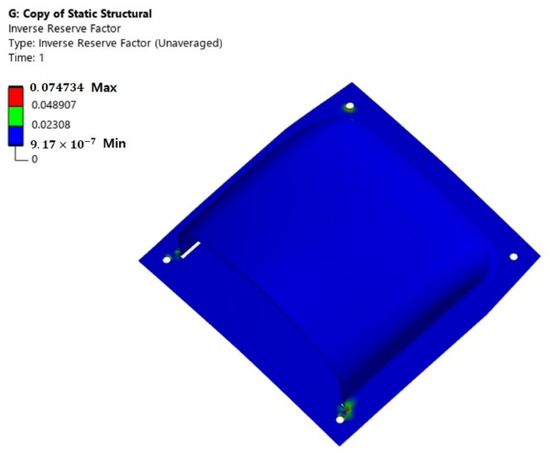
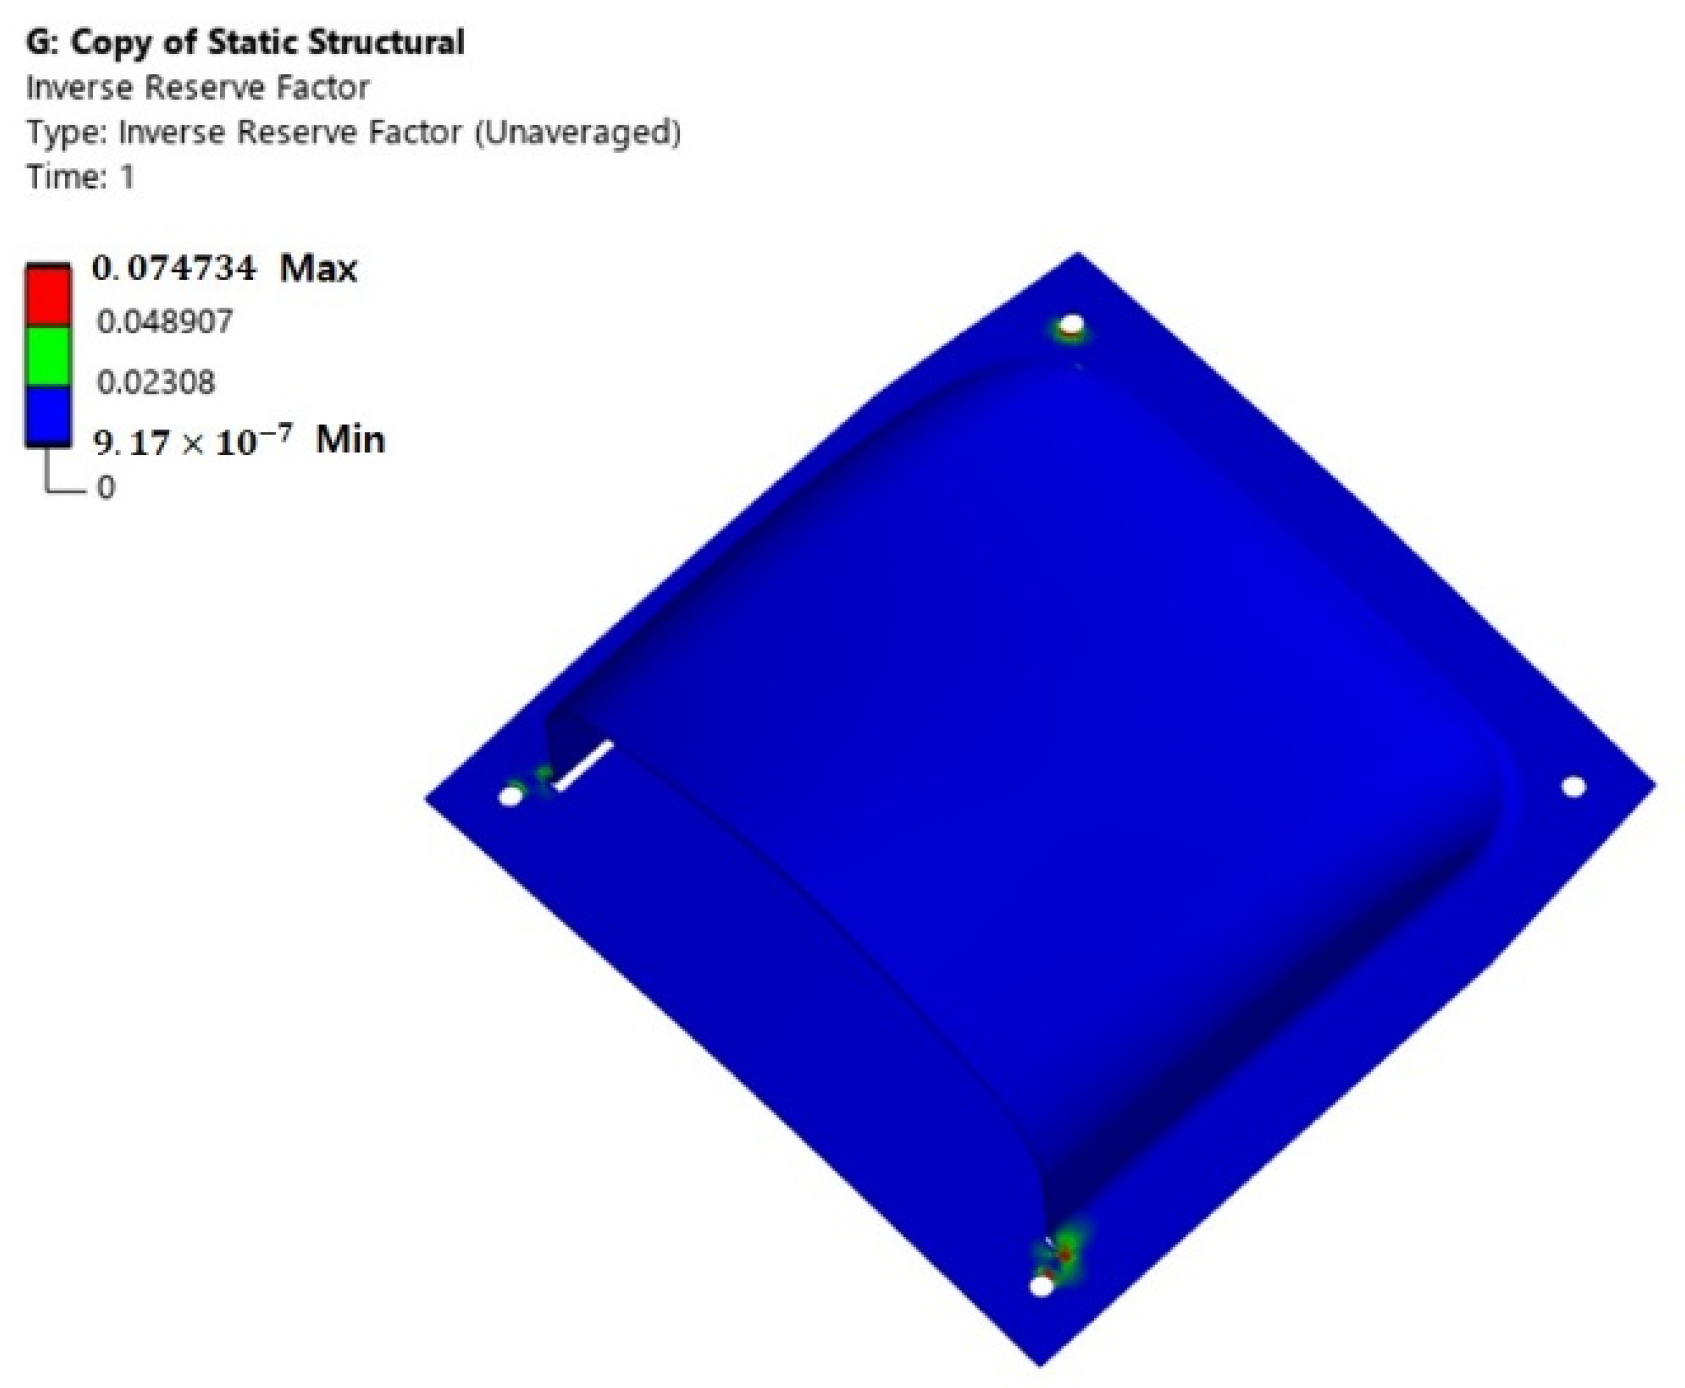
In this work, a Tsai–Wu failure index analysis was performed to evaluate the structural safety factor of the composite material. The failure criterion indicates that failure occurs when its value is greater than or equal to 1. The failure criterion is a standard used to assess the safety of a structure. Equation (15) represents the Tsai–Wu failure criterion. It is the governing equation applied within the finite element analysis. In this study, the Tsai–Wu failure analysis results was confirmed that the structural design result is sufficiently safe. Table 4 shows summary of failure criteria analysis results. The Tsai–Wu failure criterion of load case 5 is shown in Figure 23. The Tsai–Wu failure criterion of load case 6 is shown in Figure 24.
Table 4.
Summary of failure criteria analysis results.
Figure 23.
Tsai–Wu failure criterion of load case 5.
Figure 24.
Tsai–Wu failure criterion of load case 6.
The structural design results for the carbon/epoxy composite were compared with those of the conventional aluminum alloy structure. The weight comparison confirmed that the carbon/epoxy composite structure achieved a 55% weight reduction. Table 5 shows comparison result of composite and metallic structure.
Table 5.
Comparison of composite and metallic structures.
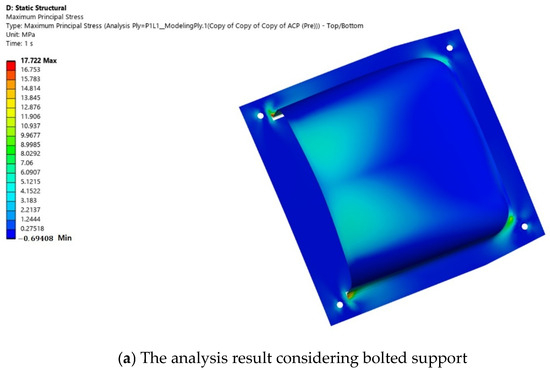
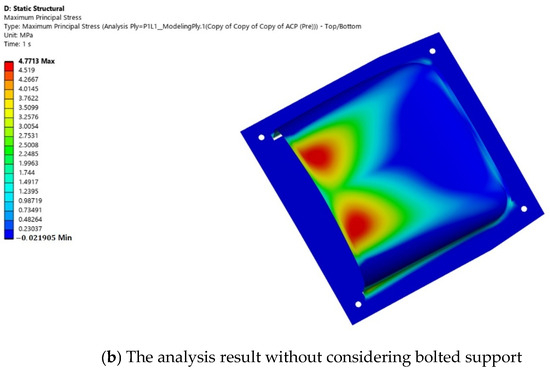
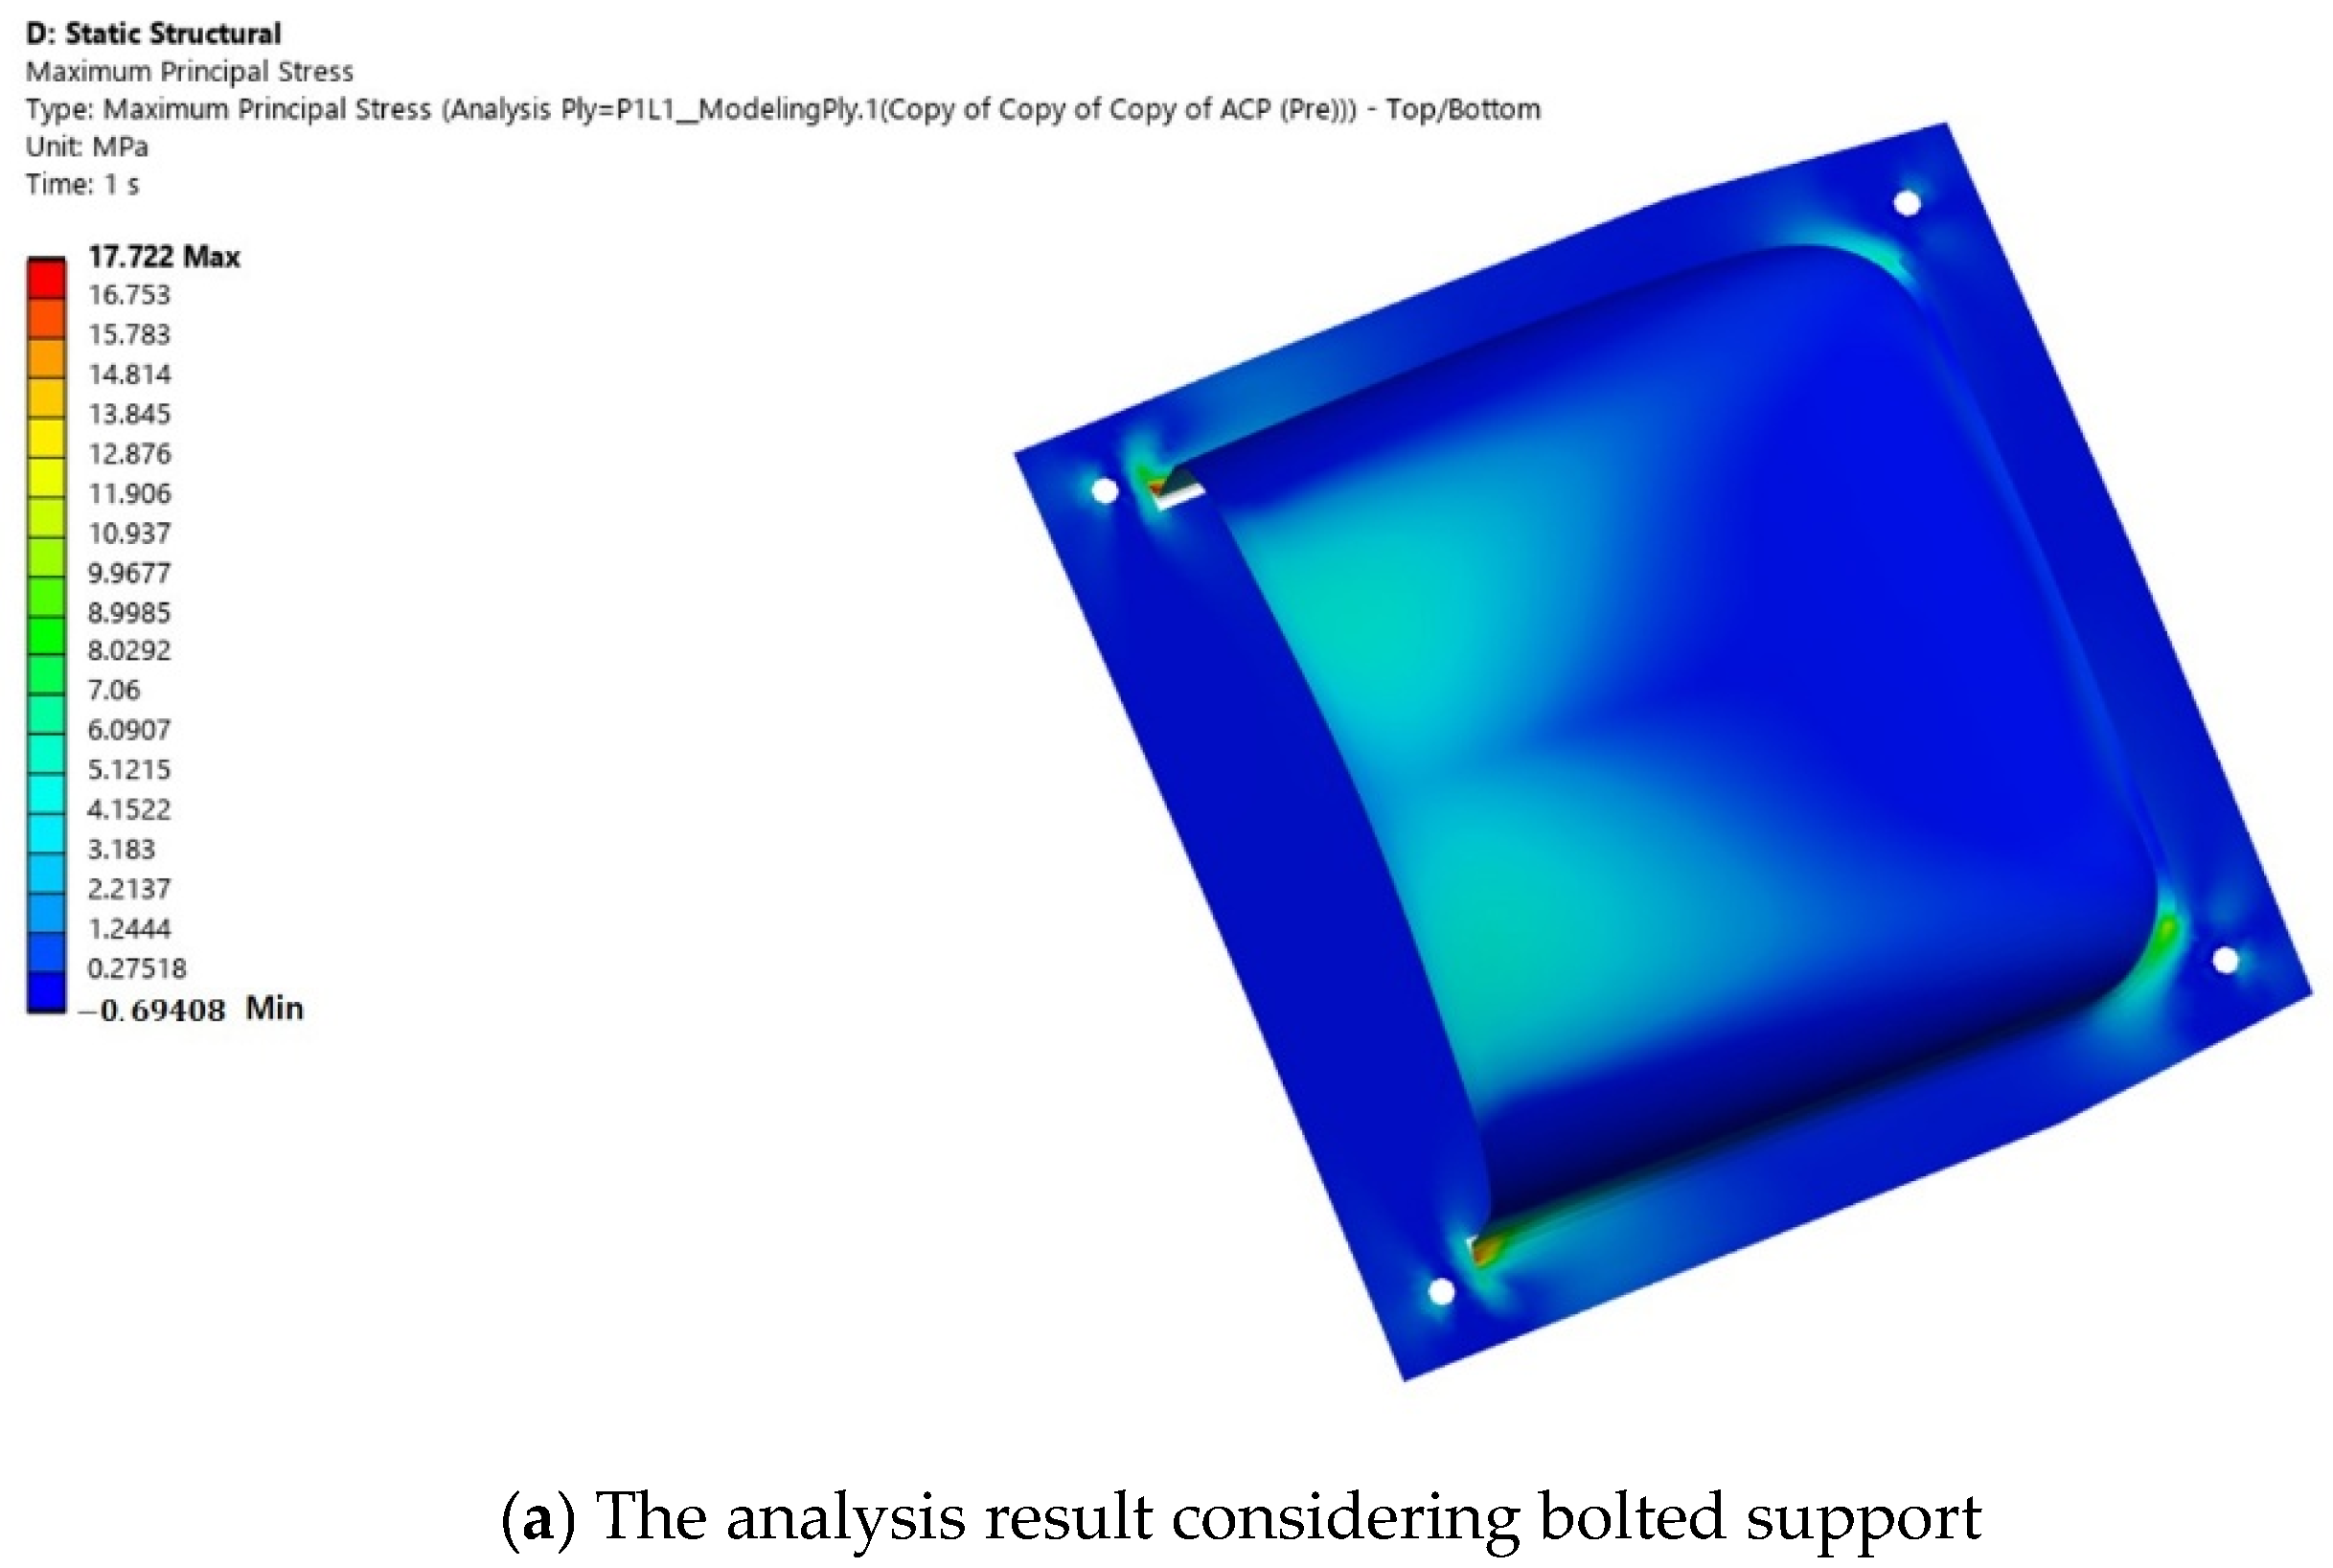
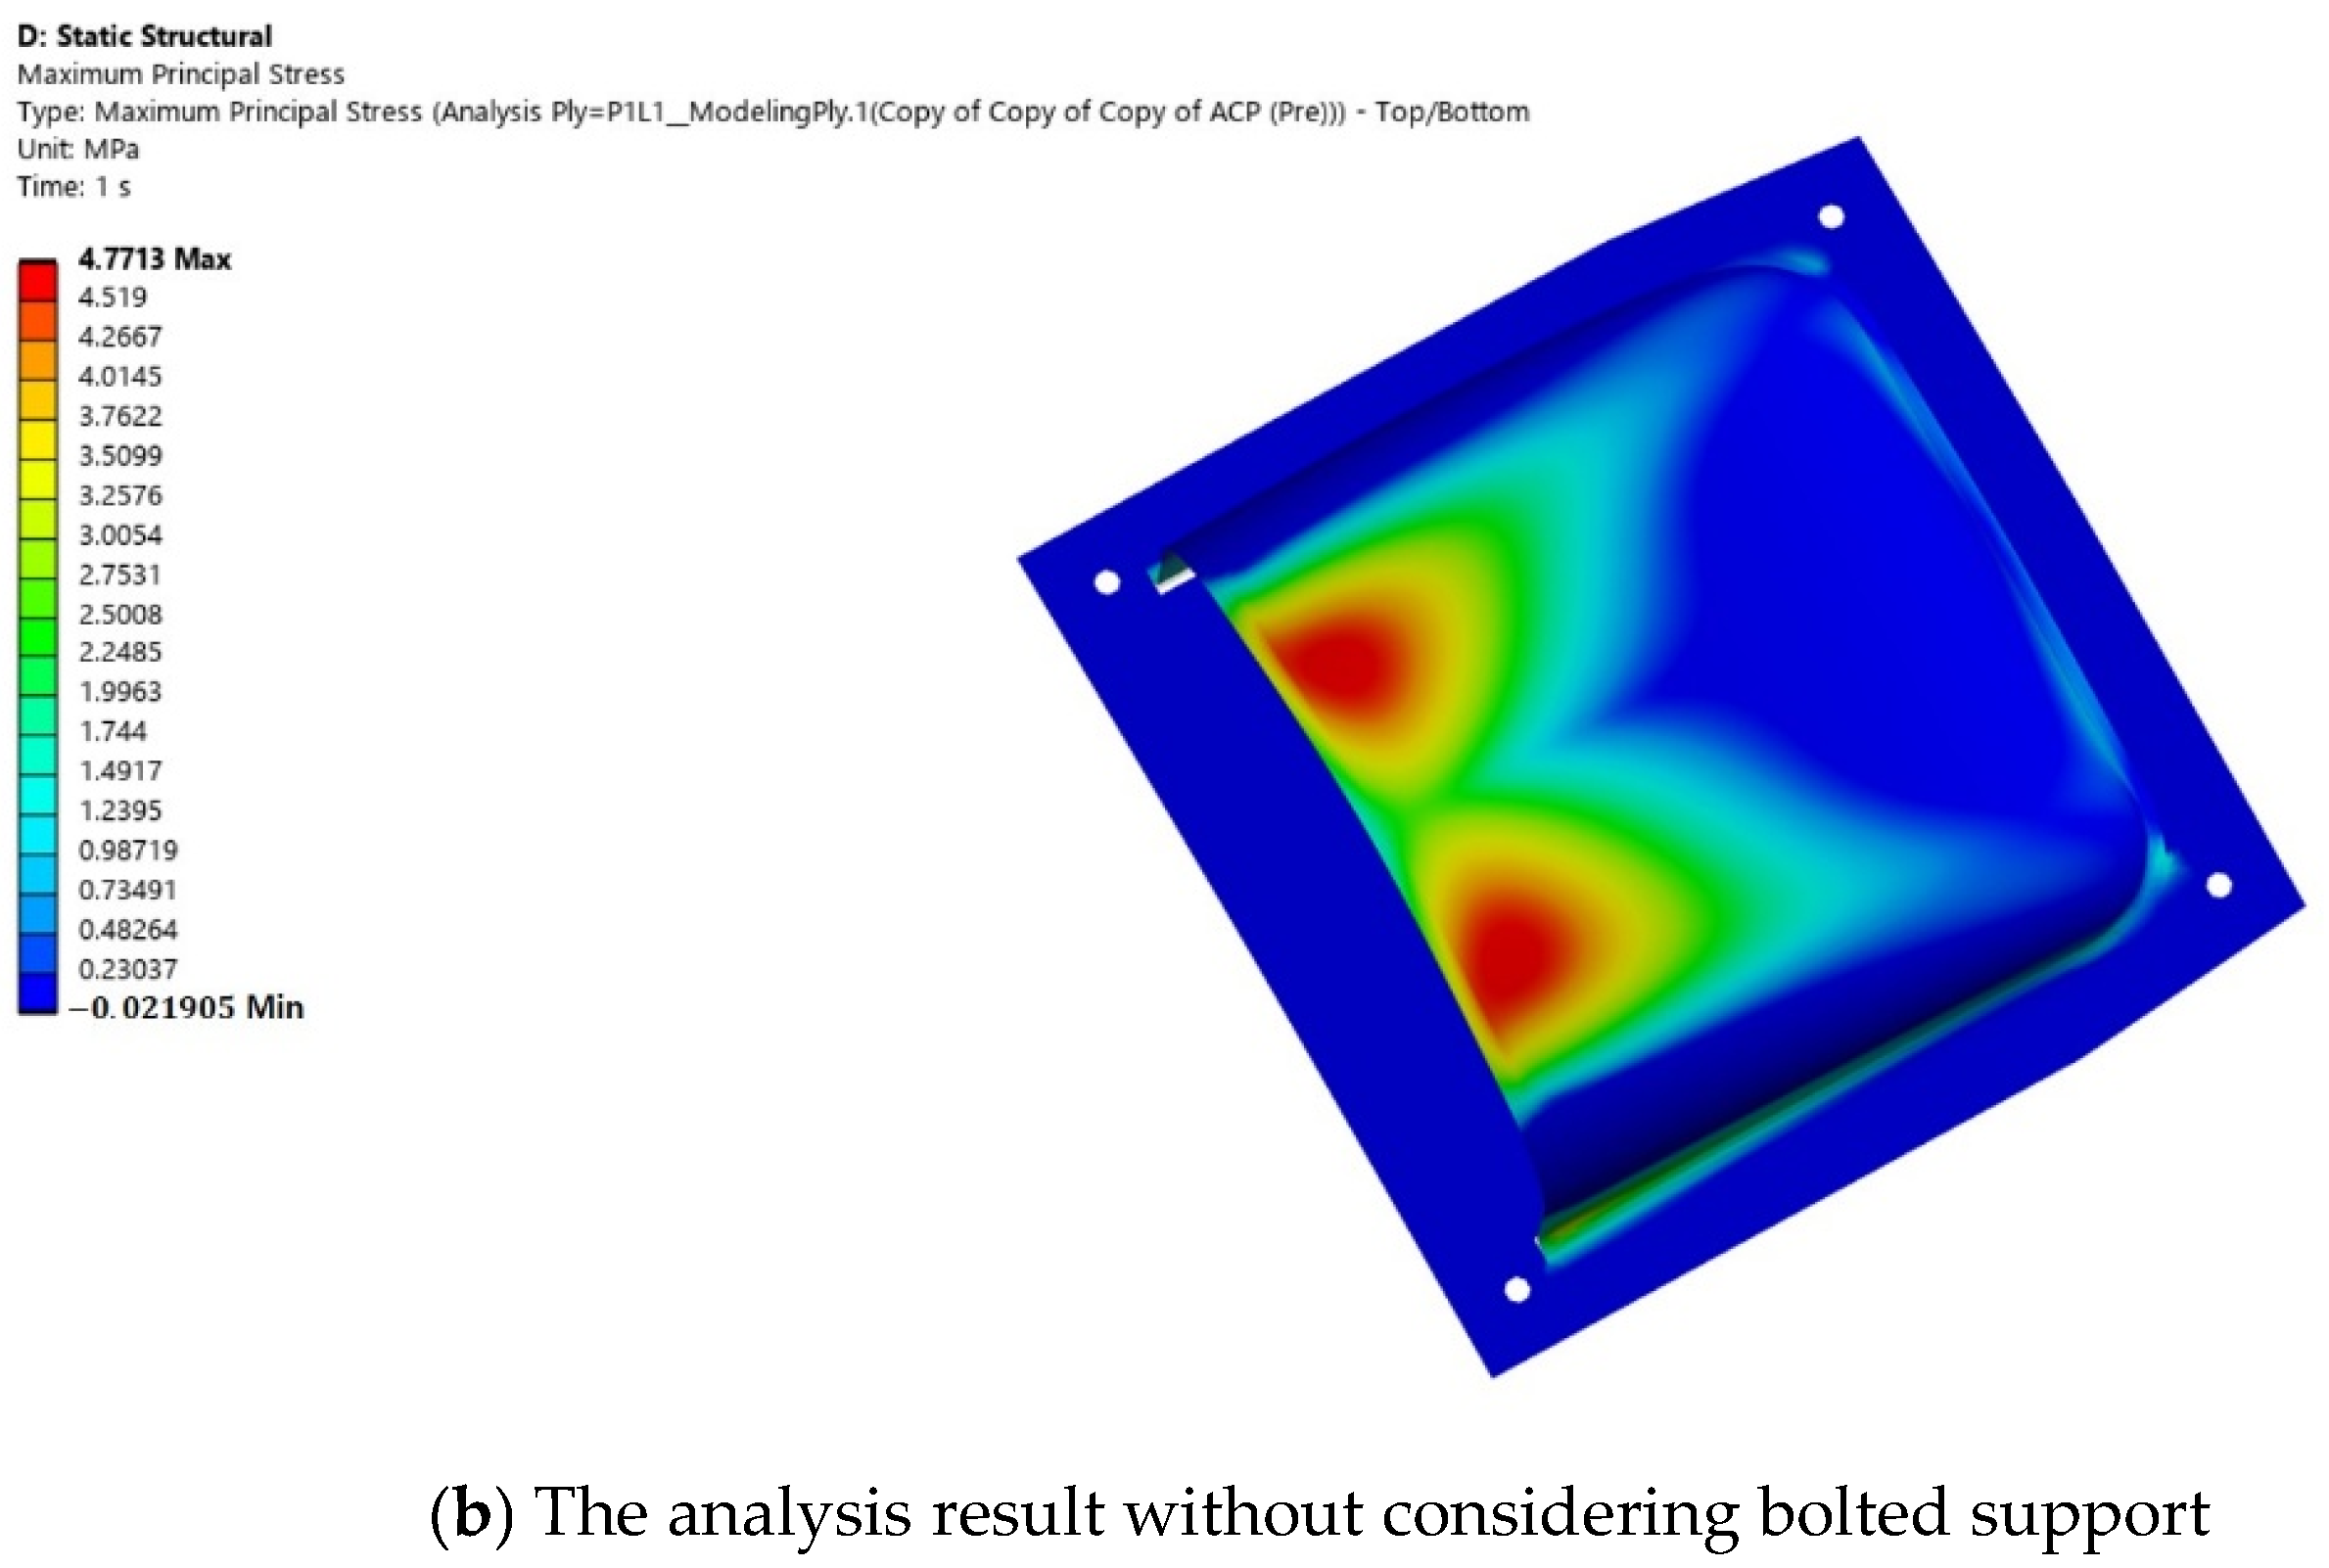
The structural analysis was performed by varying the boundary conditions of the joint part. The bolted support representation effect was analyzed. The first case represents the analysis result considering bolted support. The second case represents the result of structural analysis performed without considering bolted support. Since the difference between the two results is not significant, the analysis results are valid. Figure 25 shows a comparison of the two interpretation results.
Figure 25.
Comparison of structural analysis results of the joint parts.
4. Conclusions
In this study, an aircraft air inlet fabricated from carbon fiber composites was designed and analyzed. Aerodynamic loads under various operating conditions were evaluated using computational fluid dynamics (CFD). The resulting pressure distributions were converted into structural design loads and applied in the ANSYS FE analysis to assess the integrity of the scoop. The loading conditions were defined based on the pressure distributions acting on the upper and lower surfaces of the scoop under baseline operating conditions, together with acceleration loads. A safety factor of 1.5 was applied to all design loads to ensure structural safety.
For the boundary conditions, fixed constraints were applied to the connection regions on the four lower sides. The stress analysis results showed that, under the full load condition, the scoop structure was safe in terms of both stress and deformation. In addition, because wide planar structures are generally vulnerable to buckling, a buckling analysis was also performed. The results confirmed that the structure had sufficient stability against buckling. Finally, the safety factor was evaluated based on composite material failure criteria.
In this work, the aerodynamic pressure extracted from the simplified CFD domain intentionally neglected internal boundary layer growth, turning losses, and viscous dissipation within the duct bends. From a structural mechanics perspective, this simplification provides a conservative upper bound for the differential pressure loading across the scoop. By designing the composite laminate against this elevated pressure envelope, a robust structural safety margin is maintained against unmodeled transient pressure spikes, such as rapid pitch maneuvers or flow distortion.
Even under the overestimated aerodynamic pressure regime, the laminate stress state evaluated via the Tsai–Wu criterion yielded a minimum margin of safety. Furthermore, the linear eigenvalue buckling analysis confirmed that the critical load multiplier exceeds 17, demonstrating that the structural sizing remains safe and structurally efficient without incurring severe weight penalties compared to traditional isotropic metallic counterparts.
This study focuses on the initial conceptual design. For the structural design of the UAV, a conservative, fail-safe design approach was adopted to account for conditions ranging from unsteady flow to sudden surges and overpressure within the duct. This approach did not result in an excessive increase in composite skin thickness due to overestimated pressure, and the weight-saving benefits compared to conventional metallic structures were maintained.
A limitation of this study is that certain high-pressure values were applied as design loads due to the use of simplified analysis. This aspect will be improved in future research. The future work will aim to refine the design results by conducting high-fidelity fluid–structure interaction (FSI) analyses that incorporate precise internal flow path geometries and pressure loss coefficients.
Author Contributions
T.H.; investigation: conducting a research and investigation process, specifically performing the experiments, or data/evidence collection, S.J.; methodology, M.L.; validation, H.L.; data curation. C.S.; supervision, H.P.; writing—review and editing and work guidance. All authors have read and agreed to the published version of the manuscript.
Funding
This research was supported by the ANCHOR program through the Jeonbuk ANCHOR Center, funded by the Ministry of Education (MOE) and the Jeonbuk State, Republic of Korea (2026-ANCHOR-13-KSU). This work was supported by the Korea Institute of Energy Technology Evaluation and Planning (KETEP) and the Ministry of Climate, Energy & Environment (MCEE) of the Republic of Korea (No. RS-2022-KP002709).
Institutional Review Board Statement
Not applicable.
Informed Consent Statement
Not applicable.
Data Availability Statement
Data is contained within the article.
Acknowledgments
This research was supported by K-Glocal frontier program of Kunsan National University for National University Development Project.
Conflicts of Interest
The authors declare no conflicts of interest.
Abbreviations
| strength tensor of second rank | |
| strength tensor of fourth rank | |
| 1 and 2 direction stress interaction | |
| tensile strength of x-axis | |
| compressive strength of x-axis | |
| tensile strength of y-axis | |
| tensile strength of y-axis | |
| shear strength | |
| tensile stress | |
| compressive stress | |
| normal stress of out of plane | |
| shear stress of 2 and 3 direction | |
| shear stress of 3 and 1 direction | |
| shear stress of 1 and 2 direction |
References
- Yuan, X.; Hu, C.; Liu, H.; Yang, F.; Gu, J.; Chai, Z. Comparative analysis of nonlinear data-driven modeling of inlet distortion for nacelle air-intake system. Aerosp. Sci. Technol. 2026, 174, 111890. [Google Scholar] [CrossRef] [Scilit]
- Yang, X.; Cao, C.; Wang, C.; Li, L.; Sun, G. Surrogate-based optimization of nacelle intake with fan-intake interaction: Mitigating flow separation under crosswind. Aerosp. Sci. Technol. 2023, 142, 108641. [Google Scholar] [CrossRef] [Scilit]
- Wang, B.; Wang, Q.; Li, S. Effect of baffle board on aerodynamic and stealth performance of double S-duct caret intake. Appl. Sci. 2024, 14, 3747. [Google Scholar] [CrossRef] [Scilit]
- Bravo-Mosquera, P.D.; Abdalla, A.M.; Cerón-Muñoz, H.D.; Catalano, F.M. Integration assessment of conceptual design and intake aerodynamics of a non-conventional air-to-ground fighter aircraft. Aerosp. Sci. Technol. 2019, 86, 497–519. [Google Scholar] [CrossRef] [Scilit]
- Vercillo, V.; Karpen, N.; Laroche, A.; Guillén, J.A.M.; Tonnicchia, S.; Jorge, R.D.A.; Bonaccurso, E. Analysis and modelling of icing of air intake protection grids of aircraft engines. Cold Reg. Sci. Technol. 2019, 160, 265–272. [Google Scholar] [CrossRef] [Scilit]
- Bagnoli, F.; Beronabei, M.; Ciliberto, A. Failure analysis of an aircraft auxiliary power unit air intake door. Eng. Fail. Anal. 2011, 18, 284–294. [Google Scholar] [CrossRef] [Scilit]
- Doubrava, R.; Vlach, J.; Oberthor, M.; Vích, O.; Bělský, P. Bird strike tests, analyses, and design optimisation of a tilt-rotor aircraft composite inlet. Eng. Fail. Anal. 2014, 161, 108244. [Google Scholar] [CrossRef] [Scilit]
- Fusaro, R.; Ferretto, D.; Viola, N.; Scigliano, R.; Simone, V.D.; Marini, M. Liquid Metals Heat-Pipe solution for hypersonic air-intake leading edge: Conceptual design, numerical analysis and verification. Acta Astronaut. 2022, 197, 336–352. [Google Scholar] [CrossRef] [Scilit]
- Jing, S.; Hu, Y.; Xu, J.; Jiang, Y.; Zheng, W.; Du, Y. Numerical study on the icing hazard zone of engine intake components under anti-icing conditions. Cold Reg. Sci. Technol. 2026, 248, 104943. [Google Scholar] [CrossRef] [Scilit]
- Suzuki, N.; Tokuhiro, S.; Takeuchi, O. Double cylinder forming by die-less shear spinning for air intake lip skin of aero jet engine nacelle. Procedia Manuf. 2018, 15, 1270–1277. [Google Scholar] [CrossRef] [Scilit]
- Rajkumar; Yadav, G.S. Lightweight design and structural analysis of air intake manifold using composites. Int. J. Res. Appl. Sci. Eng. Technol. 2025, 13, 3176–3185. [Google Scholar] [CrossRef] [Scilit]
- Jung, H.; Im, S.K. Off-design characteristics of a scoop-type streamline-tracing scramjet inlet. Aerosp. Sci. Technol. 2024, 149, 109139. [Google Scholar] [CrossRef] [Scilit]
- Rea, S.; Linton, D.; Orr, E.; McConnell, J. Electromagnetic modeling of aircraft air inlet Scoop. In Proceedings of the 33rd European Microwave Conference Proceedings, Munich, Germany, 2–10 October 2003; Available online: https://doi.org/10.1109/EUMA.2003.340837 (accessed on 2 April 2007).
- John, M.A. Aeroacoustic performance of a scoop inlet. In Proceedings of the 4th Aeroacoustics Conference, Atlanta, GA, USA, 3–5 October 1977. [Google Scholar]
- Qiang, X.; Xue, Y.; Deng, H. Inlet distortion of a rear engines concept aircraft and its effect on a fan. Case Stud. Therm. Eng. 2024, 61, 105032. [Google Scholar] [CrossRef] [Scilit]
- Nikolaou, E.; Kilimtzidis, S.; Giannaros, E.; Lappas, V.; Kostopoulos, V. Thermal management of unmanned aerial vehicle power systems using ducted forced convection and computational fluid dynamic validation. Appl. Sci. 2025, 15, 12508. [Google Scholar] [CrossRef] [Scilit]
- Li, Z.; Chen, C.; Pei, H.; Kong, B. Structural optimization of the aircraft NACA inlet based on BP neural networks and genetic algorithms. Int. J. Aerosp. Eng. 2020, 2020, 8857821. [Google Scholar] [CrossRef] [Scilit]
- Almeida, O.D.; Souza, P.C.; Cunha, E. A numerical approach for implementing air intakes in a canard type aircraft for engine cooling purposes. J. Aerosp. Technol. Manag. 2021, 13, e0221. [Google Scholar] [CrossRef] [Scilit]
- Drezek, P.S.; Kubacki, S.; Zoltak, J. Kriging-based framework applied to a multi-point, multi-objective engine air-intake duct aerodynamic optimization problem. Aerospace 2023, 10, 266. [Google Scholar] [CrossRef] [Scilit]
- Ren, J.; Wu, Z.; Tan, H.; Wang, Z.; He, X.; Li, D.; Zhou, Y. Experimental study of the aerodynamic performance and flow characteristics of an integrated UAV inlet with double 90° bends. Aerospace 2024, 11, 593. [Google Scholar] [CrossRef] [Scilit]
- Arena, G.; Groh, R.M.J.; Theunissen, R.; Weaver, P.M.; Pirrera, A. Design and testing of a passively adaptive inlet. Smart Mater. Struct. 2018, 27, 085019. [Google Scholar] [CrossRef] [Scilit]
- Jones, R.M. Mechanics of Composite Materials, 2nd ed.; Taylor & Francis: Philadelphia, PA, USA, 1999. [Google Scholar]
- U.S. Department of Defense. Environmental Engineering Considerations and Laboratory Tests, MIL-STD-810G, Method 516.6 (Shock). 2008. Available online: https://www.cevians.com/app/uploads/2021/01/MIL-STD-810G.pdf (accessed on 31 October 2008).
- ASTM D3039/D3039M-17; Standard Test Method for Tensile Properties of Polymer Matrix Composite Materials. ASTM: West Conshohocken, PA, USA, 2025. Available online: https://store.astm.org/d3039_d3039m-17r25.html (accessed on 2 December 2025).
- ASTM D6641/D6641M-23; Standard Test Method for Compressive Properties of Polymer Matrix Composite Materials Using a Combined Loading Compression (CLC) Test Fixture. ASTM: West Conshohocken, PA, USA, 2023. Available online: https://store.astm.org/d6641_d6641m-16e02.html (accessed on 6 December 2023).
- Tsai, S.W.; Wu, E.M. A general theory of strength for anisotropic materials. J. Compos. Mater. 1971, 5, 58–80. [Google Scholar] [CrossRef] [Scilit]
- Li, S.; Sitnikova, E.; Liang, Y.; Kaddour, A.S. The Tsai-Wu failure criterion rationalised in the context of UD composites. Compos. Part A 2017, 102, 207–217. [Google Scholar] [CrossRef] [Scilit]
- Duan, Z.; Liu, Y.; Jin, H.; Fan, J.; Yan, J.; Zhu, J. Concurrent multi-scale variable stiffness design optimization of fiber-reinforced composite laminates with the Tsai-Wu failure criterion. Thin-Walled Struct. 2026, 227, 114864. [Google Scholar] [CrossRef] [Scilit]

Disclaimer/Publisher’s Note: The statements, opinions and data contained in all publications are solely those of the individual author(s) and contributor(s) and not of MDPI and/or the editor(s). MDPI and/or the editor(s) disclaim responsibility for any injury to people or property resulting from any ideas, methods, instructions or products referred to in the content. |
© 2026 by the authors. Licensee MDPI, Basel, Switzerland. This article is an open access article distributed under the terms and conditions of the Creative Commons Attribution (CC BY) license.