


Abstract
This study investigates how initial material deterioration and repeated stress changes affect the response of lining–rock systems during tunnel reconstruction and expansion. Monotonic uniaxial compression tests on limestone specimens with gypsum linings were monitored using digital image correlation. A corresponding numerical model was compared with the monotonic test response and used for incremental–static cyclic loading simulations. The numerical series examined cyclic stress amplitude, initial lining deterioration and initial surrounding-rock deterioration separately. Higher cyclic stress amplitudes produced greater convergence and more extensive plastic-zone development. The lining plastic-zone fraction increased more markedly between surrounding-rock deterioration levels of 20% and 30% than across the lower sampled levels, indicating a possible transition within the investigated range. Axial work-density changes depended on the parameter series and were not uniformly monotonic. A weighted five-indicator framework with prescribed engineering weights combines convergence, plastic-zone fractions and lining cohesion loss for relative comparison of the simulated cases. The findings identify regions and material conditions that warrant attention when assessing deteriorated linings and planning tunnel reconstruction and expansion.
1. Introduction
With increasing traffic demand, many existing highway tunnels in China require reconstruction or expansion [1,2]. Material aging, traffic-induced fatigue and environmental exposure can deteriorate tunnel linings, causing cracking, spalling and reduced load-bearing capacity [3,4,5,6,7,8]. Excavation and blasting during reconstruction introduce further disturbances to these existing structures [9,10,11]. Understanding how lining condition influences the response to repeated stress changes is therefore relevant to assessing deformation and damage during tunnel reconstruction and expansion.
Previous studies have examined lining response under geological and environmental deterioration [3,12,13,14,15]. Recent work also distinguishes the effects of repeated loading from those of pre-existing structural degradation. Wu et al. [16] combined lining model tests and finite-element analysis, finding a stronger deformation response to repeated-load magnitude than to frequency within their tested range. Li et al. [17] investigated train-induced response after prescribed lining-stiffness degradation, showing why the initial structural condition should be included in loading assessments. Hong et al. [18] identified different progressive lining-response modes under repeated loading and unloading motivated by periodic infiltration. Complementing these studies, Liu et al. [19] examined bending fatigue of tunnel-bottom specimens with degraded support conditions. Together, these studies show that load history, initial material condition and support configuration jointly influence lining response. Their differing loading and material representations also motivate controlled comparisons that separate prescribed cyclic stress amplitude from initial lining and surrounding-material deterioration.
In terms of tunnel safety assessment, existing studies extensively adopt the multi-criteria decision-making (MCDM) frameworks (e.g., fuzzy comprehensive evaluation and Delphi method) to classify and rank construction or operation risks [20,21,22,23,24]. Kim et al. [24] proposed a probabilistic approach for evaluating tunnel collapse risk, which employs a quantified grading system. Their framework demonstrated superior performance in distinguishing collapse-prone scenarios compared to rule-of-thumb criteria while also providing a reproducible grading workflow for practical engineering applications. Li et al. [25] developed a coupled EW-AHP weighting scheme integrated with an improved Quantitative Theory III model to evaluate tunnel collapse risks. This hybrid method reduced subjectivity in indicator weighting while enhancing classification accuracy across engineering case studies. Their findings revealed that the combined weighting approach stabilized risk rankings under indicator perturbations and improved the interpretability of the key risk contributor. Hamrouni et al. [22] conducted a reliability analysis for shallow tunnels using the Response Surface Methodology (RSM). This study quantified the probability of tunnel failure and identified dominant variables (e.g., ground deformability, overburden thickness) that influence lining moments and ground settlements. The RSM-based surrogate model reproduced finite-element method (FEM) responses efficiently and enabled engineers to gain sensitivity-driven risk insights during the tunnel design stage. These methods can form a structured indicator system when data is limited, and provide weight assignments and comprehensive scores [25,26]. To mitigate the subjectivity caused by complete reliance on expert judgment, some studies also integrated Bayesian networks with uncertainty reasoning tools such as fuzzy sets to enable dynamic updating [27,28,29]. However, a need remains for a mechanics-based framework that combines deformation, yielding and strength degradation under prescribed cyclic stress changes to compare the relative responses of deteriorated lining–rock systems.
The present study uses a common lining–rock specimen configuration to examine the effects of prescribed cyclic stress amplitude and initial material properties. Monotonic compression tests characterize the response of specimens with different initial lining conditions and provide a laboratory comparison for the numerical model. Incremental–static cyclic simulations then examine the evolution of deformation and yielding across the selected loading and deterioration series. A weighted five-indicator framework organizes these numerical responses for relative comparison, and the discussion considers their implications for assessing existing linings during tunnel reconstruction and expansion.
2. Physical Model Tests
2.1. Specimen Preparation
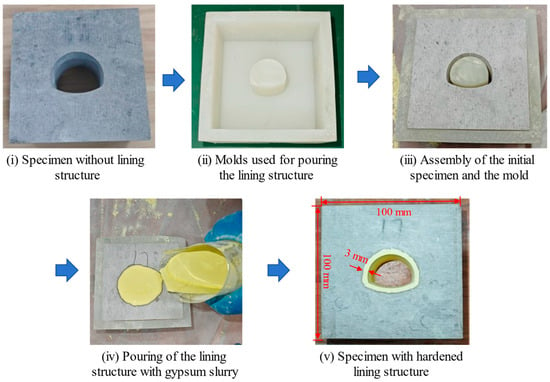
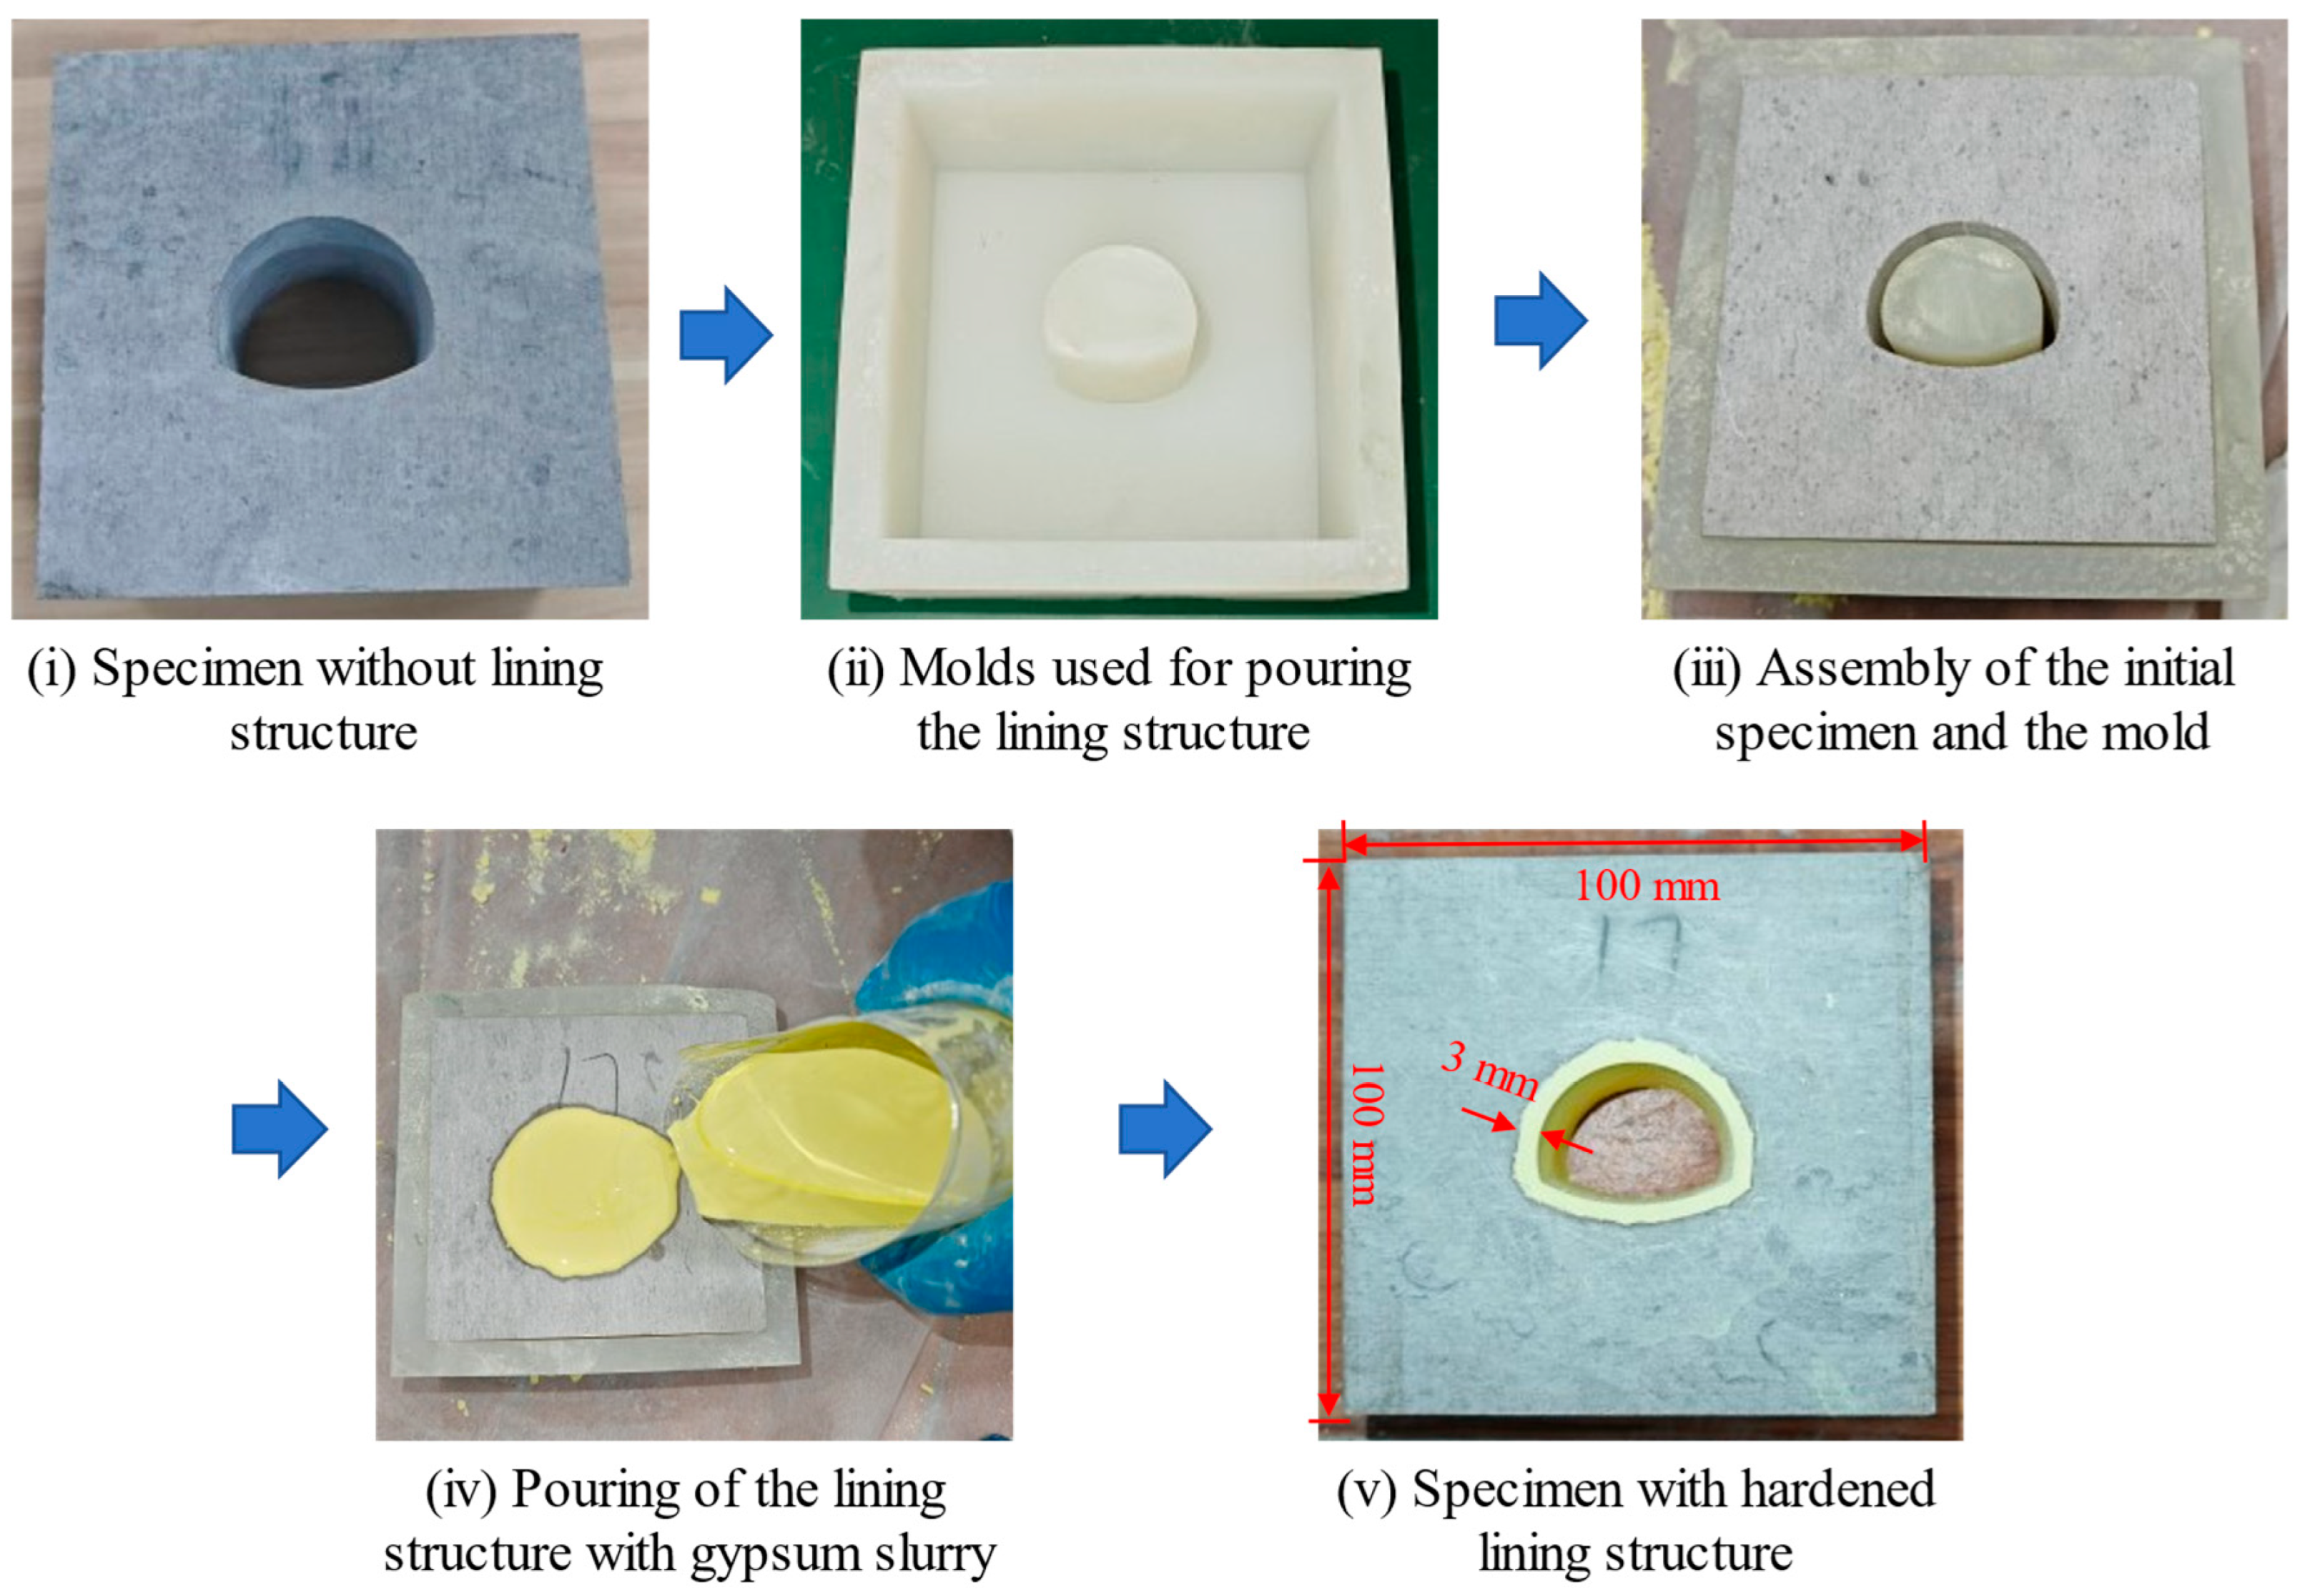
Four limestone blocks were obtained from the reconstruction and expansion site of the Jinan Ring Expressway in Shandong Province, China. Relatively uniform, intact limestone blocks were selected to reduce differences in the surrounding material between the lining-condition tests. Each block was prepared as a 100 × 100 × 50 mm cuboid, and a horseshoe opening following the actual tunnel cross-sectional outline was produced by wire cutting (Figure 1). A silicone mold provided a uniform 3 mm space for casting the gypsum lining. After the slurry hardened, the mold was removed, and the lined specimens were cured at room temperature for 14 days. The common geometry was used to compare lining properties at the specimen scale; it was not intended to reproduce the site’s stratigraphic sequence or discontinuity network.
Figure 1.
Flow chart for preparing samples containing lining structure. Blue arrows indicate the preparation sequence; red arrows indicate specimen dimensions and lining thickness.
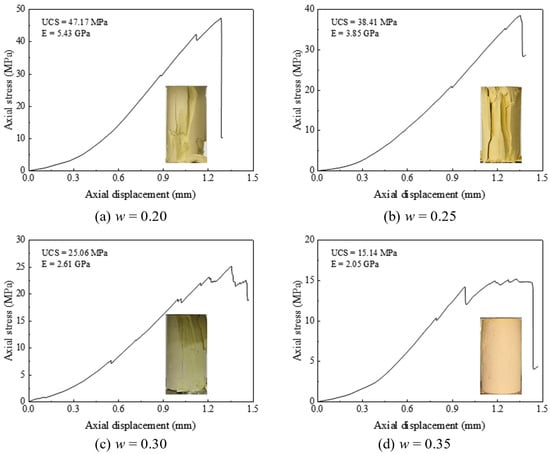
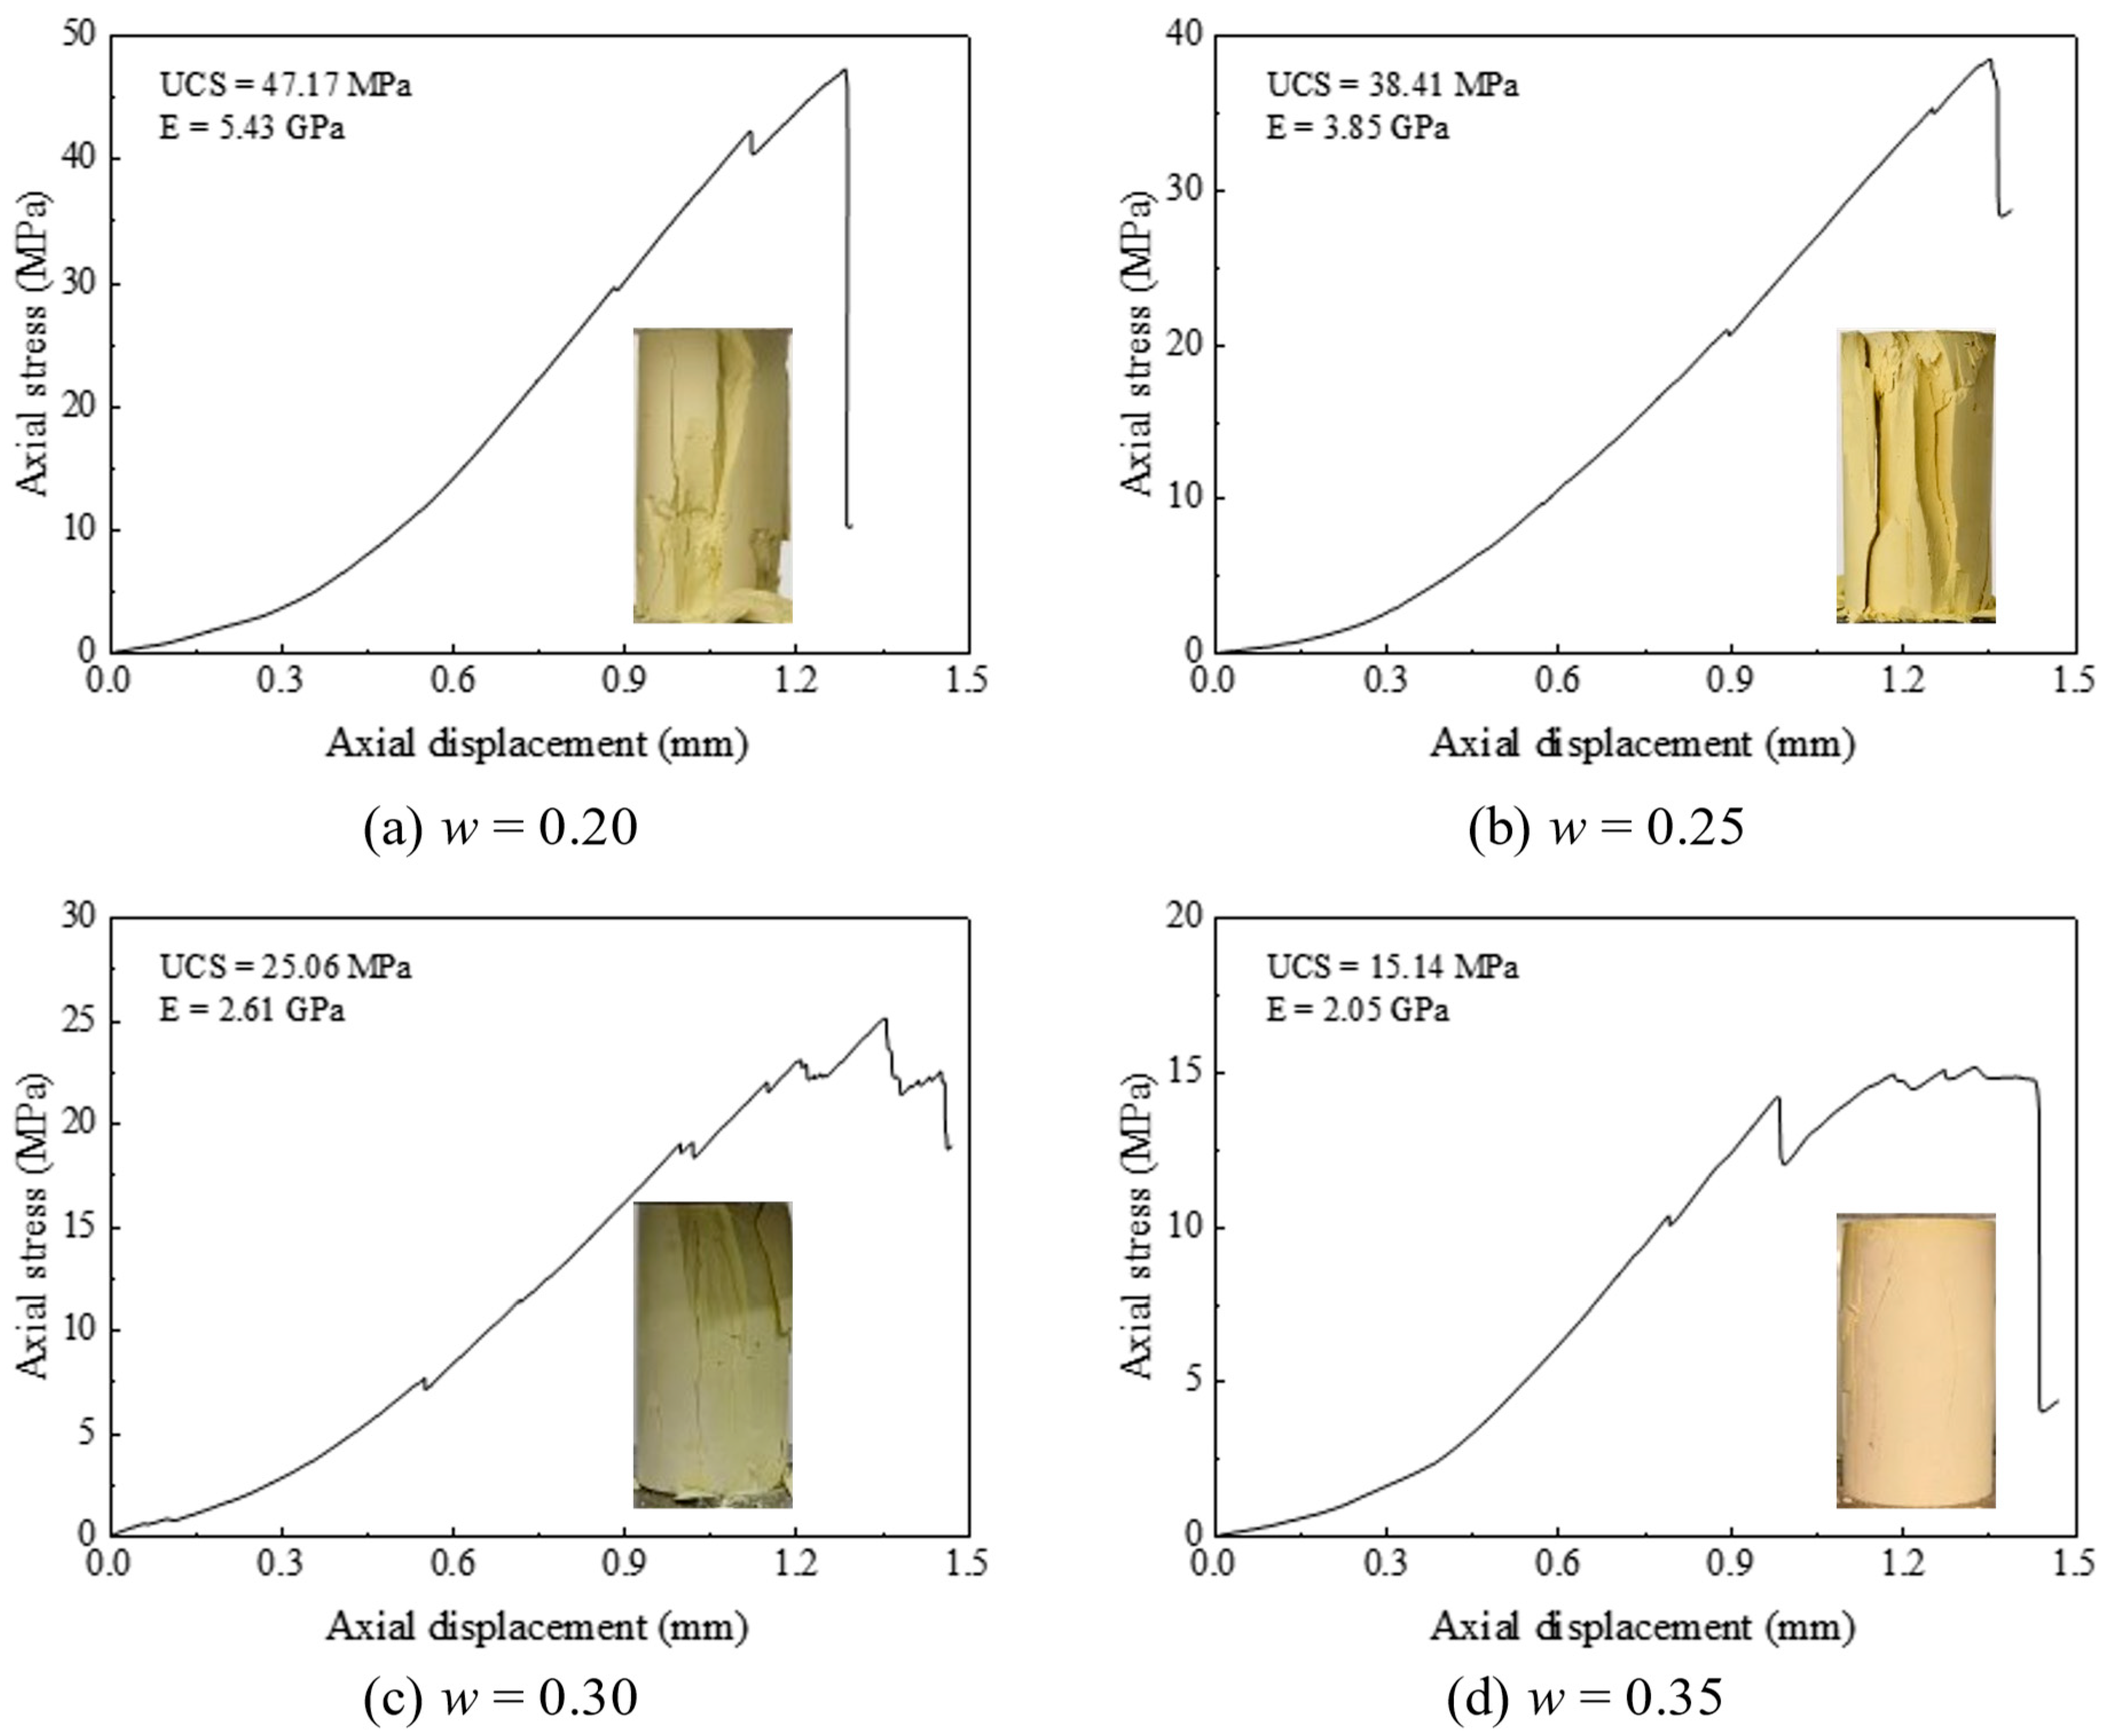
Four gypsum mixtures were prepared at water-to-binder ratios of w = 0.20, 0.25, 0.30 and 0.35 to vary the initial lining properties while retaining the same geometry. Gypsum-based analog materials allow strength and stiffness to be adjusted through mixture composition [30]. Figure 2 presents the stress–displacement curves and failure modes after 14 days of curing. As w increased from 0.20 to 0.35, the measured uniaxial compressive strength (UCS) decreased from 47.17 to 15.14 MPa and the elastic modulus decreased from 5.43 to 2.05 GPa. The relative UCS reduction from the w = 0.20 reference defines the lining-deterioration index, Di. The four conditions are labeled Di = 0%, 18.36%, 46.87% and 67.91%, respectively. One composite lining–rock specimen was tested for each condition. The comparisons describe this specimen series; independent replication would be needed to quantify between-specimen variability.
Figure 2.
Stress–displacement evolution curve and the final failure mode of rock-like materials with different water-to-binder ratios in uniaxial compression tests.
The gypsum lining is a material analog used to vary lining properties within a fixed specimen geometry. Specimen-based tests coupled with numerical comparisons have also been used to investigate lined openings under uniaxial compression [31]. The present idealization treats the surrounding material as uniform, intact limestone, without explicit joints or prescribed fractures; groundwater flow and hydro-mechanical coupling are not considered. These assumptions define the idealized mechanical setting of the comparison. Reported stresses and displacements remain at the specimen scale; no prototype conversion coefficients are applied. Conversion to field response would require consistent geometric, material and loading similitude.
2.2. Methods and Apparatus
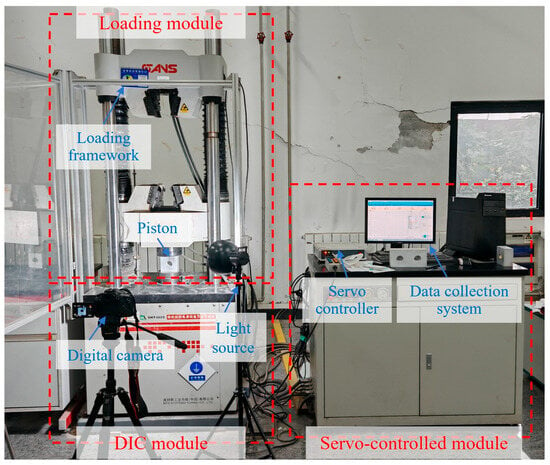
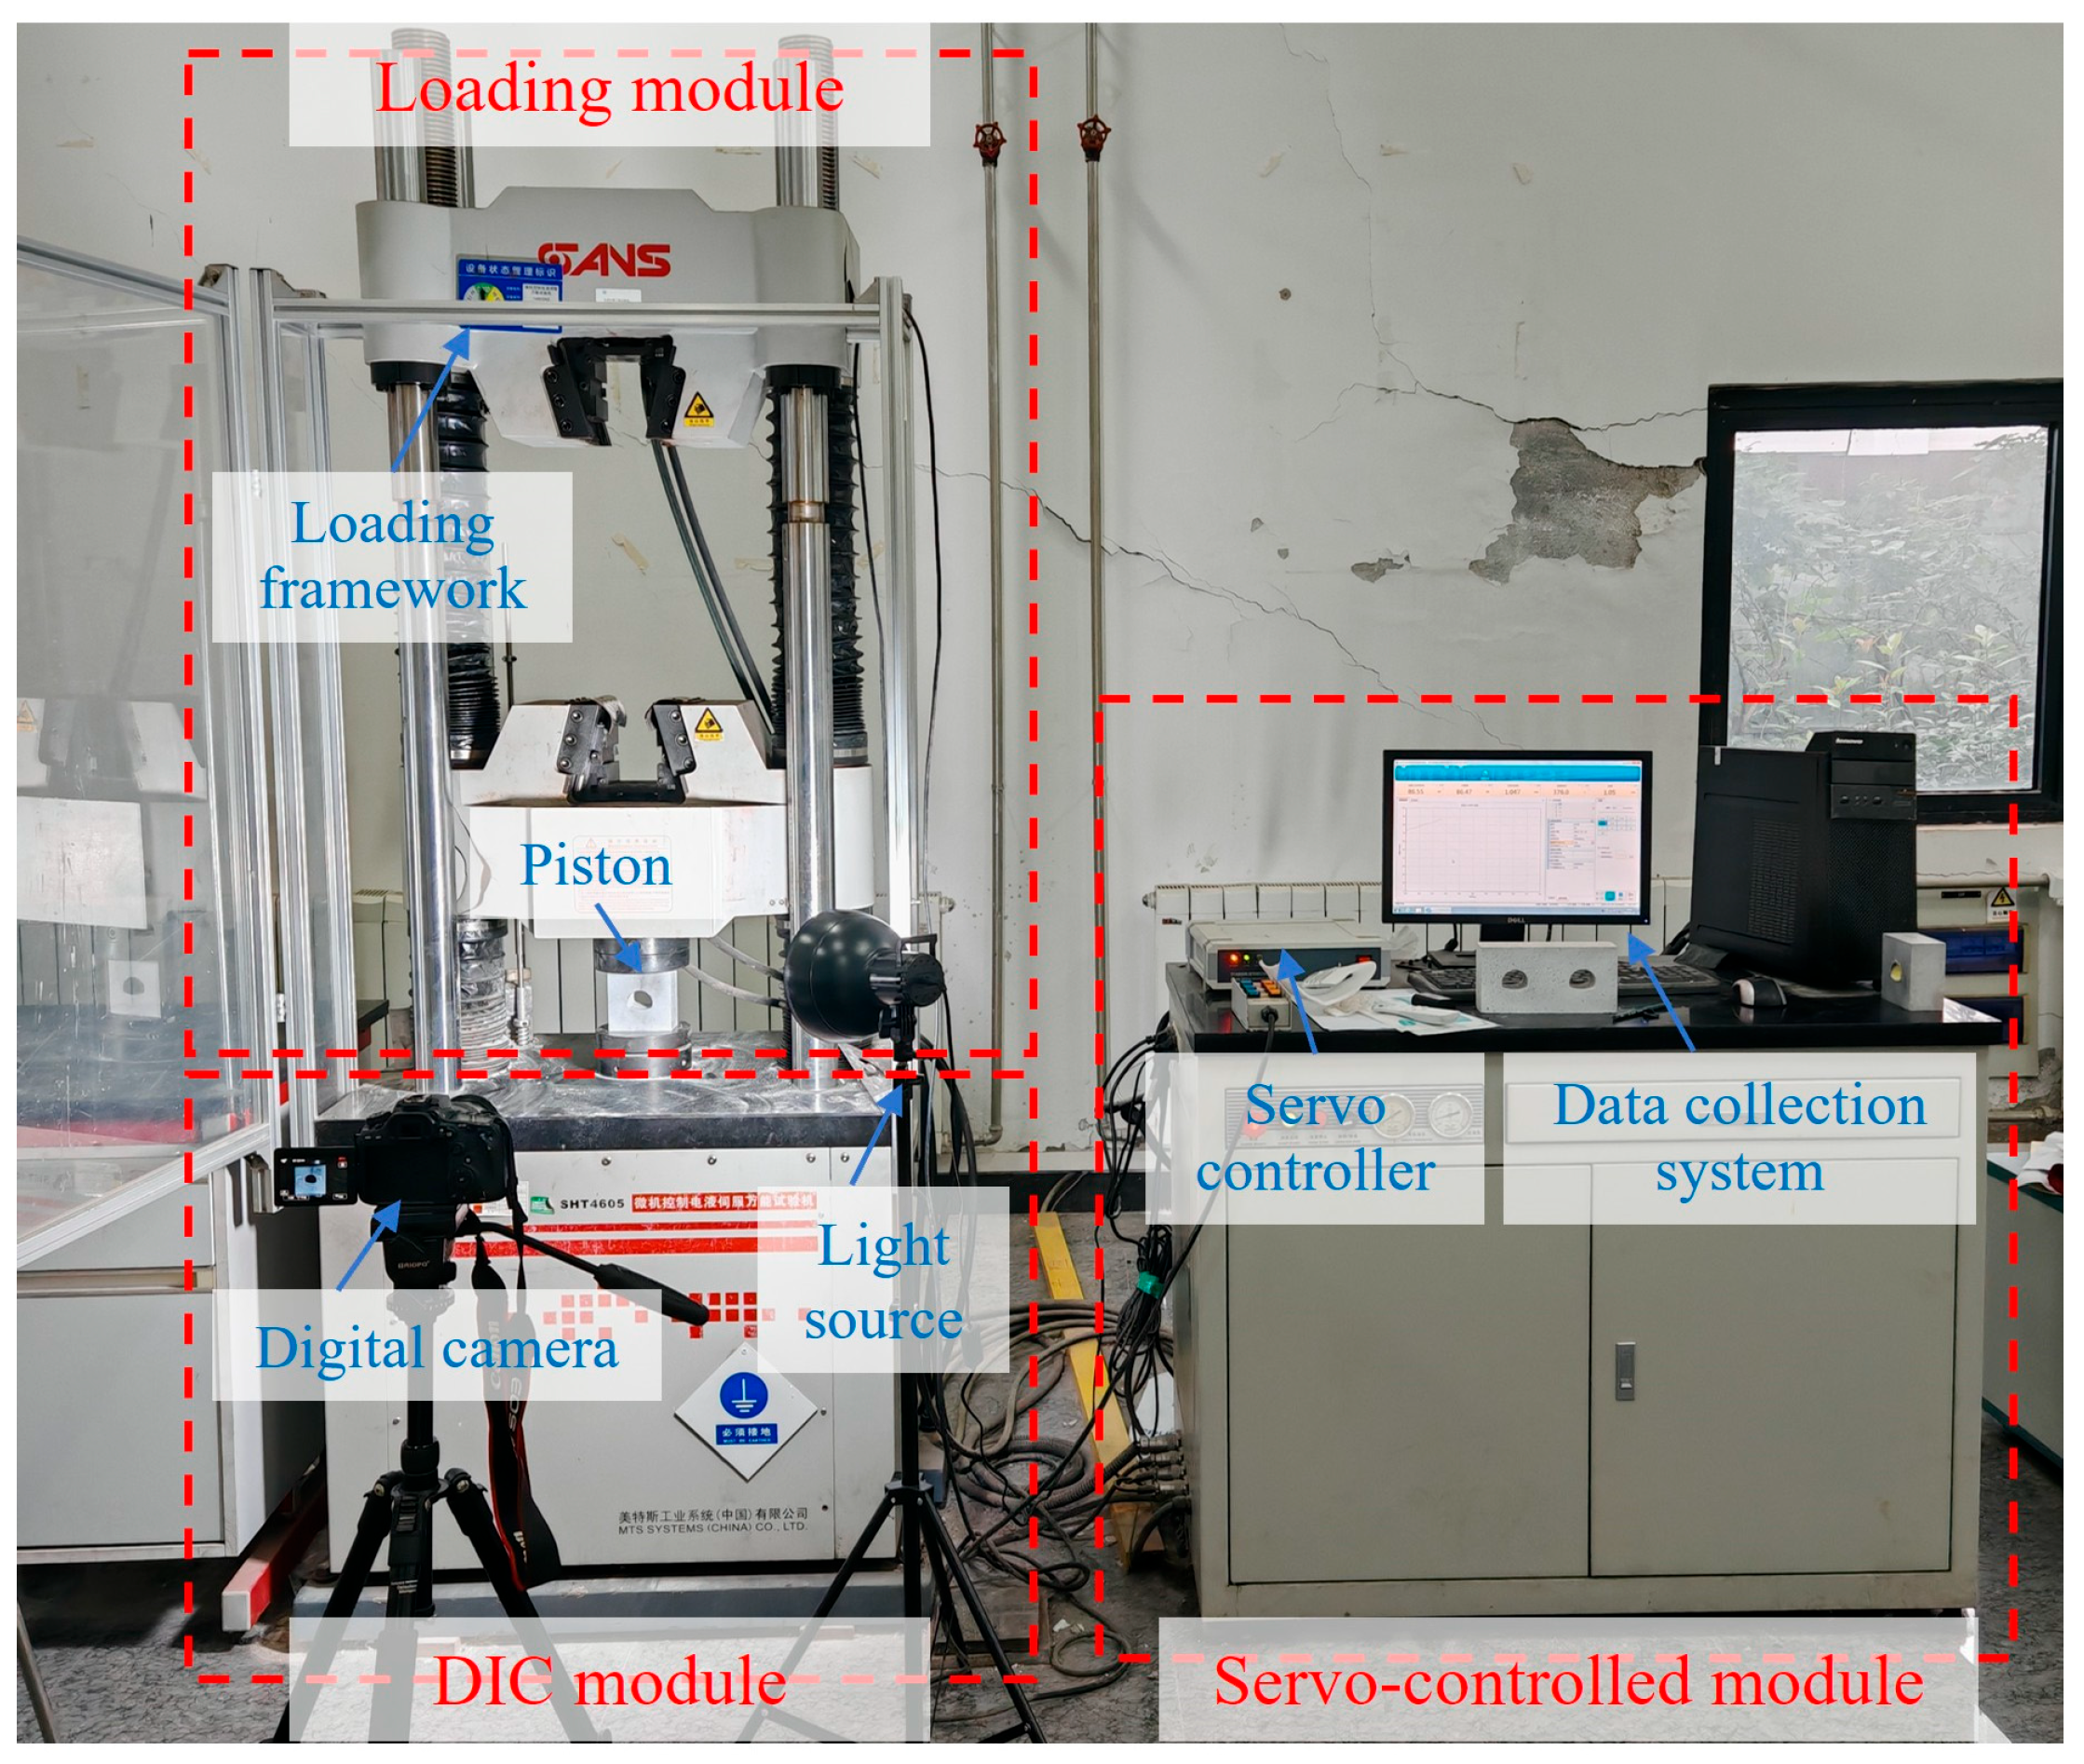
The specimens were tested under monotonic uniaxial compression using a servo-controlled loading system with a maximum axial capacity of 700 kN (Figure 3). The loading platen moved downward at 0.2 mm/min until specimen failure. Before loading, a speckle pattern was applied to the front surface. A digital camera recorded the surface throughout the test, and digital image correlation (DIC) was used to obtain displacement and strain fields from the image sequence. These fields were examined together with the mechanical loading record and the final failure photographs to compare deformation and failure among the lining conditions.
Figure 3.
Apparatus for uniaxial compression tests, which is composed of servo control module, loading module and DIC module.
2.3. Experimental Results
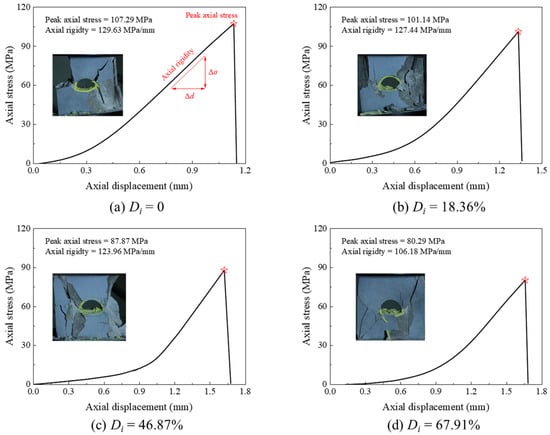
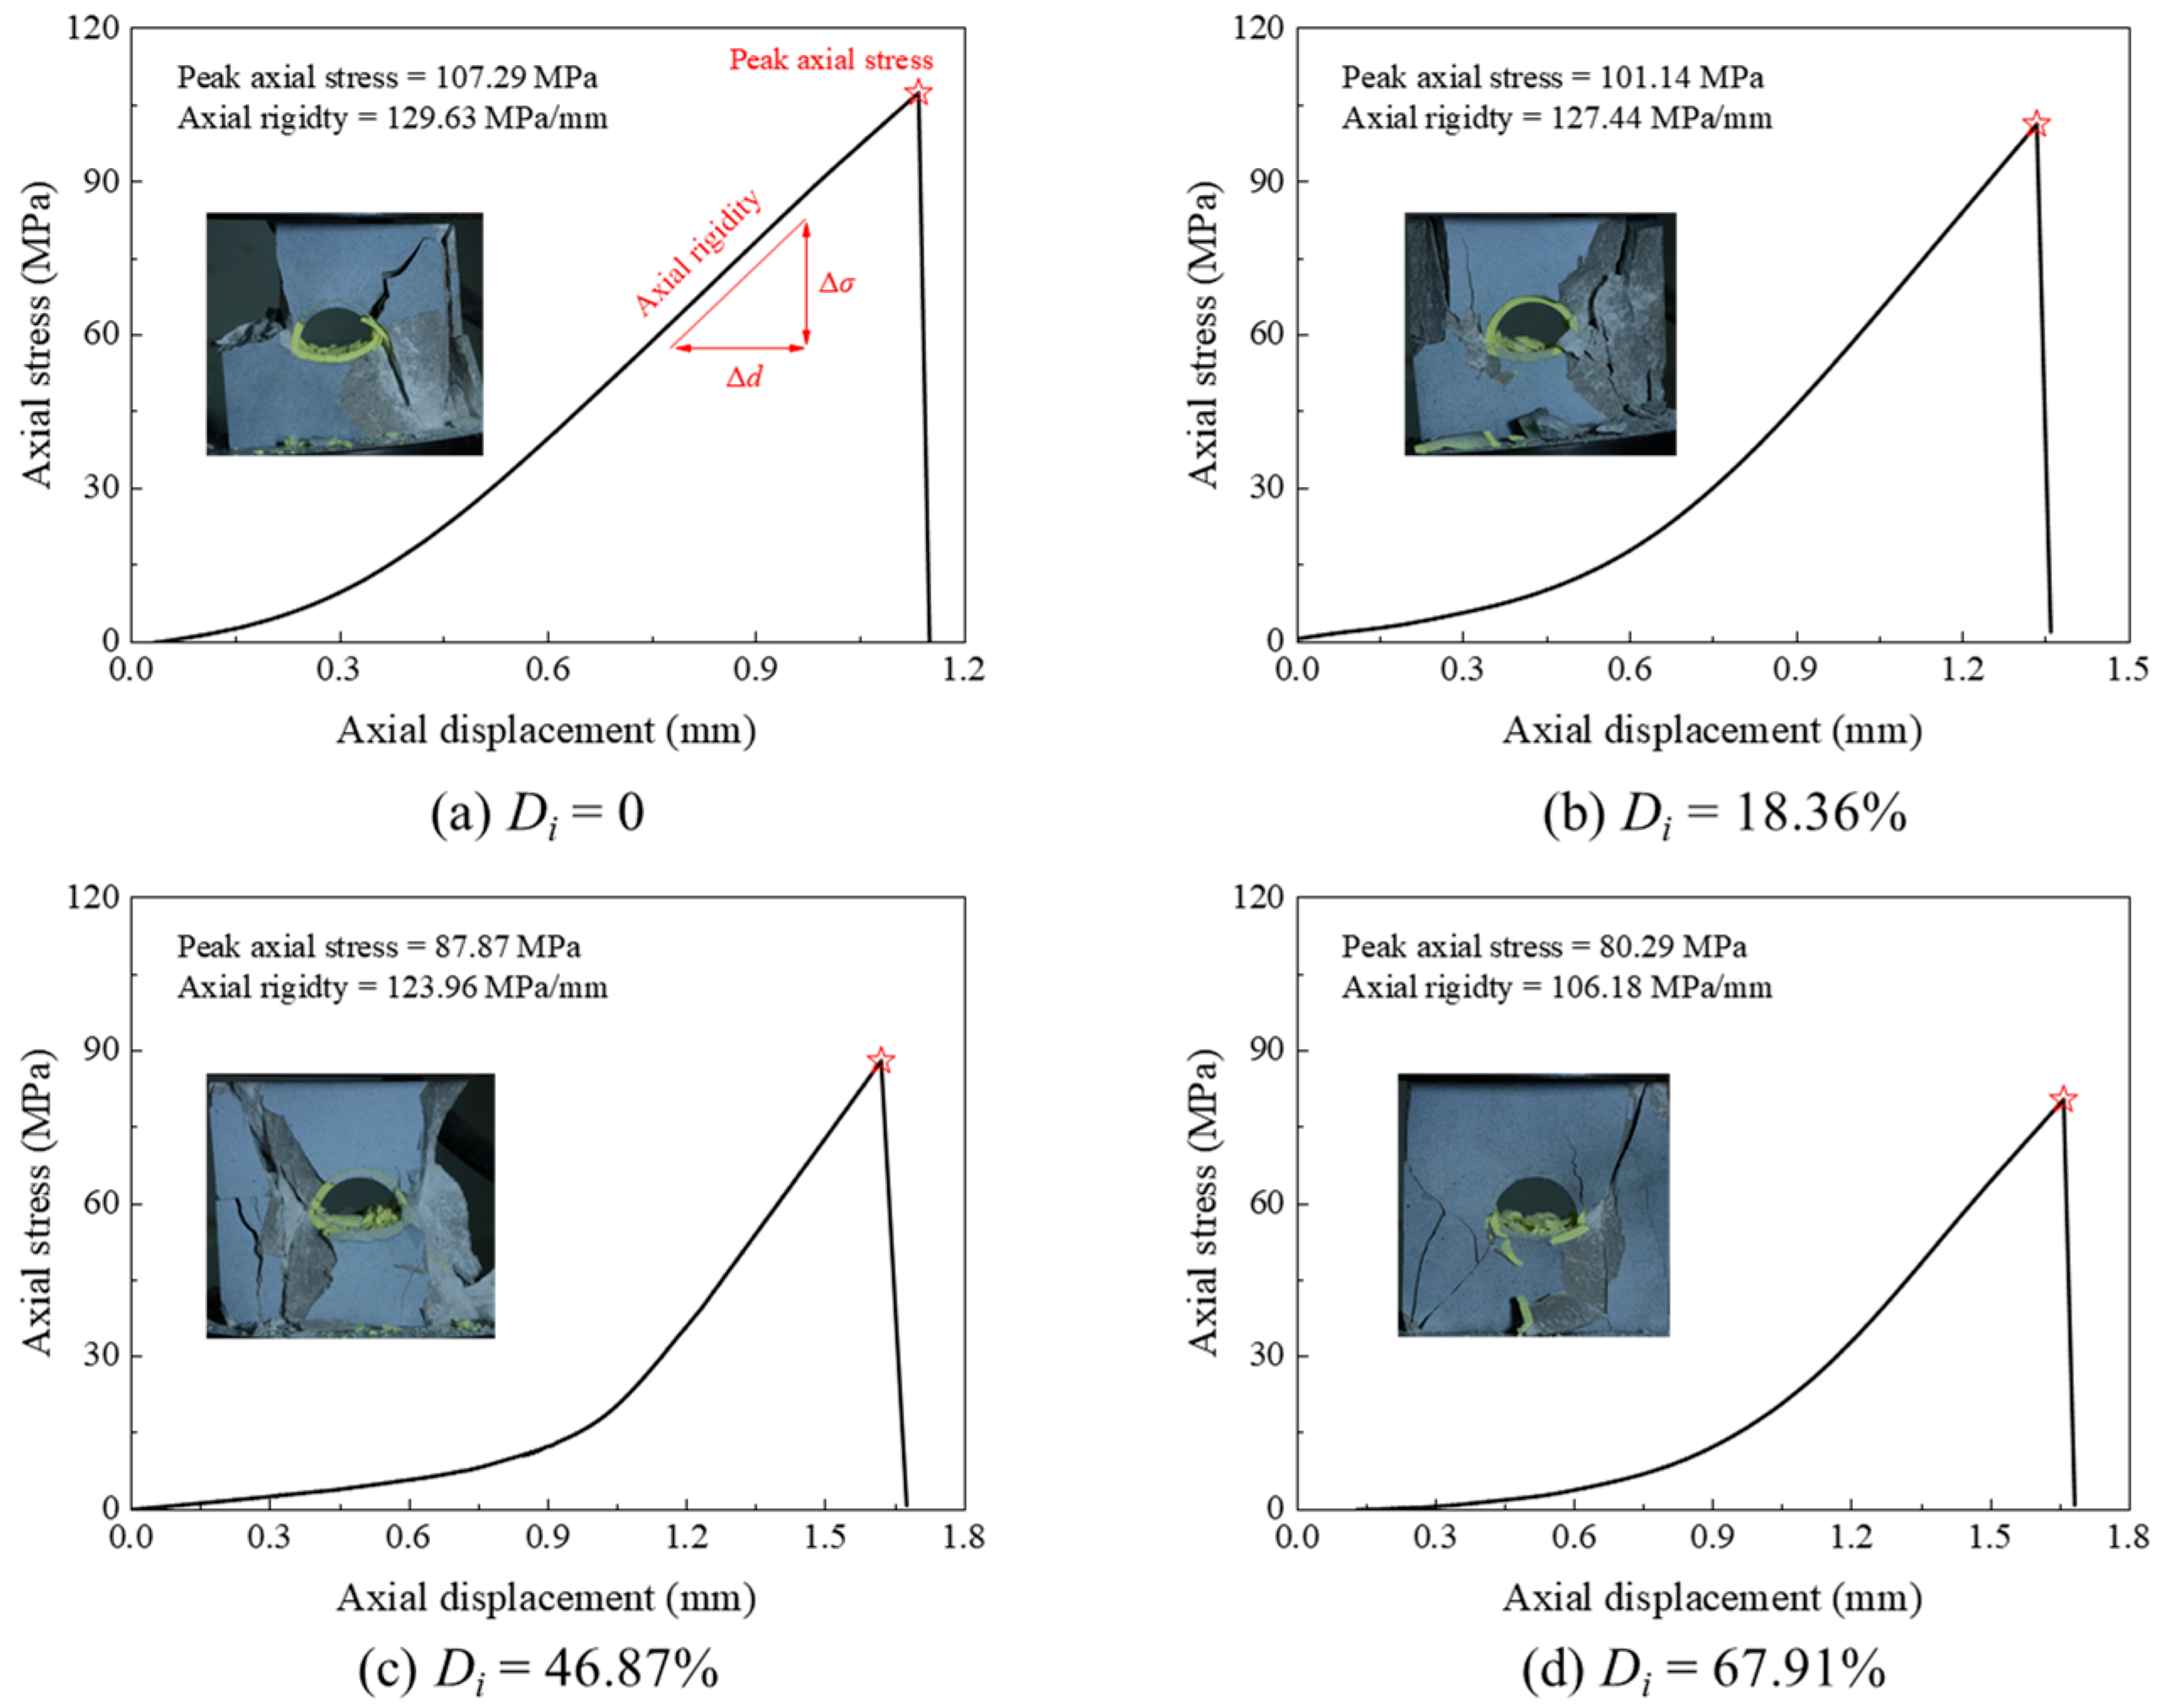
The stress-displacement curves and final failure photographs of samples with different Di under uniaxial compression are presented in Figure 4. For all samples, during the initial loading stage, the axial stress increases gradually. This stage is followed by the linear elastic stage, in which the axial stress increases almost linearly with the axial displacement. Finally, as the axial stress approaches its peak value, the accumulated strain energy in the sample leads to failure, resulting in a loss of load-bearing capacity and a rapid decrease in axial stress to zero.
Figure 4.
Evolution curve of axial stress with axial displacement and the failure mode of samples with different initial deterioration degrees of lining structure in uniaxial compression tests. Red stars mark the peak axial stresses.
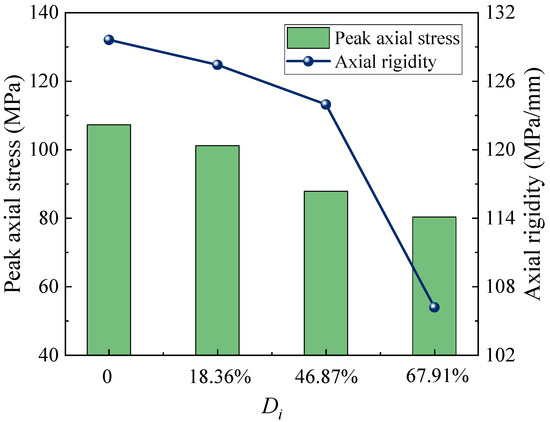
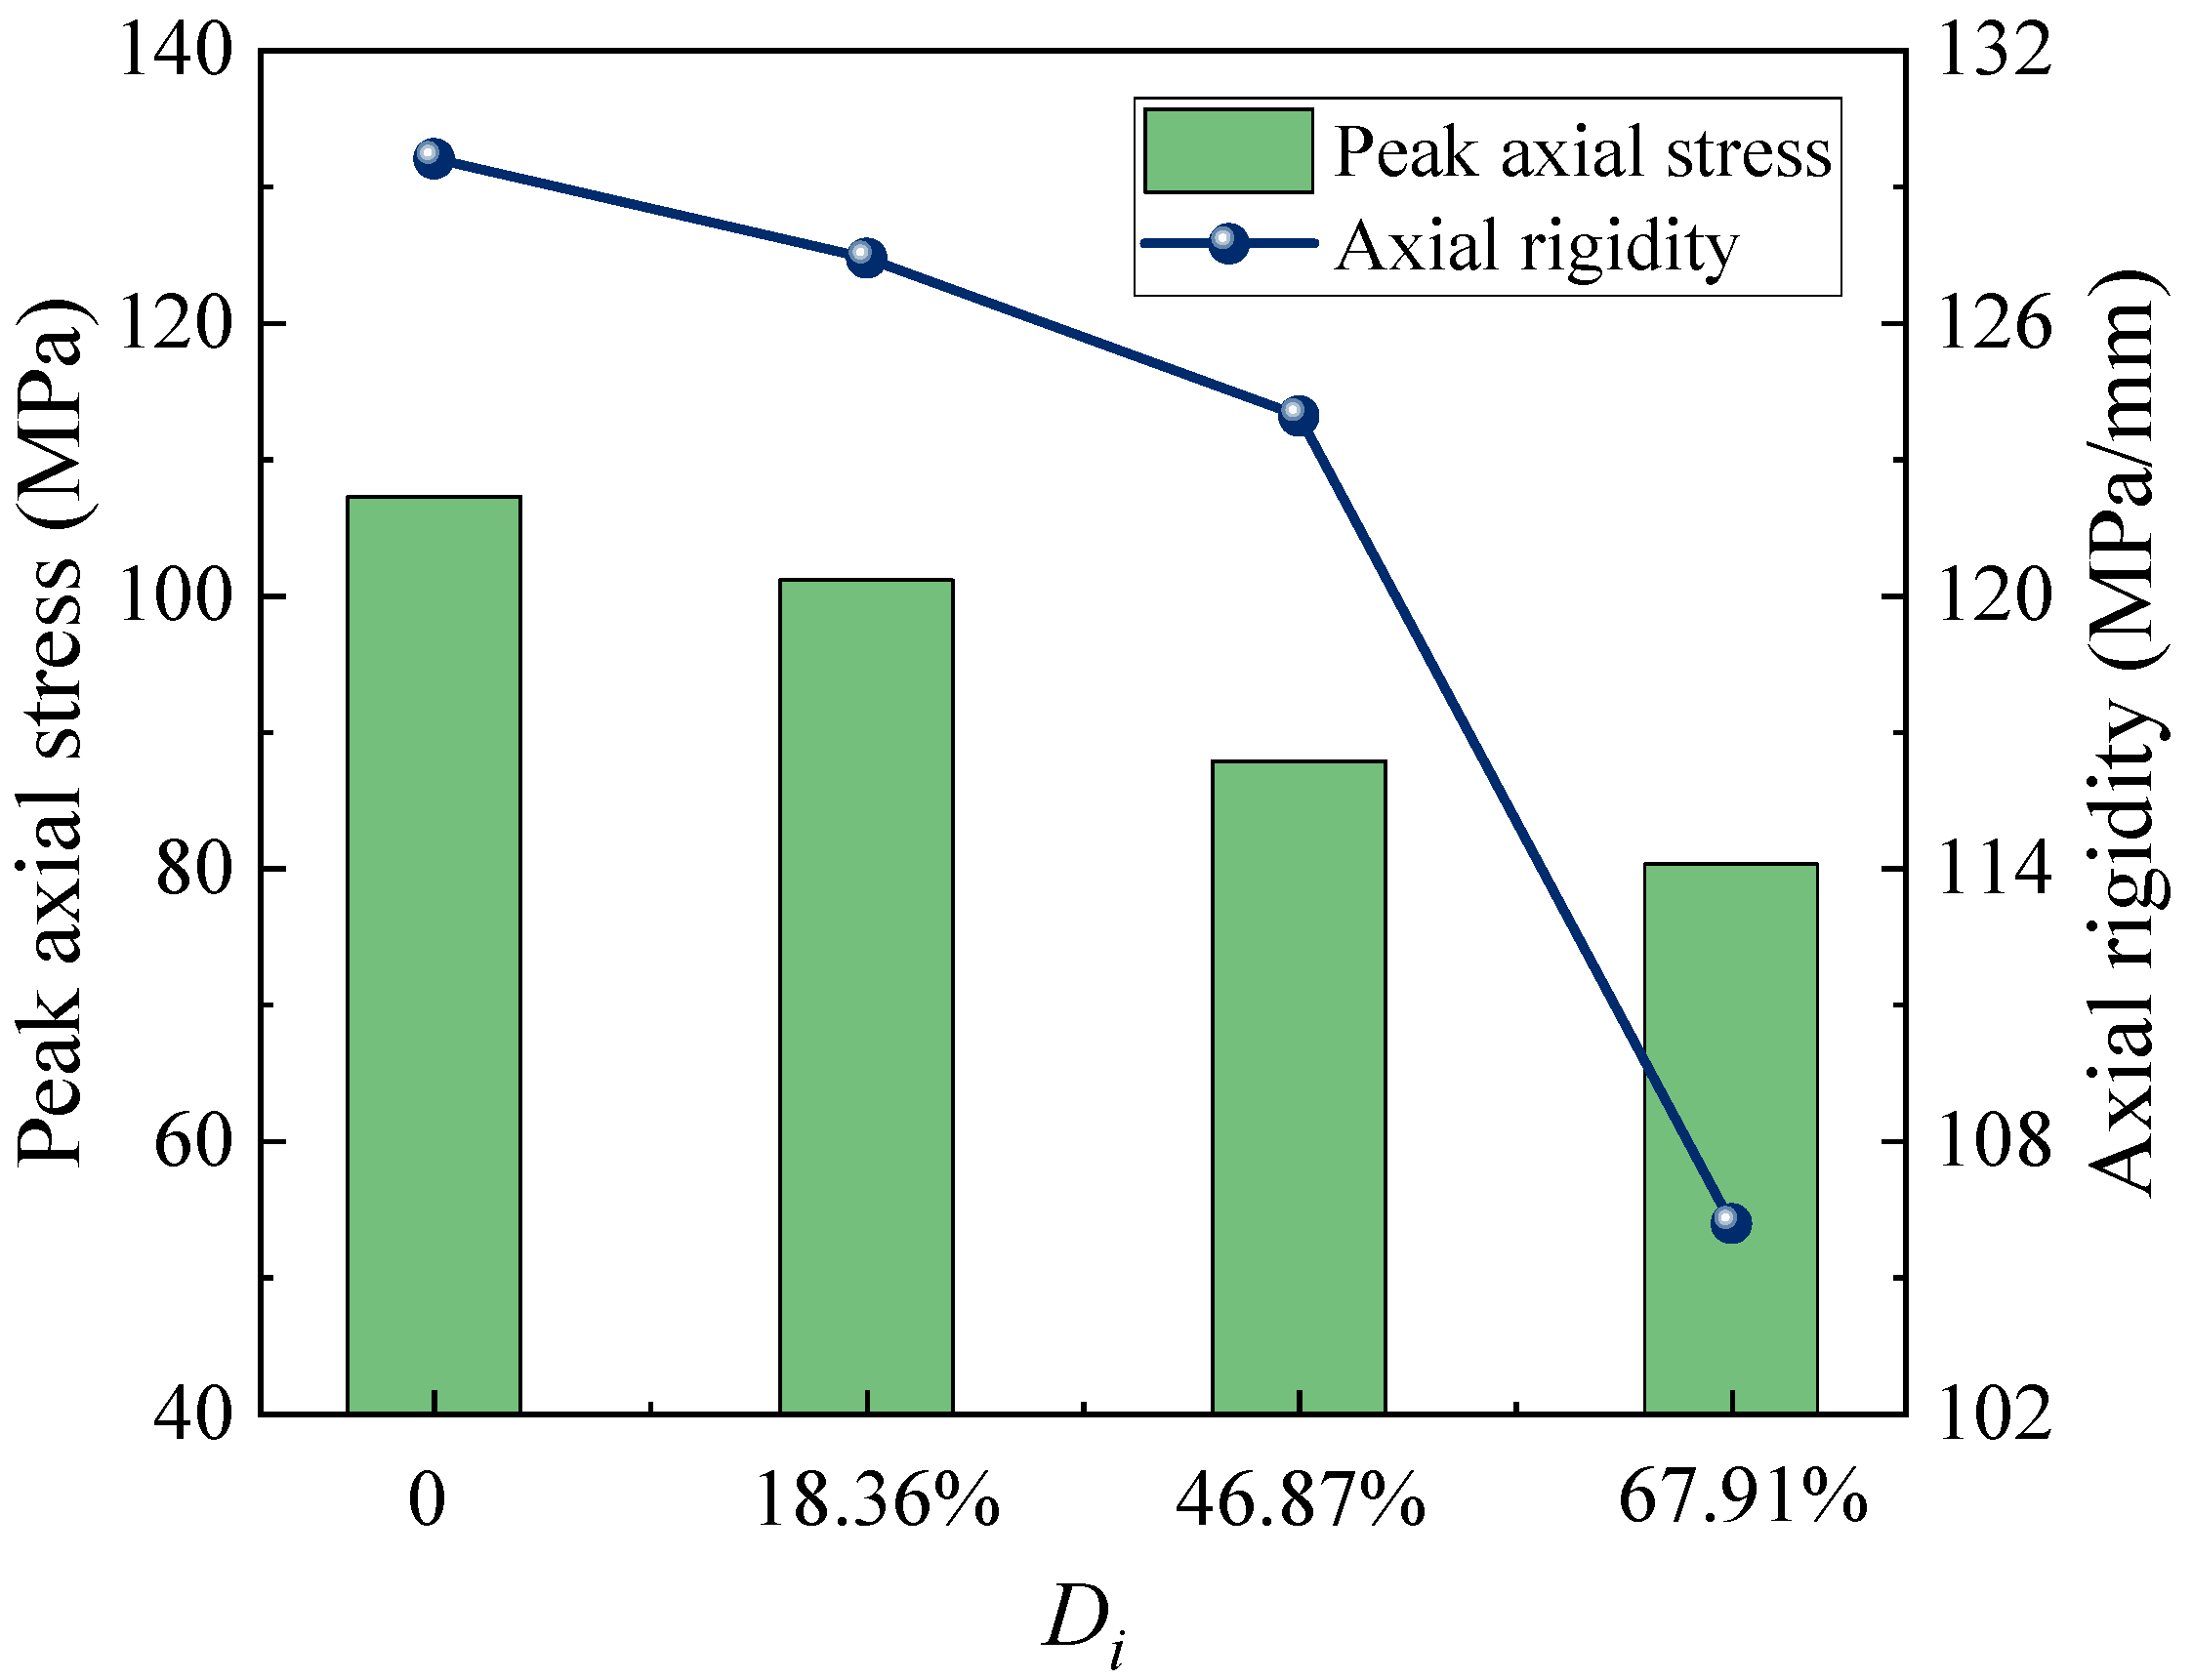
Figure 5 shows the peak axial stress and axial stiffness of the composite specimens. Axial stiffness is the increase in axial stress divided by the corresponding axial displacement during the linear elastic stage. Across the tested conditions, peak axial stress decreased from 107.29 to 80.29 MPa as Di increased from 0 to 67.91%, a reduction of 25.2%; axial stiffness decreased from 129.63 to 106.18 MPa/mm, a reduction of 18.1%. These marked changes show the influence of lining properties on the load-bearing response of the tested composite specimens. The results are interpreted descriptively for this specimen series.
Figure 5.
Evolution curves of peak axial stress and axial stiffness with initial deterioration degree of lining structure.
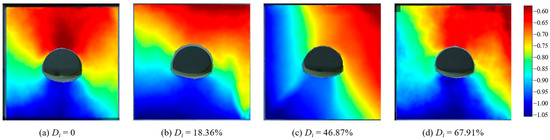
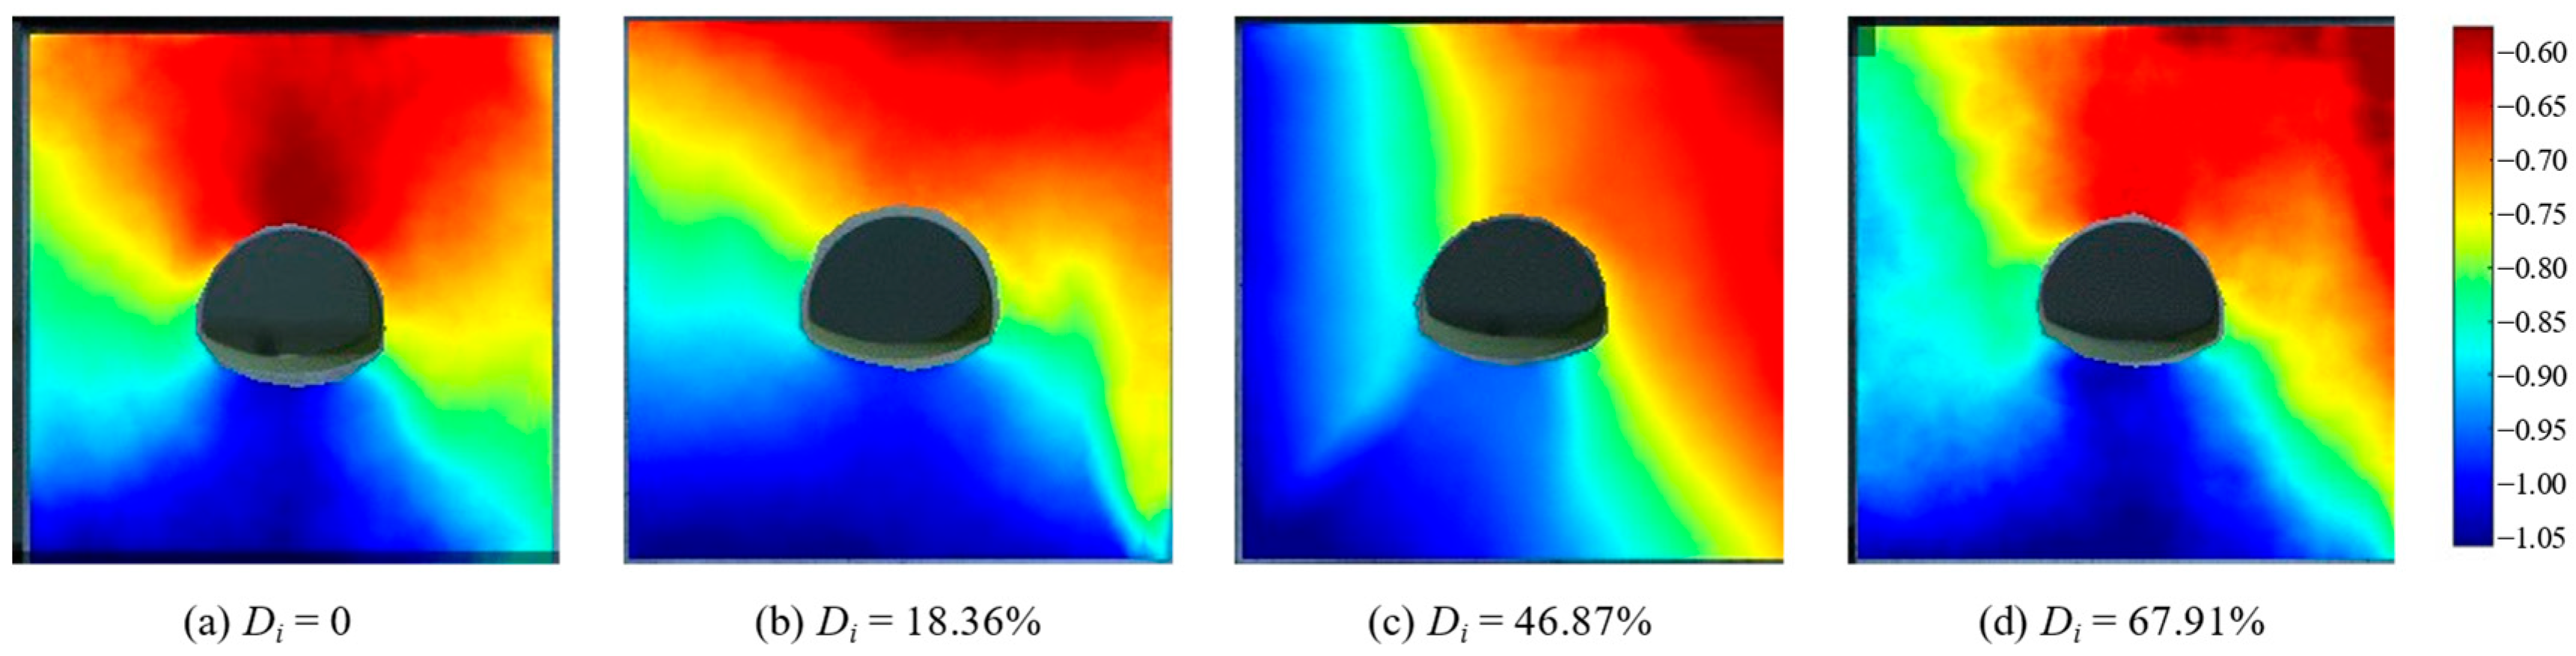
Figure 6 shows the vertical strain contour maps of specimens with different Di obtained through DIC analysis during uniaxial compression tests. As the axial displacement increases, the strain distribution within the specimens continuously adjusts. The high strain regions of the samples gradually concentrate and shift toward the arch foot of the tunnel. The failure of the specimens initiates from the arch shoulder and arch waist areas, with cracks gradually propagating and eventually connecting on both sides of samples. Before fail, the contour maps of the vertical strain distribution exhibit a typical X-shape, which is consistent with the final failure modes of the samples.
Figure 6.
Contour maps of the vertical strain for the specimens with different Di based on DIC calculation.
3. Numerical Simulations
3.1. Model Setup and Laboratory Comparison
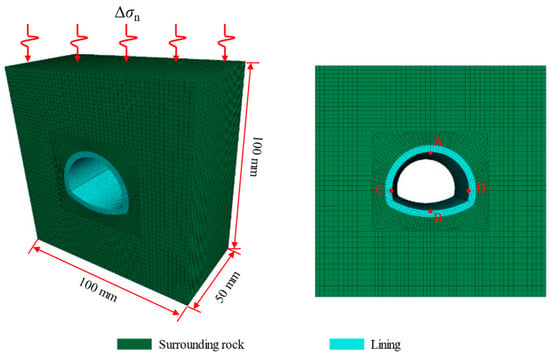
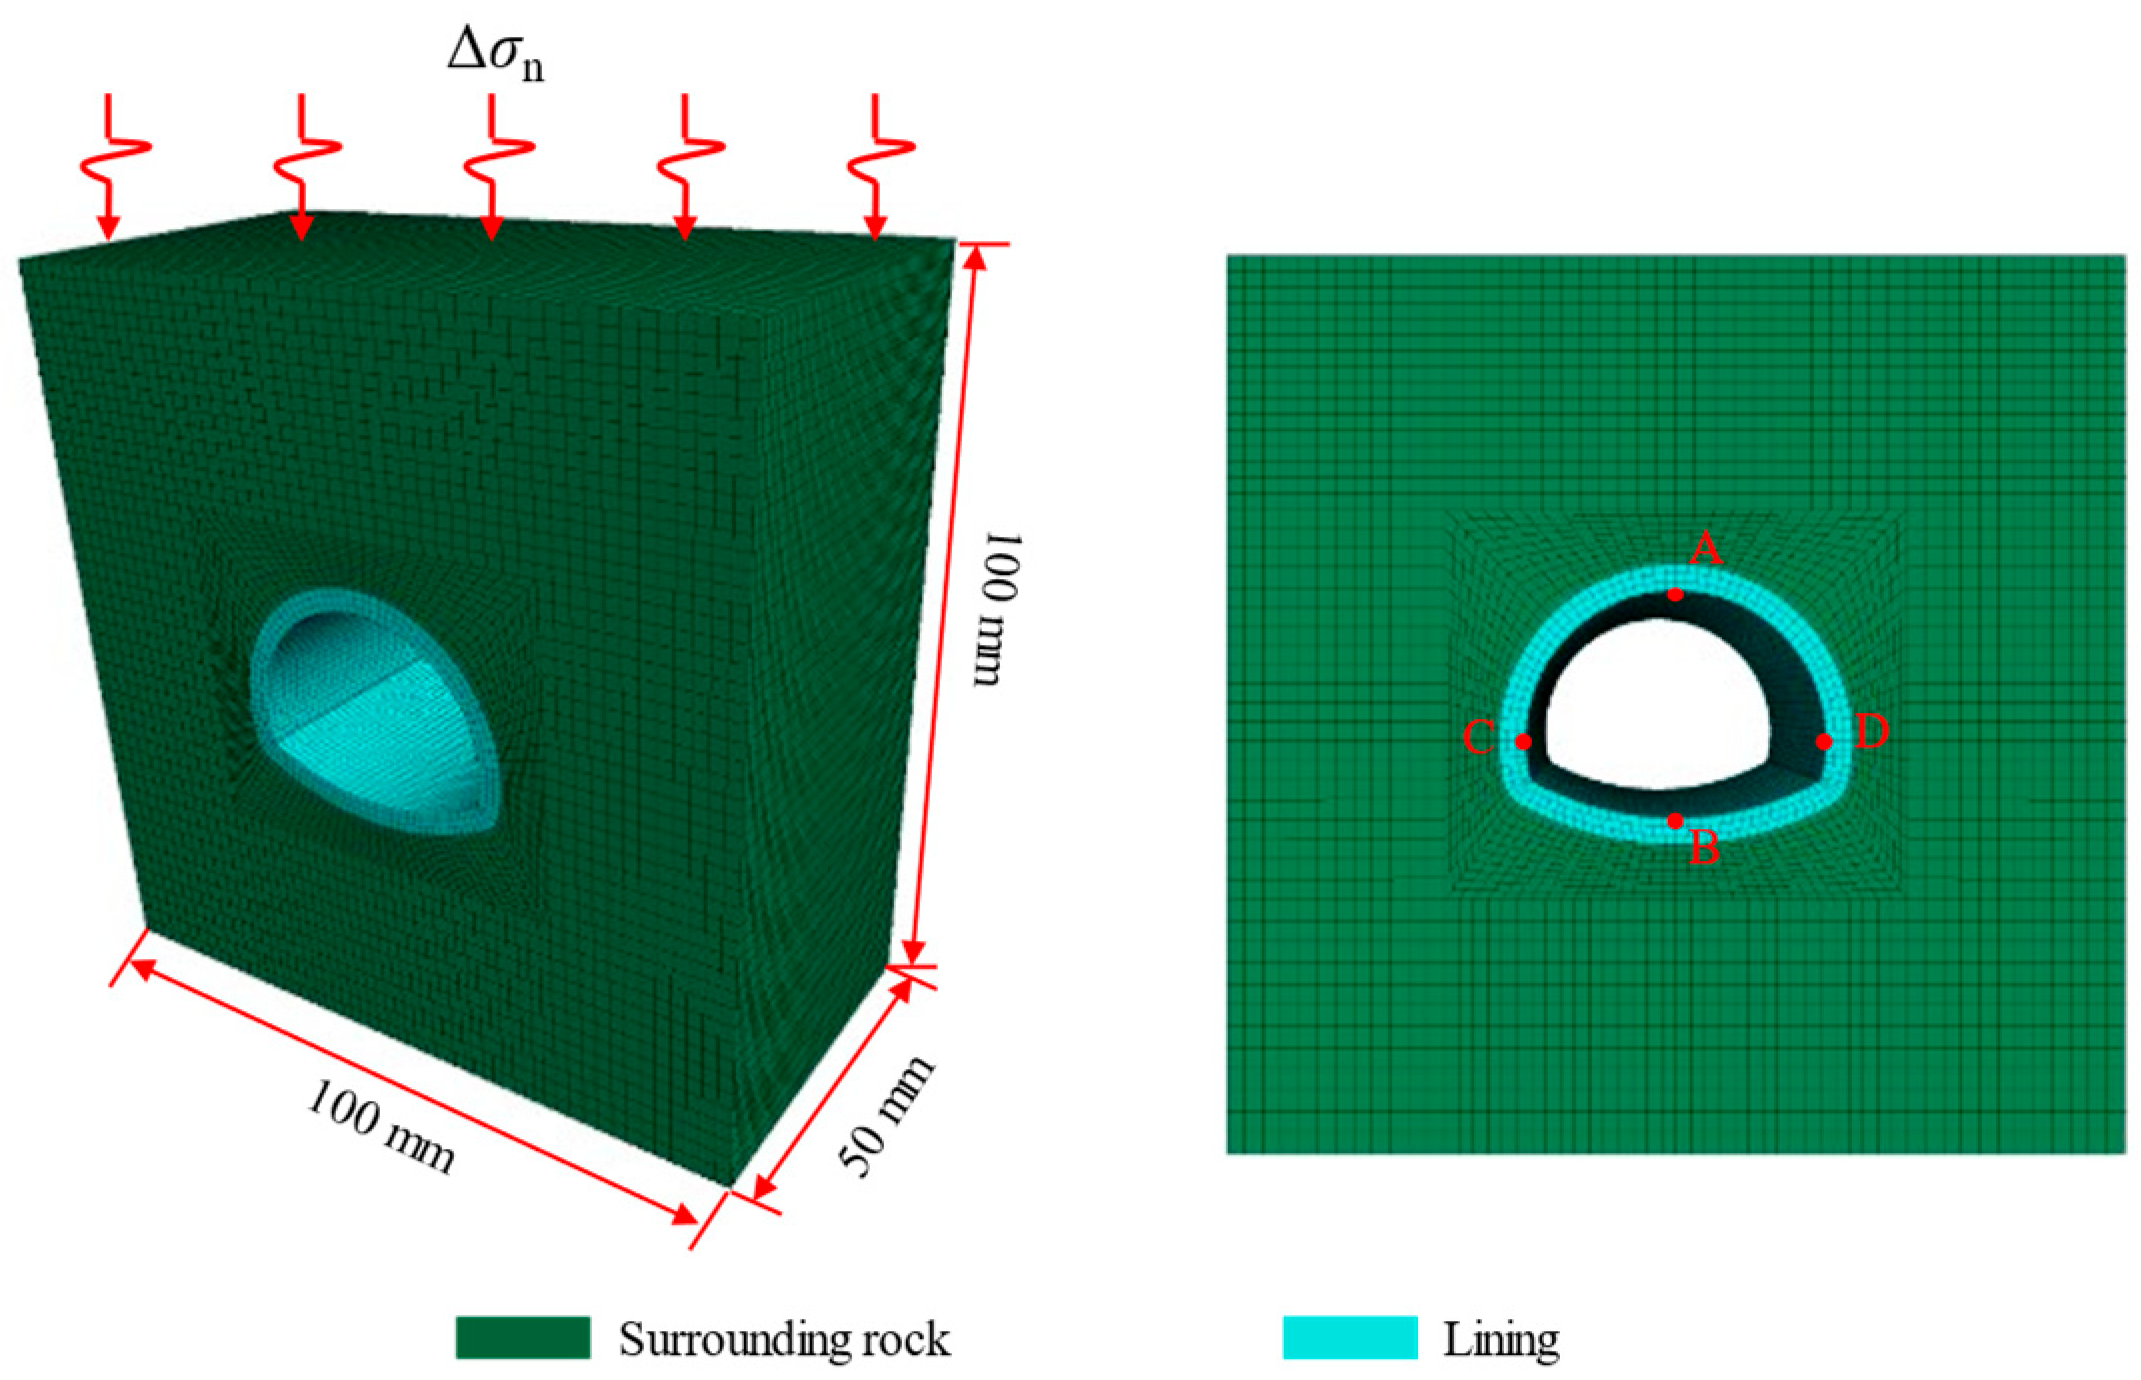
A FLAC3D model with the same nominal dimensions as the laboratory specimen was constructed to compare the monotonic compression response and extend the analysis to prescribed cyclic loading (Figure 7). The surrounding limestone was represented as a homogeneous continuum without explicit joints or prescribed fractures. Groundwater flow and hydro-mechanical coupling were not represented. The lining and surrounding-rock formed separate continuum material domains using the Mohr–Coulomb criterion [32]. No separate interface elements, interface constitutive law or normal/shear contact stiffness were introduced. The reported responses describe deformation and yielding of the continuum domains; independent interface opening, slip and debonding are not quantified. The mesh consisted predominantly of hexahedral elements, with local refinement in the lining and along the lining–rock boundary. The experimental comparison used the lining condition Di = 18.36%. The reported material properties for that comparison were UCS = 38.41 MPa and E = 3.85 GPa for the lining, and UCS = 119 MPa and E = 3.60 GPa for the limestone. These correspond to lining-to-rock strength and modulus ratios of approximately 0.323 and 1.07 within the model.
Figure 7.
Numerical model and mesh discretization for incremental–static cyclic loading of the lining–rock specimen. Green and cyan denote the surrounding rock and lining, respectively. Points A and B are located at the vault and invert, and C and D at the left and right sidewalls, respectively.
With compression taken as negative and principal stresses ordered σ1 ≤ σ2 ≤ σ3, the Mohr–Coulomb shear and tensile yield functions are defined by the following expressions. The yield surfaces are reached at fs = 0 or ft = 0. Here c, φ and σt are the current cohesion, friction angle and tensile strength; the elastic domain lies on the non-positive side of both functions.
ft = σ3 − σt
For the cyclic calculations, a custom FISH update varied strength parameters between initial values and residual targets. The scalar κ accumulated absolute changes in q/(3G) in zones with current or previous yielding flags, where q = √(3J2), J2 is the second deviatoric-stress invariant and G is the shear modulus. For each zone, the residual targets were cr = 0.60c0, tr = 0.60t0, φr = max(15°, φ0 − 2°) and ψr = 0°, where subscript 0 denotes the initial value. The parameters varied linearly towards these targets as κ increased to 0.01 for the lining and 0.02 for the surrounding material and remained at the targets thereafter. K and G remained constant.
Table 1 gives the initial constitutive inputs. Table 2 gives the thresholds and residual targets for subsequent strength updating. The indices Di and Dir reduce only the initial cohesion of the lining and surrounding rock, respectively, and are expressed as fractions. Their case-specific values in Table 3, together with Table 1, define the inputs for all 12 cases. Initial K, G, φ0, t0 and ψ0 remain the same across cases within each material. K and G denote bulk and shear moduli; c, φ, t and ψ denote cohesion, friction angle, tensile strength and dilation angle. Subscript 0 denotes an initial value. The tensile strength t is written as σt in Equation (3).
Table 1.
Initial constitutive parameters for cyclic calculations. Di and Dir are the prescribed initial deterioration indices expressed as fractions.
Table 2.
Strength-update thresholds and residual targets expressed relative to the initial material parameters.
Table 3.
Summary of simulated conditions and results. The plastic-zone fractions use the zone-count definition in Section 3.1.
Initial material deterioration and loading-induced strength evolution were treated separately. Di and Dir identify the prescribed initial deterioration levels of the lining and surrounding material in the case series (Table 3). They characterize equivalent initial material conditions, separately from the loading-induced strength update. In a continuum idealization, reduced effective strength can represent the combined macroscopic consequences of material softening and distributed microcracking, without explicitly prescribing individual fractures. The connection between progressive rock damage and evolving strength provides a mechanical basis for this interpretation [33]. No crack-density-to-strength relationship is inferred, and no discrete joint network is generated. The parameterization examines reduced load-bearing capacity in a fixed geometry; fracture orientation, persistence, opening and block sliding require an explicit discontinuity treatment.
The continuum parameters describe the tested material representation. Extension to a jointed field rock mass requires geological characterization and rock-mass parameter selection, such as the rock-quality-based approach illustrated in [34]. Equivalent continuum properties may be appropriate for distributed degradation, whereas dominant discontinuities require their geometry and mechanical response to be represented explicitly. Constitutive treatment can also affect local stress magnitudes and distributions [35]; the yield criterion and strength-update rule used here are therefore specified separately from the material inputs.
The base was restrained in the loading direction, and the lateral faces were free, corresponding to the unconfined laboratory configuration. The monotonic comparison applied downward motion at the top at a nominal prescribed rate of 0.2 mm/min. The finite boundaries influence this specimen configuration and are retained in the numerical comparison. Holding the nominal geometry and boundary conditions fixed provides a common basis for comparing prescribed cyclic loading and initial material conditions; it does not remove boundary effects or represent a remote field boundary. Monitored quantities included axial stress and strain, vertical and horizontal convergence, and yielding-zone fractions for the lining and surrounding material. Vertical convergence was defined as the reduction in the distance between the vault (A) and invert (B), and horizontal convergence as the increase in the distance between the sidewalls (C and D).
Zone volumes vary within the lining and surrounding-rock material groups. For each group, the reported plastic-zone fraction is the number of flagged zones divided by the total number of zones in that group. The lining indicator retains zones once yielding has been detected, whereas the surrounding-rock indicator uses current or previous yielding states. These are yielded-zone-count fractions without volume weighting. They are used as comparative indicators for the adopted discretization, rather than physical yielded-volume fractions.
Twelve cases compared cyclic stress amplitudes and initial material conditions (Table 3). In the reference loading case, the top normal stress was σn(k) = −[30 + 5 sin(2πk/20)] MPa, where k is the load-increment index. This gives a mean compressive stress of 30 MPa, a half-range amplitude of 5 MPa and 20 increments per cycle. At each prescribed load increment, one mechanical step was followed by a static solve to a target maximum force ratio of 10−2. The FISH strength update was called once after the solve returned, and the updated properties were used in the next load increment; parameter updating was not performed within the iterative mechanical solution. The mean compressive stress was 30 MPa for Cases 1–8 and 20 MPa for Cases 9–12. The amplitude series considered 5, 10, 15 and 20 MPa. The sinusoidal history is a parameterized analogy for repeated stress changes during successive construction disturbances; it is not a measured reconstruction or blasting history. Simplified cyclic loading is also used to investigate cumulative lining response experimentally [16,18,19]. The calculations represented construction-stage repeated stress redistribution through a finite sequence of up to 40 cycles, allowing the first-cycle response to be compared with subsequent accumulation under the same prescribed history. This mechanism-level representation has no assigned physical frequency or direct correspondence to a number of blasts, construction stages or service duration. For the 20 MPa case, the reported calculation could no longer attain static equilibrium at N = 21, which is used as its terminal state; the other cases are compared at N = 40.
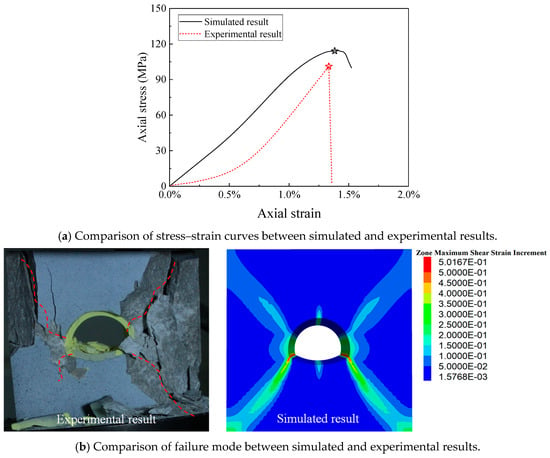
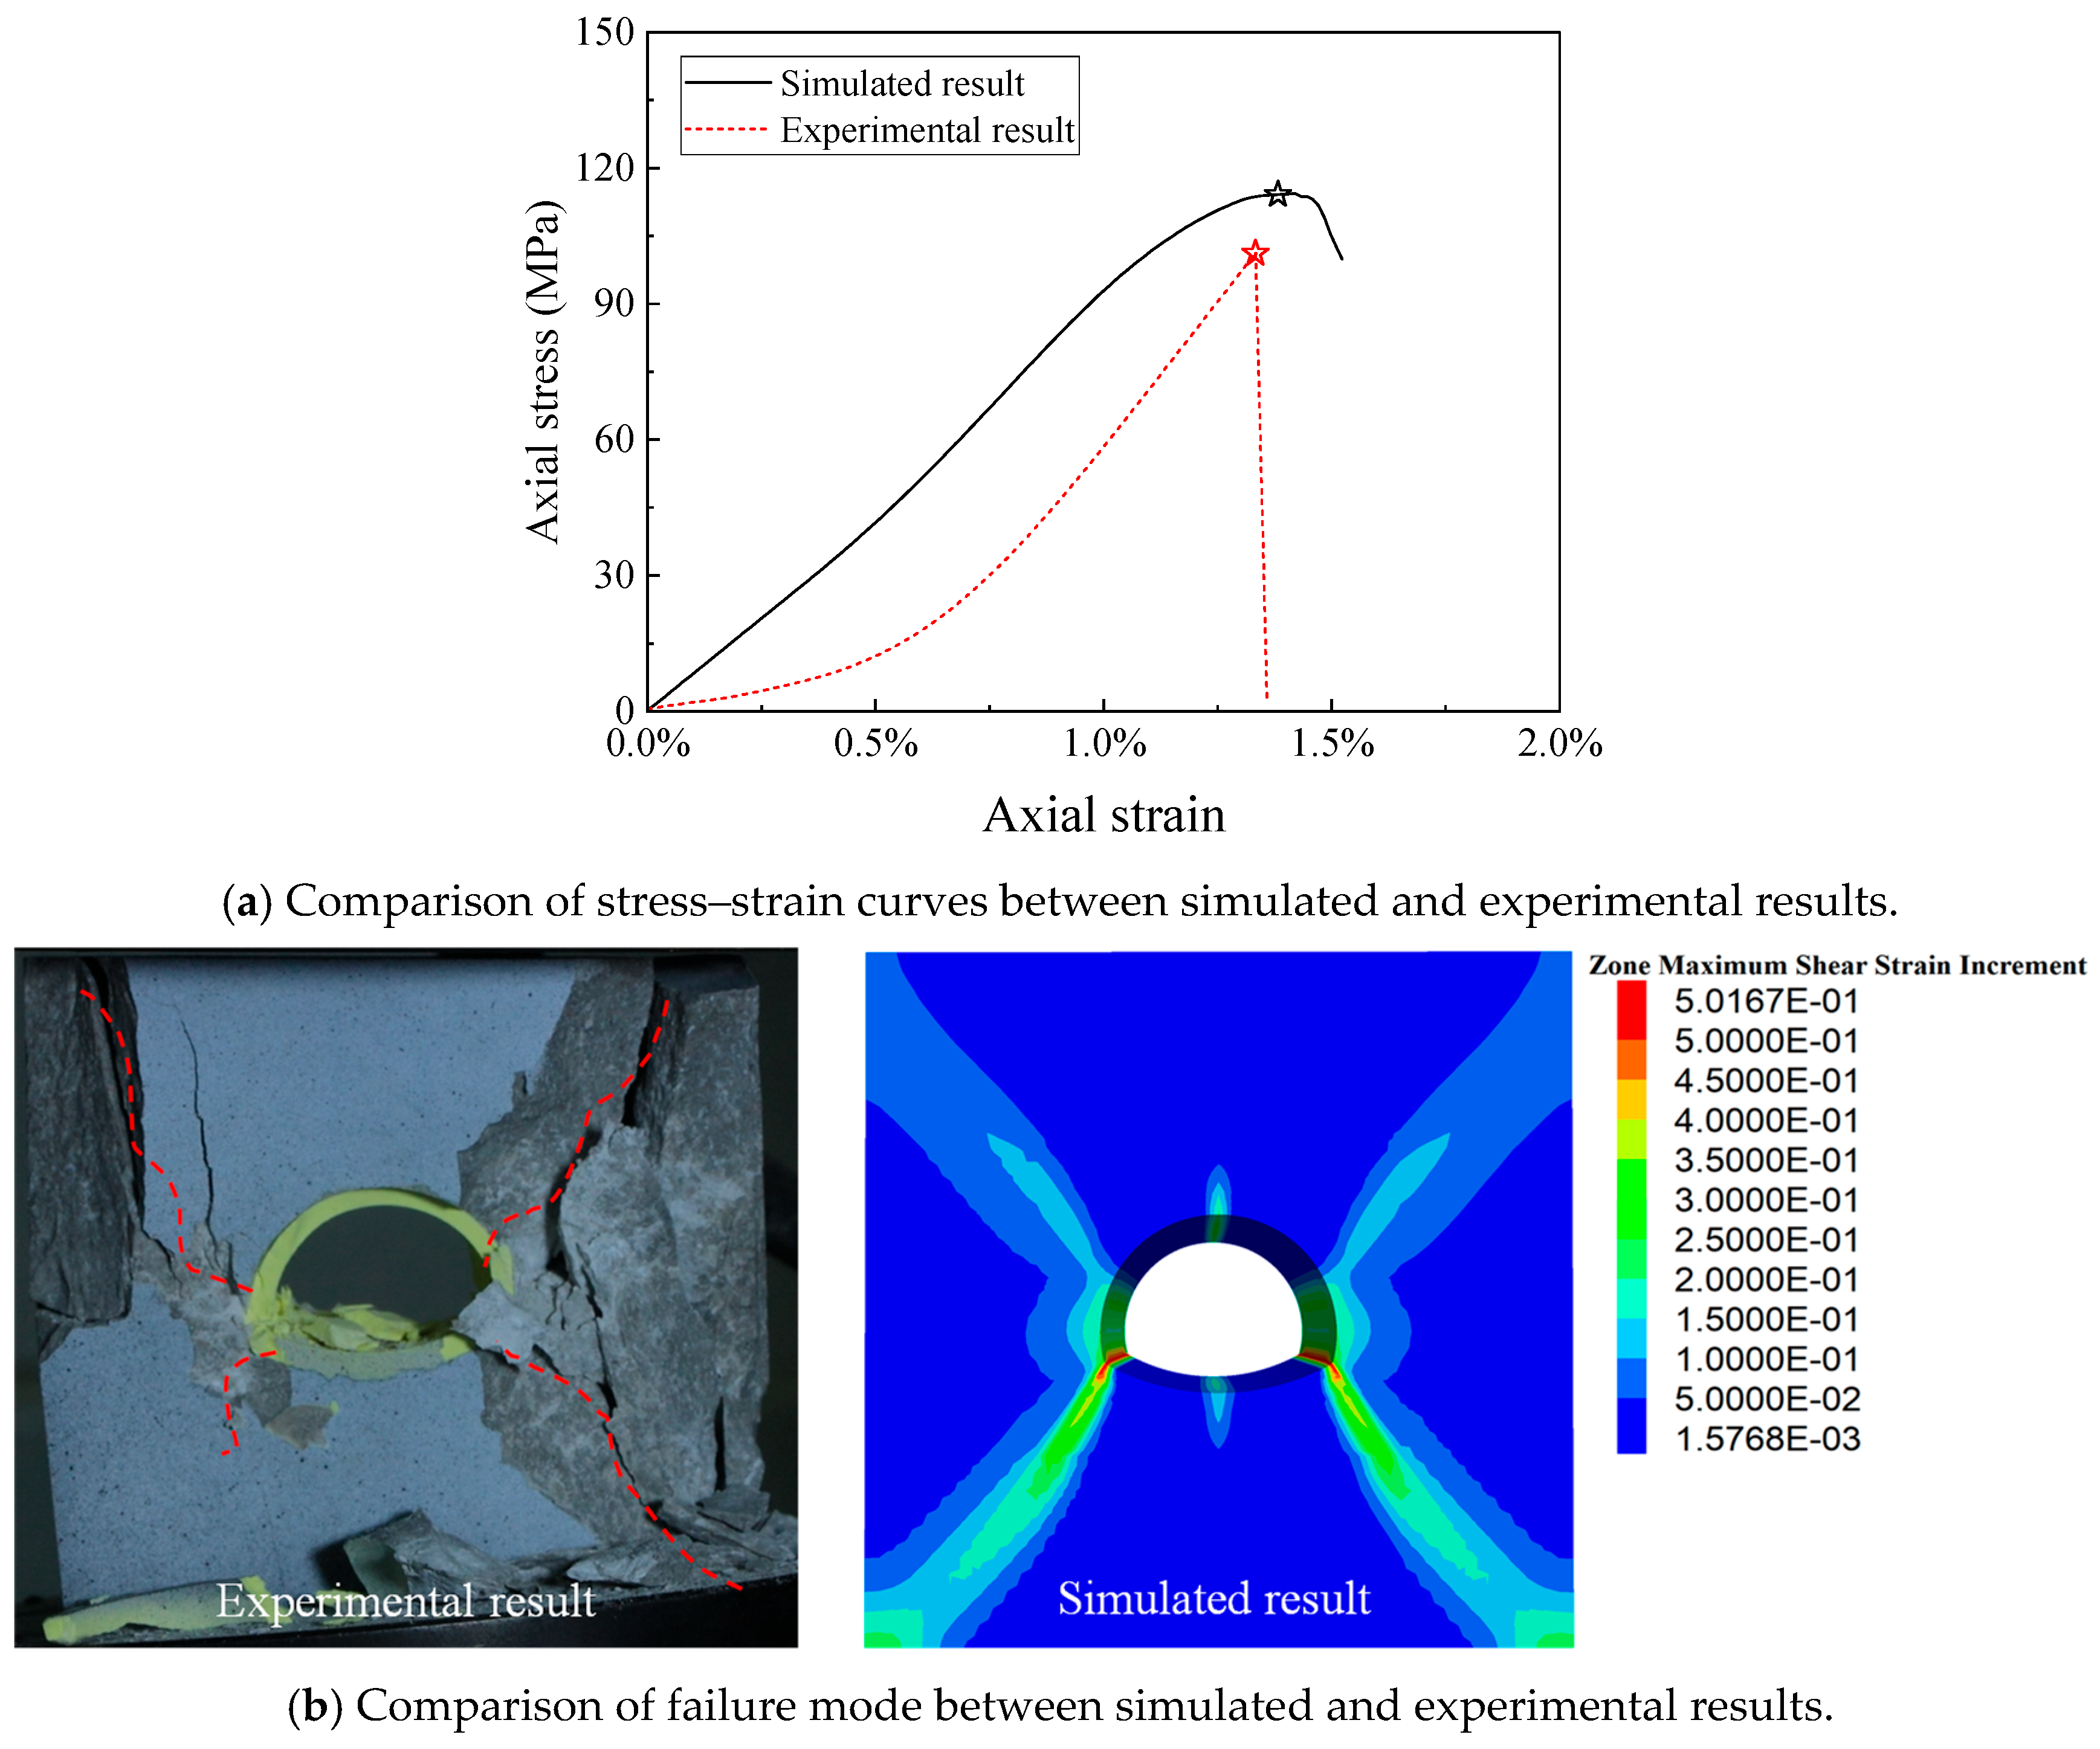
Figure 8a compares experimental and numerical stress–strain curves for monotonic compression of the same nominal specimen geometry with free lateral faces. The numerical curve rises more steeply at the initial stage because the model does not represent the initial compaction observed in the experiment. The curves show similar peak stress and strain at peak, and the experimental failure pattern and numerical localization pattern both have a broad X-shaped distribution after the peak (Figure 8b). This provides a laboratory comparison of the global response and broad localization pattern. The cyclic calculations then examine relative evolution under prescribed repeated loading within the same specimen-scale framework. As in related paired physical–numerical studies of lined openings [31], the comparison supports investigation of mechanisms within the tested configuration; cyclic accumulation and field-scale response require corresponding loading and boundary-condition evidence. This monotonic comparison does not validate cyclic hysteresis, residual-strain accumulation or strength evolution under repeated loading. The cyclic results are interpreted as numerical predictions for the prescribed loading paths.
Figure 8.
Comparison of (a) stress–strain response and (b) experimental failure and numerical localization patterns under monotonic uniaxial compression. Stars in panel (a) mark the peak axial stresses; red dashed lines in panel (b) trace the observed cracks.
3.2. Lining Response Under Incremental-Static Cyclic Loading
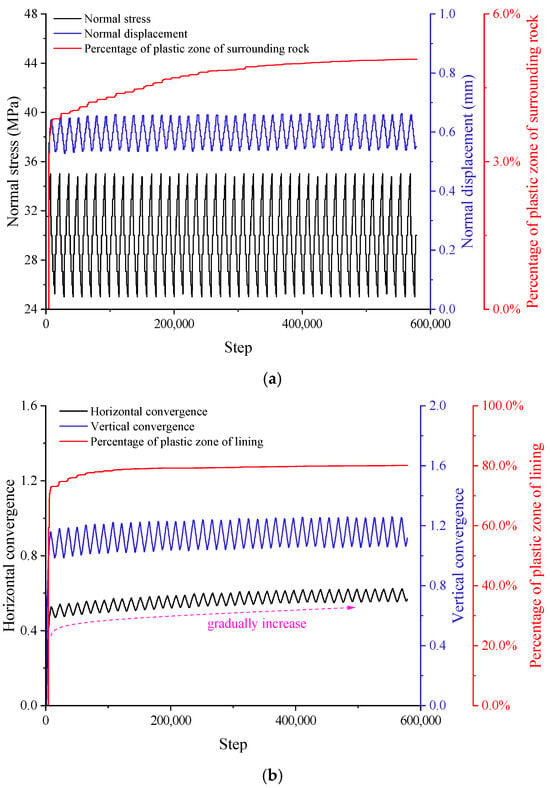
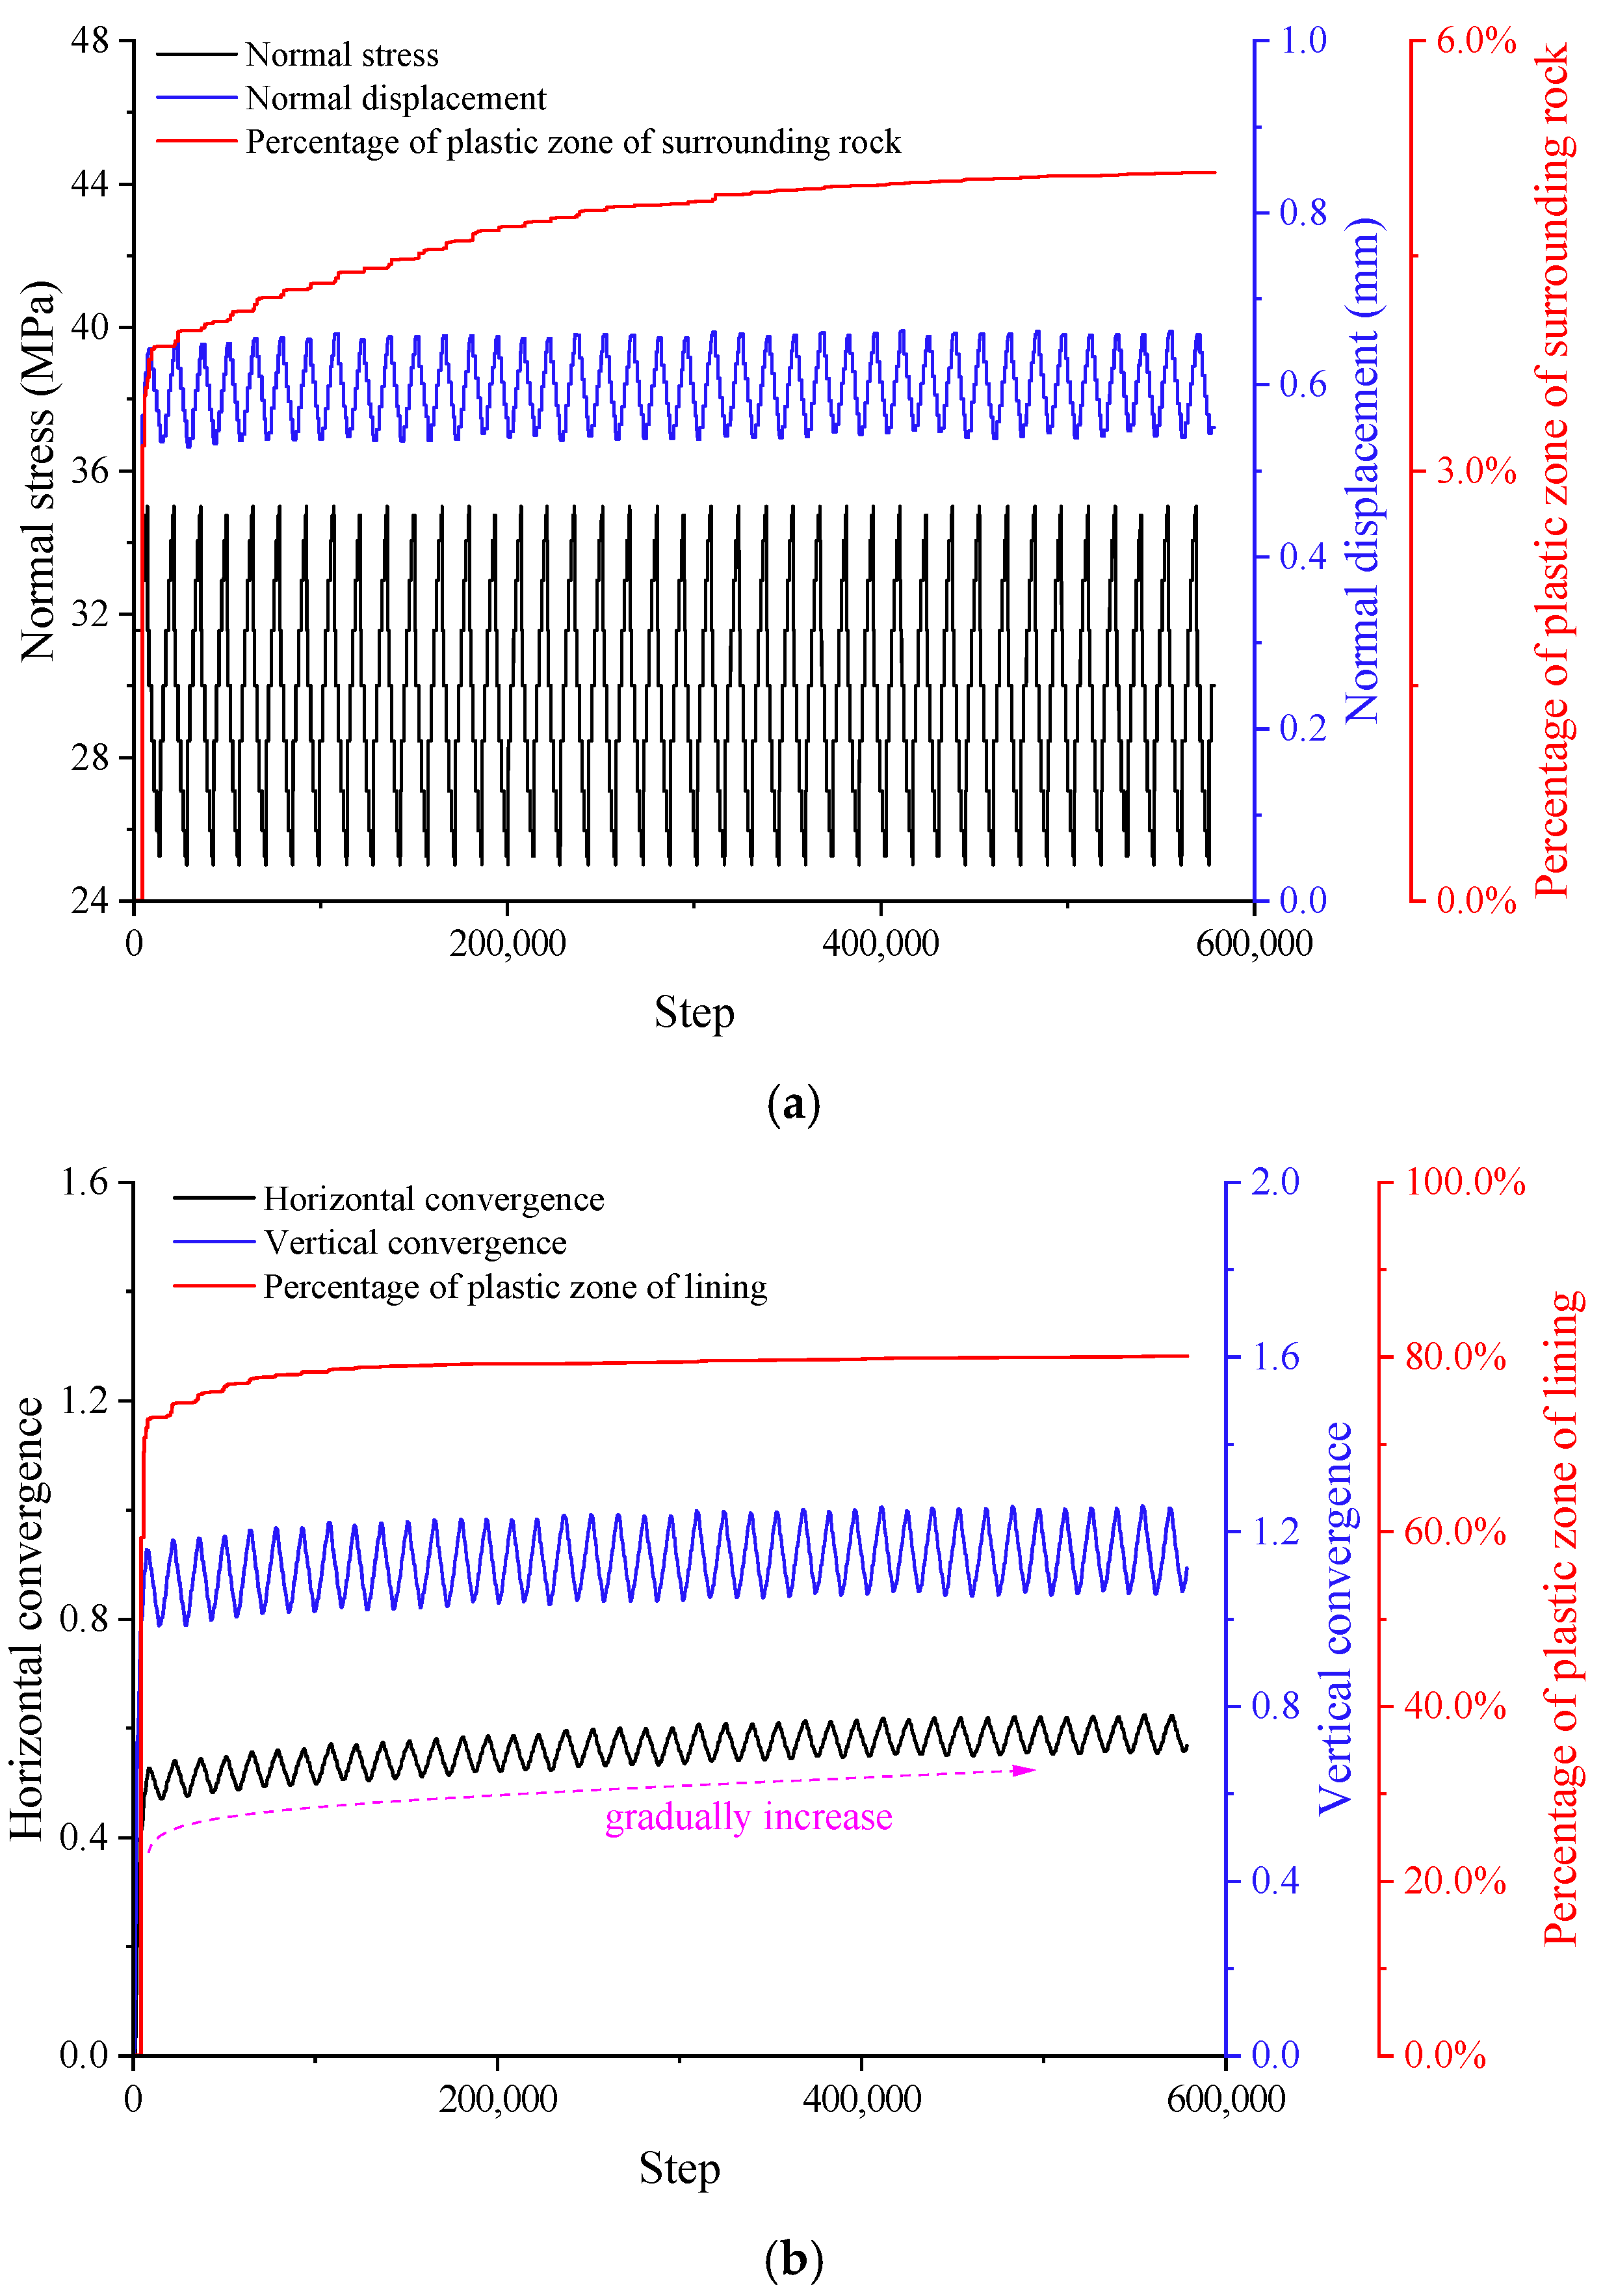
Figure 9 shows the monitored response in the reference case with a mean compressive stress of 30 MPa and an amplitude Δσn = 5 MPa. The plotted step index follows the numerical history recording. Convergence and plastic-zone fractions increase most rapidly during the first cycle and then accumulate more slowly. The convergence histories fluctuate periodically with the applied loading. The surrounding-rock plastic-zone fraction increases from 0% to 3.87% in the first cycle and reaches 5.08% at N = 40. The lining plastic-zone fraction increases to 73.11% in the first cycle and reaches 80.12% at N = 40.
Figure 9.
Evolution of (a) normal stress, normal displacement and surrounding-rock plastic-zone fraction, and (b) horizontal convergence, vertical convergence and lining plastic-zone fraction during the reference cyclic loading calculation. The horizontal axis is the numerical step index used to record the calculation history and does not represent physical time.
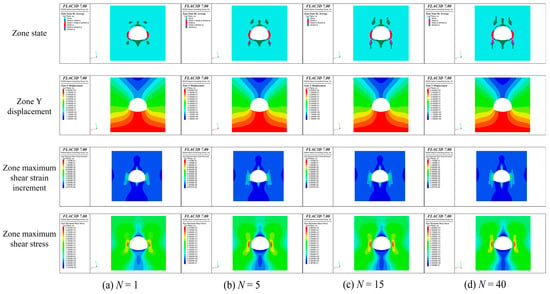
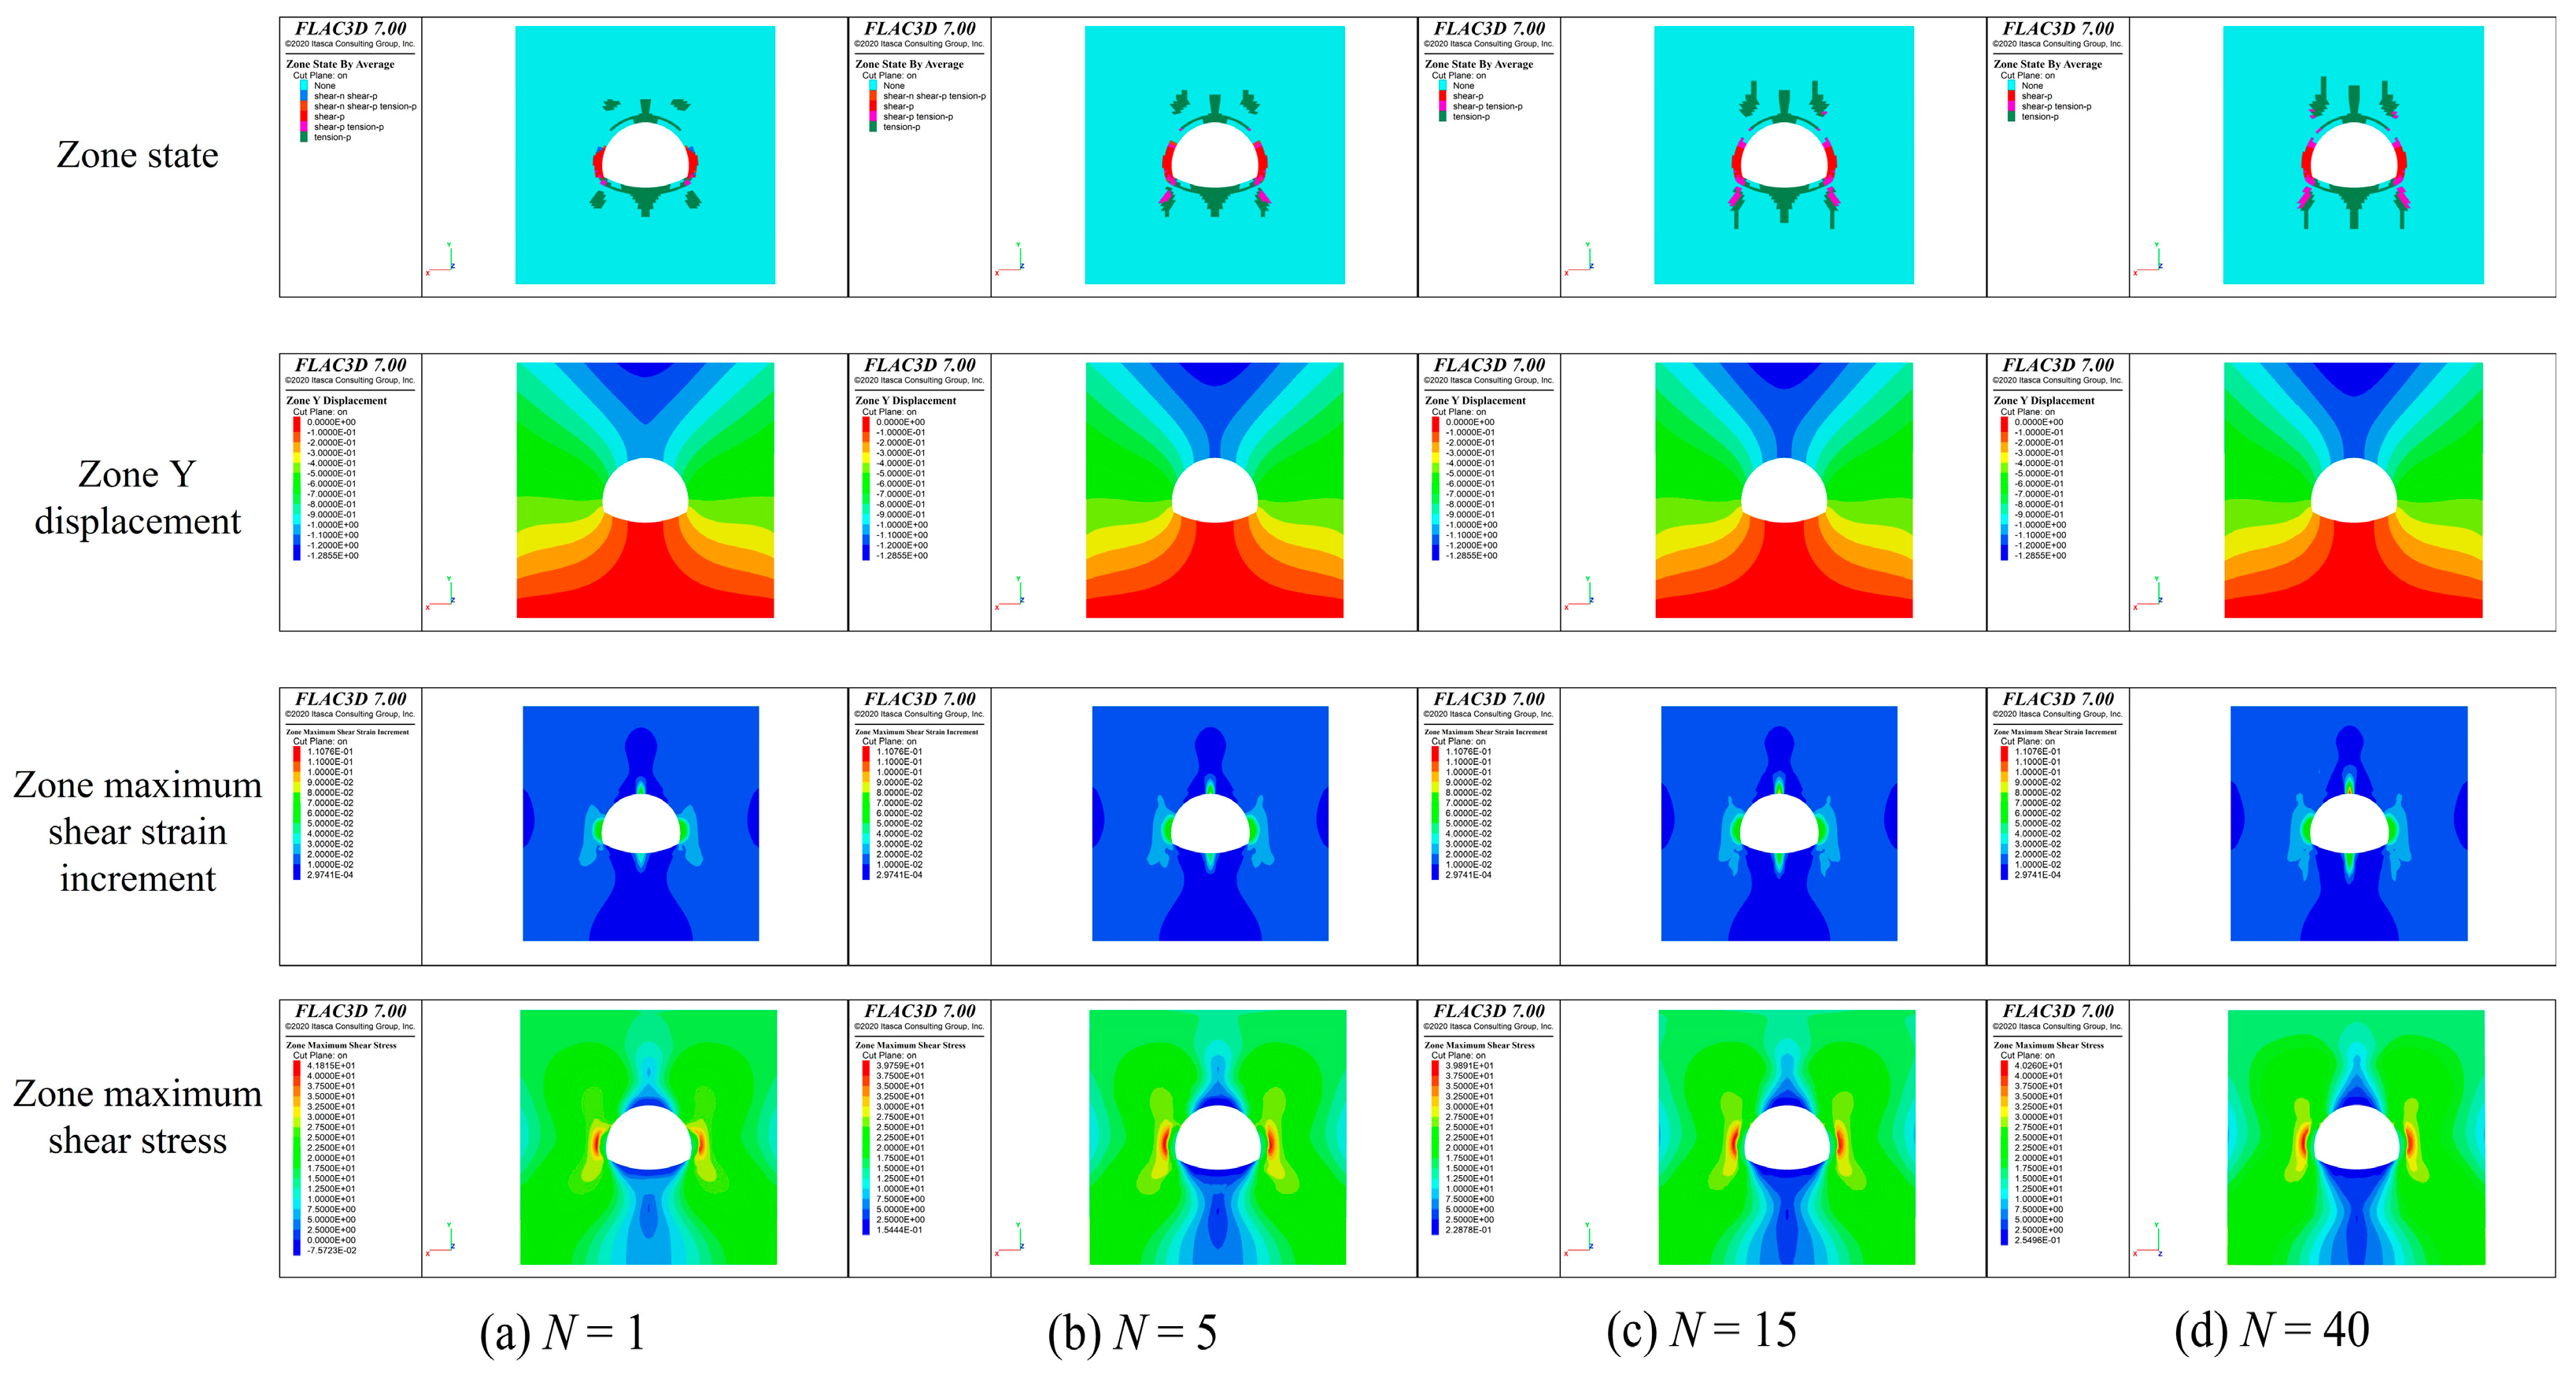
Figure 10 compares material states, axial displacement, maximum shear strain increment and maximum shear stress at selected cycle numbers. Shear yielding develops earlier and occupies a larger region in the lining than in the surrounding rock. Shear-related states are concentrated near the arch foot and arch waist, while tensile-related states occur near the vault and invert. With increasing N, the yielded regions extend along parts of the lining–rock boundary. The maximum shear strain increment initially concentrates near the vault, identifying a region of localized deformation in the unreinforced gypsum lining. The material-state contours and strain-increment contours provide complementary information on yielding mode and deformation localization.
Figure 10.
Material state, axial displacement, maximum shear strain increment and maximum shear stress at (a) N = 1, (b) N = 5, (c) N = 15 and (d) N = 40. In the state legend, n and p denote current and previous yielding, respectively. Mixed labels indicate combined state flags. Each contour should be read against its own displayed scale.
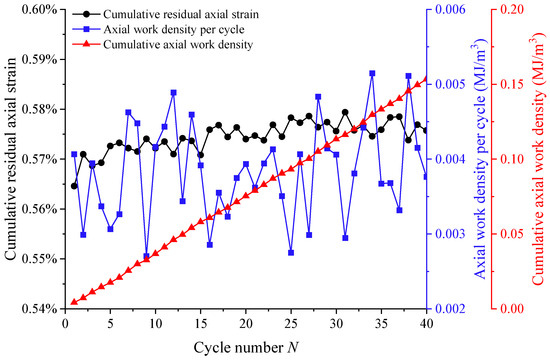
Figure 11 reports the cumulative residual axial strain and axial work density per cycle for the reference case. For each recorded cycle, successive imposed axial stresses and corresponding axial strains were integrated by the trapezoidal rule, and the magnitude of the resulting integral was retained. Stress is expressed in MPa and strain is dimensionless; the resulting work density is reported consistently in MJ/m3. Cumulative axial work density is the sum of the per-cycle magnitudes. This operational measure can include both irreversible deformation and changes in stored energy and does not isolate thermodynamic dissipation. The cumulative residual axial strain increases from 0.56% at N = 1 to 0.58% at N = 40. Axial work density per cycle has a mean of 0.00383 MJ/m3, and cumulative axial work density increases from 0.00407 to 0.1533 MJ/m3.
Figure 11.
Evolution of cumulative residual axial strain, axial work density per cycle and cumulative axial work density.
3.3. Effect of Prescribed Cyclic Stress Amplitude on the Lining Response
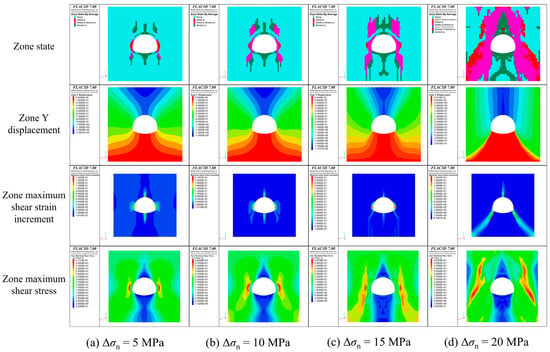
Figure 12 compares the terminal material states, axial displacement, maximum shear strain increment and maximum shear stress across the amplitude series. The 5, 10 and 15 MPa cases are shown at N = 40; the 20 MPa case is shown at its reported terminal cycle, N = 21, when the static solution no longer reached the specified equilibrium criterion. Larger amplitudes produce more extensive yielded regions near the arch waist, arch foot and arch shoulder. The yielded regions near the arch foot are separated at 5 MPa and connect between the lining and surrounding material at 10 MPa. At higher amplitudes, this connected region expands towards the base of the specimen. These terminal comparisons retain the different attained cycle numbers.
Figure 12.
Material state, axial displacement, maximum shear strain increment and maximum shear stress for (a) Δσn = 5 MPa, (b) 10 MPa, (c) 15 MPa and (d) 20 MPa. Panels (a–c) show N = 40; panel (d) shows the reported terminal state at N = 21.
The location of maximum shear strain increment also changes across the amplitude series (Figure 12). It is concentrated near the vault at Δσn = 5 and 10 MPa, shifts towards the arch waist at 15 MPa and occurs near the arch foot in the terminal 20 MPa case. This shift indicates a change in deformation localization under the imposed loading conditions. The arch shoulder shows comparatively smaller shear strain increments, differing from the broad X-shaped pattern observed under monotonic compression.
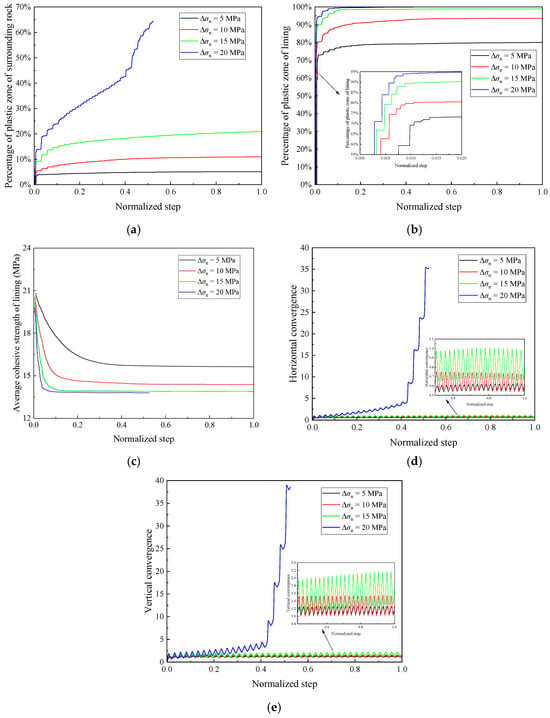
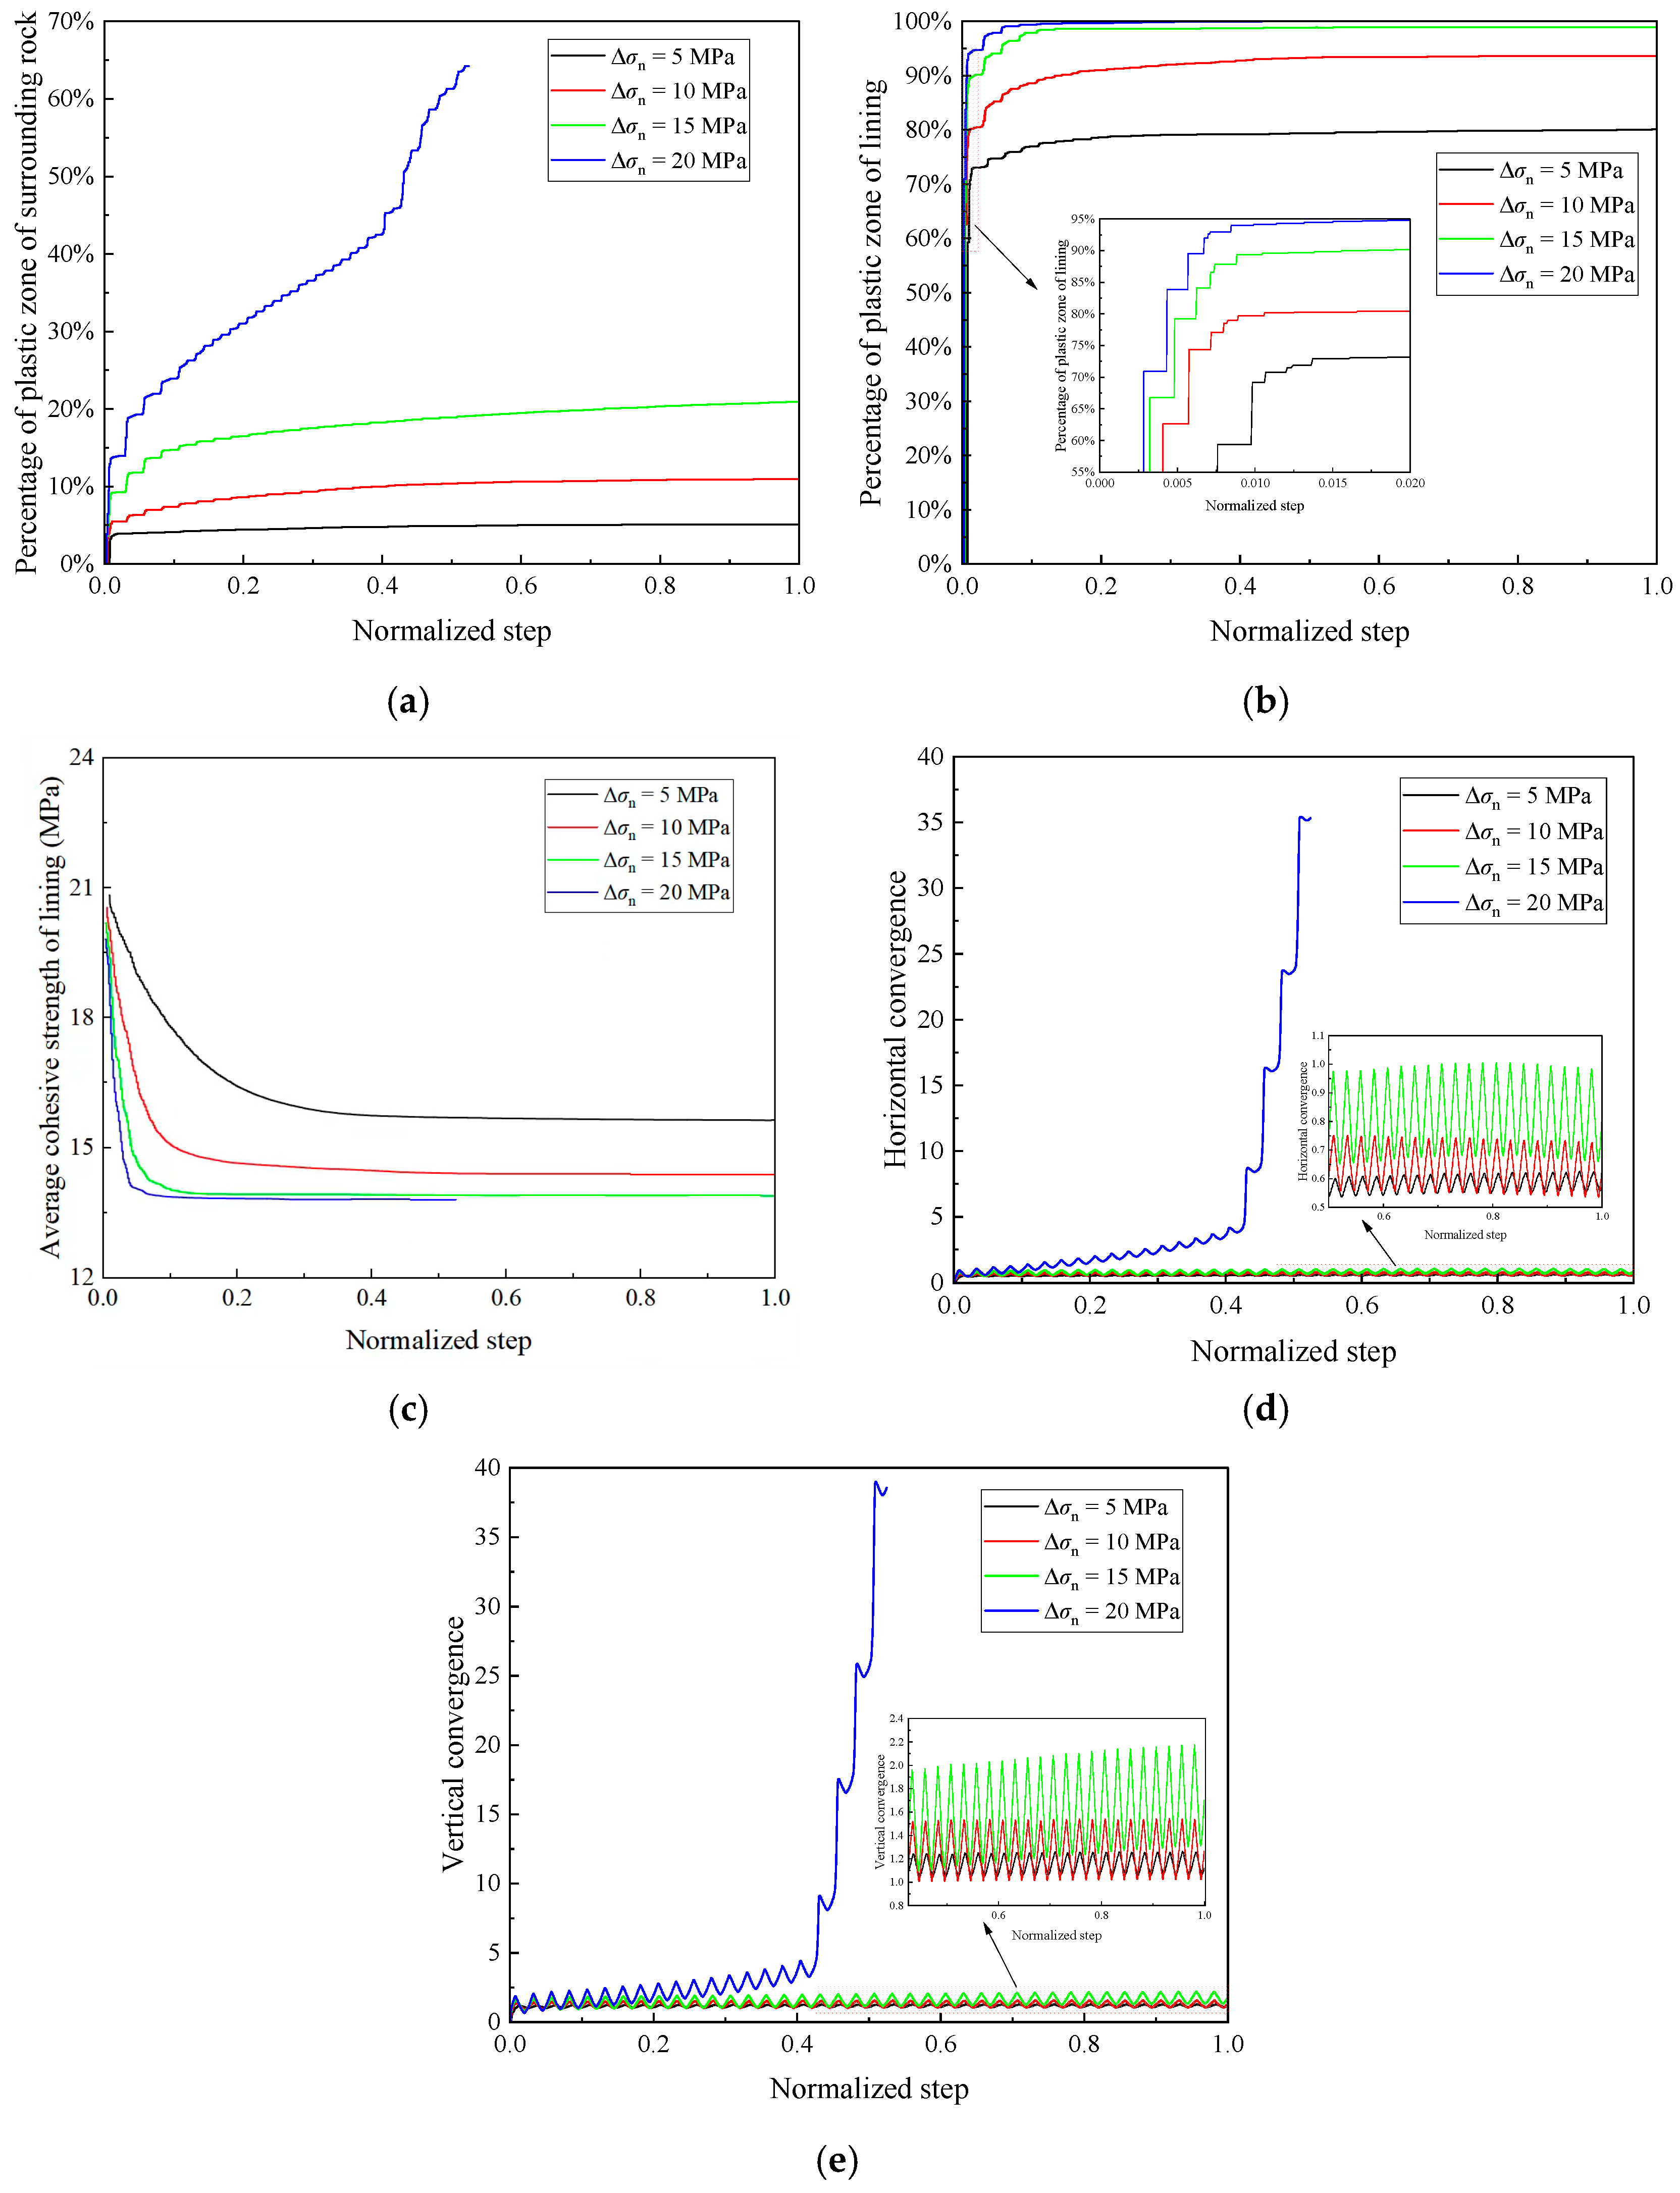
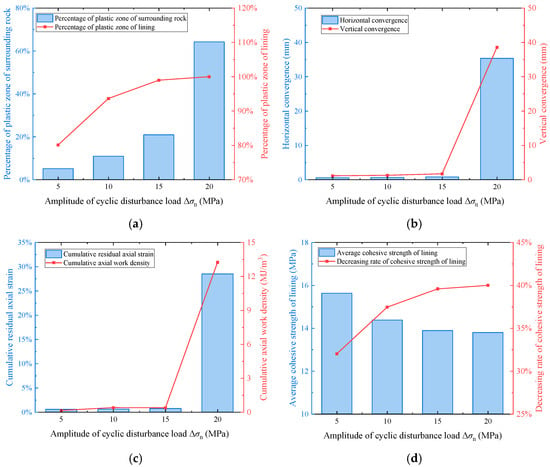
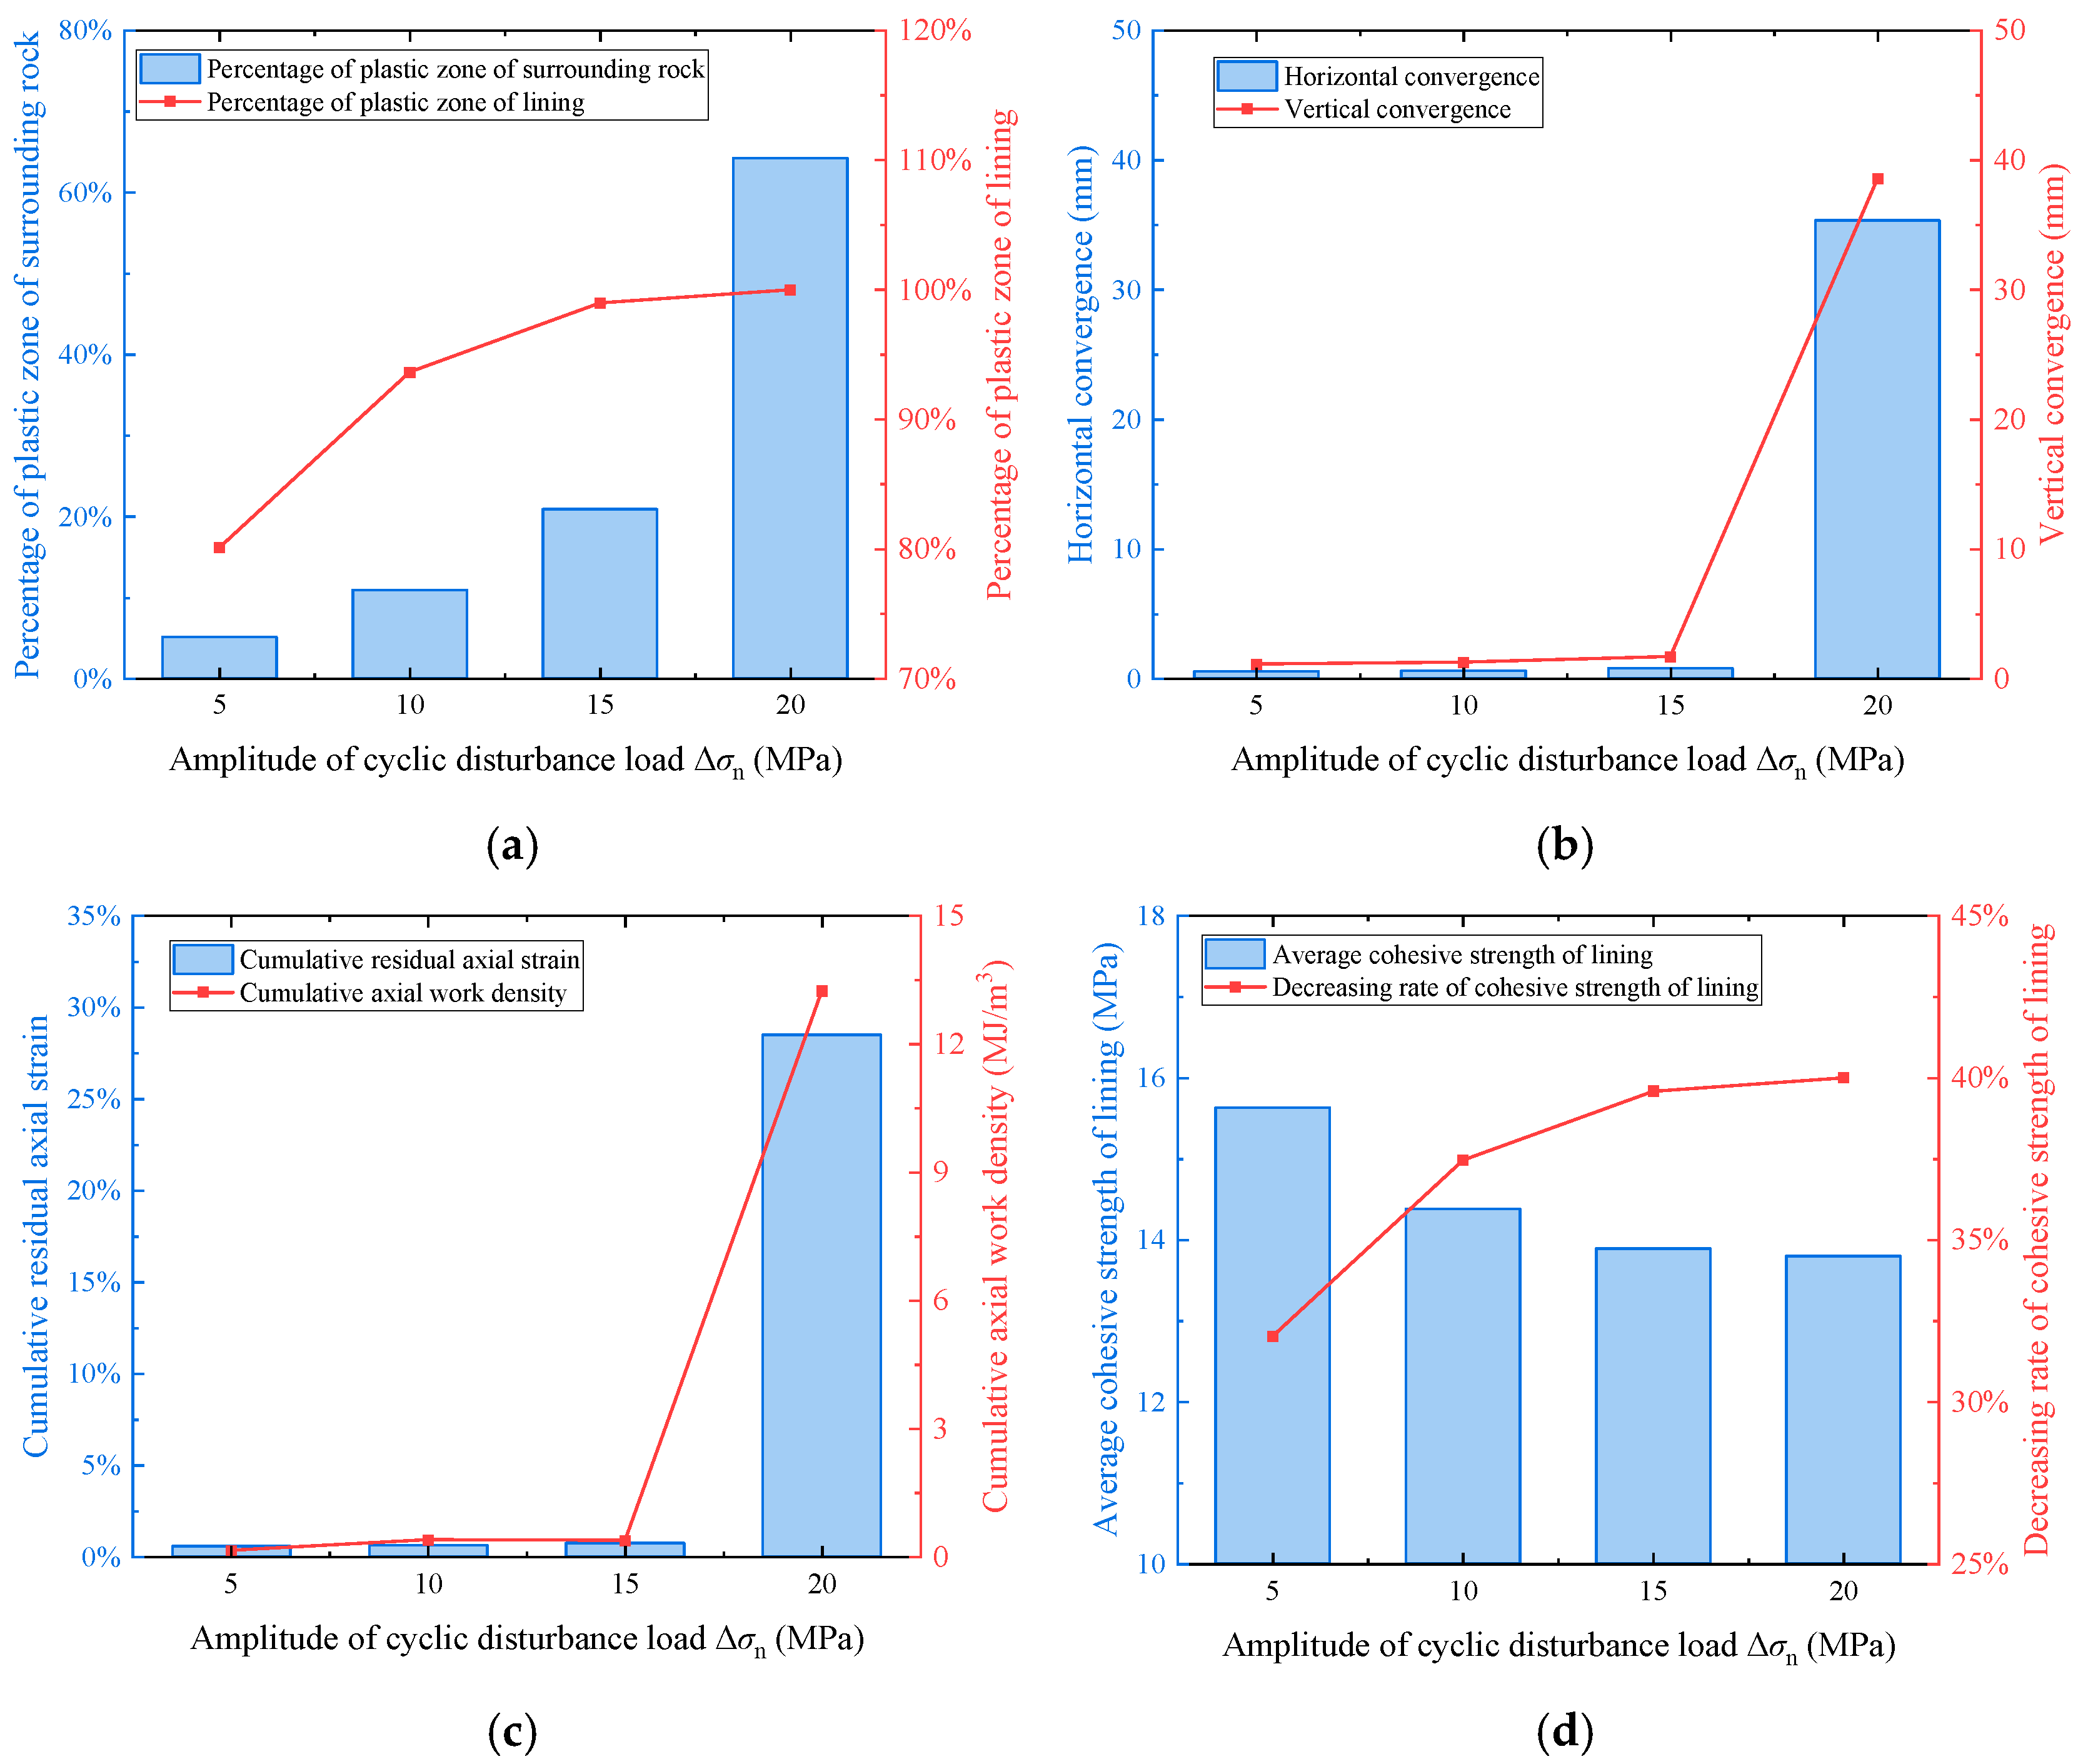
Figure 13a shows the evolution of the surrounding-rock plastic-zone fraction through the prescribed 40-cycle loading sequence. Larger cyclic stress amplitudes produced more extensive plastic yielding. At Δσn = 20 MPa, the surrounding-rock plastic-zone fraction reached 42.71% at 16 cycles and 64.25% at the final reported state, N = 21. The lining plastic-zone fraction initially increased rapidly and subsequently changed more slowly, accompanied by a reduction in average lining cohesion (Figure 13b,c). Both vertical and horizontal convergence increased with cyclic stress amplitude (Figure 13d,e). Figure 14 summarizes the terminal responses. At the available simulation endpoints, the cumulative residual axial strain increased from 0.576% at 5 MPa to 28.515% at 20 MPa. The reported cumulative axial work density increased overall from 0.1533 to 13.2416 MJ/m3, with a slight decrease from 0.3962 to 0.3869 MJ/m3 between 10 and 15 MPa. These results show a pronounced amplitude effect within the investigated series.
Figure 13.
Evolution of (a) surrounding-rock plastic-zone fraction, (b) lining plastic-zone fraction, (c) average lining cohesion, (d) horizontal convergence and (e) vertical convergence across the amplitude series. The horizontal coordinate is the normalized numerical step index; it does not denote physical time. The 20 MPa case terminates at its reported N = 21.
Figure 14.
Terminal responses across the amplitude series: (a) plastic-zone fractions, (b) horizontal and vertical convergence, (c) cumulative residual axial strain and the cumulative axial work density (MJ/m3) defined in Section 3.2, and (d) lining cohesion and its reduction ratio. The 20 MPa case is evaluated at its reported terminal cycle N = 21; the other amplitude cases are evaluated at N = 40.
3.4. Effect of the Initial Deterioration Degree of the Lining on Lining Stability
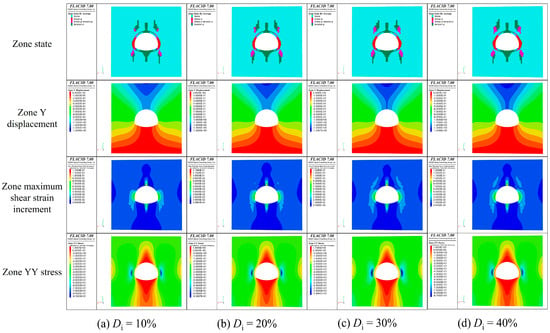
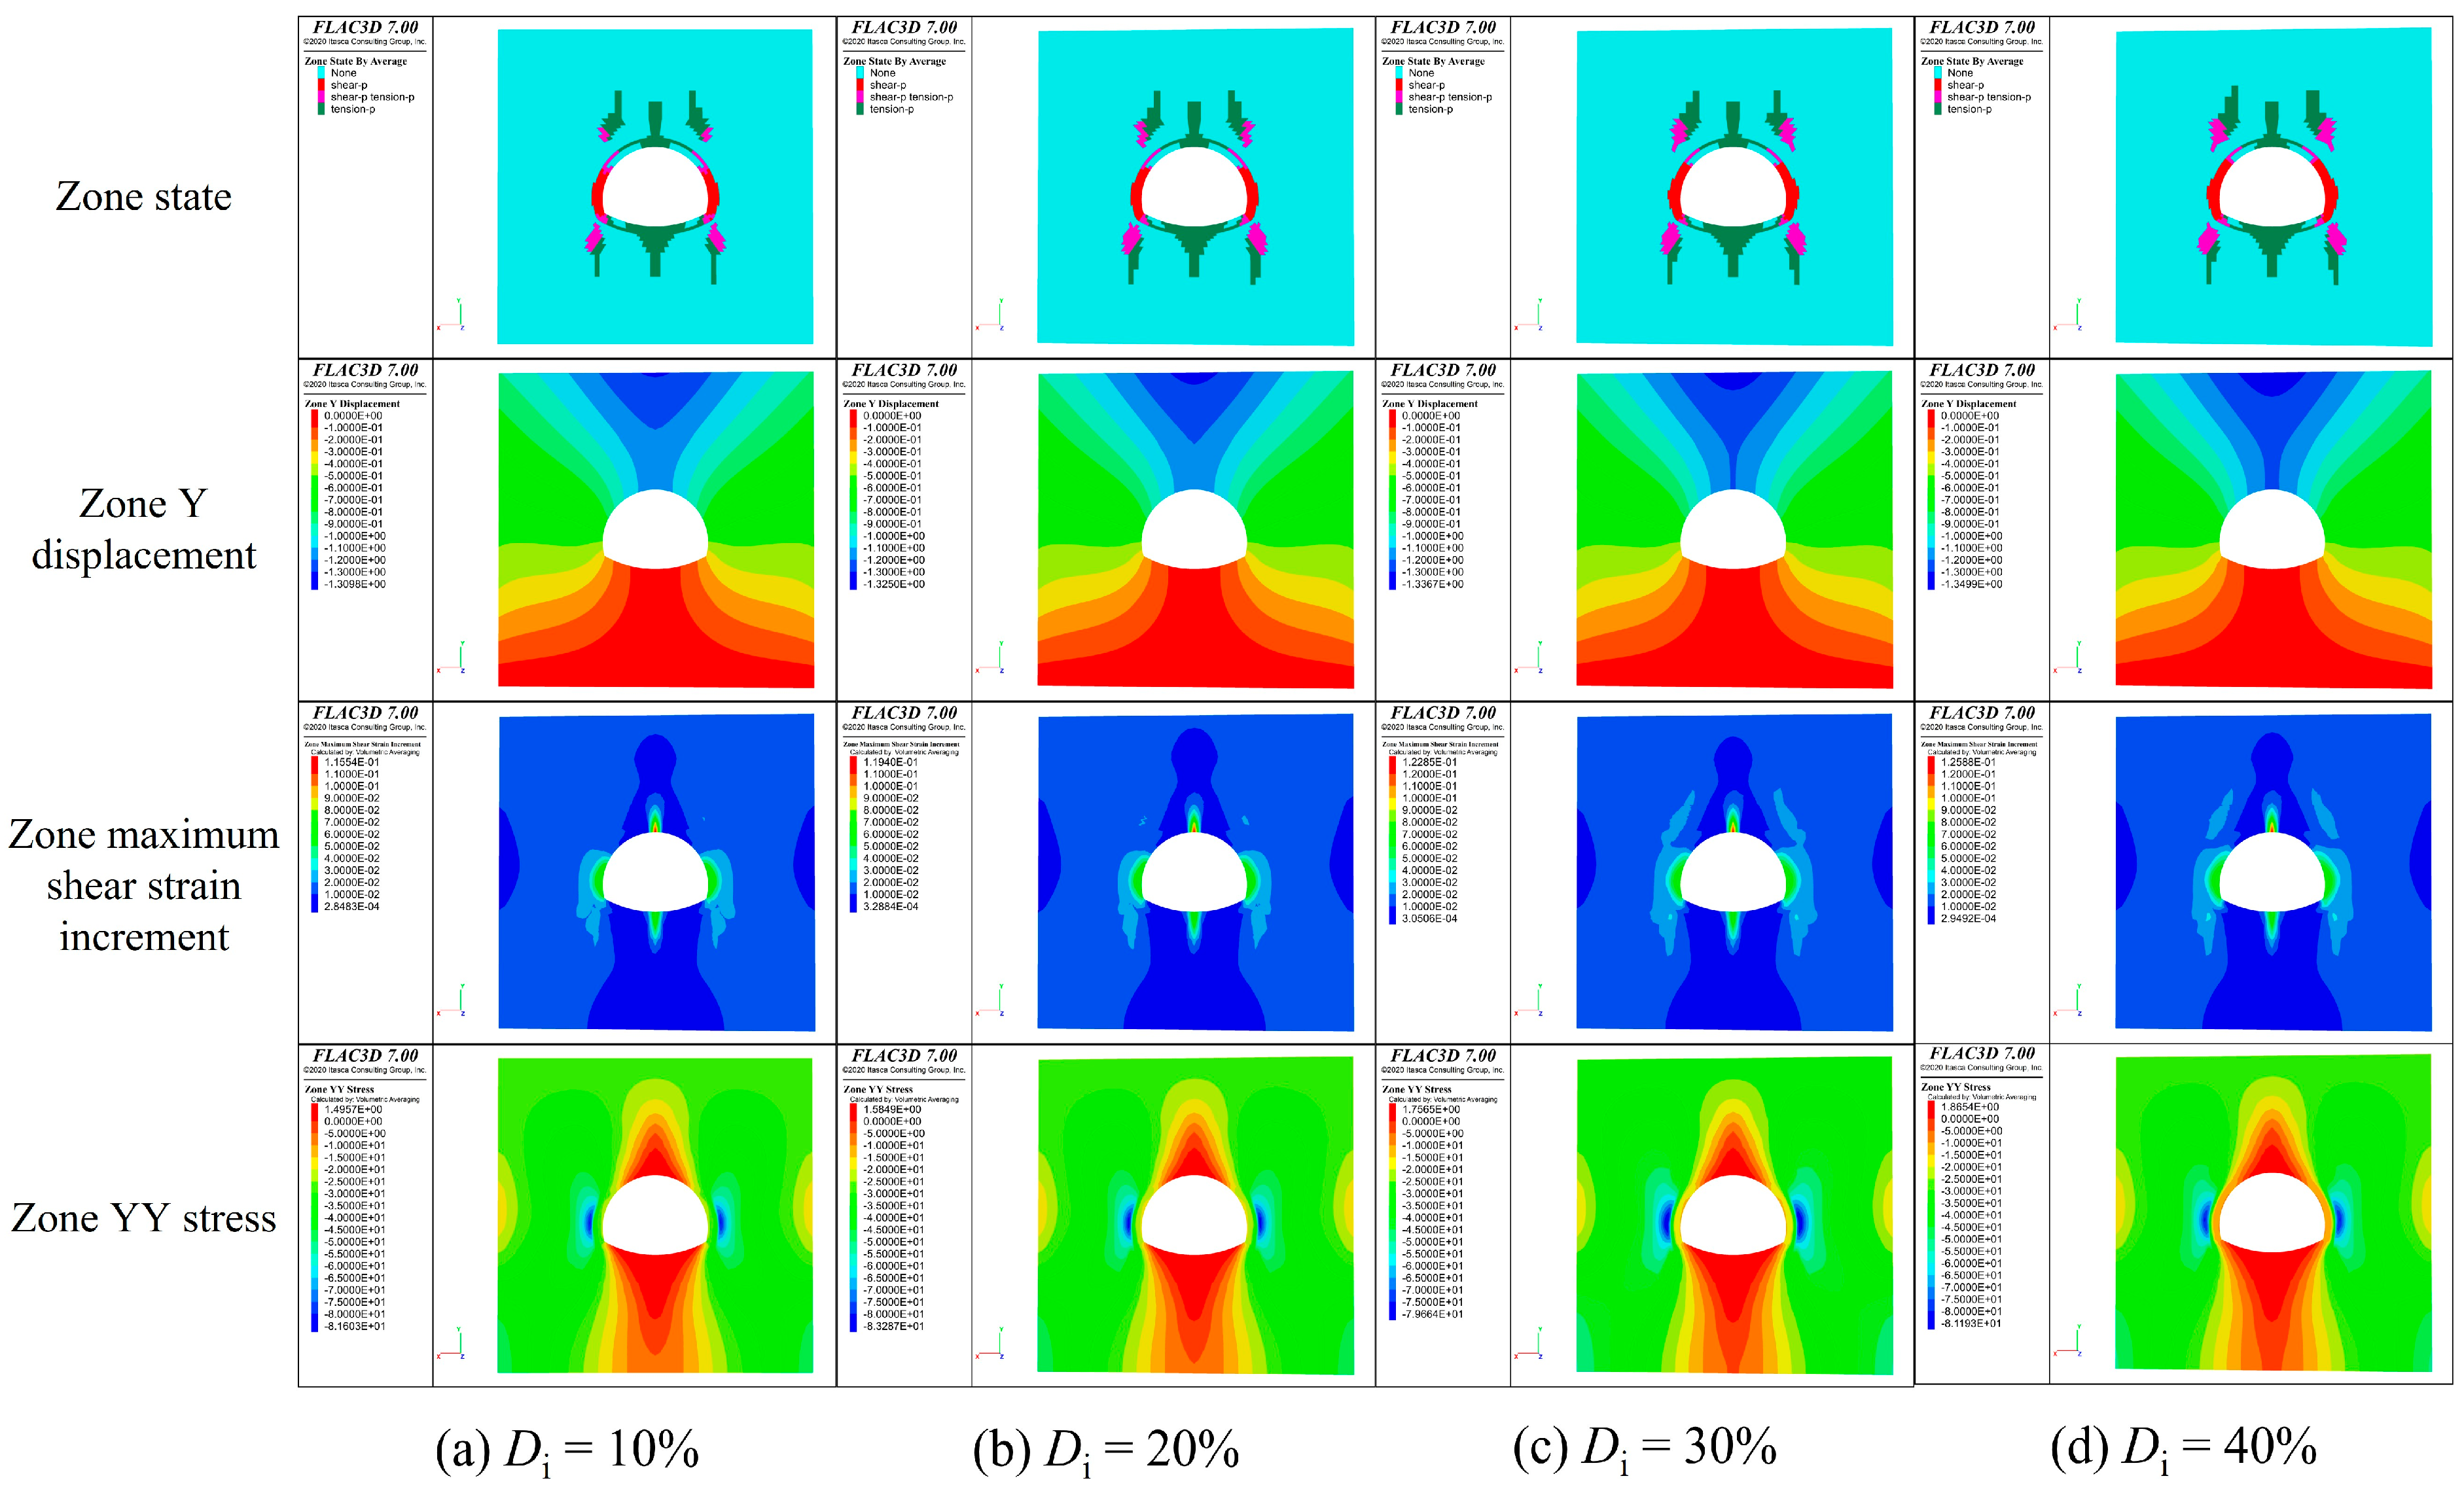
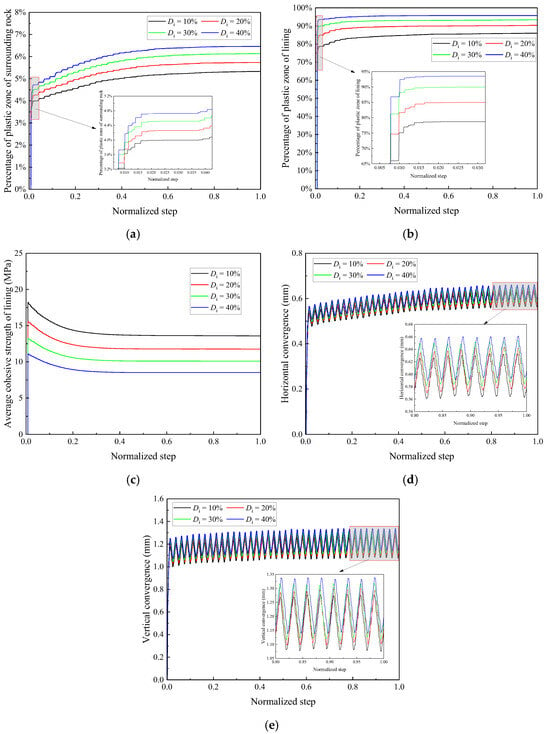
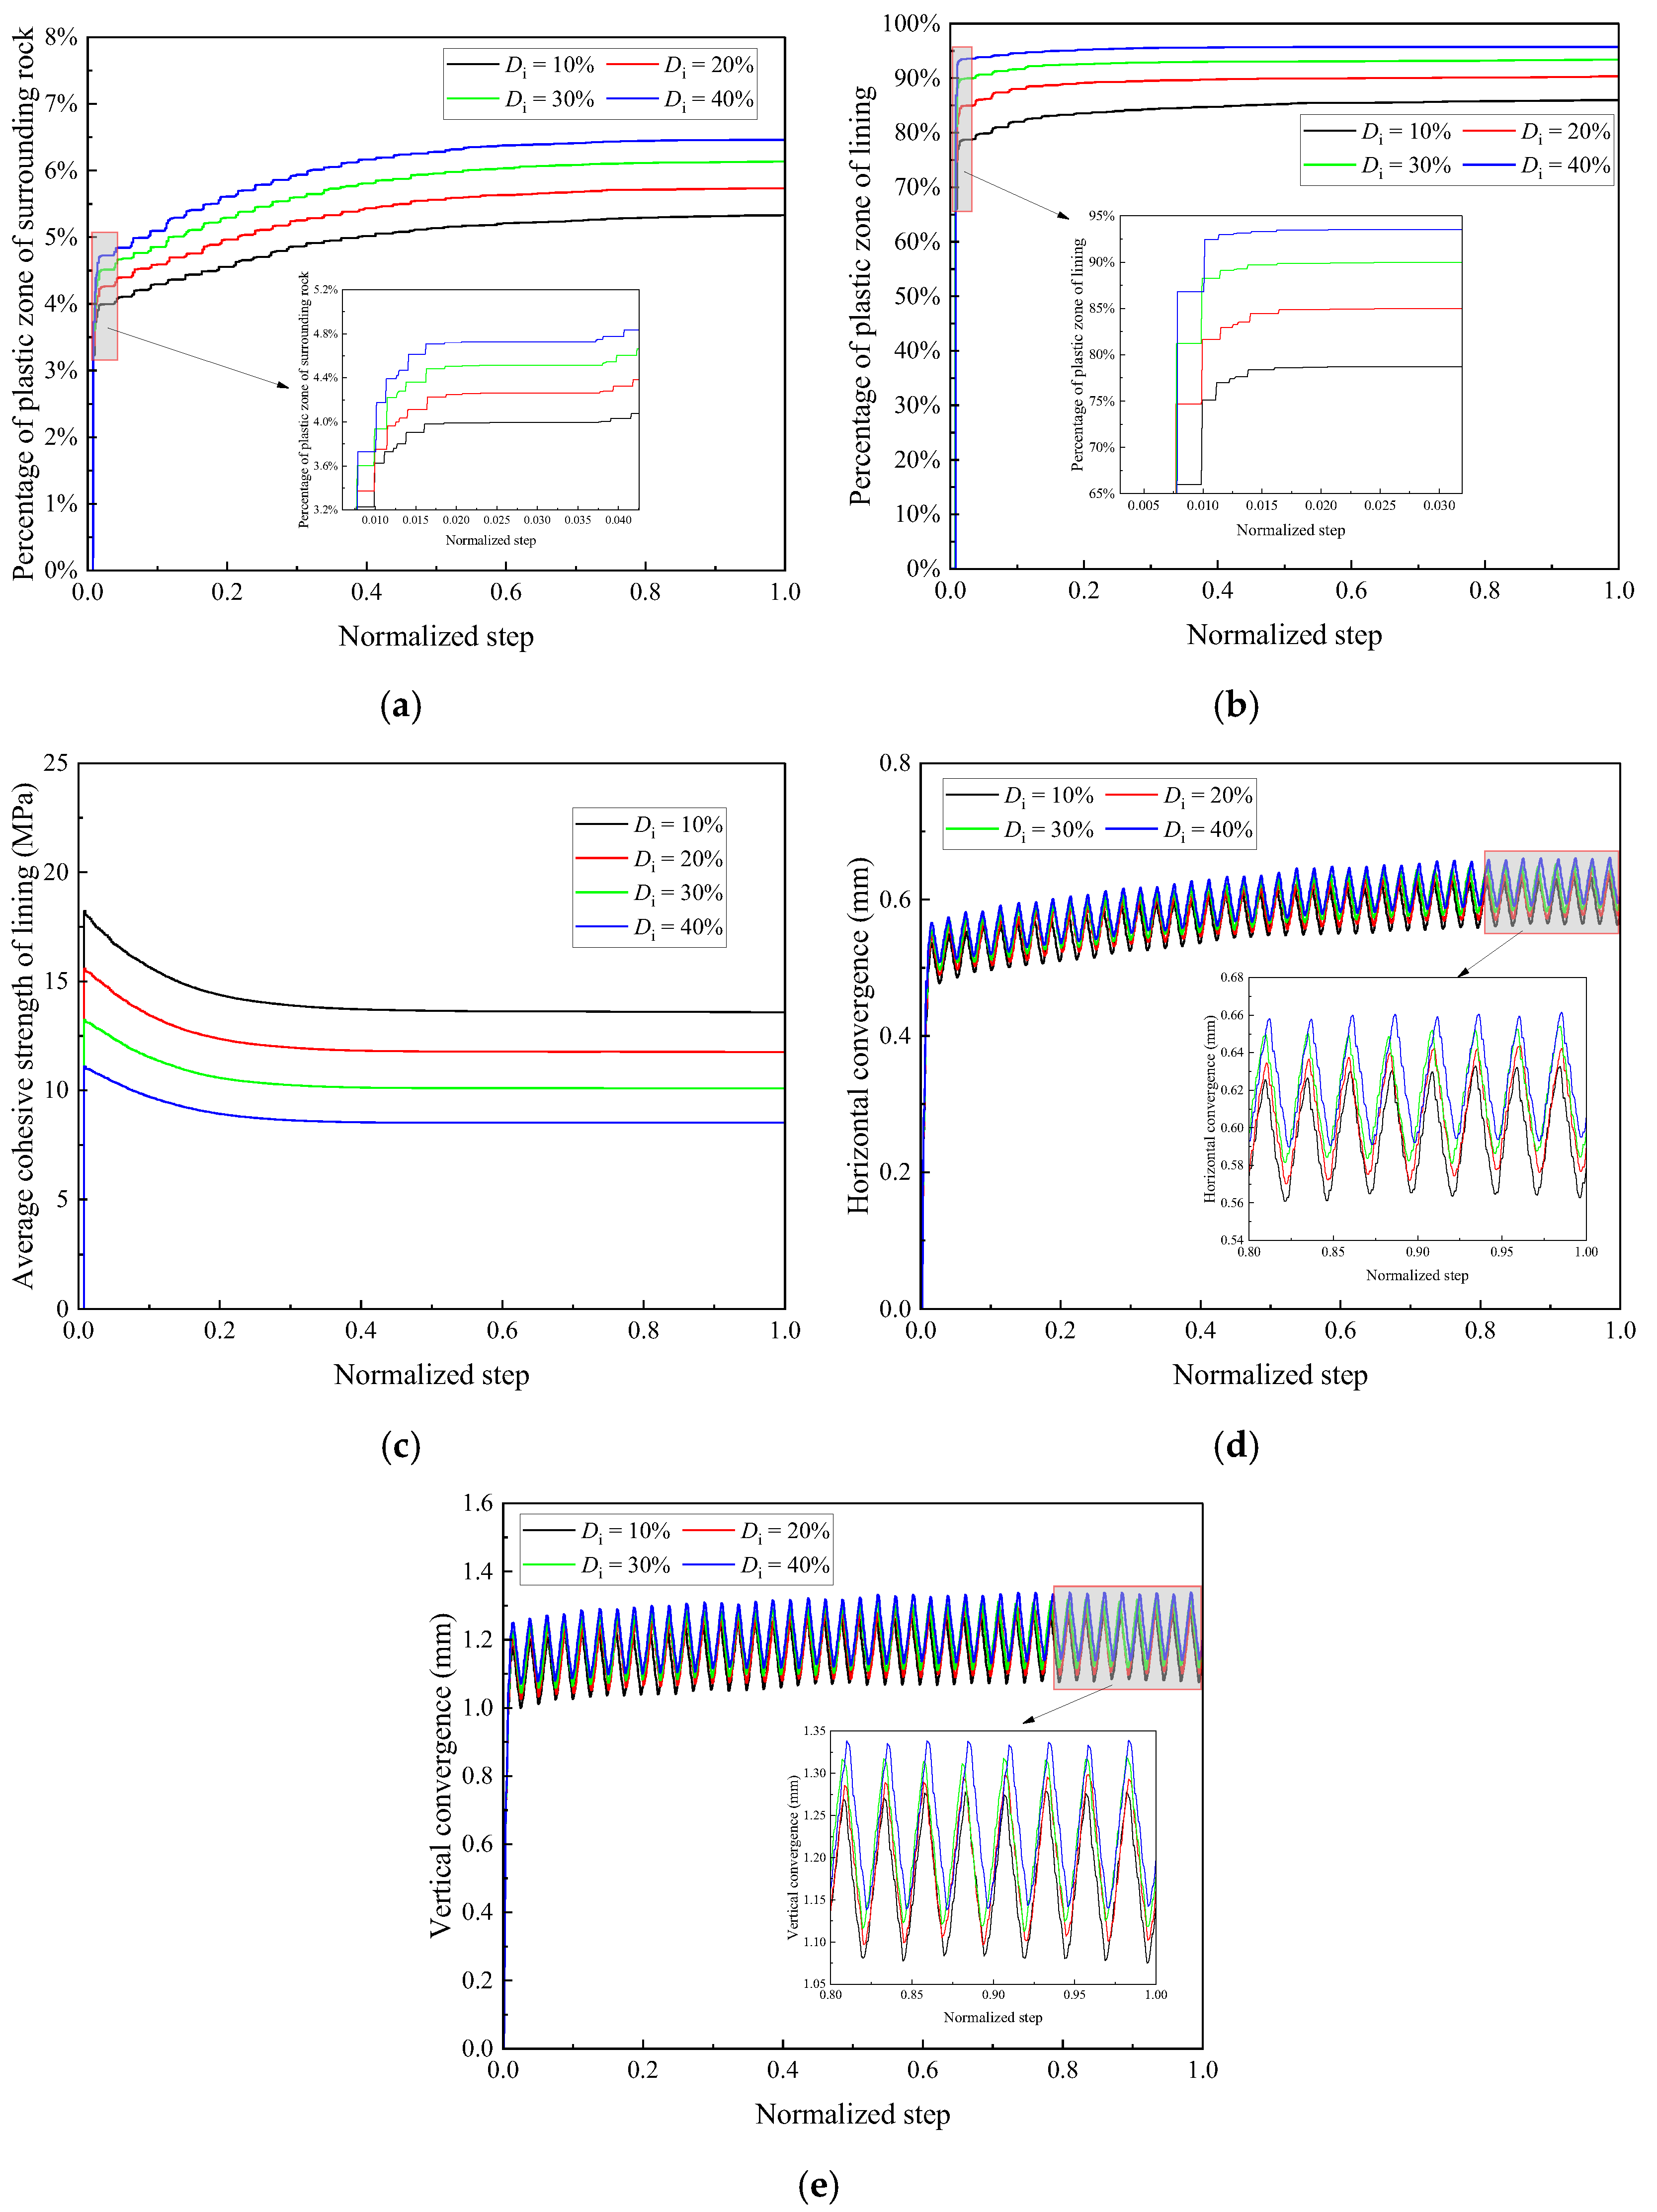
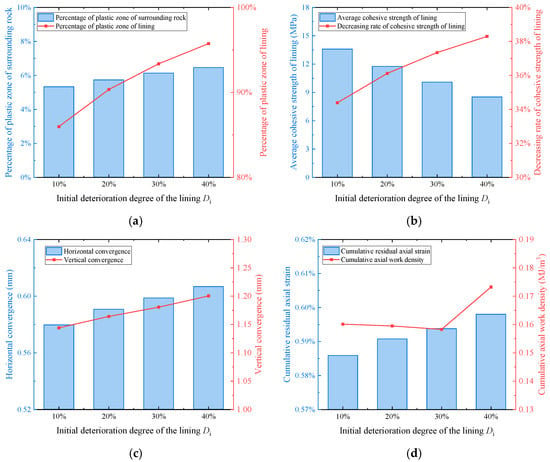
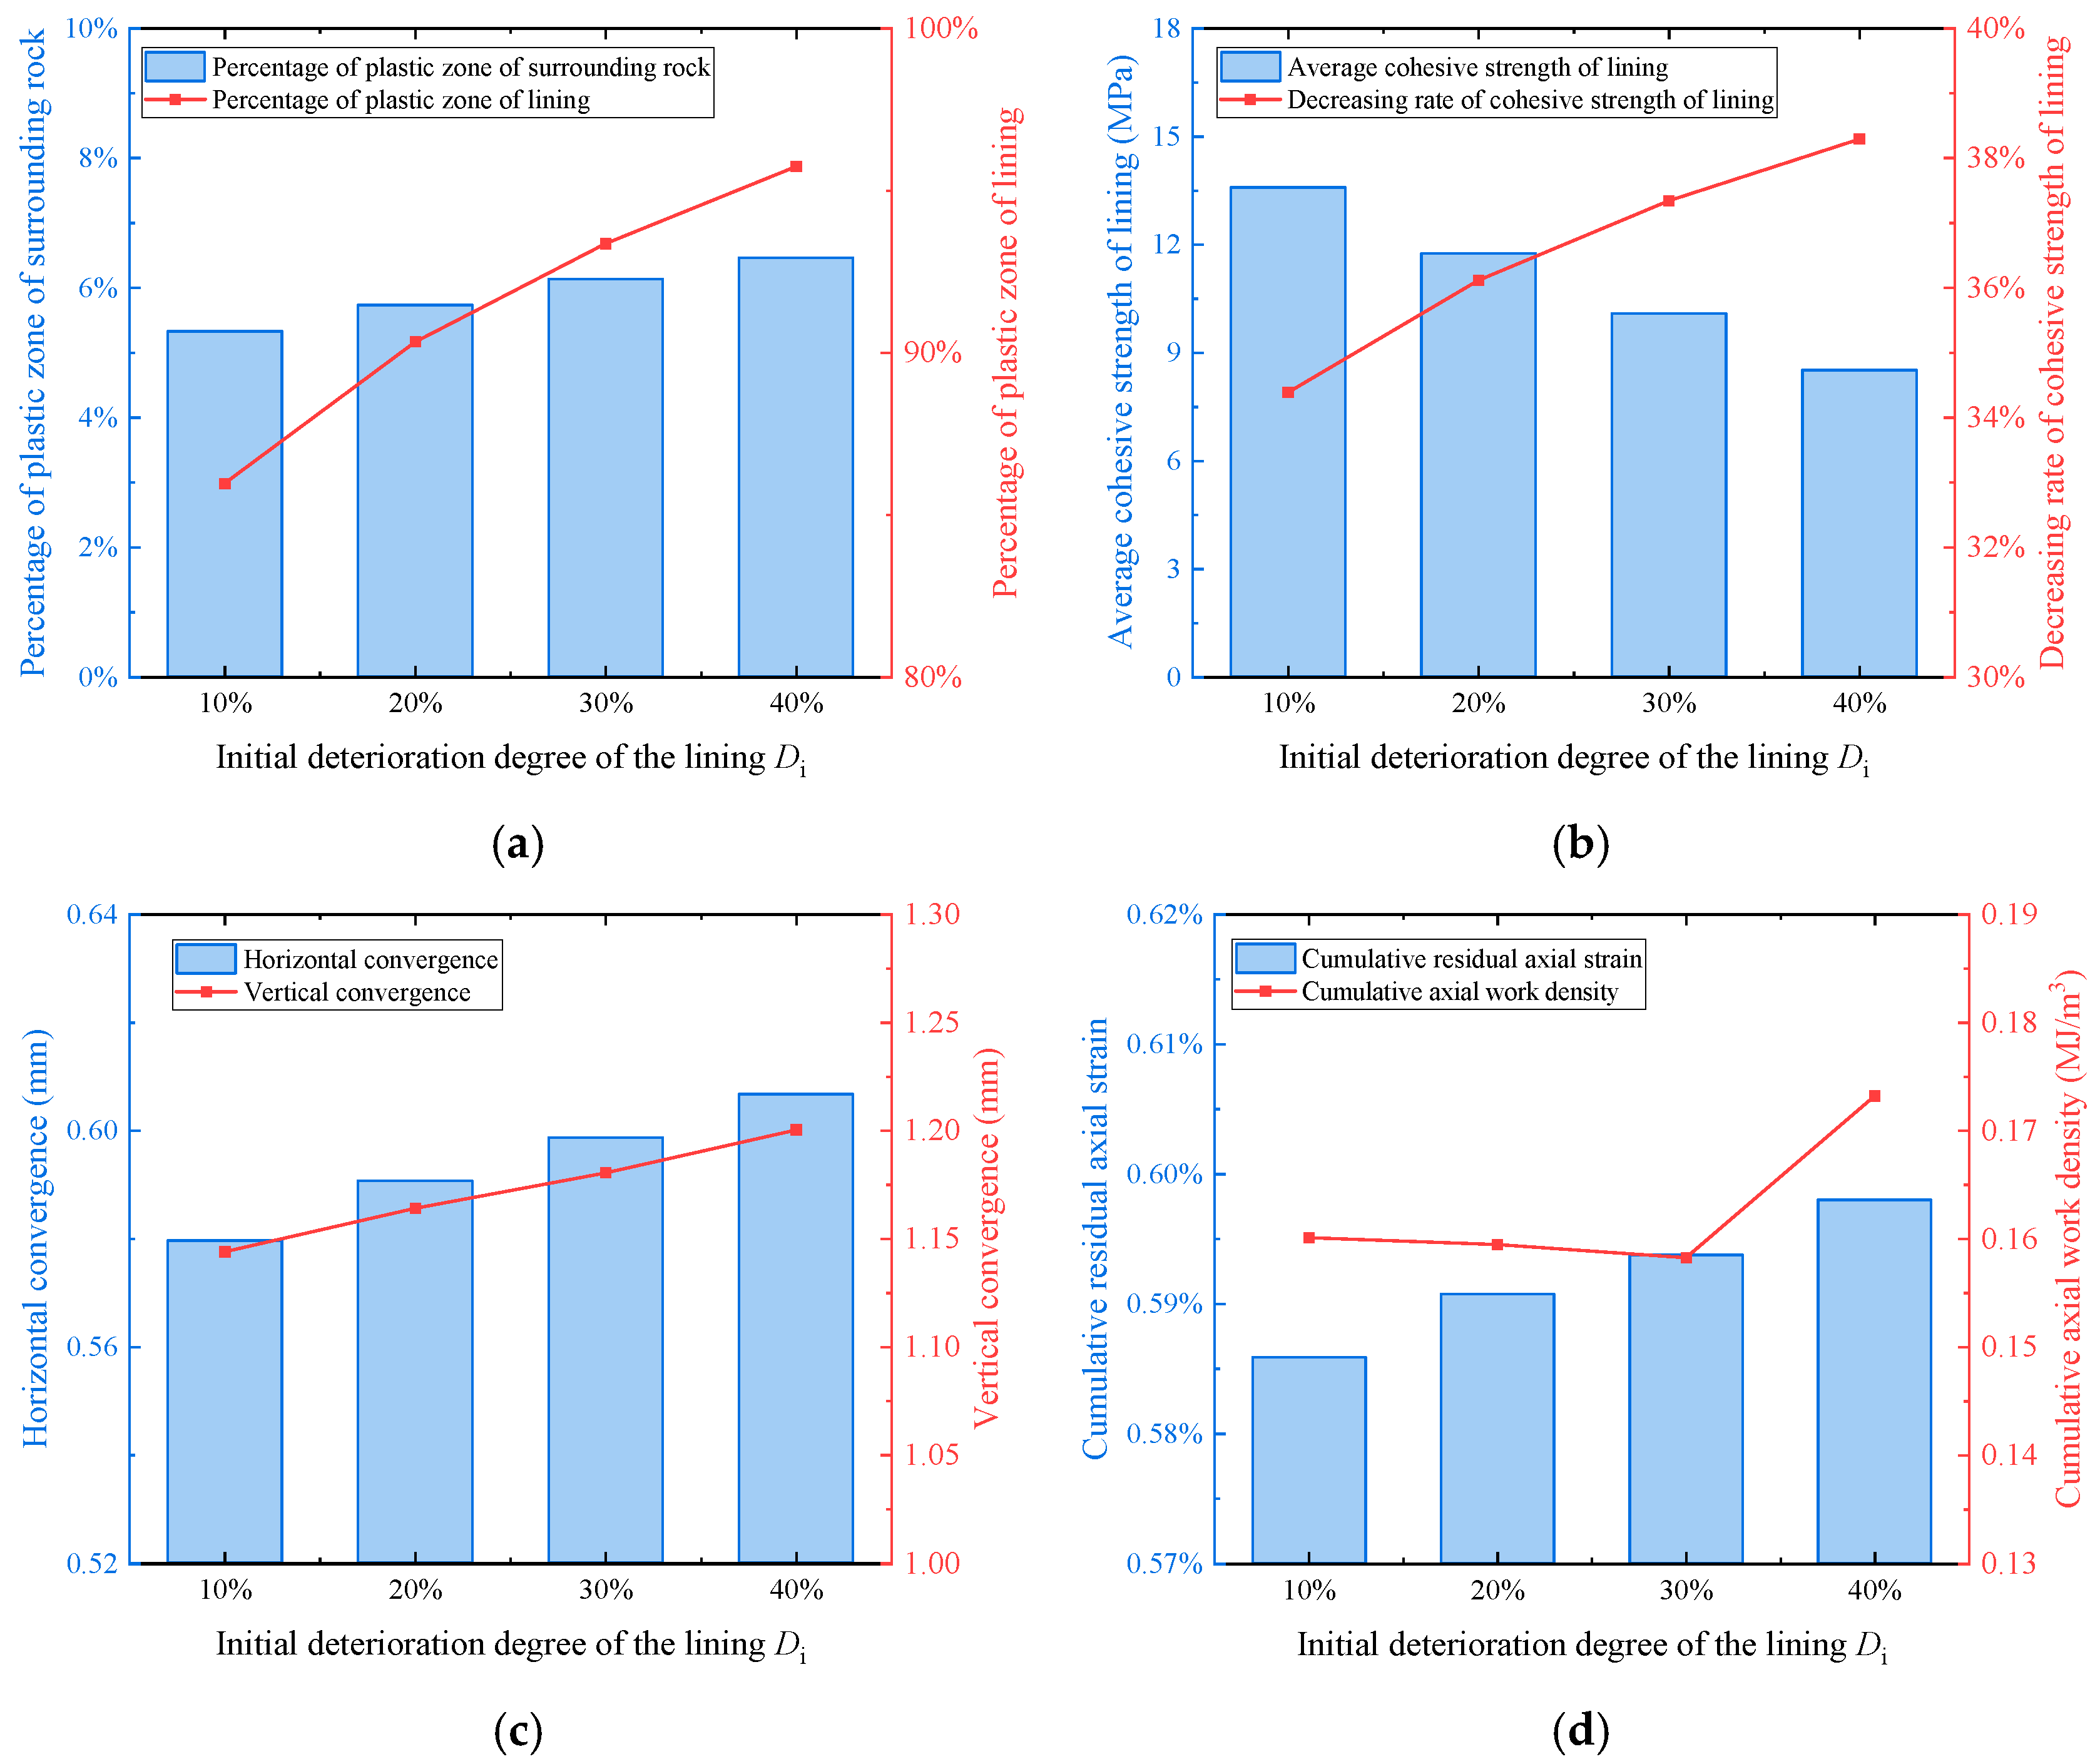
Figure 15 shows the final state distributions for specimens with different initial lining-deterioration degrees, Di. Larger Di produced more extensive shear and tensile yielding near the arch foot and shoulder. The plastic-zone fractions followed similar evolution patterns across the lining-deterioration series (Figure 16a,b). As Di increased from 10% to 40%, the surrounding-rock plastic-zone fraction increased from 5.328% to 6.461%, and the lining fraction increased from 85.965% to 95.733%. These changes indicate greater plastic yielding when the initial lining properties were reduced. The lining cohesion-loss ratio increased from 34.384% at Di = 10% to 37.341% at Di = 30% and 38.293% at Di = 40% (Figure 17b).
Figure 15.
Material state, axial displacement, maximum shear strain increment and YY stress for (a) Di = 10%, (b) 20%, (c) 30% and (d) 40%.
Figure 16.
Evolution of (a) percentage of plastic zone of surrounding rock, (b) percentage of plastic zone of lining, (c) average cohesive strength of lining, (d) horizontal convergence, and (e) vertical convergence of samples with different Di.
Figure 17.
Effects of Di on (a) percentages of plastic zone, (b) deterioration of cohesive strength of lining, (c) horizontal/vertical convergence, and (d) cumulative residual axial strain and cumulative axial work density (MJ/m3).
Larger Di also produced greater convergence under the same loading arrangement. Figure 16e shows the vertical-convergence histories, with greater cyclic fluctuations for more deteriorated linings. At the simulation endpoint, vertical convergence increased from 1.14 to 1.20 mm and horizontal convergence from 0.58 to 0.61 mm as Di increased from 10% to 40%. The cumulative axial work density varied nonmonotonically with Di (Figure 17d). It decreased from 0.160 to 0.158 MJ/m3 between Di = 10% and 30%, then increased to 0.173 MJ/m3 at Di = 40%. Thus, the axial work-density trend differed from the progressive increase in convergence within this series.
3.5. Effect of the Initial Deterioration Degree of the Surrounding Rock on Lining Stability
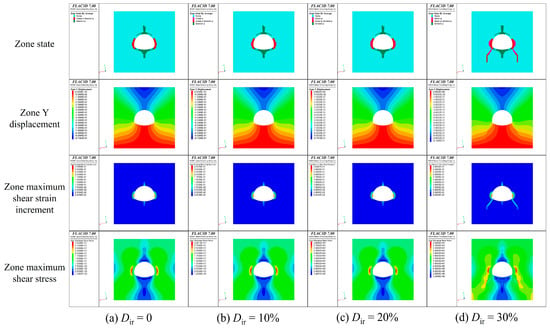
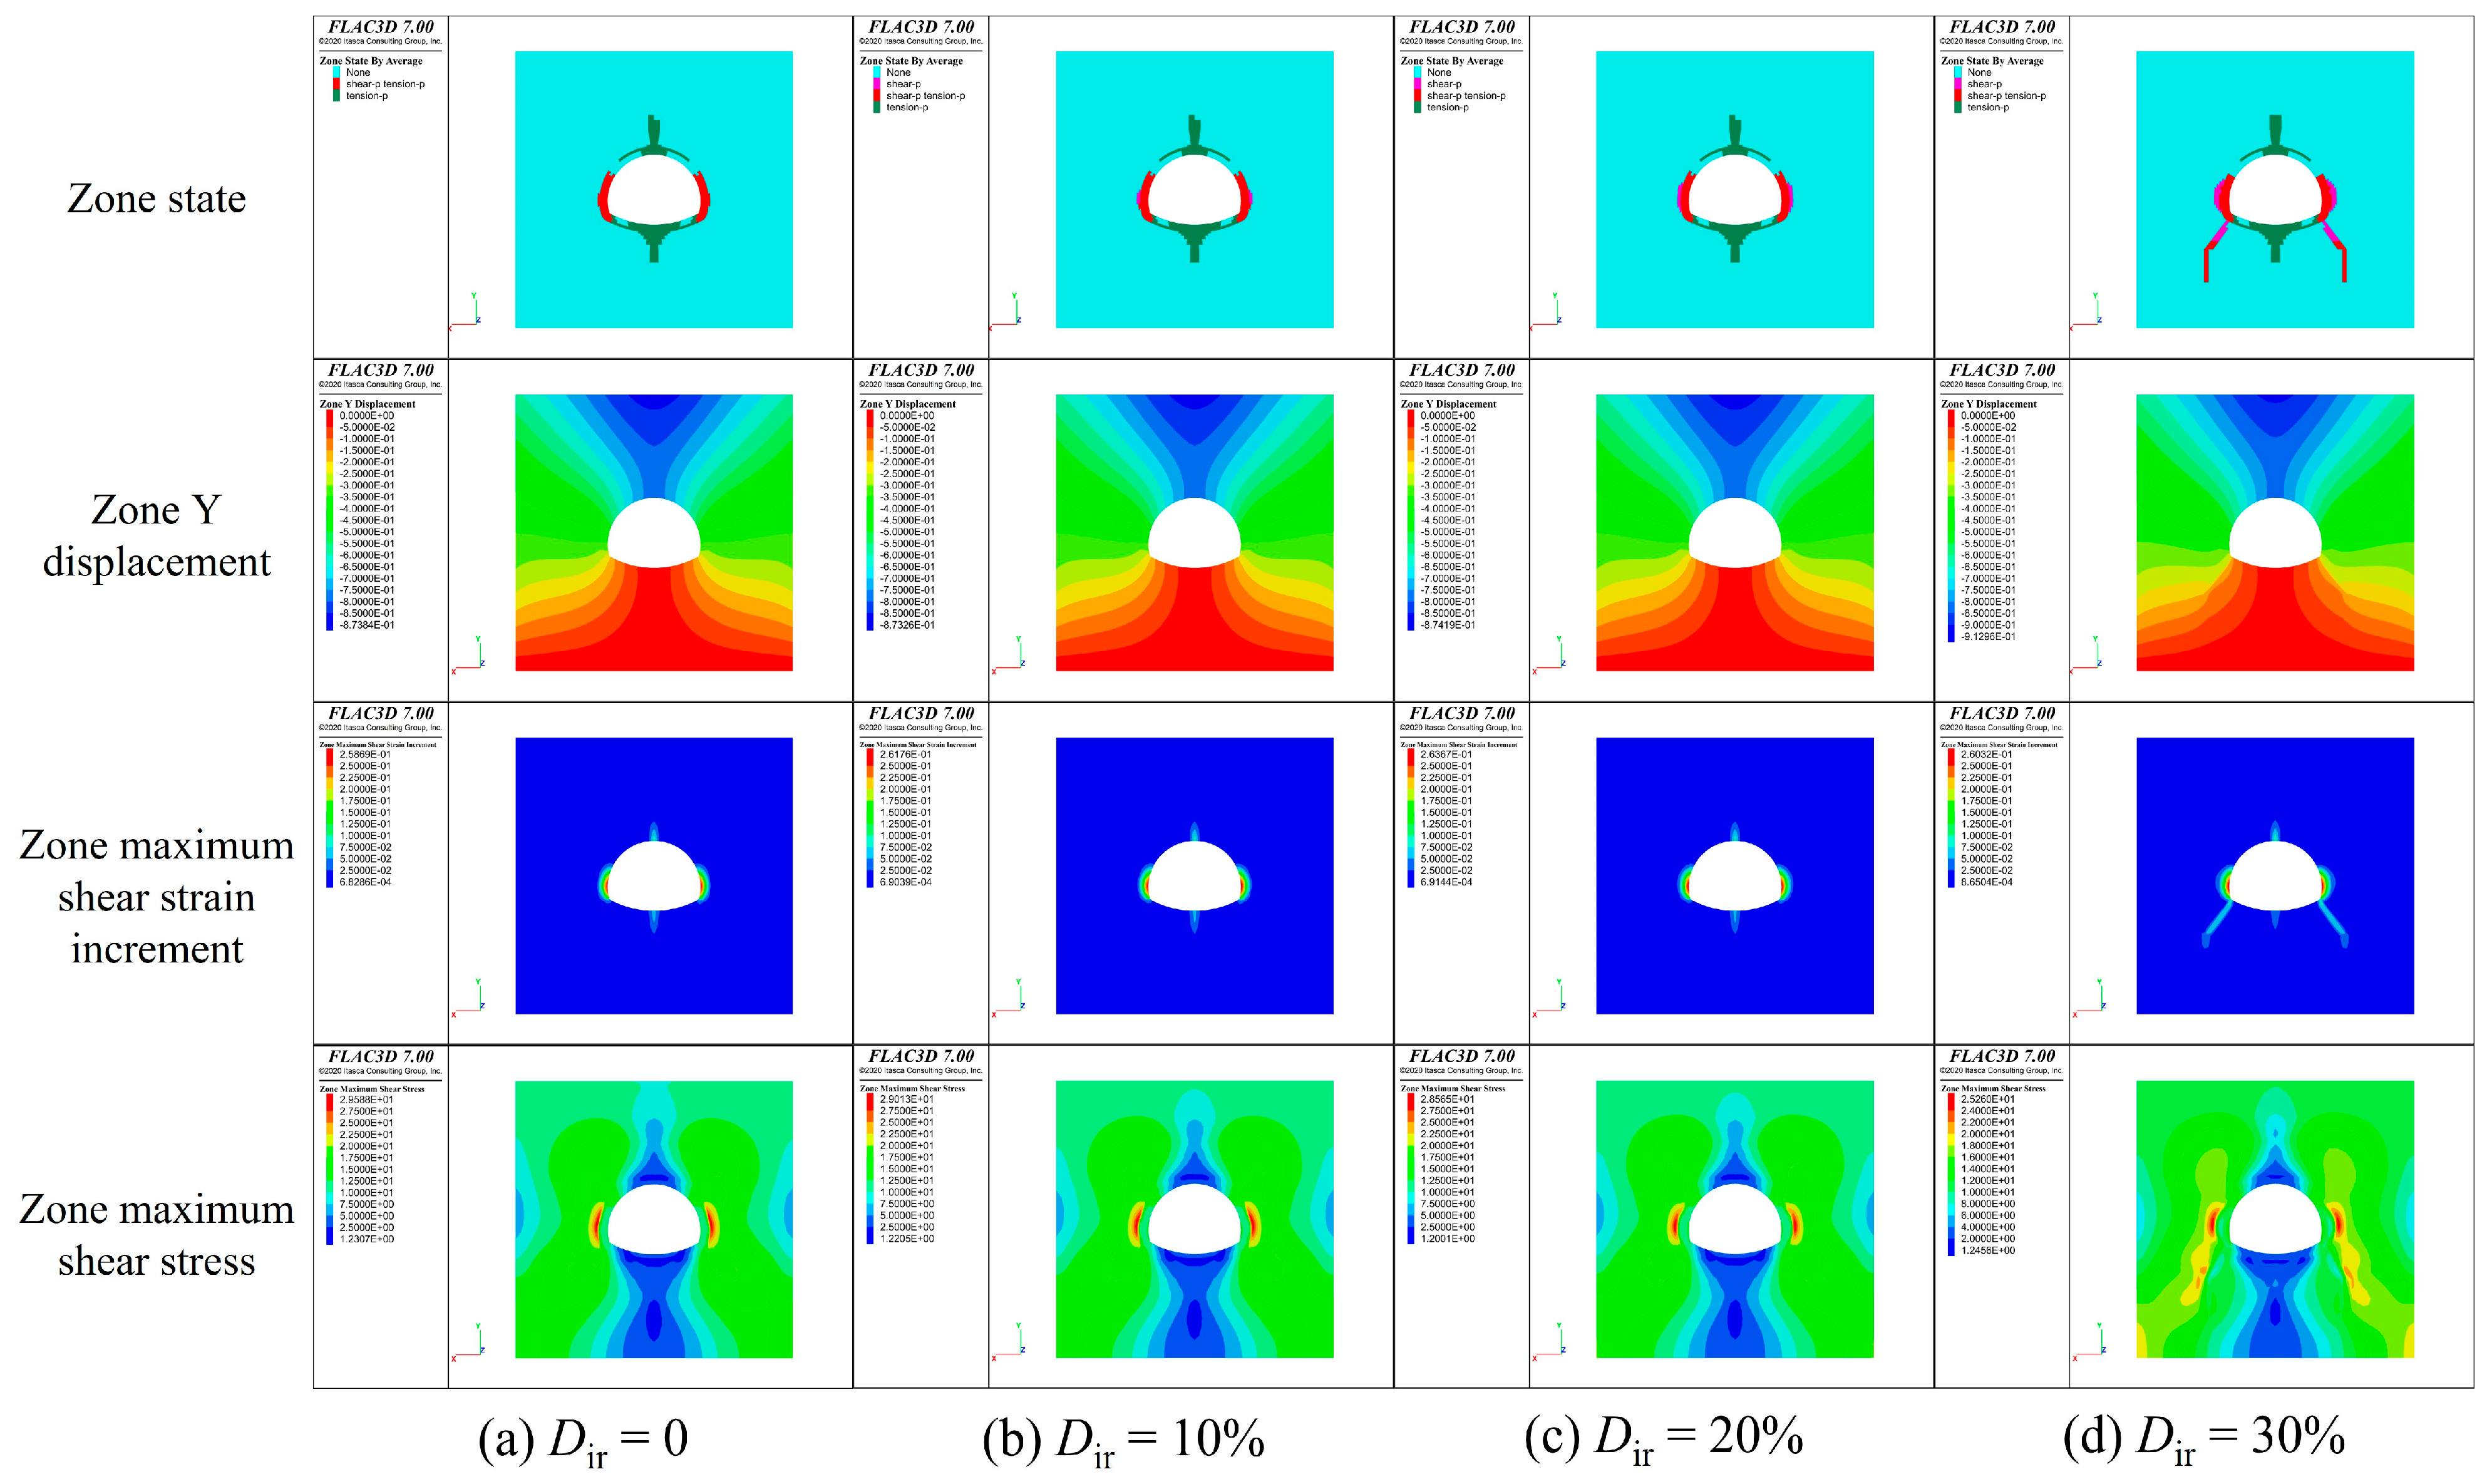
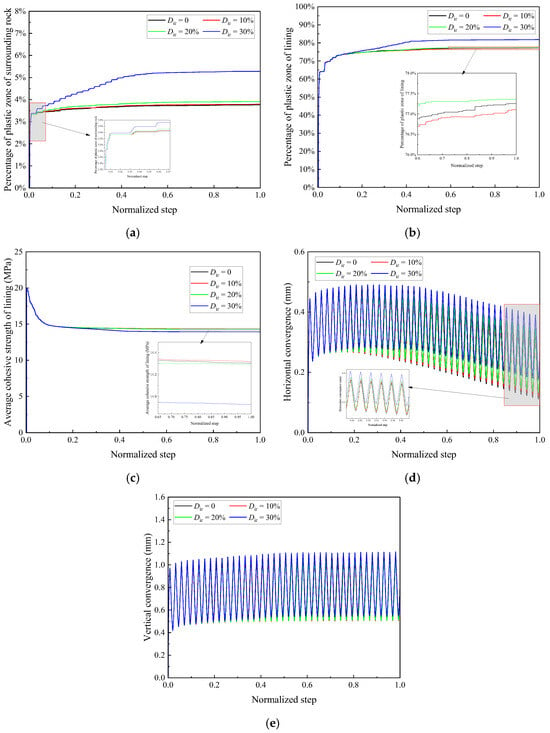
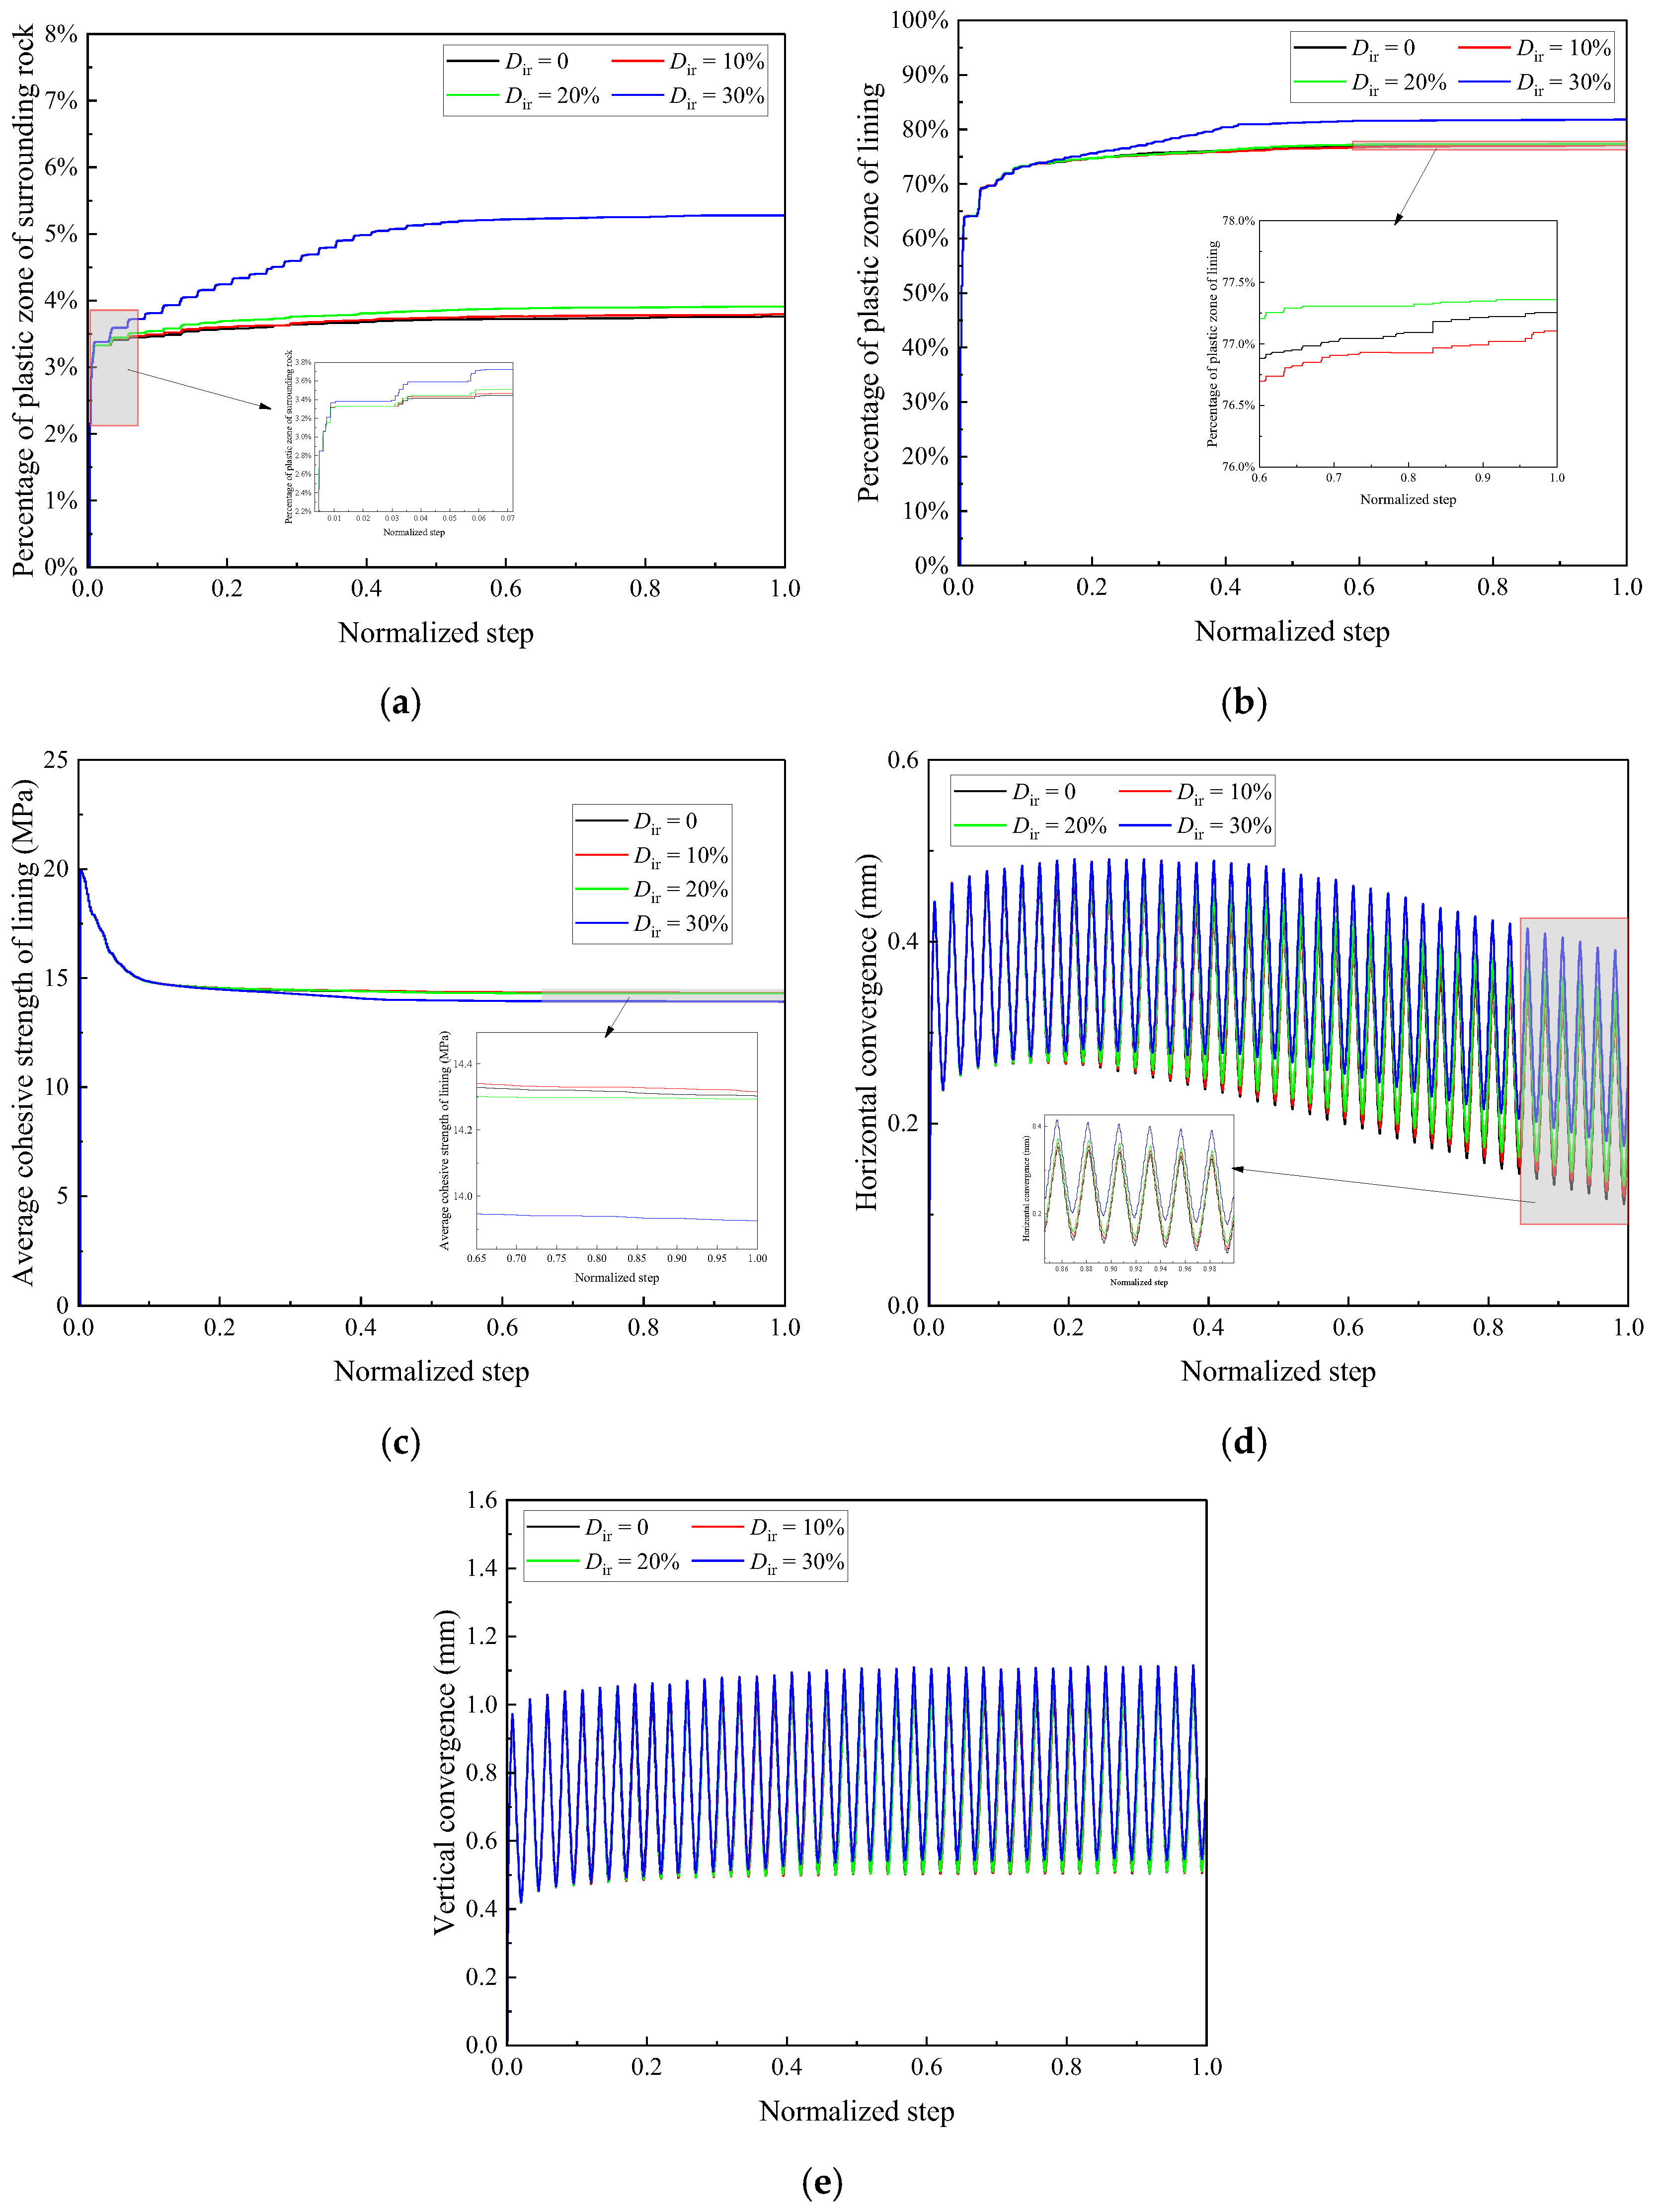
Figure 18 shows the final state, axial displacement, maximum shear strain increment and maximum shear stress for different initial surrounding-rock deterioration degrees, Dir. At Dir = 30%, yielding near the arch waist was accompanied by more extensive plastic zones extending from the arch foot into the surrounding rock. The plastic-zone histories in Figure 19a,b also showed a stronger response at Dir = 30% than at the lower sampled levels. The final lining plastic-zone fraction remained close to 77% for Dir = 0–20%, increasing from 77.361% at Dir = 20% to 81.829% at Dir = 30%. This 4.468% difference identifies a more pronounced response between the two sampled levels. The sampling does not locate a critical deterioration threshold within that interval.
Figure 18.
Contour maps of state, axial displacement, maximum shear strain increment, and maximum shear stress of samples with different initial deterioration degrees of surrounding rock (Dir): (a) Dir = 0, (b) Dir = 10%, (c) Dir = 20%, (d) Dir = 30%.
Figure 19.
Evolution of (a) percentage of plastic zone of surrounding rock, (b) percentage of plastic zone of lining, (c) average cohesive strength of lining, (d) horizontal convergence, and (e) vertical convergence of samples with different Dir.
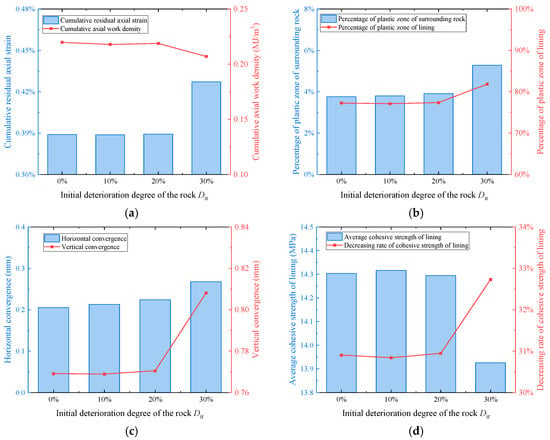
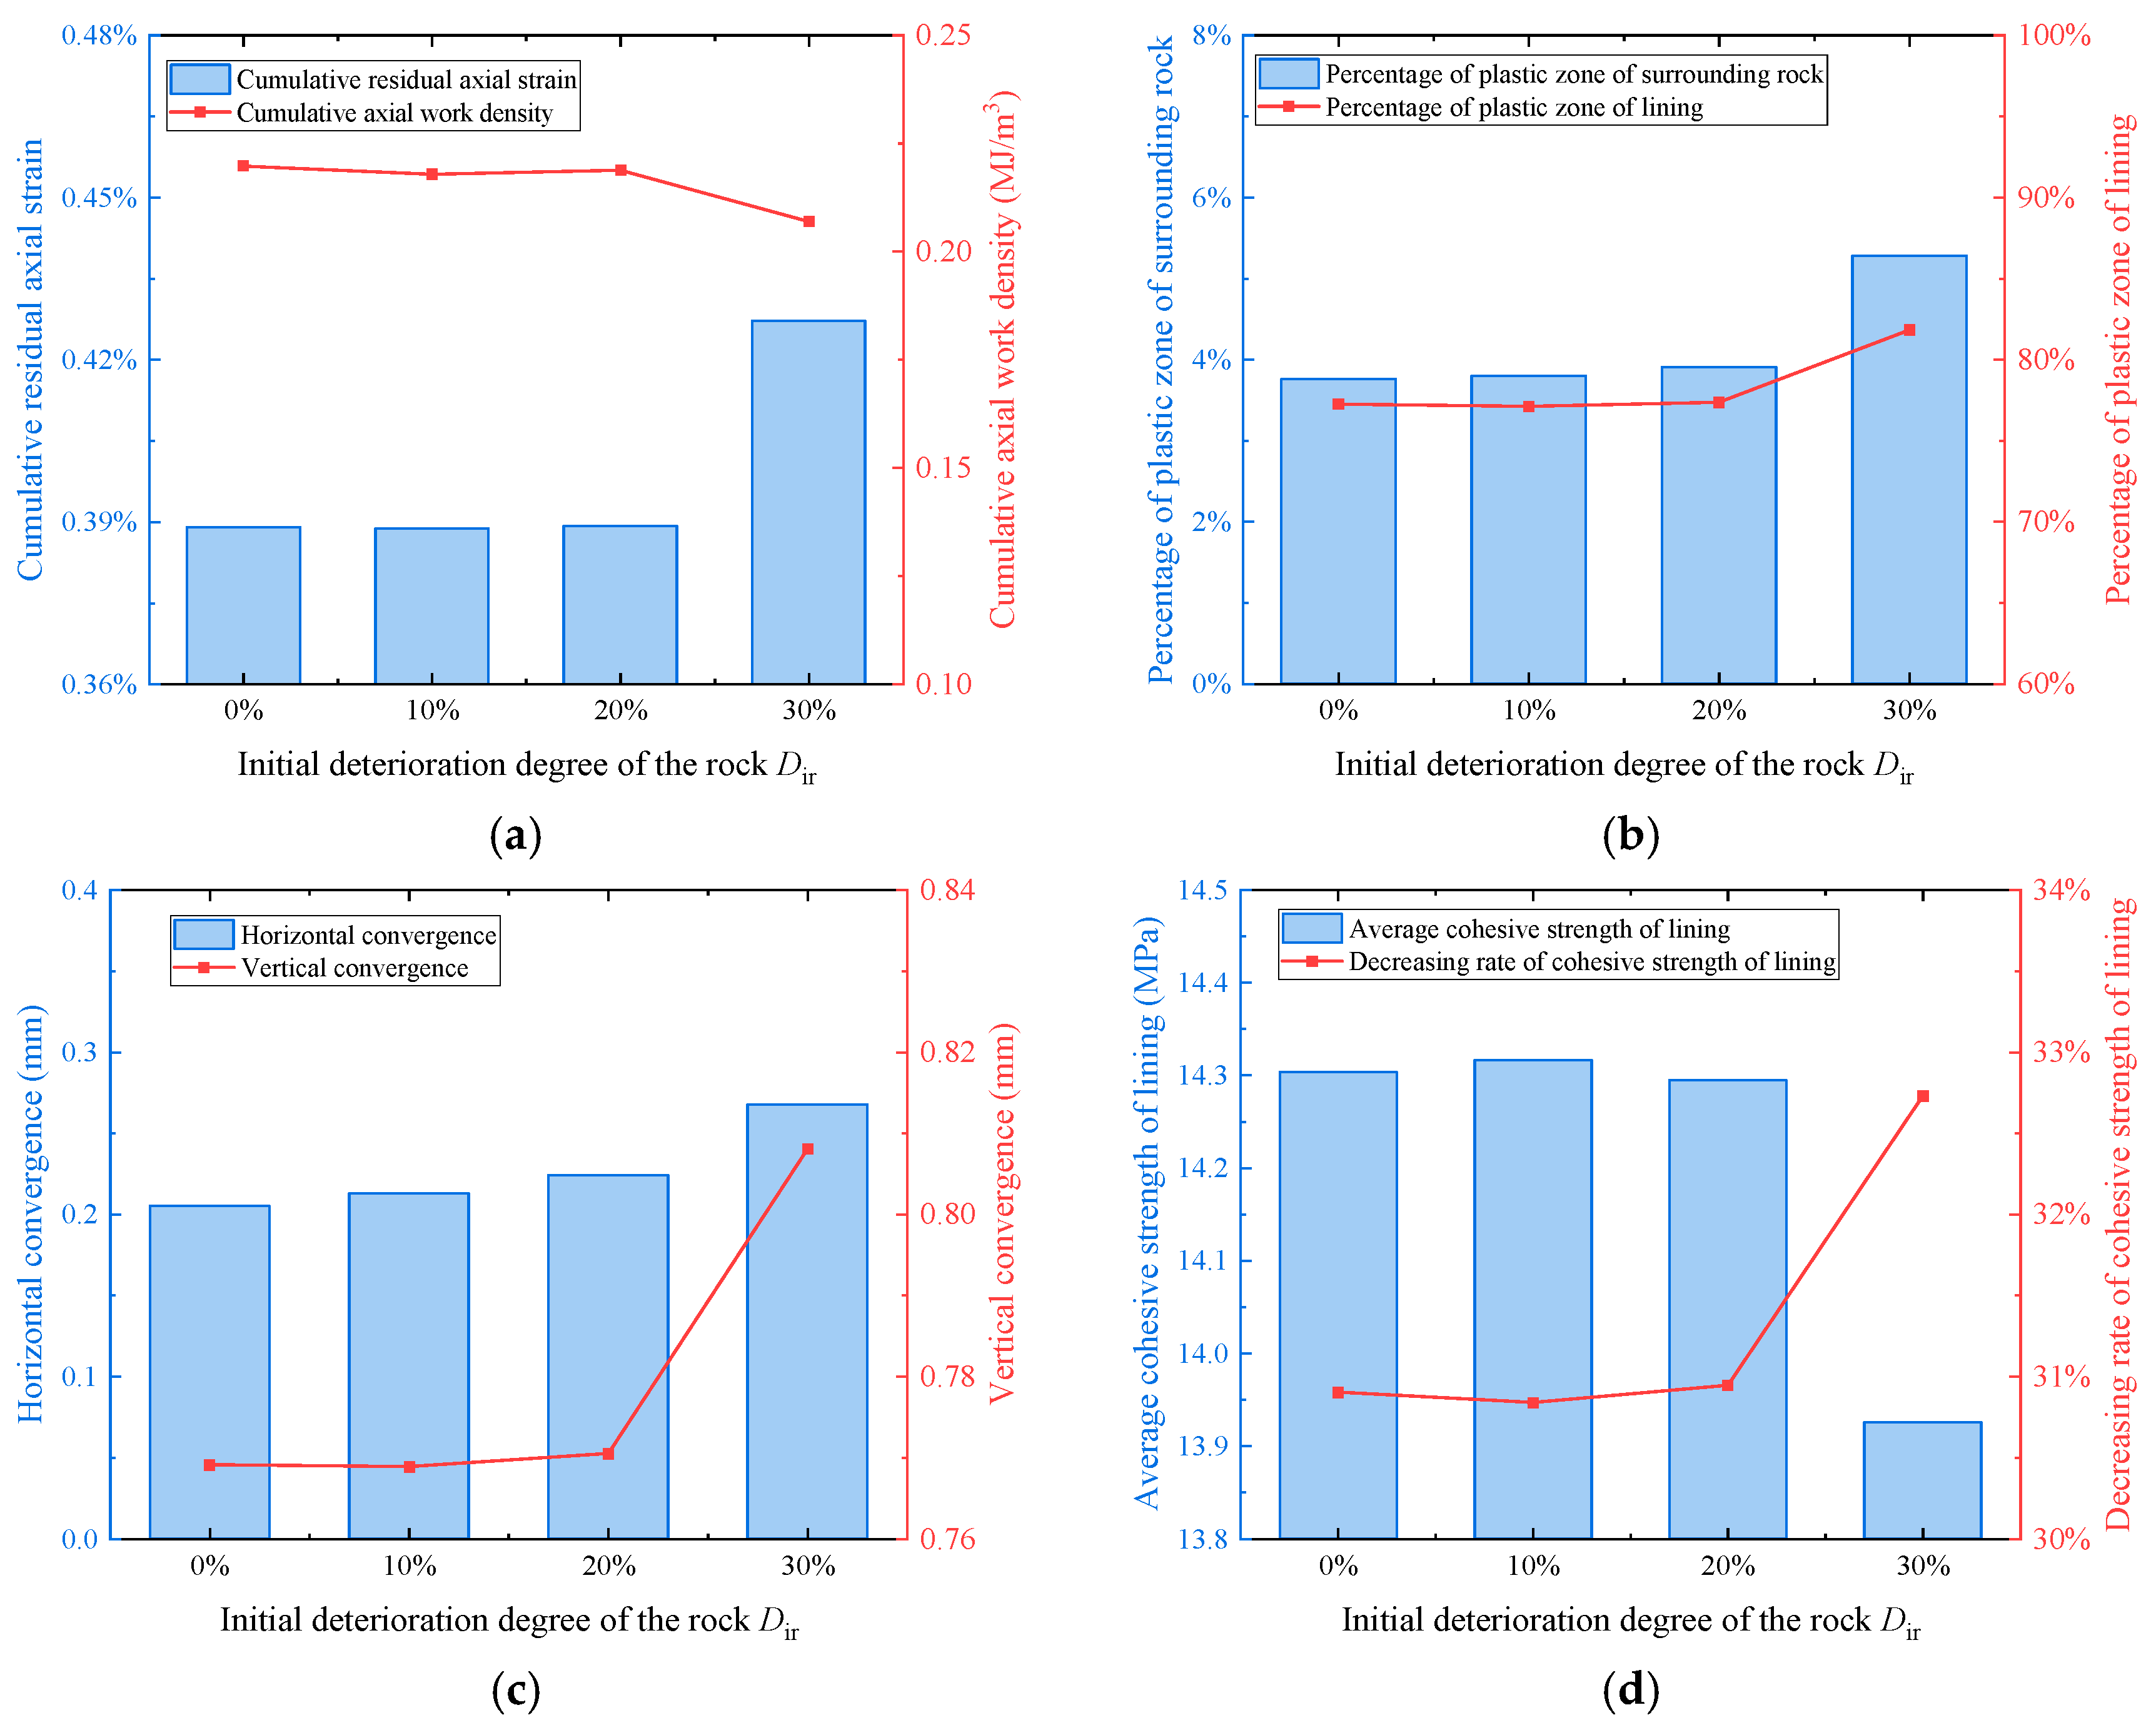
The surrounding-rock deterioration series showed greater residual deformation at Dir = 30% (Figure 20a,c). Cumulative residual axial strain increased from 0.389% at Dir = 0% to 0.427% at Dir = 30%. Over the same interval, horizontal convergence increased from 0.205 to 0.268 mm, while vertical convergence increased from 0.769 to 0.808 mm. The cumulative axial work density decreased overall from 0.220 to 0.207 MJ/m3, with a small intermediate increase between Dir = 10% and 20% (Figure 20a). The axial work-density response therefore did not increase monotonically with surrounding-rock deterioration.
Figure 20.
Effects of Dir on (a) cumulative residual axial strain and cumulative axial work density (MJ/m3), (b) plastic-zone fractions of the surrounding rock and lining, (c) horizontal and vertical convergence, and (d) average lining cohesion and its reduction ratio.
4. Weighted Multi-Indicator Relative Stability Assessment
The assessment framework combines deformation, plastic yielding and lining strength reduction to compare the investigated numerical cases. Five indicators are considered: vertical convergence (Δv), horizontal convergence (Δh), lining yielded-zone-count fraction (Pl), surrounding-rock yielded-zone-count fraction (Pr), and lining cohesion-loss ratio (Dc). Pl and Pr retain the zone-count definition in Section 3.1 and are specific to the adopted discretization. Each is an adverse indicator, with a larger raw value denoting a less favorable mechanical response. The normalized score is therefore defined so that a larger value represents a more favorable relative condition:
where i denotes a numerical case and j an indicator. The extrema xmin,j and xmax,j are determined from the 11 cases that completed N = 40, excluding Case 4. Case 4 (20 MPa) reached a failed state, with large convergence, complete lining yielding and loss of numerical equilibrium at N = 21. Its terminal values remain in Table 3, but are excluded from normalization because they would dominate the ranges and compress differences among the completed cases. Its Stability Index is reported as N.A., with the state identified separately as Failed. An indicator with zero range would be omitted, and the remaining weights would be renormalized. The prescribed engineering weights are listed in Table 4 and expressed as:
Table 4.
Prescribed engineering weights for the weighted multi-indicator relative stability assessment.
The weights express the adopted engineering priorities of deformation control first, plastic-zone development second and strength degradation as an additional indicator. They are prescribed inputs to a weighted aggregation, rather than weights inferred from independent pairwise expert judgments. The resulting scores are conditional on these weights and the normalization reference set. For each of the 11 completed cases, the relative Stability Index is defined as:
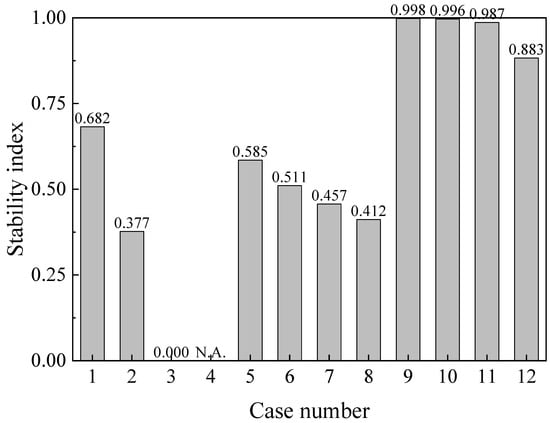
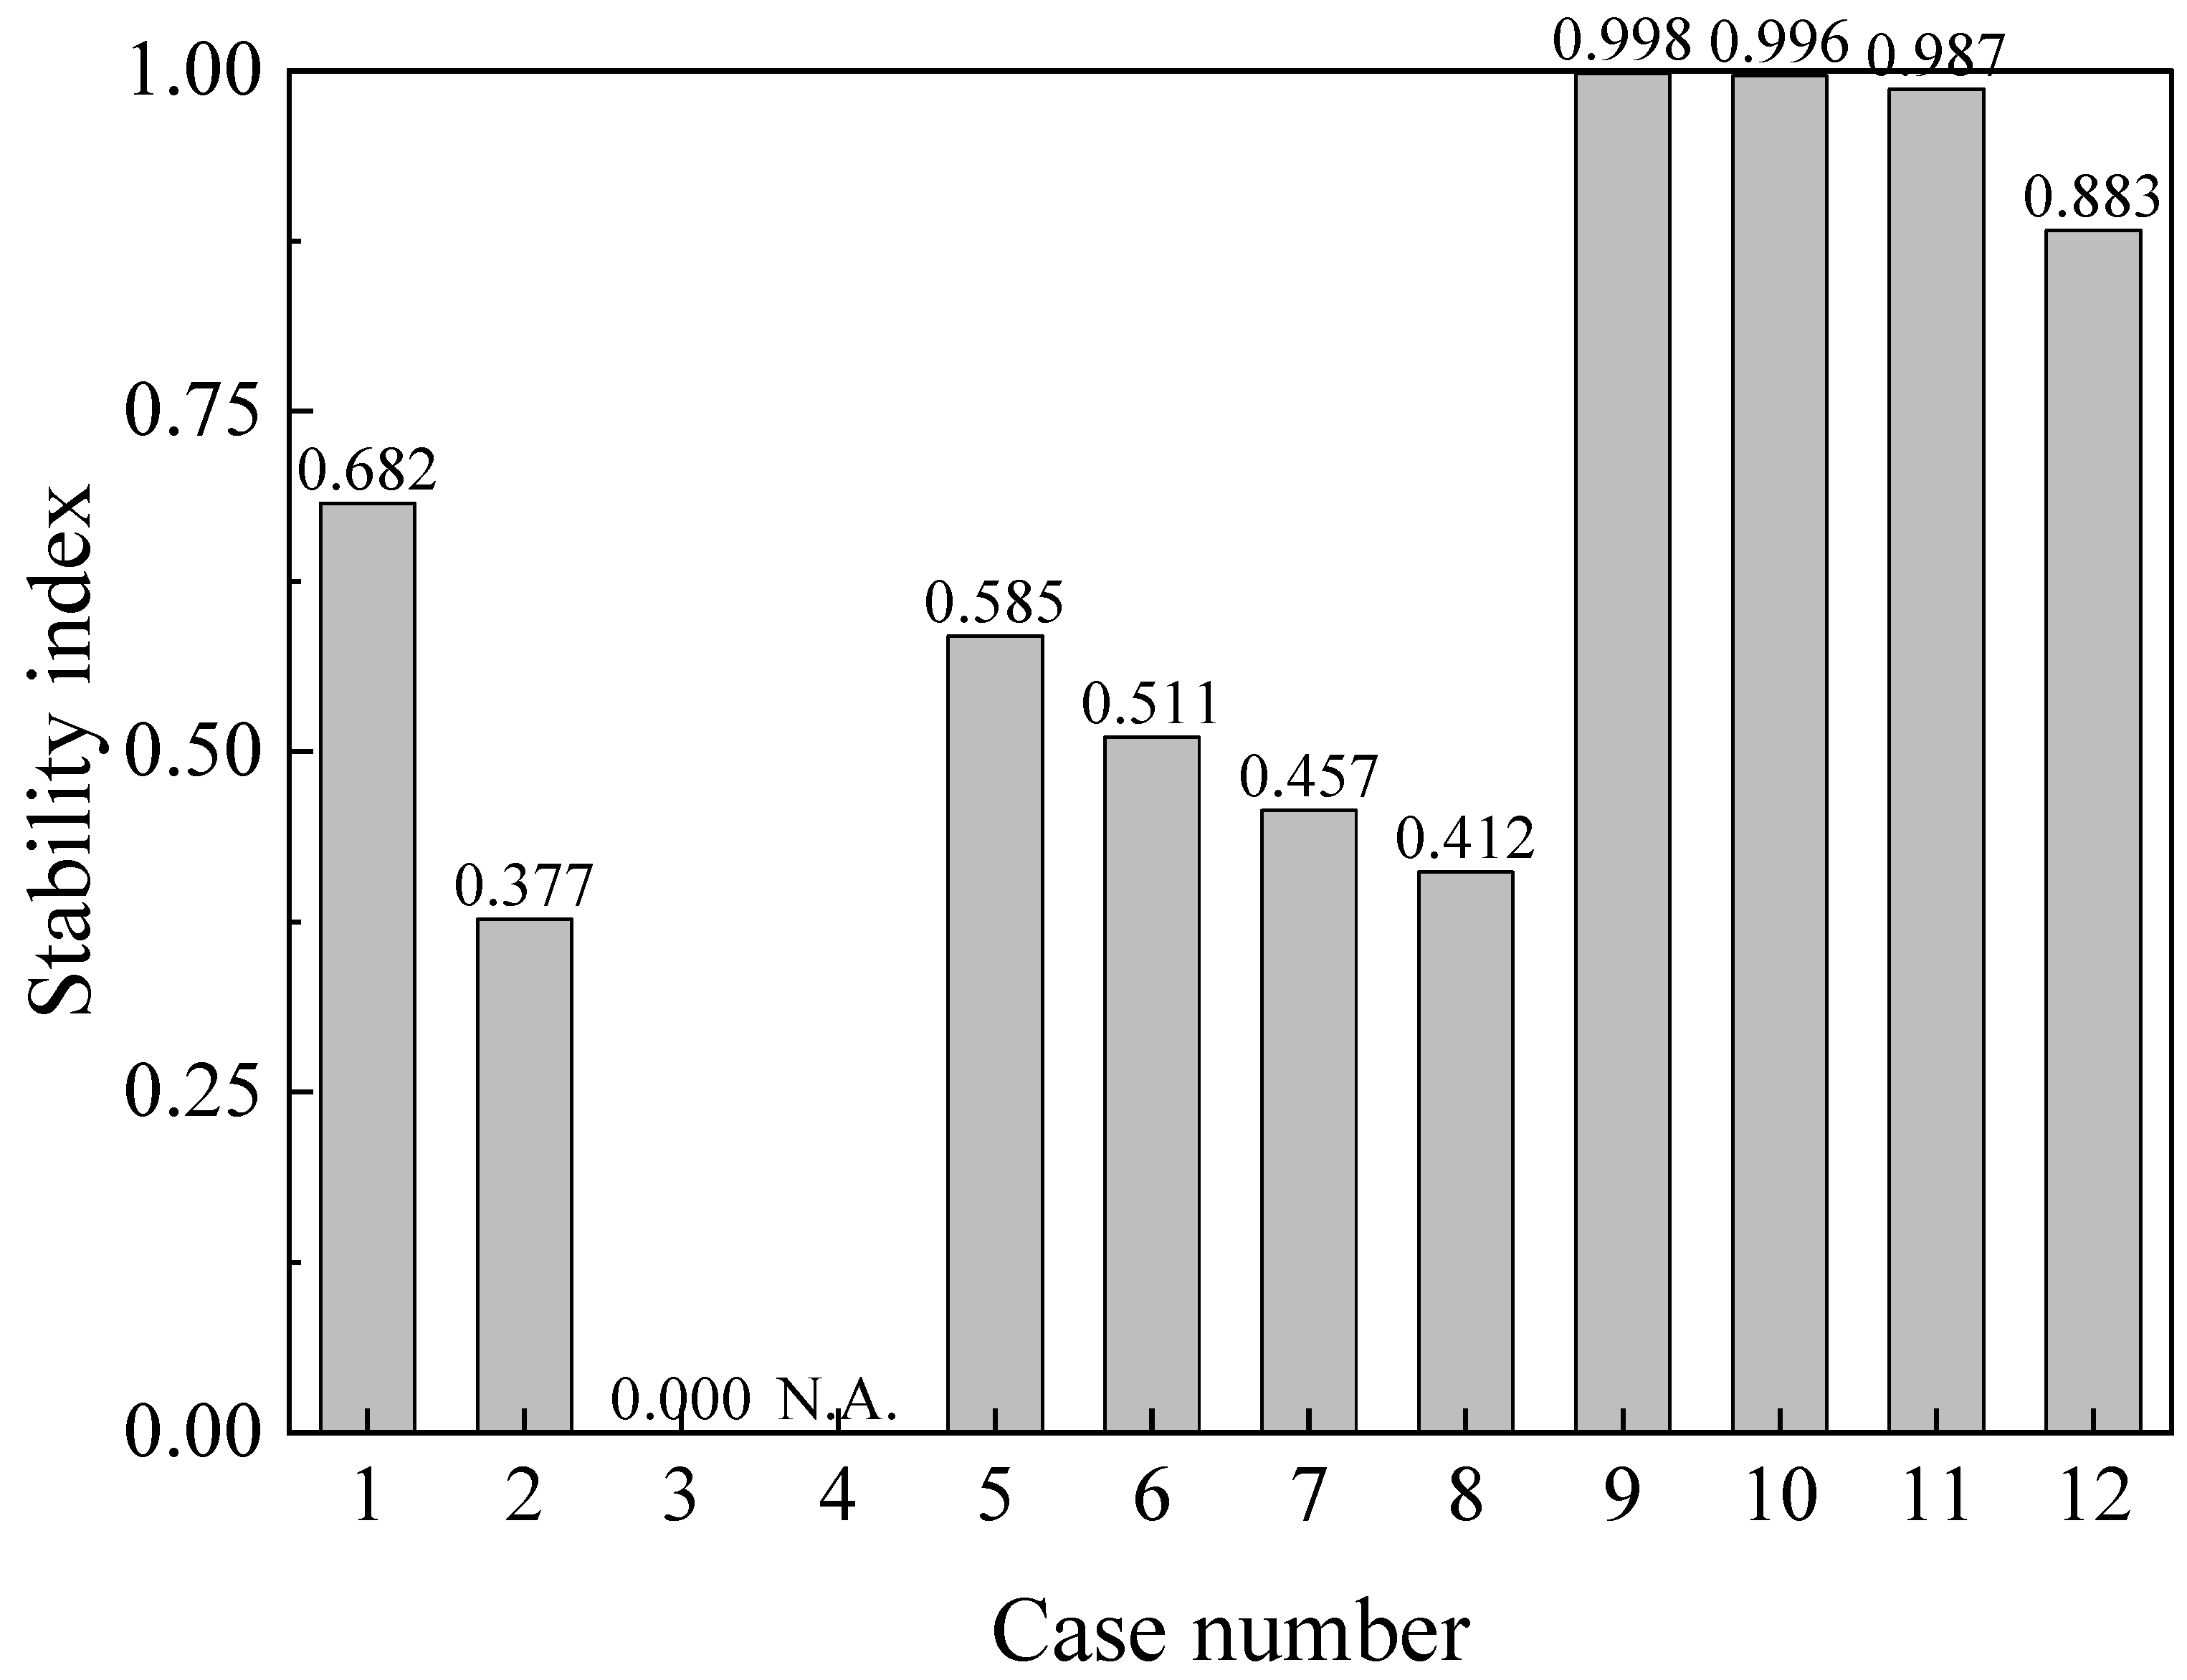
Within the 11-case reference set, a higher SI denotes a more favorable combination of the five responses. Case 3 has the largest value of every adverse indicator in this set and therefore receives SI = 0 by normalization; this relative minimum does not identify a failed state. Case 4 is reported separately as Failed/N.A. and has no numerical SI. Table 5 and Figure 21 distinguish calculated scores from this failure classification. SI is neither a failure probability nor a factor of safety, and safety or warning limits require independent calibration. Because Pl and Pr are count-based indicators, the composite SI remains specific to the adopted discretization.
Table 5.
Normalized indicator scores and relative Stability Index for 11 completed cases, with Case 4 reported separately as Failed/N.A.
Figure 21.
Relative Stability Index calculated with prescribed engineering weights. Cases 1–3 and 5–12 use common extrema from these 11 cases at N = 40. Case 4 is excluded from normalization and labeled N.A. for its failed state at N = 21; it has no numerical SI.
In the amplitude series, the computed SI decreases from 0.6824 to 0.3769 and 0.0000 as Δσn increases from 5 to 10 and 15 MPa, respectively, at N = 40. This trend reflects increasing convergence, yielded-zone-count fractions and lining cohesion loss. At 20 MPa, Case 4 reaches the failed state at N = 21 and is reported as Failed/N.A. Its much larger deformation, complete lining yielding and cohesion-loss ratio of 0.40 remain reported in Table 3, but do not determine the normalization ranges.
Within the lining-deterioration series, larger Di was associated with greater convergence, larger plastic-zone fractions and a higher lining cohesion-loss ratio; SI decreased from 0.5851 at Di = 10% to 0.4116 at Di = 40%. In the surrounding-rock series, SI values were 0.9979, 0.9963, 0.9865 and 0.8826 for Dir = 0%, 10%, 20% and 30%, respectively. These comparisons describe each factor over its sampled range and reference conditions. They do not establish a global ranking of factor importance or quantify interactions among cyclic stress amplitude and the two deterioration indices.
The comparative assessment can help prioritize numerical cases for closer investigation and connect several mechanical responses within one framework. Its engineering interpretation should be considered alongside lining-condition surveys, convergence monitoring and the relevant tunnel design criteria. Decisions on reinforcement and disturbance control then require evaluation for the specific tunnel conditions.
5. Implications for Tunnel Reconstruction and Expansion Projects
The computed shear strain increments in Figure 12 concentrate near the vault at lower stress amplitudes and shift towards the arch waist and arch foot at higher amplitudes. These contours identify localized continuum deformation and help prioritize regions for inspection during tunnel reconstruction and expansion. Relevant design considerations include the lining condition, possible voids in the vault lining and the distribution of deformation. Reinforcement or grouting may be considered according to project-specific inspection and structural assessment.
Within the simulated surrounding-rock deterioration series, the increase in lining plastic-zone fraction from Dir = 20% to 30% was larger than that from 0% to 20%. This comparison highlights the sensitivity of the modeled lining response to the surrounding-rock condition across the sampled cases and supports assessing both components together. Site investigation and rock-mass characterization behind the lining can inform the selection and evaluation of support options for tunnel reconstruction and expansion.
6. Conclusions
- (1)
- Monotonic compression tests showed that greater initial lining deterioration reduced the peak axial stress and axial stiffness of the composite rock and lining specimens.
- (2)
- Incremental-static simulations of cyclic stress loading showed greater convergence and more extensive plastic-zone development at higher stress amplitudes. The localization of shear strain increments also shifted from the vault towards the arch waist and arch foot across the amplitude series.
- (3)
- Greater lining or surrounding-rock deterioration increased convergence and plastic-zone fractions within the respective simulated series. The larger change in lining plastic-zone fraction between Dir = 20% and 30% describes the response of the sampled cases.
- (4)
- The weighted five-indicator assessment framework integrates vertical and horizontal convergence, lining and surrounding-rock yielded-zone-count fractions, and lining cohesion loss. It provides a common basis for relative comparison among the 11 cases that completed the prescribed loading on the adopted discretization. Case 4 is reported separately as Failed/N.A.; the calculated zero for Case 3 denotes the minimum within the normalization reference set.
Future work will combine jointed-specimen tests and numerical modeling to examine how joint orientation, spacing, persistence, stiffness and strength influence deformation under cyclic stress. Particular attention will be given to joint opening and slip and their interaction with the surrounding rock and lining.
Author Contributions
Conceptualization, X.R. and X.Z.; methodology, X.R., X.Z. and M.H.; software, X.R., M.H. and X.D.; validation, X.Z. and G.S.; formal analysis, X.R. and M.H.; investigation, X.R., G.S., S.W. and P.L.; resources, G.S. and W.Q.; data curation, M.H. and X.D.; writing—original draft preparation, X.R. and M.H.; writing—review and editing, X.Z., G.S., M.H. and W.Q.; visualization, M.H. and X.D.; supervision, X.Z. and W.Q.; project administration, W.Q.; funding acquisition, W.Q. All authors have read and agreed to the published version of the manuscript.
Funding
This research was funded by the National Key Research and Development Program of China, grant number 2024YFF0507904.
Institutional Review Board Statement
Not applicable.
Informed Consent Statement
Not applicable.
Data Availability Statement
Data is contained within the article. Further inquiries can be directed to the corresponding author.
Conflicts of Interest
Authors Xiaogang Ren, Guangbin Shang, Shengxu Wang, and Peng Lu are employed by the companies Shandong Hi-Speed Infrastructure Construction Co., Ltd. and Shandong Hi-Speed South Ring Expressway Co., Ltd. The remaining authors declare that the research was conducted in the absence of any commercial or financial relationships that could be construed as a potential conflict of interest.
References
- Fu, Y.; Jiang, X.; Gu, H.; Zhang, L.; Sun, R.; Zhang, M.; Qiu, Y. Design indexes and control measure for highway subgrade widening and reconstruction: A review and prospect. Transp. Res. Rec. 2025, 2679, 1381–1402. [Google Scholar] [CrossRef] [Scilit]
- Zhu, X.; Liu, R.; Li, S.; Yu, L.; Yin, X. Unloading-induced activation mechanisms and slip characteristics of fine-sand-filled fractures under varying grouting conditions. Phys. Fluids 2025, 37, 054110. [Google Scholar] [CrossRef] [Scilit]
- Yang, F.; Zhang, C.; Zhou, H.; Liu, N.; Zhang, Y.; Azhar, M.U.; Dai, F. The long-term safety of a deeply buried soft rock tunnel lining under inside-to-outside seepage conditions. Tunn. Undergr. Space Technol. 2017, 67, 132–146. [Google Scholar] [CrossRef] [Scilit]
- Lu, F.; Wang, H.; Wang, L.; Zhao, K.; Zhang, J. Degradation law and service life prediction model of tunnel lining concrete suffered combined effects of sulfate attack and drying–wetting cycles. Materials 2022, 15, 4435. [Google Scholar] [CrossRef] [Scilit] [PubMed]
- Zhu, Y.; Zhou, J.; Zhang, B.; Wang, H.; Huang, M. Statistical analysis of major tunnel construction accidents in China from 2010 to 2020. Tunn. Undergr. Space Technol. 2022, 124, 104460. [Google Scholar] [CrossRef] [Scilit]
- Jiang, Y.; Wang, L.; Zhang, B.; Dai, X.; Ye, J.; Sun, B.; Liu, N.; Wang, Z.; Zhao, Y. Tunnel lining detection and retrofitting. Autom. Constr. 2023, 152, 104881. [Google Scholar] [CrossRef] [Scilit]
- Yuan, J.; Zhang, Z.; Fu, Q.; Wang, Y.; Niu, D. Ion corrosion behavior of tunnel lining concrete in complex underground salt environment. J. Mater. Res. Technol. 2023, 24, 4875–4887. [Google Scholar] [CrossRef] [Scilit]
- Qian, W.; Wang, B.; Luo, D.; Xu, A.; Li, S. Experimental investigation and application on mechanical properties of tunnel linings under different blockage rates of drainage system in a karst tunnel. Tunn. Undergr. Space Technol. 2025, 157, 106359. [Google Scholar] [CrossRef] [Scilit]
- Zhang, Z.; Zhou, C.; Remennikov, A.; Wu, T.; Lu, S.; Xia, Y. Dynamic response and safety control of civil air defense tunnel under excavation blasting of subway tunnel. Tunn. Undergr. Space Technol. 2021, 112, 103879. [Google Scholar] [CrossRef] [Scilit]
- Xia, J.; Wang, B.; Guo, X.; Xie, Z. Vibration response and safety control for blasting vibration of the existing tunnel with defects. Undergr. Space 2024, 15, 76–89. [Google Scholar] [CrossRef] [Scilit]
- Rehman, J.U.; Park, D.; Ahn, J.K. Predicting blast-induced damage and dynamic response of drill-and-blast tunnel using three-dimensional finite element analysis. Appl. Sci. 2024, 14, 6152. [Google Scholar] [CrossRef] [Scilit]
- Song, W.; Lai, H.; Liu, Y.; Yang, W.; Zhu, Z. Field and laboratory study of cracking and safety of secondary lining for an existing highway tunnel in loess ground. Tunn. Undergr. Space Technol. 2019, 88, 35–46. [Google Scholar] [CrossRef] [Scilit]
- Liu, S.; Shi, Y.; Sun, R.; Yang, J. Damage behavior and maintenance design of tunnel lining based on numerical evaluation. Eng. Fail. Anal. 2020, 109, 104209. [Google Scholar] [CrossRef] [Scilit]
- Xu, Q.; Zhang, S.; Li, P.; Liu, C.; Bao, T. Lining failure performance of highway tunnels induced by the drainage system deterioration. Eng. Fail. Anal. 2023, 149, 107236. [Google Scholar] [CrossRef] [Scilit]
- Qian, W.; Wang, B.; Tang, X.; Li, S.; Du, Z. Response characteristics and influence mechanism of lining structures under dual-indices blockage of longitudinal drainage pipe in karst tunnels. Eng. Fail. Anal. 2025, 185, 110399. [Google Scholar] [CrossRef] [Scilit]
- Wu, F.; Sheng, W.; Zhang, G.; Li, H.; Ren, Y.; Zhang, K.; Wang, C.; Sun, T. Research on the deformation and settlement characteristics of tunnel lining structures under repeated loads. Structures 2024, 63, 106366. [Google Scholar] [CrossRef] [Scilit]
- Li, L.; Cheng, L.; Liu, W.; Yu, X. Train-induced response of stiffness-degraded tunnel linings. Tunn. Undergr. Space Technol. 2024, 148, 105739. [Google Scholar] [CrossRef] [Scilit]
- Hong, Q.; Lai, H.; Zhou, Y. Experimental study on stress of large-section loess tunnel lining structure under cyclic loading and unloading. Chin. J. Geotech. Eng. 2025, 47, 2571–2580. [Google Scholar] [CrossRef]
- Liu, C.; Wu, B.; Li, R.; Wang, F.; Tang, Q. Fatigue Test on Heavy Haul Railway Tunnel Bottom Structure with Base Cavity. Front. Earth Sci. 2022, 10, 870710. [Google Scholar] [CrossRef] [Scilit]
- Brown, E.T. Risk assessment and management in underground rock engineering—An overview. J. Rock Mech. Geotech. Eng. 2012, 4, 193–204. [Google Scholar] [CrossRef] [Scilit]
- Sousa, R.L.; Einstein, H.H. Risk analysis during tunnel construction using Bayesian Networks: Porto Metro case study. Tunn. Undergr. Space Technol. 2012, 27, 86–100. [Google Scholar] [CrossRef] [Scilit]
- Hamrouni, A.; Dias, D.; Sbartai, B. Reliability analysis of shallow tunnels using the response surface methodology. Undergr. Space 2017, 2, 246–258. [Google Scholar] [CrossRef] [Scilit]
- Li, K.; Xiahou, X.; Huang, H.; Tang, L.; Huang, J.; Li, Q.; Feng, P. AHP-FSE-based risk assessment and mitigation for slurry balancing shield tunnel construction. J. Environ. Public Health 2022, 2022, 1666950. [Google Scholar] [CrossRef] [Scilit] [PubMed]
- Kim, J.; Kim, C.; Kim, G.; Kim, I.; Abbas, Q.; Lee, J. Probabilistic tunnel collapse risk evaluation model using analytical hierarchy process (AHP) and Delphi survey technique. Tunn. Undergr. Space Technol. 2022, 120, 104262. [Google Scholar] [CrossRef] [Scilit]
- Li, L.; Ni, B.; Zhang, S.; Qiang, Y.; Zhang, Z.; Zhou, L.; Liu, G.; Cheng, L. Tunnel collapse risk assessment based on improved quantitative theory III and EW-AHP coupling weight. Sci. Rep. 2022, 12, 16054. [Google Scholar] [CrossRef] [Scilit] [PubMed]
- Ou, X.; Wu, Y.; Wu, B.; Jiang, J.; Qiu, W. Dynamic Bayesian network for predicting tunnel-collapse risk in the case of incomplete data. J. Perform. Constr. Facil. 2022, 36, 04022034. [Google Scholar] [CrossRef] [Scilit]
- Wang, Z.; Jiang, T.; Li, Z. Risk assessment of underground tunnel engineering based on Pythagorean fuzzy sets and Bayesian networks. Buildings 2024, 14, 2897. [Google Scholar] [CrossRef] [Scilit]
- Zhang, K.; Zhang, Z.; Lan, Q. Dynamic responses and long-term damage evolution of tunnels in expansive strata under dynamic loads from high-speed trains. Transp. Geotech. 2024, 49, 101391. [Google Scholar] [CrossRef] [Scilit]
- Kong, H.Q.; Zhang, N. Risk assessment of water inrush accident during tunnel construction based on FAHP-I-TOPSIS. J. Clean. Prod. 2024, 449, 141744. [Google Scholar] [CrossRef] [Scilit]
- Zhao, W.; Gao, H.; Chen, W.; Liu, J.; Peng, W.; Zhou, S. Experimental study on similar materials for tunnel lining concrete in geomechanical model tests. Eng. Fail. Anal. 2023, 152, 107456. [Google Scholar] [CrossRef] [Scilit]
- Fan, X.; Yang, Z.; Li, K. Effects of the lining structure on mechanical and fracturing behaviors of four-arc shaped tunnels in a jointed rock mass under uniaxial compression. Theor. Appl. Fract. Mech. 2021, 112, 102887. [Google Scholar] [CrossRef] [Scilit]
- Itasca Software. Mohr–Coulomb Model. FLAC3D 7.0 Documentation. Available online: https://docs.itascacg.com/flac3d700/common/models/mohr/doc/modelmohr.html (accessed on 16 September 2026).
- Martin, C.D.; Chandler, N.A. The progressive fracture of Lac du Bonnet granite. Int. J. Rock Mech. Min. Sci. Geomech. Abstr. 1994, 31, 643–659. [Google Scholar] [CrossRef] [Scilit]
- Sakhno, I.; Sakhno, S. Control of floor heave with rock bolts-steel piles coupling support technology. Int. J. Coal Sci. Technol. 2026, 13, 44. [Google Scholar] [CrossRef] [Scilit]
- Sakhno, I.; Sakhno, S. Directional fracturing of rock by soundless chemical demolition agents. Heliyon 2024, 10, e26068. [Google Scholar] [CrossRef] [Scilit] [PubMed]

Disclaimer/Publisher’s Note: The statements, opinions and data contained in all publications are solely those of the individual author(s) and contributor(s) and not of MDPI and/or the editor(s). MDPI and/or the editor(s) disclaim responsibility for any injury to people or property resulting from any ideas, methods, instructions or products referred to in the content. |
© 2026 by the authors. Licensee MDPI, Basel, Switzerland. This article is an open access article distributed under the terms and conditions of the Creative Commons Attribution (CC BY) license.