


Abstract
Geomagnetically induced geoelectric fields can exhibit substantial spatial variability because regional subsurface electrical structures affect surface electromagnetic responses. This study characterized the induced geoelectric field across mainland China during the extreme geomagnetic storm of 10 May 2024, using observations from the China Geoelectric Network. We evaluated changes in field intensity, ratios between collinear short- and long-dipole measurements, and regional variations in polarization direction, with particular emphasis on the onset of the storm. The geoelectric response showed pronounced spatial heterogeneity, with substantial differences among stations during storm onset. At most stations, measurements from collinear short and long dipoles maintained consistent ratios, indicating stable local scaling between the two electrode configurations. In contrast, polarization directions inferred from the long-dipole measurements showed no uniform relationship with local land–sea orientations. High-density electrical exploration data further supported this interpretation. These findings indicate that local subsurface electrical structures play an important role in controlling geoelectric field measurements and their responses to geomagnetic disturbances. This study provides a quantitative assessment of storm-time geoelectric field variations across mainland China and establishes a basis for investigating regional electromagnetic phenomena associated with induced geoelectric fields.
1. Introduction
Characterizing geomagnetically induced geoelectric fields over large areas is essential for understanding how space-weather disturbances interact with the electrically heterogeneous subsurface of the Earth. Geomagnetic storms are large-scale disturbances caused by interactions between the solar wind and the Earth’s magnetosphere. During the main phase of a storm, the horizontal geomagnetic field may decrease markedly, particularly at mid- and low-latitude locations. Storm intensity is commonly described using geomagnetic indices such as the planetary K index (Kp), with Kp ≥ 5 indicating geomagnetic storm conditions. The timing of storm-related variations may differ by approximately 1–2 min among observation sites [1,2,3]. On 10 May 2024, the Earth experienced its most intense geomagnetic storm since 2004. The event produced pronounced geoelectric field variations at approximately 120 stations across mainland China, providing a valuable opportunity to investigate the spatial characteristics of the surface electromagnetic response.
Time-varying geomagnetic fields induce electric fields at the Earth’s surface [4,5,6]. Although storm-related magnetic disturbances can be detected worldwide, the corresponding geoelectric response is not spatially uniform. During intense storms, the amplitude and temporal evolution of geomagnetic and geoelectric disturbances can differ substantially [7,8,9]. Local heterogeneity and anisotropy can alter both the magnitude and polarization direction of the observed electric field, resulting in considerable differences between stations, even within the same region.
Geomagnetically induced electric fields are commonly estimated from observed or modeled magnetic-field variations using the Earth’s surface impedance, which describes the relationship between the horizontal magnetic and electric fields [10,11]. Magnetotelluric impedance data have therefore been used to reconstruct geoelectric field variations during geomagnetic disturbances [12]. Numerical models have also been developed to evaluate the spatial distribution and potential effects of induced electric fields and currents under different conductivity structures [13,14,15,16], demonstrating, in particular, the practical value of real-time observations for characterizing rapidly evolving geomagnetic disturbances. Nevertheless, many previous studies have relied primarily on modeled electric fields or conductivity structures. Direct comparisons based on simultaneous observations from a dense, large-scale geoelectric network remain comparatively limited. The consistency of measurements obtained using different dipole lengths and the relationship between electric-field polarization and local subsurface structure also require further investigation.
In this study, we analyze geoelectric field observations recorded during the extreme geomagnetic storm of 10 May 2024, which occurred during Solar Cycle 25. Information on the storm was obtained from the Space Environment Prediction Center, and the geoelectric observations were examined together with the horizontal and vertical magnetic-field components recorded at geomagnetic relative-observation stations in China. The study aims to quantify regional variations in geoelectric field intensity, compare measurements from collinear short and long dipoles, characterize changes in electric-field polarization, and evaluate the influence of local subsurface electrical structure. The results reveal pronounced station-to-station differences in the induced geoelectric field. Measurements from collinear short and long dipoles generally maintain consistent ratios, whereas the polarization directions derived from long-dipole measurements show no uniform relationship with local land–sea orientations. Together with the high-density electrical survey results, these observations indicate that local subsurface electrical structure plays an important role in controlling the measured geoelectric response to geomagnetic disturbances.
2. Materials and Methods
2.1. Study Design and Observation Period
This observational study examined the geoelectric response across mainland China during the extreme geomagnetic storm of 10 May 2024. Geoelectric records from the China Geoelectric Network were evaluated together with geomagnetic observations and global geomagnetic indices. The analysis comprised four steps: identification of storm-related signals, calculation of the storm-onset amplitude, comparison of measurements from collinear short and long dipoles, and characterization of horizontal electric-field polarization. The same analysis procedure was applied to all stations for which valid observations were available during the study interval.
2.2. China Geoelectric Network and Instrumentation
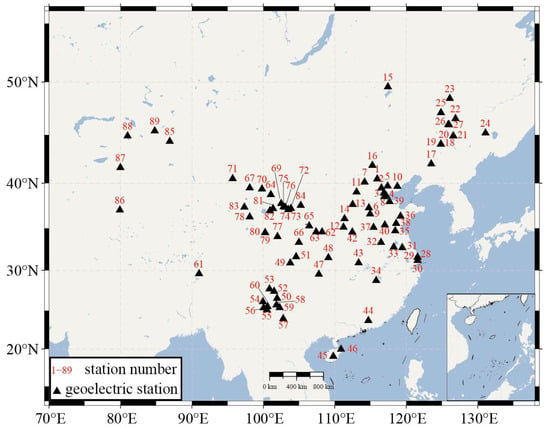
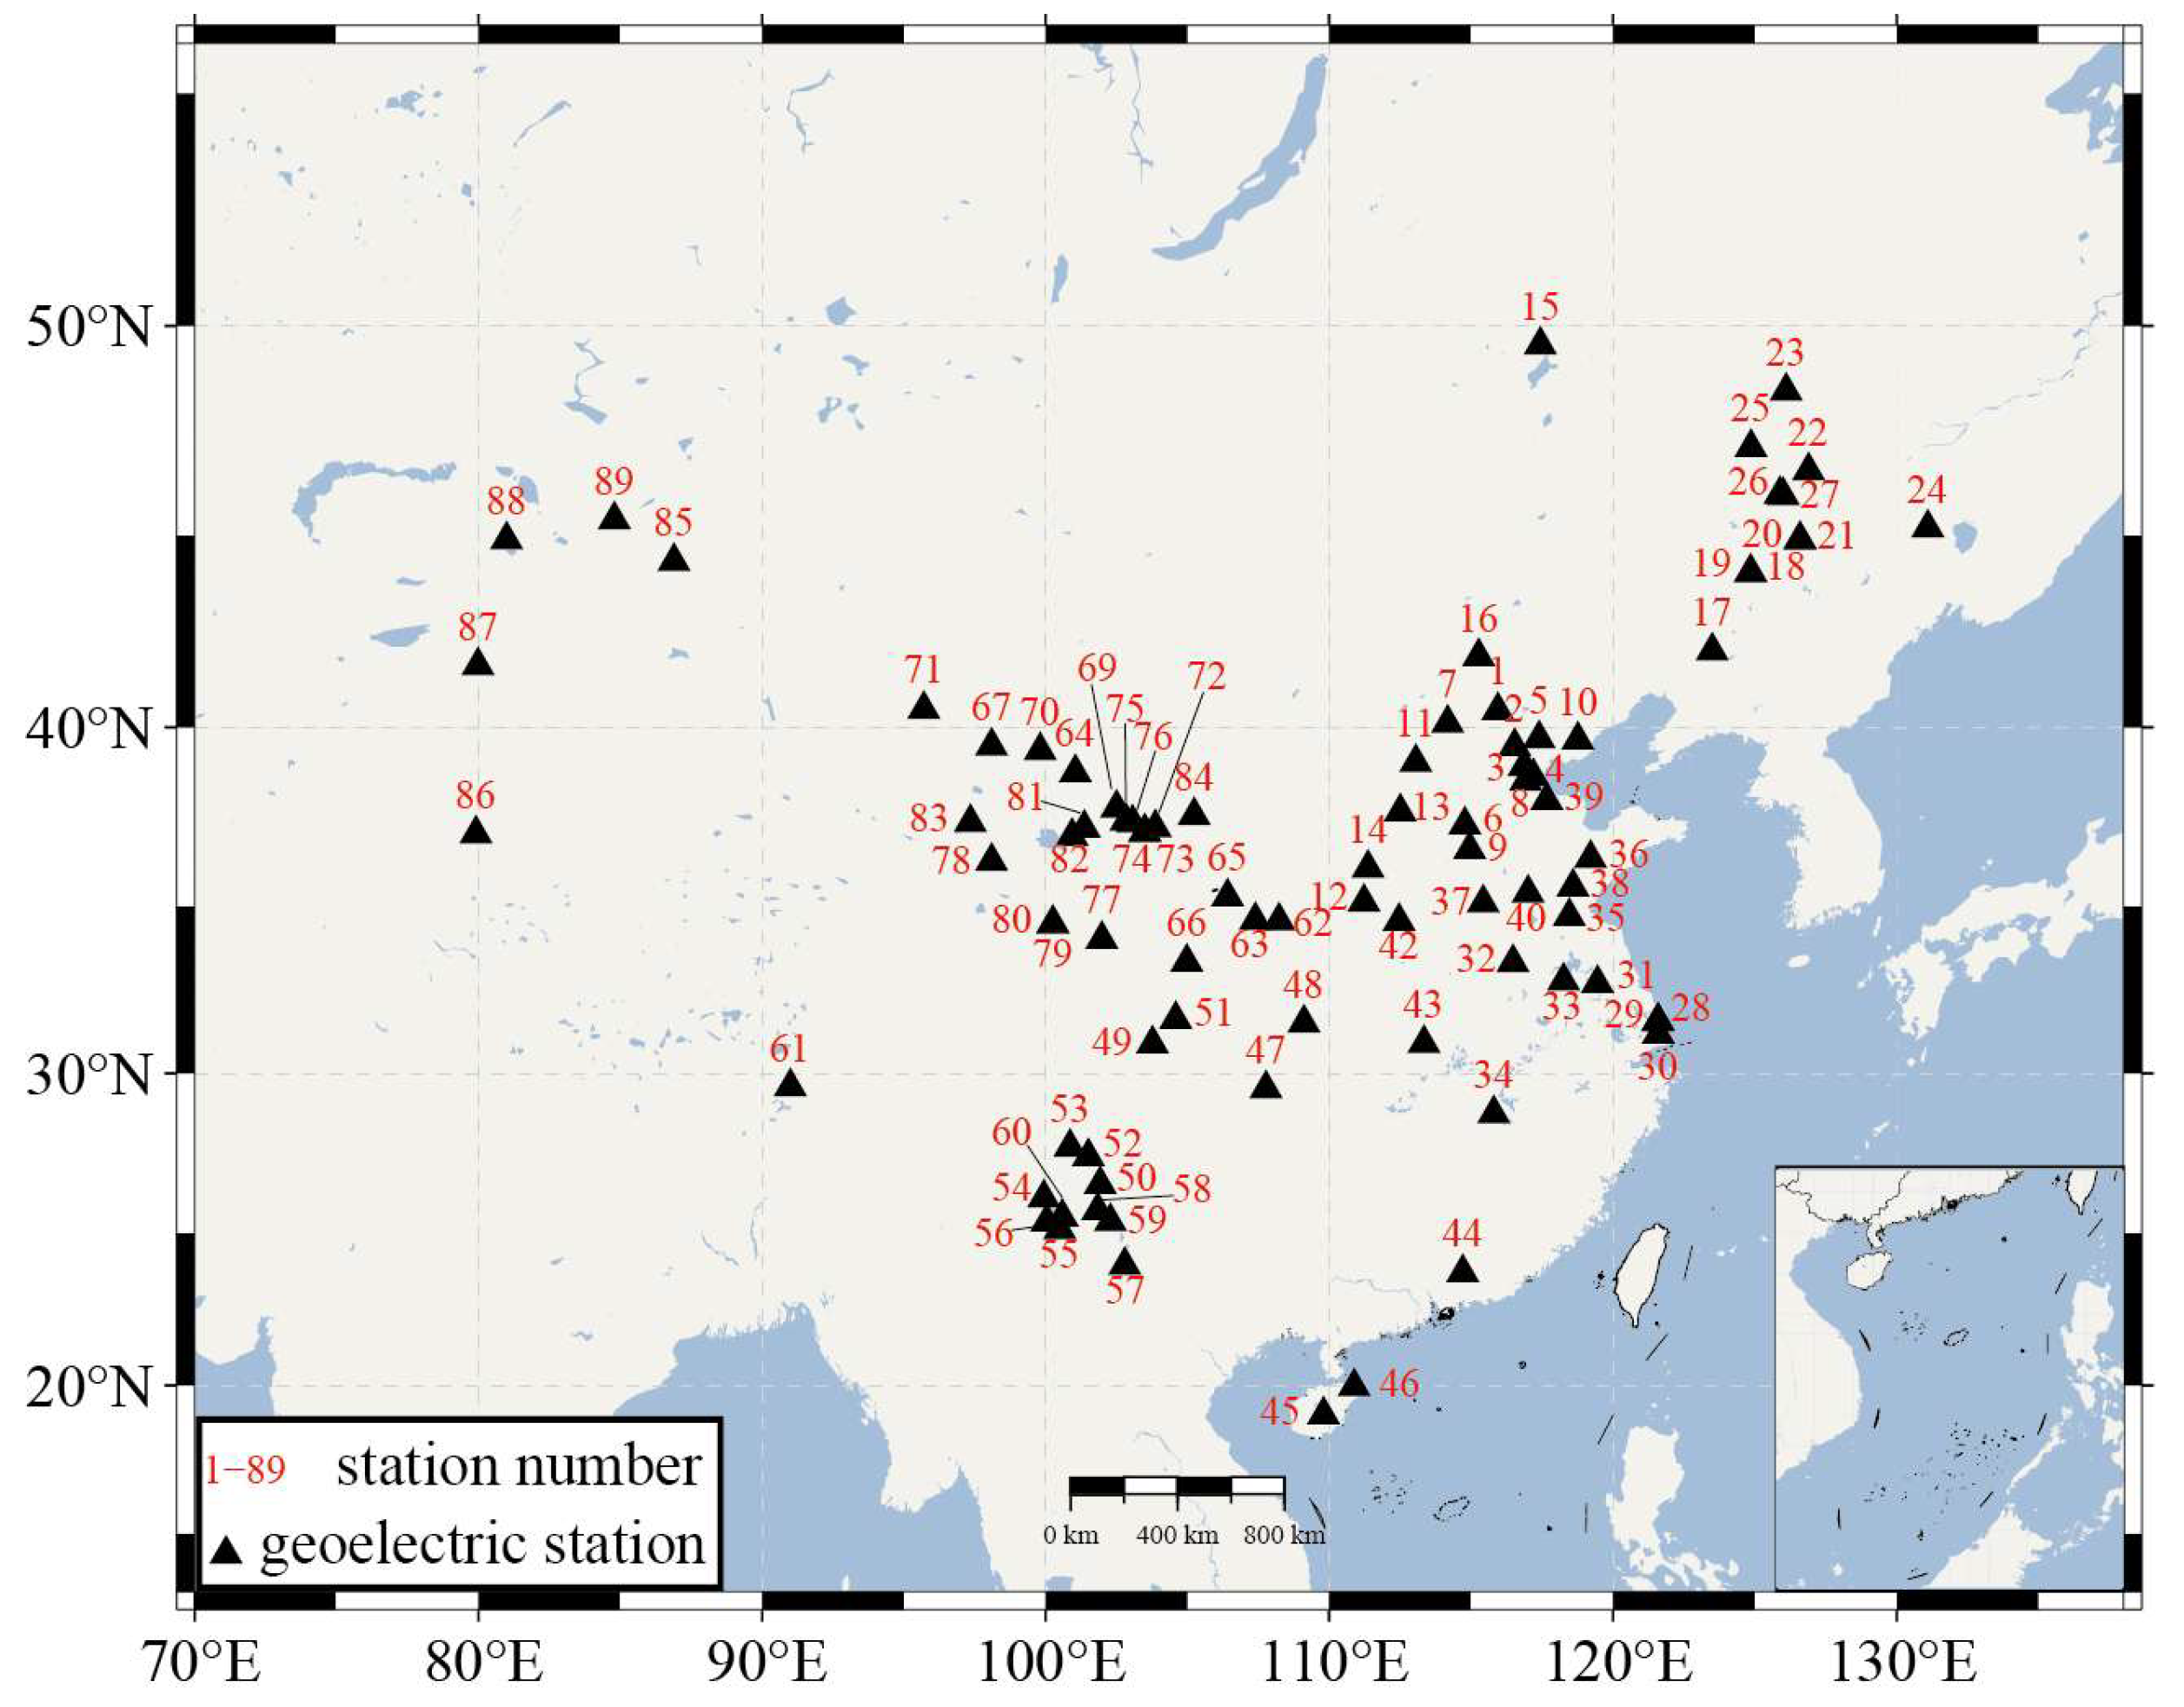
By 2024, the China Geoelectric Network comprised approximately 120 stations distributed across mainland China, as shown in Figure 1 and Table 1. The network used two types of geoelectric field instruments, ZD9A and GEF (Both sets of instruments are manufactured by the Institute of Earthquake Forecasting, China Earthquake Administration, Beijing, China). Both instrument types followed the same measurement principle and used equivalent probes and operating parameters. Both observation instruments feature six measurement channels, each with a sampling rate of once per minute per channel, and provide second-resolution potential difference data; their resolution is 0.01 mV; the effective observation frequency bands are DC–0.1 Hz, respectively, and both support AC and DC power inputs [17,18]. In the observations, Pb-PbCl2 was used for data acquisition; this electrode features low noise, a low temperature coefficient, and long-term stability [19,20].
Figure 1.
Distribution of the geoelectric stations across China. The network comprises approximately 120 stations, 89 of which detected the sudden commencement of the geomagnetic storm on 10 May 2024. The distribution and details of these stations are provided in Table 1, which matches the station numbers shown in Figure 1 with the corresponding station names.
Table 1.
Station identifiers and names.
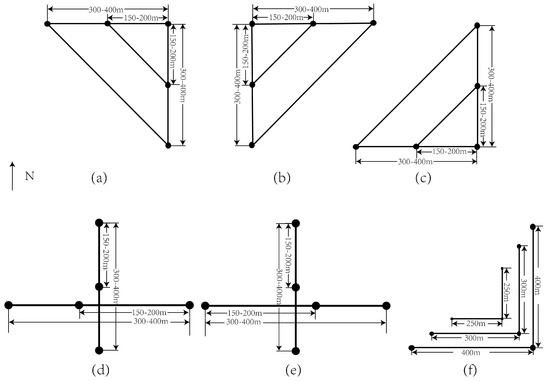
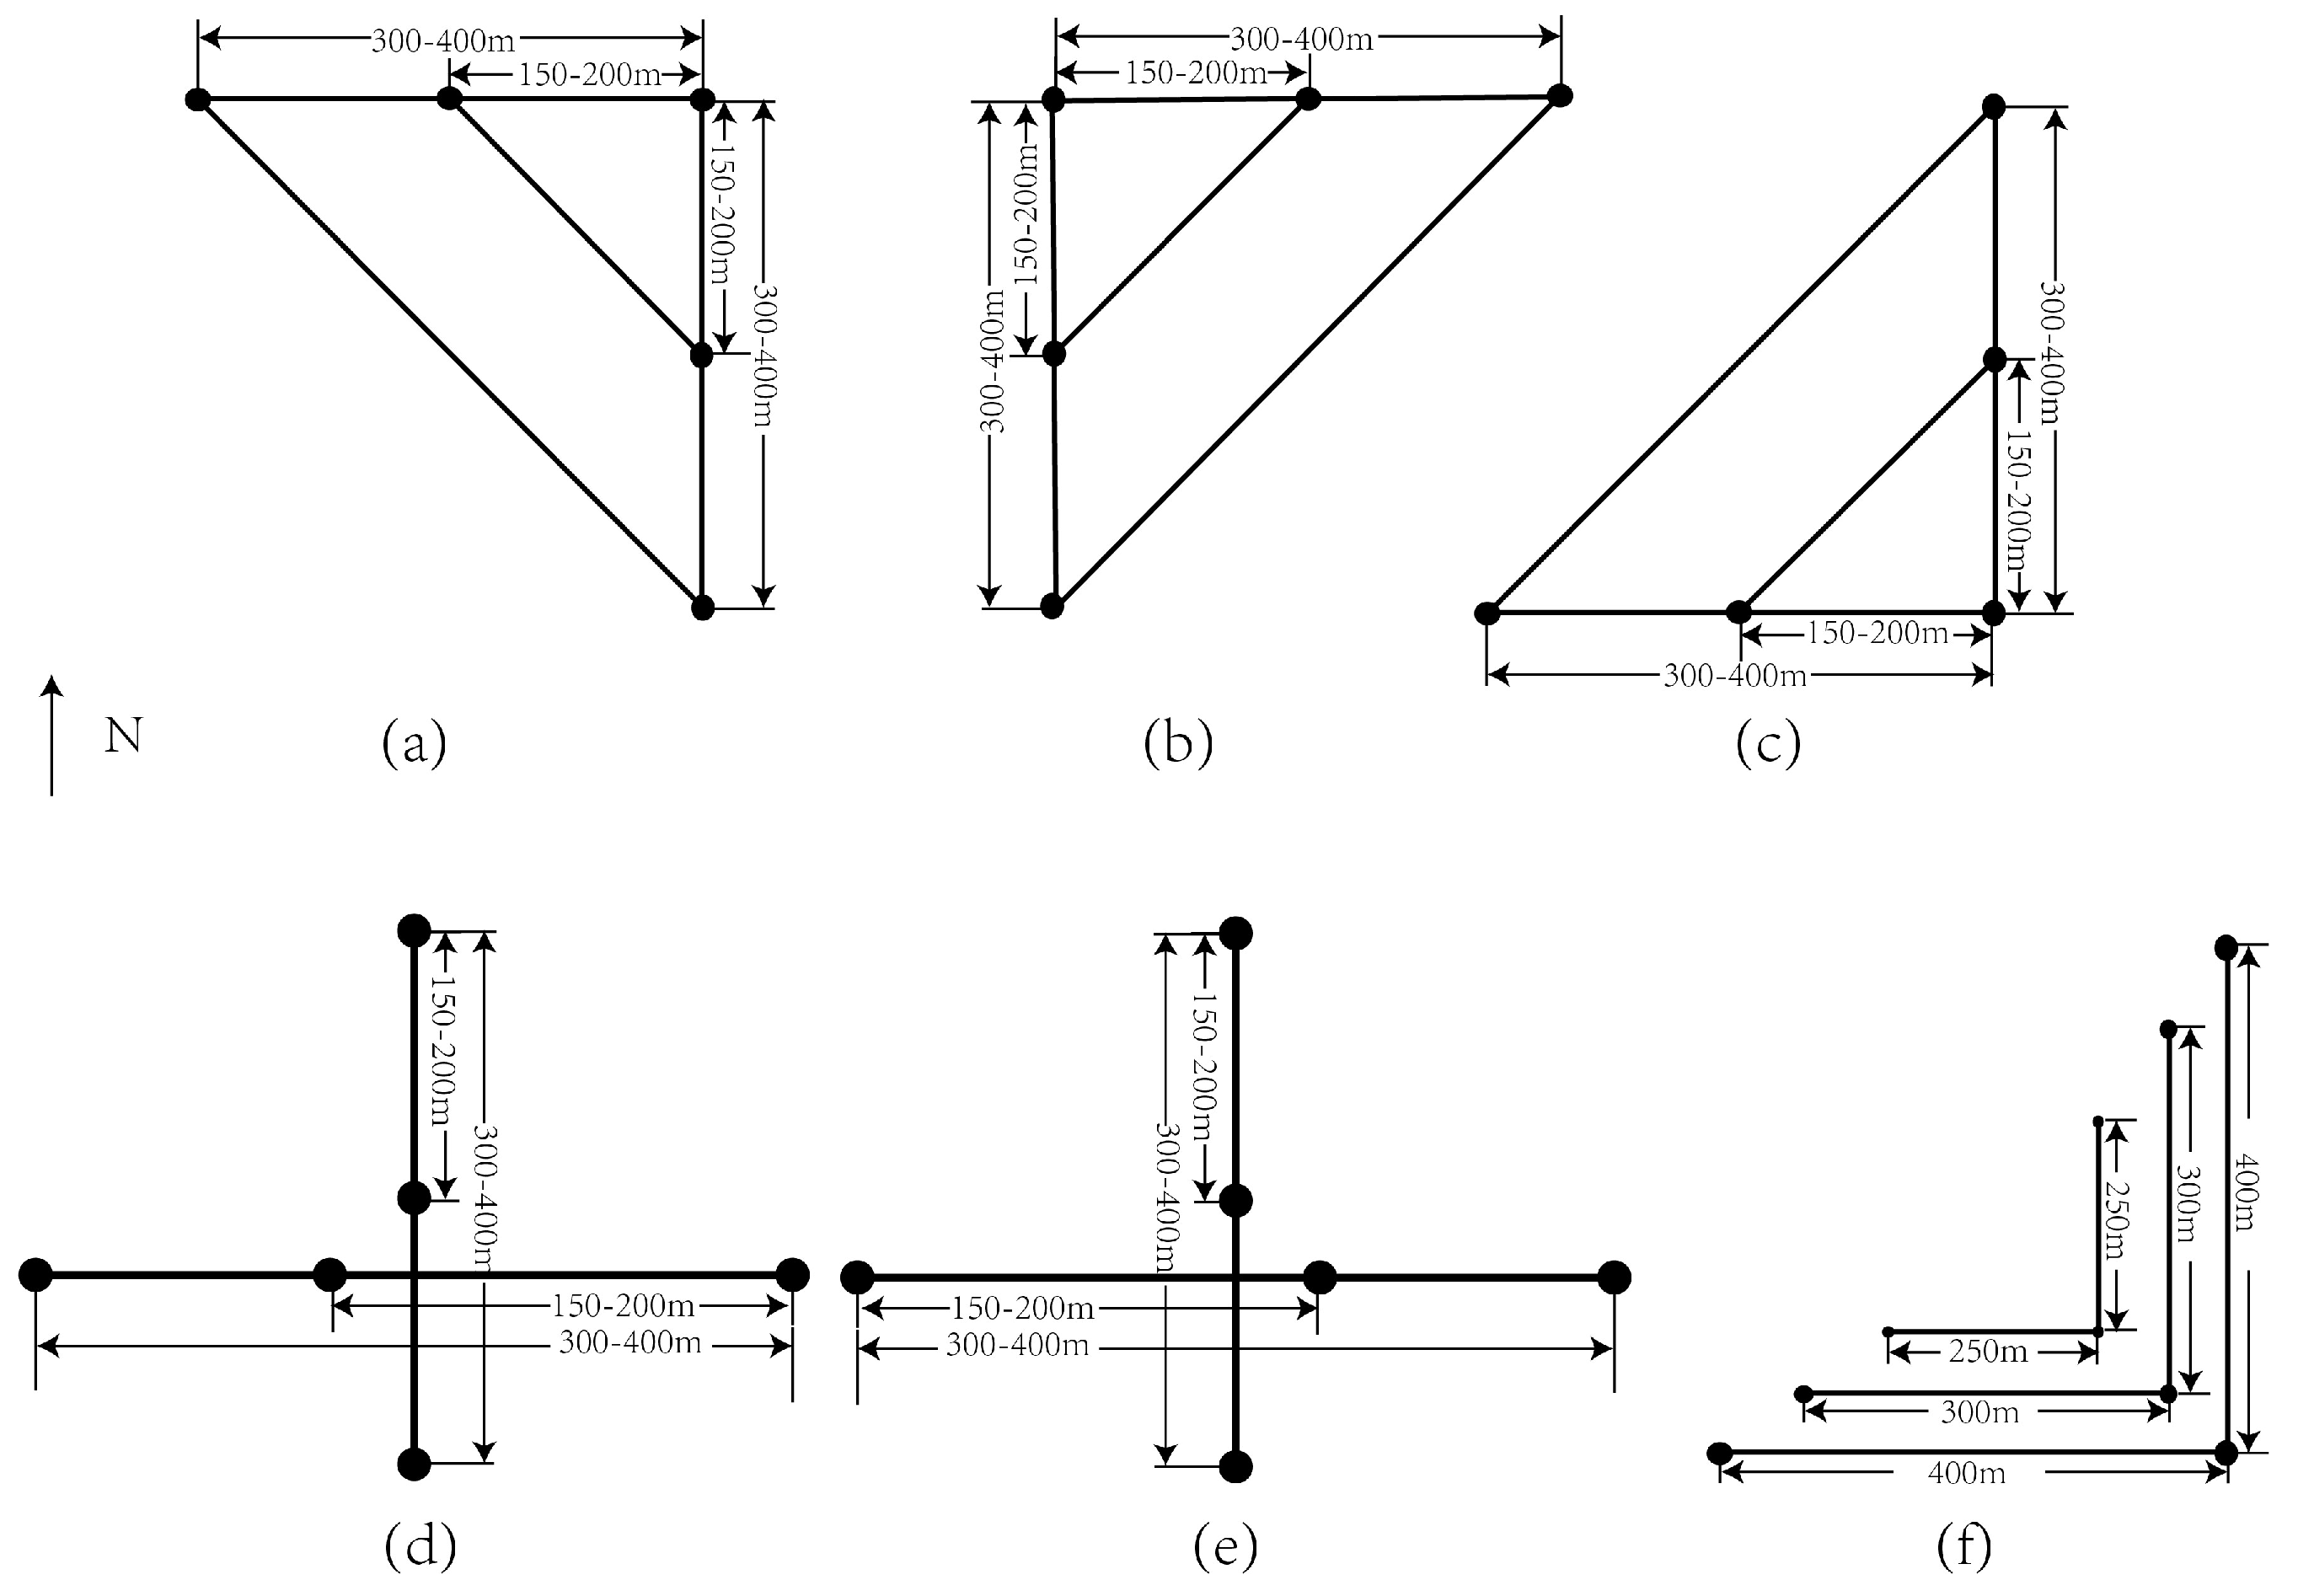
The electrode arrays were configured according to the multi-dipole observation principle used in the VAN method [21,22]. Each station measured two or three horizontal directions: north–south (NS), east–west (EW), and either northeast (NE) or northwest (NW). Two collinear dipoles, designated as long and short dipoles, were installed in each direction. Their lengths were in a ratio of 2:1.5. This configuration allowed the response recorded over different spatial scales to be compared within the same direction, as shown in Figure 2.
Figure 2.
Schematic of the electrode layout at the geoelectric stations. (a) Layout method 1; (b) Layout method 2; (c) Layout method 3; (d) Layout method 4; (e) Layout method 5; (f) Layout method 6.
2.3. Geomagnetic and Space-Weather Data
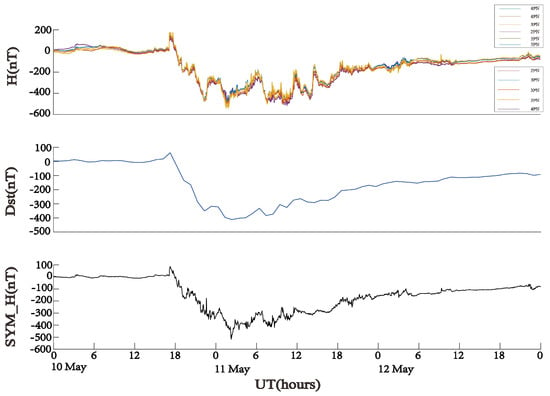
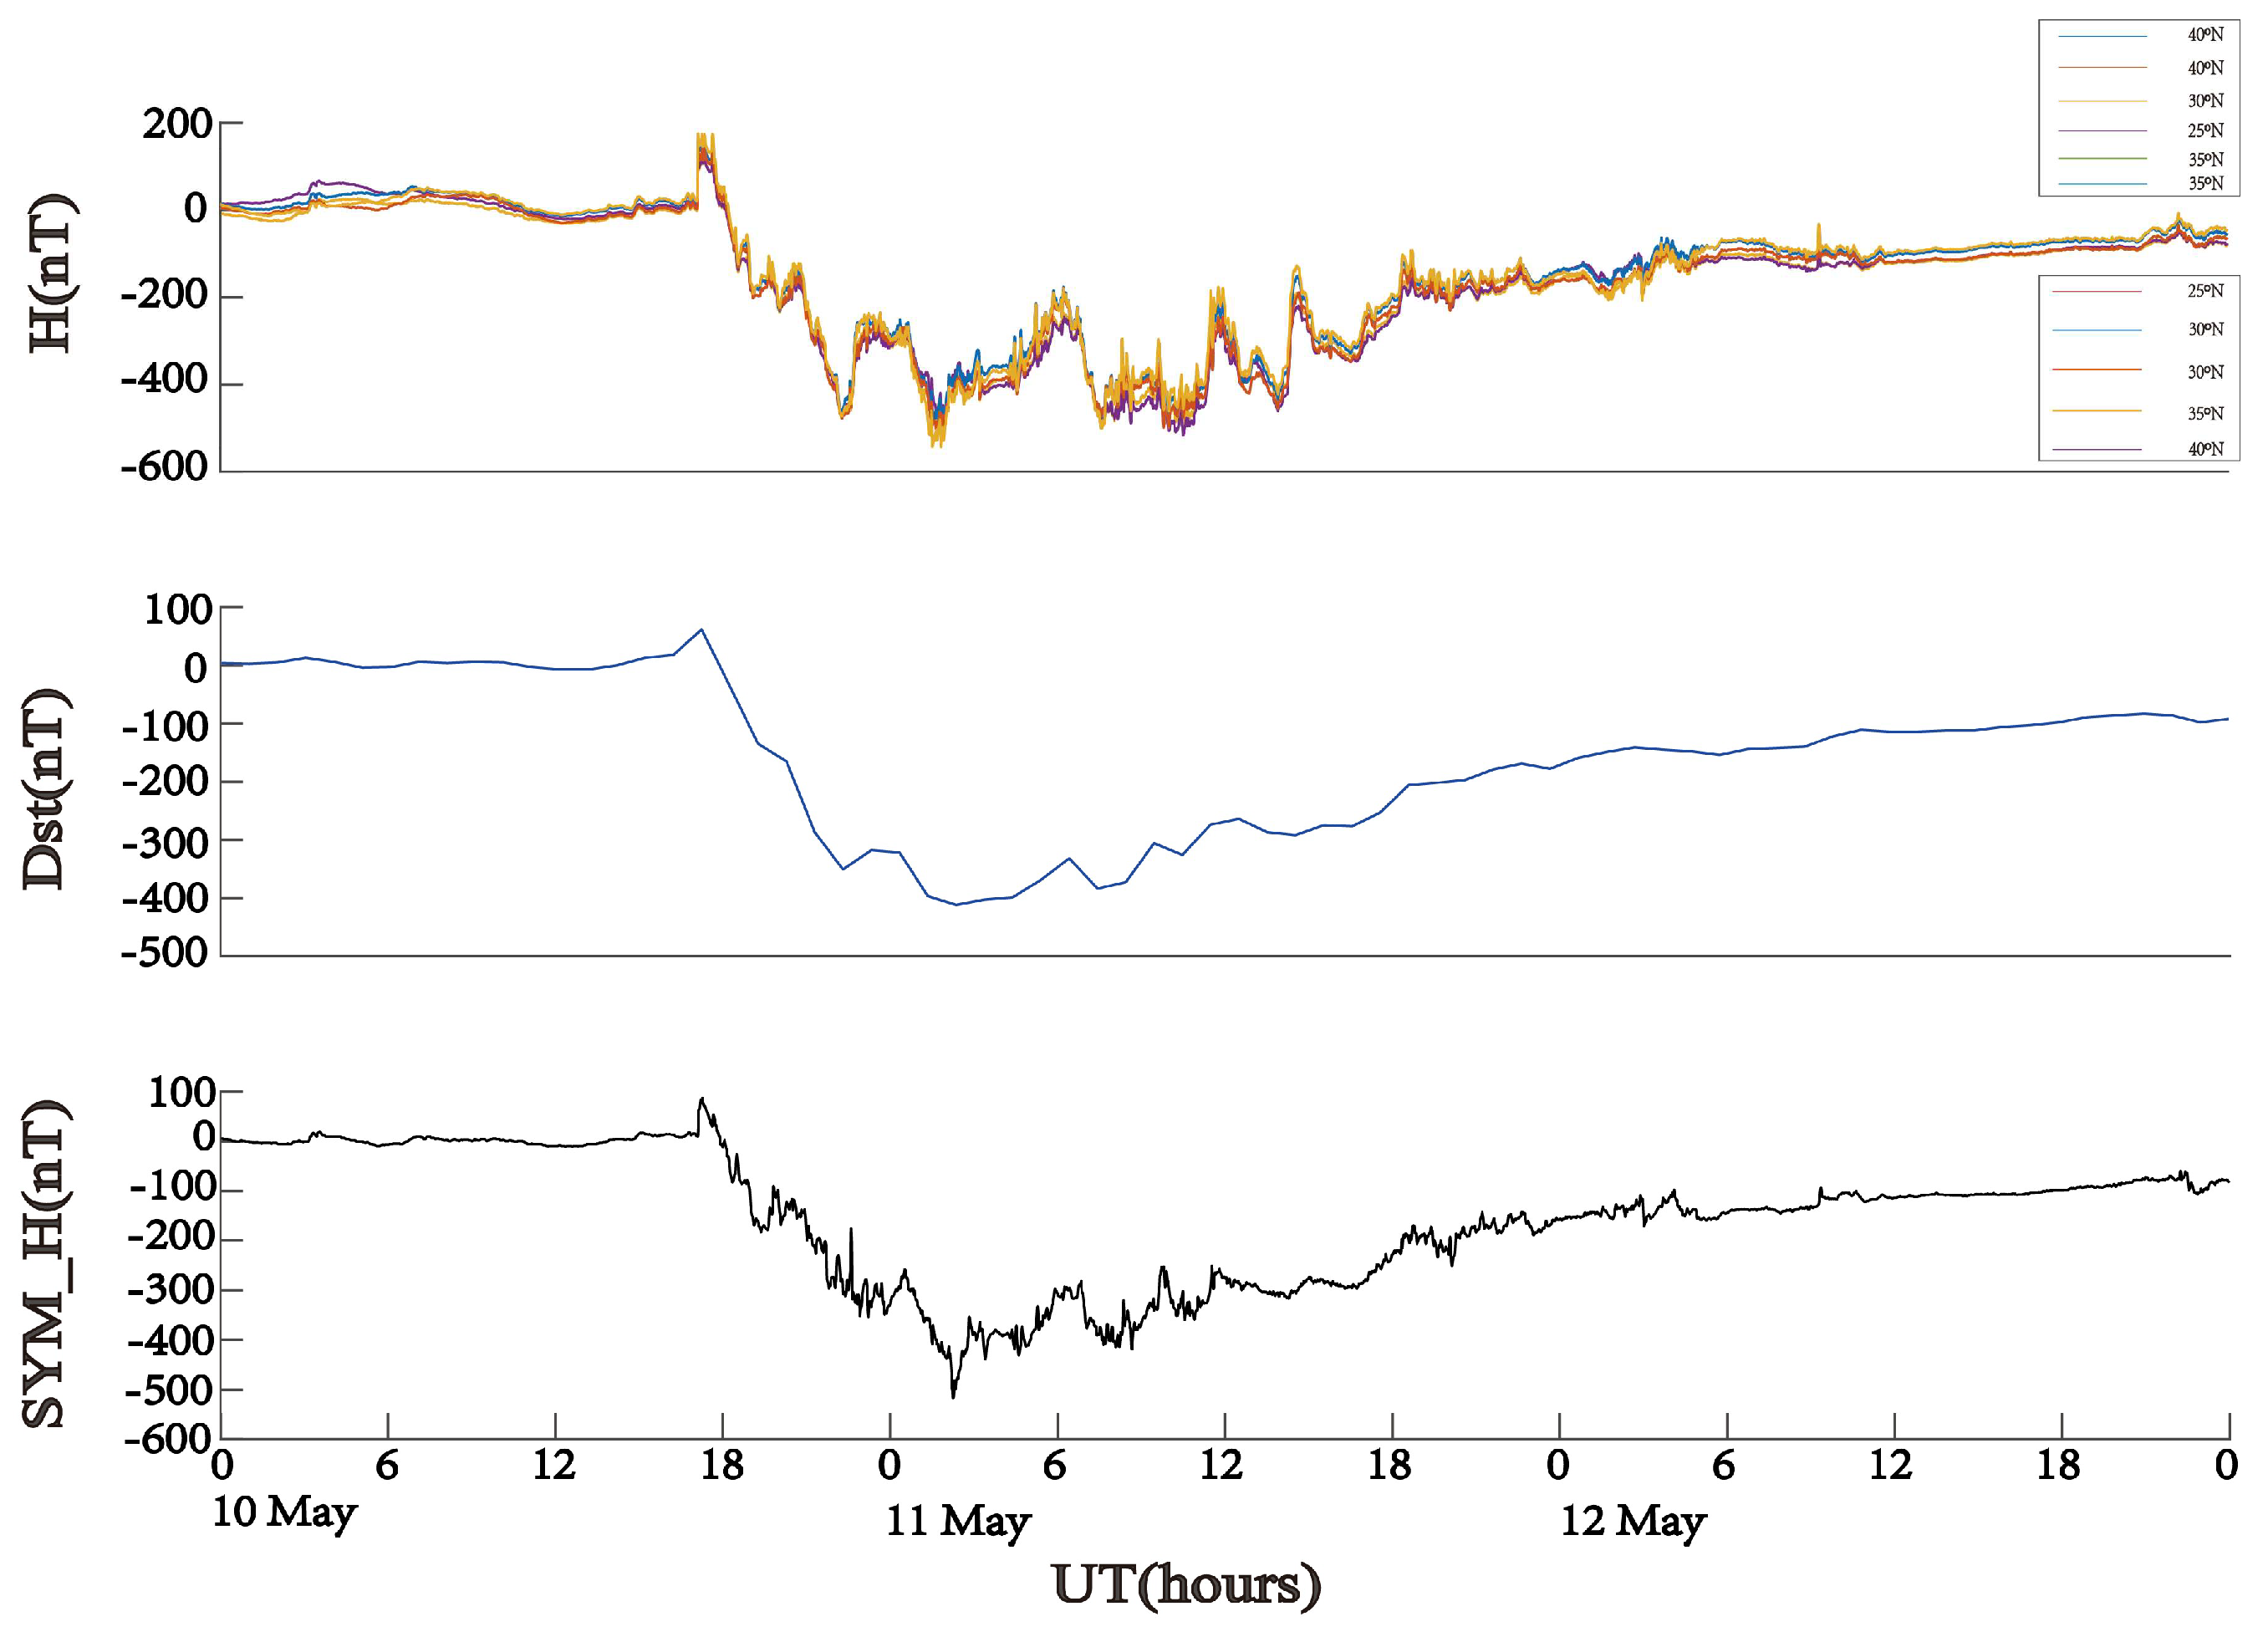
To precisely determine the onset time at which geoelectric field signals are affected by the sudden commencement of the geomagnetic storm, this study aims to corroborate these findings using geomagnetic field data and geomagnetic indices. Among the geoelectric stations depicted in Figure 1, some stations employed FHD-2 (manufactured by Jiangsu Earthquake Agency, Nanjing, China), GM-4 (manufactured by BeiJing Xinlong Instrument Limited, Beijing, China), or FGE (manufactured by Danish Meteorological Institute, Copenhagen, Denmark) instruments to conduct synchronous geomagnetic measurements. In this study, we analyzed the horizontal magnetic field component (H) from 11 geomagnetic monitoring stations, as illustrated in Figure 3. We selected these 11 stations based on latitude: 25° N, 30° N, 35° N, and 40° N.
Figure 3.
Information on the geomagnetic storm of 10−12 May 2024: horizontal magnetic-field variations observed at 11 stations, together with the Dst and SYM-H indices. The station locations in the legend indicate which stations are represented by each color, and "X° N" denotes the latitude of the geomagnetic station.
The H-component records were examined together with the disturbance storm time (Dst) and symmetric H-component (SYM-H) indices to determine the timing and regional coherence of the storm. The Dst and SYM-H indices were obtained from “Kyoto Dst index service” “http://wdc.kugi.kyoto-u.ac.jp (accessed on 10−12 May 2024)”. These datasets were used to define the study event and to compare the timing of the magnetic and geoelectric responses.
2.4. Identification and Quality Control of Storm-Related Signals
Geoelectric observations may contain variations associated with rainfall, high-voltage direct-current grounding-electrode discharges, electrode instability, and anthropogenic activities within or near an observation site [23,24,25,26]. Among the aforementioned interfering factors, those other than rainfall induce anomalous variations in data only at small scales and do not cause synchronous changes across the entire country; therefore, this study focused specifically on rainfall conditions. From the sudden commencement of the geomagnetic storm on 10 May 2024, and within the preceding and following hours, the vast majority of observation stations recorded no significant rainfall; in a few isolated regions, rainfall did occur during this period, but in those cases, the rainfall showed no clear correlation with the changes in the geoelectric field during the sudden disturbance in the remaining vast majority of stations nationwide. Consequently, the observed changes in the geoelectric field at national observation stations on 10 May 2024, were not necessarily linked to meteorological factors such as rainfall. Storm-related signals were therefore identified by jointly comparing the geoelectric records from multiple regional stations with the corresponding H-component, Dst, and SYM-H variations. A variation was classified as storm-related when its timing was consistent with the geomagnetic disturbance and a comparable response was observed at multiple stations [27]. Localized steps or offsets without regional or geomagnetic coherence were flagged as site-specific interference. This procedure was also used to identify disturbances associated with urban rail operations in the Qingpu record.
2.5. Amplitude of the Storm-Induced Geoelectric Variation
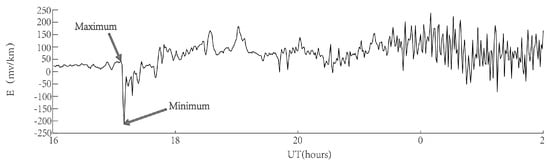
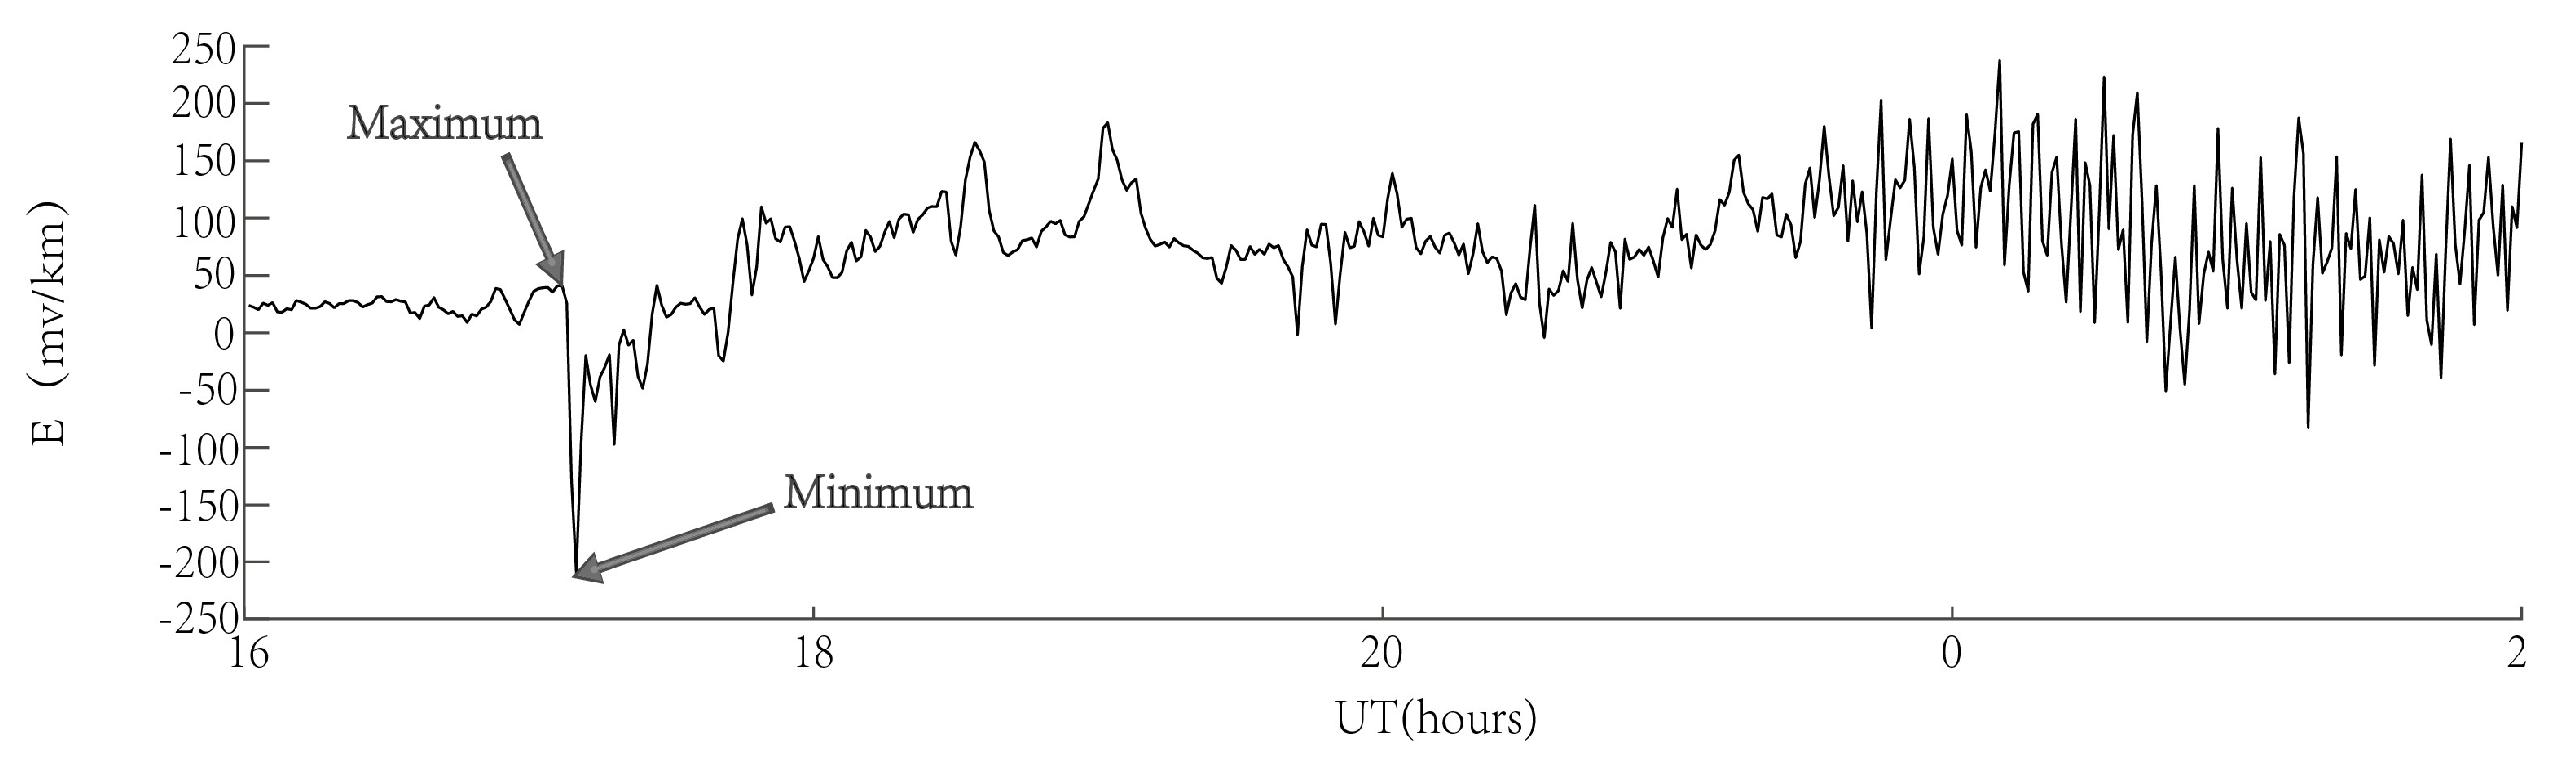
For each station, dipole, and horizontal component, the amplitude of the geoelectric variation during storm onset was quantified as the difference between the maximum and minimum values within the selected analysis interval:
where ΔE is the peak-to-peak storm-onset variation and Emax and Emin are the maximum and minimum observed values, as shown in Figure 4. For Emax and Emin in Equation (1), both values come from raw data from independent observations at each station; no smoothing was applied, and station-to-station averages were not used in their place. The calculation was performed separately for the NS and EW components and for the available diagonal component. The resulting amplitudes were compared among stations to evaluate regional differences in the geoelectric response.
Figure 4.
Amplitude of the sudden−onset changes in the induced geoelectric field observed at Qingpu Station on 10 May 2024, at the sudden commencement of the geomagnetic storm.
2.6. Multi-Dipole Consistency Analysis
The local spatial consistency of the geoelectric response was evaluated using the ratio of the storm-related magnitude measured by the long dipole to that measured by the collinear short dipole [28]. For a given direction d, the ratio was calculated as
where and denote the geoelectric-field magnitudes recorded by the long and short dipoles, respectively, in direction d. The ratios were calculated independently for the NS, EW, and NE or NW components. Consistent ratios indicate a stable response between the two dipole scales, whereas marked departures from the station-specific relationship may reflect local electrical heterogeneity or site-specific interference.
2.7. Polarization Analysis
The horizontal geoelectric field was treated as a two-dimensional vector defined by its orthogonal NS and EW components. Its directional behavior was characterized using the component ratio
where ENS and EEW are the NS and EW components measured over the same time interval. The ratio was used as an indicator of polarization orientation and was compared among stations across mainland China. Long-dipole measurements were used for the regional polarization comparison to maintain a consistent spatial scale.
Where available, high-density electrical survey results from the vicinity of individual stations were compared with the observed amplitudes, long-to-short dipole ratios, and polarization characteristics. This comparison was used to assess whether station-specific geoelectric responses were consistent with local variations in subsurface electrical structure.
3. Results
3.1. Amplitude Variation in The Induced Geoelectric Field During the Sudden Commencement
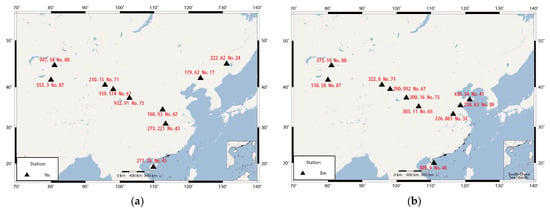
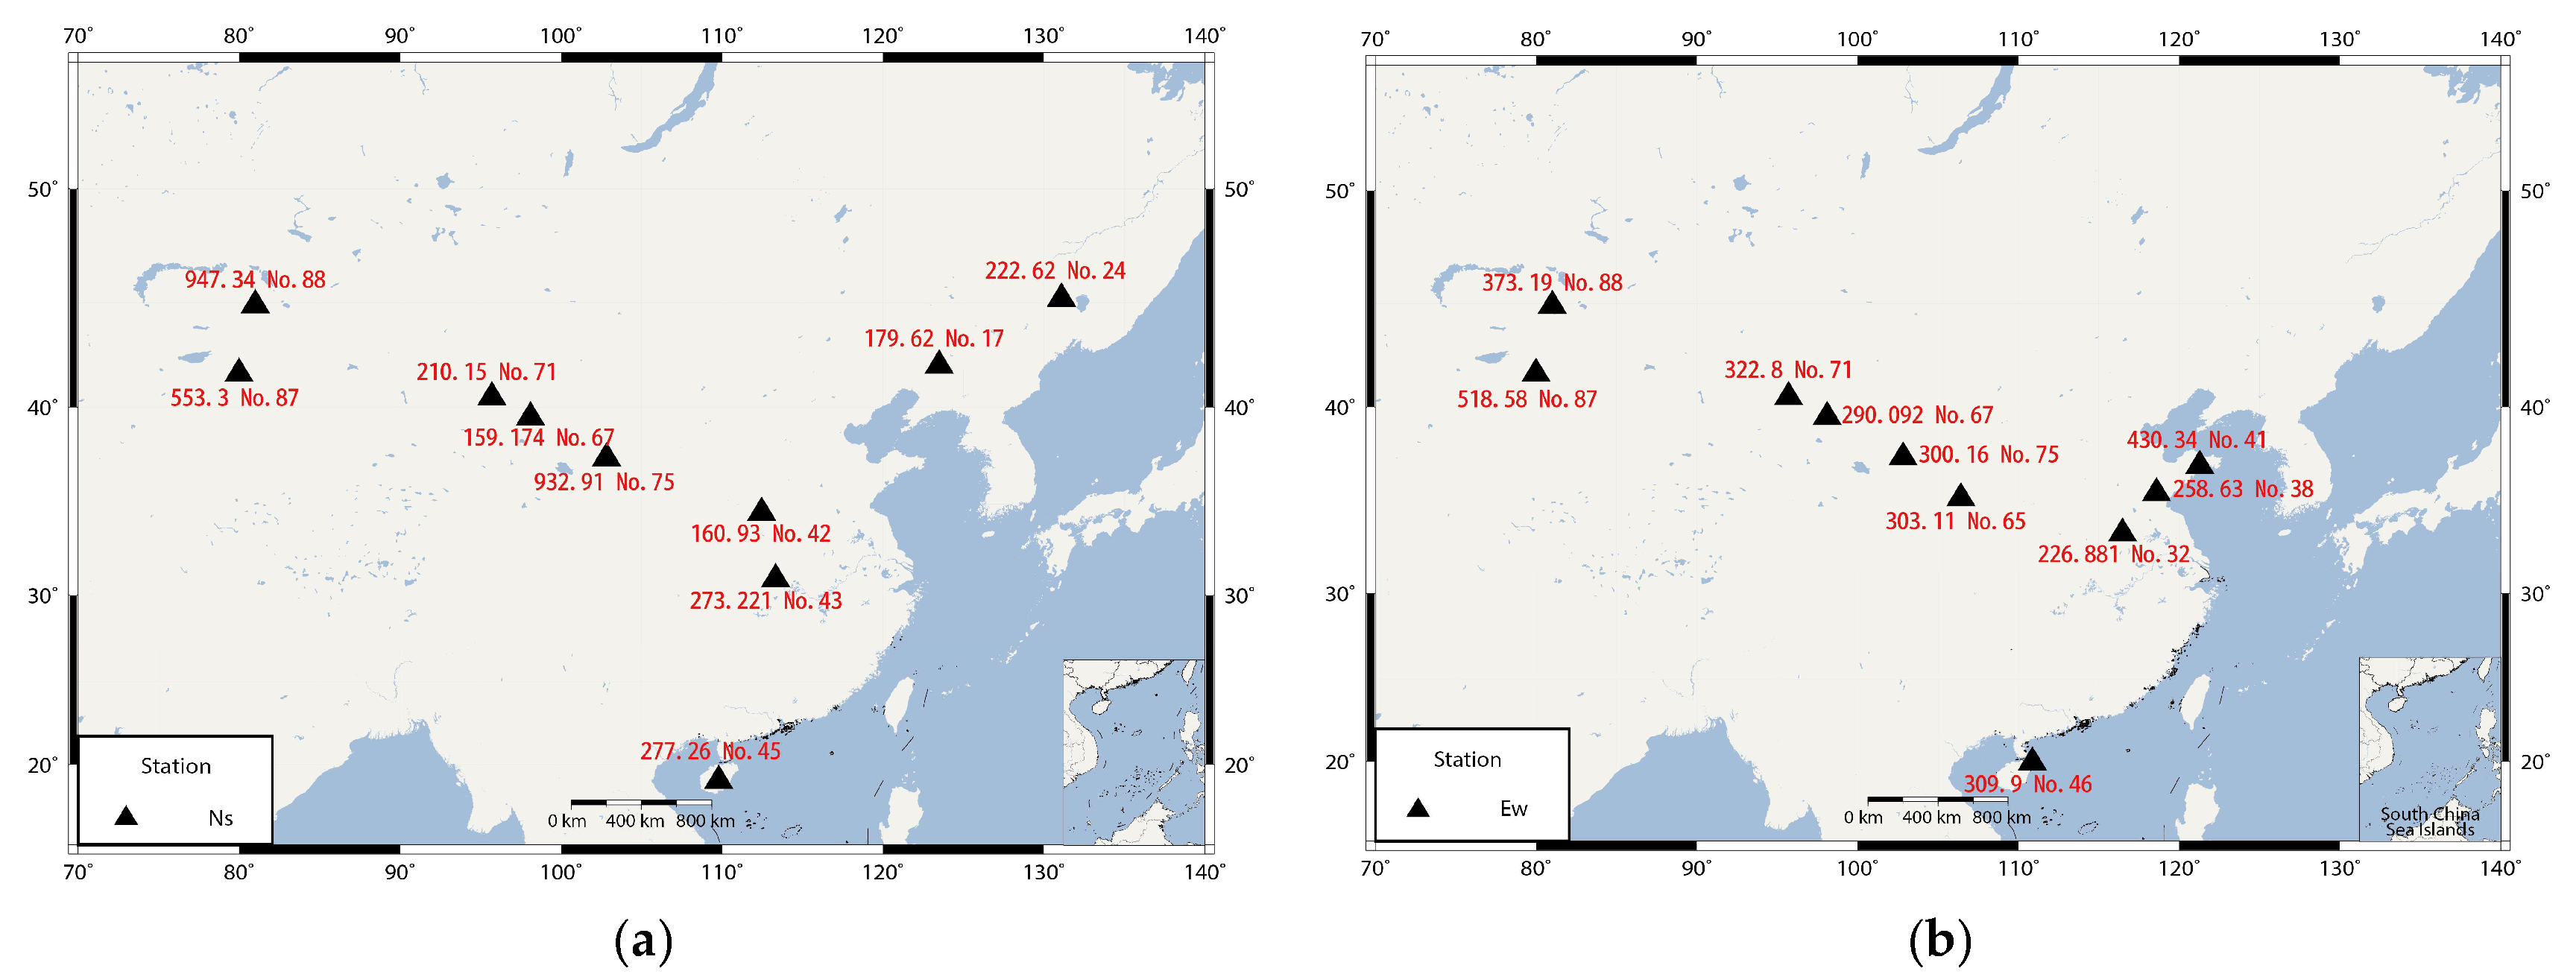
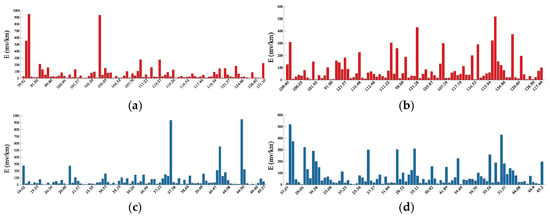
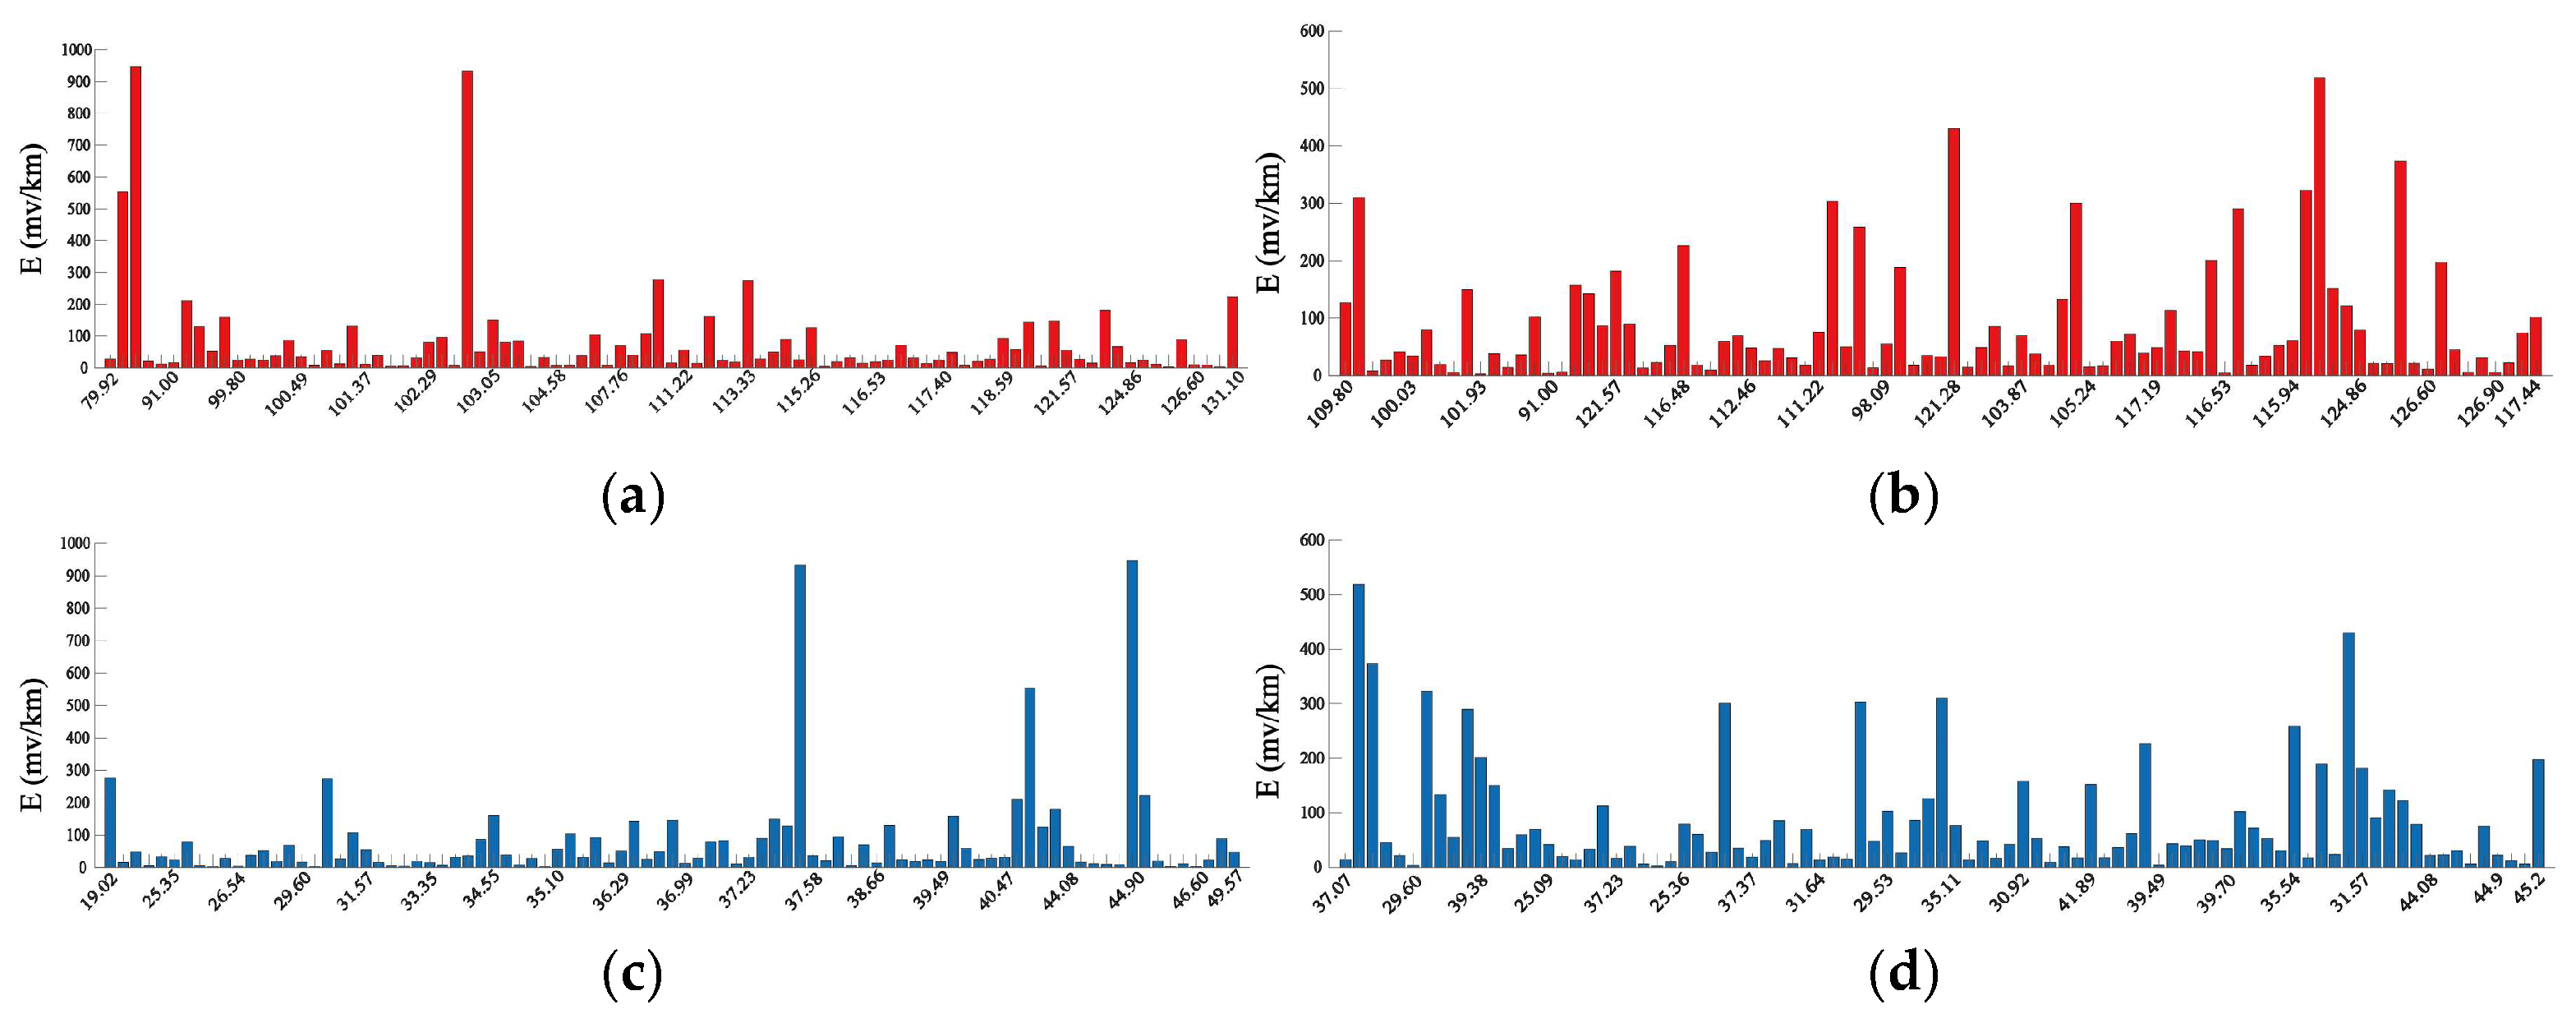
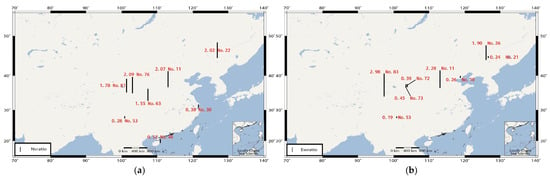
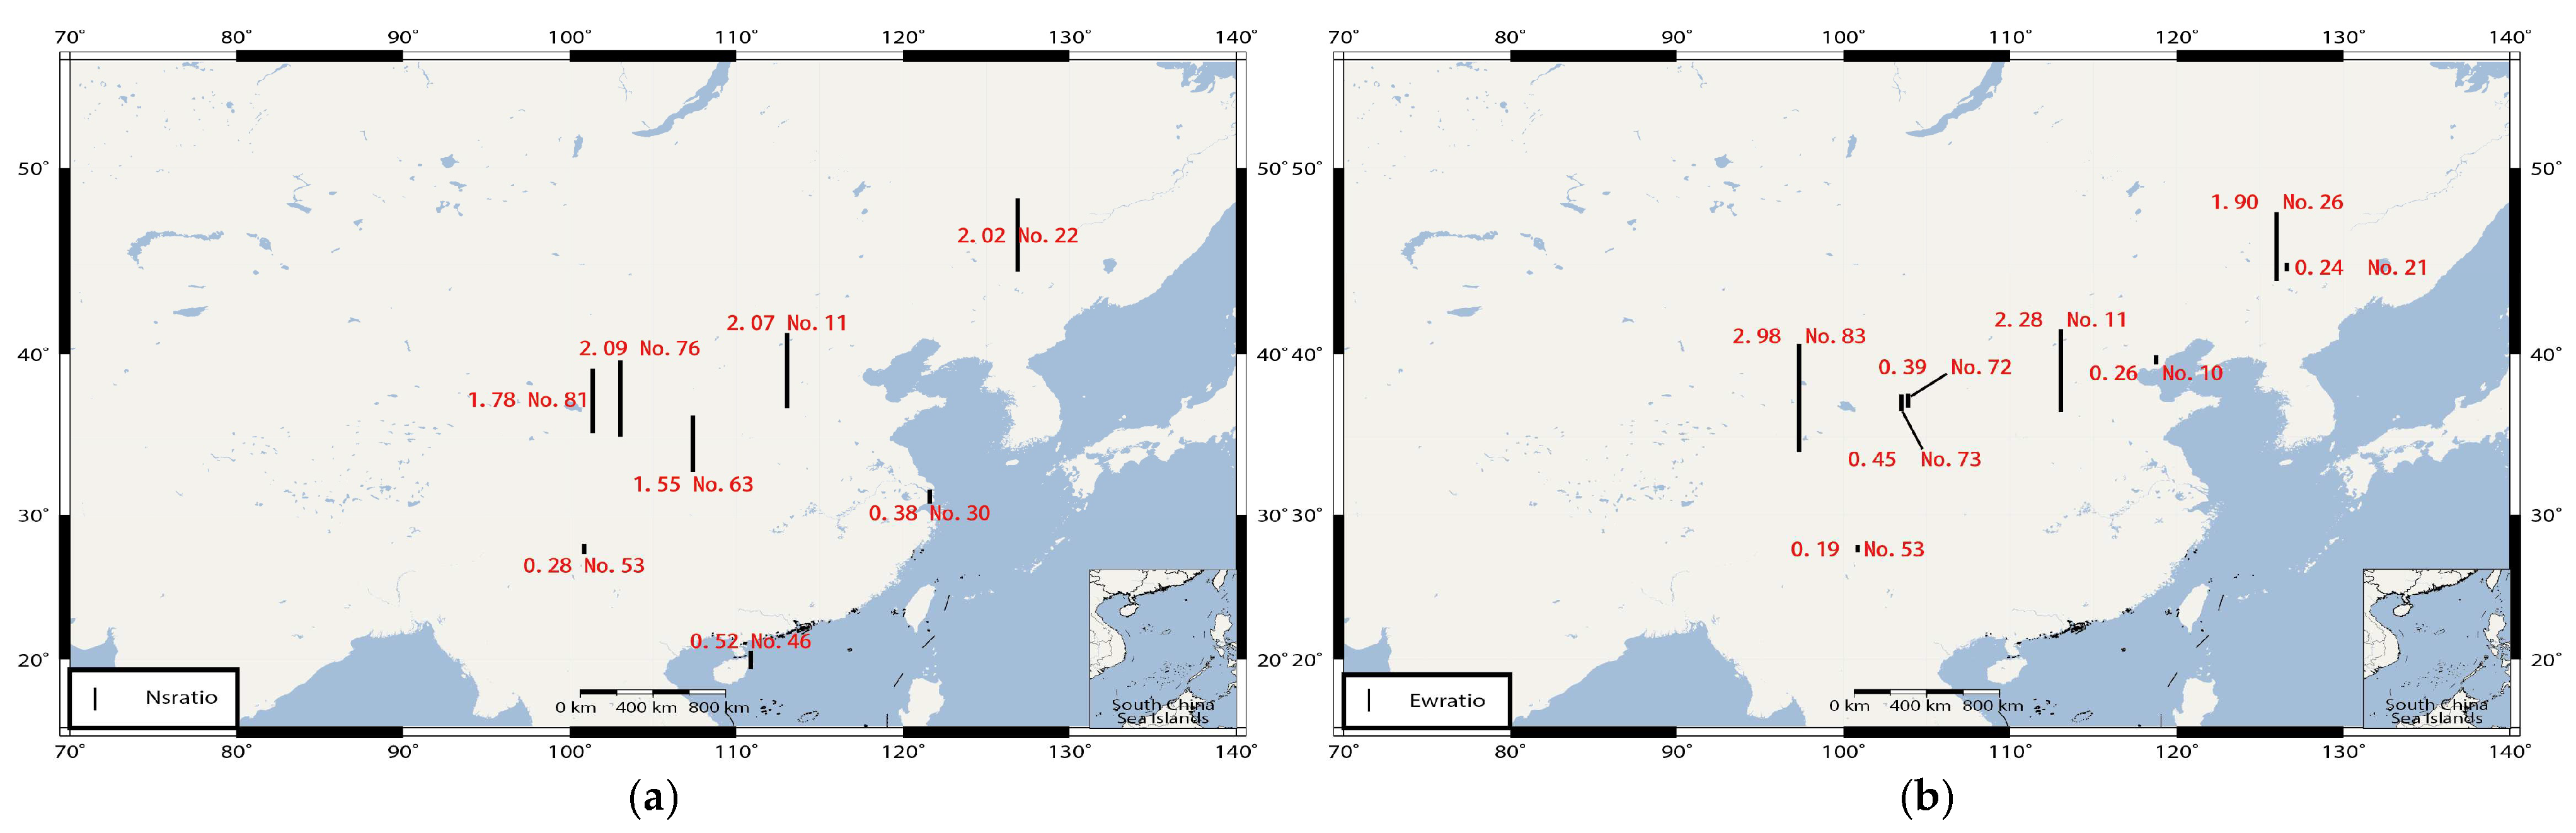
Figure 5 illustrates the amplitude changes in the induced geoelectric field at various stations during the sudden commencement of the geomagnetic storm on 10 May 2024. To highlight the most significant responses, Figure 5 displays the ten stations with the largest amplitude changes for both the north–south (NS) and east–west (EW) components. A bar chart in Figure 6 illustrates the amplitude changes at additional stations. Together, these figures support the following observations on the amplitude variations in the induced geoelectric field recorded at stations across China during the storm.
Figure 5.
Distribution of the 10 stations that recorded the largest amplitude variations on long dipoles in the north–south (a) and east–west (b) directions. For each station, the first number indicates the induced geoelectric field intensity in mV/km at the sudden commencement of the geomagnetic storm, and the second number is the station identifier.
Figure 6.
Variation amplitudes of induced electric fields for north–south and east–west long-pole distances, sorted by latitude and longitude from lowest to highest. (a) Variation amplitude of north–south long-pole distances sorted by longitude; (b) variation amplitude of east–west long-pole distances sorted by longitude; (c) variation amplitude of north–south long-pole distances sorted by latitude; (d) variation amplitude of east–west long-pole distances sorted by latitude.
NS direction: The ten stations with the largest amplitude changes in the NS direction are concentrated mainly in the NS Seismic Zone (30–42° N, 90–110° E), with a few stations located in East, Northeast, and Northwest China. The three stations exhibiting the largest amplitudes are Wenquan (Xinjiang, 947.34 mV/km), Gufeng (Gansu, 932.91 mV/km), and Wushi (Xinjiang, 553.3 mV/km).
EW direction: The ten stations with the largest amplitude changes in the EW direction are distributed relatively evenly between the northern part of the NS Seismic Zone and eastern China. The three stations with the largest amplitudes in this direction are Wushi Station in Xinjiang Province (518.58 mV/km), Rushan Station in Shandong Province (430.34 mV/km), and Wenquan Station in Xinjiang Province (373.19 mV/km).
These findings indicate that stations in specific regions, particularly those within the NS Seismic Zone and parts of Xinjiang Province, exhibited the largest amplitude changes in the induced geoelectric field during the sudden commencement of the geomagnetic storm.
Figure 6 depicts the amplitude changes in the north–south and east–west induced geoelectric field intensity on long dipoles during the sudden commencement of the geomagnetic storm at stations 1–89. A comparison with the station distribution map (Figure 1) reveals no clear latitudinal or longitudinal dependence in the geoelectric field amplitudes across mainland China. Instead, the data reveal regions with either elevated or reduced amplitude variations.
The spatial distribution of stations with prominent and minor amplitude variations is strongly heterogeneous, with no clear correlation with latitude, longitude, or broad geographical regions. This variability suggests that local factors, such as ground conductivity and subsurface structure, may play a more important role than geographic location in controlling the induced geoelectric field response to geomagnetic storms.
3.2. Analysis of Component Ratio Changes
Figure 7 shows an overview of the ratios (λ) of the induced geoelectric field observed on long dipoles relative to short dipoles in the NS, EW, and NE directions at the above-mentioned eight stations. The subplots highlight stations where the ratios exceed 1.5 or fall below 0.5, indicating significant deviations.
Figure 7.
(a) The long-to-short dipole ratios (λ) for the NS directions at various stations; (b) the long-to-short dipole ratios (λ) for the EW direction at various stations. Subplots highlight stations for which the ratios exceed 1.5 or fall below 0.5, indicating significant deviations.
NS Component (Figure 7a):
The ratio λNS of the NS component of the induced geoelectric field exceeds 1.5 at only five stations: Huangyang (No. 76), Daixian (No. 11), Suihua (No. 22), Menyuan (No. 81), and Fengxiang (No. 63). Conversely, at three stations (Wenchang, Qingpu, and Luguhu), the ratios fall below 0.5. The ratios for the remaining stations fall between 0.5 and 2.0. The maximum ratio is observed in Gansu Province, while the minimum ratio is in Sichuan Province. Stations with low ratios are predominantly scattered south of the Yangtze River, while those with high ratios are mainly distributed in the northern and northeastern regions.
EW Component (Figure 7b):
Only at three stations are the EW component ratios λEW of the induced geoelectric field greater than 1.5, while at five stations the ratios fall below 0.5. The spatial distribution of these stations indicates that both high and low ratios occur at higher latitudes in northern China. However, no clear pattern related to longitude or latitude is evident.
3.3. Polarization and Subsurface Electrical-Structure Analysis
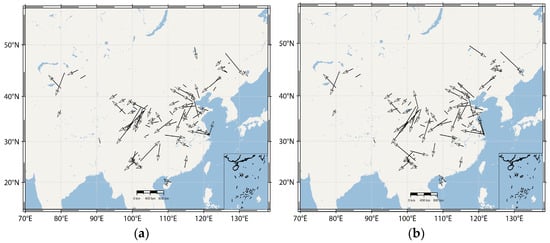
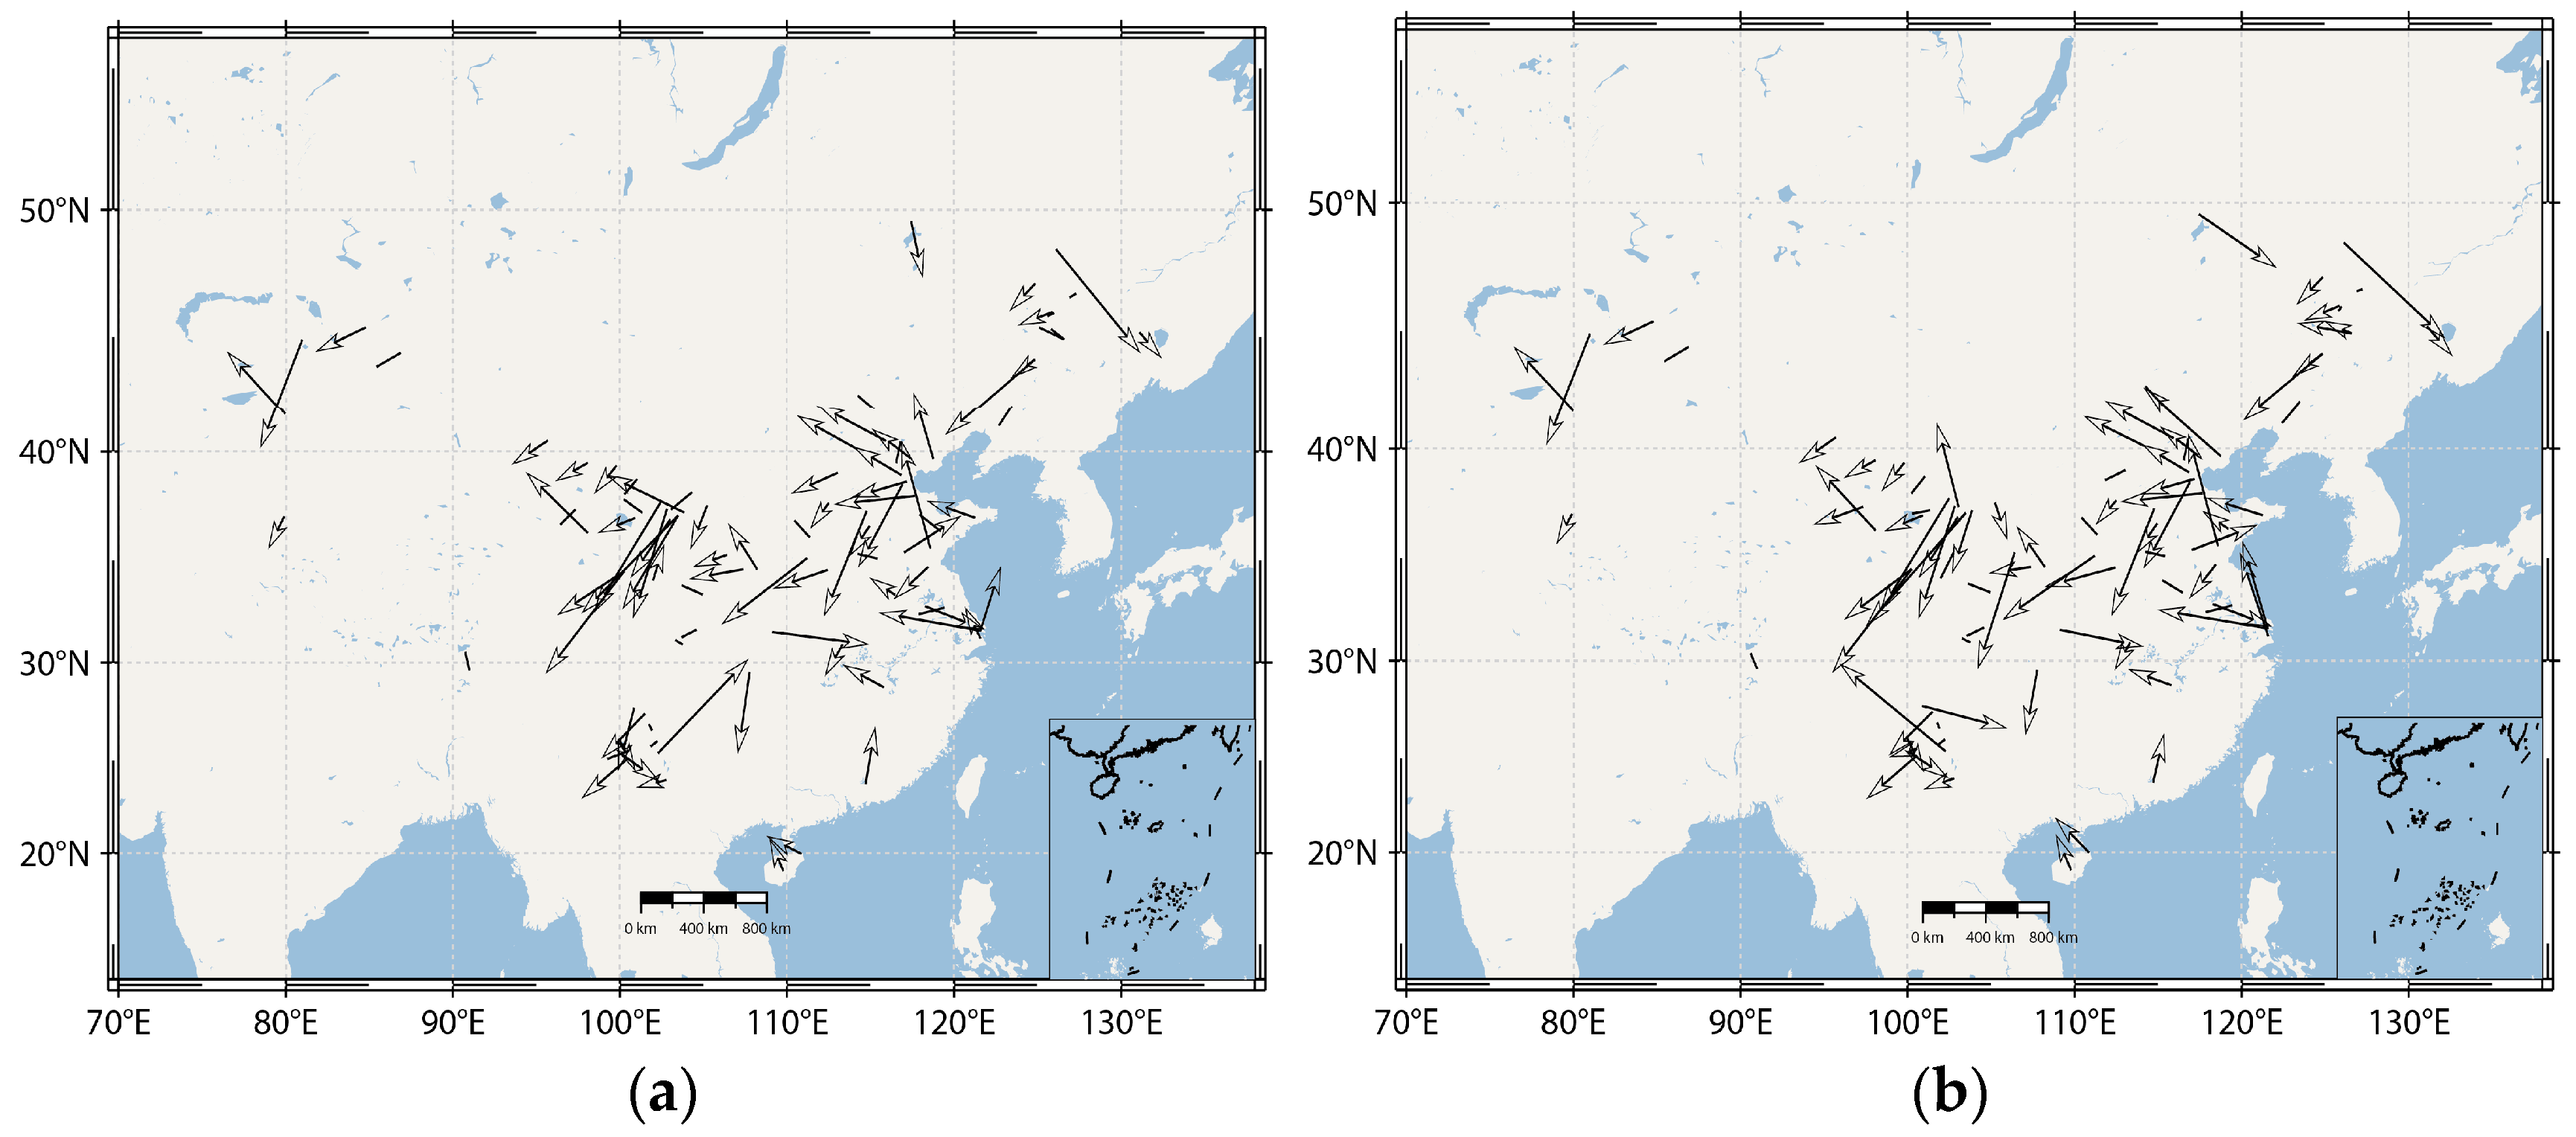
The vector characteristics of the induced geoelectric field are shown in Figure 8. At inland stations, the polarization direction of the induced geoelectric field generally aligns with both the long and short dipoles. At coastal stations, in contrast, the polarization directions deviate from the dipole orientation, particularly at latitudes above 30° N, where the angular difference between the long- and short-dipole measurements exceeds 30°. For coastal stations below 30° N, the polarization direction remains consistent, as shown in Figure 8. This coastal effect does not, however, exhibit a simple landward attenuation pattern or a consistent orientation perpendicular to the coastline.
Figure 8.
(a) Polarization direction of the long dipoles; (b) polarization direction of the short dipoles. The arrows show the vector direction, and their length corresponds to the magnitude.
Figure 8a,b reveal that the induced geoelectric field maintains a consistent polarization direction for the short and long dipoles at most inland stations, although the amplitudes show noticeable variations. In contrast, at many coastal stations, discrepancies in polarization direction and significant amplitude differences are observed between the long- and short-dipole measurements.
4. Discussion
4.1. The Impact of Anisotropic Medium on Geoelectric Field Intensity at the Observation Site
The induced geoelectric field signals originate from the high-altitude current system. Their variation amplitudes at different geoelectric field stations, particularly on long and short electrode dipoles oriented in the same direction, can be attributed to the pervasive non-uniformity and anisotropy of the underground electrical structure at these sites.
In magnetotelluric analysis, a key focus is the linear relationship, in the frequency domain, between the horizontal components of the magnetic field, B(t, x, y), and those of the electric field, E(t, x, y). This linear relationship is a fundamental characteristic of geomagnetic and geoelectric fields interacting with an anisotropic electrical structure in the subsurface [29,30], as shown in Equation (4):
Here, is the complex impedance tensor, which depends on the Earth’s conductivity and permeability, and μ is the magnetic permeability. and are the results of applying the Fourier transform to B(t, x, y) and E(t, x, y), respectively. Assuming an ideal region in which the impedance tensor is antisymmetric, the Earth’s conductivity depends only on depth. In this case, geomagnetic-field changes above the ideal region induce a quadrature electric field with a uniform amplitude of variation. In reality, however, the conductivity structure of the Earth’s surface (including the oceans) is three-dimensional, and the impedance tensor is usually asymmetric:
Here, the location of the region is determined by the coordinates at which the impedance tensor is evaluated. No simple mathematical equation can represent the relationship between Zxx and the other three tensor components. The electric-field strength can then be obtained in the time domain by applying the inverse Fourier transform to Equation (6), as follows:
in which Ze is the empirical magnetotelluric impedance tensor.
Equation (5) shows that the temporal variation in geoelectric field intensity is directly influenced by the local impedance tensor, which varies among regions. Each coordinate (x, y) therefore experiences a unique change in geoelectric field intensity. When the impedance tensor varies with direction, the characteristics of the geoelectric field change correspondingly. This effect is tied to the geoelectric field induced within the Earth by fluctuations in the magnetic field. The anisotropy of the underground electrical structure thus leads to directional variations in the geoelectric field.
Geoelectric field observations are strongly affected by the anisotropy and non-uniformity of the underground electrical structure, particularly local non-uniformity. In areas with lateral subsurface non-uniformity, the direction of current lines is altered. A high-resistivity ore body, for example, acts as a barrier, repelling current away from its vicinity. The degree of repulsion increases with the resistivity of the ore body. Conversely, a low-resistivity ore body attracts current inward, and the degree of attraction increases as the resistivity decreases. This phenomenon has been studied extensively and is reflected in the behavior described by Equations (4)–(6) [31,32,33,34].
4.2. Impact of Subsurface Conditions on Geoelectric Field Intensity at Relevant Stations
In field observations, a comprehensive examination of the electrical structure of the subsurface at geoelectric field stations is essential. The high-density electrical exploration method provides an effective approach for this purpose. The method was applied at the Chongming and Qingpu stations in Shanghai Municipality to examine how subsurface conditions influence geoelectric field intensity at these locations.
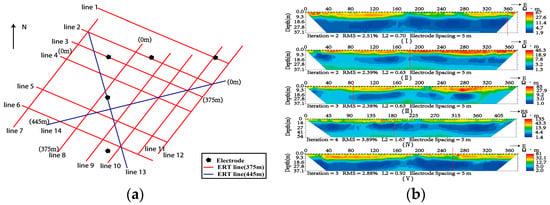
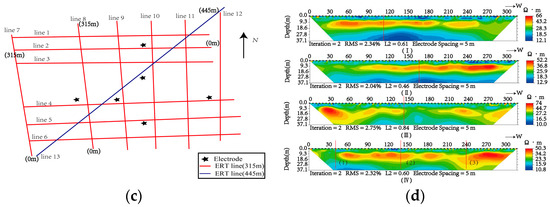
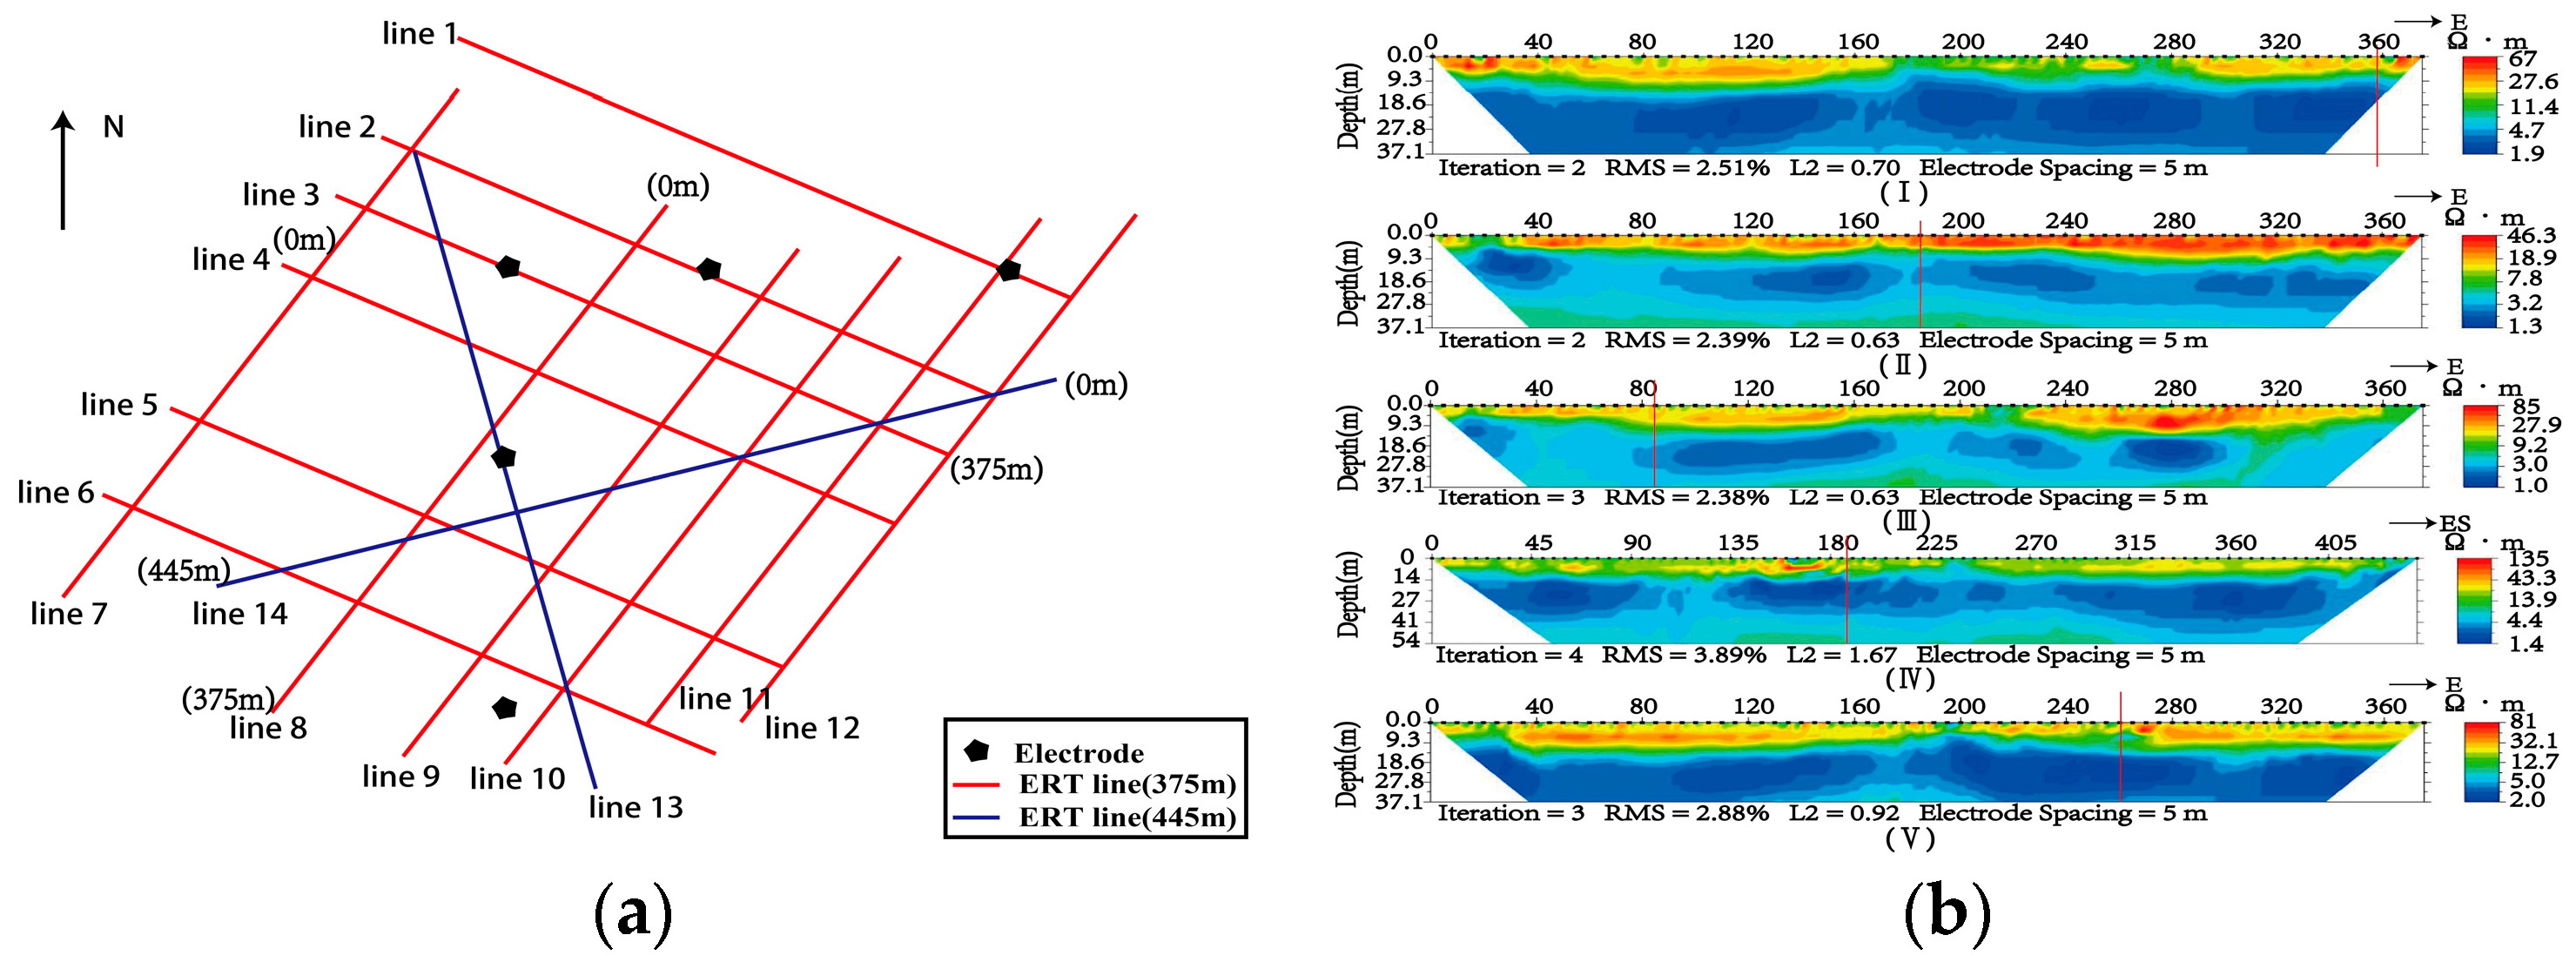
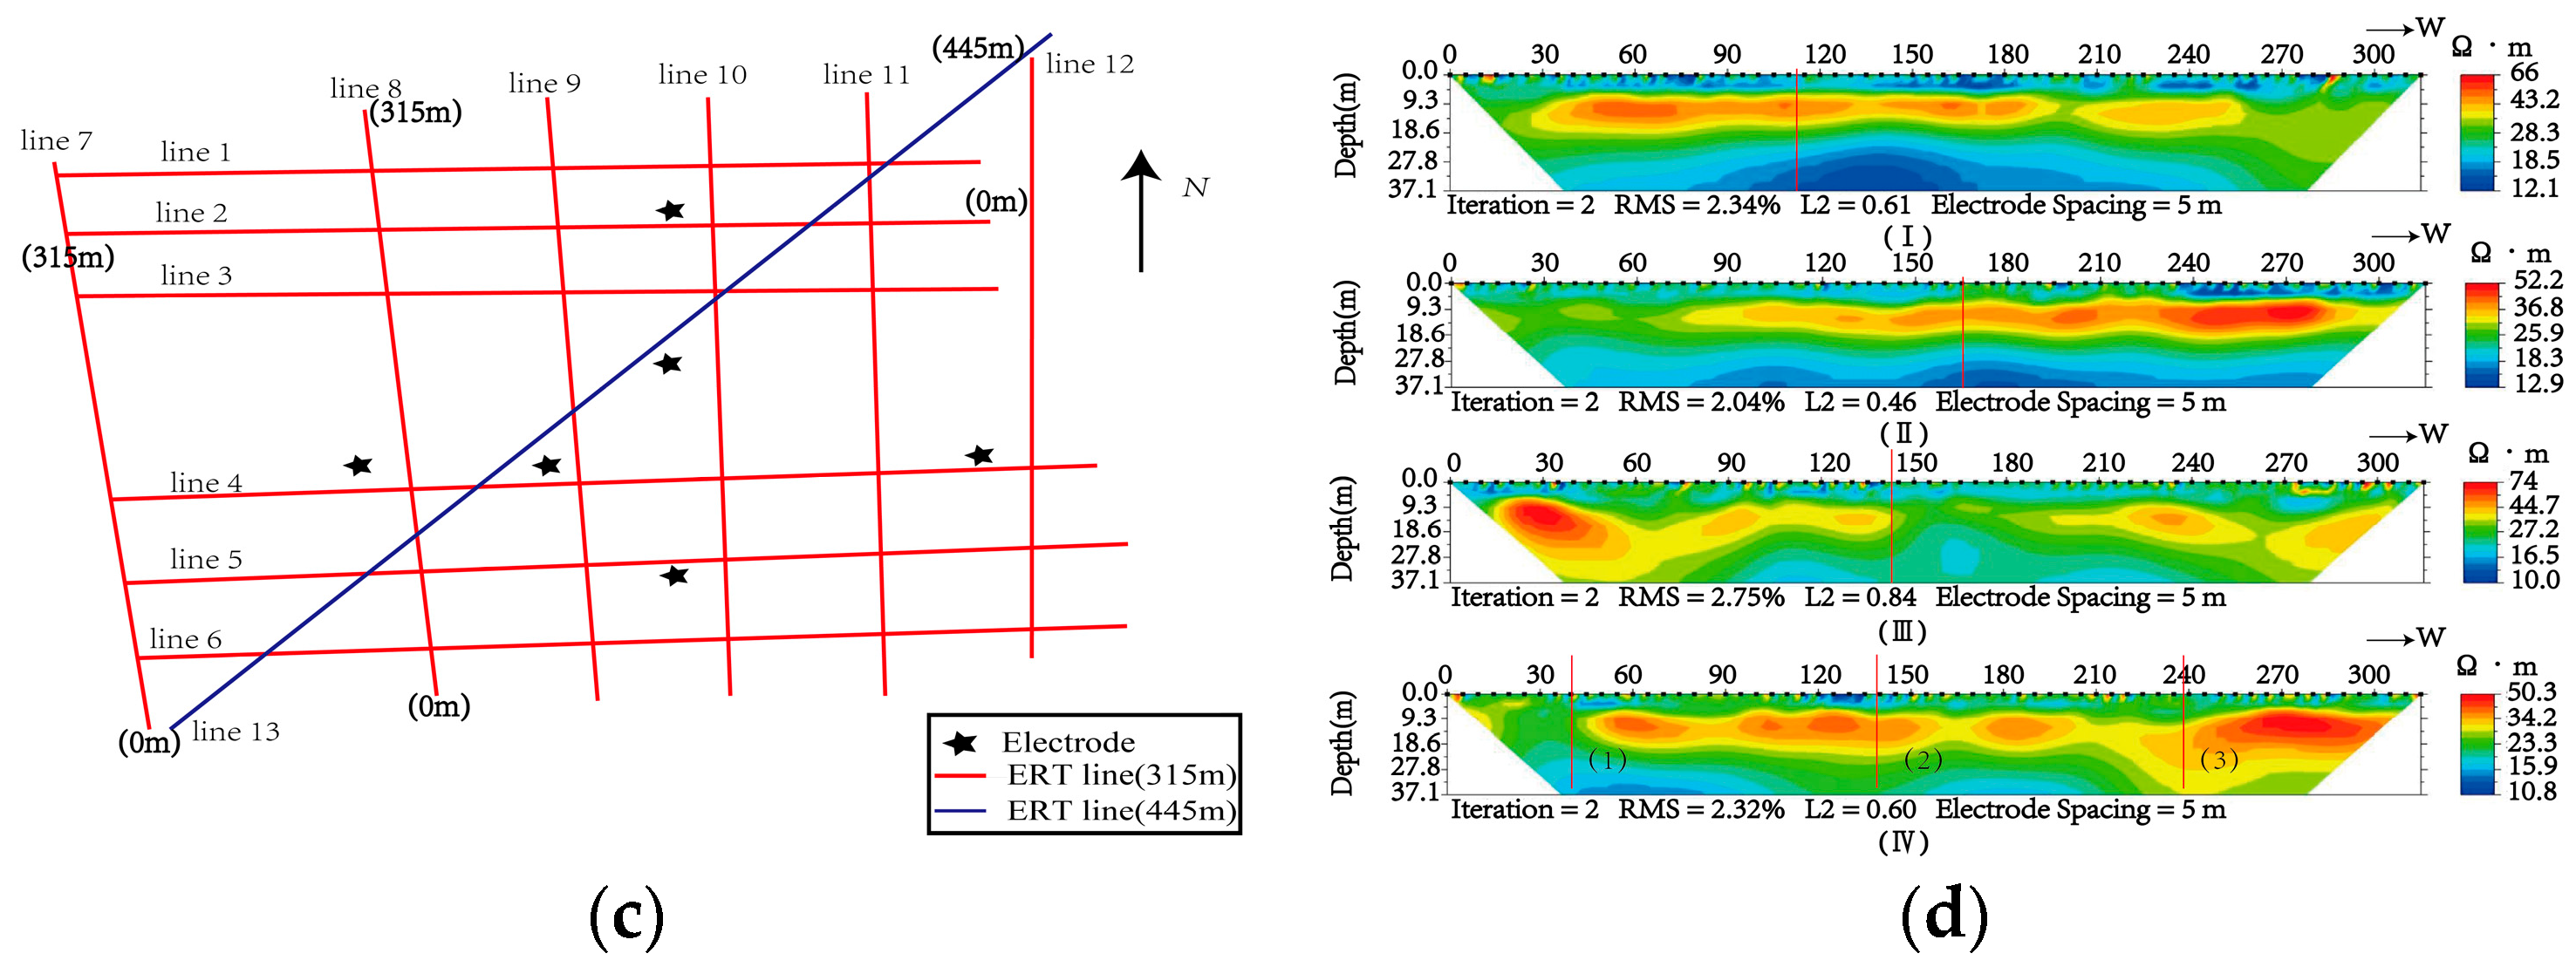
To evaluate the influence of local subsurface electrical heterogeneity on station-specific geoelectric responses, the electrode configurations, two-dimensional (2-D) resistivity profiles, and storm-time field amplitudes at the Chongming and Qingpu stations are compared below. Figure 9 presents the Chongming results in panels (a,b) and the Qingpu results in panels (c,d).
Figure 9.
(a) Electrode layouts and ERT lines at Chongming Station; (b) 2-D resistivity profiles at Chongming Station; (c) electrode layouts and ERT lines at Qingpu Station; (d) 2-D resistivity profiles at Qingpu Station. In (b), subfigures (I), (II), (III), (IV), and (V) correspond to lines 1, 2, 3, 13, and 6 in (a), respectively; in (d), subfigures (I), (II), (III), and (IV) correspond to lines 2, 10, 5, and 4 in (c), respectively. In subfigure (IV) of (d), points (1), (2), and (3) mark the electrode positions from left to right along line 4 in (c). Iteration indicates the number of inversion iterations; RMS denotes the root mean square error, which quantifies the goodness of fit between the inverted model and the measured data; L2 norm reflects the smoothness of the inverted model. The labels E, ES, and W in the upper-right corner indicate the strike directions of the survey lines, denoting that the endpoints of these lines lie to the east, southeast, and west, respectively. The red line indicates the relative position of the electrode along the lines.
Chongming Station: The electrode configuration follows the design shown in Figure 2b. In both the north–south (NS) and east–west (EW) directions, the long- and short-dipole electrode separations are 300 and 150 m, respectively. Five survey lines were used to characterize the electrical structure near the electrodes. Along the EW direction, the common electrode is located at 80–85 m on line 3, the short-dipole electrode at 185 m on line 2, and the long-dipole electrode at 360 m on line 1. Along the NS direction, the common electrode is also located at 80–85 m on line 3, whereas the short- and long-dipole electrodes are located at 185 m on line 13 and 260 m on line 6, respectively.
The Chongming profiles show consistently low resistivity below a depth of approximately 10 m. This feature is attributed to the aquifer overlying the micro-confined groundwater layer. The interval from approximately 10 to 45 m in depth consists predominantly of silty clay and fine sand. Electromagnetic signals in different frequency bands may sample different portions of the upper 37.1 m. Consequently, differences in effective penetration depth may produce different responses in the observed data.
Qingpu Station: As shown in Figure 2d, the long- and short-dipole electrode separations in the EW direction are 200 and 150 m, respectively, and the corresponding separations in the NS direction are 200 and 100 m. Figure 9c combines the electrode layout with the 2-D resistivity profiles from four survey lines. In the EW direction, the common electrode is located at 42–43 m on line 4, the western electrode of the short dipole at 139–140 m on the same line, and the western electrode of the long dipole at 240 m on line 4. In the NS direction, the common electrode is located at 144–145 m on line 5, whereas the short- and long-dipole electrodes are located at 171–175 m on line 10 and 113 m on line 2, respectively.
The four Qingpu profiles exhibit only minor resistivity variations at a depth of approximately 6 m. The profiles along lines 2 and 10 contain high-resistivity zones at depths of 8–20 m, below which resistivity decreases. The profiles along lines 5 and 4 show high-resistivity zones at depths of 10–30 m that gradually weaken with depth. These features indicate that the geoelectric field intensity at Qingpu Station is influenced by variations in both shallow and deeper subsurface media, consistent with previous numerical simulations [35,36,37].
At the sudden commencement of the geomagnetic storm, the maximum induced geoelectric field amplitudes at Chongming Station were 15.327, 90.043, and 21.430 mV/km for the long dipoles in the NS, EW, and NE directions, respectively, and 15.954, 97.723, and 37.413 mV/km for the corresponding short dipoles. The short-dipole maxima were therefore higher than the long-dipole maxima in all three directions. Because the common electrodes for these channels are located close to one another, the subsurface electrical structure beneath them can be regarded as approximately uniform. The observed differences between the long- and short-dipole amplitudes are therefore primarily associated with the uneven resistivity distribution beneath the remaining electrodes.
At a depth of approximately 1 m, the resistivity beneath the long and short dipoles in the EW direction ranges from 11.4 to 27.6 Ω·m and from 18.9 to 46.3 Ω·m, respectively. The corresponding ranges in the NS direction are 12.7–32.1 Ω·m and 13.9–43.3 Ω·m. The relatively high resistivity beneath some electrodes is associated with stronger induced geoelectric field intensities at the surface, in agreement with the numerical simulations and theoretical analyses discussed above.
At Qingpu Station, the maximum amplitudes recorded by the long and short dipoles were 27.11 and 142.01 mV/km in the NS direction, 41.13 and 71.29 mV/km in the EW direction, and 250.61 and 178.69 mV/km in the NE direction, respectively. The calculated ratios λ_NS, λ_EW, λ_NE, and λ_NS/EW are 0.19, 0.57, 1.40, and 0.65, respectively. The shallow resistivity structure exhibits pronounced lateral heterogeneity, with substantial differences among electrode locations. This variability accounts for much of the disparity among the maximum amplitudes recorded by the different channels at Qingpu Station.
Taken together, the observations demonstrate that subsurface heterogeneity strongly modulates the induced geoelectric field at both stations. The Quaternary cover in Shanghai is approximately 200–350 m thick and consists mainly of unconsolidated sedimentary layers, which would generally suggest a relatively homogeneous shallow subsurface. According to Equations (4)–(6) and the theoretical discussion in Section 4.1, spatially distributed field sources should produce similar amplitude variations at the three observation stations in Shanghai. The measurements, however, show pronounced differences among stations for the same field component and between the two stations on Chongming Island. Comparison of these amplitude variations with the high-density electrical survey results from Chongming and Qingpu confirms that local variations in shallow electrical structure are a major source of the station-to-station differences. This interpretation is consistent with previous studies [10,11] and highlights the difficulty of accurately extrapolating geoelectric field values between stations under the current observational framework.
The influence of shallow electrical structure also has practical implications for metallic infrastructure. Although the effect may be limited for short, small-scale pipelines, it can become important for long-distance metallic pipelines. Subsurface inhomogeneity may produce substantial potential differences between locations along a pipeline, thereby increasing the risk of electrochemical corrosion [38,39,40]. The resulting damage may ultimately lead to considerable economic losses and other adverse consequences [41].
The above discussion also raises another consideration: geoelectric field networks in mainland China are designed to detect pre-seismic anomalies related to underground electrical signals, and geoelectric field observation data have yielded numerous valuable research results [42,43,44,45,46,47,48,49]. However, whether each station can detect geoelectric field anomaly signals remains a question worth addressing. In this study, we analyzed changes in the geoelectric field across the continental region during the sudden commencement of geomagnetic storms and, by comparing large-scale observation datasets, demonstrated the critical importance of the surface electrical structure at each geoelectric field observation site to the observational outcomes.
5. Conclusions
In China, approximately 120 sets of ZD9A and GEF geoelectric field instruments are used to measure geoelectric fields, yielding a substantial body of precise and reliable data. Most stations maintain stable observation systems. This paper analyzes the characteristics of the induced geoelectric field during the extreme geomagnetic storm of 10 May 2024, focusing on amplitude changes, directional consistency, and long-to-short dipole ratios. The study also examines the amplitude variations and polarization directions at geoelectric field stations nationwide during the sudden commencement of the storm.
The findings reveal significant horizontal variations in the induced geoelectric field at the sudden commencement of the geomagnetic storm, with no evident concentration effects related to longitude or latitude. Similarly, no geographical concentration effect is evident in the long-to-short dipole ratios of the induced geoelectric field components in the NS, EW, and NE directions. Inland regions tend to show consistent polarization directions for the long and short dipoles. Coastal areas, by contrast, exhibit some deviation in polarization direction, which may be influenced by the placement of the buried electrodes.
Furthermore, this study shows that amplitude variations in the induced geoelectric field across mainland China are associated with the local shallow electrical structure. In this study, we used deterministic signal sources to compare large-area geoelectric field observations. The results reveal considerable variations in signal amplitude, and a single observation station often shows distinct electrical signals from different directions. This indicates that the anomalous characteristics of geoelectric field precursory signals are closely related to inhomogeneity at the observation site, further showing that such precursory signals are strongly influenced by the electrical structure at each station’s location.
Author Contributions
Conceptualization, W.Z. and Q.M.; methodology, W.Z. and Q.M.; software, W.Z.; validation, W.Z., Q.M. and W.L.; formal analysis, W.Z., W.L. and Y.W.; investigation, W.Z., W.L. and Y.W.; resources, Q.M.; data curation, W.Z.; writing—original draft preparation, W.Z.; writing—review and editing, W.Z. and Q.M.; visualization, W.Z.; supervision, W.L. and Y.W.; project administration, W.Z.; funding acquisition, W.Z. and W.L. All authors have read and agreed to the published version of the manuscript.
Funding
This research was funded by the Spark Program of Earthquake Science of the China Earthquake Administration (XH24011C), the Shanghai Science and Technology Commission Research Project (23dz1200200), and the Shanghai Sheshan National Geophysical Observatory (SSKP202302, SSKP202502).
Data Availability Statement
The data used in this study were obtained from the China Earthquake Networks Center and the National Earthquake Data Center “http://data.earthquake.cn (accessed on 10−12 May 2024)” with the permission of the Geomagnetic Network Center of China, Institute of Geophysics, China Earthquake Administration, and the China Earthquake Networks Center. Restrictions apply to the availability of these data.
Acknowledgments
The Dst and SYM-H indices used in this paper were obtained from “Kyoto Dst index service” “http://wdc.kugi.kyoto-u.ac.jp (accessed on 10−12 May 2024)”. Figures were prepared using the GMT v5.4 [50]. We would like to thank the editor for their encouragement.
Conflicts of Interest
The authors declare no conflicts of interest.
References
- Xu, W.Y. Advances on Geomagnetic Studies in China. Chin. J. Geophys. 1994, 37, 284–294. (In Chinese) [Google Scholar]
- Gonzalez, W.D.; Joselyn, J.A.; Kamide, Y.; Kroehl, H.W.; Rostoker, G.; Tsurutani, B.T.; Vasyliunas, V.M. What is a geomagnetic storm? J. Geophys. Res. 1994, 99, 5771. [Google Scholar] [CrossRef] [Scilit]
- Ding, J.H.; Huang, X.X.; Dai, S.L. The Effect of Lunar Phase on Seismicity. Earthquake 1994, 4, 7–13. (In Chinese) [Google Scholar]
- Kpaev, A.P. Geoelectrics Principle; Zhang, K.G.; Chen, P.G.; Zhang, Z.C.; Gu, Y.T.; Wang, S.H., Translators; Geological Publishing House: Beijing, China, 1954; pp. 100–191. [Google Scholar]
- Sun, Z.J.; Wang, H.J. Introduction of Geoelectricity; Seismological Press: Beijing, China, 1984; pp. 15–19. (In Chinese) [Google Scholar]
- Li, J.M. Geoelectric Field and Electrical Method; Geological Publishing House: Beijing, China, 2005; pp. 38–39. (In Chinese) [Google Scholar]
- Nikitina, L.; Trichtchenko, L.; Boteler, D.H. Assessment of extreme values in geomagnetic and geoelectric field variations for Canada. Space Weather 2016, 14, 481–494. [Google Scholar] [CrossRef] [Scilit]
- Lotz, S.I.; Danskin, D.W. Extreme Value Analysis of Induced Geoelectric Field in South Africa. Space Weather 2017, 15, 1347–1356. [Google Scholar] [CrossRef] [Scilit]
- Wu, S.Y.; Yao, S.; Feng, X.D.; Wei, W.B.; Yin, Y.T.; Zhang, L.T.; Dong, H.; Wang, G.W.; Liu, J.L.; Yu, Y.Q.; et al. Features and Source Current of Long-Period Induced Geoelectric Field during Magnetic Storms: A Case Study. Space Weather 2020, 18, e2019SW002298. [Google Scholar] [CrossRef] [Scilit]
- McKay, A.J.; Whaler, K.A. The electric field in northern England and southern Scotland:Implications for geomagnetically induced currents. Geophys. J. Int. 2006, 167, 613–625. [Google Scholar] [CrossRef] [Scilit]
- Love, J.J.; Lucas, G.M.; Kelbert, A.; Bedrosian, P.A. Geoelectric hazard maps for the Mid-Atlantic United States: 100 year extreme values and the 1989 magnetic storm. Geophys. Res. Lett. 2018, 45, 5–14. [Google Scholar] [CrossRef] [Scilit]
- Cuttler, S.W.; Love, J.J.; Swidinsky, A. Geoelectric hazard assessment: The differences of geoelectric responses during magnetic storms within common physiographic zones. Earth Planets Space 2018, 70, 35. [Google Scholar] [CrossRef] [Scilit]
- Pulkkinen, A.; Pirjola, R.; Viljanen, A. Determination of ground conductivity and system parameters for optimal modeling of geomagnetically induced current flow in technological systems. Earth Planets Space 2007, 59, 999–1006. [Google Scholar] [CrossRef] [Scilit]
- Viljanen, A.; Pirjola, R.; Wik, M.; Ádám, A.; Prácser, E.; Sakharov, Y.; Katkalov, J. Continental Scale Modelling of Geomagnetically Induced Currents. J. Space Weather Space Clim. 2012, 2, A17. [Google Scholar] [CrossRef] [Scilit]
- Wei, L.H.; Homeier, N.; Gannon, J.L. Surface electric fields for North America during historical geomagnetic storms. Space Weather 2013, 11, 451–462. [Google Scholar] [CrossRef] [Scilit]
- Varotsos, P.; Alexopoulos, K. Physical Properties of the Variations of the Electric Field of the Earth Preceding Earthquakes. Tectonophysics 1984, 110, 73–98. [Google Scholar] [CrossRef] [Scilit]
- Xi, J.L.; Zhao, J.L.; Wang, Y.Q.; Wang, L.W.; Li, Y.D. Research on observational technology of the geoelectric field. Earthquake 2002, 67–73. (In Chinese) [Google Scholar]
- Zhang, X.G.; Wang, L.W.; Zhang, Y.; Hu, Z.; Zhang, S.Z. Development and Application of GEF-II Geoelectric Field Instrument. Earthq. Res. China 2024, 40, 470–483. (In Chinese) [Google Scholar]
- Clerc, G.; Petiau, G.; Perrier, F. The Garchy 1995–1996 Electrode Experiment; technical report; CNRS: Garchy, France, 1998. [Google Scholar]
- Petiau, G. Second Generation of Lead-Lead Chloride Electrodes for Geophysical Applications. Pure Appl. Geophys. 2000, 157, 357–382. [Google Scholar] [CrossRef] [Scilit]
- Varotsos, P.; Alexopoulos, K. Physical Properties of the Electric Field of the Earth Preceding Earthquakes. II. Determination of Epicenter and Magnitude. Tectonophysics 1984, 110, 99–125. [Google Scholar] [CrossRef] [Scilit]
- Geller, R.J. VAN: A Critical Evaluation. A Critical Review of VAN; Lighthill, J., Ed.; World Scientific: Singapore, 1996; pp. 155–238. [Google Scholar]
- Hayakawa, M. Earthquake Prediction with Radio Techniques; Wiley: Hoboken, NJ, USA, 2015; p. 46. [Google Scholar]
- Varotsos, P.; Lazaridou, M. Latest Aspects of Earthquake Prediction in Greece Based on Seismic Electric Signals. Tectonophysics 1991, 188, 321–347. [Google Scholar] [CrossRef] [Scilit]
- Varotsos, P.; Sarlis, N.V.; Skordas, E.S. Natural Time Analysis: The New View of Time: Precursory Seismic Electric Signals, Earthquakes and Other Complex Time Series; Springer Science & Business Media: Berlin/Heidelberg, Germany, 2011. [Google Scholar]
- Varotsos, P.; Sarlis, N.V.; Skordas, E.S.; Uyeda, S.; Kamogawa, M. Natural Time Analysis of Critical Phenomena. Proc. Natl. Acad. Sci. USA 2011, 108, 11361–11364. [Google Scholar] [CrossRef] [Scilit]
- Li, W.; Ma, Q.Z.; Wang, G.Y. Abnormal Signal Recognition by Multi-Dipole Observation of Geoelectric Field. Earthq. Res. China 2014, 30, 91–101. (In Chinese) [Google Scholar]
- Ma, Q.Z.; Qian, J.D.; Li, W.; Zhao, W.Z.; Fang, G.Q. Characteristics of the Spatial Variation of Geoelectric Field Signals Recorded at the Station in Huadong Area in China when 4 Heavy Currents Are Injected. Chin. J. Geophys. 2016, 59, 2598–2614. (In Chinese) [Google Scholar] [CrossRef] [Scilit]
- Weidelt, P.; Chave, A.D. The Magnetotelluric Response Function. The Magnetotelluric Method: Theory and Practice; Chave, A.D., Jones, A.G., Eds.; Cambridge University Press: Cambridge, UK, 2012; pp. 122–164. [Google Scholar]
- Bedrosian, P.A.; Love, J.J. Mapping Geoelectric Fields during Magnetic Storms: Synthetic Analysis of Empirical United States Impedance. Geophys. Res. Lett. 2015, 42, 10160–10170. [Google Scholar] [CrossRef] [Scilit]
- Fu, L.K. A Course in Electrical Prospecting; Geological Publishing House: Beijing, China, 1983; pp. 65–70. (In Chinese) [Google Scholar]
- Ma, Q.Z.; Qian, J.D. The Influence of Inhomogeneous Geoelectric Structure on the Signals of Geoelectric Field. Earthquake 2003, 23, 1–7. (In Chinese) [Google Scholar]
- Huang, Q.H.; Lin, Y.F. Numerical Simulation of Selectivity of Seismic Electric Signal and Its Possible Influences. Chin. J. Geophys. 2010, 53, 535–543. (In Chinese) [Google Scholar]
- Dong, B.; Wang, Z.; Liu, L.; Liu, L.; Liu, C. The Proximity Effect on the Induced Geoelectric Field at the Interface of Different Conductivity Structures with Lateral Variations during Geomagnetic Storms. Chin. J. Geophys. 2015, 58, 238–246. (In Chinese) [Google Scholar] [CrossRef]
- Ma, Q.Z.; Qian, J.D. Boundary Element Method for Forward Solution of Two-Dimensional Frequency Electromagnetic Sounding. Chin. J. Geophys. 1995, 38, 144–155. (In Chinese) [Google Scholar]
- Ma, Q.Z. The Boundary Element Method for 3-D Resistivity Modeling in Layered Earth. Geophysics 2002, 67, 610–617. [Google Scholar] [CrossRef] [Scilit]
- Ma, Q.Z. Study on the Characteristics of the Geoelectric Field from Underground Source. Earthquake 2007, 27, 149–154. (In Chinese) [Google Scholar]
- Schwalm, L.H.; Sandor, J.G. Stray Current: The Major Cause of Underground Plant Corrosion. Mater. Perform. 1969, 31–36. [Google Scholar]
- Martin, B. A History of Stray Current Corrosion. Corros. Mater. 2006, 31, 12–14. [Google Scholar]
- Bertolini, L.; Carsana, M.; Pedeferri, P. Corrosion Behaviour of Steel in Concrete in the Presence of Stray Current. Corros. Sci. 2007, 49, 1056–1068. [Google Scholar] [CrossRef] [Scilit]
- Kelbert, A. The Role of Global/Regional Earth Conductivity Models in Natural Geomagnetic Hazard Mitigation. Surv. Geophys. 2020, 41, 115–166. [Google Scholar] [CrossRef] [Scilit]
- Ma, Q.Z.; Tang, Y.X.; Zhang, Y.X. Abnormal characterisrics of geoelectric field at Lhasa station before 4 MS6. 0 earthquakes of 2008 in Tibet. Earthquake 2011, 31, 86–97. (In Chinese) [Google Scholar]
- Xi, J.L.; Zhao, J.L.; Gao, S.H.; Wang, X.L.; Li, G.Y.; Meng, F.B. Study on the characteristics and mechanism of long-period geoelectric field variation: A case study from Dulan seismic station. Seismol. Geol. 2023, 45, 1092–1111. (In Chinese) [Google Scholar] [CrossRef]
- Ma, Q.Z. Multi-dipole observation system and study on the abnormal variation of the geoelectric field observed at Capital Circle area before the Wenan MS5.1 earthquake. Acta Seismol. Sin. 2008, 21, 618–628. (In Chinese) [Google Scholar] [CrossRef] [Scilit]
- Ma, Q.Z.; Feng, Z.S.; Song, Z.P.; Zhao, W.G. Study on the variation characteristics of the geoelectric field preceding earthquakes. Acta Seismol. Sin. 2004, 17, 334–343. (In Chinese) [Google Scholar] [CrossRef] [Scilit]
- Ma, Q.Z. Abnormal signals of geoelectric field related to Wenchuan Ms8.0 earthquake recorded at the Chengdu station. Acta Seismol. Sin. 2018, 40, 351−363. (In Chinese) [Google Scholar] [CrossRef]
- Ma, Q.Z.; Zhao, W.G.; Zhang, W.P. Abnormal variations of geoelectric field recorded at Wenxian station preceding earthquakesand their application to the prediction of the 2001 Ms8.1 Kunlun earthquake. Acta Seismol. Sin. 2009, 31, 660–670. (In Chinese) [Google Scholar]
- Ma, Q.Z.; Li, W.; Fang, G.Q.; Zhou, J.N. Electromagnetic anomalies before the Lushan Ms7.0 earthquake. Acta Seismol. Sin. 2013, 35, 717–730. (In Chinese) [Google Scholar]
- Ma, Q.Z.; Li, W.; Gong, Y.; Zhang, Y.N.; Liu, M.J.; Zheng, Z.H.; Lai, J.S.; Wen, Y.L.; Zhao, W.Z. Network Observation of Geoelectric Field Along Fujian Coast and Its Implication Meaning for Short-Term and Imminent Earthquake Prediction in Fujian-Taiwan Region. South China J. Seismol. 2026, 46, 27–40. (In Chinese) [Google Scholar]
- Wessel, P.; Smith, W.H.F.; Scharroo, R.; Luis, J.; Wobbe, F. Generic Mapping Tools: Improved Version Released. EOS Trans. Am. Geophys. Union 2013, 94, 409–410. [Google Scholar] [CrossRef] [Scilit]

Disclaimer/Publisher’s Note: The statements, opinions and data contained in all publications are solely those of the individual author(s) and contributor(s) and not of MDPI and/or the editor(s). MDPI and/or the editor(s) disclaim responsibility for any injury to people or property resulting from any ideas, methods, instructions or products referred to in the content. |
© 2026 by the authors. Licensee MDPI, Basel, Switzerland. This article is an open access article distributed under the terms and conditions of the Creative Commons Attribution (CC BY) license.