


Abstract
The ecohydrology of Horseshoe Bay lagoon on Magnetic Island, a World Heritage Area off Townsville, was studied using aerial photography and maps (1892–2023); Landsat/Sentinel-2 imagery; LIDAR and RTK-GPS surveys; in situ water-level and salinity logging during the 2025 dry season and 2026 wet season; and hydrodynamic modelling. We suggest from that data that three cumulative human interventions, namely the diversion of Eastern Creek into the lagoon, the unmitigated catchment erosion delivering sand to the lagoon, and the progressive dredging of the Outflow Channel culminating in the removal of a natural shoal (“weir”) in November 2022, have altered the lagoon’s hydroperiod and allowed tidal seawater intrusion. This likely caused the salinisation of the lagoon, mass mortality of Weeping Paperbark (Melaleuca leucadendra L.), loss of Bulkuru Sedge (Eleocharis dulcis L.), and possible impacts on Magpie Geese (Anseranas semipalmata) and Agile Wallabies (Notamacropus agilis). Restoration measures are needed all over the watershed of the lagoon and its estuary. These include restoring the outflow weir, using one-way flap gates, and catchment erosion control, to be implemented under adaptive management principles. Long-term monitoring of the hydrodynamics and the ecology of the lagoon is needed to guide the implementation of ecohydrology-based solutions for the environmental implications of the dead trees in the upper lagoon, the new sand delta in the lower lagoon, and long-term sea level rise.
Keywords:
hydrology; sedimentation; urbanisation; salinisation; ecosystem health; Yunbenun; Magpie Geese; lagoon 1. Introduction
Coastal plains worldwide have been heavily modified by human activities in the last 100 years [1,2,3]. Lagoons and coastal wetlands have been most impacted [4,5,6,7], and there is an extensive scientific literature quantifying their degradation throughout the world, including the following: development of urban and agricultural coastal settlements with consequent pollutant runoff; sediment erosion and deposition of riverbeds; and damage to sensitive ecosystems through human movements and harvesting [8,9,10,11,12]. The scientific literature also extensively documents the human-mediated degradation of coastal lagoons and their ecosystem services, including the loss of habitat for coastal and wetland species, reduced amenity, recreation, cultural and spiritual values, reduced water quality, lower abundance and diversity of food species such as aquatic plants, fish and shellfish, and reduced capacity to filter nutrients, buffer against severe weather events, and sequester carbon [13,14,15,16]. Lagoons worldwide have been and are being degraded. For instance, for the Mediterranean lagoons, long-term monitoring documents the extreme turbidity and reduced light availability from massive algal blooms [17,18]. Many Italian coastal lagoons suffer from persistent eutrophic conditions and show no long-term recovery trends [19,20]. In China, the Pinqing Lagoon has high nutrient levels in the wet summer season and high heavy metal levels in the dry winter season [21]. Irish lagoons suffer from eutrophication due to runoff of excessive nutrient inputs of nitrogen and possibly phosphorus from agriculture [22]. A similar degradation of coastal lagoons from agricultural runoff is also reported in Sri Lanka [23] and in Australia [7,24,25,26] and along the Mexican coast of the Gulf of Mexico [27]. In most of these cases, the degradation results from two or more sources that include increased nutrient loads from agricultural and urban runoff, alterations to their freshwater inflows from water management upstream and from changes in rainfall and evaporation, modification to their tidal regime by engineering measures downstream, and more recently, pollution by heavy metals [28] and microplastics [29].
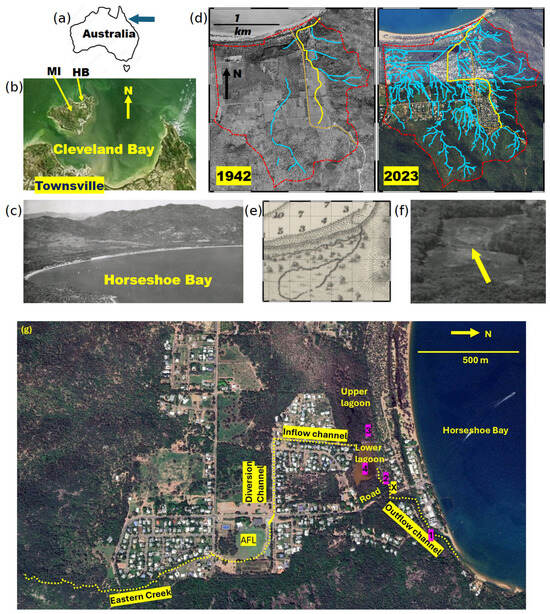
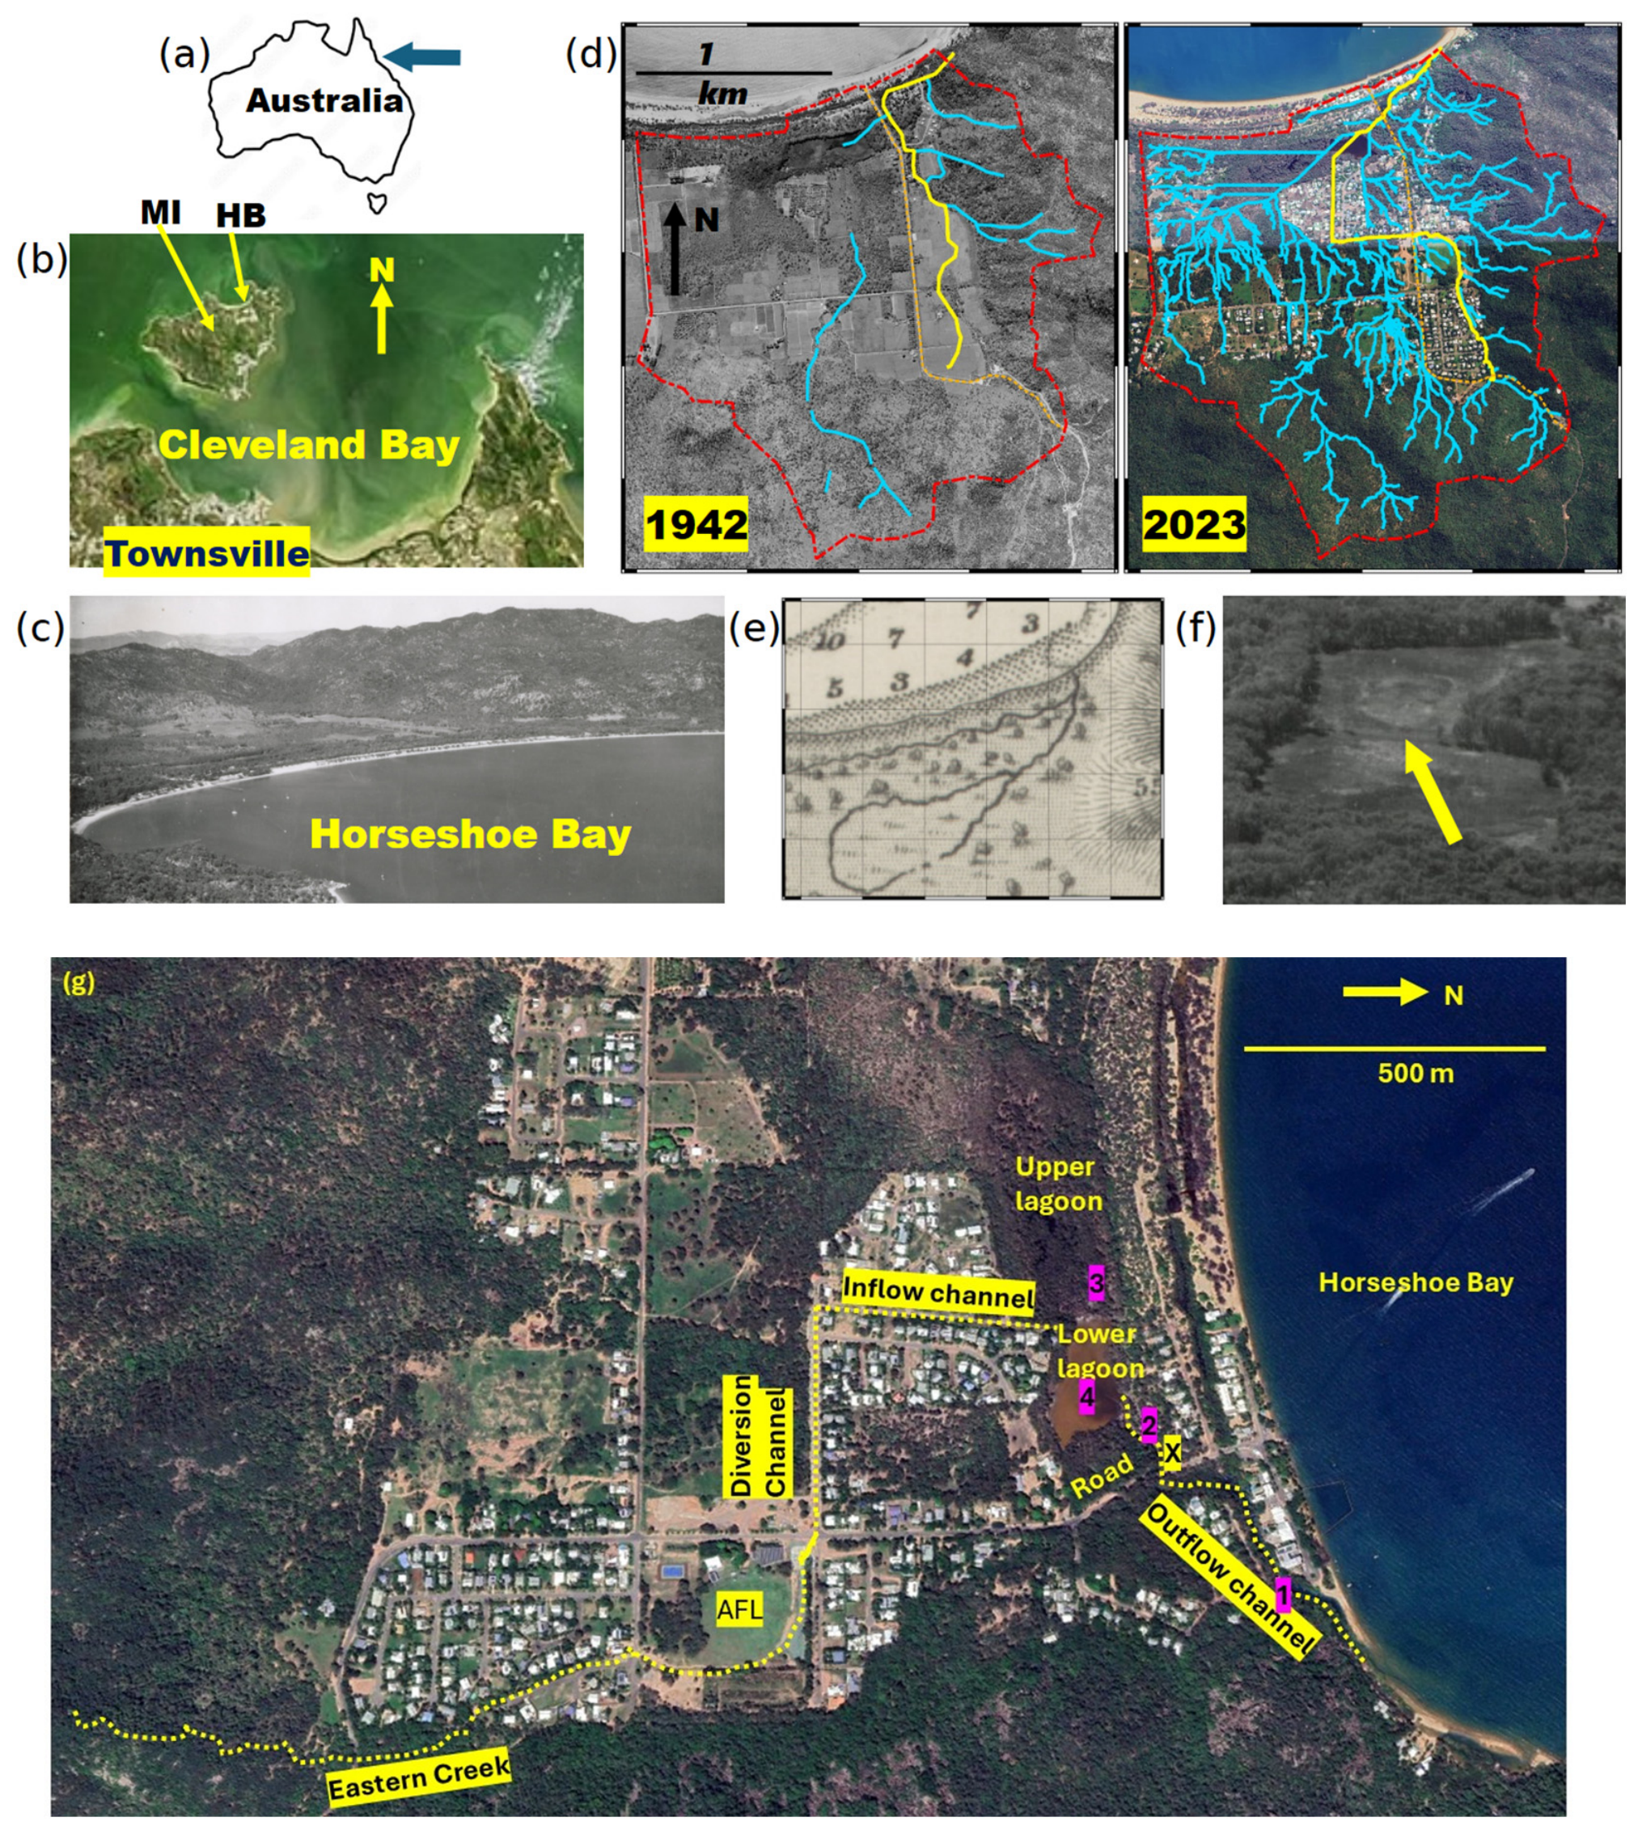
To address this degradation, the United Nations Development Programme advocates for the coast to be responsibly managed for the future (https://www.undp.org/sustainable-development-goals, accessed on 28 September 2024). However, in practice, it is still rare to find sites where solutions are implemented to effectively address the pressure of all human activities on coastal wetlands and lagoons [30]. Meadows et al. [31] first addressed the science behind these issues by their publication ‘Limits to Growth’, a model of the patterns and dynamics of human presence on earth. There were several re-interpretations of these models in subsequent decades [32]. In turn, this led to the development of ecohydrology as a science promoting nature-based solutions aiming at mitigating human impact and enhancing catchment resilience [33]. In this paper, we present the case of the lagoon in Horseshoe Bay on Magnetic Island (Yunbenun) off Townsville, within the Great Barrier Reef World Heritage Area (Figure 1). We quantify its environmental degradation within the context of lagoons worldwide. We combined historical aerial photography and maps (1892–2023), Landsat/Sentinel-2 imagery, LIDAR and RTK-GPS surveys (with an accuracy of ±0.02 m), an in situ water-level and salinity logging field study during the 2025 dry season and 2026 wet season, and hydrodynamic modelling. We suggest from that data that three cumulative human interventions, namely the diversion of Eastern Creek since the 1940s, the catchment erosion delivering sand to the lagoon, and the progressive dredging of the Outflow Channel culminating in the removal of a natural shoal (“weir”) in November 2022, have altered the lagoon’s hydroperiod and allowed tidal seawater intrusion. The stated consequences are salinisation, likely the mass mortality of Weeping Paperbark (Melaleuca leucadendra L.) and the loss of Bulkuru Sedge (Eleocharis dulcis L.), and possible impacts on Magpie Geese (Anseranas semipalmata) and Agile Wallabies (Notamacropus agilis). A set of ecohydrology-based restoration measures is proposed (restoring the outflow weir, one-way flap gates, and catchment erosion control) to be delivered under adaptive management. This study builds on our previous work [24,34] for a new site-specific instrumented record for the LIDAR volumetric analysis and the hydroperiod reconstruction.
Figure 1.
(a,b) Location maps. (c) A 1939 oblique aerial image of Horseshoe Bay showing the coastal plain and the hills with a small European influence then. (d) The yellow line shows the Eastern Creek (left) in 1942 and (right) in 2023. (e) The 1892 map of the Horseshoe Bay Lagoon (HBL) before European settlement. (f) A 1942 aerial view of HBL showing that it was split into two lagoons by a causeway and that both lagoons were unvegetated. The yellow arrow points to the causeway. (g) The 2022 Google Earth view of the HBL watershed. The dotted yellow line shows the Eastern Creek that flows along the sports field (AFL). The line also shows the HBL Outflow Channel. The HBL was then split into two lagoons: the unvegetated lower lagoon to the east and the forested upper lagoon to the west. The labels 1–4 mark mooring sites. The label X marks the location of the former shoal in the Outflow Channel.
2. Site Description
The Horseshoe Bay lagoon (HBL; Figure 1) is a seasonal freshwater lagoon on Magnetic Island (Yunbenun in the language of the Wulgurukaba Traditional Custodians) in Cleveland Bay offshore Townsville, the largest city in regional Queensland and the largest tropical city in Australia. The entire island and its surrounding marine environments fall within the protected Great Barrier Reef World Heritage Area boundaries [https://parks.qld.gov.au/parks/magnetic-island/about, accessed on 10 July 2025]. Around 70 to 78% of the island’s land area is protected as a national park or conservation park. Horseshoe Bay is the northernmost bay in Magnetic Island. It drains a coastal plain surrounded by hills. Aboriginal people inhabited the island; they remained on the island until the 1920s and 1930s when they were displaced as more Europeans moved into the area [35]. The island is now a residential suburb of Townsville and a tourism hub. The coastal plain of Horseshoe Bay was first settled by Europeans in 1909. Following European settlement, the primary economy was the gathering of hoop pine and granite, as well as pineapple farming that used freshwater from the HBL. The HBL supports a rich birdlife, and its natural beauty provides important mental relaxation and psychological benefits to the residents and visitors, as well as aesthetic, spiritual and recreational benefits, which are recognised as cultural ecosystem services.
An earthen causeway across HBL, topped with a narrow railway track (see the yellow arrow in Figure 1f), was constructed by the first European settlers and used in 1909–1939 to carry products to a jetty in Horseshoe Bay. This causeway divided the lagoon into the lower lagoon to the east and the upper lagoon to the west. In 1939, a road was constructed for products to be trucked over the hills to Arcadia Bay [35], a more sheltered bay with deeper water for boat access further south on the east coast of Magnetic Island. At that time, use of the causeway ceased, but the causeway was not removed. The seasonal floodplains around HBL were heavily vegetated and extensively logged; much of it has since been encroached upon by urbanisation (Figure 1g). About half of what remains of the vegetation around HBL is now protected in the HBL Conservation Park.
The HBL is the largest seasonal freshwater lagoon and the main Bulkuru Sedge (E. dulcis) swamp on the island. During the wet season, water flowing down the surrounding hills and surfacing in springs replenishes the lagoon. This stream inflow presently occurs in two small streams on the western side that drain largely pristine forested areas with minimal erosion and a major stream (called here the Eastern Creek) on the eastern, urbanised side (Figure 1). Historically, the Eastern Creek flowed straight downhill towards the Outflow Channel at Site X (Figure 1d). Aerial photographs reveal that, with urbanisation, that creek was diverted westward in the late 1970s to flow through a Diversion Channel and then into the Inflow Channel draining into HBL. The Inflow Channel has three concrete weirs to trap the coarse sediment. Flood water is exported seaward from HBL through an Outflow Channel that is mangrove-fringed downstream of Site X (Figure 1). In 2025, to combat saline intrusion, a non-government organisation blocked the inflow of seawater in the Outflow Channel into HBL, but only during spring high tides, by putting sandbags in the culverts under the road. That stopped in January 2026.
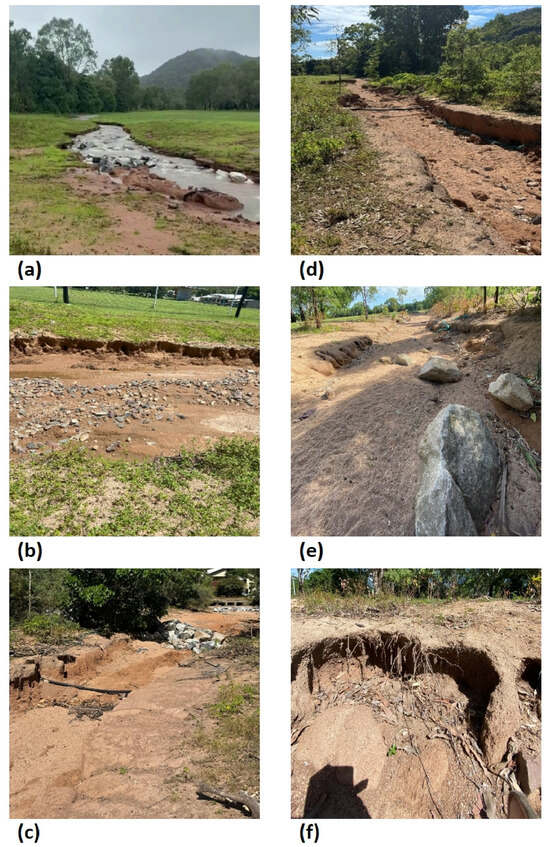
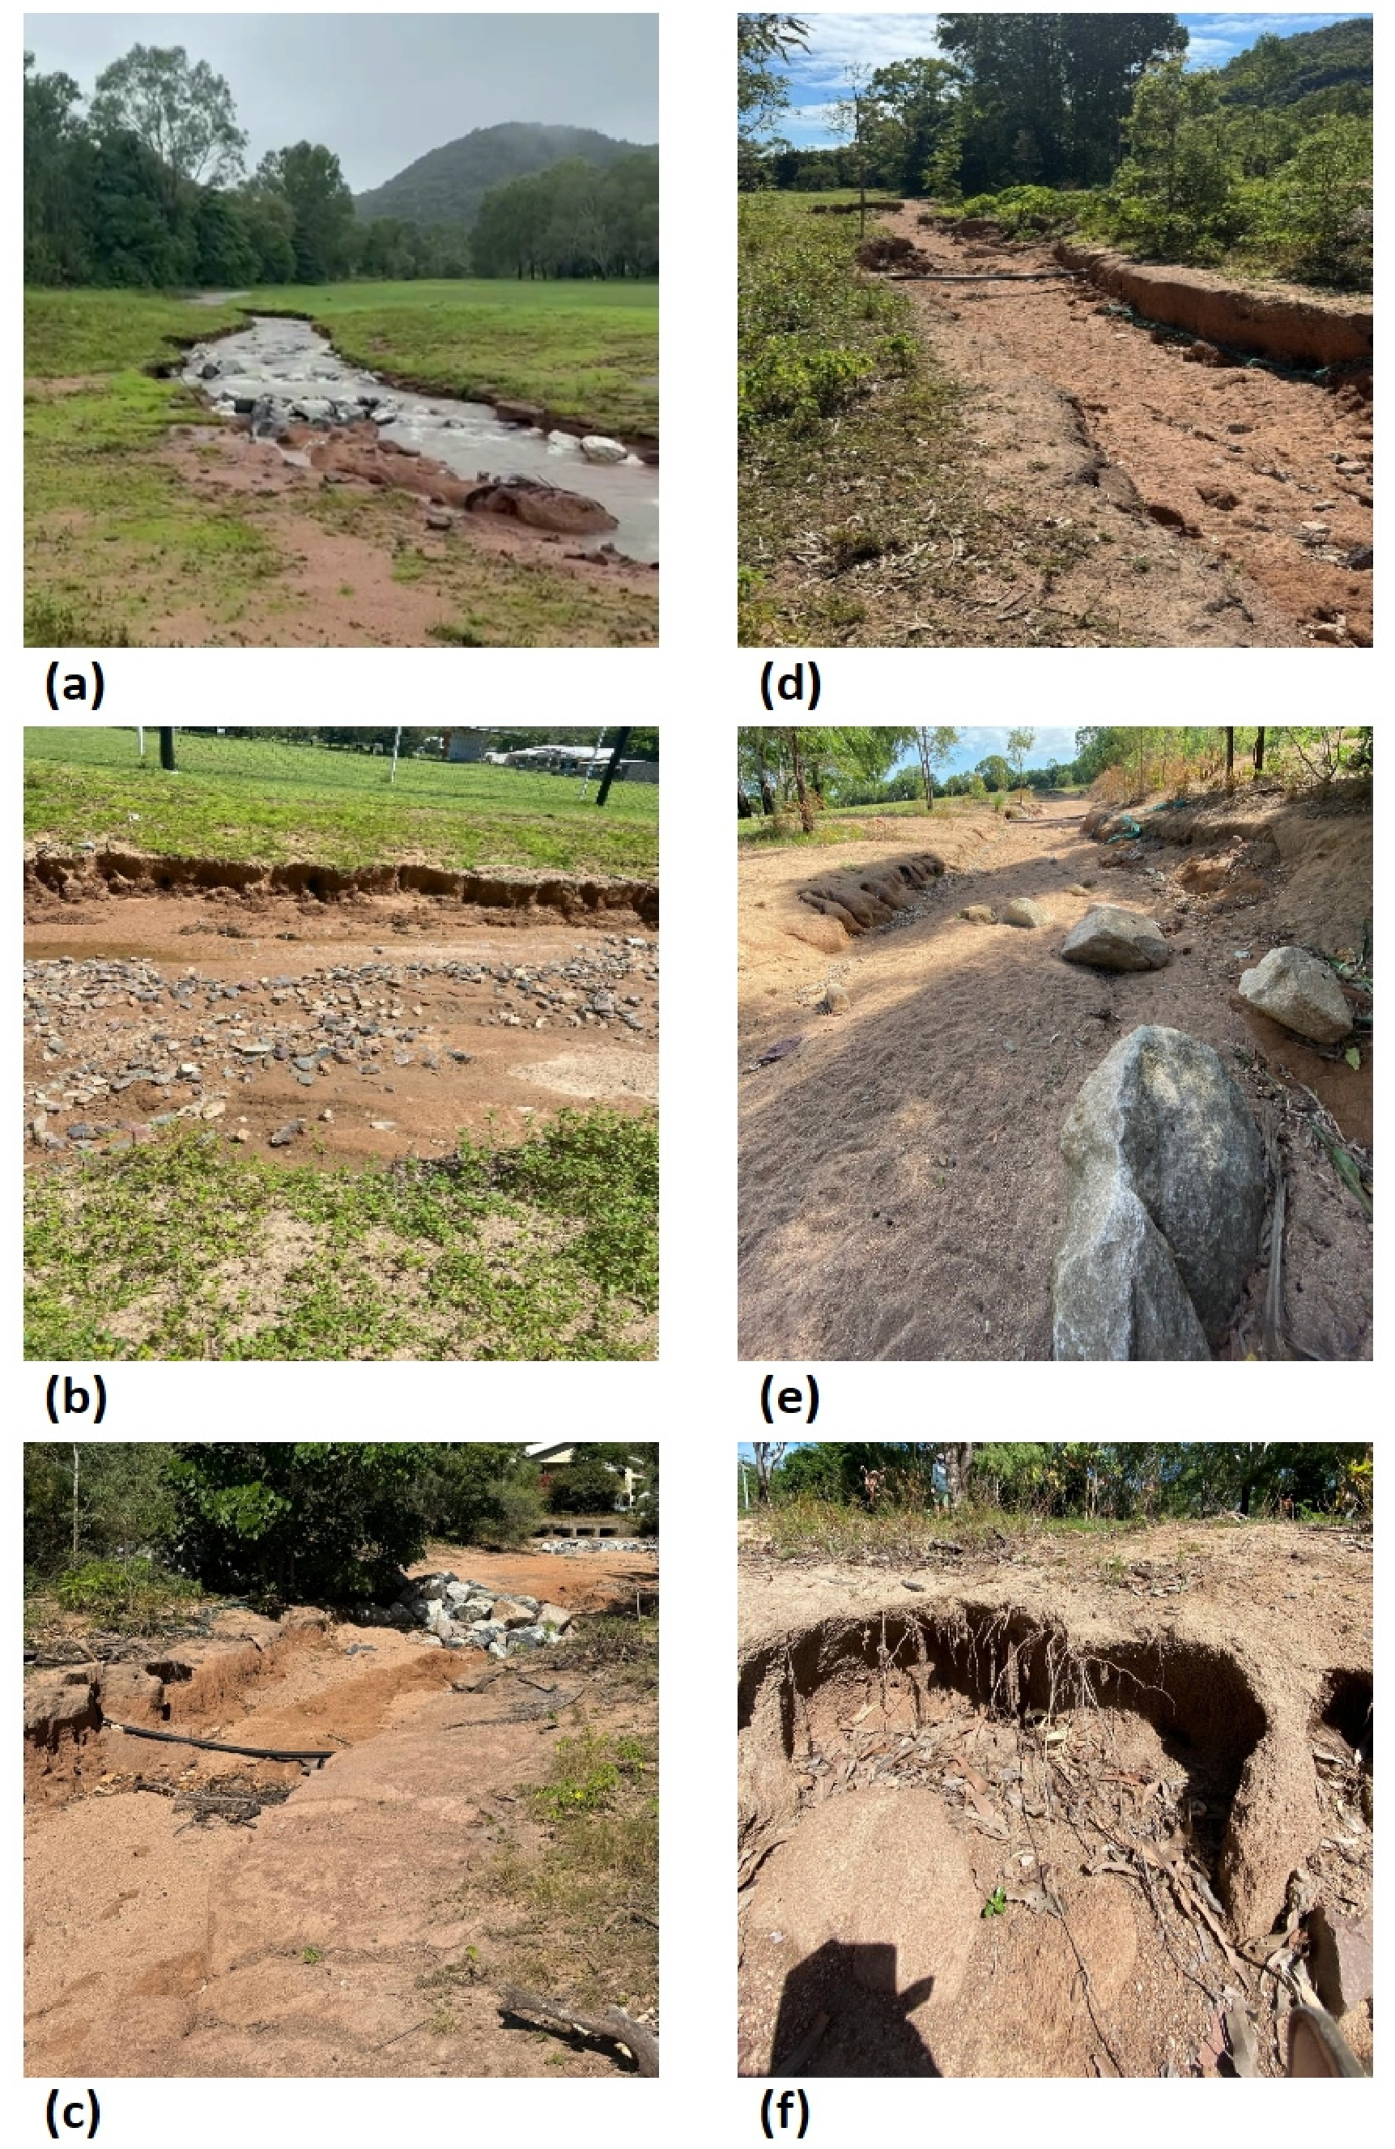
Up to 2025, there were no erosion-control measures in the Eastern Creek that skirts the AFL sports field (Figure 2a,b). In 2025, some leaky weirs were built in the creek to mitigate erosion, but they were ineffective, having no aprons and being too far apart (Figure 2c,d). Following the installation of the rocky weirs, the erosion was increased by the waterfall effect as the water tumbled down over the weirs. By 2026, the City Council covered the stream bed with sand. However, the deposited sand was swiftly eroded away (Figure 2e). Bank erosion was severe (Figure 2f).
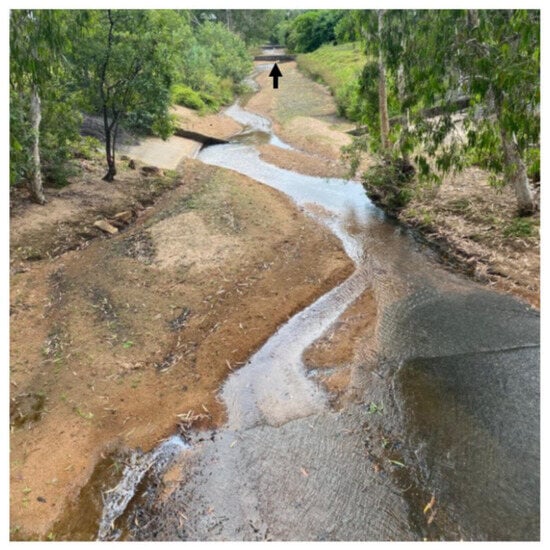
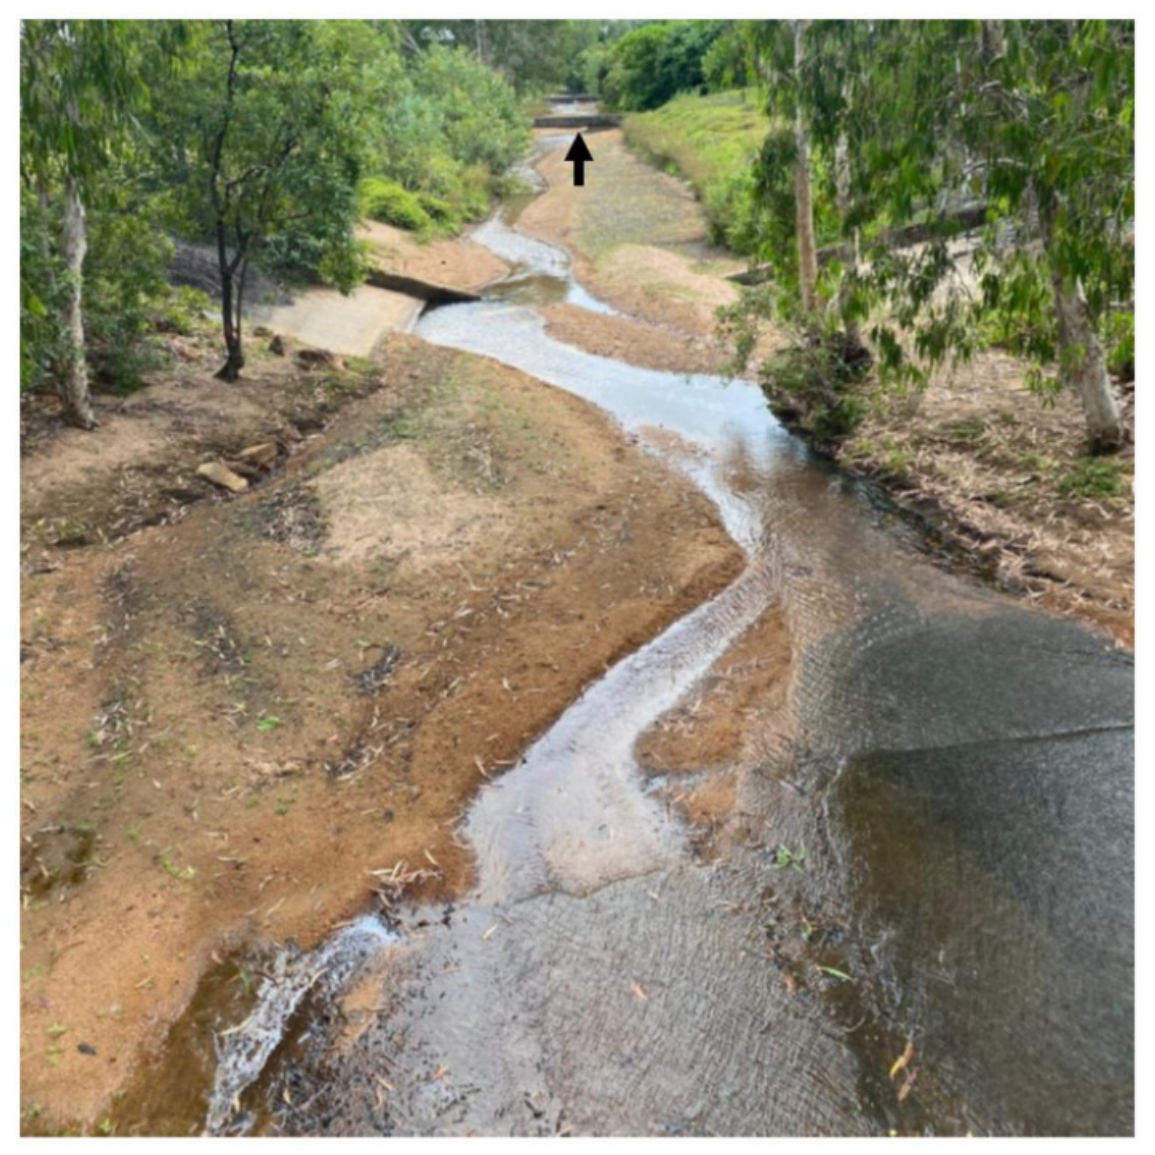
Figure 2.
(a–f) Photographs from 2024 to 2026 of the erosion in Eastern Creek. The explanations are in the text.
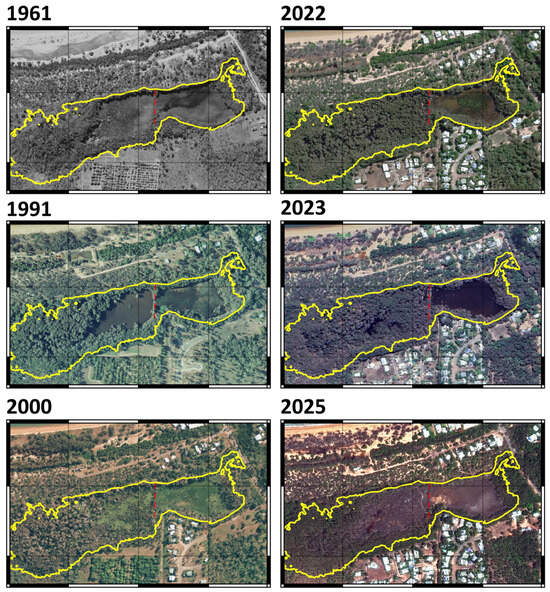
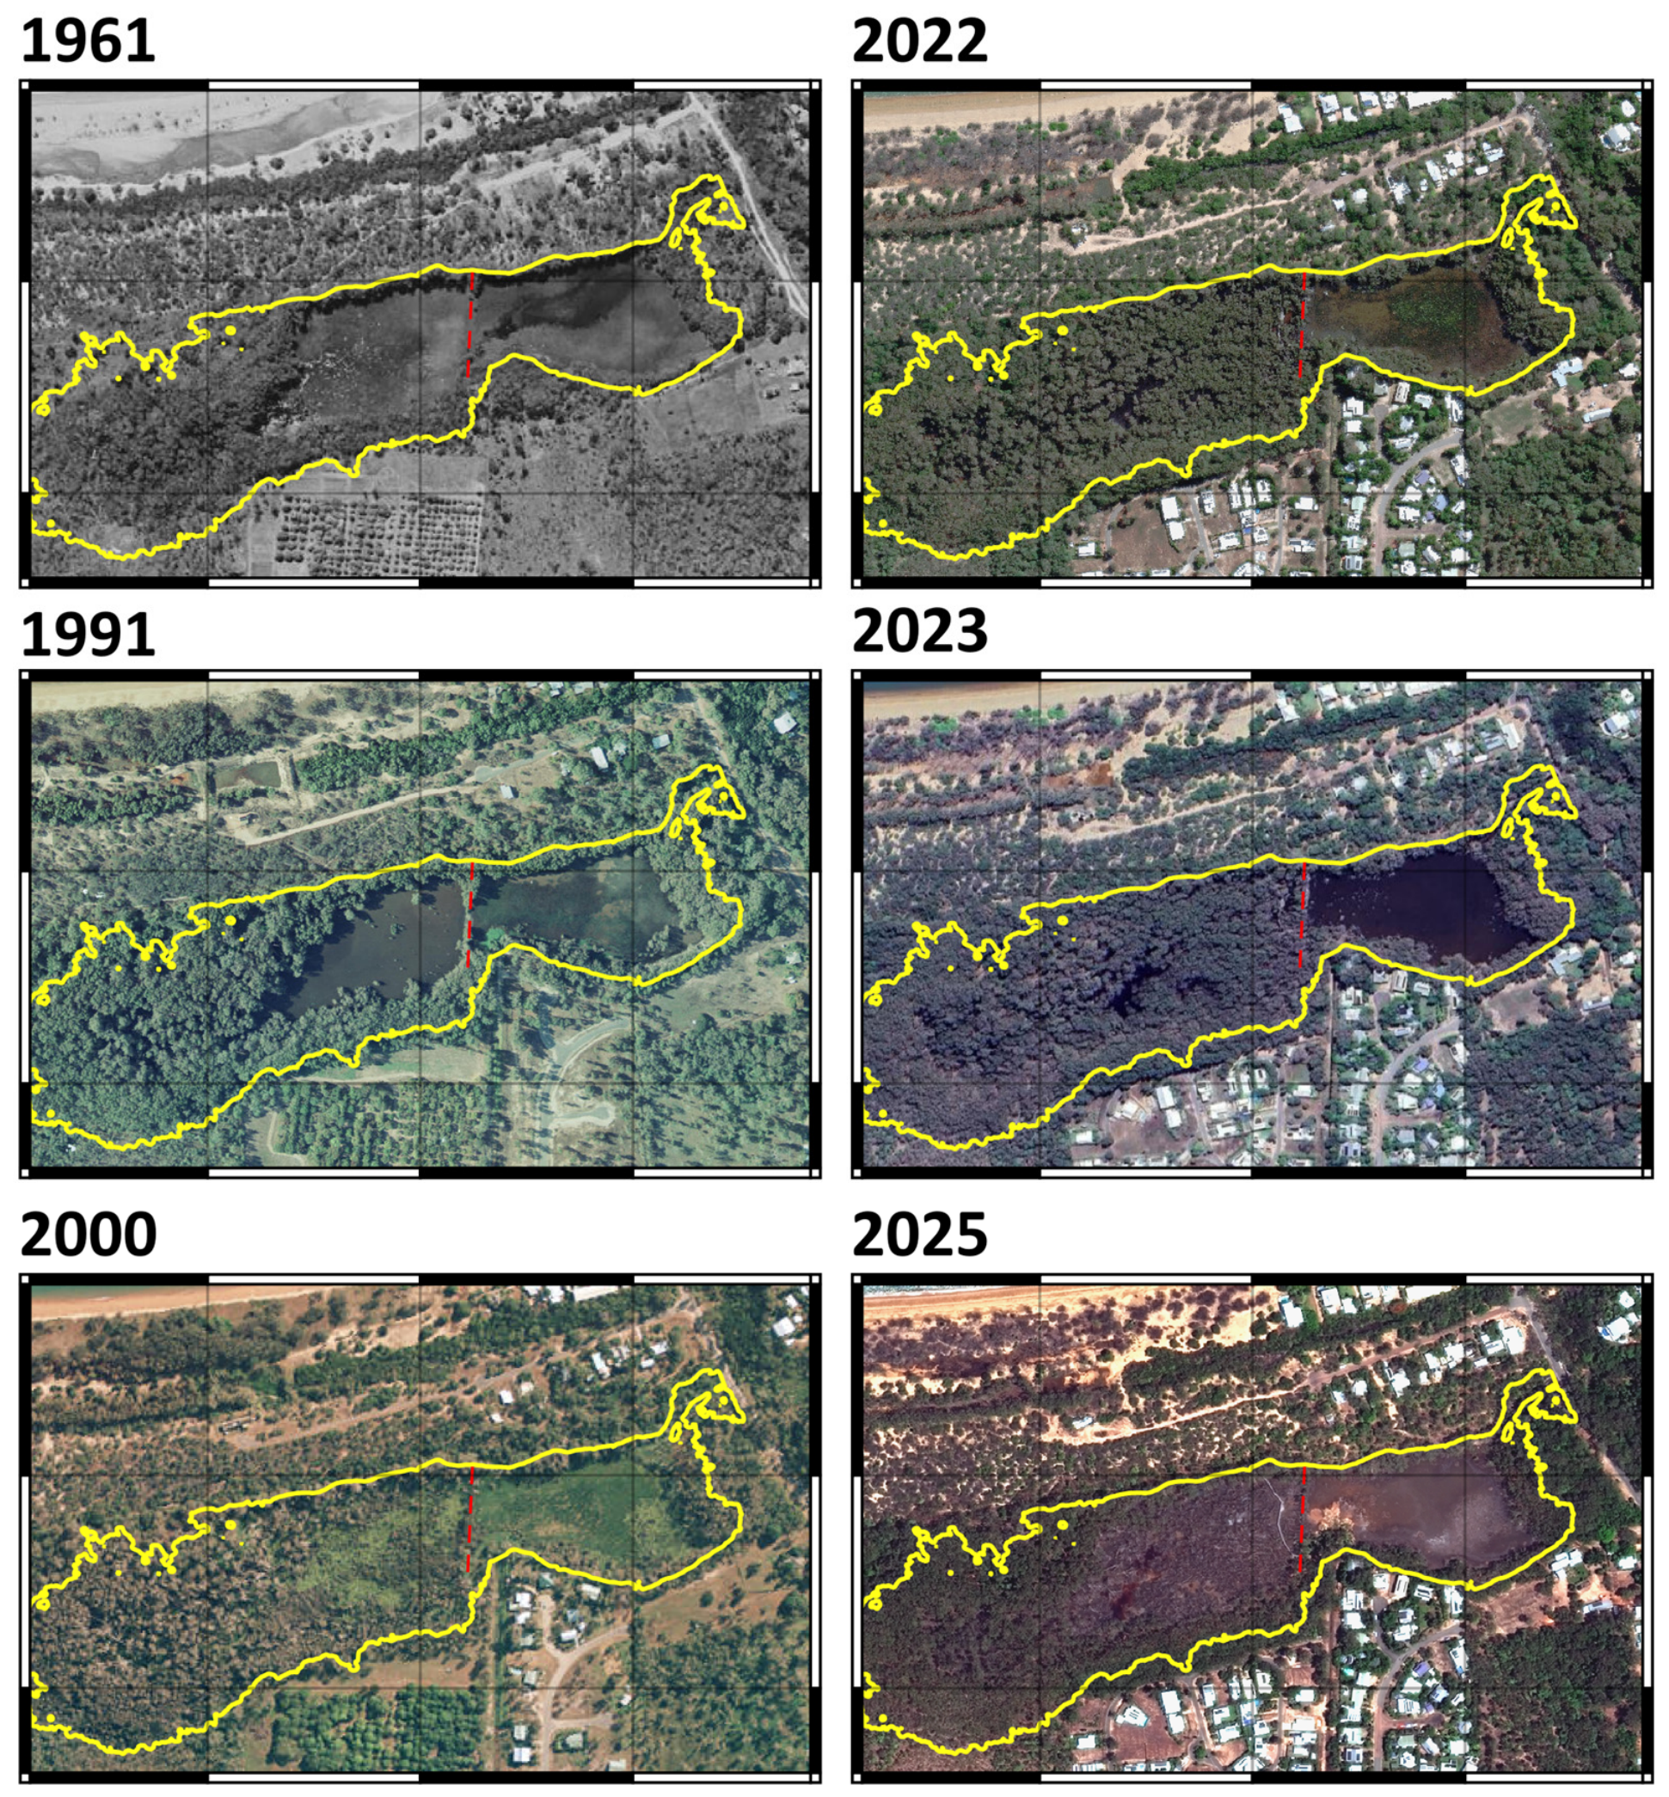
LIDAR data reveal that, from 2013 to 2022, the Outflow Channel was progressively dredged, together with the shoal at Site X. That shoal formed a natural weir, ponding water in HBL. In November 2022, the shoal was completely removed by dredging, which allowed tides and seawater to enter. The evidence supports a progressive loss of the natural weir over 15 years, with the 2022 event as the final step, rather than a single 2022 cause. When the water level in the lagoon was below that of the natural weir (a shoal) at Site X, the lagoon water was stagnant, slowly evaporating and occasionally drying out in some years. That period is critical for Bulkuru Sedge, which grows profusely in HBL; it germinates when wetlands become inundated with freshwater, and the shoots die back to underground tubers in the dry season when the wetlands become dry [36] [https://wetlandinfo.detsi.qld.gov.au/resources/static/pdf/resources/fact-sheets/profiles/p01781aa.pdf, accessed on 20 October 2025]. It is an important food for the Magpie Goose (A. semipalmata) and the Agile Wallaby (N. agilis). Thus, the hydrology controls the Bulkuru sedge, which in turn influences the populations of Magpie Geese and Agile Wallabies [https://ielc.libguides.com/sdzg/factsheets/magpie-goose/behavior, accessed on 20 October 2025]. Magpie Goose nesting occurs when floodplain water levels are stable or slowly declining [37]. There are 33 days from nesting to the goslings leaving the nest [38]. They fledge in 10 weeks, and they remain with the parents until the following breeding season [39]. When the lagoon dries out, the Bulkuru Sedge shoots also die, and the Agile Wallabies disperse away from HBL. Anecdotal observations record the Agile Wallabies in rocky outcrops in other regions of Magnetic Island, where it is posited that they compete with the Allied Rock-wallaby for resources [https://www.minca.org/feral-animals.html, https://www.minca.org/uploads/6/7/4/9/6749091/magnetic_island_mammals_dec_2023.pdf, accessed on 25 June 2026]. Originally, HBL was unvegetated (Figure 1f). Satellite images revealed that in the 1990s, the upper lagoon, but not the lower lagoon, started to be invaded by trees, mainly the Weeping Paperbark (M. leucadendra), which formed dense, picturesque Melaleuca wetlands by 2022 (Figure 3).
Figure 3.
Time-series of aerial and satellite photographs of HBL showing Weeping Paperbark, Melaleuca leucadendra L., trees colonising the upper lagoon from the 1990s, but not the lower lagoon. The yellow line is the outline of the lagoon, with the red dashed line being the division between the upper and lower lagoon.
3. Methods
Historical maps and pictures, and LIDAR data, were obtained from government archives, Google Earth, Landsat and Sentinel-2 satellites. Hourly atmospheric pressure and rainfall data at a site in Cleveland Bay, 3.77 km away from HBL, were provided by the Australian Institute of Marine Science. The hydrodynamics and the salinity regime of HBL and the Outflow Channel were studied during the dry season of 2025 (April to November) and the wet season of 2026 (January to April). During the 2025 dry season, Hobo (Bourne, MA, USA) water level loggers logging every hour were moored at Sites 1 (channel mouth) and 3 (under the boardwalk in the upper lagoon), and DataFlow Odyssey (Sydenham, Christchurch, NZ) salinity loggers were moored at 0.1 m over the bottom at Sites 2 (Outflow Channel between HBL and the road) and 3 (Figure 1g). During the 2026 wet season, one Hobo logger and one salinity logger were moored at Sites 2, 3 and 4. Site 4 was monitored for only 3 weeks because it was judged unsafe to access considering the potential presence of crocodiles. The water level data were corrected for atmospheric pressure fluctuations, and they were referenced to the LAT datum using RTKGPS data of the water level at specific times. The RTKGPS data had an accuracy of 0.02 m. Salinity data at specific times were obtained using a handheld Reed Instruments salinometer (model RS3100SD, Wilmington, NC, USA) at all the mooring sites. The effects of biofouling were minimal as the moored units were induction, not conduction. The salinity data were corrected for temperature fluctuations upon data download, with the units containing their own temperature sensor.
A modification of the 2016 LIDAR data was needed, because the 2018 dataset had high water surface reflection at 3.8 m LAT. Accordingly, we used RTKGPS points collected in 2025 to create a TIN Raster of the new delta and channel near HSB. This was then combined with 2016 LIDAR survey data. All datums of the LIDAR survey and RTK GPS data were aligned against a transect of the old road to the north of the lagoon using transect points across the road instead of a single point because of the curvature of the road surface. Using the aligned RTKGPS and LIDAR survey data, a raster volume calculation was performed to show the increase in sand volume at the new delta. The additional area of sand in the 2026 delta was volumetrically subtracted from the same area in 2013. A similar method was used below 3.8 m LAT to show the decrease in water volume at a ponded level of 3.8 m LAT. The criteria for the period in which the lower lagoon is vegetated were, after the end of the wet season, vegetation > 50% and/or mud/soil < 50% to vegetation < 50% and/or mud/soil > 50%. The end of the wet season was defined as the point after the rainfall peak in the first half of the year if the 14-day rolling average had dropped below the first half-yearly rainfall total × 0.1. If there were no clear results, the end of the wet season was assumed to be 31 June.
To calculate the vegetation cover, we used data from the four 30 m pixels in the middle of the lower lagoon because they are not shaded by trees. We followed the methodology for calculating the Normalised Difference Vegetation Index (NDVI) baseline threshold from Auravant (https://www.auravant.com/en/articles/precision-agriculture/vegetation-indices-and-their-interpretation-ndvi-gndvi-msavi2-ndre-and-ndwi/, accessed on 22 June 2026). Therefore,
Veg (%) = (1/(1 + e^(−10 × ((((NIR − Red)/(NIR + Red) − 0.33))))) × 100
This equation sets an NDVI threshold of 0.33 at 50%. To calculate the Bare Soil Index (BSI) at the 4 pixels in the lower lagoon, we used the method of ESA-SEND4CAP (https://www.esa-sen4cap.org/wp-content/uploads/files/06_Sen4CAP_DDF_v1.1_BareSoil.pdf, accessed on 22 June 2025). Therefore,
Mud and/or soil (%) = (1/(1 + e^(−10 × ((((SWIR1 + Red) − (NIR + Blue))/((SWIR1 + Red) + (NIR + Blue)) − 0.05))))) × 100
This equation sets the BSI threshold of 0.05 to 50% rather than 0.15 because it was a better fit against the validation points from the high-resolution Queensland Globe aerial imagery and Google Earth Timeline Imagery from a visual inspection. Images with clouds, cloud shadows, and sensor faults were removed using the Landsat SR_CLOUD_QA or QA_PIXEL bit values for each of the four pixels in the images. This provided clear results for 1121 out of 2052 images.
A good or bad year was defined by the first half-yearly rainfall being above or below the median value of 785.30 mm from 1986 to 2026. The rainfall data came from the Townsville Airport BOM database, as it is the longest and most reliable database. That site is located 17.85 km from HBL.
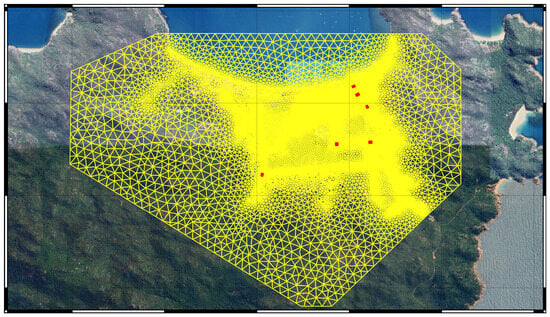
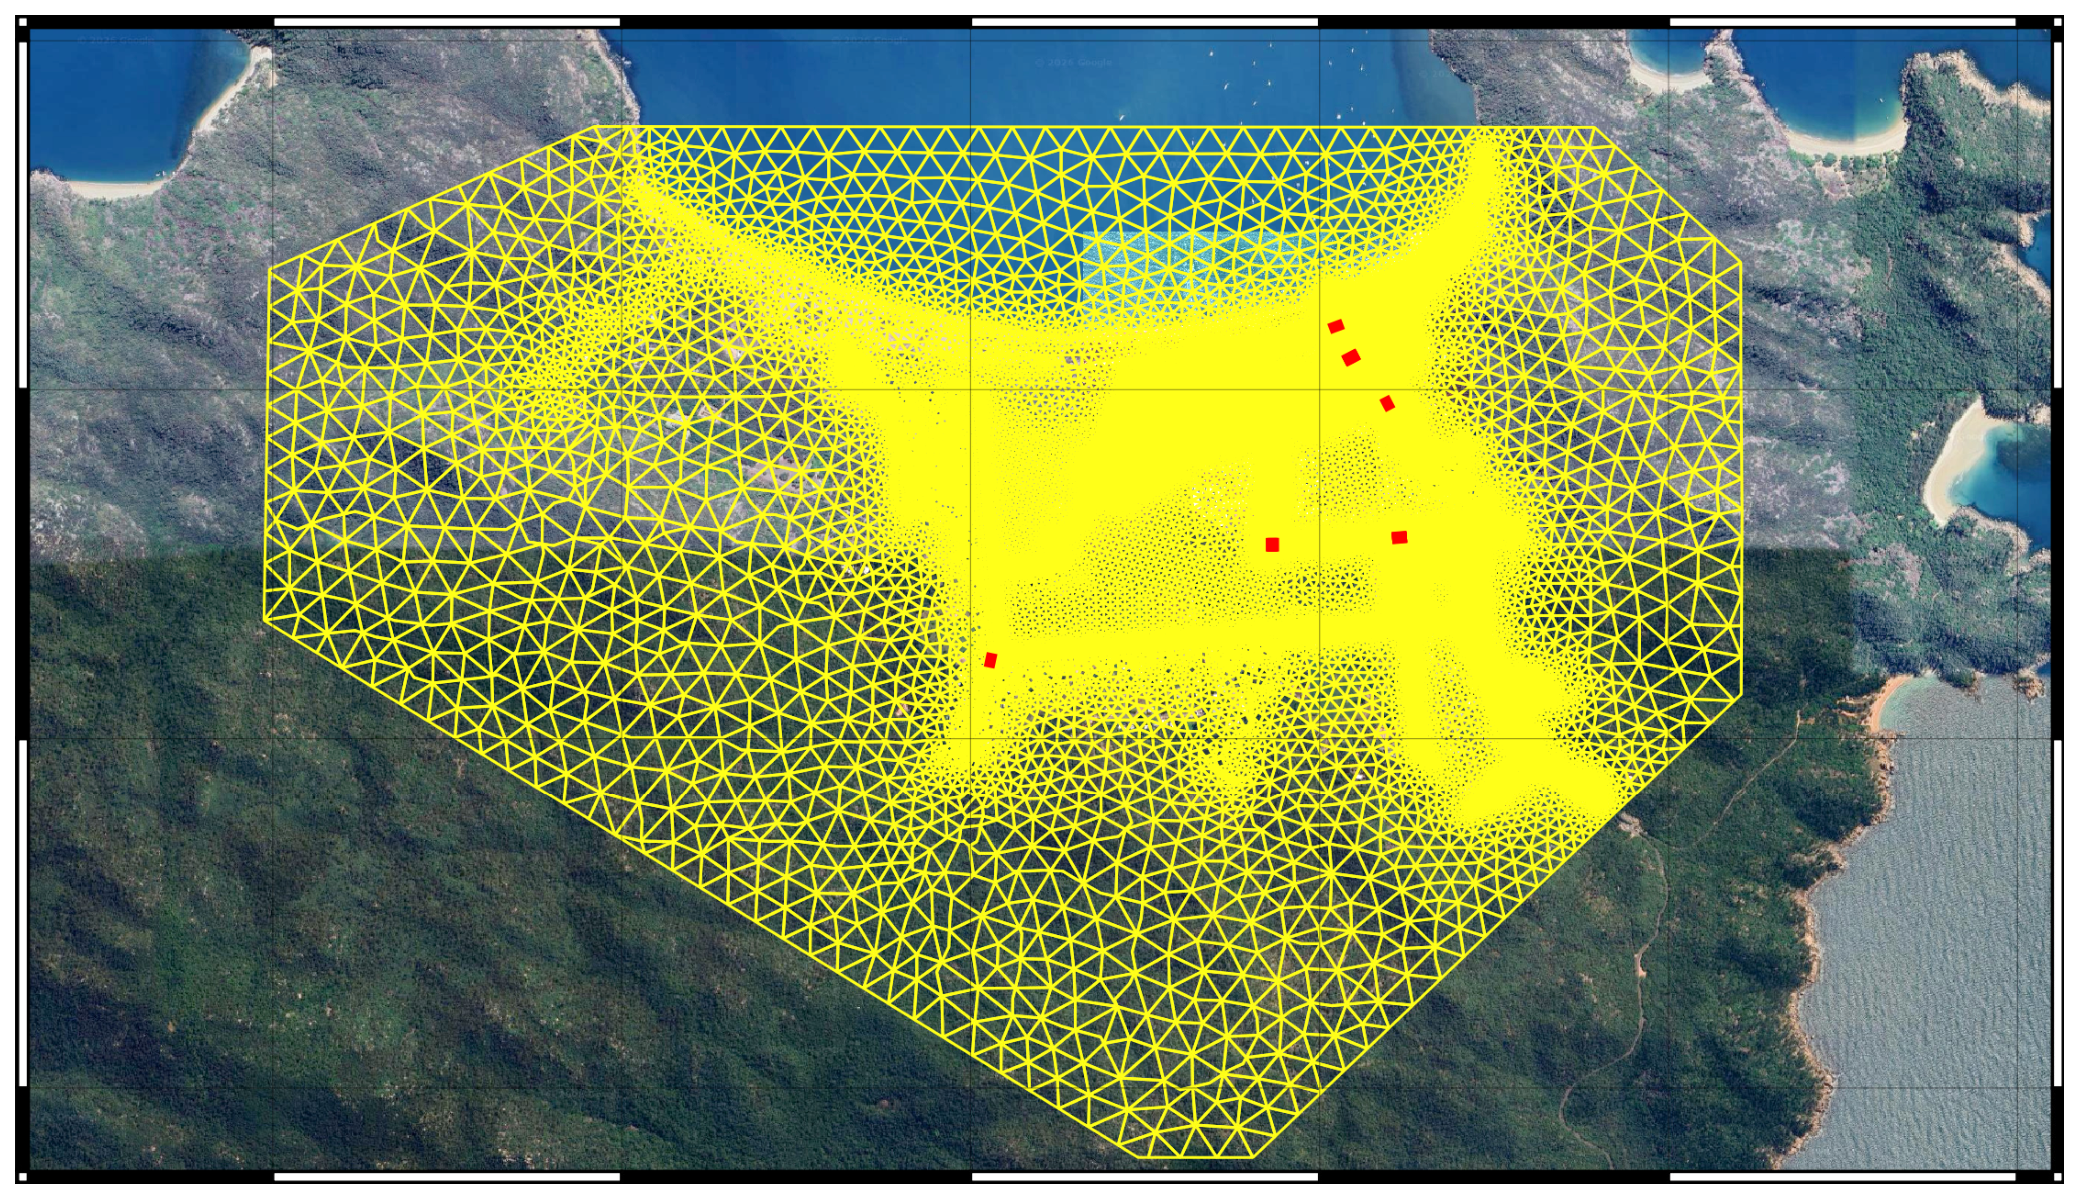
The 2D HECRAS model [24] was used to quantify the hydrodynamics of HBL. The mesh was very refined (Figure 4). Tidal height at the seaward open boundary was adjusted to align with tidal heights at Site 1, and we verified the model against field data of water surface elevation at Site 3. The model was used to predict the water level for two engineering scenarios of building a weir in the outflow channel before the culvert. In addition, these scenarios also included a flap gate for each culvert. One flap gate had a 200 mm hole to facilitate fish movement. The weir crest elevation was at 3.75 m LAT for Scenario 1 and at 4.1 m LAT for Scenario 2. The model was also used to predict the inflow of seawater in the dry season with no stream runoff during a spring tide without (i.e., the present situation; Scenario 3) and with engineering measures (Scenario 4) as in Scenario 1. The high ground terrain modification tool was used to build the weirs with aprons at a 1:15 ratio to ensure that the weir crest was greater than 2 cells wide in the model.
Figure 4.
The HECRAS mesh comprised 55,401 triangular and quadrilateral cells marked yellow. The existing culverts are marked red and were used in the model.
4. Results
4.1. Recent Environmental Degradation
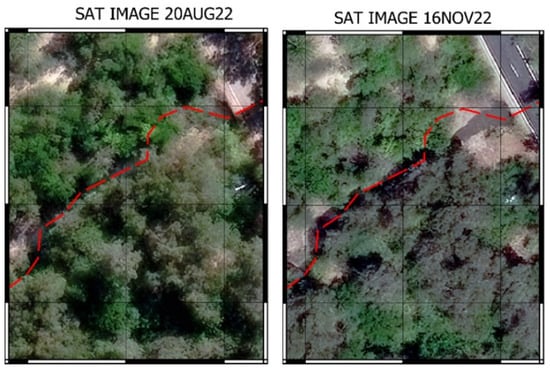
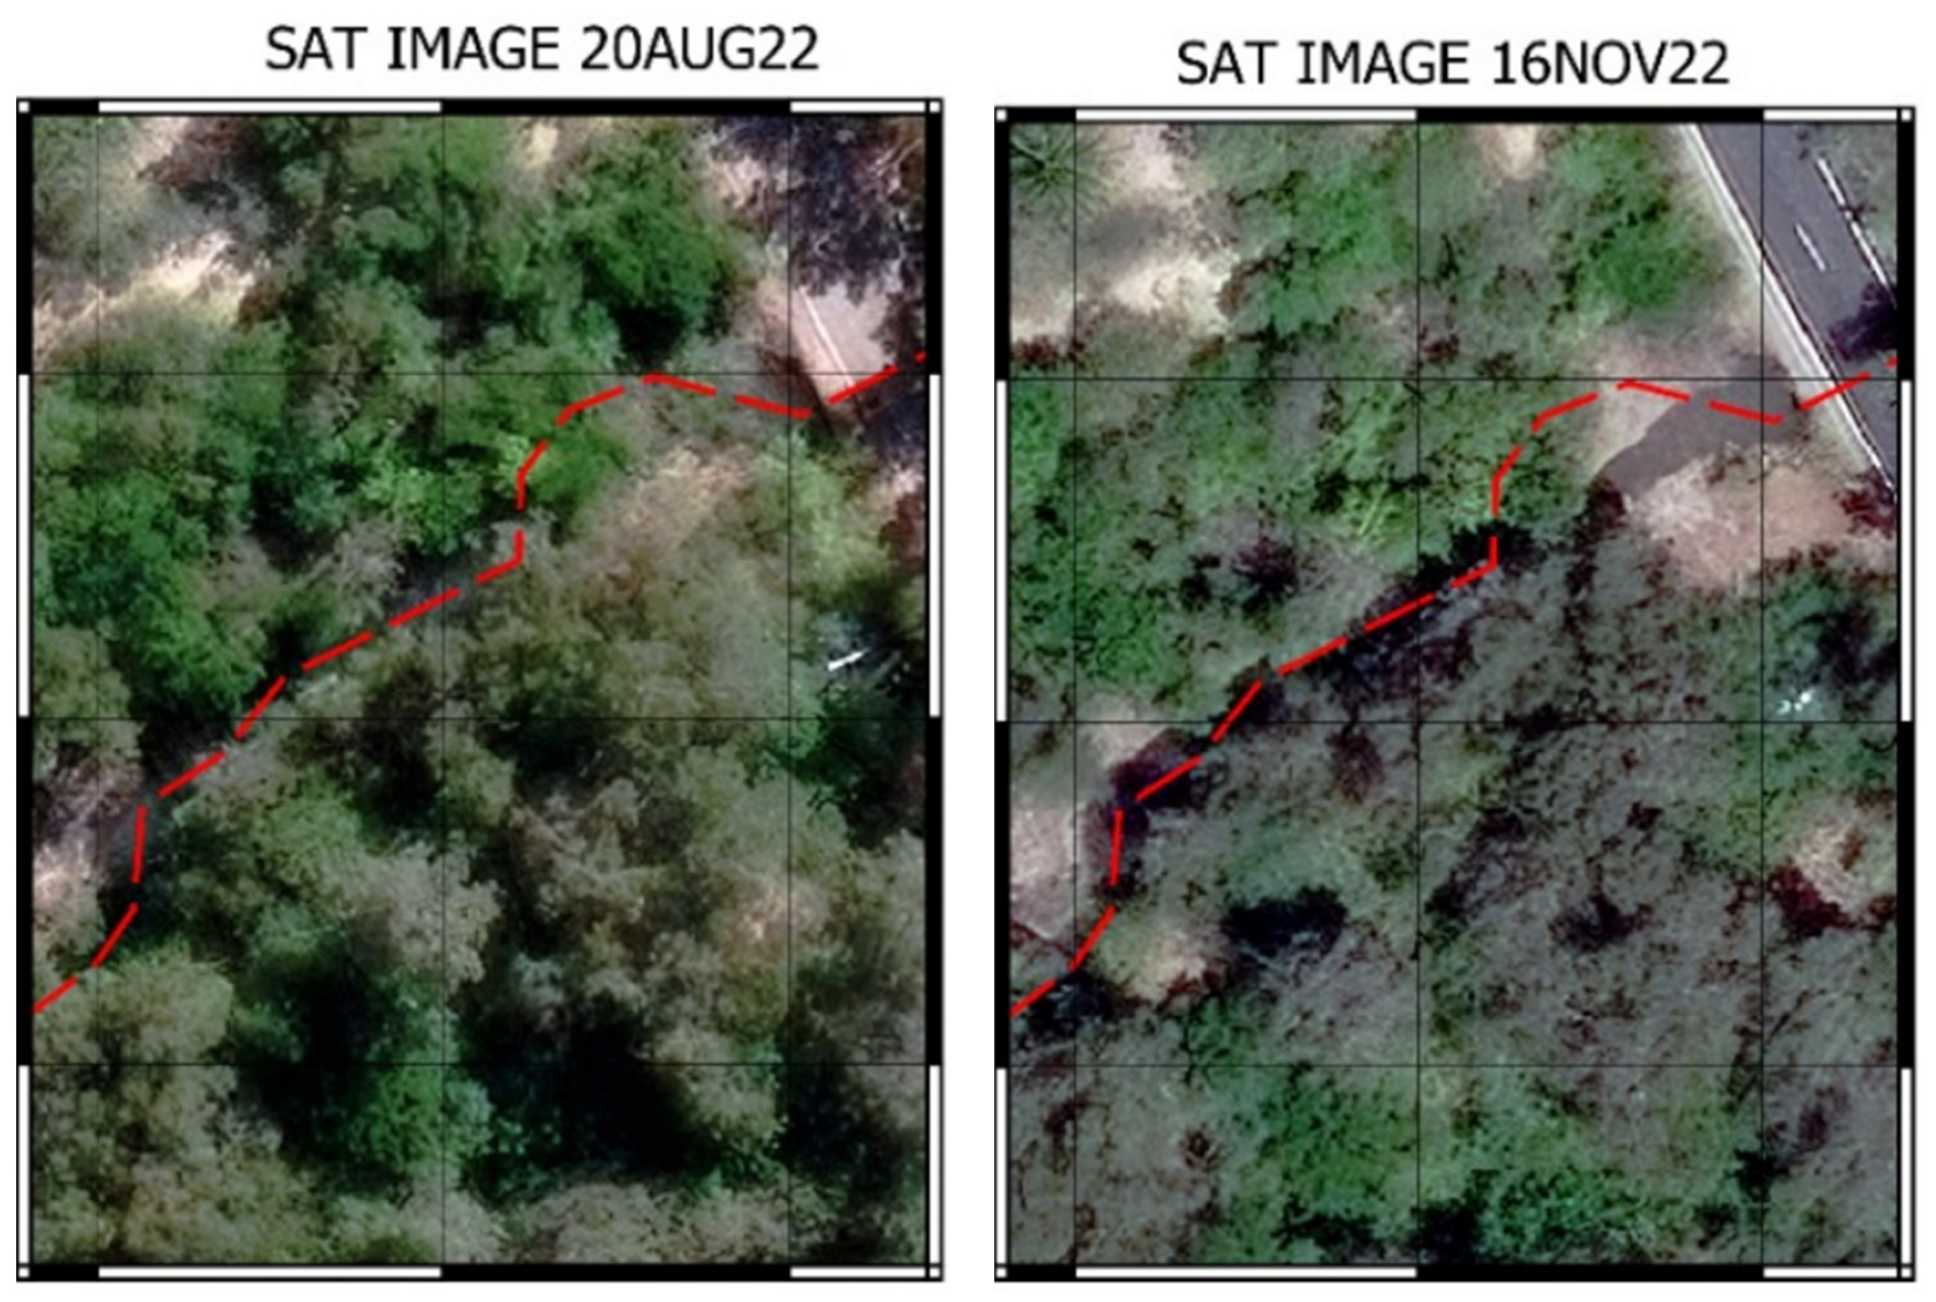
There is no record of salinity intrusion in HBL before 2007, when the Outflow Channel was first dredged by hand [A. Frost, pers. comm.]. LIDAR shows that some mechanical dredging events occurred again in the channel between 2013 and 2016. After the shoal at Site X was removed in November 2022 (Figure 5) and the Outflow Channel was deepened, seawater likely intruded at each spring tide. Seawater was observed to intrude in November 2022, in the dry season, when no rainfall > 20 mm was recorded for the previous 103 days, after removal of the natural weir.
Figure 5.
Georeferenced satellite images of the Outflow Channel (left) before removal of the natural weir and (right) after its removal by mechanical dredging. The red dashed line is the pre-dredging thalweg. The road bridge is on the right.
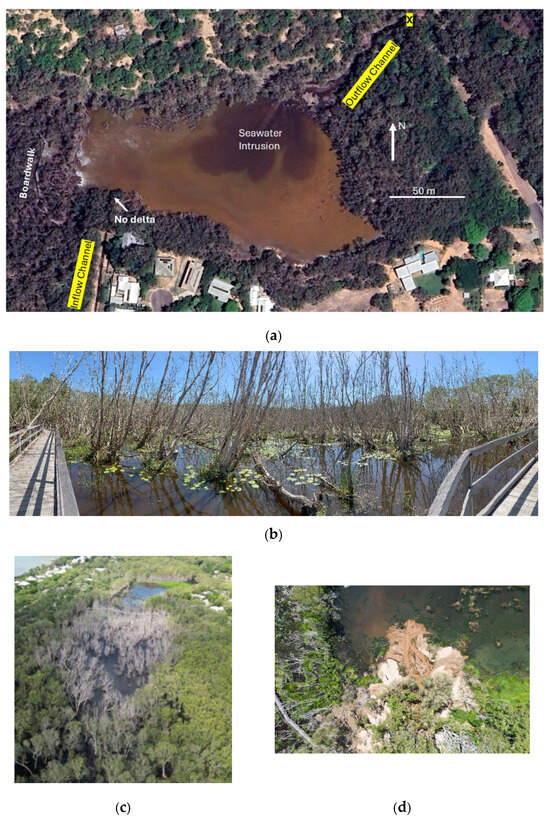
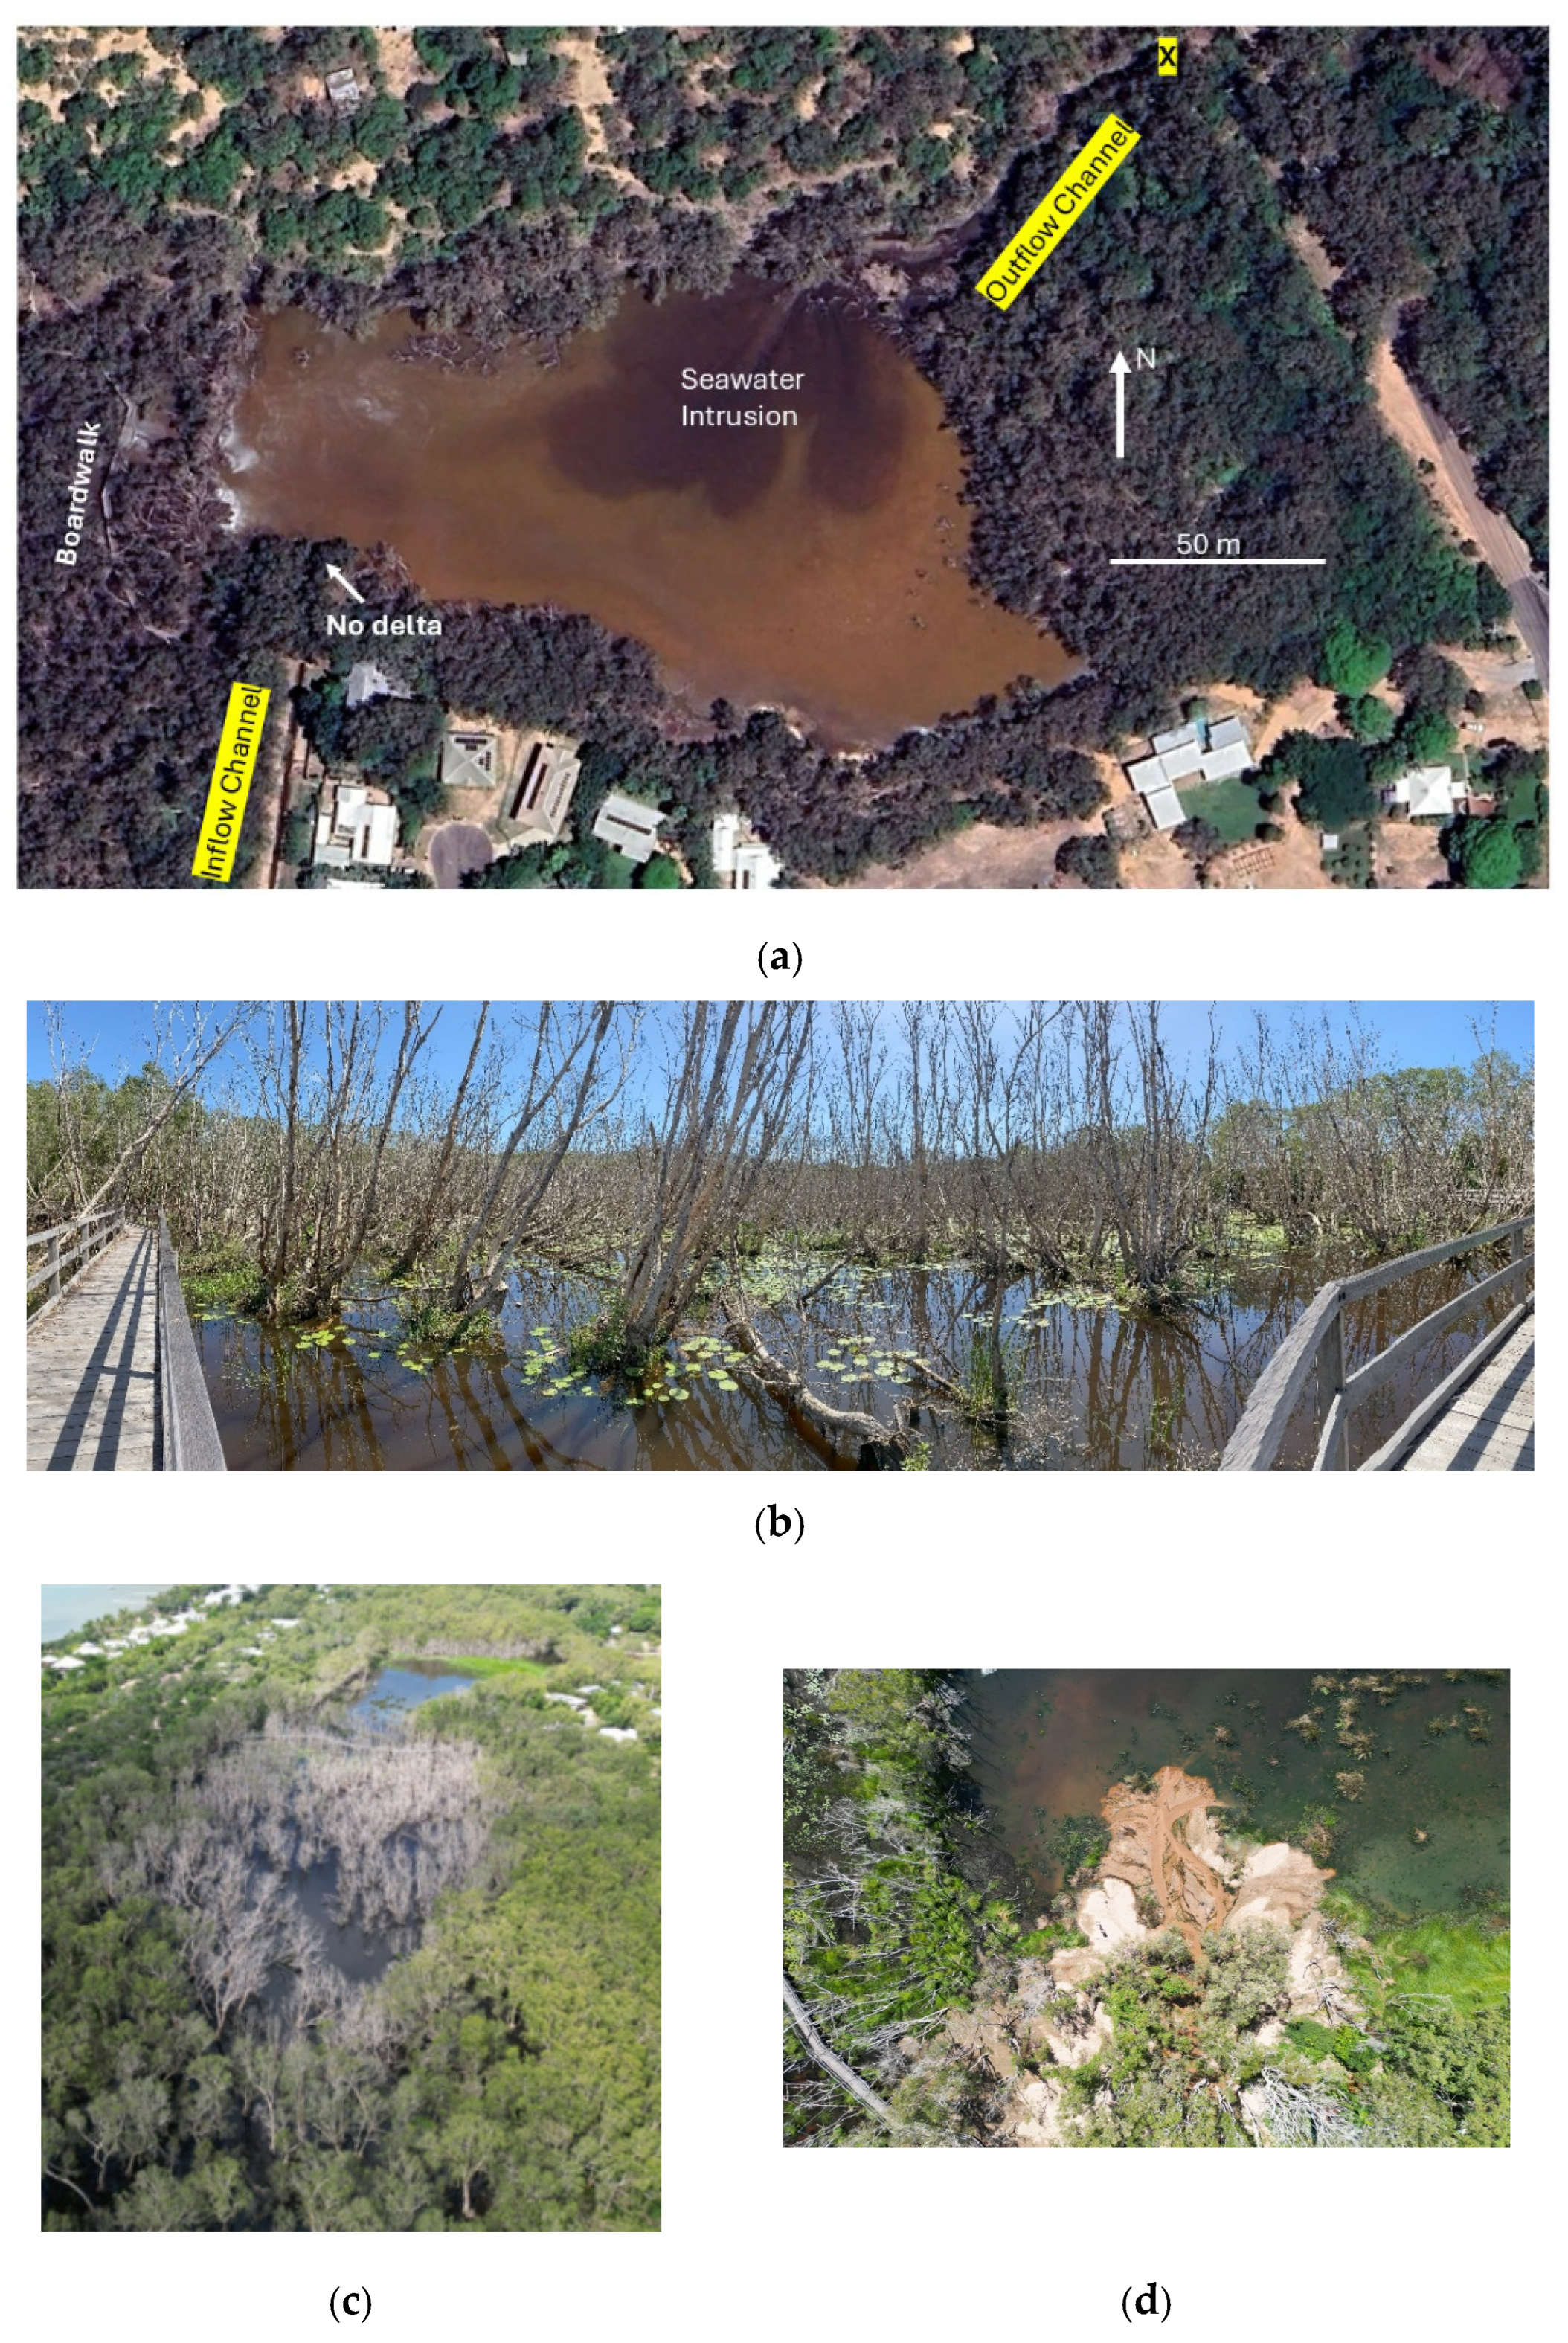
The satellite image of 4 January 2022 shows a change in water colour and extent at the mouth of the Outflow Channel, which suggests a tidal intrusion of saline coastal water (Figure 6a). In subsequent years, the lagoon degraded measurably. In 2025, all the trees along the shore of the lower lagoon were dead, and all the trees in the upper lagoon and along its shore were also dead (Figure 6b,c). In 2025, the sand eroded from the catchment formed a delta at the mouth of the Inflow Channel (Figure 6d), while there was no such delta in previous years (Figure 6a). In 2025, the delta accumulated 1317 m3 (±3.6%) of sand. This resulted in a decrease in the water volume below the 3.8 m LAT of at least 0.774 Megalitres (±3.6%). This decreased the amount of freshwater stored in the lower lagoon in the dry season available for the ecology.
Figure 6.
(a) A Google Earth image of water intrusion from the Outflow Channel into the lower lagoon on 4 January 2022 at 1030 h, near high tide still rising. This water is likely seawater. No delta (white arrow) existed at that time at the mouth of the Inflow Channel. Images of the dead trees in 2025: (b) the upper lagoon at ground level viewed from the boardwalk, and (c) an oblique drone view of HBL. (d) Vertical drone image of the sand delta in 2025 at the mouth of the Inflow Channel in the lower lagoon; the curved strip to the right is the boardwalk.
4.2. Mass Tree Mortality and Salinisation
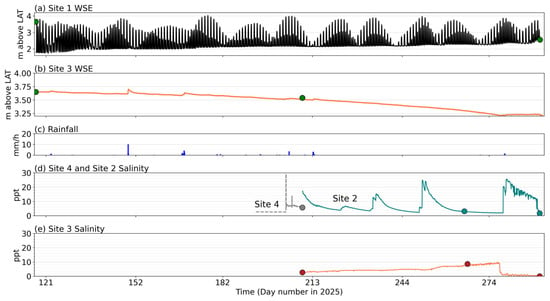
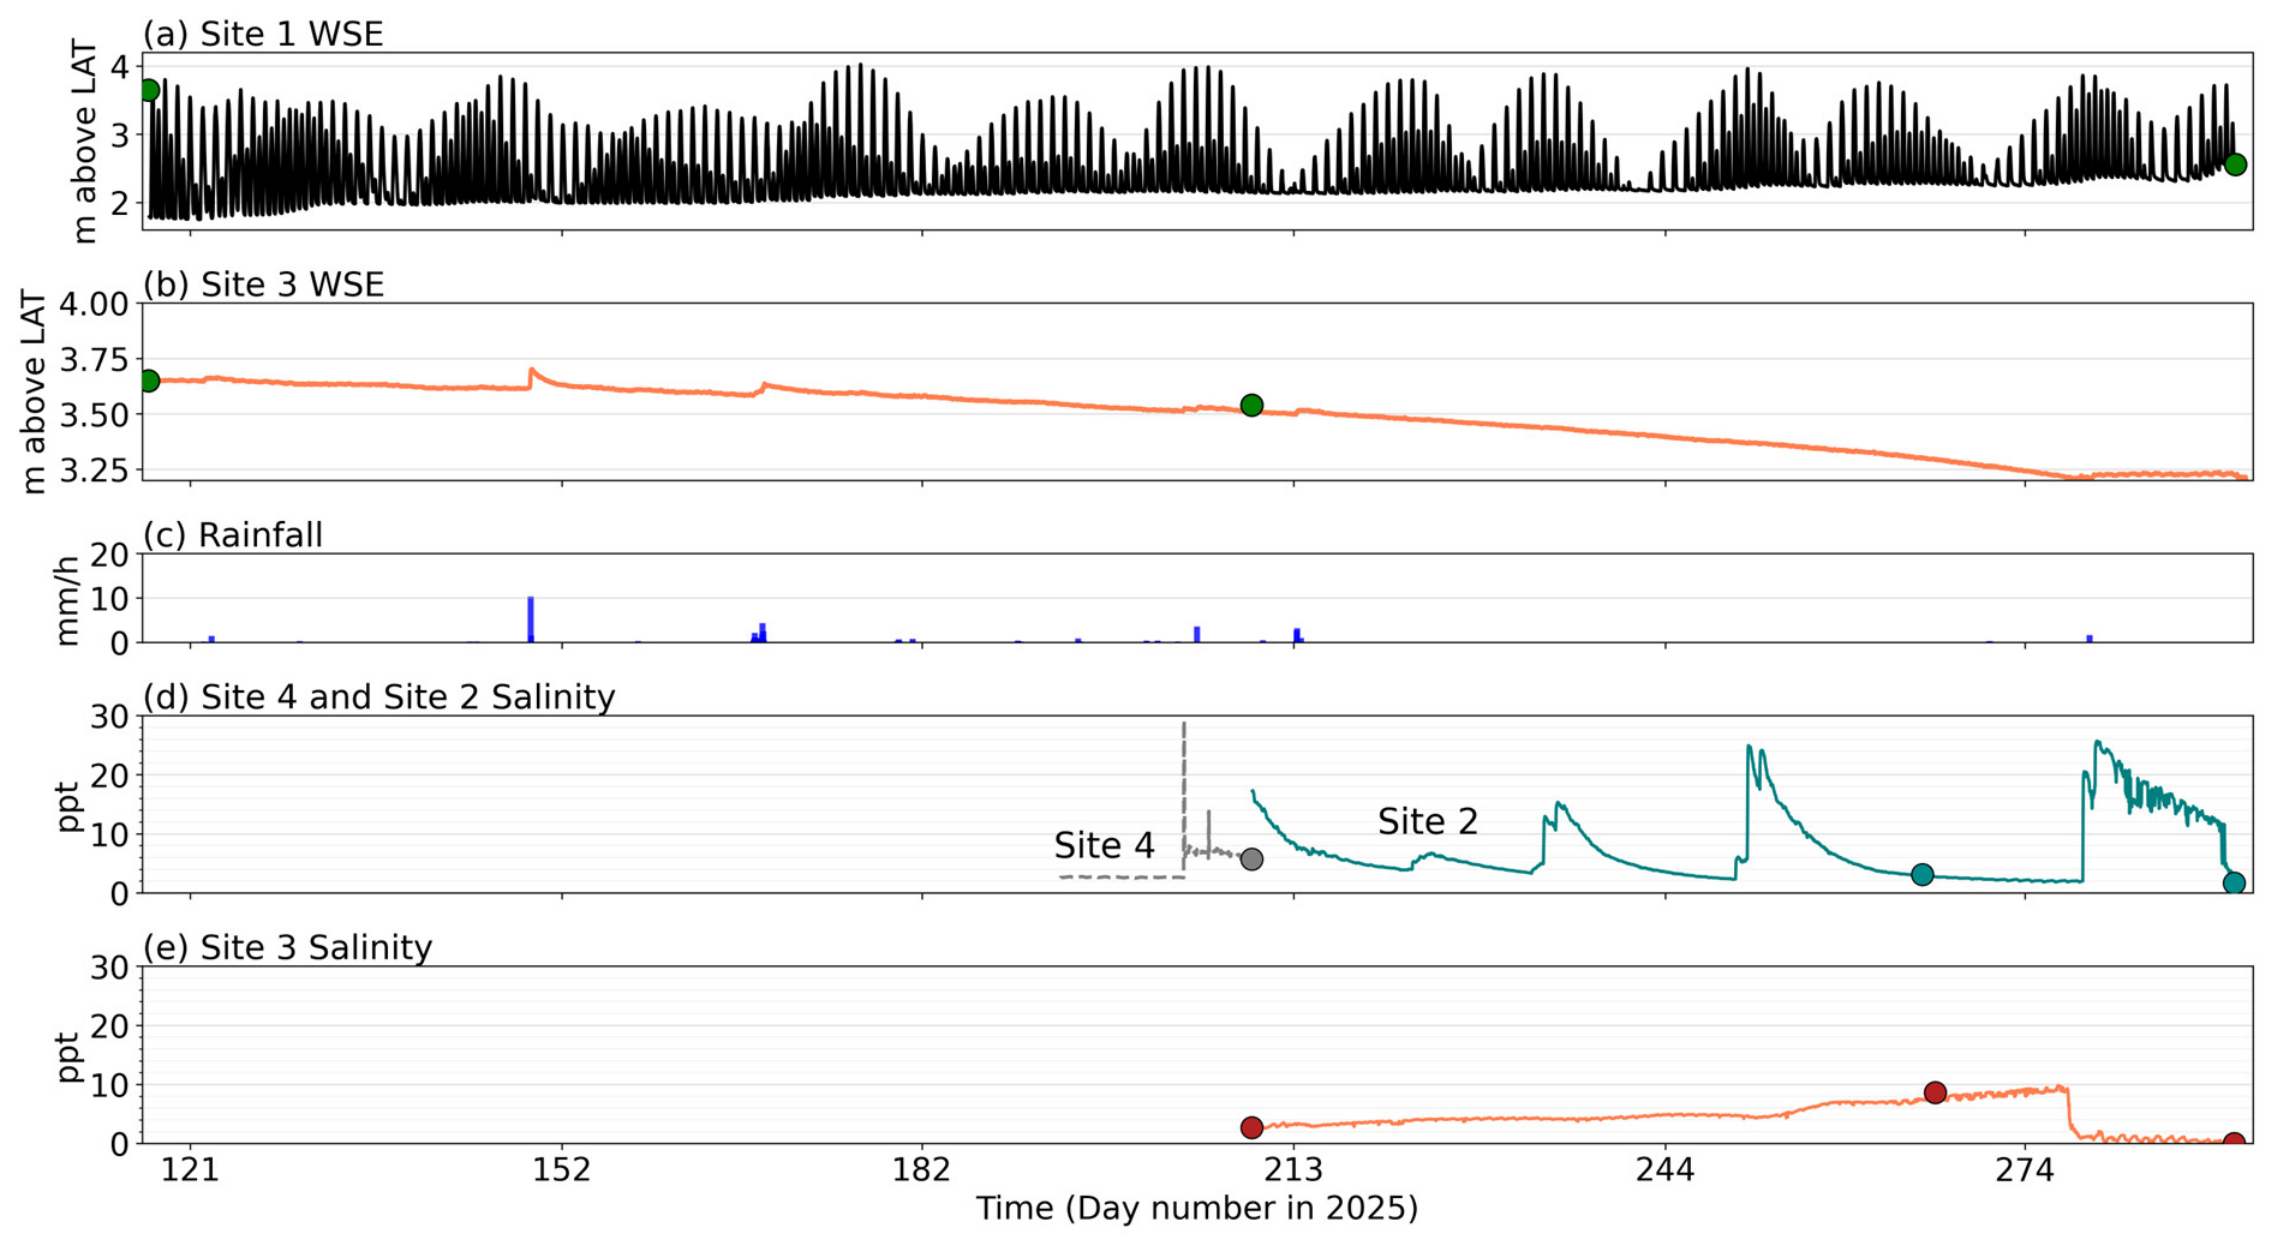
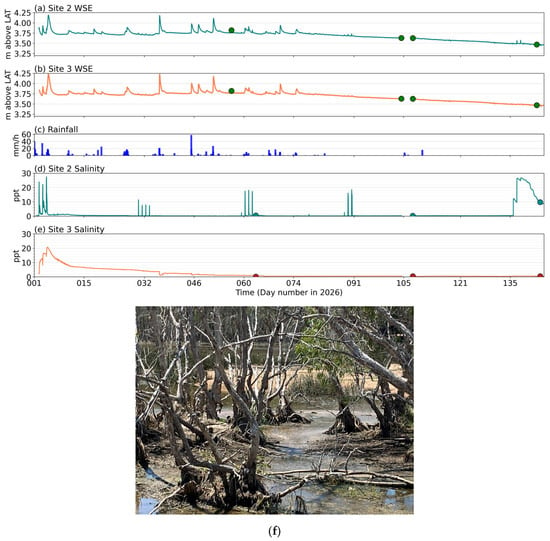
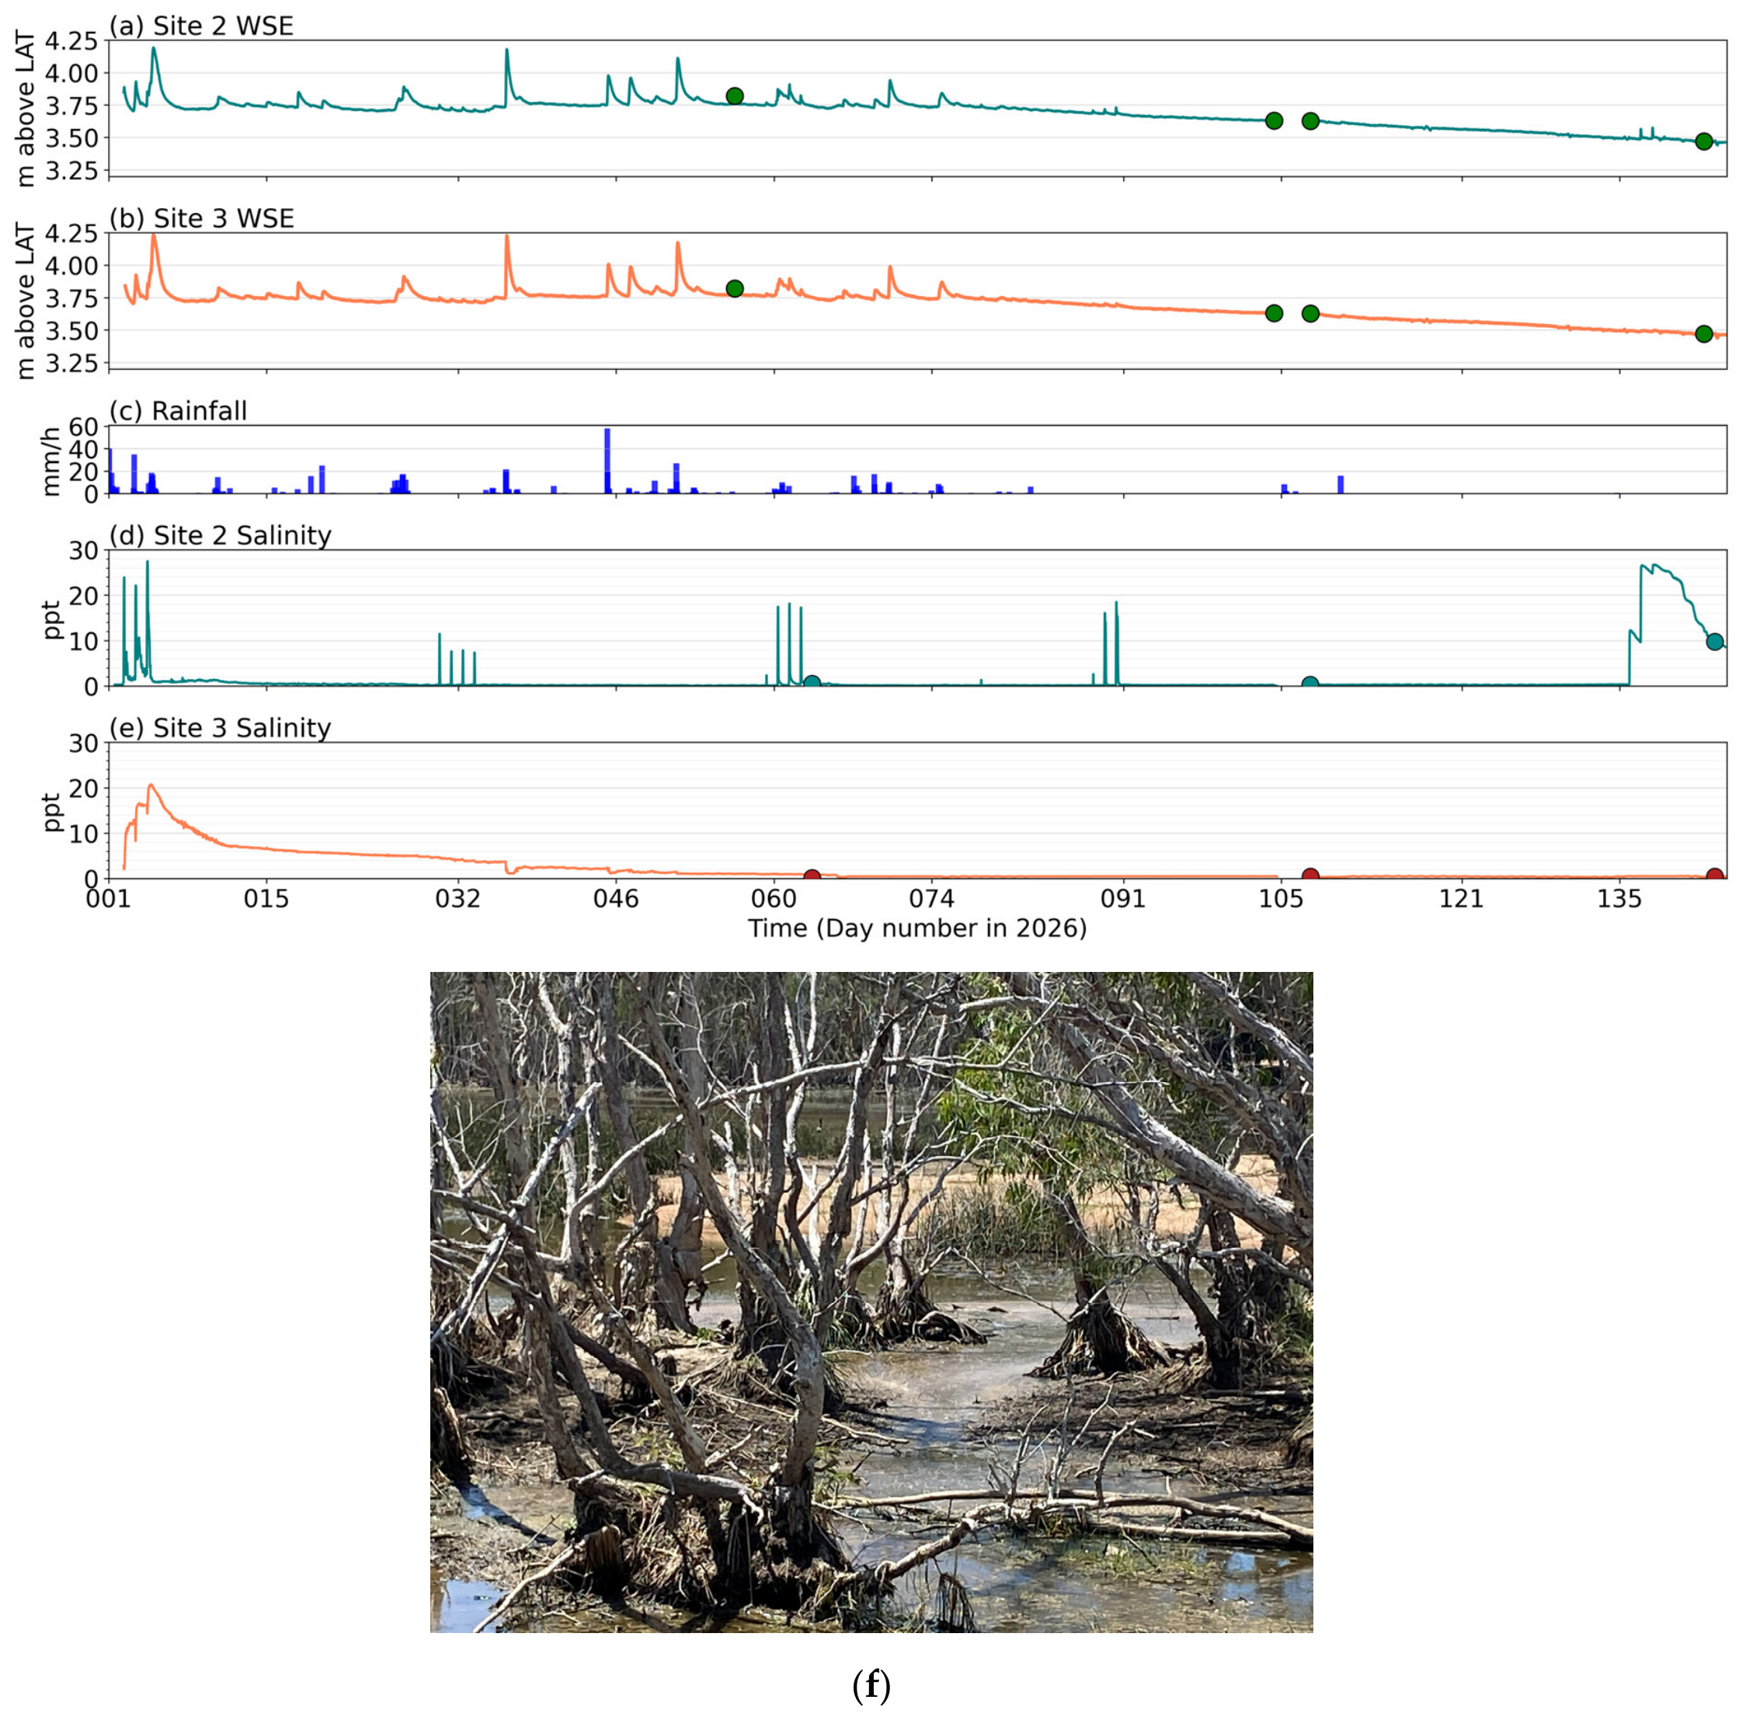
Residents observed that trees in the Horseshoe Bay Lagoon Conservation Park on Magnetic Island began dying off significantly in 2023 and mass tree mortality occurred in 2024–2025 (Figure 6b,c). The lagoon salinity also changed after 2022 following dredging to deepen the Outflow Channel and remove its natural weir near Site X. Our field data documents the severity of the salinity intrusion. During the 2025 dry season, the Outflow Channel hydrodynamics were forced by the semi-diurnal tides of Cleveland Bay. There was no tidal inflow for tidal heights less than 1.6 m in April and 2.7 m at the end of September because the Outflow Channel had been filled by coastal sand by about 1.1 m (±3.6%) from April to September (Figure 6a). The upper lagoon water level responded little to this tidal inflow, and it dried out on day 277 (05 October; Figure 7). The salinity in the Outflow Channel (Site 2) occurred as bursts of rapid inflow and slow outflows of saline water (Figure 7d). The salinity in the upper lagoon under the boardwalk increased continuously, peaking at about 9.94 ppt on day 276 (04 October; Figure 7). In the occasional manual vertical salinity profiles, we found no evidence of a strong (>1 ppt from top to bottom) vertical stratification. The field data during the 2026 wet season show that the tidal intrusion in the Outflow Channel was limited to a few short-term events during spring tides but not when heavy rainfall occurred (Figure 8a). There were spikes of salinity intrusion in the Outflow Channel (Site 2), but no salinity intrusion in the upper lagoon (Site 3). The upper and lower lagoons were separated by a shallow causeway, but they were hydraulically connected at low water by a small V-notch weir in the causeway and by overtopping everywhere following heavy rainfall or spring tides (Figure 8f). This maintains an equal water level on both sides of the causeway.
Figure 7.
Time-series plots during the 2025 dry season of the water surface elevation (WSE, LAT datum) (a) near the mouth of the channel (Site 1 in Figure 1g) and (b) in the upper lagoon at the boardwalk (Site 3); (c) the rainfall; (d) the near-bottom salinity of the Outflow Channel (Site 2) and of the lower lagoon (Site 4); and (e) of the upper lagoon at the boardwalk (Site 3). The filled circles are field measurements at specific times using an RTKGPS for WSE and a handheld salinometer for salinity. The sudden decrease in salinity near the end of the time series is due to the sensors emerging when the lagoon dried out.
Figure 8.
(a–e) Time-series plot of rainfall, tides, water surface elevation (WSE, LAT datum), and the near-bottom salinity in the Outflow Channel (Site 2 in Figure 1g) and in the upper lagoon at the boardwalk (Site 3) during the 2026 wet season. The filled circles are field measurements at specific times using an RTKGPS for WSE and a handheld salinometer for salinity. (f) The curved V-notch in the causeway that separates the upper and lower lagoons enables hydraulic connectivity between the two lagoons at low water.
4.3. Impacts on the Avifauna
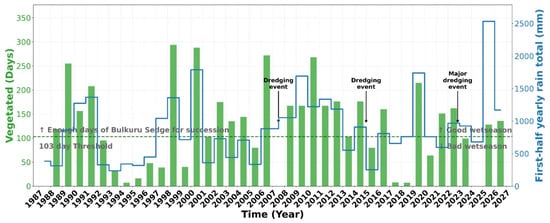
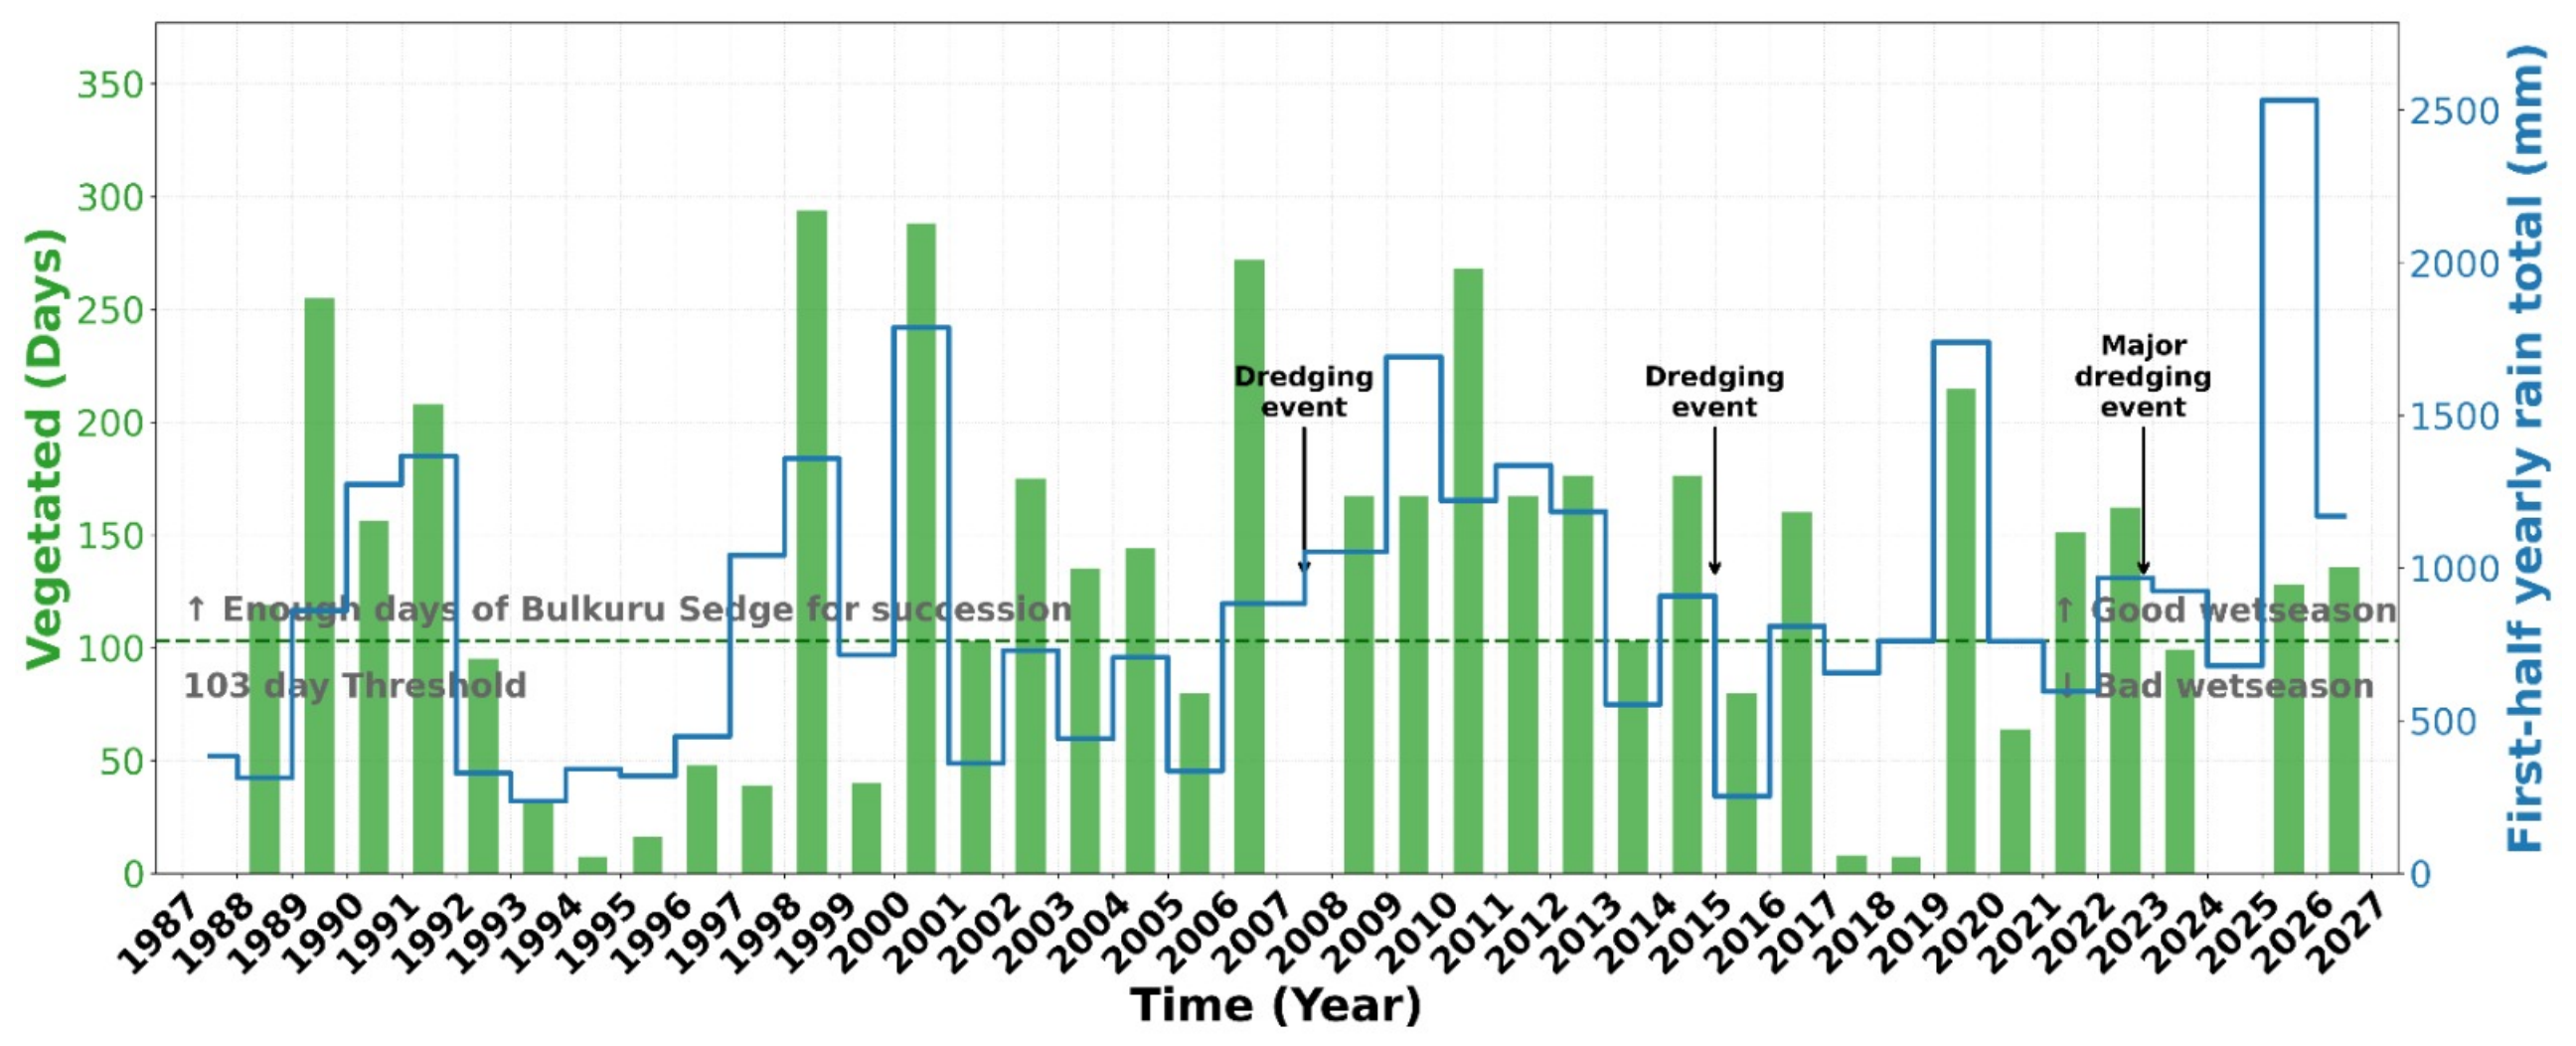
There are no local records of the number of days per year that the lagoon was vegetated by Bulkruru sedge, which is a staple food for the Magpie Geese. We calculated this for the lower lagoon from remote-sensing data. Our results show that the number of days per year that the lagoon was vegetated varied measurably from year to year (Figure 9). In turn, this translated into good years and bad years for the breeding birds, a natural pattern in Australia. There is no gosling survival if the lagoon dries out during the 103 days between when the female Magpie Goose lays her eggs and when the goslings fledge [37,38,39]. There is also no gosling survival if the Bulkuru Sedge shoots are killed by high salinity from intruding spring tides before the 103-day threshold has elapsed.
Figure 9.
A time-series chart of the rainfall in the first half of the year and the number of days that the lower lagoon was covered by vegetation (Bulkuru Sedge). The horizontal line shows the years when the Bulkuru Sedge lasted at least 103 days in the dry season, which allows the Magpie Geese to reproduce successfully in that year. The arrows indicate the dredging events. The dredging causes salinisation that impacts the Bulkuru Sedge. The dredging impact is not one-off; it is cumulative from 2007 to 2022.
Figure 9 shows the suggested yearly likely success or failure of reproduction based on the hydrology only. There are other factors that need to be included. Since 2022, the likelihood of success or failure may also be influenced by the dredging of the Outflow Channel that resulted in seawater from spring tides entering the lagoon. These events would delay the stabilisation of the lagoon water level (Figure 8a,b) and thus the nesting cycle. Therefore, it can be concluded that poor wet season years and years when large spring tides are close to the end of the wet season may be bad years for Magpie Goose reproduction (Figure 9). For the years when Magpie Goose goslings survive the hydrology cycle, their survival rate also depends on the mortality of the eggs and of the young, predation, and habitat destruction [39]. Long-term field data on the success rate of the reproduction of the Magpie Geese in HBL are much needed.
4.4. Engineering the Outflow Channel
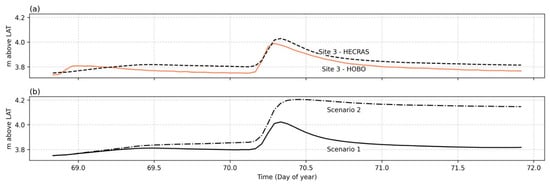
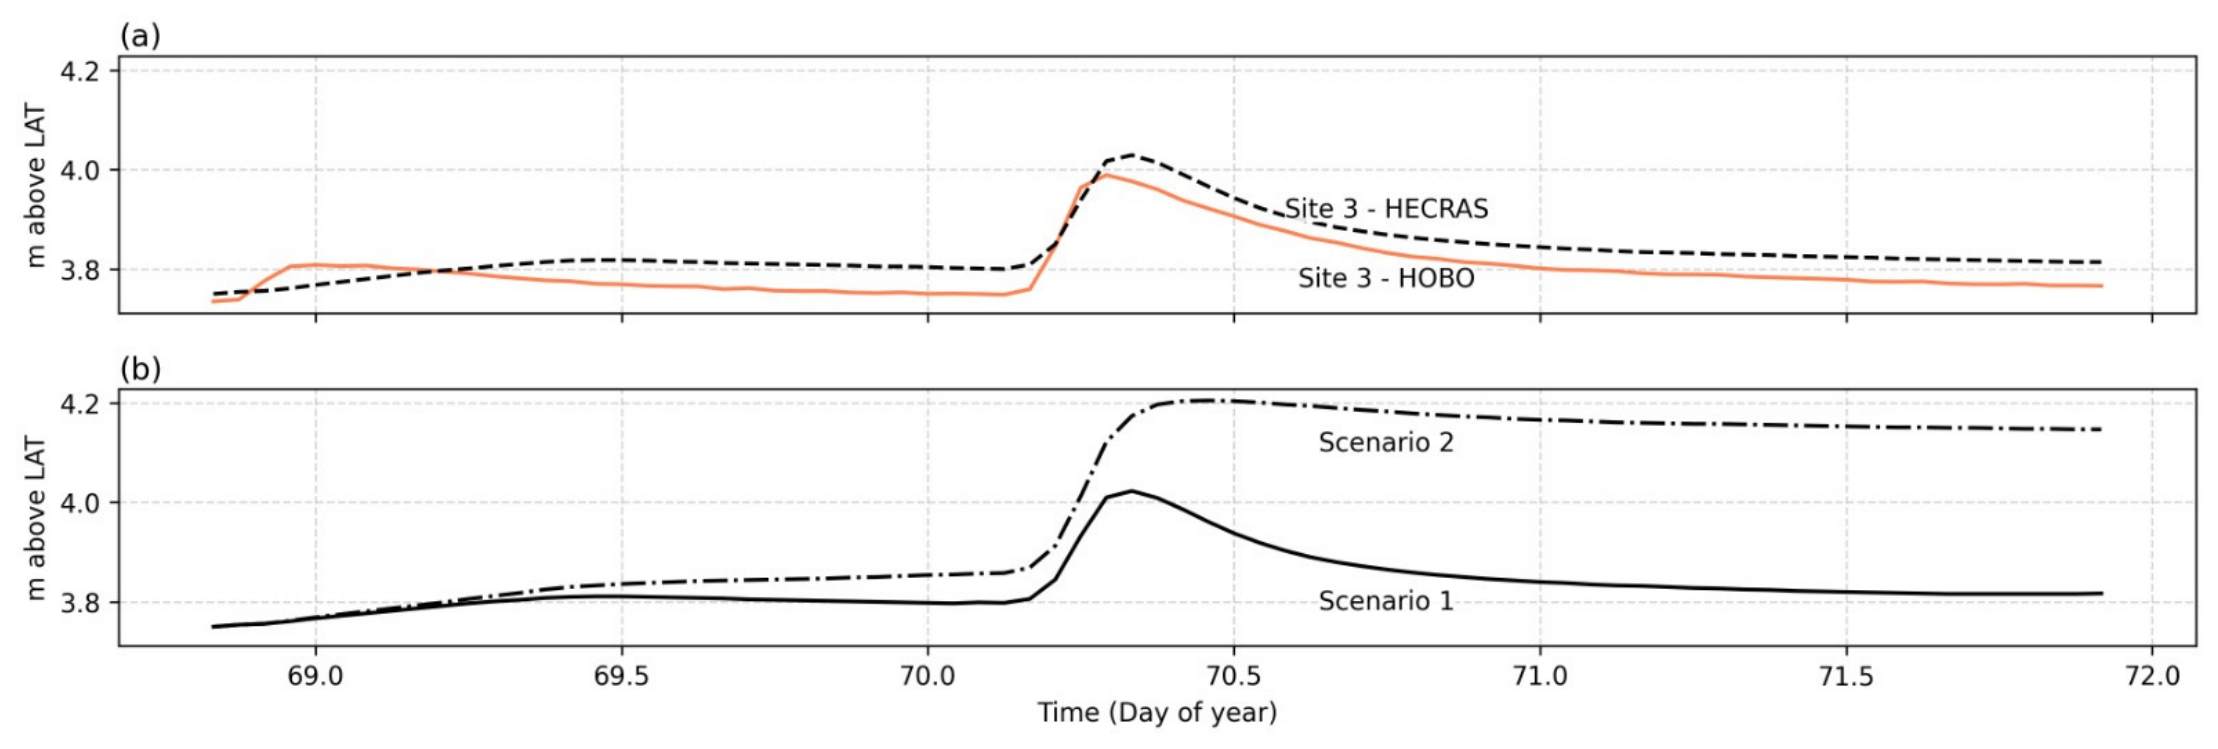
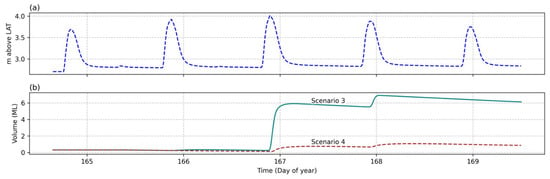
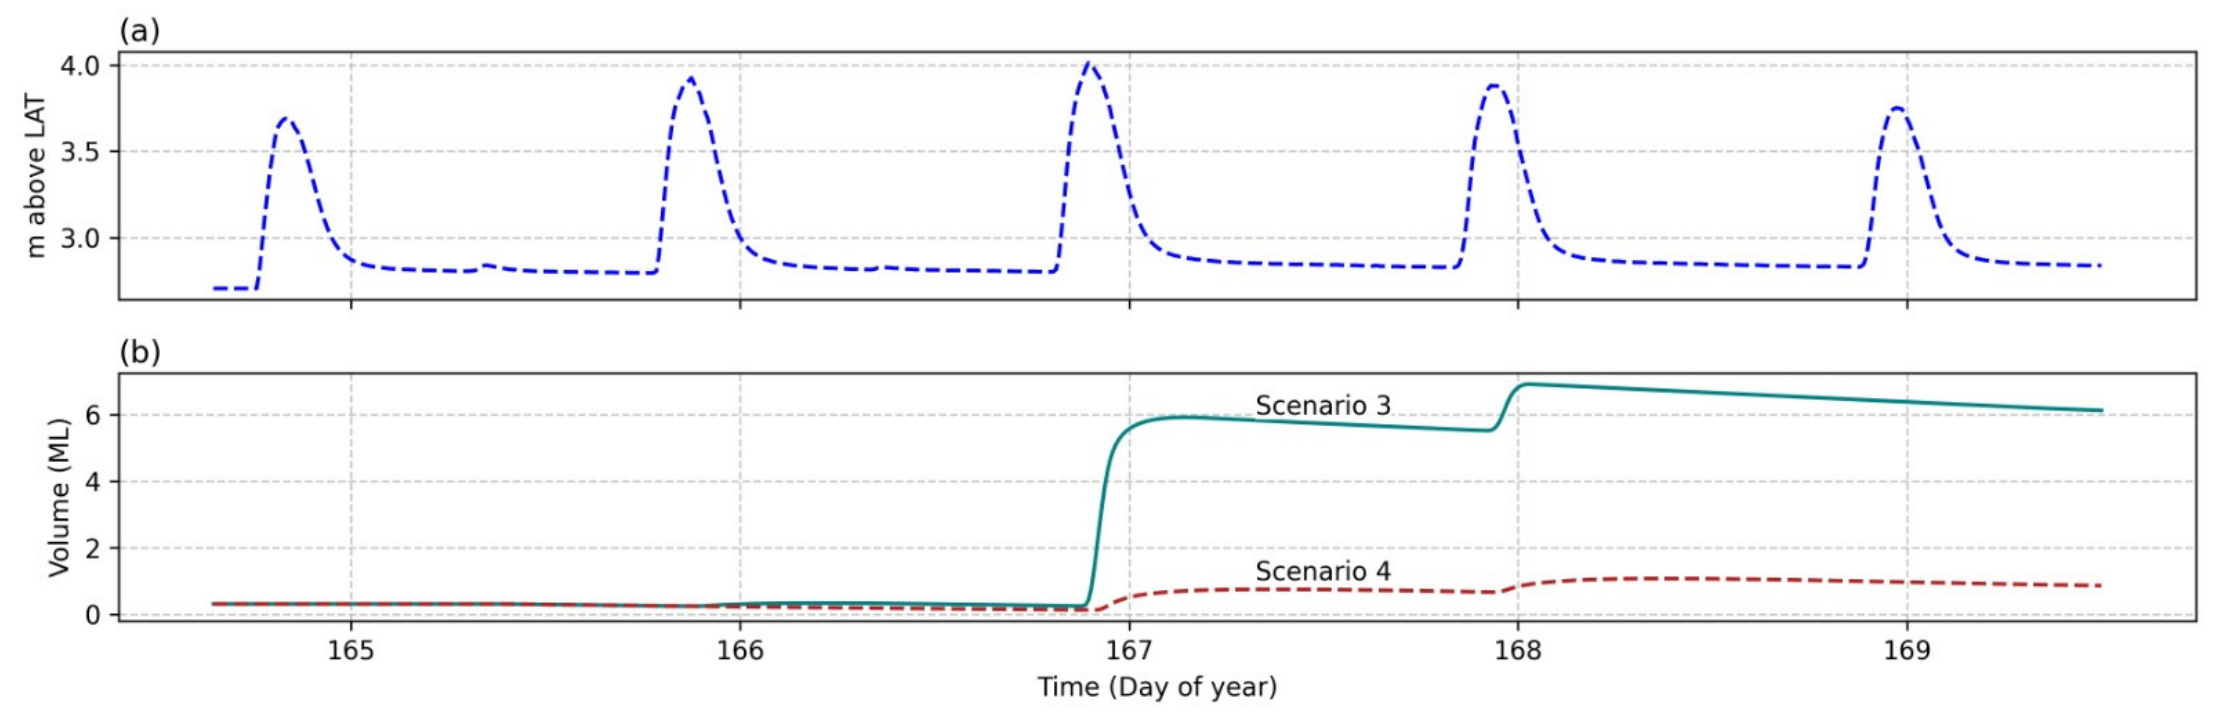
We verified the HECRAS model against Hobo surface water elevation data (m above LAT) at Site 3; the model error was less than 0.05 m (Figure 10a). The model was also used to investigate the effect of a weir placed in the outflow channel before the culvert and the use of a flap gate at each culvert under the road to prevent seawater intrusion, with one flap gate containing a 200 mm hole to facilitate fish movement. Scenario 1 gave the upper lagoon an effective depth of 0.6 m. The peak in surface water elevation on Day 70 was due to the large rainfall (246 mm) on that day. The modelling suggested that there was no risk of flooding for Scenario 1, but there was an increased risk of flooding in Scenario 2 (Figure 10b). This risk was due to the physical constrictions of the narrow Outflow Channel and of the culverts under the road (site X). The peak water surface height for Scenario 2 was 0.05 m above the weir crest height for this 2026 rainfall event, while the private property boundaries around HBL are at about 5.0 m LAT (as measured by LIDAR). Scenario 3 predicted a seawater inflow during a spring tide of 6.924 ML into the upper lagoon in its current state during the dry season (no rain and no runoff into HBL; Figure 11). Scenario 4 predicts a reduction of 84.3% of this seawater inflow into the upper lagoon (Figure 11).
Figure 10.
(a) The Site 3 HECRAS rainfall model calibrated against Hobo surface water elevation (m above LAT) over time at Site 3. (b) The same model for scenarios 1 and 2. The day number is for 2026.
Figure 11.
(a) The tidal input in the model scenarios 3 and 4. (b) The volumetric value in megalitres of the upper lagoon for Scenario 3 and Scenario 4 in the dry season. The day number is for 2026.
5. Discussion
Urbanisation has severely degraded HBL from its pre-European status, starting with the construction of Horseshoe Bay Road in the 1940s, then the development of the Inflow channel in 1986, the diversion of the Eastern Creek in the 2010s, and finally the lining and deepening of the diversion channel in 2021. This diversion of Eastern Creek, which historically bypassed the lagoon, is likely to be the primary cause of degradation for several reasons. Firstly, the natural shoal in the Outflow Channel at Site X (Figure 1g) is not receiving the input of stream sediment anymore. That shoal was formed by the confluence of two streams, the Eastern Creek and the Outflow Channel. When two streams converge, the sudden change in water volume, speed, and sediment load causes the water’s energy to fluctuate, frequently causing the heaviest gravel, sand, and silt to settle to the streambed and form a shoal [40,41,42]. Thus, following the diversion of the Eastern Creek, the natural shoal in the Outflow Channel became sediment-starved; it then naturally eroded away. Consequently, the lagoon drained out faster in the dry season. Secondly, the diversion of the Eastern Creek has doubled the inflow of freshwater into HBL. This has modified the hydrology of HBL.
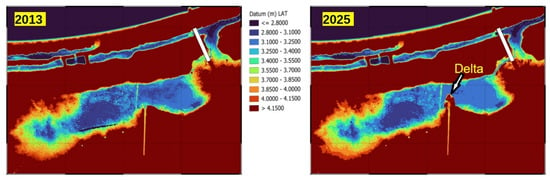
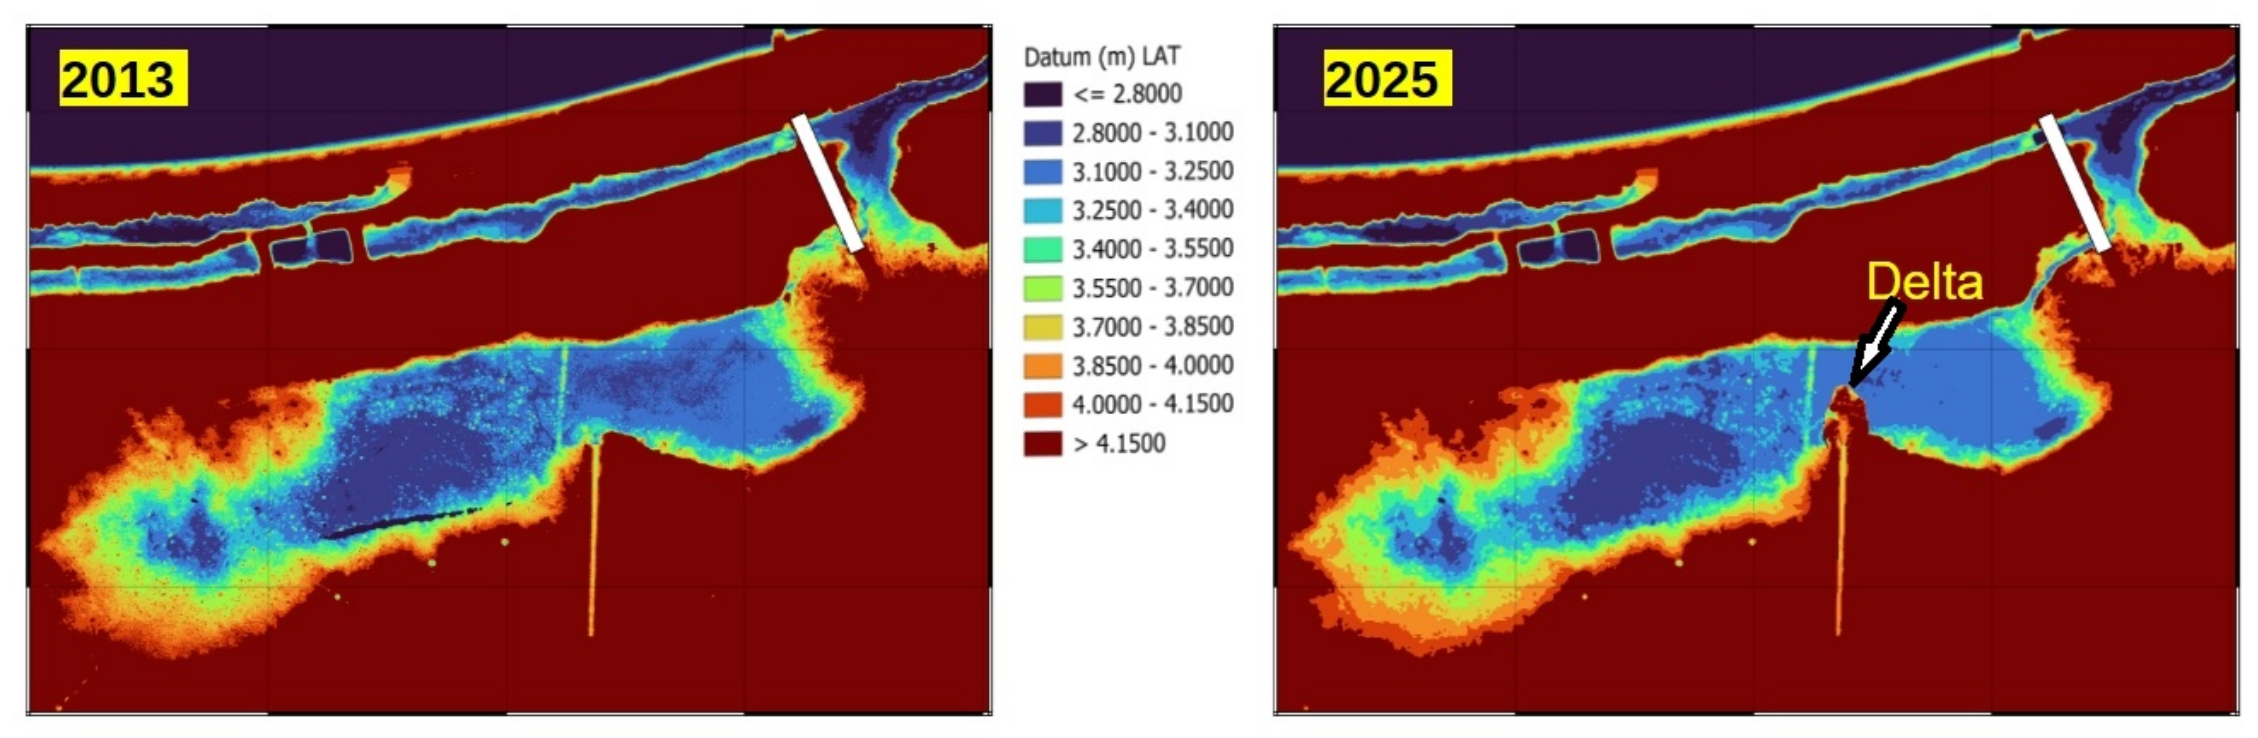
The inflow of sediment into HBL has also increased and impacted the ecology of HBL. The increased fine sediment inflow into the lower lagoon during floods is deposited preferentially in the lower lagoon. This has resulted in raising the bed level of the lower lagoon to be about 0.2 m higher than that in the eastern half of the upper lagoon (Figure 12). As a result, the eastern half of the upper lagoon stays wet about 30 days longer than the lower lagoon. This may be the reason for the colonisation of the upper lagoon by the Weeping Paperbark trees, as it now has a prolonged (3–10 months) seasonal inundation followed by a dry period, which is ideal for those trees. Also, the decrease in the volume of the lower lagoon results in a higher salinity value when saline water intrudes or when it first gets wet when salt stored in the lagoon soil from the previous dry season leaches out. In summary, the diversion of Eastern Creek, the erosion around Eastern Creek, and the dredging of the natural shoal in the Outflow Channel lagoon have severely degraded the ecological health of HBL. To aggravate it all, sand trapped behind the first weir in the Inflow Channel filled the channel and was not removed (Figure 13). Thus, the new incoming riverine sand during floods went straight over the weirs to the lower lagoon, where it built up the sand delta (Figure 6d).
Figure 12.
LIDAR and RTKGPS-derived ground level elevation (m, LAT datum) in and around HBL in 2013 and 2025.
Figure 13.
An oblique photograph looking downstream along the Inflow Channel showing that coarse sediment (mainly sand) that filled the basin behind the 1st weir (demarcated by the arrow) after the 2025 and 2026 floods was not cleared away.
We found no previous Environmental Impact Study predicting the impact of modifying the hydrology and salinity regime of HBL to support the engineering measures that were implemented in the last few decades to manage HBL. Residents requested the authors to conduct this study. It has limitations; all monitoring was post-impact, and there is no other lagoon nearby that could be monitored as a control site. As a result, our argument that dredging caused salinisation, which in turn caused the tree mass mortality, is asserted rather than demonstrated. Indeed, there were at least two significant confounders, namely (1) an uncontrolled sandbagging intervention in 2025 during the very dry season that was monitored and (2) concurrent lagoon desiccation as an alternative mortality mechanism. However, the sandbagging intervention in 2025 is not the cause of the tree mass mortality because it occurred after the tree mass mortality. Also, desiccation may not be responsible for the tree mass mortality because the trees survived much more prolonged desiccation periods in previous decades (Figure 3). Salinisation of the lagoon harmed the Bulkuru sedge, and in turn this reduced food availability for the Magpie Geese. It could also lead to the build-up of acid sulphide/sulphate sediments in the lagoon. On the positive, it could enable coastal fish to migrate in the lagoon.
6. Conclusions and Ecohydrology Solutions
Science-based restoration efforts are needed. Restoring the ecology of estuaries and lagoons is a difficult endeavour in an urbanised environment [43] and should be done cautiously, following ecohydrology principles that are nature-based [33]. HBL was originally, unvegetated and M. leucadendra colonised the upper lagoon only from the late 1970s (Figure 1 and Figure 3). The first question to answer is what restoration is needed. If the pre-European condition is the restoration target, the Weeping Paperbark stand is itself a symptom of the altered regime, and successful restoration would remove it. However, that would be an unrealistic target because the watershed has been heavily modified by humans. If the restoration target is the pre-dredging period, then the trees are part of the ecosystem. As a first step, the physical resilience of the lagoon should be increased by restoring its hydrodynamics. Here we propose restoration recommendations, which may be too specific relative to the available engineering analysis. It is necessary to restore the original elevation of the lagoon water level when the outflow stops; this will give enough time for the avifauna, principally the Magpie Geese, to successfully reproduce. This could be achieved by restoring the natural weir in the Outflow Channel at Site X, possibly using sandbags and with an apron both upstream (to prevent toe erosion during a storm surge) and downstream (to prevent toe erosion during a flood). The location and the height of the weir must be based on hydrology-hydrodynamics considerations. By decreasing the number of days when the HBL is dry, the weir will reduce the hypothesised competition for resources by the two species of wallaby. It is also necessary to prevent tidal intrusion, which could be achieved by installing one-way flap gates in the culverts under the road bridge over the Outflow Channel. The choice of flap gates must be made based on hydraulic engineering considerations. A 200 mm hole, with its bottom at 3.5 m LAT, could be added to one of the flap gates to encourage fish migration. These recommendations could have significant hydraulic and ecological consequences. They are suggested as options requiring detailed hydrodynamic/hydraulic modelling, engineering design, ecological assessment, and long-term monitoring. At present, there are no such studies.
This is a neglected World Heritage Area. Consultation with the Wulgurukaba people is practical for the proposed restoration works. Finally, measures are needed to control the infilling of the HBL by eroded soil. Erosion data from Eastern Creek are unavailable. From our data on the growth of the sand delta, we know that in the 2025 wet season, there was at least 1300 m3 (±3.6%) of sand exported yearly from the watershed into HBL. There are no data on the export of fine sediment, and fine sediment (mud) is present in abundance because visual observations revealed that the waters in Eastern Creek were very turbid following heavy rain. There are formulae to evaluate the erosion rate [44]. However, without data, their use would be guesswork, especially for gully erosion, as the formulae are extremely sensitive to two key parameters whose values are unknown a priori. Starting with Eastern Creek, we suggest that (1) the sand in the three weirs in the Inflow Channel must be removed annually; (2) larger leaky weirs, each with a long river apron, should be built in Eastern Creek; these weirs will fill with eroded sediment, and they must also be excavated annually; (3) the well-proven Australian soil erosion control measures be used to control gully erosion; (4) Eastern Creek could be armoured throughout; and (5) leaky weirs be built with suitable aprons in all the creeks upstream of the urbanised areas. These measures would reverse the present slide into increasing environmental degradation that the residents start to accept as normal following the shifting baseline syndrome [45]. Based on worldwide experience, to be successful, the implementation of these measures should follow the ‘Adaptive Assessment Management’ methodology [33,46]. At that stage, ecohydrology-based solutions should be sought to solve the environmental implications of the dead trees in the upper lagoon, of the sand delta in the lower lagoon, and of the long-term sea level rise. All these measures would, in practice, fall under the regulatory and consent framework (Great Barrier Reef World Heritage Area, Queensland fisheries and marine park approvals, Native Title and Traditional Owner consultation).
Author Contributions
Conceptualization, C.H. and E.W.; methodology, C.H. and E.W.; software, C.H.; validation, C.H., N.D., and E.W.; formal analysis, C.H., N.D., and E.W.; investigation, C.H., N.D., and E.W.; resources, C.H., N.D., and E.W.; data curation, C.H., N.D., and E.W.; writing—original draft preparation, C.H., N.D., and E.W.; writing—review and editing, C.H., N.D., and E.W.; visualization, C.H.; supervision, E.W.; project administration, E.W.; funding acquisition, E.W. and C.H. All authors have read and agreed to the published version of the manuscript.
Funding
This project was self-funded.
Data Availability Statement
The data is available upon request.
Acknowledgments
It is a pleasure to acknowledge the help of Alejandro Sanchez at USACE for assistance in debugging the HBL mesh, and that of Andy Frost for discussions, his local knowledge, and kindly providing Figure 2a. We thank the three anonymous reviewers who provided numerous comments and suggestions that were extremely helpful.
Conflicts of Interest
The authors declare no conflict of interest.
References
- Elliott, M.; Day, J.; Ramesh, R.; Wolanski, E. A Synthesis: What future for coasts, estuaries, deltas, and other transitional habitats in 2050 and beyond? In Coasts and Estuaries; Wolanski, E., Day, J.W., Elliott, M., Ramachandran, R., Eds.; Elsevier: Amsterdam, The Netherlands, 2019; pp. 1–28. [Google Scholar]
- Steven, A.D.L.; Appeaning Addo, K.; Llewellyn, G.; Vu, T.C.; Boateng, I.; Bustamante, R.; Doropoulos, C.; Gillies, C.; Hemer, M.; Lopes, P.; et al. Coastal Development: Resilience, Restoration and Infrastructure Requirements; World Resources Institute: Washington, DC, USA, 2020. [Google Scholar]
- Reimann, L.; Vafeidis, A.T.; Honsel, L.E. Population development as a driver of coastal risk: Current trends and future pathways. Camb. Prism. Coast. Futures 2023, 1, e14. [Google Scholar] [CrossRef] [Scilit]
- Barnes, R.S.K. Coastal Lagoons; Cambridge University Press: Cambridge, UK, 1980. [Google Scholar]
- Kjerfve, B. Coastal Lagoon Processes; Elsevier Oceanography Series 60; Elsevier: Amsterdam, The Netherlands, 1994. [Google Scholar]
- Perillo, G.M.E.; Wolanski, E.; Cahoon, D.M.E.; Brinson, M.M. Coastal Wetlands. An Integrated Ecosystem Approach; Elsevier: Amsterdam, The Netherlands, 2009. [Google Scholar]
- Wolanski, E.; Day, J.; Elliott, M.; Ramesh, R. Coasts and Estuaries. The Future; Elsevier: Amsterdam, The Netherlands, 2019. [Google Scholar]
- Ramesh, R.; Chen, Z.; Cummins, V.; Day, J.; D’Elia, C.; Dennison, B.; Forbes, D.L.; Glaeser, B.; Glaser, M.; Glavovic, B.; et al. Land–Ocean interactions in the coastal zone: Past, present & future. Anthropocene 2015, 12, 85–98. [Google Scholar] [CrossRef] [Scilit]
- Bonthu, S.; Ganguly, D.; Ramachandran, P.; Ramachandran, R.; Pattnaik, A.K.; Wolanski, E. Both riverine detritus and dissolved nutrients drive lagoon fisheries. Estuar. Coast. Shelf Sci. 2016, 183, 360–369. [Google Scholar] [CrossRef] [Scilit]
- Pasqualini, V.; Derolez, V.; Garrido, M.; Orsoni, V.; Baldi, Y.; Etourneau, S.; Leoni, V.; Rebillout, P.; Laugier, T.; Souchu, P.; et al. Spatiotemporal dynamics of submerged macrophyte status and watershed exploitation in a Mediterranean coastal lagoon: Understanding critical factors in ecosystem degradation and restoration. Ecol. Eng. 2017, 102, 1–14. [Google Scholar] [CrossRef] [Scilit]
- Newton, A.; Brito, A.C.; Icely, J.D.; Derolez, V.; Clara, I.; Angus, S.; Schernewski, G.; Lillebø, A.I.; Sousa, A.I.; Béjaoui, B.; et al. Assessing, quantifying and valuing the ecosystem services of coastal lagoons. J. Nat. Conserv. 2018, 44, 50–65. [Google Scholar] [CrossRef] [Scilit]
- Bonometto, A.; Ponis, E.; Cacciatore, F.; Riccardi, E.; Pigozzi, S.; Parati, P.; Novello, M.; Ungaro, N.; Acquavita, A.; Manconi, P.; et al. A new multi-index method for the eutrophication assessment in transitional waters: Large-scale implementation in Italian lagoons. Environments 2022, 9, 41. [Google Scholar] [CrossRef] [Scilit]
- Allan, H.; Levin, N.; Kark, S. Quantifying and mapping the human footprint across Earth’s coastal areas. Ocean Coast. Manag. 2023, 236, 106476. [Google Scholar] [CrossRef] [Scilit]
- Rodrigues-Filho, J.L.; Macêdo, R.L.; Sarmento, H.; Pimenta, V.R.A.; Alonso, C.; Teixeira, C.; Pagliosa, P.R.; Netto, S.A.; Santos, N.C.L.; Daura-Jorge, F.G.; et al. From ecological functions to ecosystem services: Linking coastal lagoons biodiversity with human well-being. Hydrobiologia 2023, 850, 2611–2653. [Google Scholar] [CrossRef] [Scilit] [PubMed]
- Perera, N.S.; Wartman, M.; Macreadie, P.I.; Malerba, M.E.; Costa, M.D.P. Future risks to coastal wetlands under climate change: A case study from Victoria, Australia. J. Environ. Manag. 2026, 401, 128930. [Google Scholar] [CrossRef] [Scilit] [PubMed]
- Gonenc, E.; Wolflin, J.P. Coastal Lagoons Ecosystem Processes and Modeling for Sustainable Use and Development; CRC Press: Boca Raton, FL, USA, 2004. [Google Scholar]
- Jiménez-Casero, J.; Ruiz, J.M.; Bernardeau-Esteller, J.; García-Muñoz, R.; Sánchez-Lizaso, J.L.; Marín-Guirao, L.; Belando, M.D. Cascading ecological impacts: From eutrophic coastal lagoon collapse to decline of Posidonia oceanica meadows in the Mediterranean. Mar. Pollut. Bull. 2025, 221, 118536. [Google Scholar] [CrossRef] [Scilit] [PubMed]
- Ligorini, V.; Malet, N.; Garrido, M.; Four, B.; Etourneau, S.; Leoncini, A.S.; Dufresne, C.; Cecchi, P.; Pasqualini, V. Long-term ecological trajectories of a disturbed Mediterranean coastal lagoon (Biguglia lagoon): Ecosystem-based approach and considering its resilience for conservation? Front. Mar. Sci. 2022, 9, 937795. [Google Scholar] [CrossRef] [Scilit]
- Specchiulli, A.; Pastorino, P.; De Rinaldis, G.; Scirocco, T.; Anselmi, S.; Cilenti, L.; Ungaro, N.; Renzi, M. Multiple approach for assessing lagoon environmental status based on water bodies quality indices and microplastics accumulation. Sci. Total Environ. 2023, 892, 164228. [Google Scholar] [CrossRef] [Scilit] [PubMed]
- Pagliani, V.; Arnau-López, E.; Campillo-Tamarit, N.; Muñoz-Colmenares, M.; Soria, J.M.; Molner, J.V. Environmental degradation in the Italian Mediterranean coastal lagoons shown by satellite imagery. Phycology 2025, 5, 87. [Google Scholar] [CrossRef] [Scilit]
- Wang, Y.; Dong, X.; Xian, H.; Zhang, Y.; Li, Y.; Wang, Y.; Bennion, H. Emerging environmental risks to the largest coastal lagoon (Pinqing Lagoon) on the Chinese mainland: Assessment through a water-sediment-ecological perspective. Mar. Pollut. Bull. 2025, 212, 117498. [Google Scholar] [CrossRef] [Scilit] [PubMed]
- O’Connor, B.; Oliver, G.; Cawley, T.; Roden, C.; Perrin, P.; de Wit, R.; McCaffrey, K.; O’Connor, A. Research 473: Coastal Lagoons: Ecology and Restoration (CLEAR); Environmental Protection Agency: Wexford, Ireland, 2025. [Google Scholar]
- Gunathilaka, D.M.D.K.L. Study of the major causes of degradation of coastal lagoon environment: A case study from Daluwa to Kalpitiya shoreline in Puttalam lagoon, Sri Lanka. Int. J. Emerg. Technol. Innov. Res. 2019, 1, 650–657. [Google Scholar]
- Wolanski, E.; Hopper, C. Environmental degradation of Townsville coast and coastal waters of the Great Barrier Reef—Ecohydrology solutions. Ecohydrol. Hydrobiol. 2025, 25, 100672. [Google Scholar] [CrossRef] [Scilit]
- Webster, I.T.; Harris, G.P. Anthropogenic impacts on the ecosystems of coastal lagoons: Modelling fundamental biogeochemical processes and management implications. Mar. Freshw. Res. 2004, 55, 67–78. [Google Scholar] [CrossRef] [Scilit]
- Huang, P.; Hennig, K.; Kala, J.; Andrys, J.; Hipsey, M.R. Climate change overtakes coastal engineering as the dominant driver of hydrological change in a large shallow lagoon. Hydrol. Earth Syst. Sci. 2020, 24, 5673–5697. [Google Scholar] [CrossRef] [Scilit]
- Vazquez Botello, A.; de la Lanza Espino, G.; Villanueva Fragoso, S.; Velez, G.P. Pollution Issues in Coastal Lagoons in the Gulf of Mexico; Lagoon Environments Around the World-A Scientific Perspective; IntechOpen: London, UK, 2020. [Google Scholar]
- Shetaia, S.A.; Wang, Y.; Marriner, N.; Li, M.; Zhao, X.; Chen, J.; Salem, A.; Chen, Z. Fate of heavy metals in the water-scarce Nile Delta lagoons: A post-Aswan Dam perspective. Environ. Pollut. 2025, 382, 126754. [Google Scholar] [CrossRef] [Scilit] [PubMed]
- Athukorala, A.; Amarathunga, A.A.D.; De Silva, D.S.M.; Bakir, D.S.M.; McGoran, A.; Sivyer, A.; De Silva, D. Microplastics in lagoon ecosystems: A review on occurrence and methods for microplastic detection. Biol. Environ. Proc. R. Ir. Acad. 2023, 123B, 121–135. [Google Scholar] [CrossRef] [Scilit]
- Elliott, M.; Mander, L.; Mazik, K.; Simenstad, C.; Valesini, F.; Whitfield, A.; Wolanski, E. Ecoengineering with ecohydrology: Successes and failures in estuarine restoration. Estuar. Coast. Shelf Sci. 2016, 176, 12–35. [Google Scholar] [CrossRef] [Scilit]
- Meadows, D.H.; Meadows, D.L.; Randers, J.; Behrens, W.W. The Limits to Growth: A Report for the Club of Rome’s Project on the Predicament of Mankind; Universe Books: New York, NY, USA, 1972. [Google Scholar]
- Schröder, P. Limits and beyond: 50 years on from The limits to growth, what did we learn and what’s next? Int. Aff. 2023, 99, 1342–1343. [Google Scholar] [CrossRef] [Scilit]
- Zalewski, M. Transdisciplinary Ecohydrology. Advanced Nature Based Solutions for the Enhancement of Catchment Sustainability Potential; Elsevier: Amsterdam, The Netherlands, 2026. [Google Scholar]
- Wolanski, E.; Hopper, C. Dams and climate change accelerate channel avulsion and coastal erosion and threaten Ramsar-listed wetlands in the largest Great Barrier Reef watershed. Ecohydrol. Hydrobiol. 2022, 22, 197–212. [Google Scholar] [CrossRef] [Scilit]
- Fraley, A. A Pictorial History of Magnetic Island, North Q’land; Arch Fraley: Townsville, Australia, 1996. [Google Scholar]
- Giblett, R. Wetland plants and Aboriginal paludiculture in North- and South-Eastern Australia. Plant Perspect. 2024, 1, 96–119. [Google Scholar] [CrossRef] [Scilit]
- Whitehead, P.J.; Saalfeld, K. Nesting phenology of magpie geese (Anseranas semipalmata) in monsoonal northern Australia: Responses to antecedent rainfall. J. Zool. 2000, 251, 495–508. [Google Scholar] [CrossRef] [Scilit]
- Whitehead, P.J. Aspects of the Nesting Biology of the Magpie Goose Anseranas semipalmata: Incubation period, hatching synchrony and patterns of nest attendance and defence. Emu-Austral Ornithol. 1999, 99, 121–134. [Google Scholar] [CrossRef] [Scilit]
- Frith, H.J.; Davies, S.J.F. Ecology of the Magpie Goose, Anseranas semipalmata Latham (Anatidae). CSIRO Wildl. Res. 1961, 6, 91–141. [Google Scholar] [CrossRef] [Scilit]
- Rhoads, B.L. The dynamics of river confluences. In River Dynamics: Geomorphology to Support Management; Cambridge University Press: Cambridge, UK, 2020; pp. 269–293. [Google Scholar]
- Yuan, S.; Tang, H.; Li, K.; Xu, L.; Xiao, Y.; Gualtieri, C.; Rennie, C.; Melville, B. Hydrodynamics, sediment transport and morphological features at the confluence between the Yangtze River and the Poyang Lake. Water Resour. Res. 2021, 57, e2020WR028284. [Google Scholar] [CrossRef] [Scilit]
- Fernandes, J.N.; Alizadeh, L. Sedimentation Pattern as a Response to Hydrodynamics in a Near-Symmetric River Confluence. Sustainability 2025, 17, 3790. [Google Scholar] [CrossRef] [Scilit]
- Duarte, C.M.; Conley, D.J.; Carstensen, J.; Sánchez-Camacho, M. Return to Neverland: Shifting Baselines Affect Eutrophication Restoration Targets. Estuaries Coasts 2009, 32, 29–36. [Google Scholar] [CrossRef] [Scilit]
- Bezak, N.; Borrelli, P.; Mikoš, M.; Auflič, M.J.; Panagos, P. Towards multi-model soil erosion modelling: An evaluation of the erosion potential method (EPM) for global soil erosion assessments. Catena 2024, 234, 107596. [Google Scholar] [CrossRef] [Scilit]
- Soga, M.; Gaston, K.J. Shifting baseline syndrome: Causes, consequences, and implications. Front. Ecol. Environ. 2018, 16, 222–230. [Google Scholar] [CrossRef] [Scilit]
- Sellberg, M.M.; Quinlan, A.; Preiser, R.; Malmborg, K.; Peterson, G. D Engaging with complexity in resilience practice. Ecol. Soc. 2021, 26, 8. [Google Scholar] [CrossRef] [Scilit]
Disclaimer/Publisher’s Note: The statements, opinions and data contained in all publications are solely those of the individual author(s) and contributor(s) and not of MDPI and/or the editor(s). MDPI and/or the editor(s) disclaim responsibility for any injury to people or property resulting from any ideas, methods, instructions or products referred to in the content. |
© 2026 by the authors. Licensee MDPI, Basel, Switzerland. This article is an open access article distributed under the terms and conditions of the Creative Commons Attribution (CC BY) license.