


Abstract
Conventional cast-in-place foundations can require substantial on-site work, motivating transportable precast alternatives for substation equipment. This study proposes a prestressed precast concrete isolated foundation (PPCIF), comprising a pedestal and stepped footing assembled with post-tensioned threaded bars. Component and connection design checks are combined with a three-dimensional finite-element model incorporating concrete damaged plasticity, discrete reinforcement, frictional contact, and soil–foundation interaction. Sixteen design cases cover four ground profiles and four prescribed load cases. The reported maximum settlement ranges from approximately 1.0 mm in the rock profile to 16.2 mm in the collapsible-loess parameter set. Local concrete compressive stress reaches 21.66 MPa, and tensile damage reaches 0.975 near the pedestal and ducts, identifying anchorage-region detailing as a priority for refinement. Prestressing supports compressive force transfer across the assembled interfaces, whose performance also depends on local relative movement. A supplementary J1 soil-mesh comparison gives loading-point settlement increments of 15.968, 15.174, and 16.104 mm at 895.6 kN. The combined results link ground-dependent settlement to local connection demand and provide a numerical basis for refining the modular foundation under the considered design loads. The findings constitute a preliminary parametric exploration under prescribed design actions and are intended to guide, rather than replace, experimental validation and project-specific design verification.
1. Introduction
1.1. Engineering Context and Connection Performance
Precast concrete construction offers opportunities to shorten on-site construction periods, facilitate assembly, and reduce disturbance around operating infrastructure [1,2]. For substation equipment foundations, these advantages must be achieved without losing the load-transfer functions of a conventional pedestal and footing. Dividing the foundation into transportable units changes its mechanical continuity: axial force, horizontal force, and overturning moment must cross interfaces before being transferred to the supporting ground. The engineering task is therefore to coordinate component size, connection layout, and foundation response. An assessment based only on member strength would overlook the relative movements that can develop between individually stiff precast components.
Modular foundations have been assembled using embedded steel components, bolts, and mechanical interlock to accommodate transportation and lifting requirements [3]. Shear keys and prestressing offer complementary ways of connecting such units [4,5,6,7]. A key transfers shear through local bearing and interlock, whereas prestress introduces compression that can mobilize friction along a contact surface. These mechanisms also create concentrated force-transfer regions. A connection capable of maintaining global equilibrium can consequently develop local tensile damage or high reinforcement demand near an anchorage, duct, or geometric transition. The design of an assembled footing must account for both the overall load path and these local details.
Experimental research on precast column–foundation connections provides an important starting point for this assessment [8,9,10,11]. Nascimbene and Bianco [12] investigated cyclic response using full-scale tests and nonlinear three-dimensional models of connections formed by column shoes and foundation bolts. Xu et al. [13] examined a UHPC connection between precast bridge columns and footings through testing and numerical analysis. Jiao et al. [14] studied an embedded steel-tube connection with studs, including comparison with a conventional cast-in-place specimen. These studies demonstrate how connection-specific mechanisms can be examined against measured response. Their column-base systems, however, do not provide a direct assessment of a footing divided into several post-tensioned blocks resting on deformable soil.
Dry-joint research further shows why connection geometry should be treated as a mechanical variable rather than only an assembly detail. Baghdadi et al. [5] tested and modeled eight dry-joint frame geometries under combined bending and shear. Wu et al. [6] examined large bond-tooth joints in prestressed assembled beams, while Hou et al. [7] investigated large keyed dry joints through experiments and numerical modeling. Together, these studies motivate explicit consideration of the contact surface and its adjacent concrete when assessing force transfer. These findings highlight the influence of joint geometry and loading conditions on connection performance.
Ground support introduces an additional scale of interaction. Meng et al. [15] examined the influence of backfill and embedment on metallic prefabricated foundations under uplift, and the shallow-foundation studies in [16,17] address the influence of soil response on bearing and deformation. For concrete mat foundations, Patrício et al. [18] combined settlement monitoring with numerical soil–structure interaction analysis and emphasized the effect of construction stages on the measured response. The materials, geometry, and loading differ from the present system, but these studies establish the need to consider how the ground redistributes foundation reactions. In a segmented footing, that redistribution can change the deformation imposed on the joints and the local demand transmitted through the prestressing system.
1.2. Numerical Modeling Strategies
Three levels of numerical description are useful for organizing the modeling choices: an idealized continuous representation, an explicit component-and-interface representation, and a multiscale representation. These are alternative levels of resolution, rather than a mandatory sequence of development. Their suitability depends on the response being sought and the evidence available to define the model. An economical model for global displacement need not be sufficiently detailed for anchorage stresses; conversely, a highly detailed joint model does not automatically provide a reliable prediction of foundation settlement if its ground support is overly constrained. The choice of model should therefore follow the quantities to be interpreted.
A continuous or fully bonded representation imposes compatibility across the boundaries of adjacent components. It is useful for estimating an idealized composite response or defining a monolithic reference, and it avoids the nonlinear changes in contact status associated with opening and reclosure. Its interpretation is nevertheless tied to that compatibility assumption. If the research question concerns separation or tangential displacement between precast blocks, the relevant relative degrees of freedom must be retained. Assigning identical bulk material properties to a monolithic and an assembled geometry is not sufficient to make their joint behavior equivalent. Similarly, a comparison with a monolithic reference is meaningful only when the geometry, reinforcement, loading, and support conditions are controlled.
An explicit component-and-interface model resolves the individual blocks and assigns separate rules to their interfaces. Normal contact can transmit compression while allowing separation, and a friction law relates tangential resistance to contact pressure. This description is consistent with the mechanical distinctions examined in dry-joint studies [5,6,7]. It also requires the analyst to distinguish bearing contact from genuinely tied or embedded connections. The response depends on contact geometry, friction assumptions, and the prestress-induced state before external loading. Consequently, contact pressure, opening, and tangential relative displacement should be interpreted together. A compressive pressure contour identifies active force transfer but does not, by itself, demonstrate closure everywhere on an interface.
The representation of reinforcement is a separate modeling choice. A distributed reinforcement idealization can describe directional composite action without explicitly resolving every bar. Discrete bar elements retain the layout and enable stresses to be associated with individual reinforcement members. This is useful when demand near a pedestal transition, a duct, or an anchorage is part of the research question. However, the use of discrete bars does not itself constitute a bond-slip model. Embedded reinforcement follows the displacement of its host concrete and therefore represents perfect bond. The present choice of discrete reinforcement is based on the required bar-level output rather than a claim that all alternative representations are unsuitable or that existing studies predominantly use smeared reinforcement.
Explicit bond modeling becomes important when reinforcement slip and local splitting are quantities of interest. Valiukas et al. [19] combined short reinforced-concrete tie tests with mesoscopic finite-element analysis to examine bond-slip behavior before reinforcement yielding. Their study illustrates that the reinforcement–concrete interface contains mechanisms not represented by a simple compatibility constraint. For the present foundation, an embedded formulation provides an efficient baseline for tracing reinforcement demand, while duct-wall contact and the prestressing-bar connections are represented separately. The present representation focuses on reinforcement stresses and concrete damage under the prescribed loads.
Multiscale methods provide another way to connect local mechanisms with structural response. Sciegaj et al. [20] developed a two-scale formulation in which effective reinforcement slip and its variation enrich the macroscopic description, with the subscale problem resolving the associated concrete, steel, and bond response. Such approaches can transfer information between scales without explicitly representing the complete heterogeneous microstructure over the full structural domain. They also introduce additional constitutive definitions and scale-transition assumptions. For a design-case study of a specific assembled foundation, an explicit three-dimensional structural model offers a direct relationship between the component arrangement and the reported field outputs. Multiscale treatment is therefore a possible extension for local bond or cracking questions.
Soil representation and numerical discretization must be considered alongside these connection choices. A deformable soil continuum permits reaction redistribution and spatially varying settlement, whereas a prescribed support stiffness represents those effects only through its selected parameters. The domain boundaries and initial stress state therefore enter the interpretation of soil–foundation response. Construction-stage effects on settlement have also been documented for concrete mat foundations [18]. Mesh assessment should likewise identify the quantity being compared. Stability of a global load–displacement curve does not establish that a local softening variable is independent of element size, particularly when the structural mesh remains unchanged [21,22,23]. Reporting the soil discretization and the complete loading-point histories provides a useful numerical check without treating a local stress or damage plateau as a universal convergence criterion.
1.3. Research Scope and Contribution
The resulting research need is to link three responses within one foundation configuration: settlement governed by the supporting ground, force transfer across the assembled blocks, and local stress and damage around prestressing details. Existing connection tests and models provide mechanisms and comparative evidence, but a column-base connection or a beam dry joint is not interchangeable with a multi-block footing. The present study addresses this configuration-specific question by building on the available joint and foundation evidence. Its contribution is the integration of a transportable component arrangement, a threaded-bar connection design, and a numerical assessment in which the foundation interfaces and deformable ground are represented together.
Accordingly, this study proposes a prestressed precast concrete isolated foundation for substation equipment, comprising a precast pedestal and stepped footing assembled by post-tensioned threaded bars. The configuration retains the overall dimensions of the cast-in-place design reference while dividing the foundation into transportable units. Concrete component and connection checks follow [24], whereas geotechnical checks follow [25]. A three-dimensional finite-element model combines concrete damaged plasticity, discrete reinforcement, prestressing bars, frictional interfaces, and soil–foundation interaction. Four ground profiles and four prescribed load cases provide 16 design-case assessments. A supplementary J1 soil-mesh comparison examines the loading-point response. The study evaluates settlement, the localization of structural demand, and the implications for anchorage and duct detailing. The resulting evidence supports refinement of the assembled foundation under the stated mechanical loading conditions.
The scope of this assessment is limited to four conditions. First, the analyses address prescribed design actions for the selected equipment and do not replace project-specific verification. Second, the numerical predictions have not been calibrated against a matching prototype or model test; the connection experiments discussed in Section 3.7 provide mechanism-based context only. Third, the soil profiles are represented by rate-independent elasto-plastic parameters, and transient hydro-mechanical processes are outside the present formulation. Fourth, the finite soil domain and the structural discretization are supplemented, rather than replaced, by the sensitivity evidence in Appendix B. Within these bounds, the results support a preliminary parametric exploration of the PPCIF system.
2. Materials and Methods
2.1. Project Background and Modular Configuration
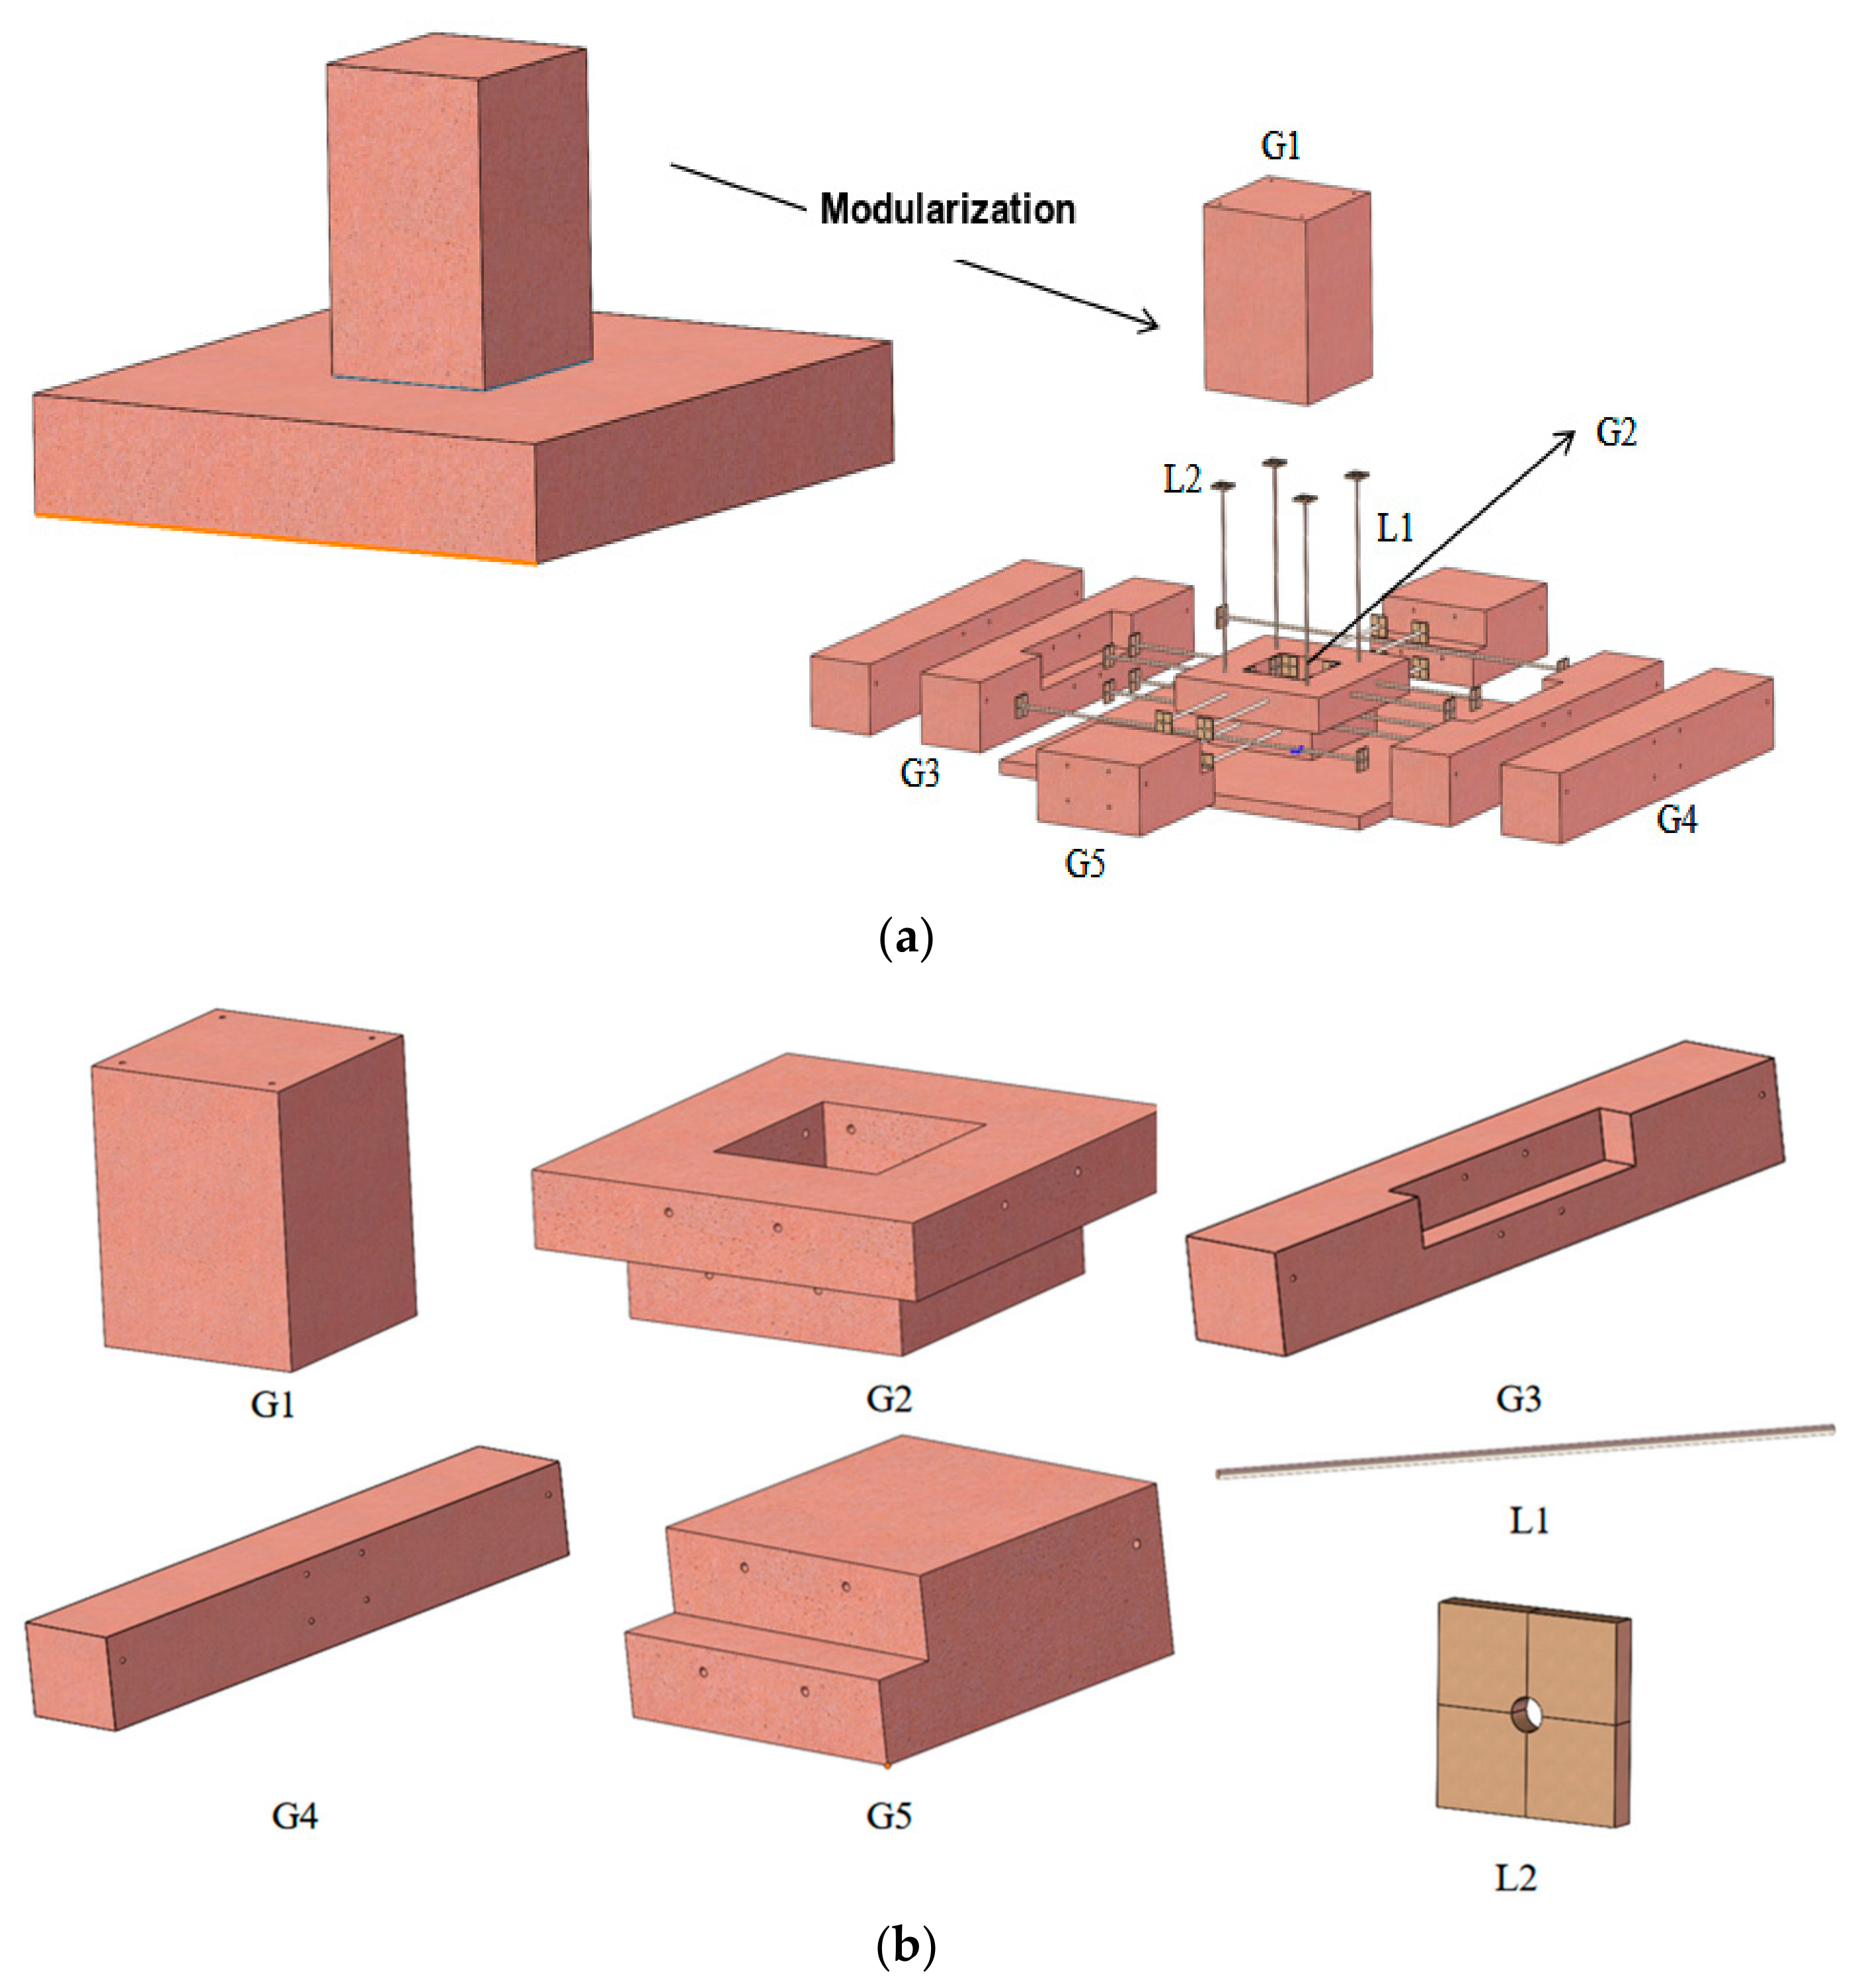
This study is based on a project involving prefabricated foundations for substation equipment in Ningxia, China. The project includes a standardized connection and assembly scheme for pedestal–raft foundations, prefabricated foundation schemes for 330 kV and 110 kV outdoor substation equipment, and an assembly scheme and design methodology for isolated foundations. A conventional monolithic cast-in-place reinforced-concrete isolated foundation used in the project was selected as the reference structure. To satisfy transportation and on-site lifting requirements, the foundation was modularized according to the design criterion that the mass of each precast component should not exceed 5 t, as specified in Table 1. Accordingly, the monolithic foundation was divided into several smaller precast reinforced-concrete components, as illustrated in Figure 1.
Table 1.
Comparison between the cast-in-place and modular prefabricated foundations.
Figure 1.
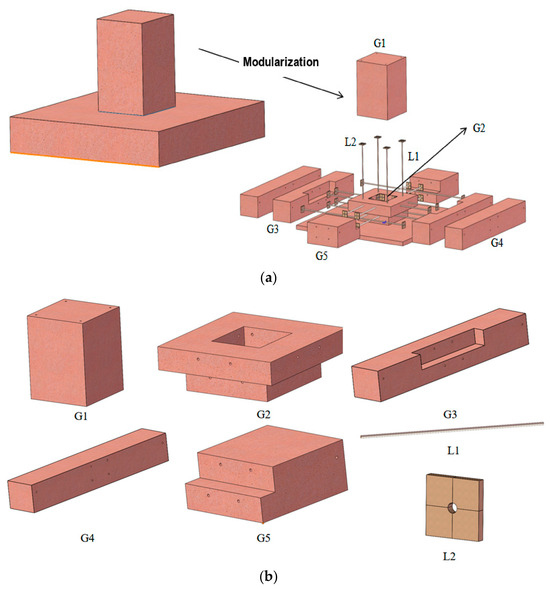
Modular decomposition and component arrangement of the isolated foundation: (a) modular decomposition of the cast-in-place isolated foundation; (b) modular components of the PPCIF. Principal component dimensions are given in Section 2.3.1.
The proposed foundation consists of five types of precast components assembled using post-tensioned prestressing threaded bars (L1) and bearing plates (L2). Type G1 forms the precast pedestal, whereas type G2 forms the central footing block to which the pedestal is anchored. Types G3 and G5 form the long and short stepped connecting slabs, respectively, and are arranged on either side of the central block. Type G4 consists of two longitudinal outer base slabs. The standardized component geometry facilitates formwork fabrication and bidirectional arrangement, thereby reducing the number of molds and component types required. Preformed ducts are incorporated into the components to facilitate the on-site installation and tensioning of the prestressing threaded bars, thereby simplifying assembly and enhancing connection integrity.
2.2. Structural Analysis and Design Basis
The structural design addresses force and deformation demands under the governing load cases, the critical interfaces and structural regions, and their associated responses. The configuration and design parameters of the prestressing threaded bars were evaluated against the prescribed strength, serviceability, stability, and assembly requirements. The subsequent nonlinear analyses assess global response and local demand under the specified load cases.
Design Actions and Joint Forces
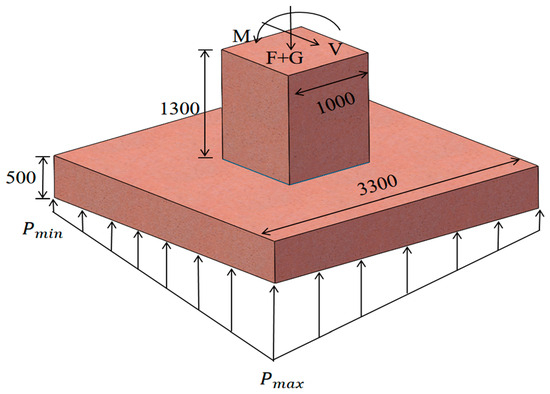
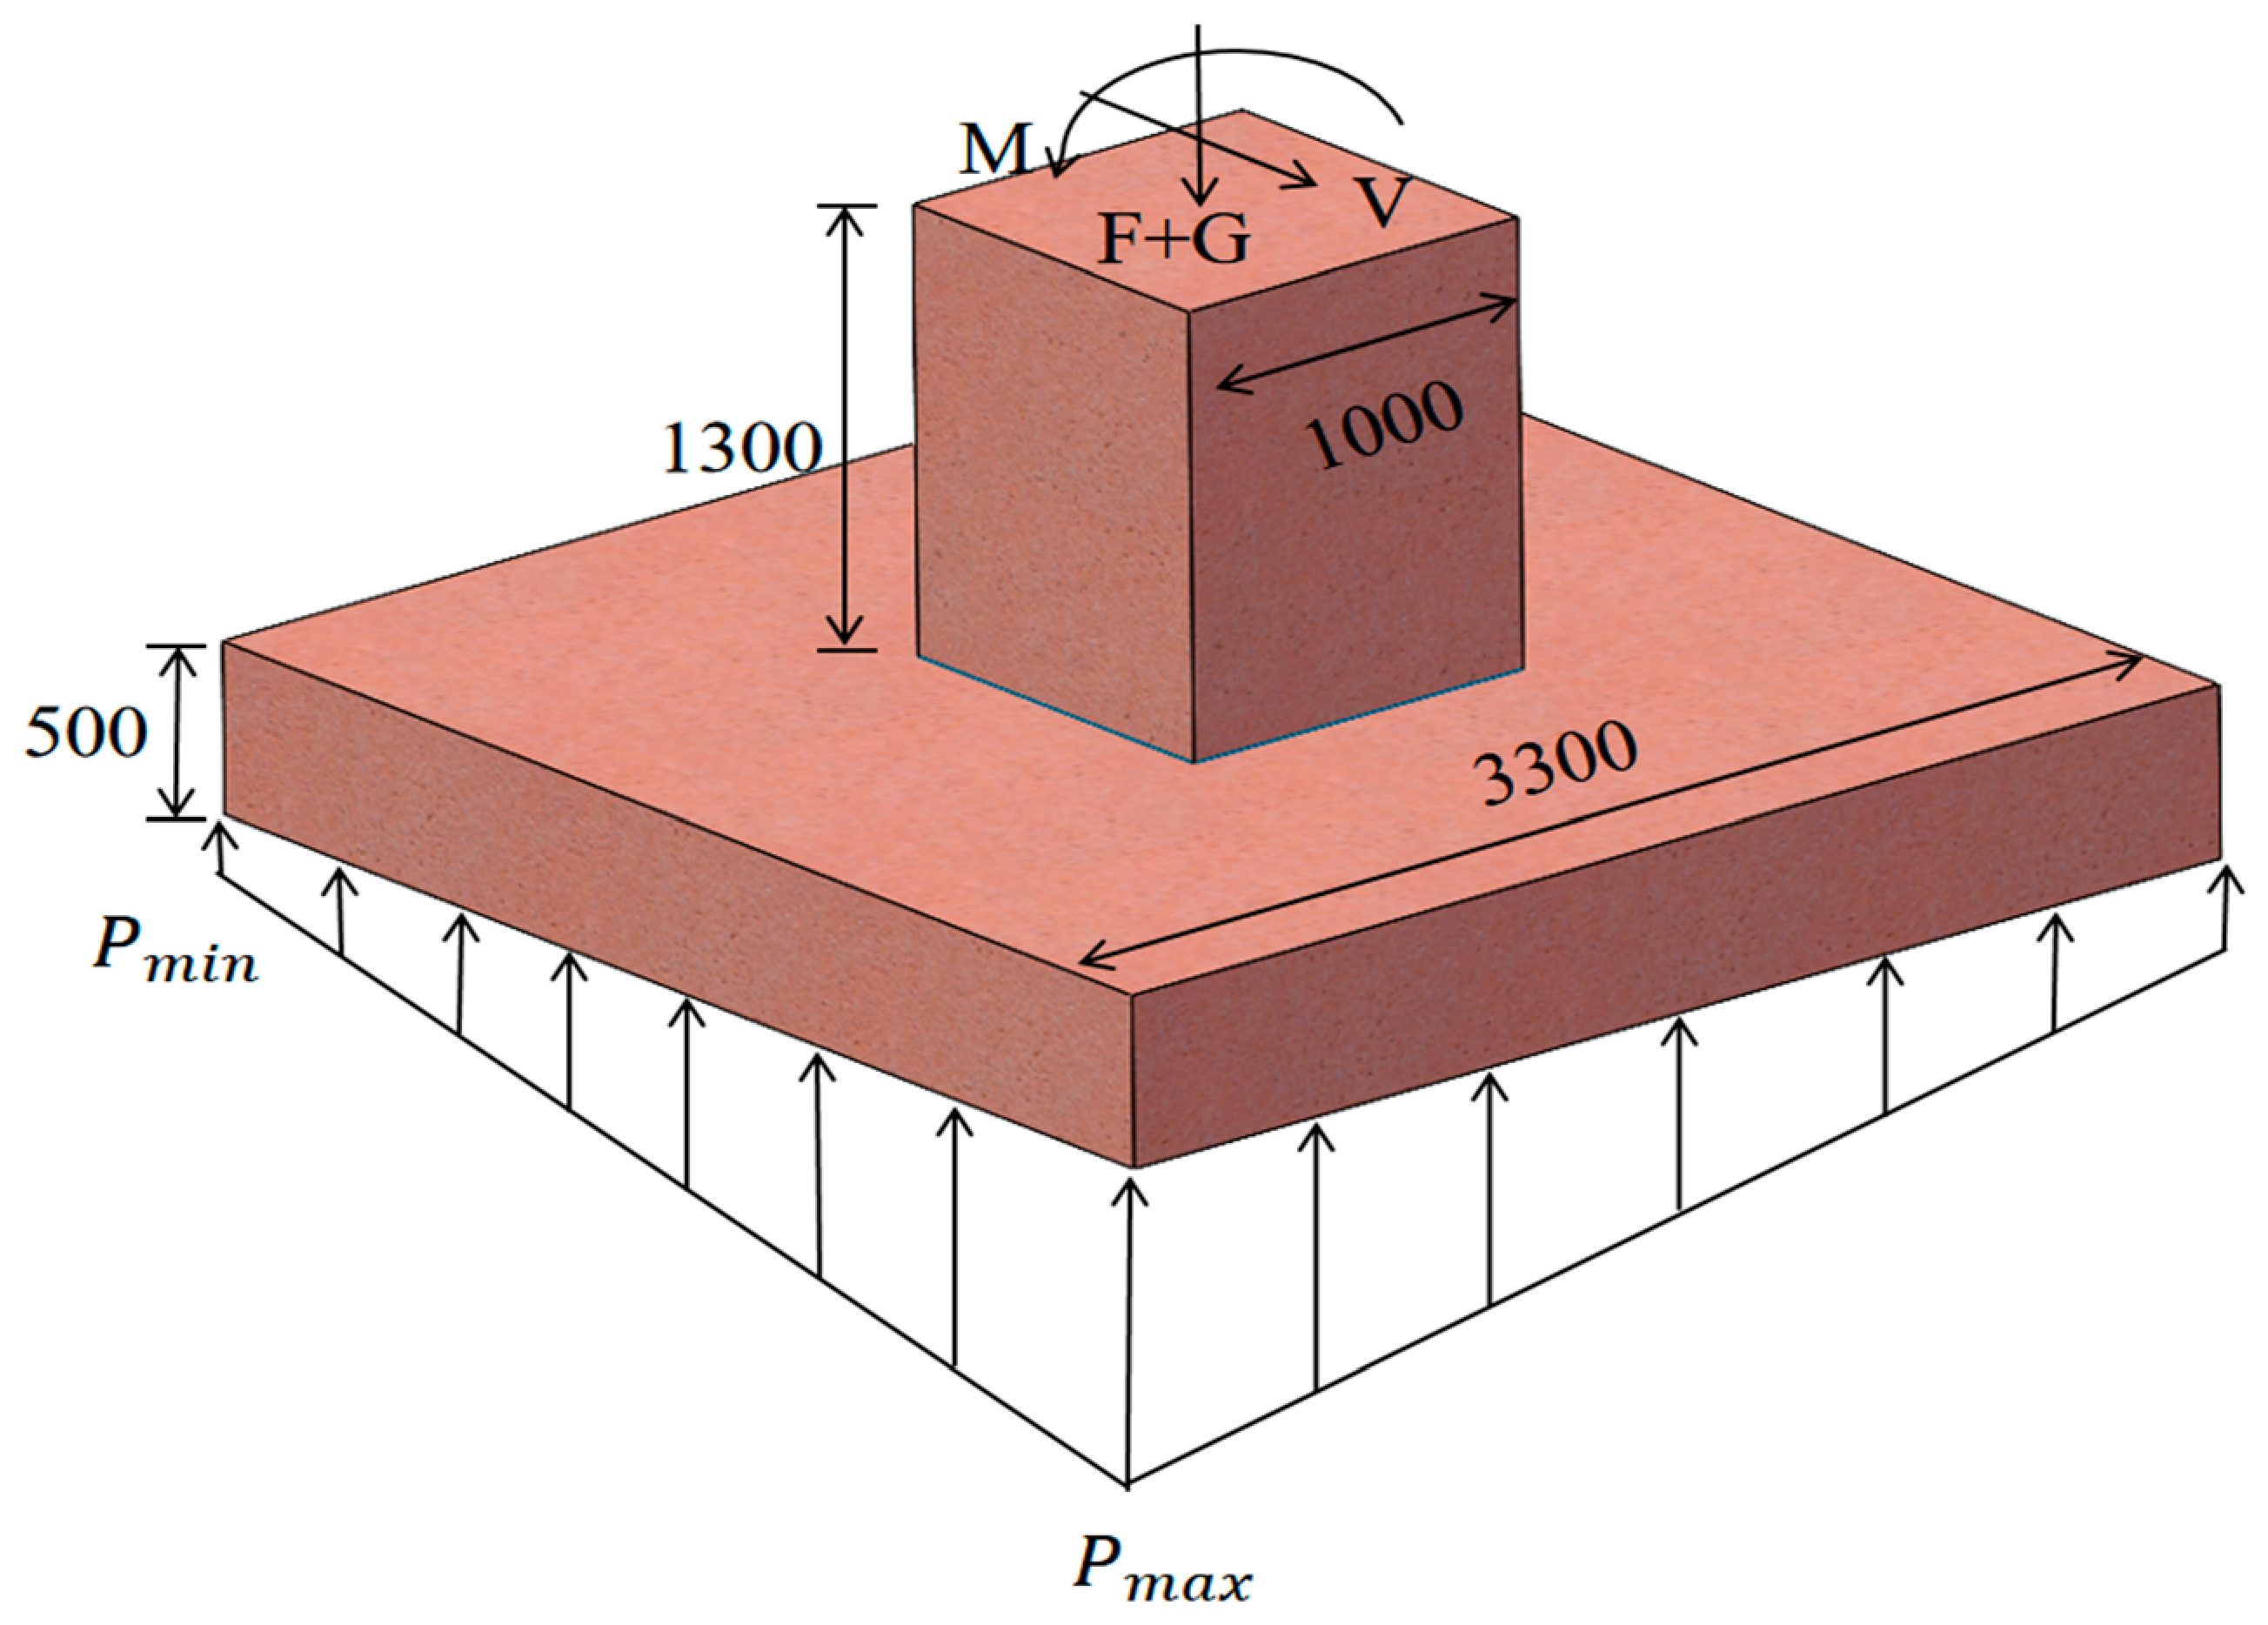
The design calculations use the force resultants and sign conventions shown in Figure 2.
Figure 2.
Force resultants used in the analysis of the isolated foundation. Dimensions are in millimeters.
According to relevant design codes, the serviceability limit state requires that structural responses, including deformation and crack width, remain within specified limits under normal operating conditions. Crack-width verification is therefore performed using the effects of the characteristic load combination, which typically includes permanent loads, wind loads, and other loads that are expected during normal operation. Accidental loads are not considered in this process.
The ultimate limit state relates to the structural safety under specified design conditions. It requires that the structure has sufficient resistance to strength failure, instability, and other potential failure modes. For both permanent and temporary design situations, the structural resistance is determined using the effects of the fundamental load combinations. For accidental design situations, the corresponding accidental load combinations must be used. The design values for the foundation are summarized in Table 2.
Table 2.
Design actions for load sets 1 (first data row) and 2 (second data row).
In Table 2, the compressive axial force N is reported as negative.
Following the geotechnical design provisions in [25], the maximum and minimum bearing pressures are calculated as follows:
where and are the maximum and minimum design bearing pressures at the footing edges (kPa), respectively; F is the design vertical force transferred from the superstructure to the footing base (kN); G is the combined weight of the foundation and overlying soil (kN); A is the footing-base area (m2); is the partial factor for permanent actions; are the design moments about the x- and y-directions at the footing base (kN·m); and are the corresponding section moduli of the footing base (m3).
The maximum bending moment in the footing slab is calculated as follows:
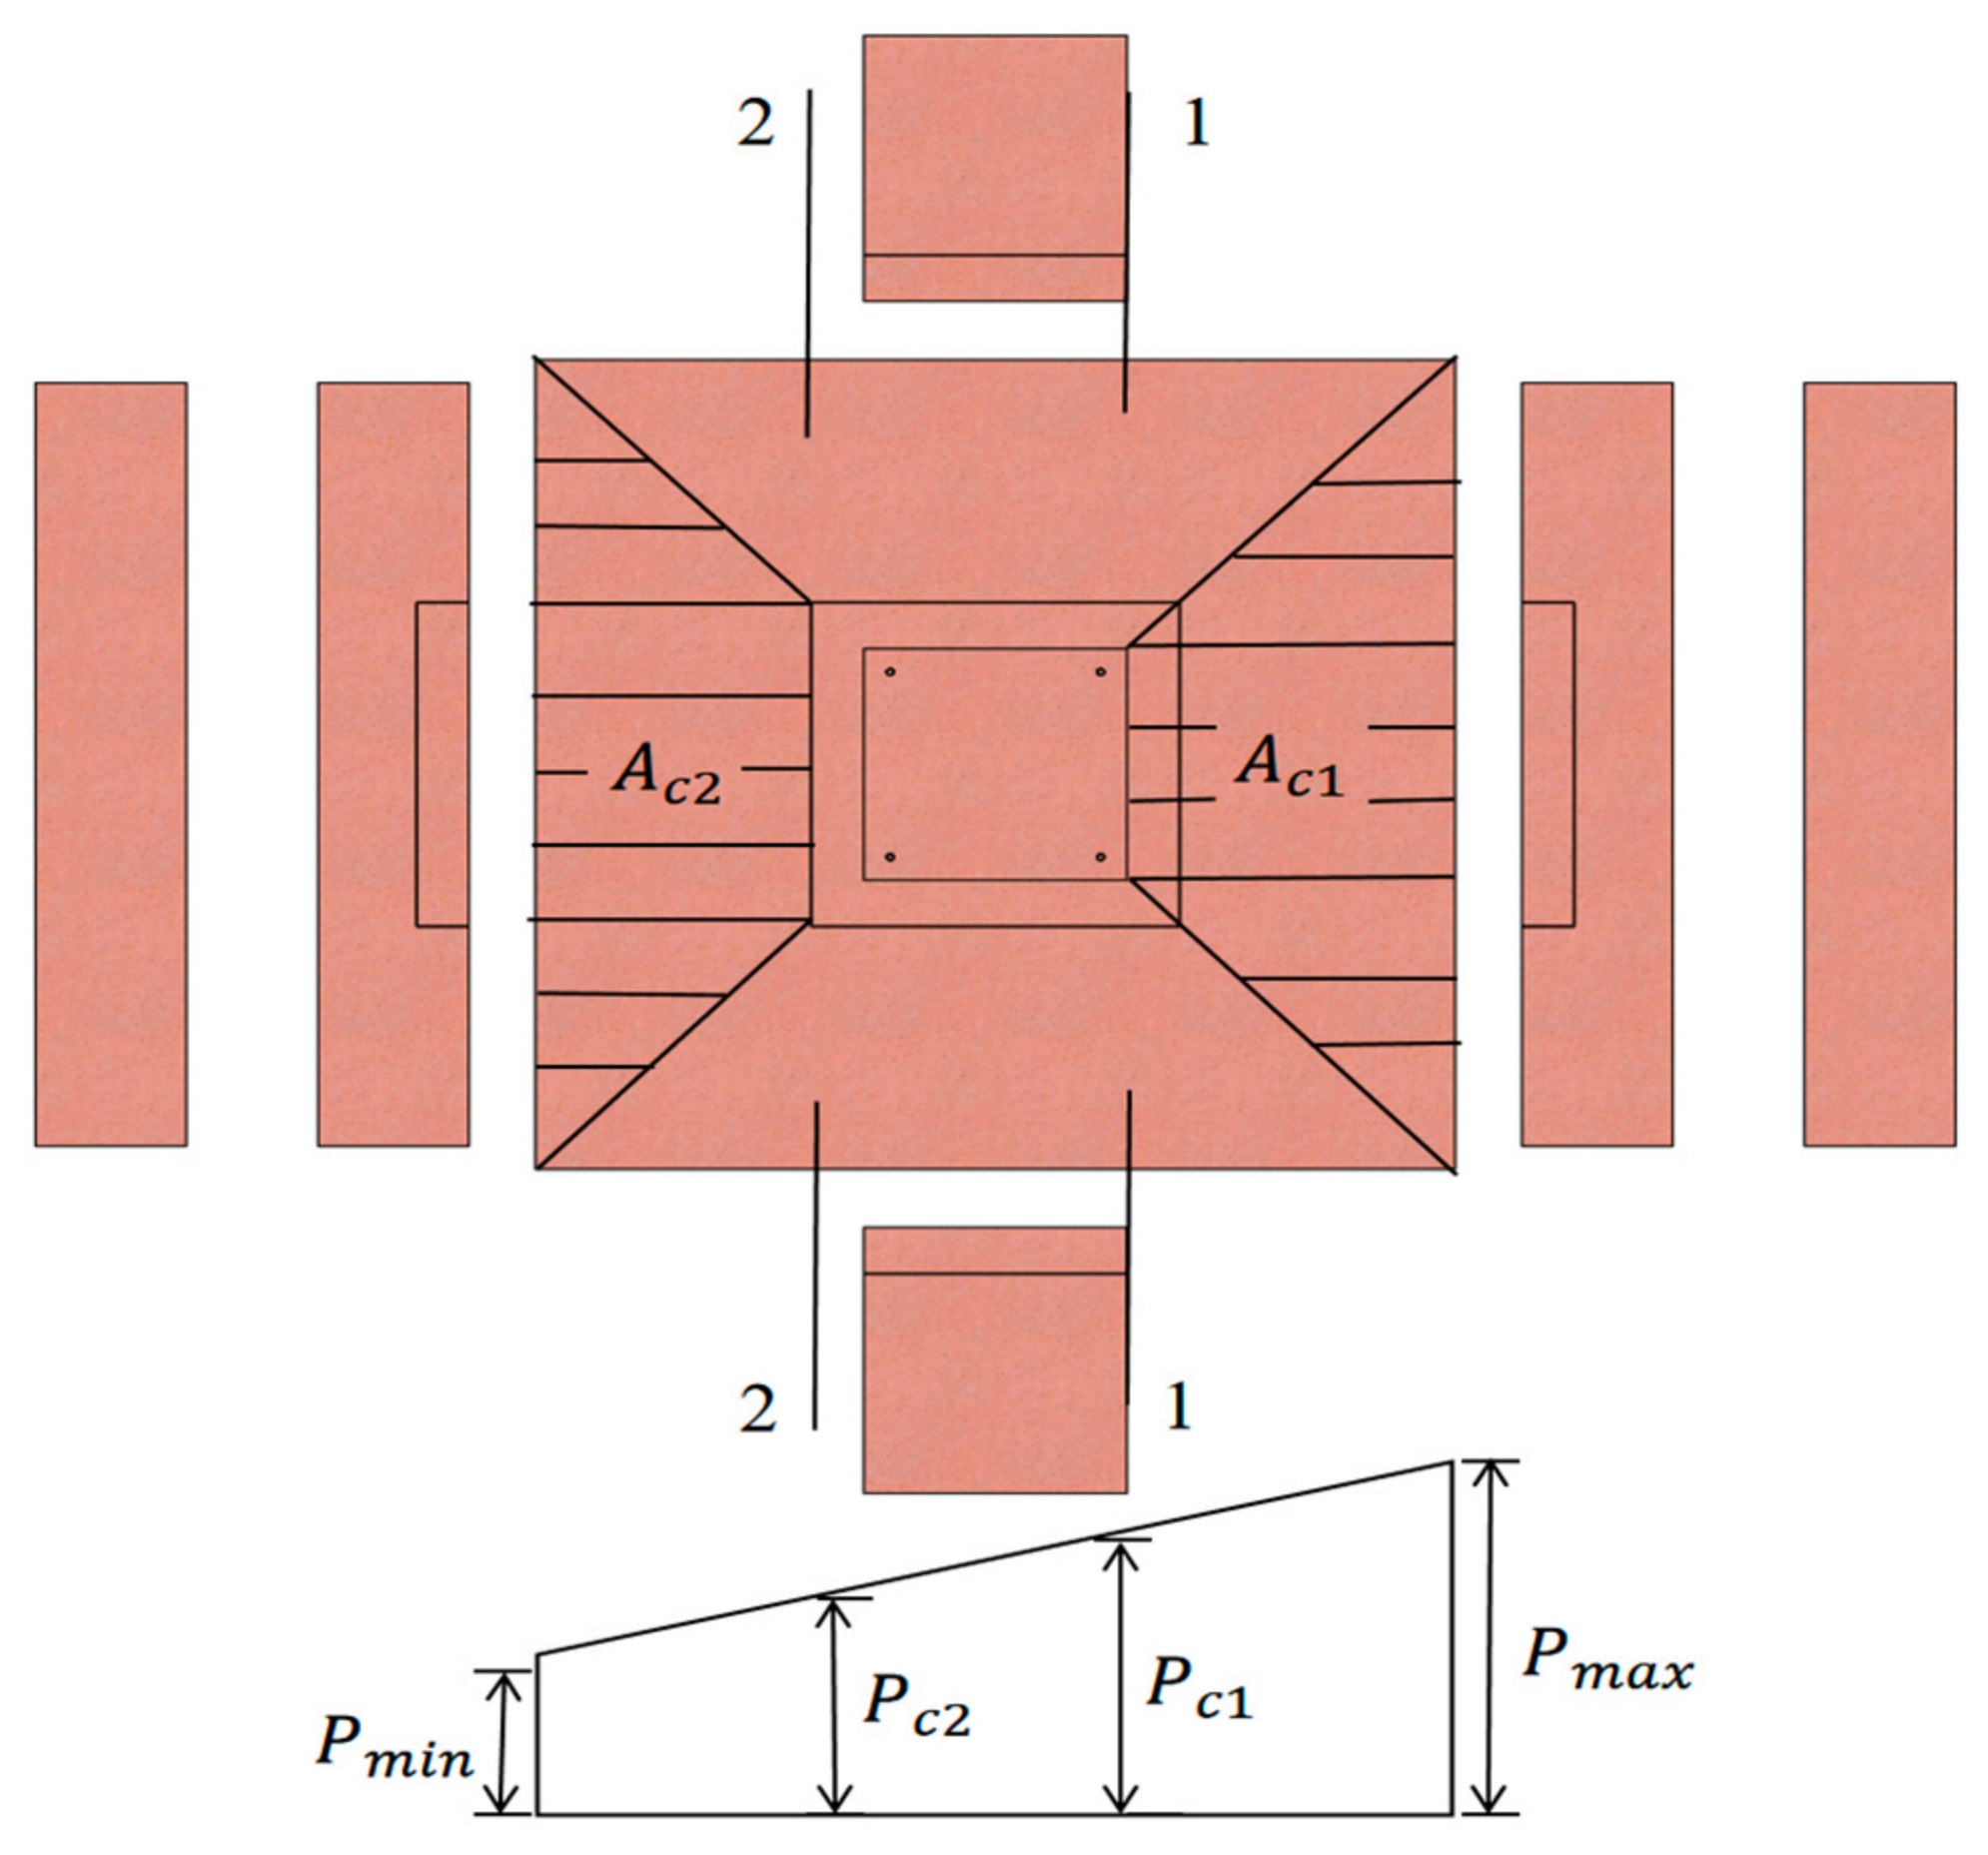
where and are the reactions at section 1-1 (the pedestal joint) and section 2-2 (the slab joint), respectively; and are the footing-slab plan dimensions; and and are the pedestal plan dimensions. Pc2max is introduced for the joint-shear calculation in Equation (4); it is not a term in Equation (2).
The design shear forces at the slab joints are calculated as follows:
where V1max and V2max are the maximum design shear forces at joints 1 and 2, respectively, and Ac1 and Ac2 are the corresponding shaded interface areas shown in Figure 3.
Figure 3.
Joint sections used in the force analysis of the PPCIF. Sections 1–1 and 2–2 denote the pedestal joint and footing-slab joint, respectively.
The calculated foundation forces are summarized in Table 3.
Table 3.
Calculated bearing pressure, bending moment, and joint shear forces for load sets 1 (first data row) and 2 (second data row).
2.3. Design Parameters
The reinforcement layout was adapted from established design practice for cast-in-place isolated footings. The interface shear forces calculated in Section 2.2 were then used to determine the number, diameter, arrangement, and prestress level of the threaded bars. These bars were designed to resist interface shear and maintain contact between adjacent components under the prescribed design actions.
2.3.1. Foundation Dimensions and Reinforcement
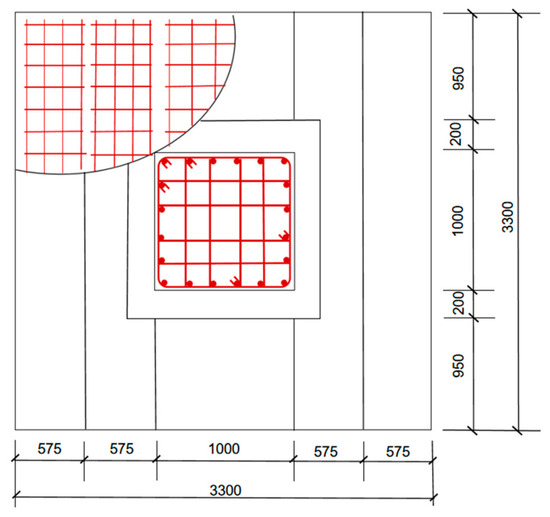
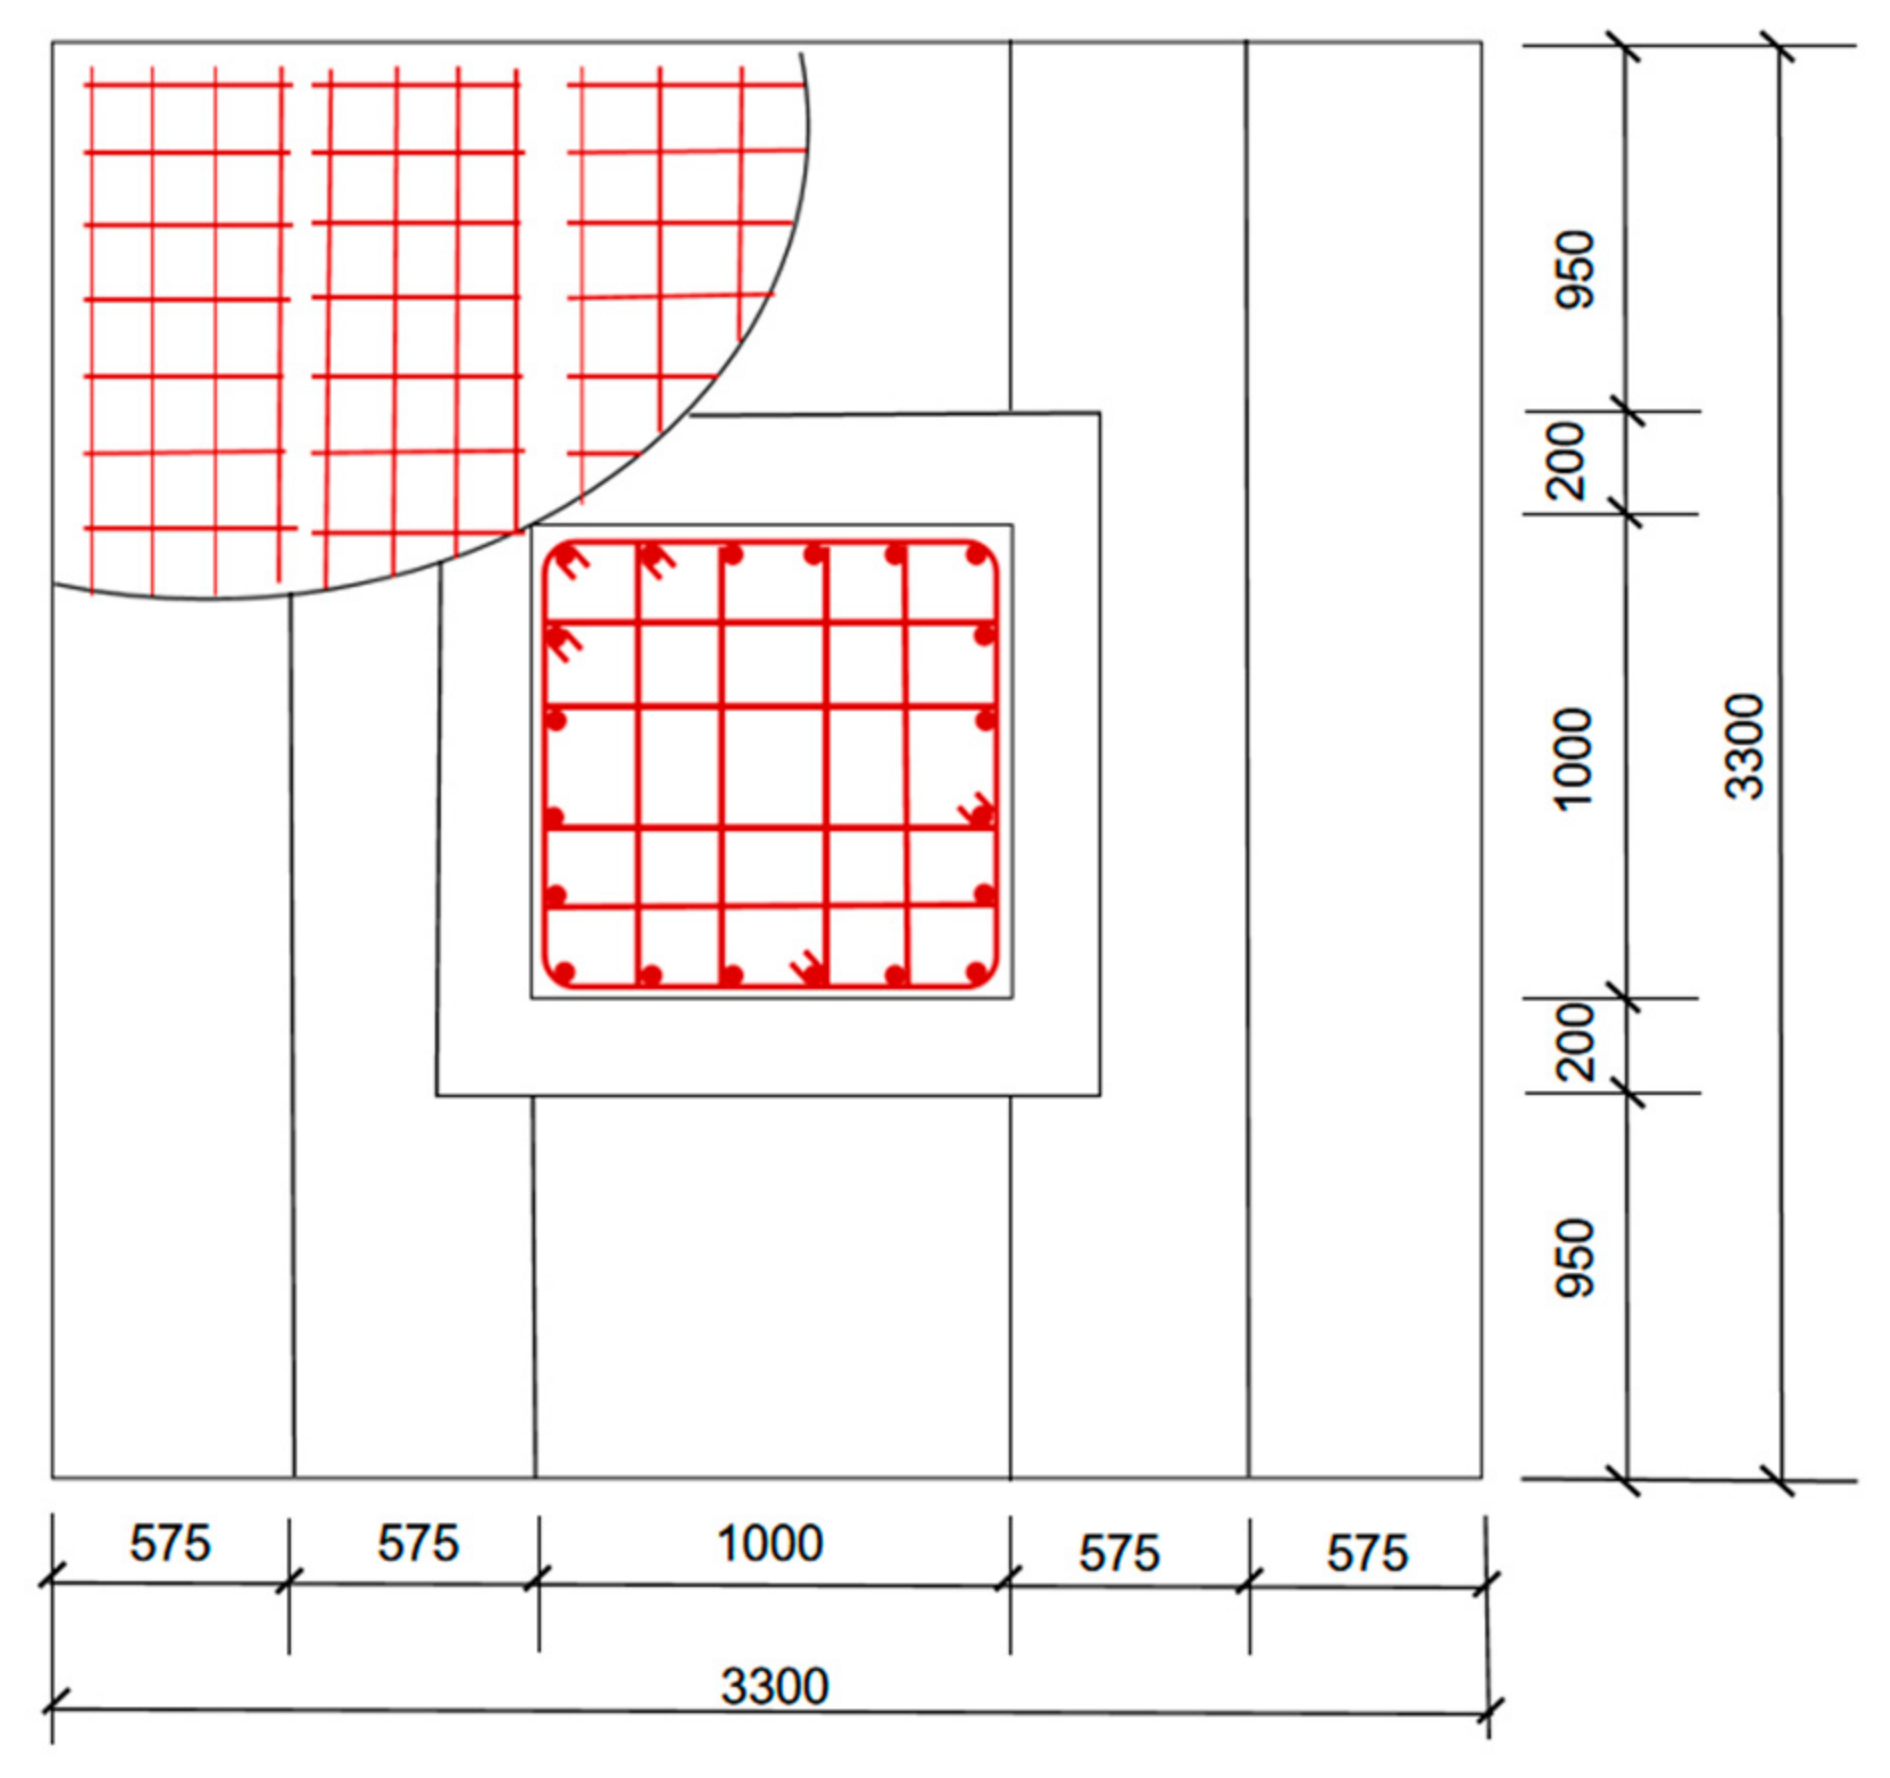
The reinforcement layout of the PPCIF (Figure 4) follows that of the cast-in-place reference footing, with the same bar dimensions retained within each precast unit. The four corner bars of the pedestal are replaced by prestressing threaded bars. The footing slab is 3300 mm × 3300 mm in plan and 500 mm thick; the pedestal cross-section is 1000 mm × 1000 mm; the embedment depth is 1800 mm; and the concrete cover is 50 mm. The structural concrete is grade C30 and the blinding concrete is grade C15. HPB300 steel is used for the pedestal ties, HRB400 steel for the orthogonal slab reinforcement, and PSB930 threaded bars for prestressing.
Figure 4.
Plan reinforcement layout of the PPCIF. Dimensions are in millimeters.
The principal external dimensions of the components in Figure 1 are as follows (all in millimeters): G1, 1000 × 1000 × 1300; G2, 1400 × 1400 × 500; G3, 3300 × 575 × 500; G4, 3300 × 575 × 500; and G5, 1150 × 1000 × 500. The assembly contains one G1, one G2, and two each of G3–G5, giving eight structural precast units. These are external envelope dimensions; the stepped profiles, recesses, and ducts are retained. The 22 threaded bars have a diameter of 25 mm: 16 short horizontal bars of length 1410 mm, two long horizontal bars of length 3360 mm, and four vertical bars of length 1730 mm. The bearing plates are 145 × 145 × 20 mm, and the blinding layer is 3500 × 3500 × 100 mm.
The reinforcement layout was checked against the cited design provisions for uplift and downward loading, slab flexure and shear, pedestal bending and shear, and the additional reinforcement in the longitudinal outer slabs. These calculations define the baseline arrangement shown in Figure 4. The nonlinear analyses subsequently assess its global response and local stress, strain, and damage demands under the prescribed load cases. This layout provides a design baseline rather than an optimized reinforcement arrangement. Changes in reinforcement ratio, continuity, and local confinement may alter stiffness, crack localization, and anchorage demand; their quantitative effects were not varied in the present analyses.
The assembly sequence is organized around the lifting capacity and site access of a mobile crane. The component types are placed in the order G5, the paired G4 and G3 slab elements, G2, and finally the G1 pedestal, so that each lift remains below 3.05 t and within the five-tonne handling criterion adopted for remote sites. Lifting points are provided by embedded anchors with flexible slings, and the crane is assumed to operate from the same access track used for component delivery, thereby minimizing the need for additional temporary working areas under the assumed site conditions. The blinding layer is cast first to provide the leveling reference, and the threaded bars are tensioned in the staged sequence described in Section 2.5. These arrangements keep the erection equipment consistent with the transport constraint that motivated the modular scheme.
2.3.2. Prestressing Threaded-Bar Design
The prestressing threaded bars cross the footing-slab joints and contribute to flexural tension resistance and interface clamping. Their required number and effective cross-sectional area were determined from the joint shear demand and effective prestress. Prestress applies compression normal to the joint and mobilizes frictional shear resistance. A concrete-to-concrete interface friction coefficient of μ = 0.60 was adopted as a modeling assumption for the specified interface condition.
The pedestal-to-slab joint is subjected to interface shear and constitutes a critical design section. Equation (5) defines the required joint-normal clamping force Ncl from the design interface shear demand and friction coefficient μ. Equation (6) defines the corresponding frictional shear resistance provided by prestressing threaded bars. Here, and are the maximum bearing pressures at the footing edge and pedestal joint in the x-direction, respectively; and are the footing and pedestal plan dimensions in that direction; d is the nominal bar diameter; and is the effective prestress in each bar.
For the six-bar arrangement, an anchorage-efficiency coefficient of 0.99 was adopted.
PSB930 prestressing threaded bars are used as the prestressing reinforcement. The control stress during tensioning is limited by Equation (7), where σcon is the control stress, and fptk is the specified tensile strength of the prestressing steel:
The jacking stress was set to 0.60 fptk. Equation (8) gives the resultant jacking force F in one bar–anchorage assembly, where As is the cross-sectional area of one prestressing bar and 0.99 is the adopted anchorage-efficiency coefficient:
Because prestress is reduced by several time-dependent and anchorage-related losses, the effective prestress applied to the foundation is calculated using Equation (9). The individual loss components are listed in Table 4:
Table 4.
Components of prestress loss.
The listed components sum to a total prestress loss of 122.96 MPa.
The omission of the thermal-curing prestress loss is based on the adopted production process. The precast components are cured under ambient conditions using conventional covering and watering, with no steam curing or other externally heated curing process applied during production. Under this construction assumption, the temperature-difference loss associated with heated curing is not applicable and is therefore taken as zero in accordance with the adopted design provisions. If elevated-temperature curing is introduced in future production, this loss component should be reinstated and evaluated using the monitored curing-temperature history.
Where is the loss due to anchorage deformation and bar seating; is the friction loss; is the prestress loss caused by differential temperature effects during heat curing, which is taken as zero because the precast components in this study are cured without artificial heating; is the threaded-bar relaxation loss; is the loss due to concrete shrinkage and creep; and is the loss due to elastic shortening of concrete. For a post-tensioned member stressed in a single operation, the adopted provisions specify = 0.
Using Equations (7)–(9) and the loss components in Table 4, the anchorage-adjusted jacking stress and effective prestress are 552.42 MPa and 429.46 MPa, respectively.
For a 25 mm diameter bar, the effective clamping force is 210.81 kN, calculated as N1 = (πd2/4)σf, where N1 is the clamping force provided by one bar and d is the nominal bar diameter.
Because the shear forces at joints 1 and 2 are similar, the larger magnitude is used as the design interface shear demand Vd. Equation (5) gives a required total joint-normal clamping force of 716.33 kN, which gives a calculated minimum of four prestressing threaded bars (716.33/210.81 = 3.40, rounded up). Six bars are adopted to provide a symmetric arrangement and additional redundancy.
2.4. Finite Element Model
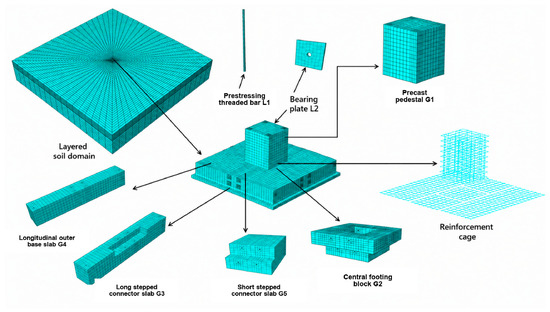
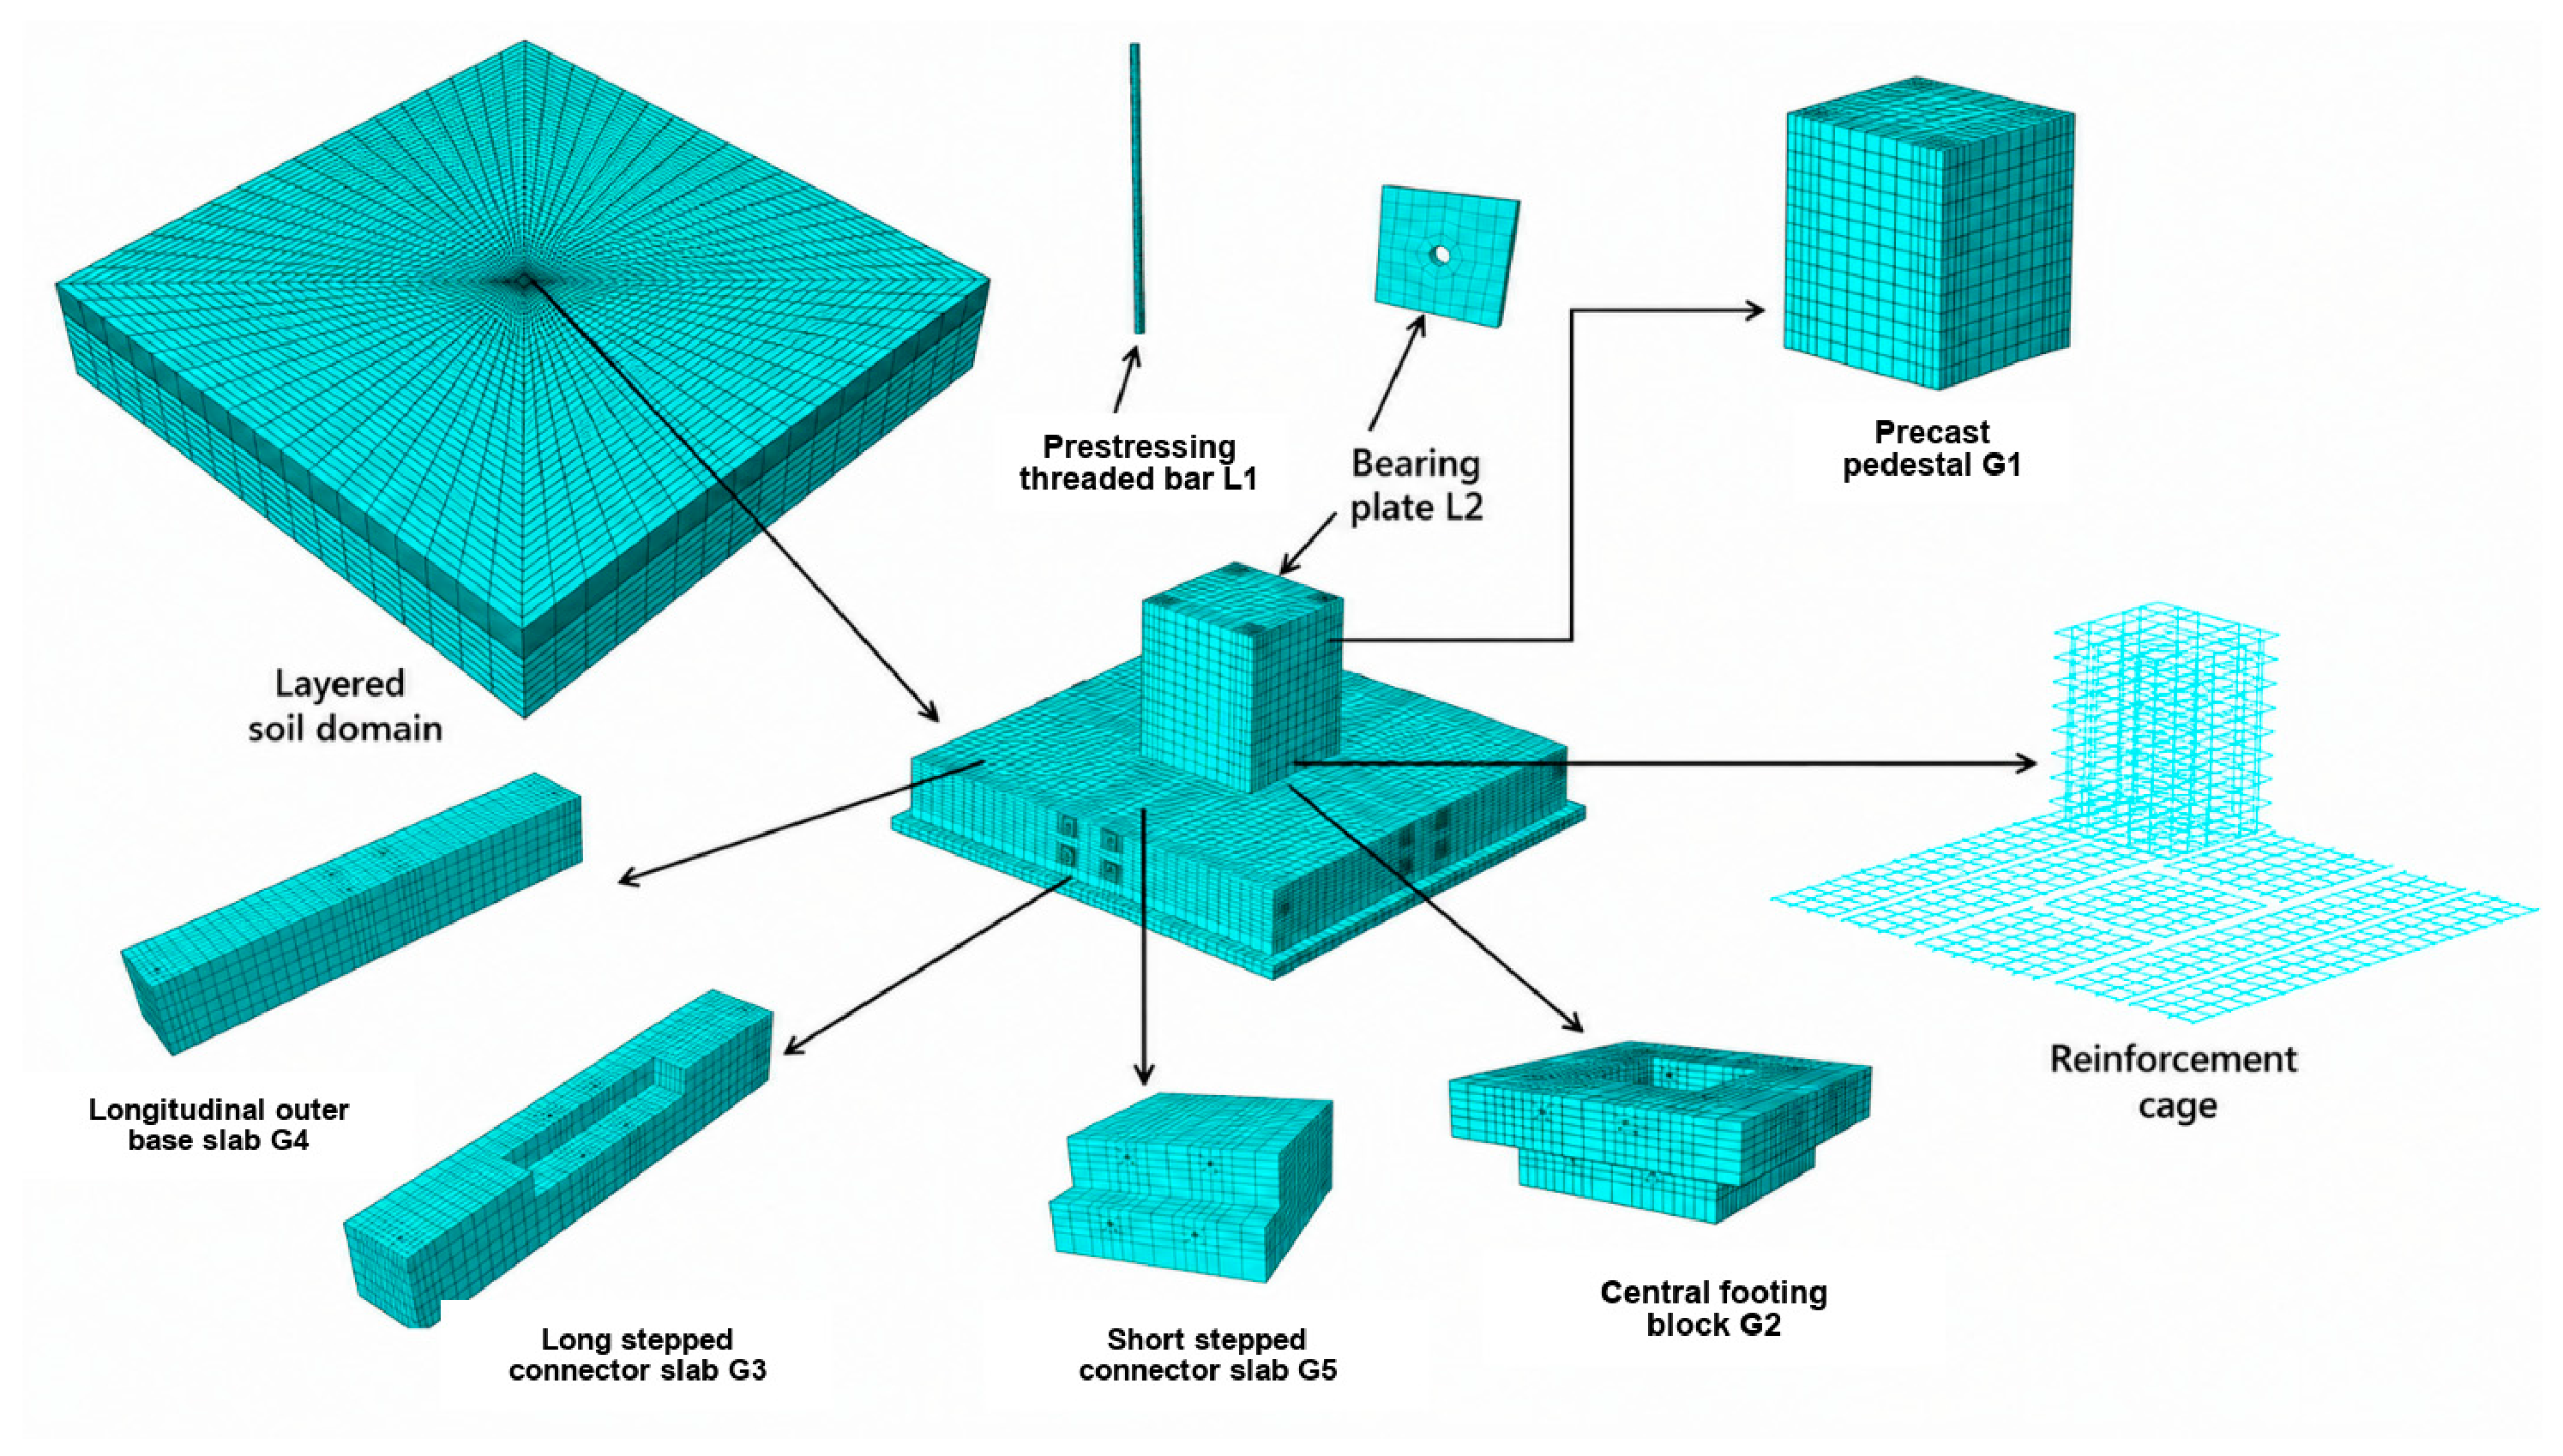
A three-dimensional finite-element model was developed in Abaqus 2025 to evaluate the PPCIF under the prescribed ground and loading conditions. The model included the layered soil domain, precast concrete components, prestressing threaded bars, bearing plates, and embedded reinforcement cages (Figure 5). Material behavior, contact interactions, boundary conditions, staged construction, and mesh density were defined as described below.
Figure 5.
Three-dimensional foundation–soil finite-element model.
2.4.1. Materials and Constitutive Models
Material Properties
The isolated foundation uses C30 concrete and a C15 plain-concrete blinding layer. The concrete and steel properties are listed in Table 5.
Table 5.
Material properties of concrete and steel.
The elastic modulus and Poisson ratio specify the initial stiffness response, while density defines self-weight in the staged analysis. C30 and C15 identify the structural and blinding concrete, respectively; the constitutive stress values used in the finite-element model are distinguished from nominal concrete grade designations. The steel modulus represents the elastic stiffness before the adopted plastic response.
Four representative ground-profile parameter sets were considered (Table 6): loess-like silt (LSS), a collapsible-loess profile (CLS), a sandy-soil profile (SWS), and a rock profile (RS).
Table 6.
Soil stratigraphy and constitutive parameters.
The labels identify the adopted stratigraphies and parameters. The analyses did not simulate wetting-induced collapse, pore-pressure evolution, seepage, or consolidation.
The ground profiles in Table 6 are treated as complete engineering parameter sets. The elastic modulus and Poisson ratio govern the initial deformation response; cohesion and friction angle define the Mohr–Coulomb shear-strength envelope, and dilation angle controls plastic volumetric expansion. Density governs the initial overburden stress. Comparisons between profiles therefore reflect changes in both stratigraphy and material properties, rather than the isolated effect of a single parameter.
Constitutive Models and Strength Criteria
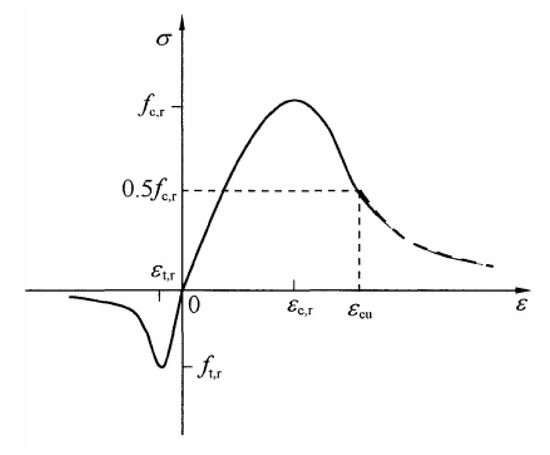
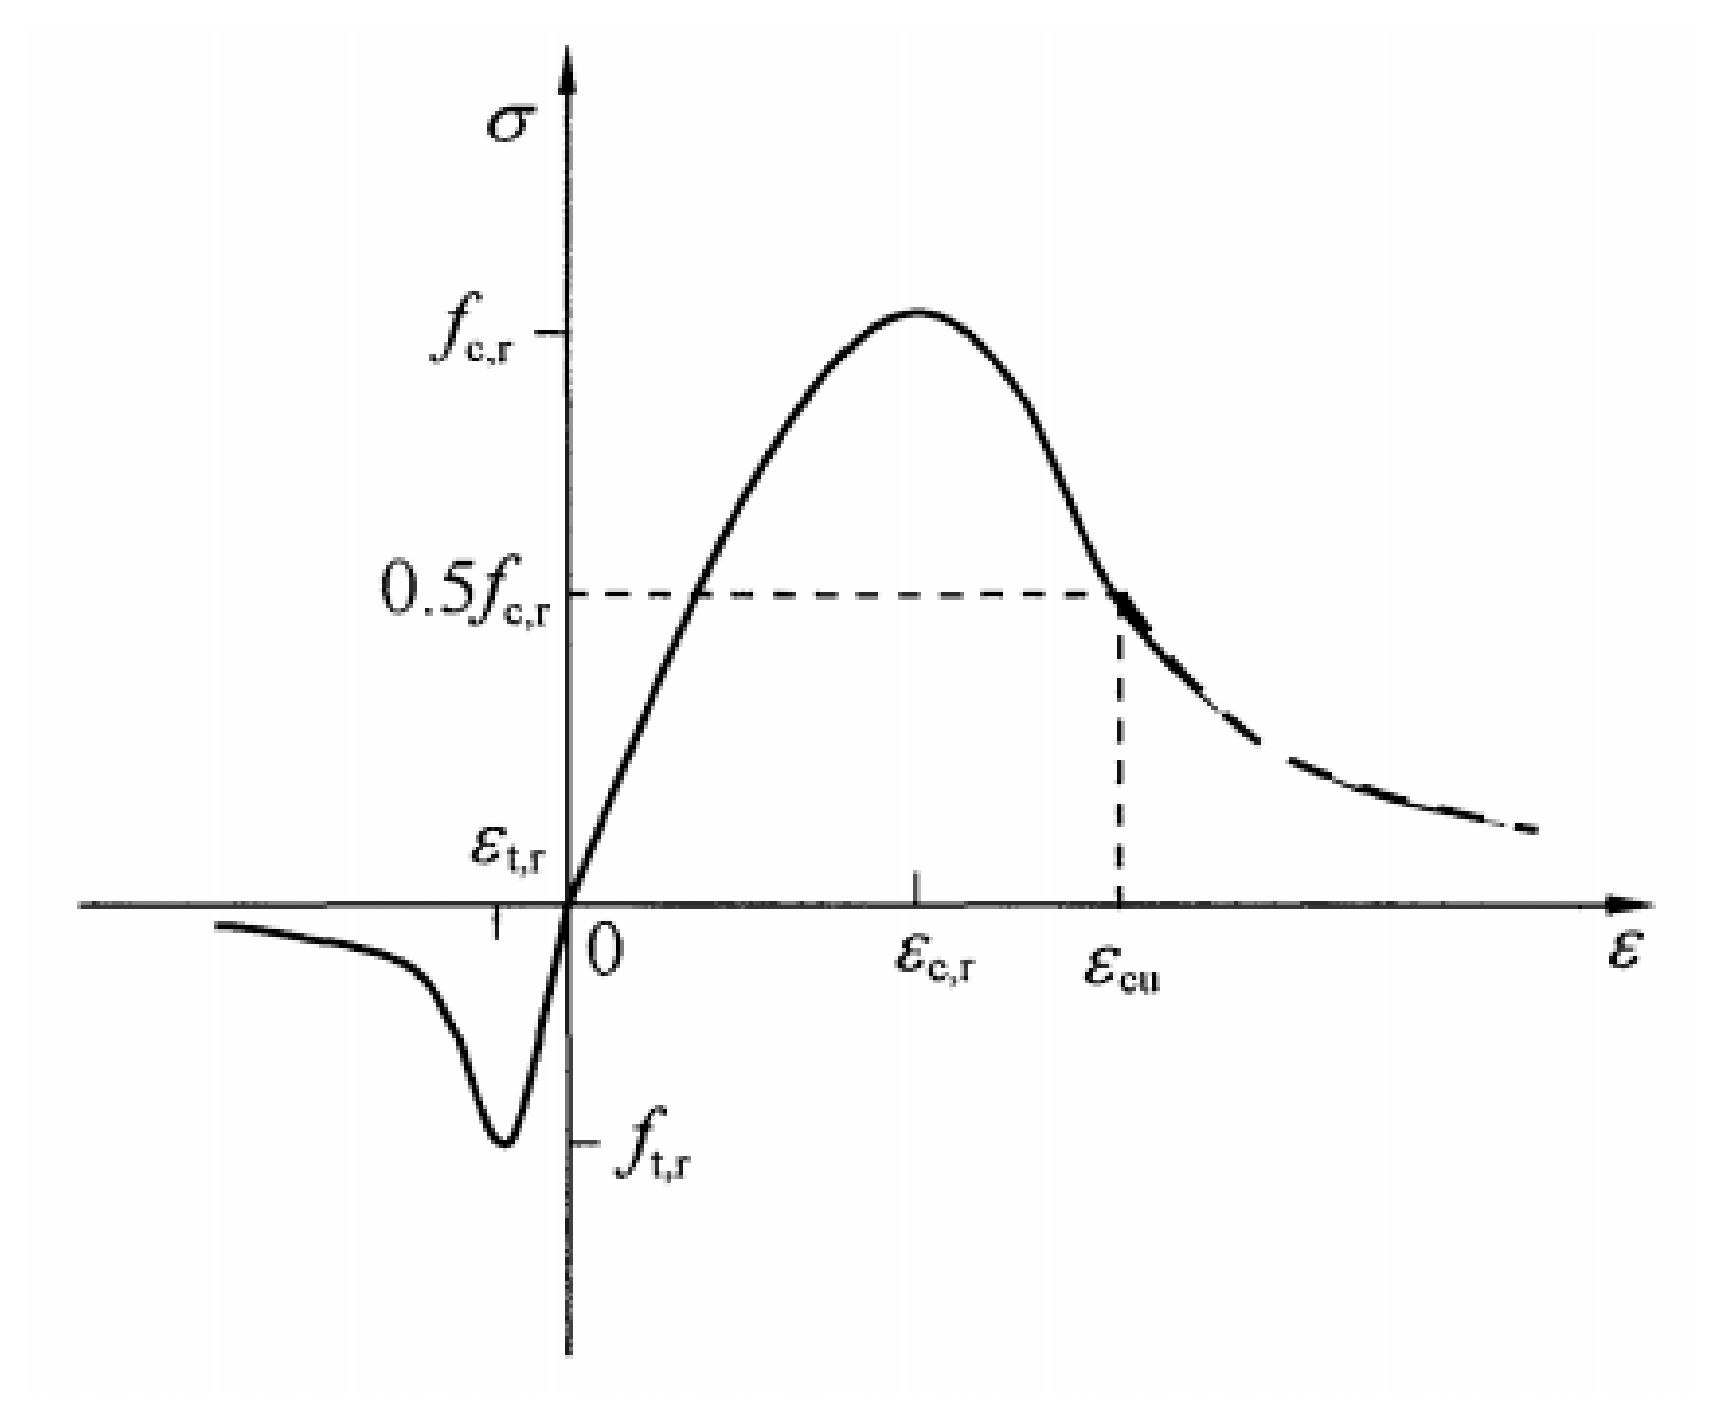
The uniaxial compressive and tensile stress–strain relations for C30 concrete were defined using Appendix C.2 of the Chinese Code for Design of Concrete Structures [24], as illustrated in Figure 6. The reference-model material inputs specify a CDP dilation angle of 35°, eccentricity of 0.1, initial biaxial-to-uniaxial compressive yield–stress ratio of 1.16, deviatoric-section parameter Kc of 0.667, and viscosity parameter of 0.0008. For C30, the elastic modulus is 30,000 MPa and the peak stresses in the compression and tension input tables are 22.8 MPa and 2.24 MPa, respectively. These values define the adopted constitutive inputs.
Figure 6.
Uniaxial stress–strain relations adopted for concrete. For C30, E0 = 30,000 MPa; the constitutive input tables have compressive and tensile peak stresses of 22.8 MPa and 2.24 MPa, respectively.
The CDP dilation angle controls plastic volumetric expansion, while eccentricity controls the shape of the plastic potential. The biaxial-to-uniaxial stress ratio and Kc define the yield-surface shape. The viscosity parameter provides numerical regularization of the constitutive response; it is not interpreted as a measured physical creep property. The listed values specify the adopted reference-model representation, whereas the uniaxial stress–strain relations define the compression and tension response.
Concrete was represented by the concrete damaged plasticity (CDP) model. Published CDP studies indicate that mesh density and the calibration of softening and damage parameters affect the predicted nonlinear response [21,22,23]. The inelastic strains and damage variables were calculated as follows:
where is the concrete compressive inelastic strain; is the concrete tensile inelastic strain; is the peak tensile strain corresponding to the representative uniaxial tensile strength; is the damage variable in the Sidoroff damage formulation.
In Equations (10) and (11), and are the compressive and tensile stress magnitudes, respectively, and E0 is the undamaged elastic modulus. In Equation (12), d denotes the damage variable for the relevant loading mode: dt in tension or dc in compression; σ and ε are the corresponding uniaxial stress and total strain.
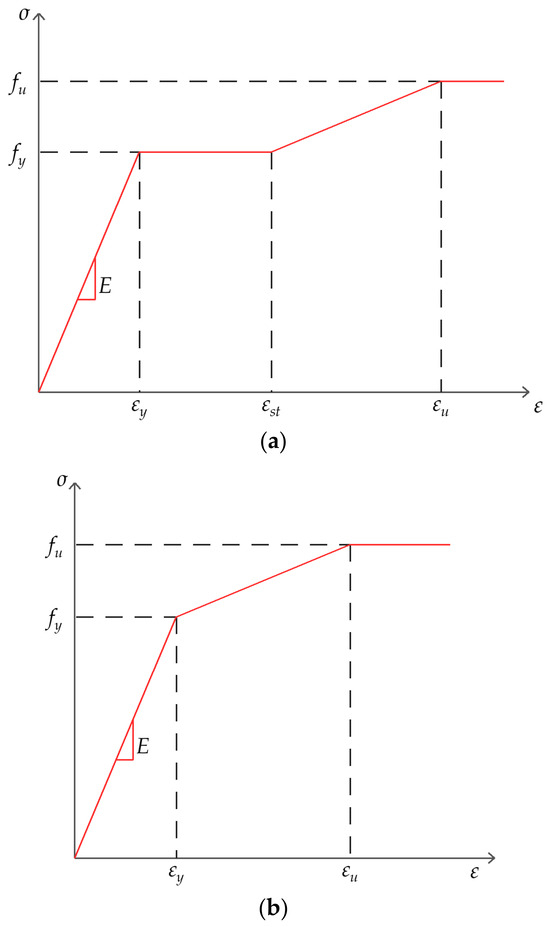
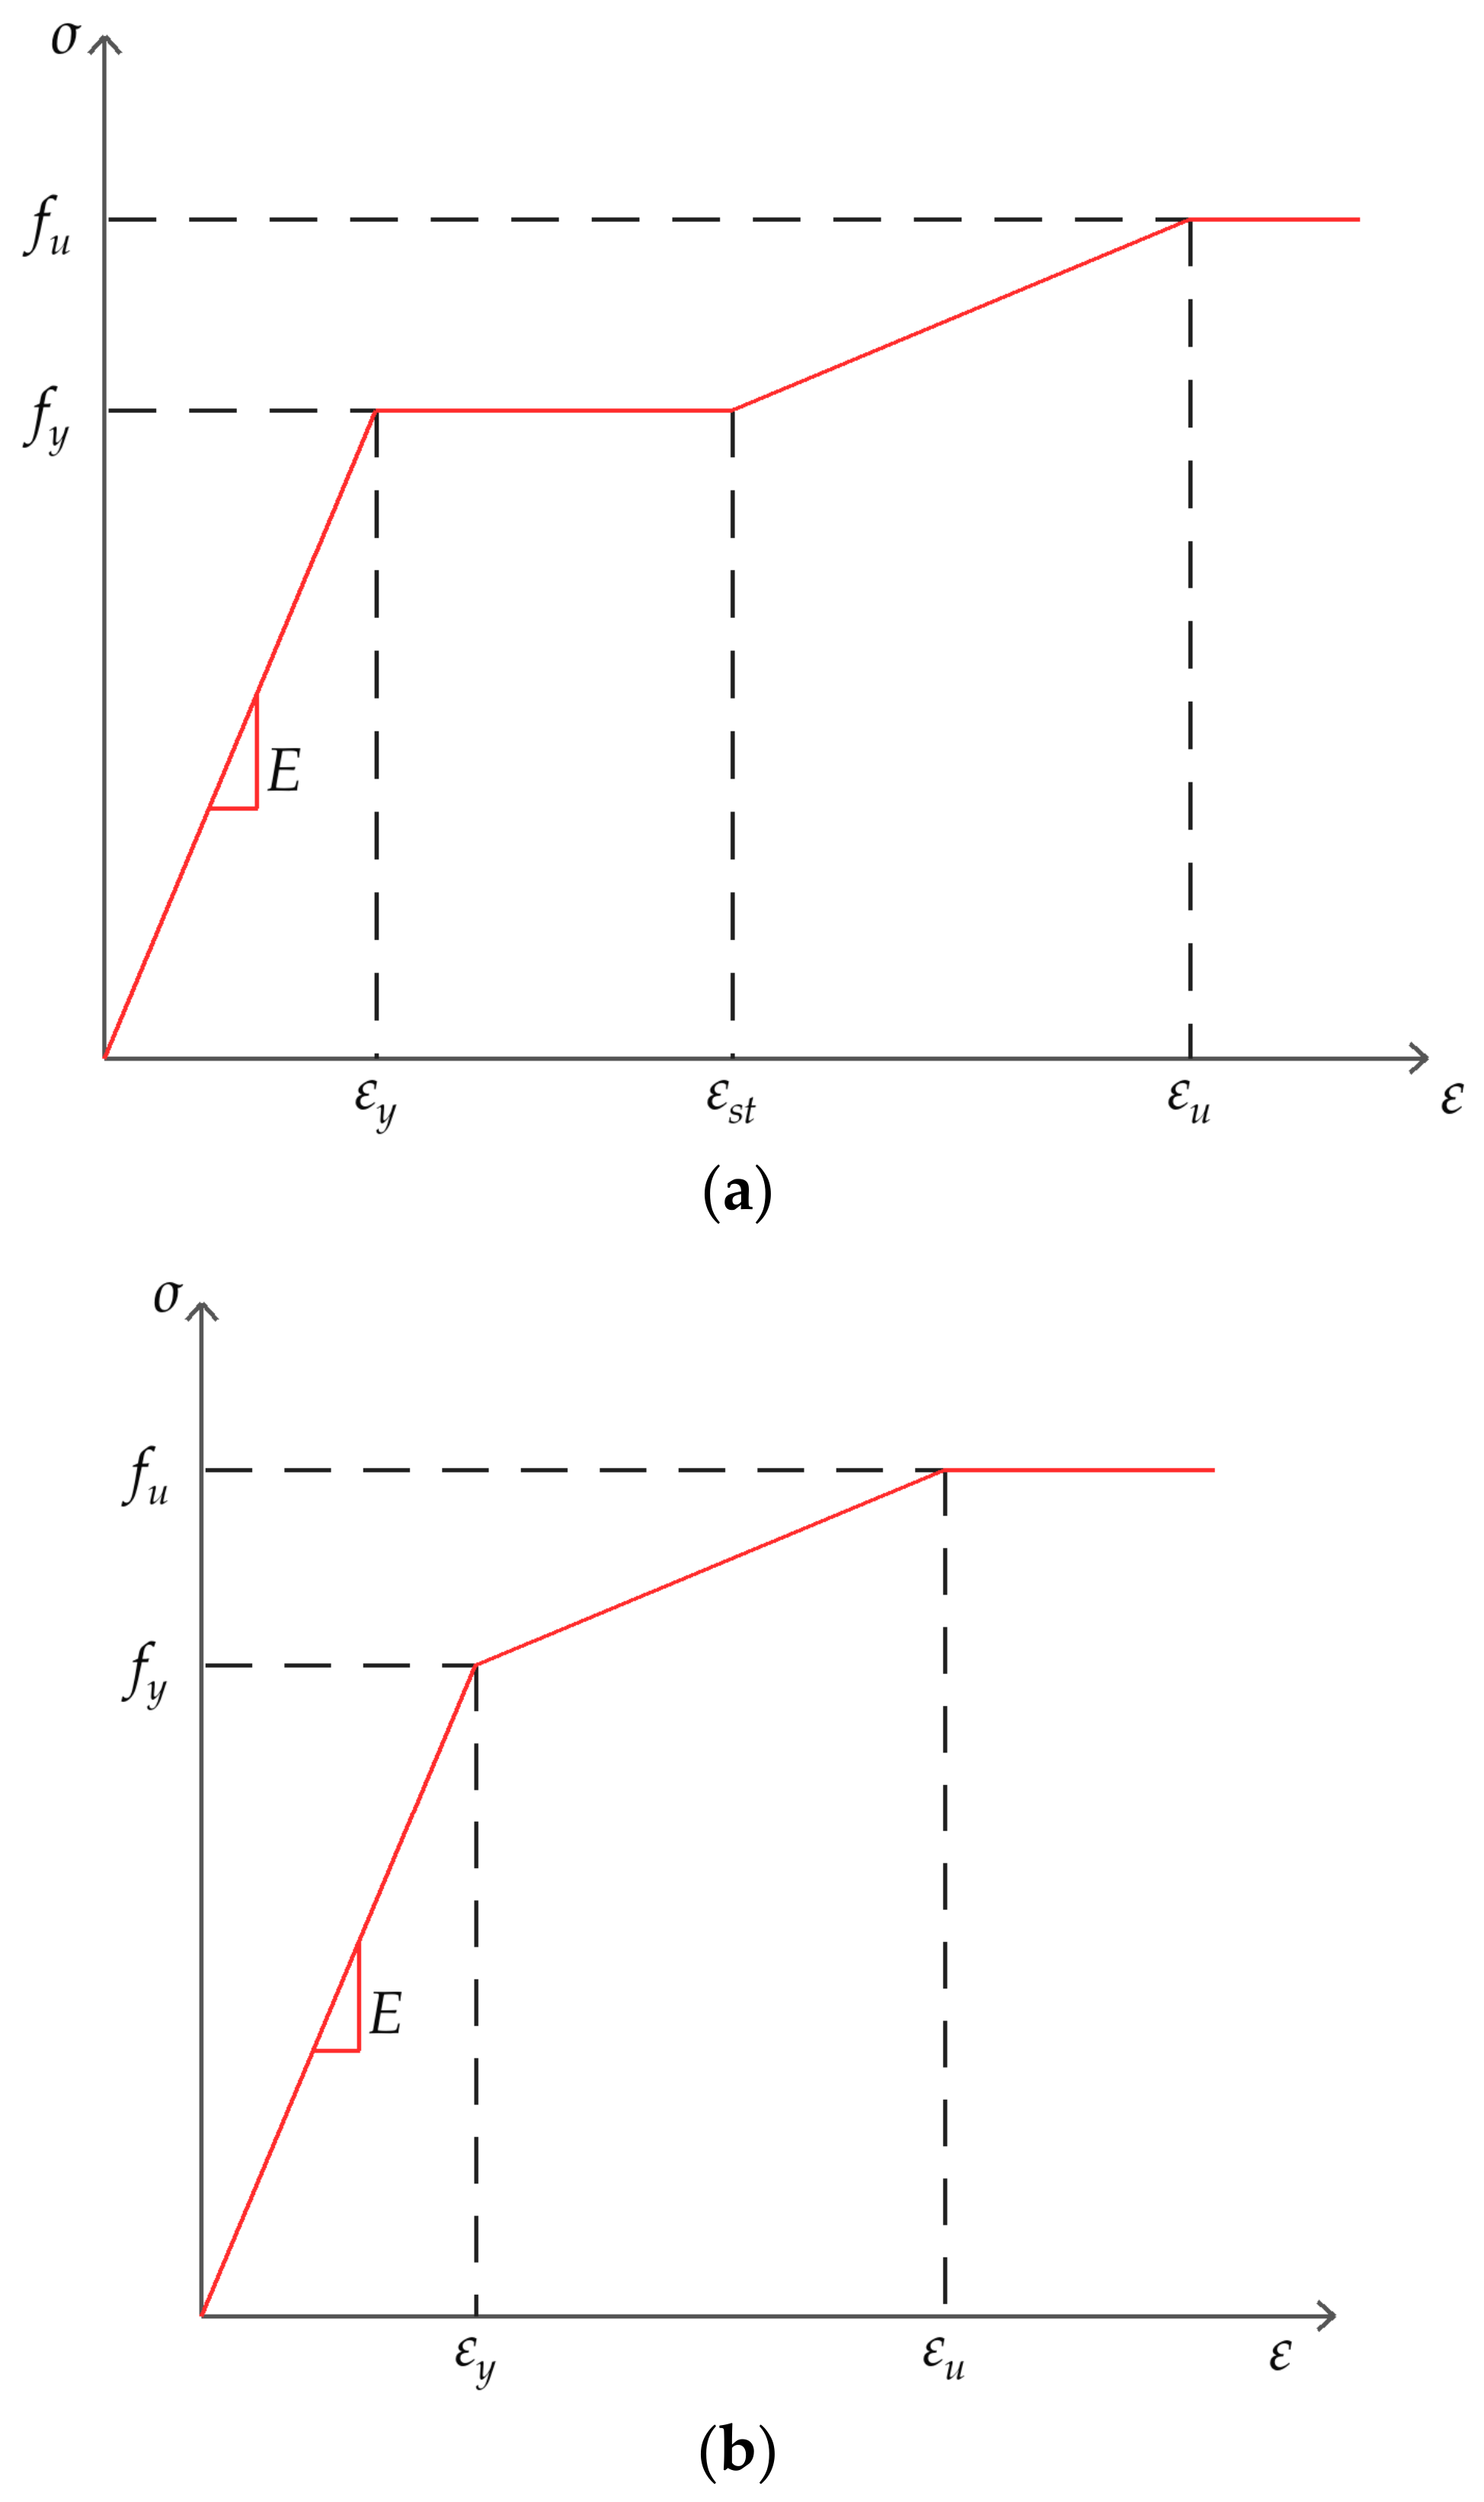
Figure 7 illustrates schematic steel constitutive idealizations. For the analyses, the assigned steel materials use E = 205,000 MPa and ν = 0.30, with elastic–perfectly plastic input stresses of 400 MPa for ordinary reinforcement, 1200 MPa for threaded bars, and 345 MPa for bearing plates. These material inputs remain unchanged across the three J1 discretizations and are distinguished from the nominal design grades.
Figure 7.
Schematic steel constitutive idealizations: (a) a model with a yield plateau; (b) a multilinear model without a plateau. Related steel constitutive modeling is discussed in [26]. The actual steel input parameters used in the supplementary J1 calculations are specified in Section Constitutive Models and Strength Criteria; the schematic is not a substitute for those material tables.
The soil parameters are given in Table 6. Soil strength was modeled using the Mohr–Coulomb criterion. This model neglects the intermediate principal stress but can represent monotonic response for the adopted frictional and cohesive parameter sets. The soil was therefore represented by linear elasticity combined with Mohr–Coulomb plasticity in Abaqus. Failure initiates when the shear stress reaches the strength defined by Equation (13). This formulation does not reproduce wetting-induced collapse or hydro-mechanical coupling.
where τ is the shear strength; c is the cohesion; σ is the normal stress; and φ is the internal friction angle.
2.4.2. Mesh Design
The prestressing threaded bars L1, bearing plates L2, and concrete components G1–G5 were discretized using eight-node reduced-integration linear hexahedral elements (C3D8R), with nominal mesh sizes of 40, 20, and 100 mm, respectively. The reinforcement cages were represented by two-node three-dimensional truss elements (T3D2) with a nominal mesh size of 150 mm. In this model, the soil mesh was graded from the foundation toward the external boundaries. A supplementary soil-mesh sensitivity assessment was conducted for J1 in the LSS profile, using a 30 m × 30 m × 6 m domain and three main-soil meshes containing 42,755, 79,144, and 103,501 elements. The structural discretization and assigned material inputs were retained. The applied load and loading-point settlement histories were compared throughout the loading step; the mesh inventory and response curves are provided in Appendix B.
The reduced-integration C3D8R formulation was adopted to alleviate shear-locking effects, together with enhanced hourglass control to suppress spurious zero-energy deformation modes. Across all sixteen analyses, the maximum ratio of artificial strain energy (ALLAE) to total internal energy (ALLIE) was 4.2%, indicating that hourglass deformation was adequately controlled at the global level. Accordingly, the localized stress gradients observed around the bar ducts are interpreted primarily as responses to local geometric discontinuities and load transfer, rather than as being dominated by hourglass modes.
2.4.3. Contact Interactions and Boundary Conditions
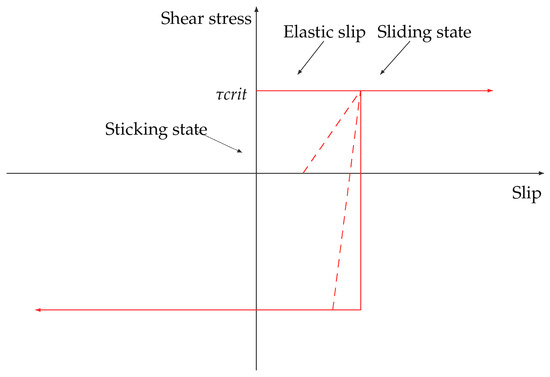
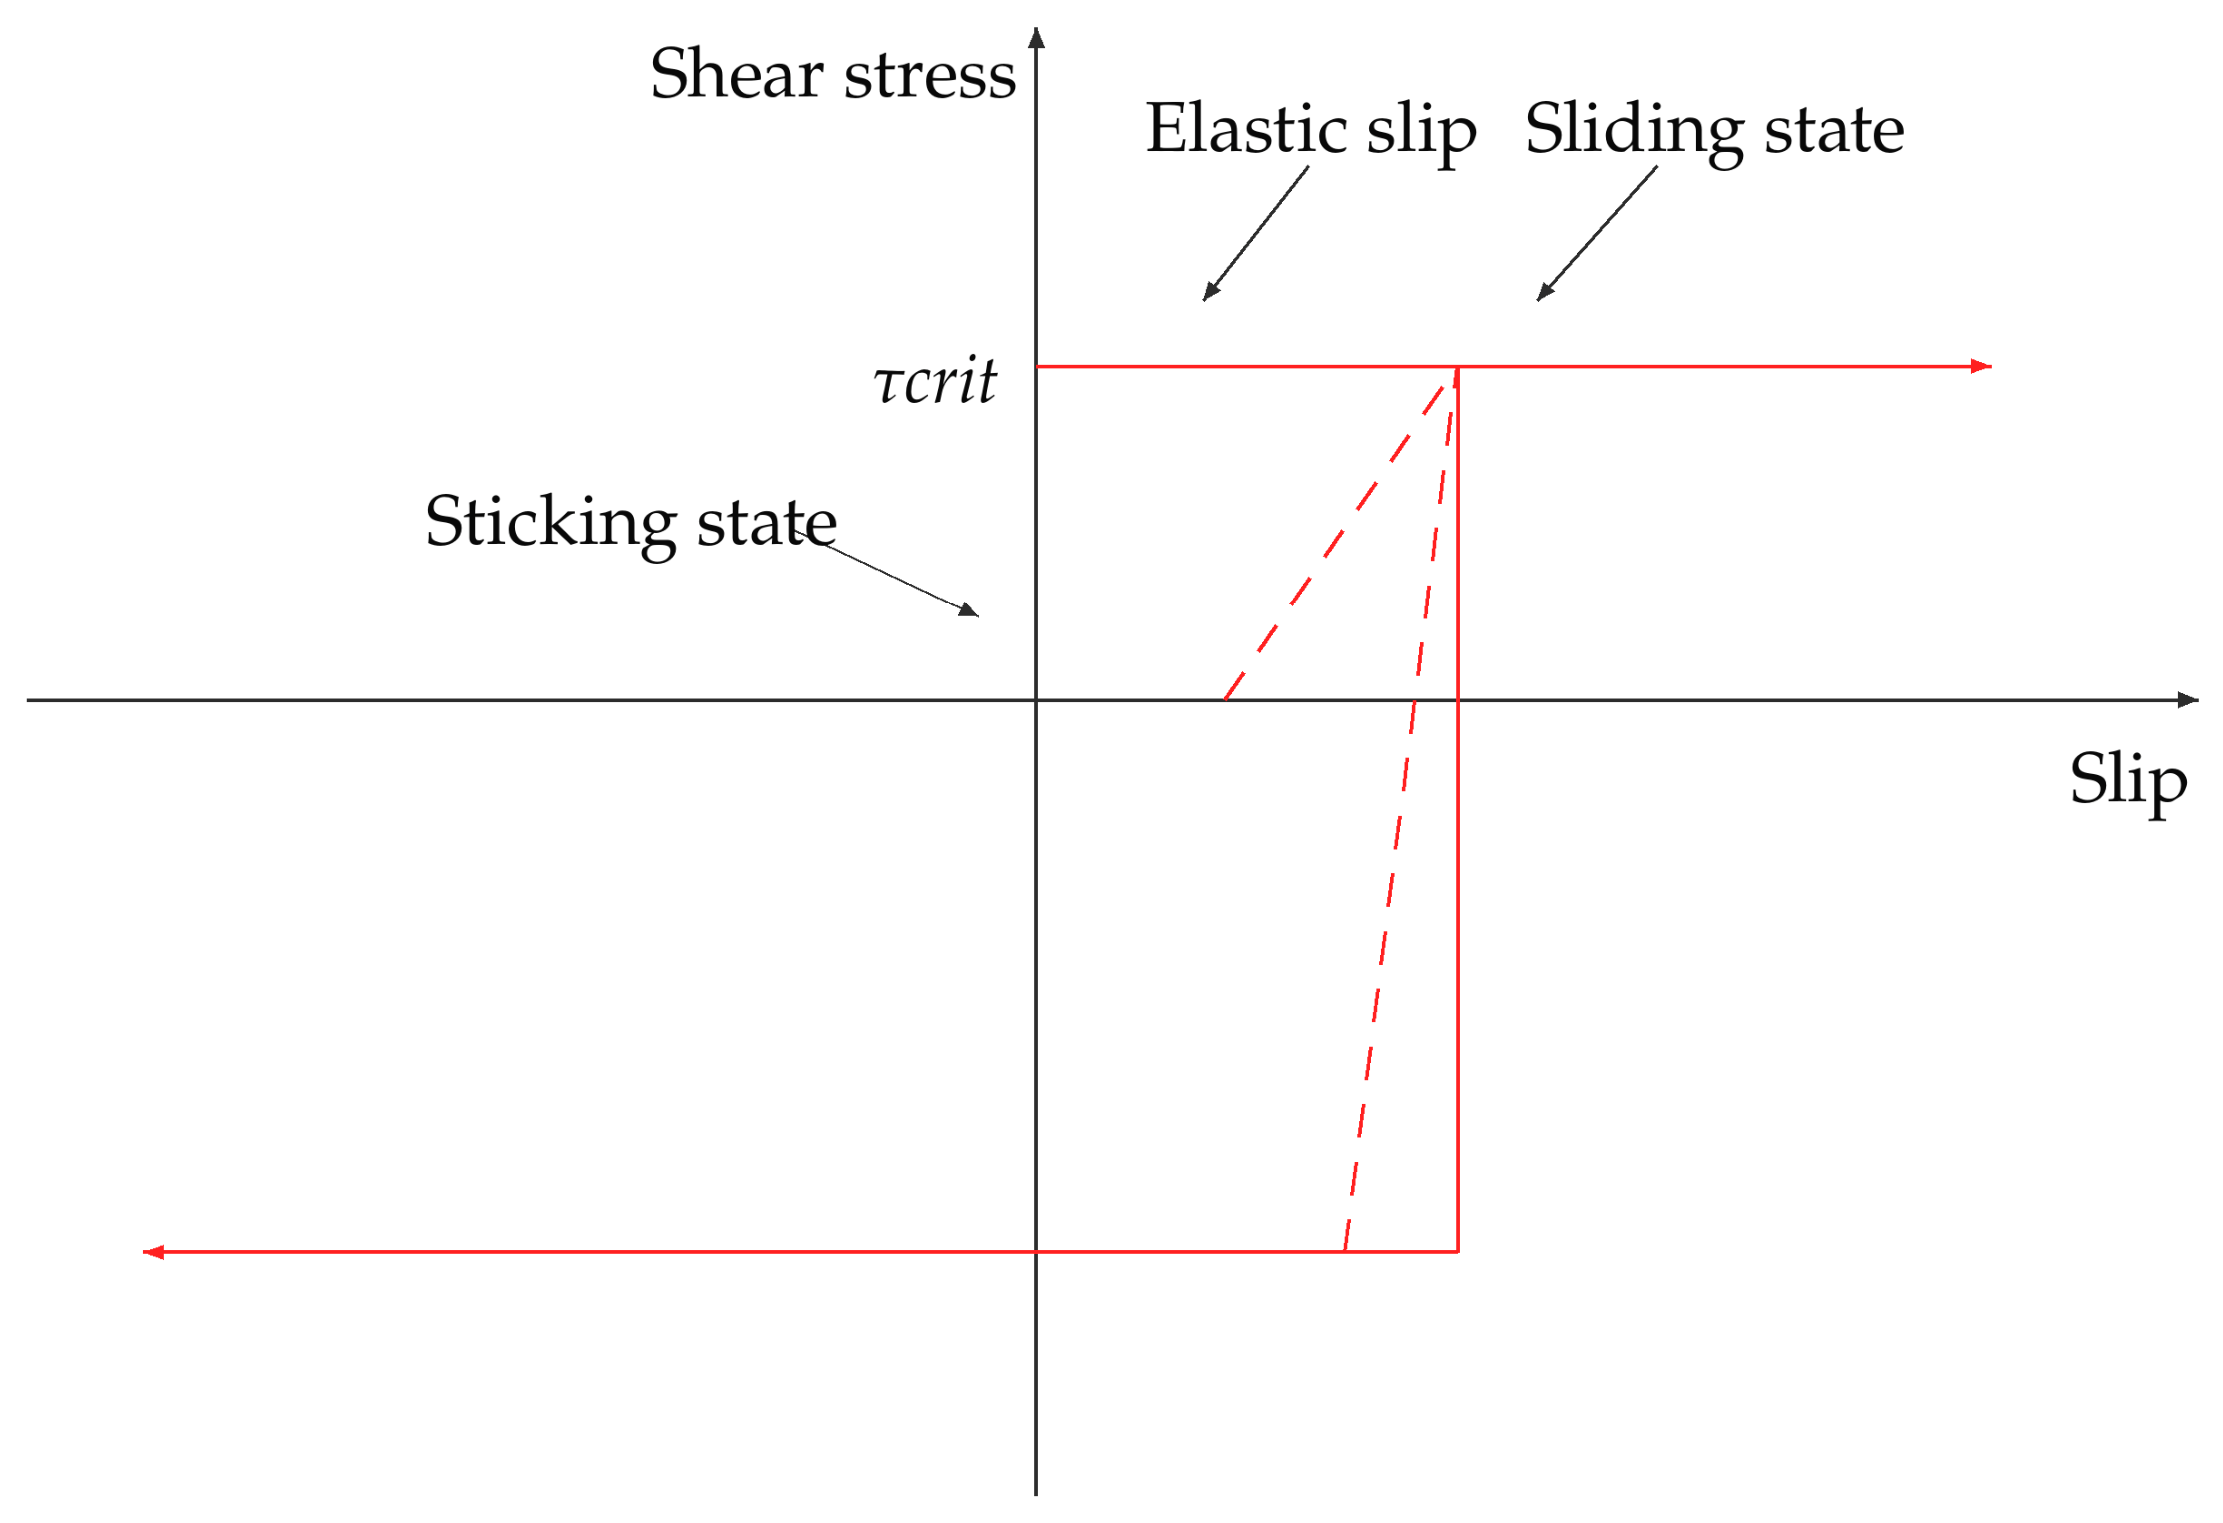
Because the foundation was directly embedded in the soil, contact pairs were defined at the upper and lower footing surfaces, slab edges, and pedestal surfaces. Owing to the greater stiffness of concrete, the foundation surfaces were designated as main surfaces and the corresponding soil surfaces as secondary surfaces. Surface-to-surface discretization with finite sliding was adopted. Hard contact defined the normal behavior, and a penalty formulation defined tangential friction, as illustrated in Figure 8.
Figure 8.
Tangential contact behavior used in the finite element model.
Embedded constraints bonded the reinforcement to concrete, and reinforcement–concrete slip was neglected. Tie constraints connected each prestressing threaded bar to its bearing plate and each plate to the concrete. Contact pairs were defined between the threaded bars and duct walls, the footing slab and pedestal, adjacent concrete components, and the foundation and soil. Friction coefficients of 0.60, 0.40, and 0.30 were assigned to the concrete–concrete, concrete–steel, and foundation–soil interfaces, respectively, as prescribed interface assumptions. The contact response is evaluated for these prescribed interface parameters. The embedded formulation does not require a separate contact calculation between the ordinary reinforcement cages and their host concrete. Explicit truss bars retain the reinforcement layout and permit individual bar stresses to be examined; a smeared-reinforcement idealization could reduce computational cost but would not provide the same direct bar-level information.
The friction coefficients distinguish the assumed concrete–concrete, bar–duct, and soil–foundation interfaces. In the Coulomb formulation, the limiting tangential traction is proportional to the contact pressure through the assigned coefficient. The values 0.60, 0.40, and 0.30 therefore define three interface idealizations, rather than a single material constant. The soil–concrete studies [27,28] provide context for that interface; they do not establish the adopted concrete–concrete or bar–duct coefficients.
The concrete-to-concrete friction coefficient of 0.60 follows the design provisions cited in Section 2.3.2 for construction-joint interfaces and is consistent with published dry-joint shear tests on precast connections, including the keyed and bond-tooth joints reviewed in Section 1.1 [5,6], where comparable frictional resistance is mobilized. Project-specific shear verification of this value under combined shear and moment actions is discussed as follow-up work in Section 3.7.3.
The soil-domain side boundaries restrained normal displacement, while all translational degrees of freedom at the base were fixed. These restraints define the external boundaries of the modeled soil region. The side restraints are U1 = 0 on x-normal boundaries and U2 = 0 on y-normal boundaries. External actions are applied at a reference point kinematically coupled to the pedestal top. The continuum equilibrium and idealized contact conditions are summarized in Appendix A.
2.5. Staged Construction and Prestress Application
Element activation and deactivation were used to reproduce geostatic equilibrium, excavation, and foundation installation. Prestress was introduced through an equivalent temperature decrease in the prestressing threaded bars. These procedures represented the construction sequence and subsequent structural response within a single analysis framework.
2.5.1. Element Activation and Deactivation
A geostatic step first established equilibrium in the soil and minimized deformation caused by self-weight initialization. The soil occupying the foundation volume was then deactivated, and the foundation components were activated. After the prestressing threaded bars were tensioned to assemble the components, the complete foundation was subjected to static loading.
2.5.2. Thermal Prestress Method
The target effective prestress determined in Section 2.3 is 429.46 MPa. Prestress was applied by imposing an equivalent temperature decrease. The coefficient of thermal expansion of steel, α, was taken as 1.2 × 10⁻⁵/°C in accordance with GB 50009-2012 [29]. Here, σ is the induced prestress, ΔT is the imposed temperature change, and E is the elastic modulus of steel.
The temperature change is an equivalent strain input used to impose prestress, rather than an environmental temperature action. The effective prestress is obtained from the stated jacking level and loss components, and the thermal strain is related to the induced elastic stress through Equation (14). Thus, the prestress target is a design input, and the simulated bar stress is the corresponding response check.
Two further points clarify this implementation. First, the approximately 0.87% gap between the simulated local von Mises maximum of 425.7 MPa (Section 3.2) and the target effective prestress of 429.46 MPa is a numerical-realization tolerance of the equivalent thermal input, not an additional loss mechanism. Second, the cumulative losses of the actual multi-bar tensioning sequence are accounted for at the design stage through the loss chain in Table 4 (122.96 MPa in total). Because the threaded bars are straight, the friction loss is relatively small but is not neglected; a value of 4.98 MPa is included in the design loss chain in Table 4. Anchorage-deformation, relaxation, and shrinkage–creep losses are also included, while the thermal-curing and elastic-shortening loss terms are taken as zero under the adopted design assumptions.
2.6. Load Cases
Four load cases were analyzed for each ground profile, giving 16 static analyses. The cases combine load sets 1 and 2 with the characteristic and fundamental load combinations listed in Table 7, where N denotes the applied axial load and is distinct from the joint clamping force Ncl and the interface shear resistance VR defined in Section 2.3.2.
Table 7.
Load combinations (forces in kN and moments in kN·m).
3. Results and Discussion
The 16 analyses combined the CDP model for concrete, Mohr–Coulomb plasticity for soil, and elastoplastic steel models. The results were assessed in terms of geostatic equilibrium, applied prestress in the threaded bars, reinforcement yielding, global settlement, concrete deformation and damage, and joint contact response.
The supplementary discretization assessment concerns J1 in LSS. Abaqus 2025 is the specified software version for all three J1 discretizations. The original four-profile comparisons retain their stated case identities.
3.1. Geostatic Equilibrium
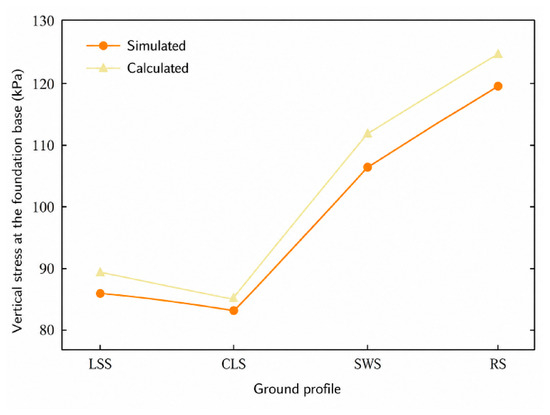
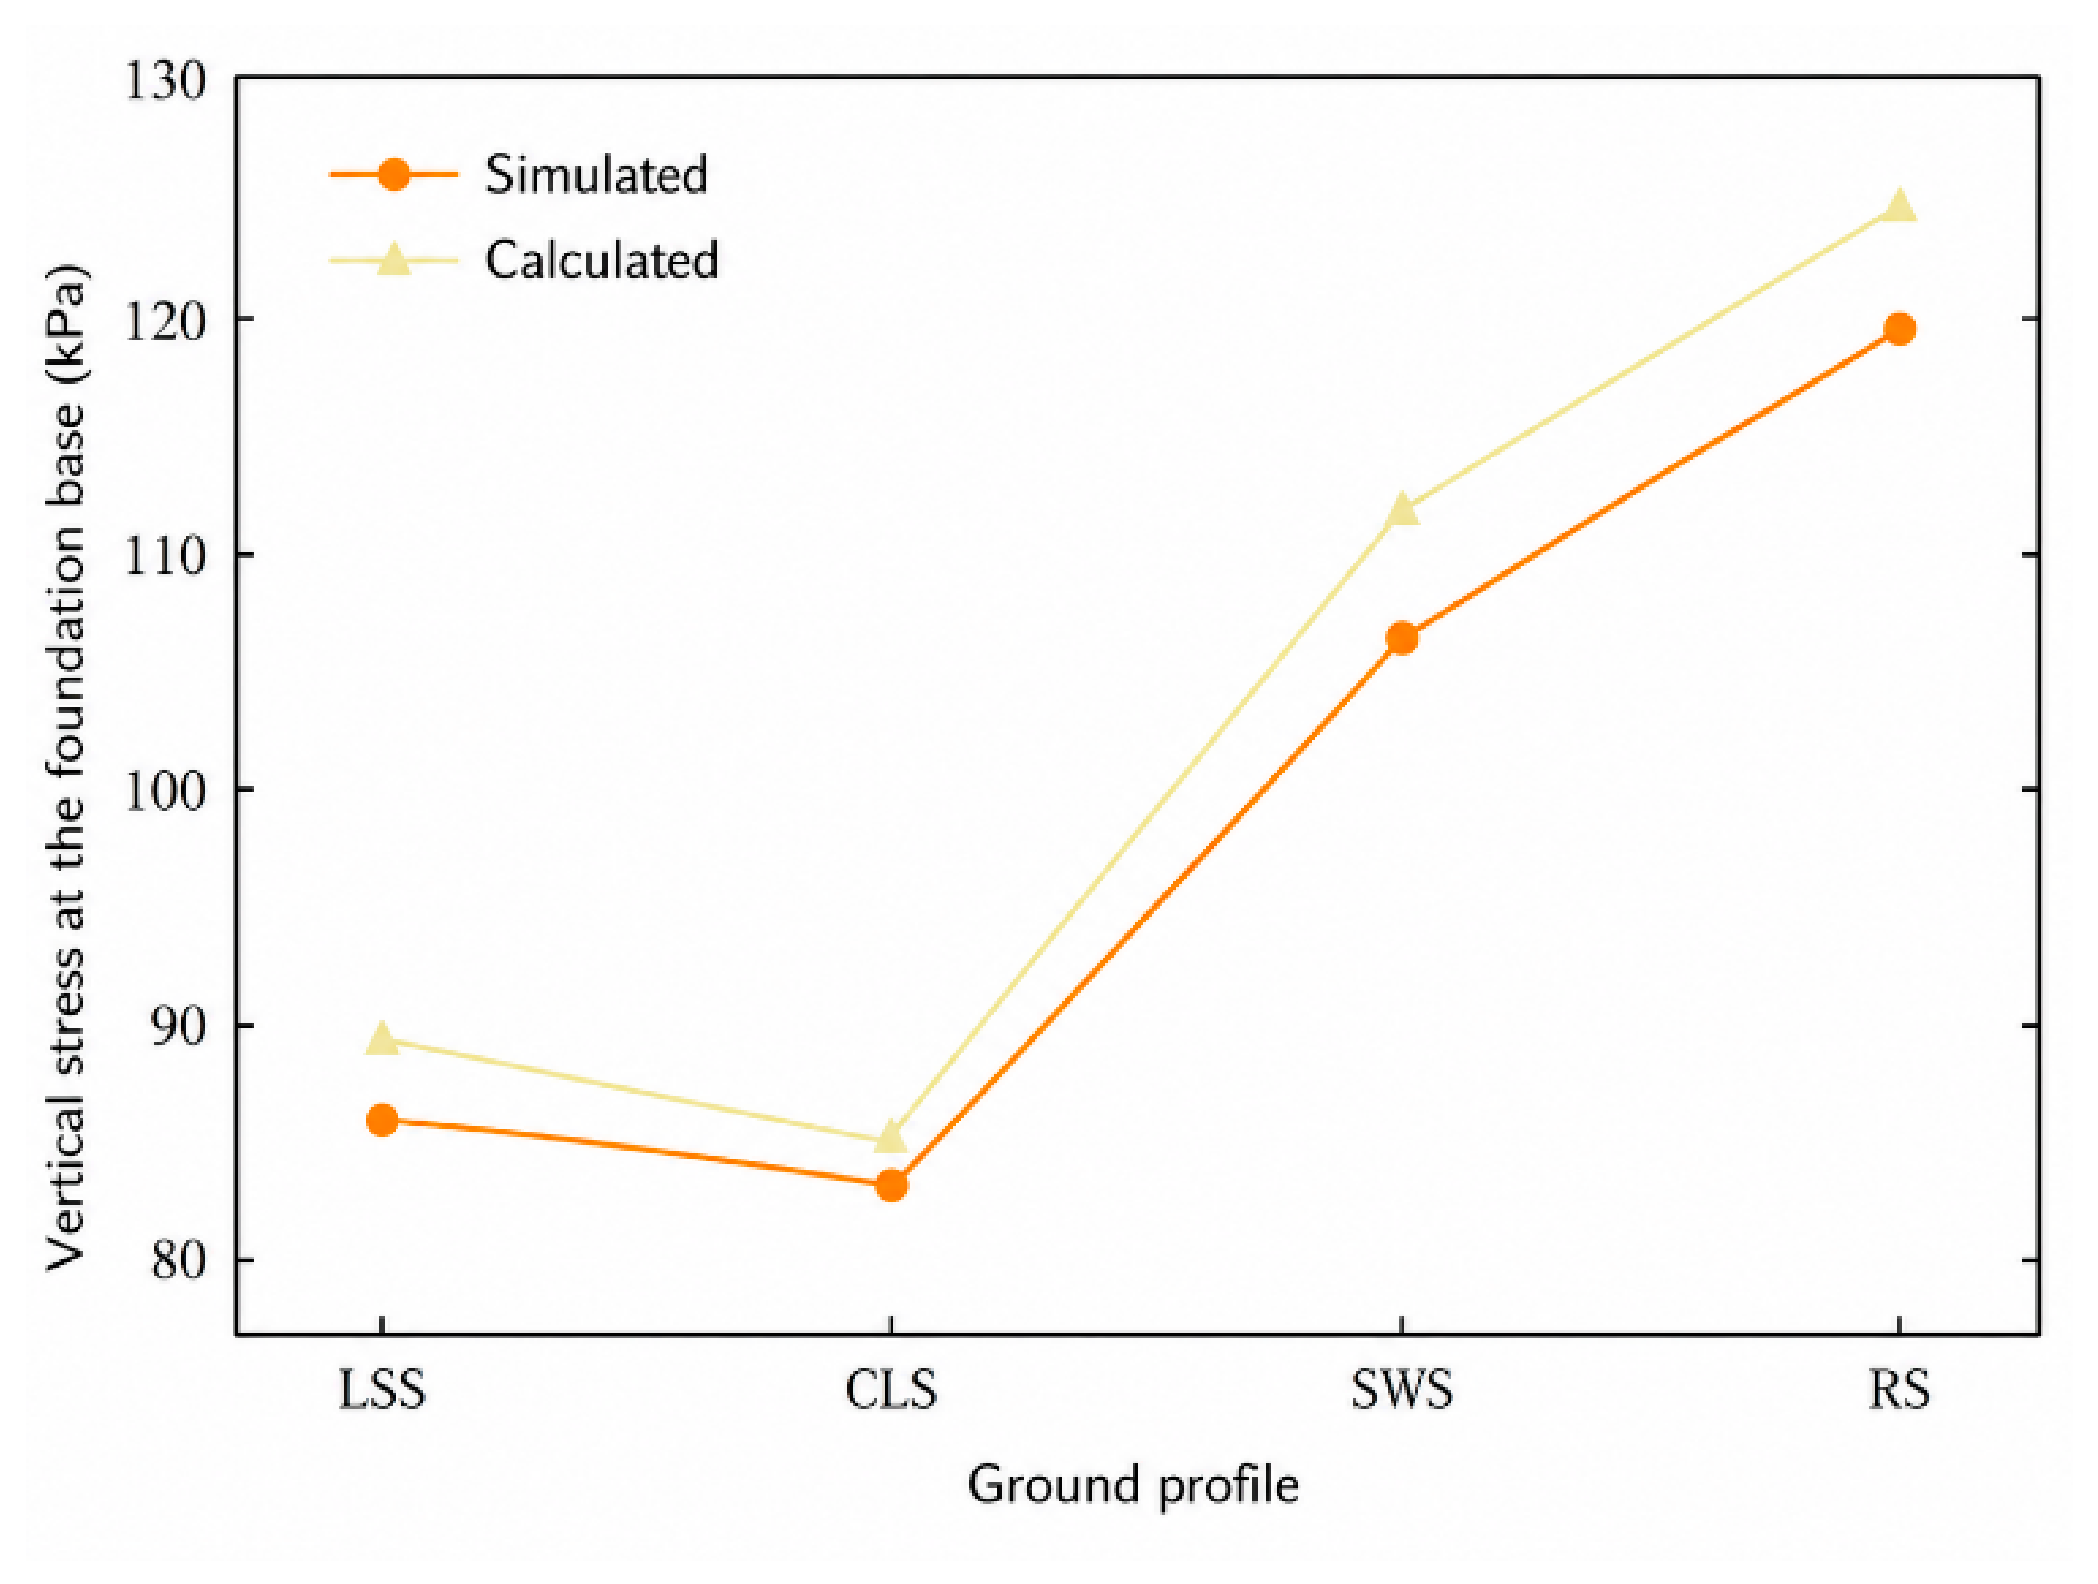
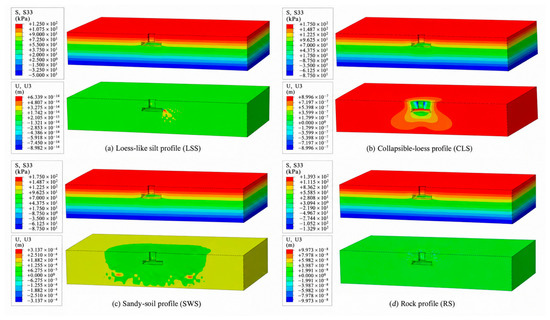
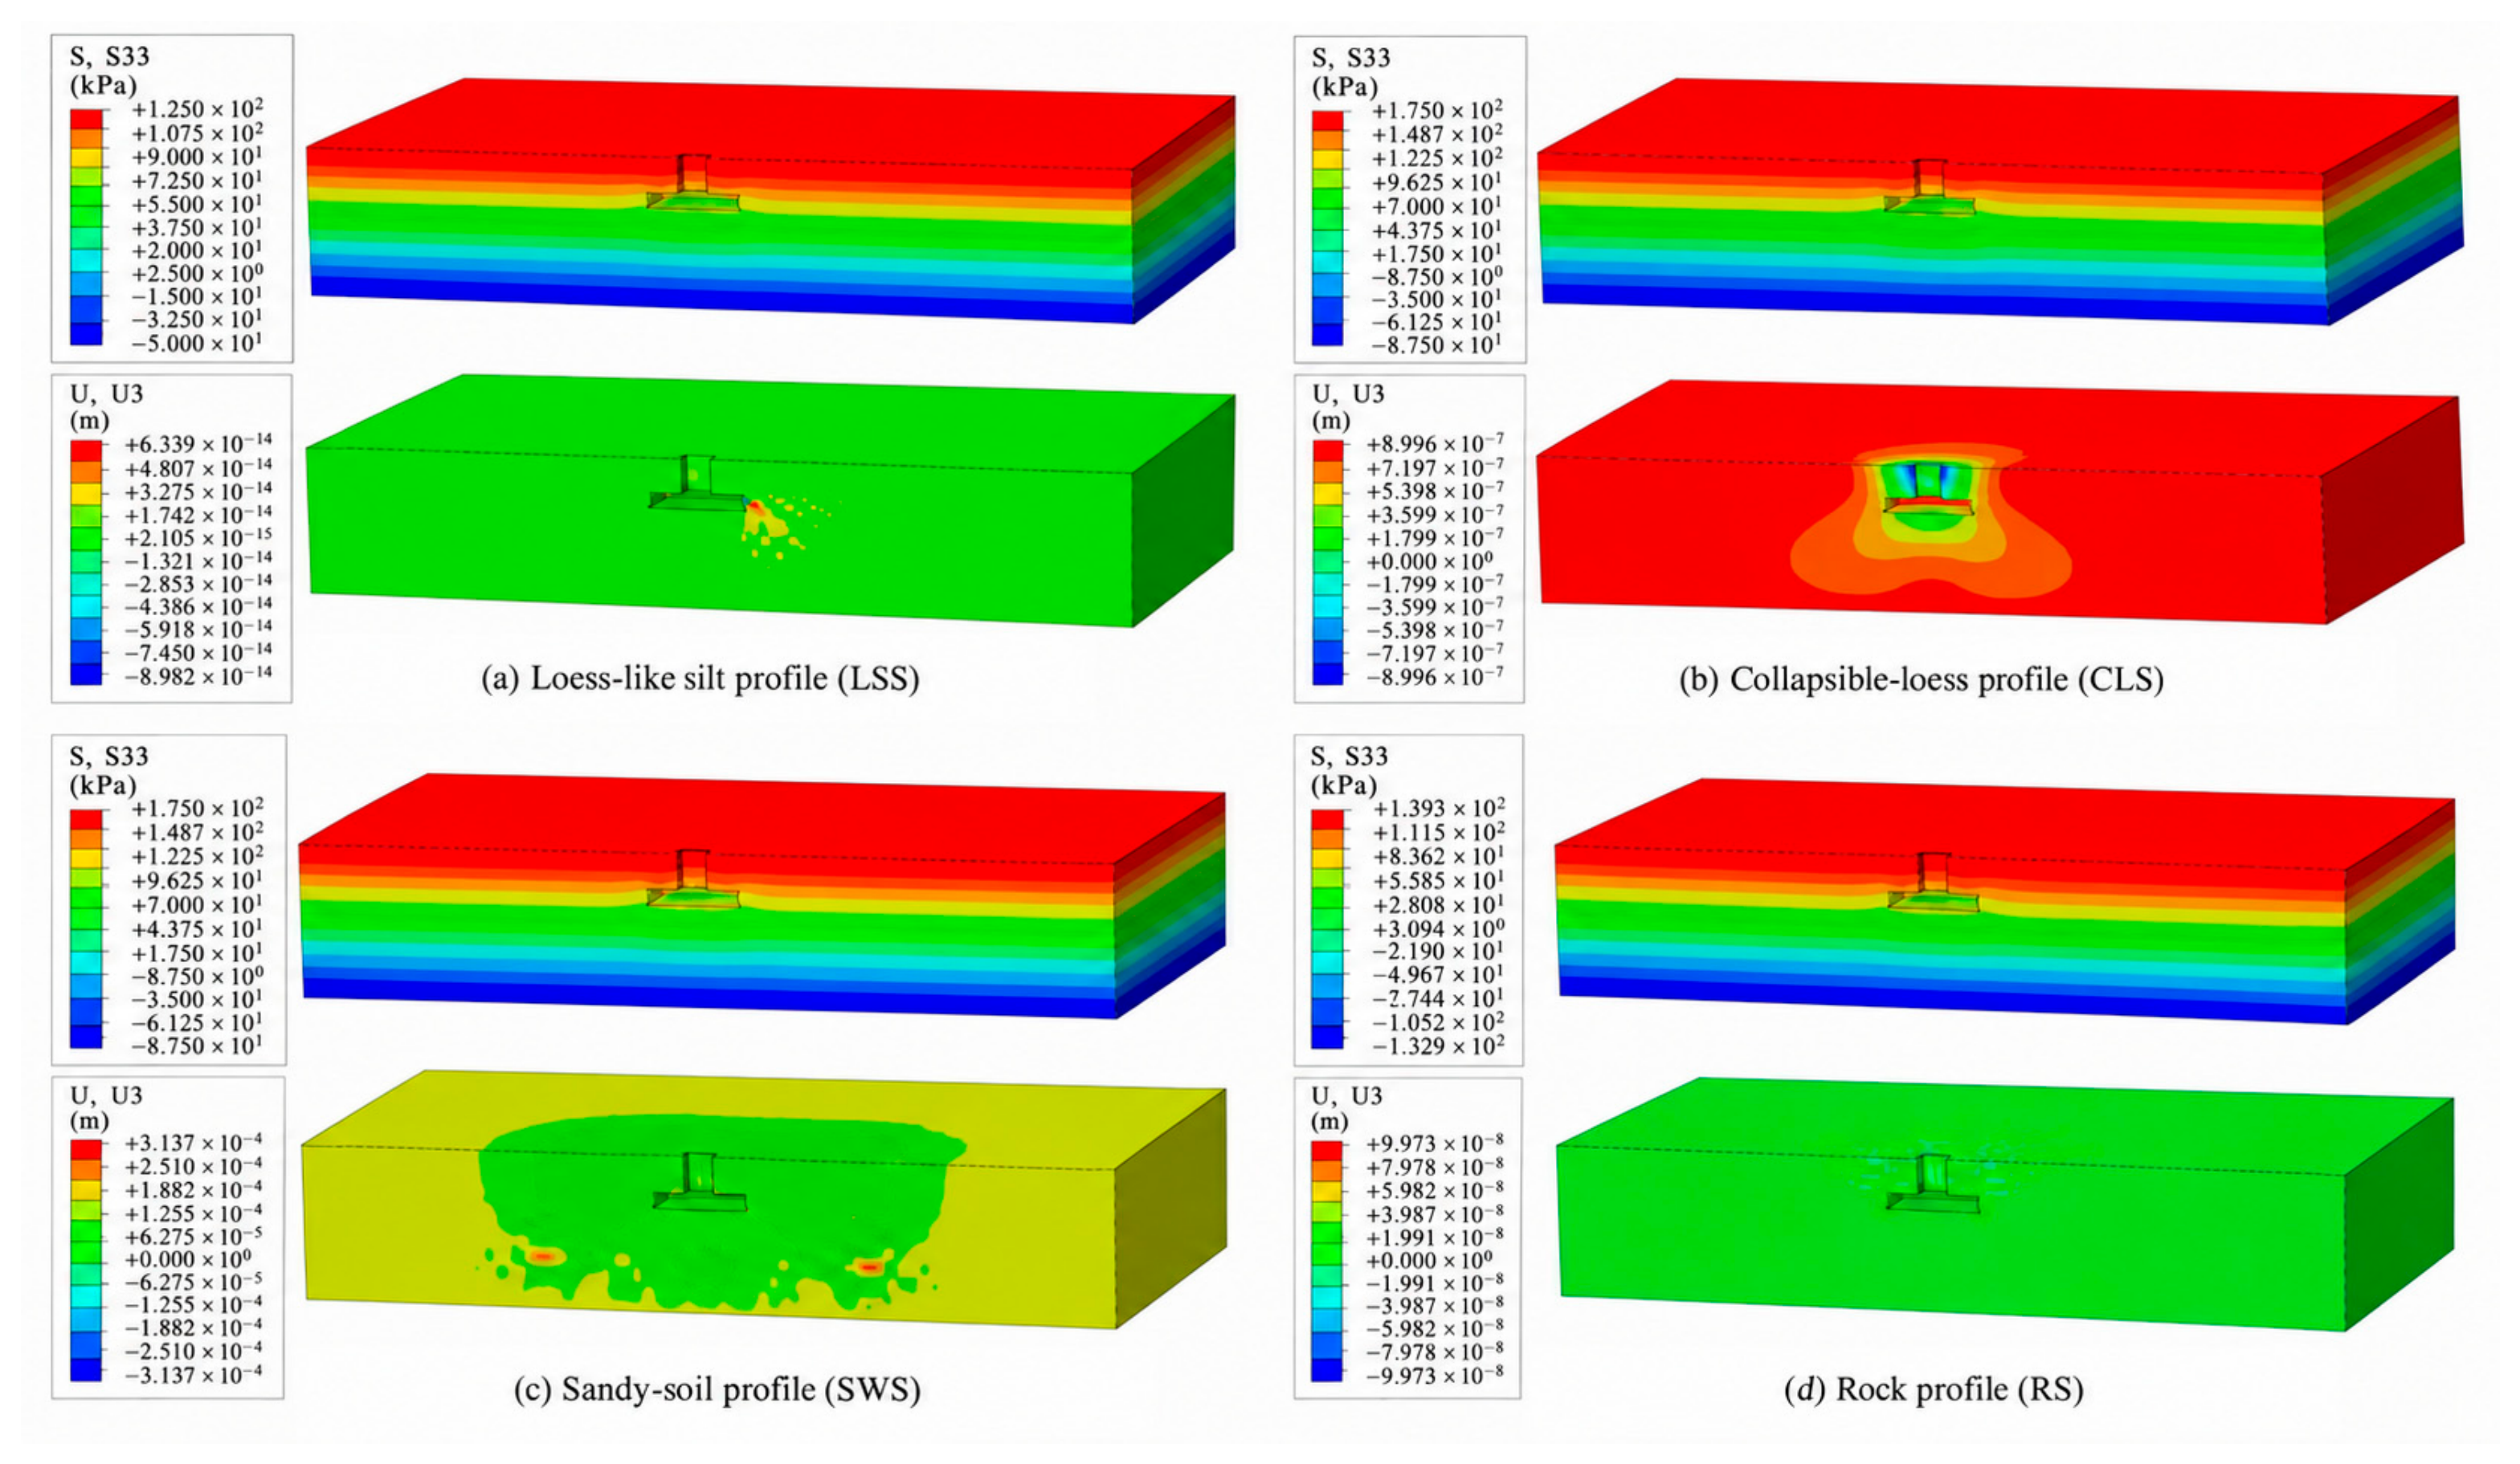
Figure 9 compares the calculated and simulated geostatic stresses, while Figure 10 shows the vertical stress contours through the center of the soil domain after geostatic initialization. Vertical stress increases approximately linearly with depth and approaches zero at the ground surface. For the four ground profiles, the simulated vertical stress at the domain base differs from the calculated overburden stress by approximately 3%.
Figure 9.
Error between calculated and simulated geostatic stresses.
Figure 10.
Vertical stress and displacement fields after geostatic initialization. The upper row shows vertical stress, and the lower row shows residual vertical displacement; ground profiles are identified in the panels.
The second row of Figure 10 shows the vertical displacement contours through the center of each soil domain after geostatic initialization. The residual displacements are well below the adopted tolerance of 1 × 10⁻⁴ m and are therefore negligible.
3.2. Verification of the Applied Prestress
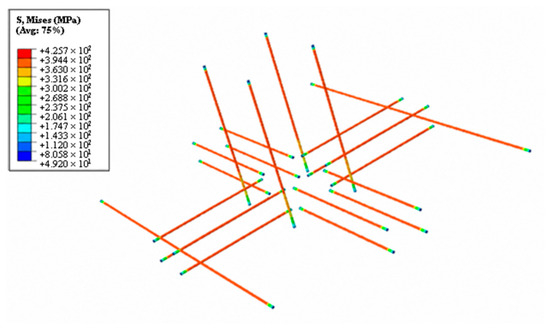
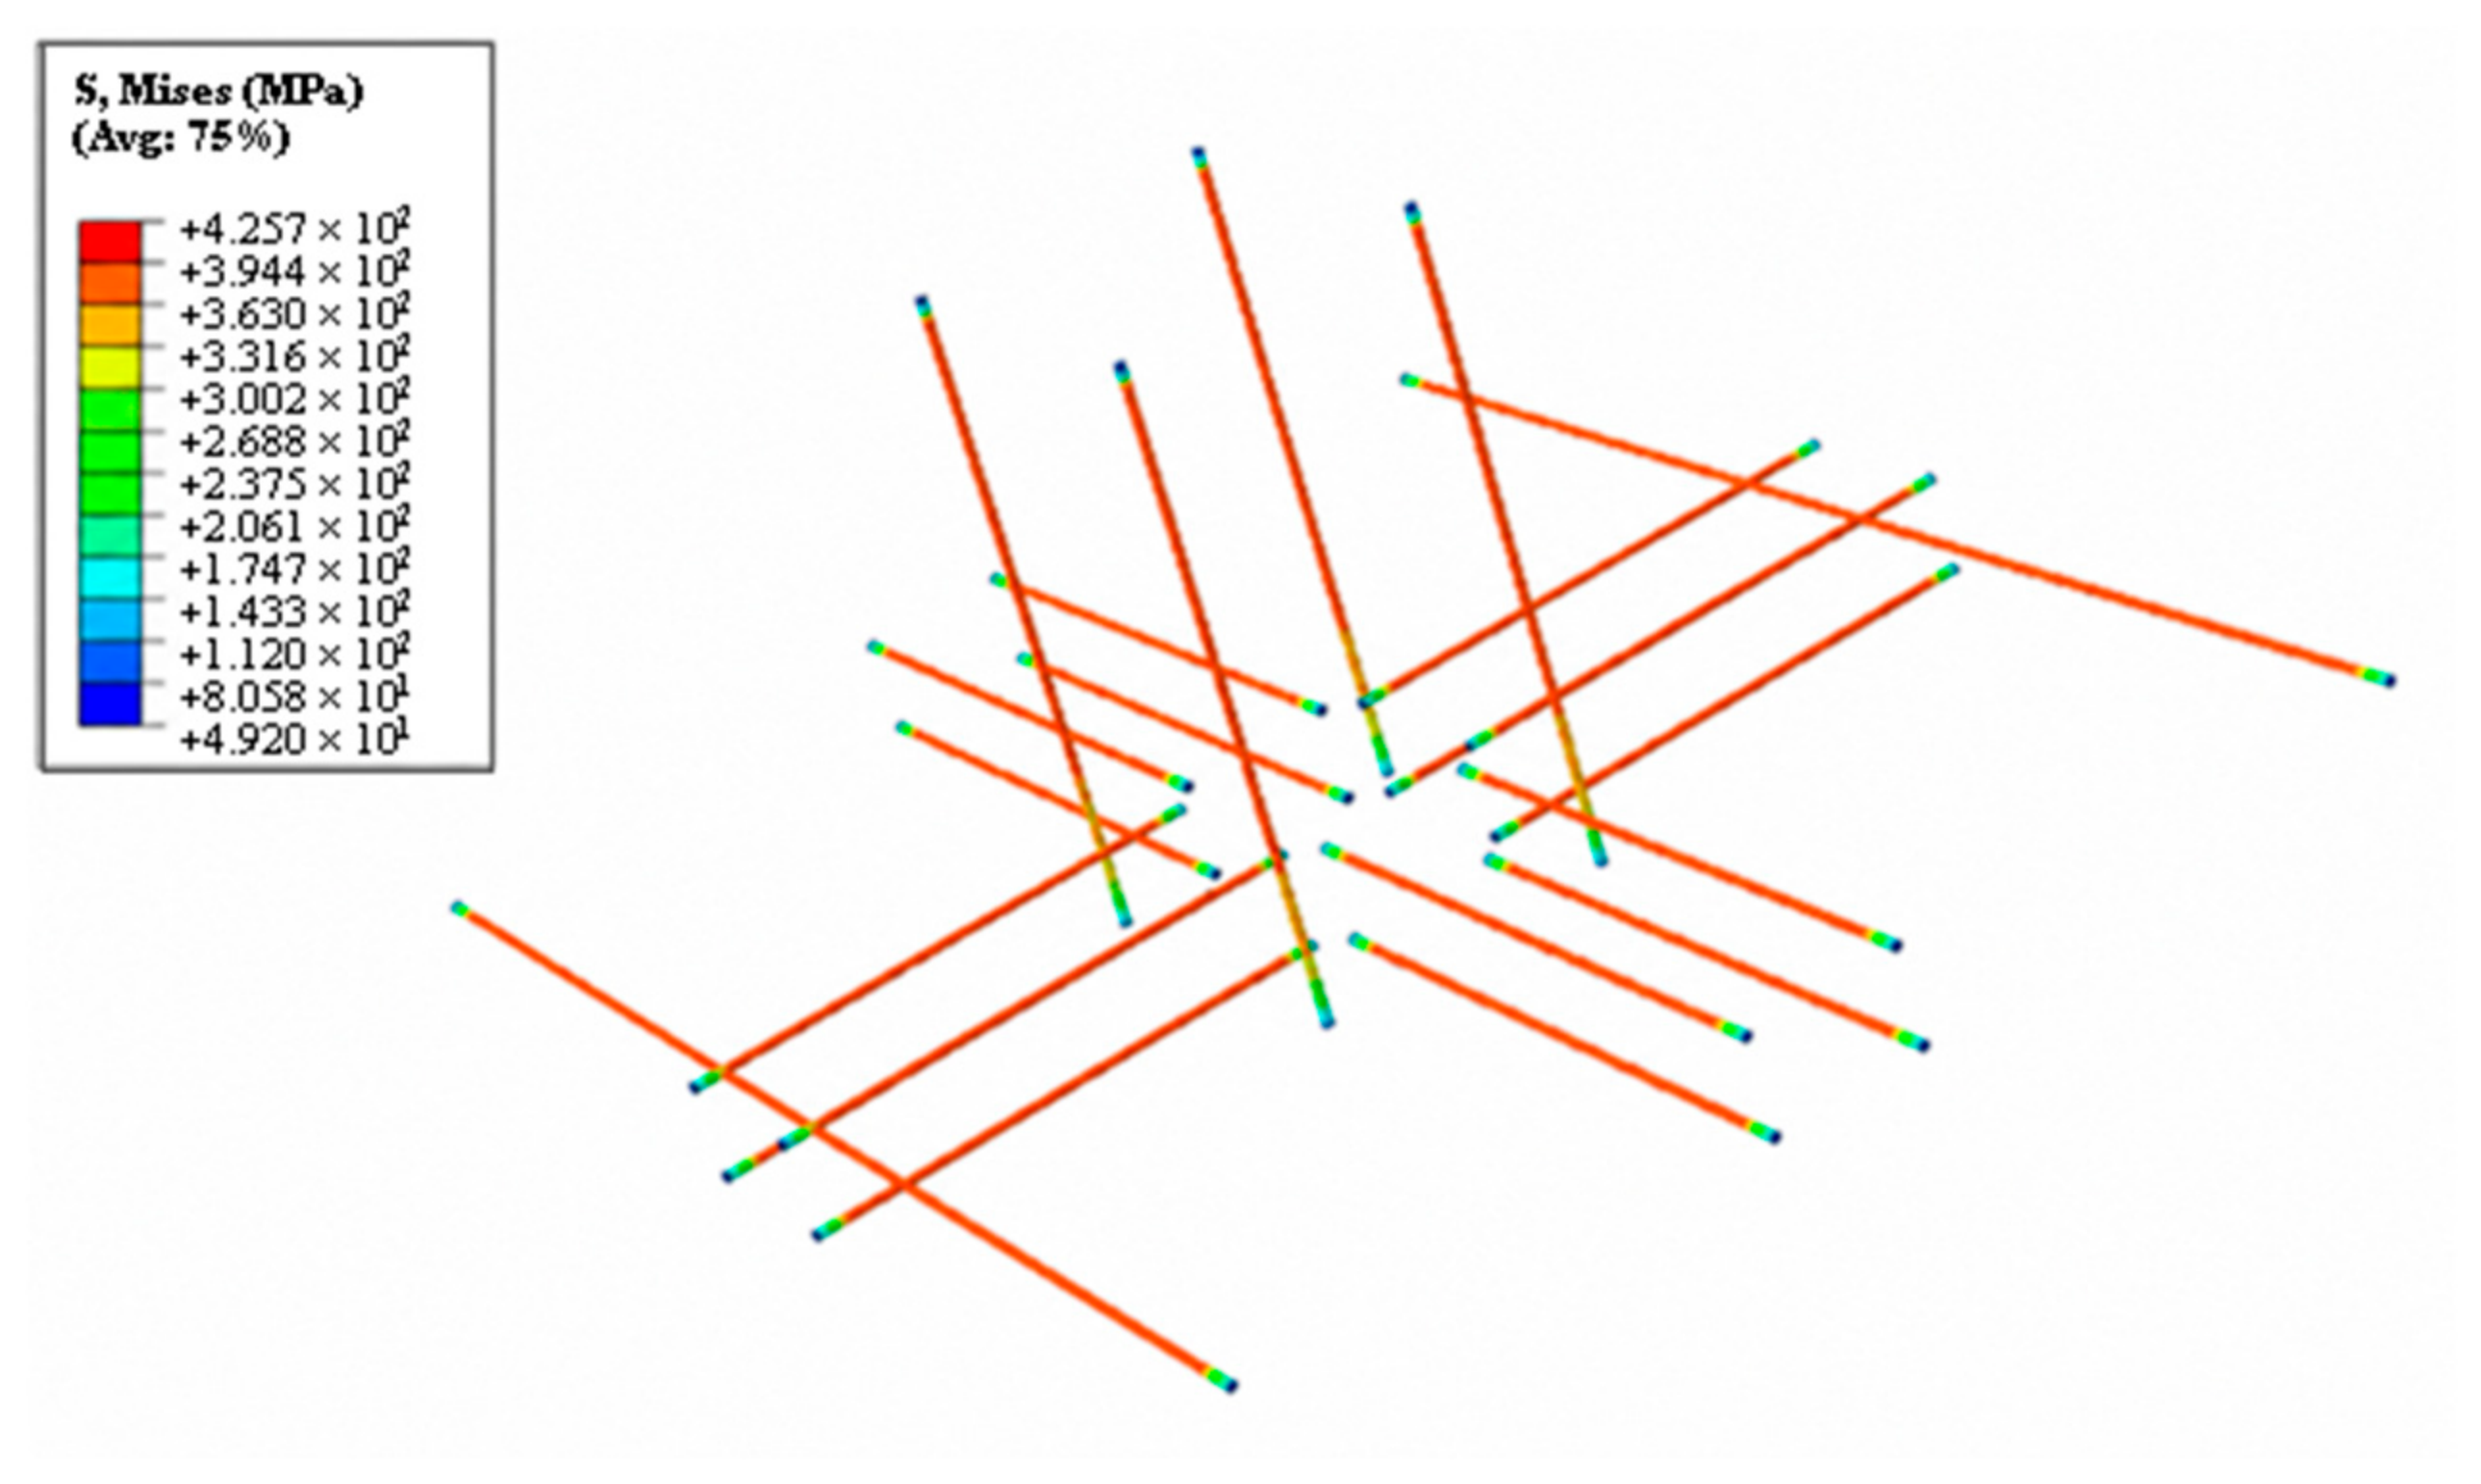
Figure 11 shows the threaded-bar stress before external static loading. The local von Mises stress maximum of approximately 425.7 MPa is close to the design effective prestress of 429.46 MPa. This comparison provides a check on the simulated stress level; the design axial-stress target and the local equivalent-stress maximum represent different quantities.
Figure 11.
Stress field in the prestressing threaded bars after prestress application.
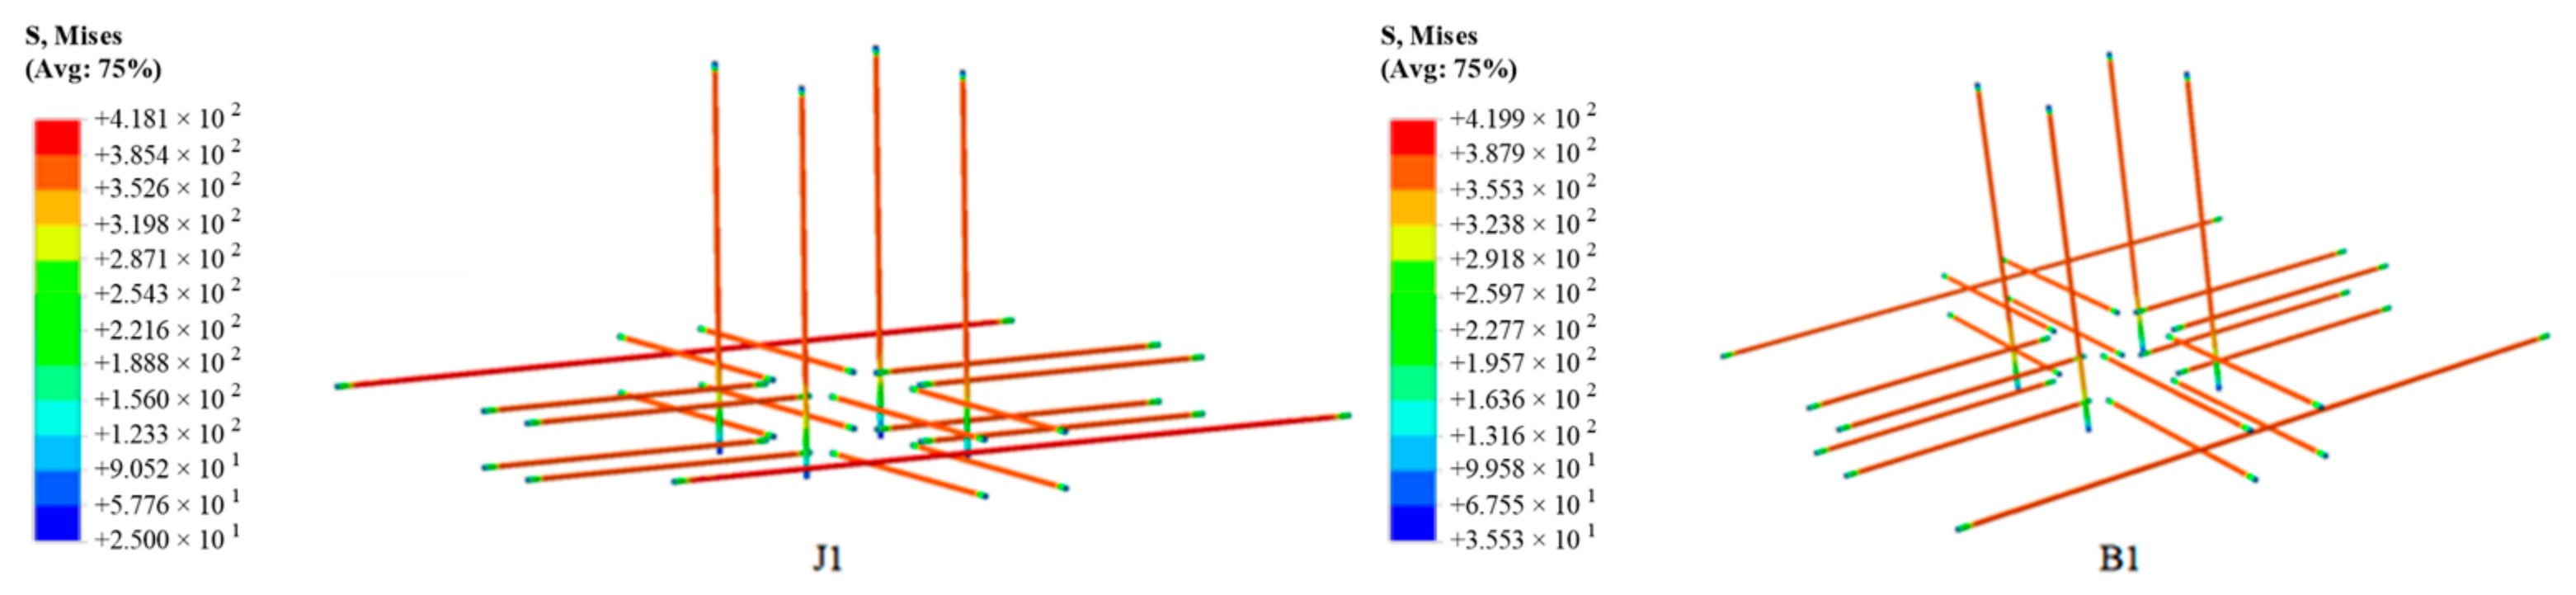
Figure 12 shows the prestressing threaded-bar stresses after static loading for cases J1 and B1 in the CLS profile. The bars in the footing slab carry higher stresses than those in the pedestal, and the bars aligned with the principal horizontal action carry higher stresses than those oriented perpendicular to it. The two long bars develop the largest stresses because they connect the major slab components and accommodate differential settlement between the two sides of the footing.
Figure 12.
Prestressing threaded-bar stress fields after external loading in the CLS profile for cases J1 and B1.
3.3. Settlement Sensitivity
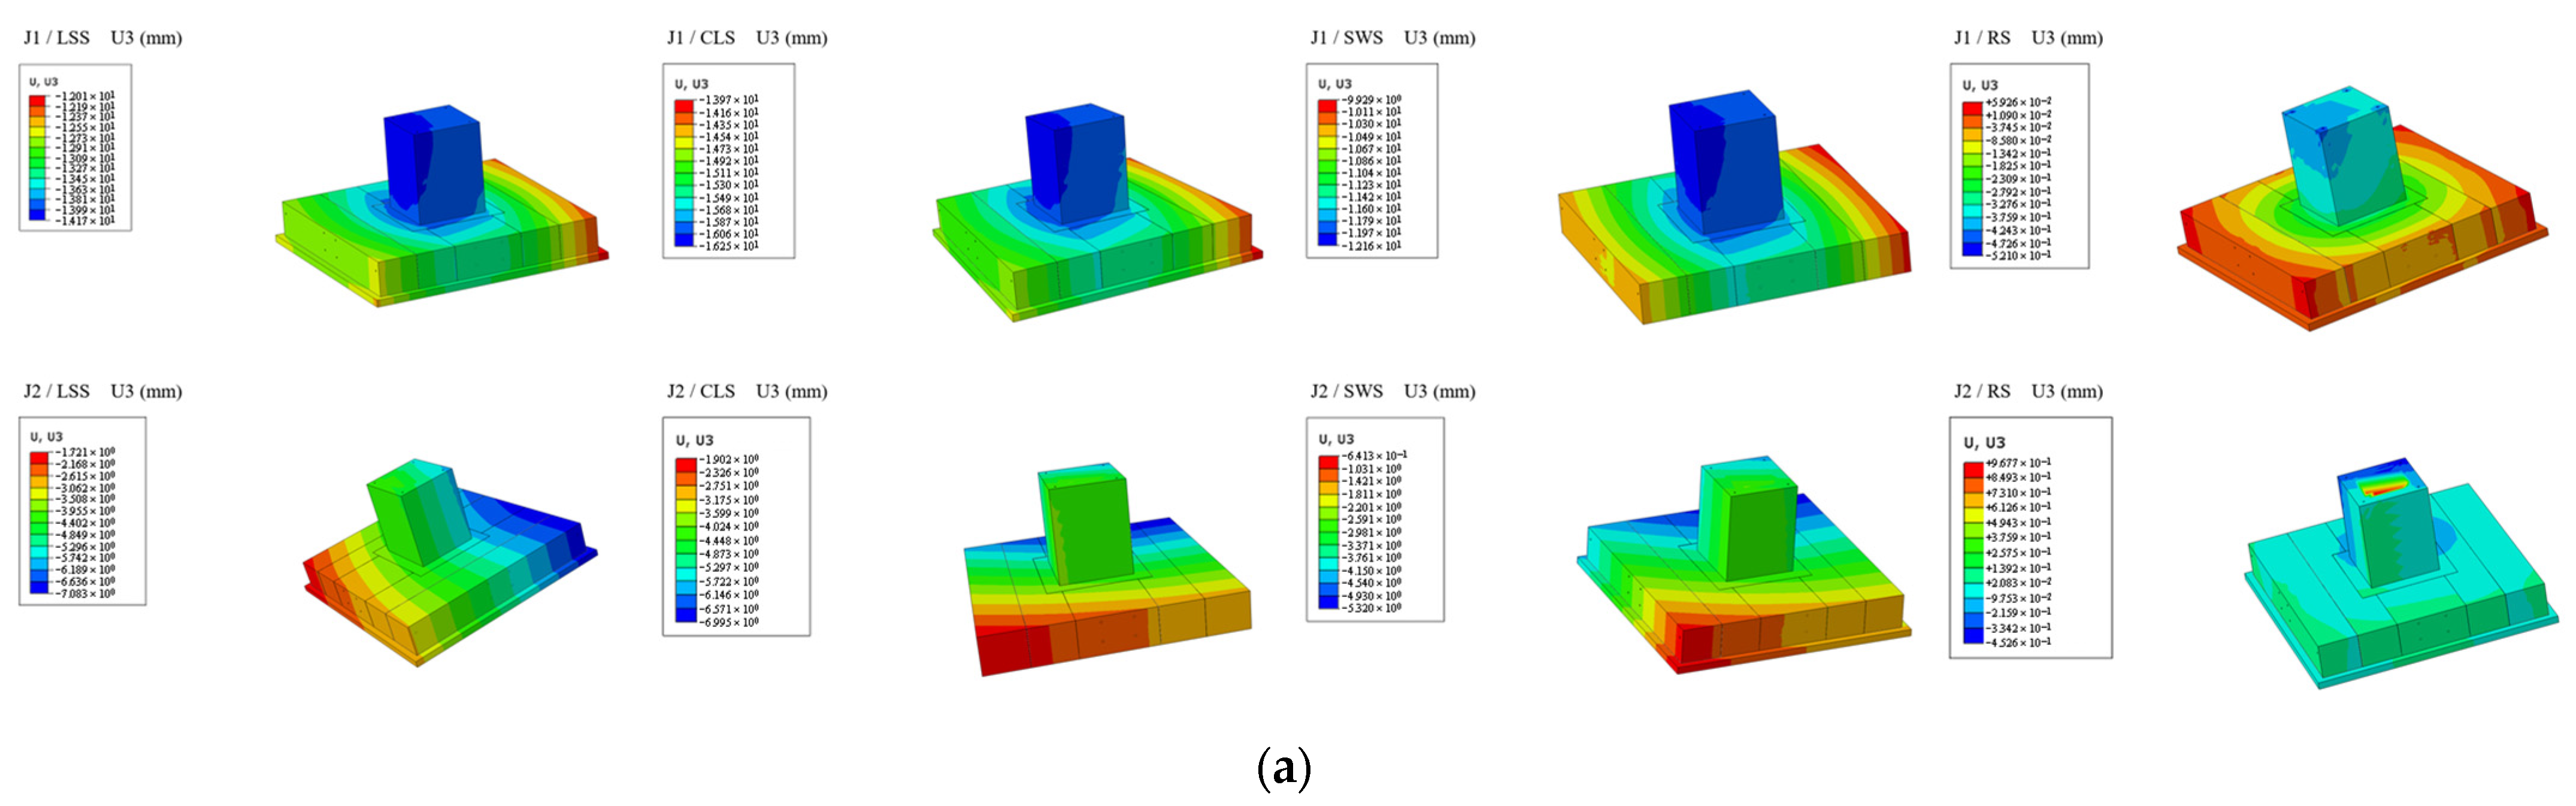
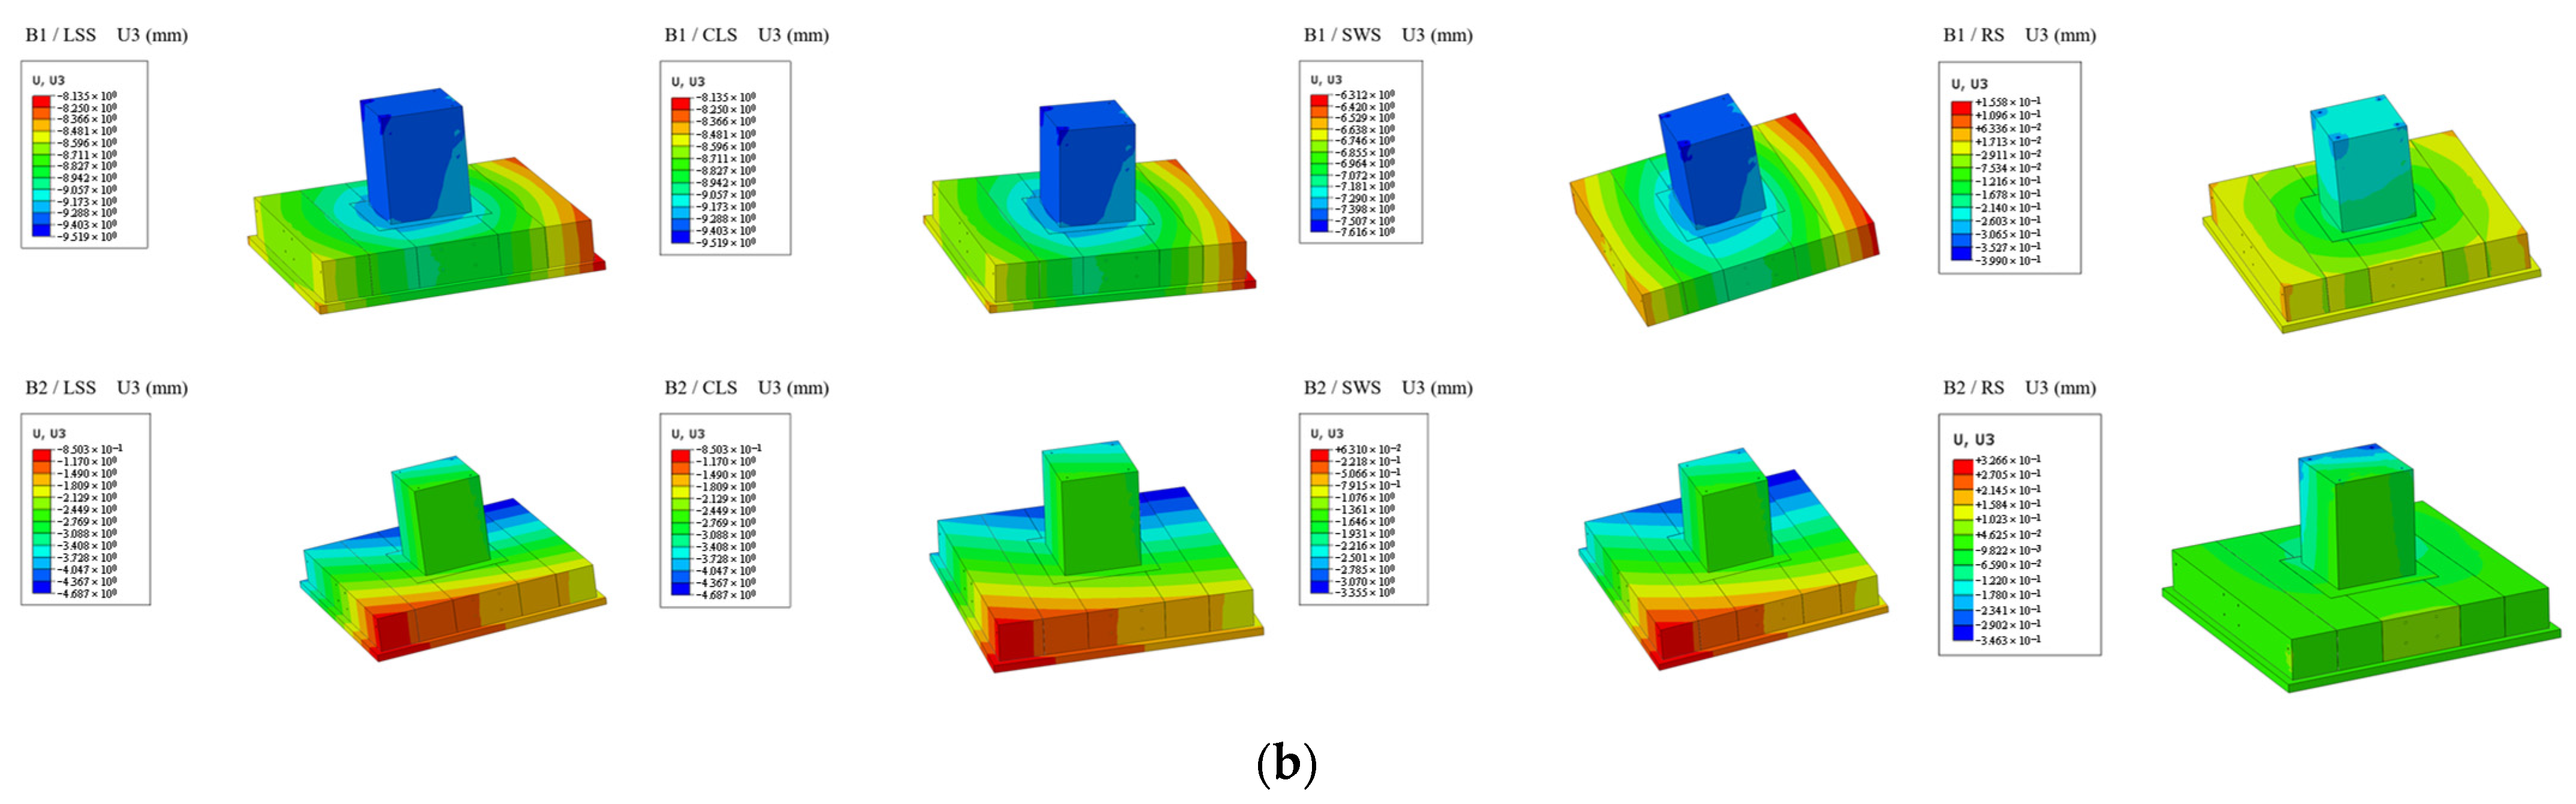
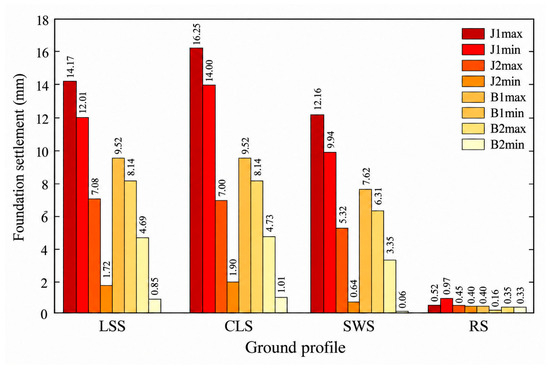
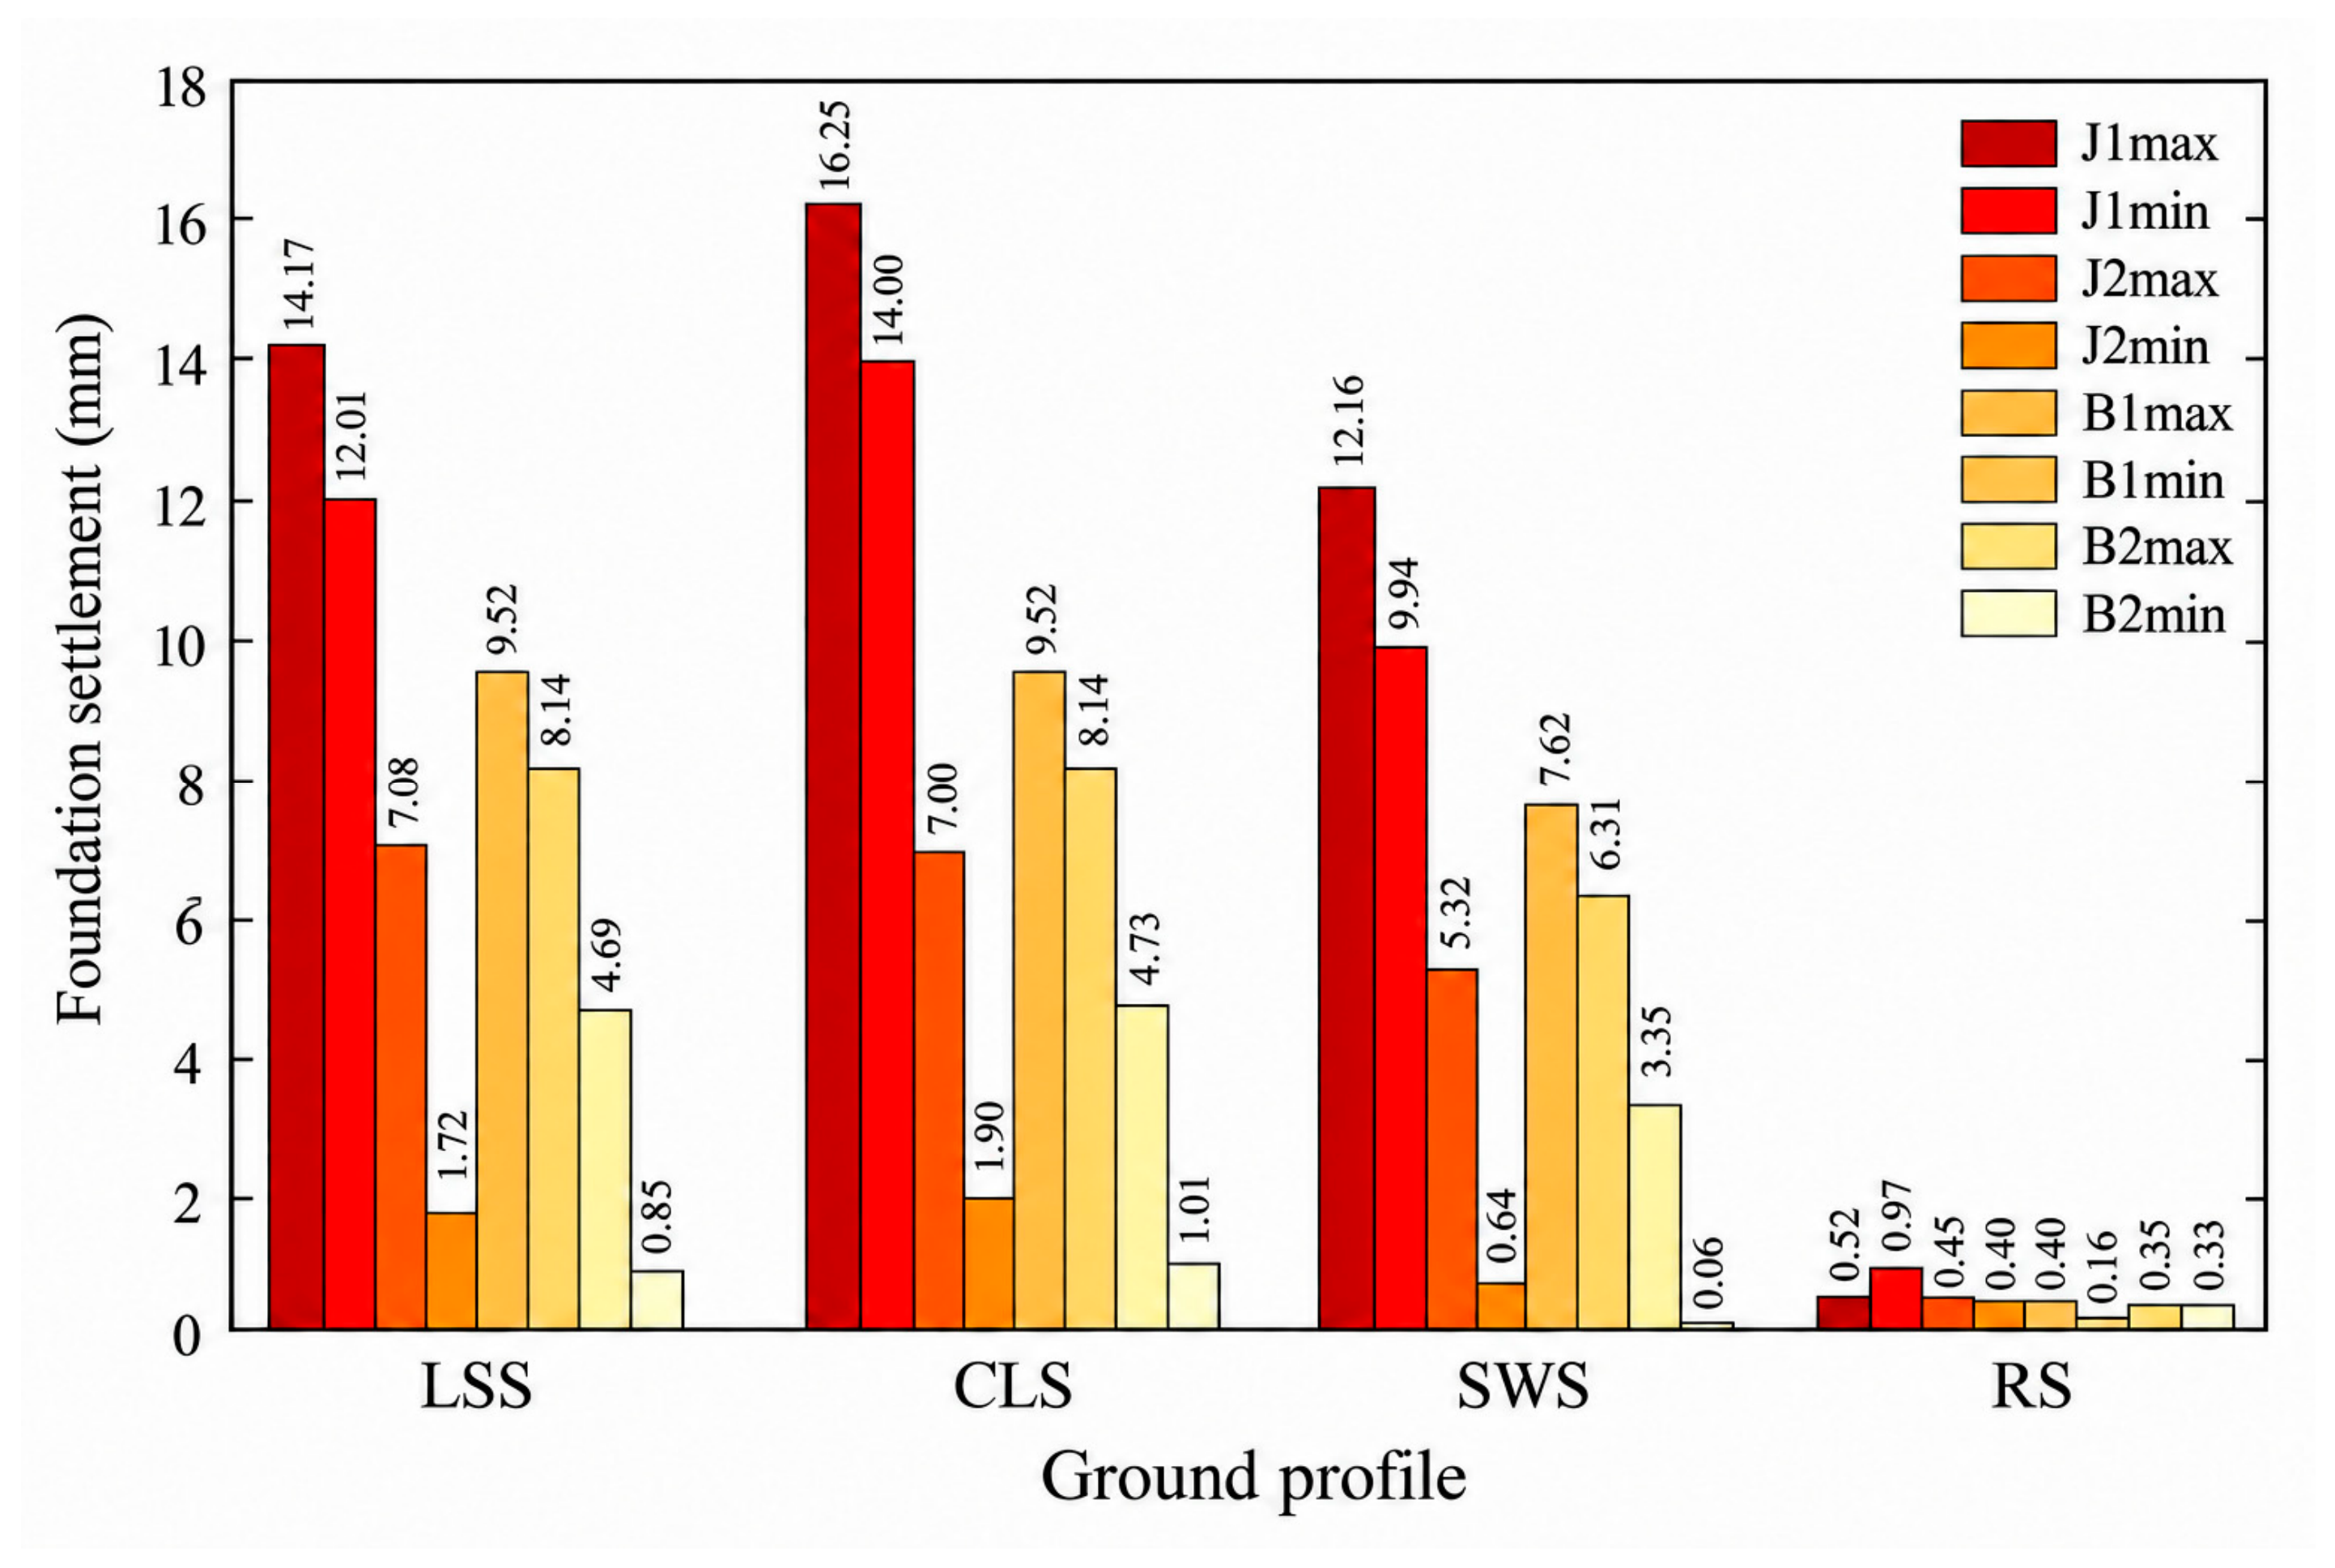
Horizontal deformation was small relative to vertical movement. Figure 13 shows that the largest vertical displacement in cases based on load set 1 occurred mainly in components G1 and G2. In cases based on load set 2, it was concentrated near the negative x-edge of the footing. Settlement responses for all 16 analyses are compared in Figure 14.
Figure 13.
Vertical displacement fields of the prefabricated foundation: (a) foundation settlement under the fundamental load combination; (b) foundation settlement under the characteristic load combination.
Figure 14.
Total foundation settlement by ground profile and load case (mm). J/B denote fundamental/characteristic combinations, 1/2 identify load sets, and max/min denote the plotted extrema.
Differential settlement decreased as the ground profile became stiffer, from the LSS and SWS profiles to the RS profile. The larger compressive axial force in cases based on load set 1 concentrated bearing pressure beneath the pedestal and produced greater settlement. In cases based on load set 2, the smaller axial force kept the soil response closer to the elastic range, whereas the larger shear forces and moments increased horizontal and rotational demand. The largest settlements occurred in the CLS profile, reflecting the combined influence of its adopted stratigraphy and relatively soft constitutive parameter set.
Differential settlement between the two load sets approached zero in the RS profile.
3.4. Soil Deformation
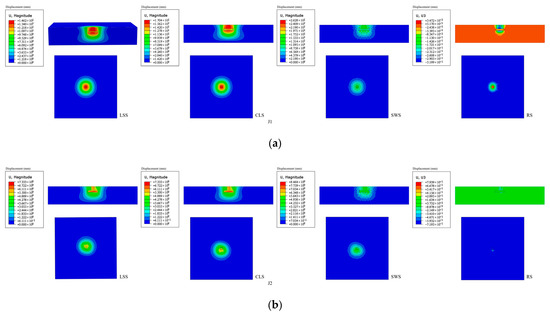
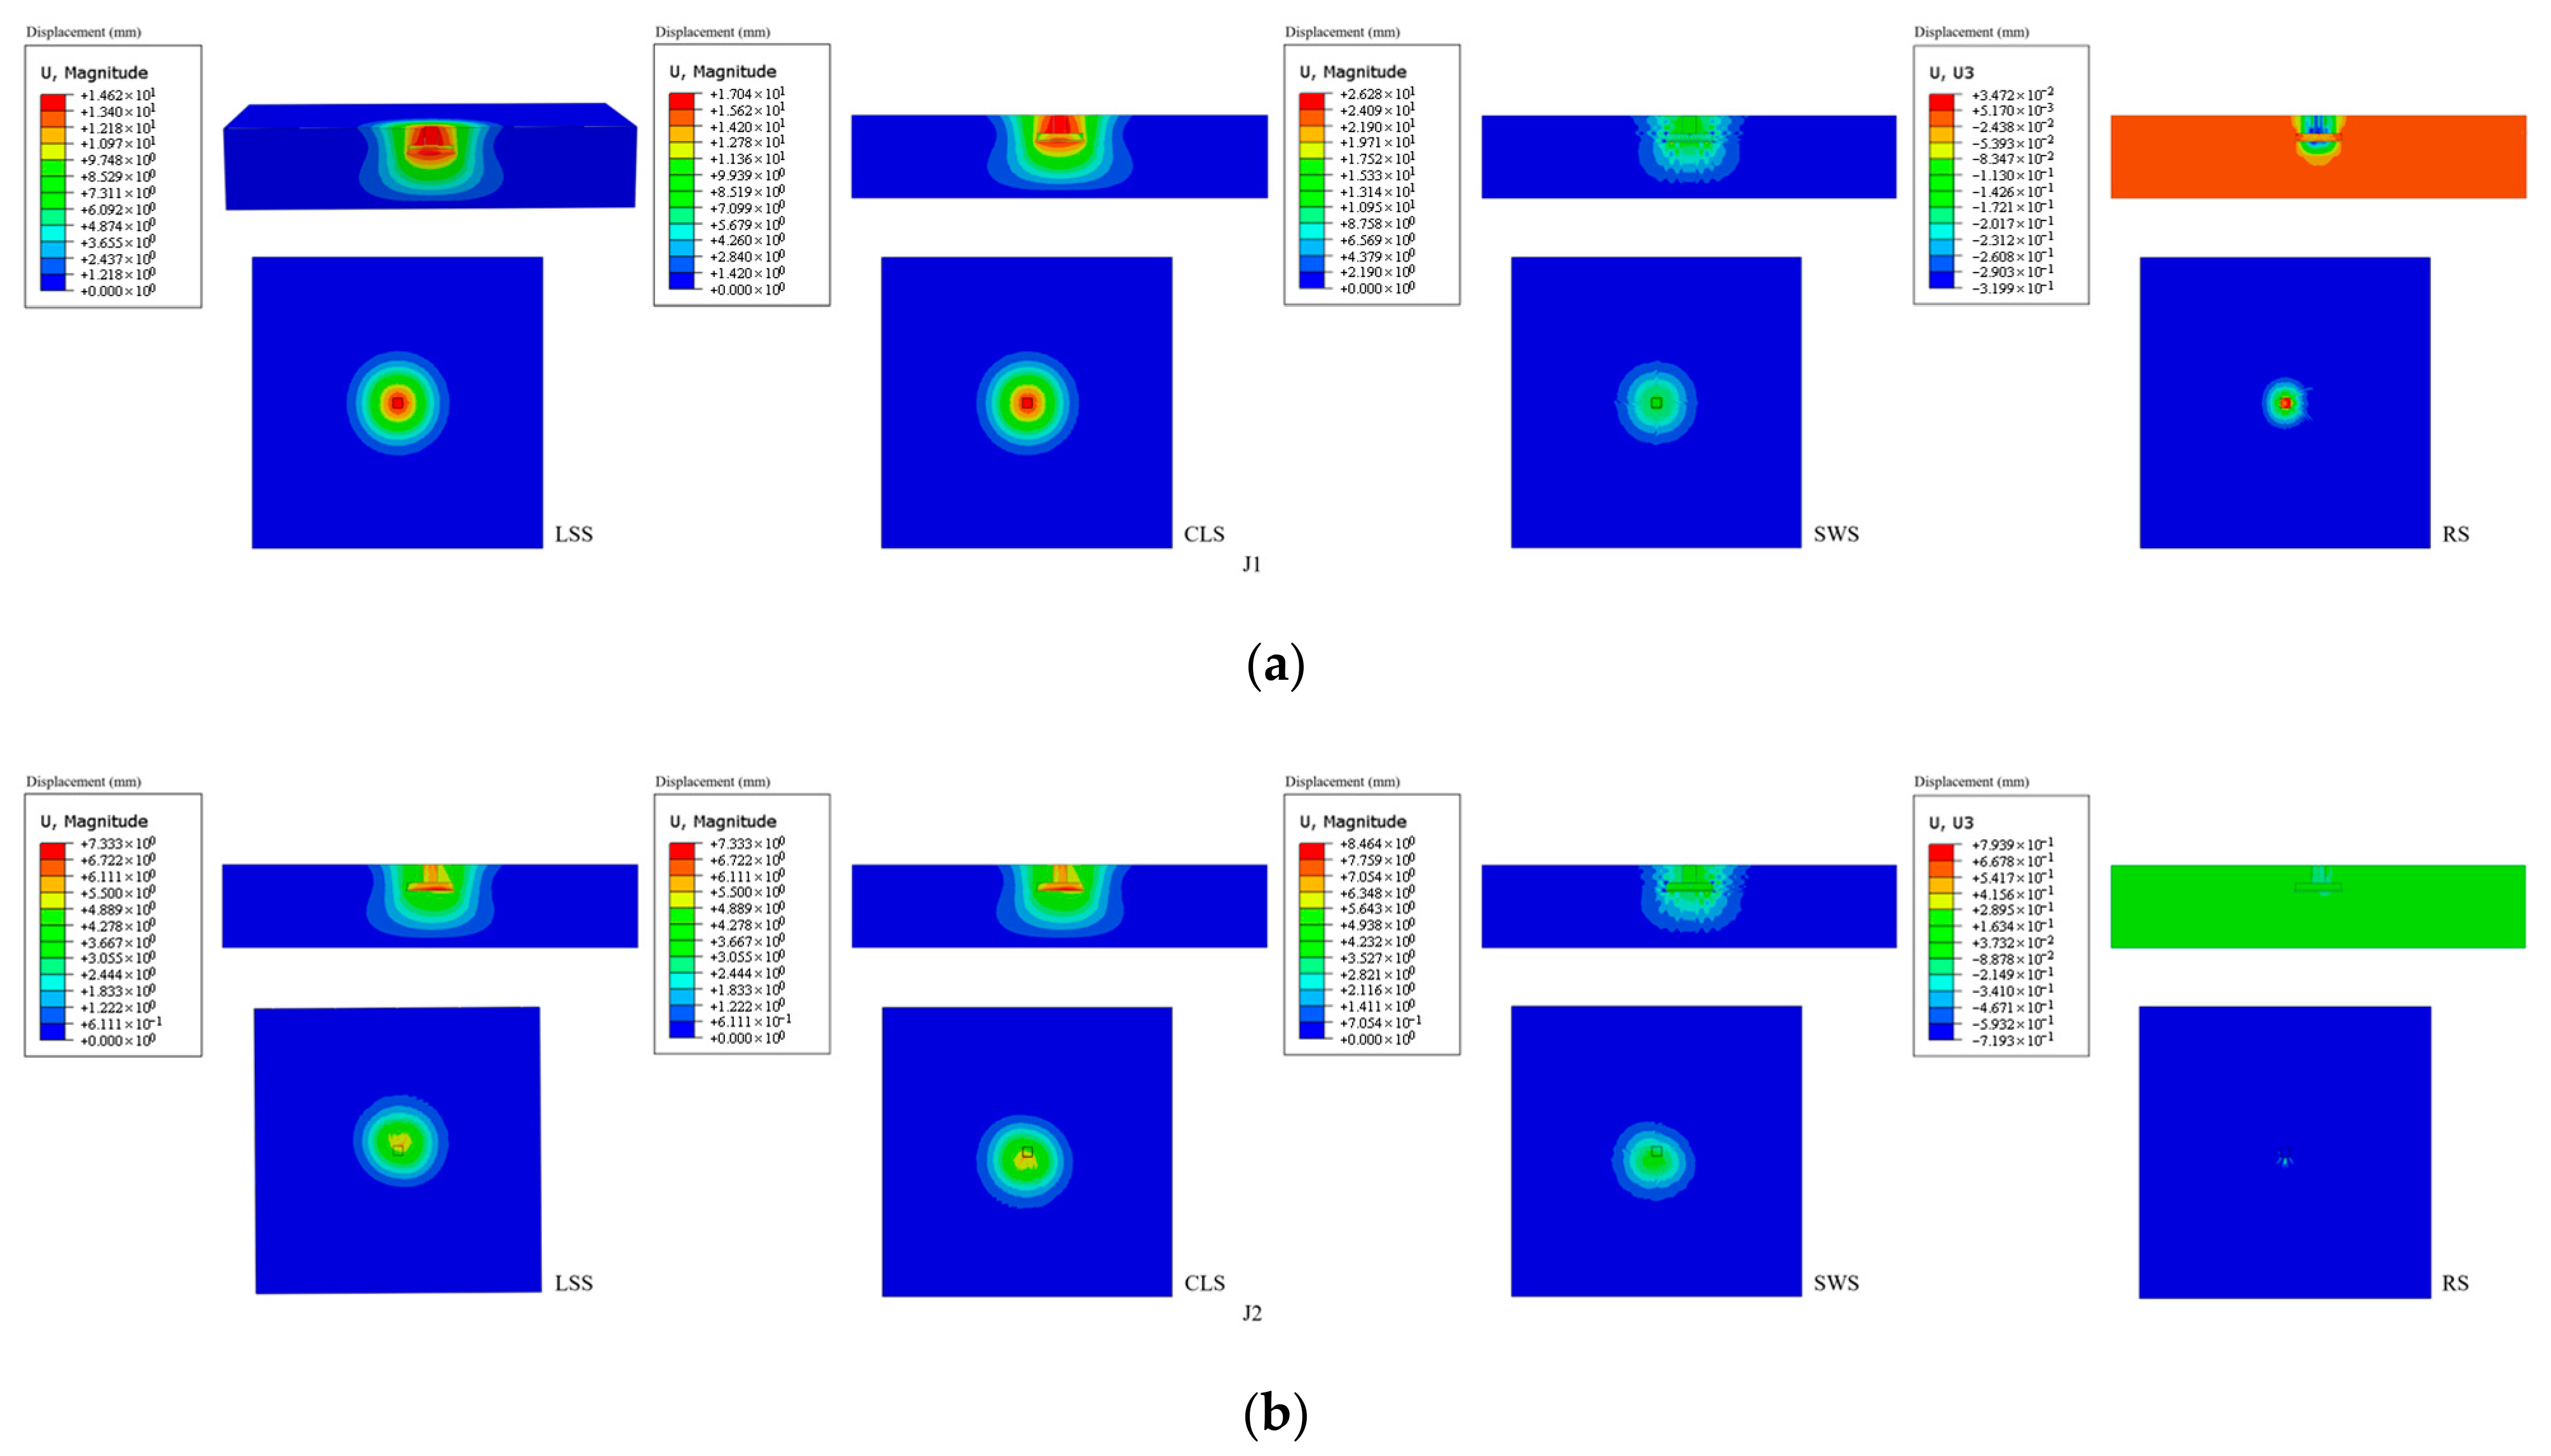
External loading altered the stress and displacement fields in the surrounding soil. The supplementary LSS result files use a 30 m × 30 m × 6 m soil domain. Because the response contours reached these limits, the analyses do not establish the complete influence-zone extent. The fundamental load combinations were used to compare the ground profiles. A vertical section aligned with the horizontal load was extracted to show the soil response around the footing (Figure 15). Vertical displacement decreased with distance from the foundation center. The location of maximum vertical displacement shifted in the load direction, producing asymmetric deformation near the slab edges. This shift was more pronounced in cases based on load set 2 because of their larger horizontal actions.
Figure 15.
Soil-deformation fields under the fundamental load combinations. (a) Soil deformation in load case J1. (b) Soil deformation in load case J2.
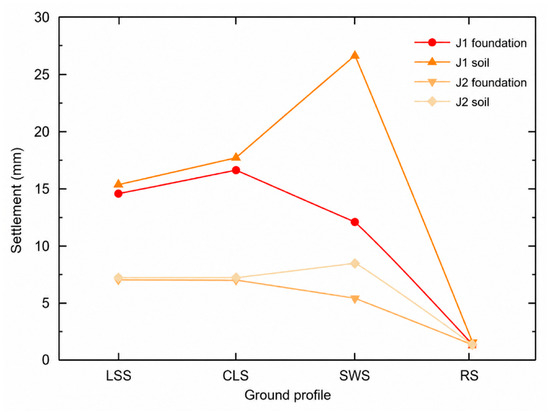
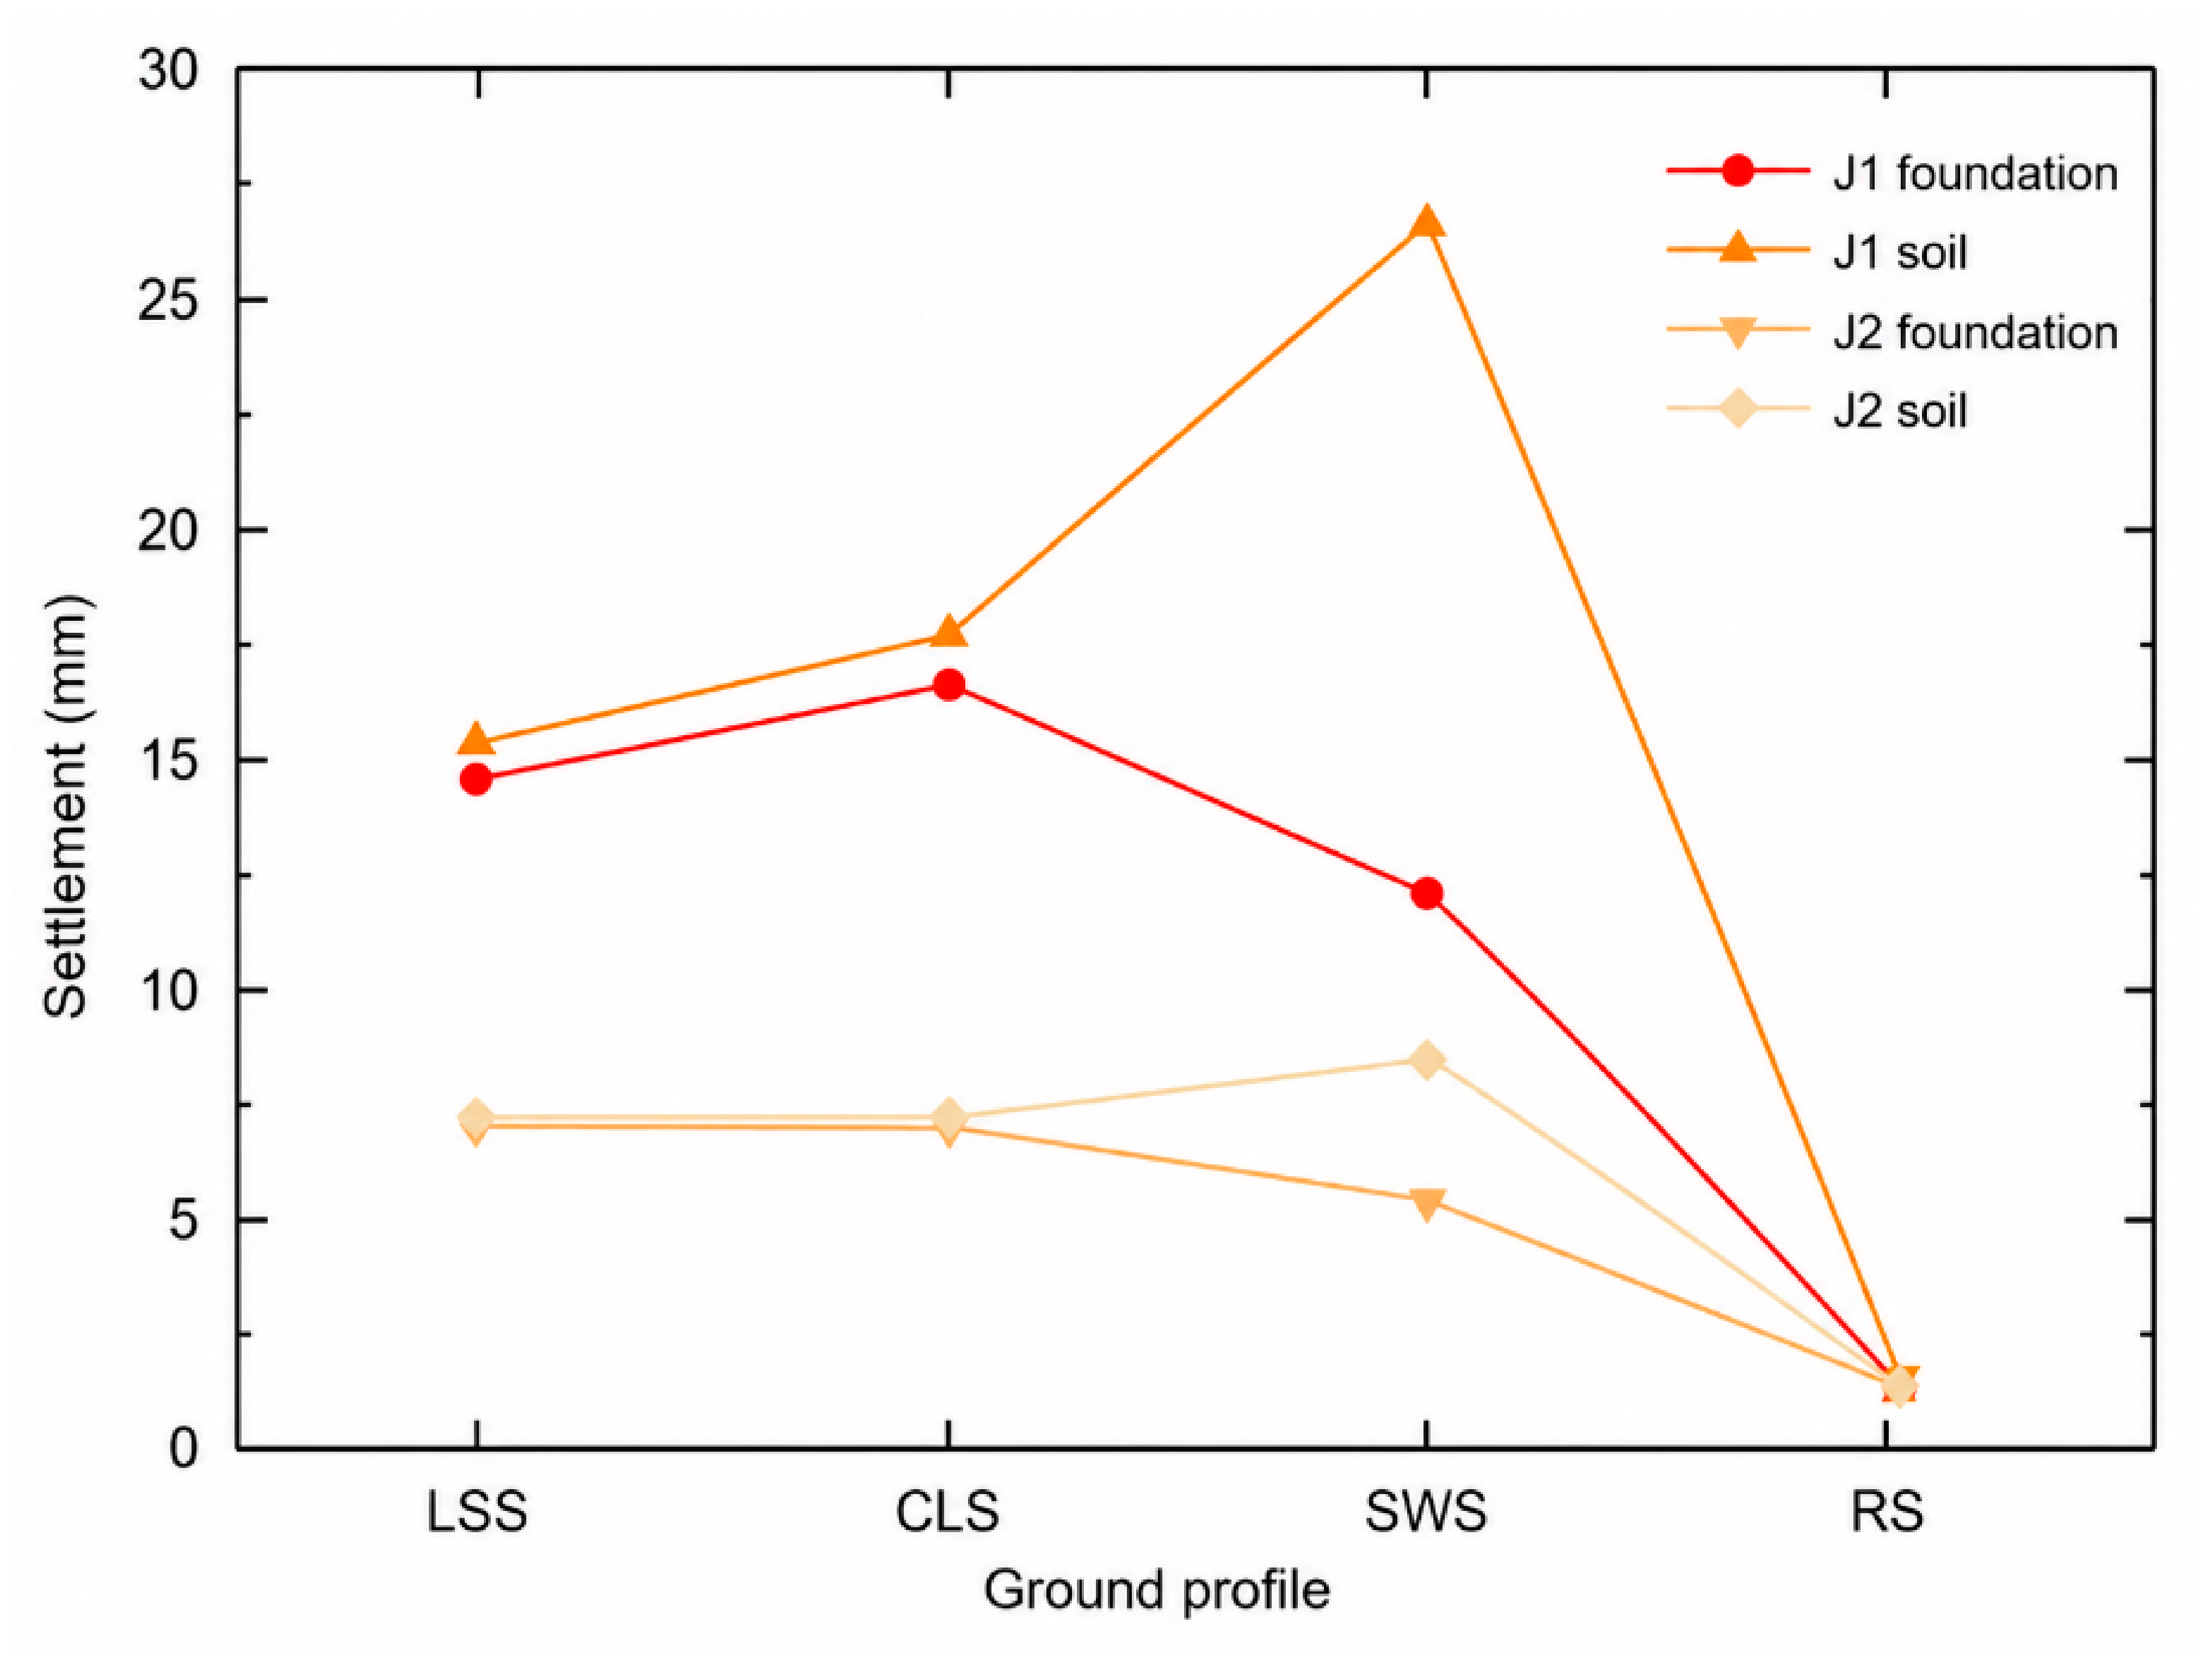
Figure 16 compares the soil and foundation displacements under the same load case. The responses are generally consistent for the LSS, CLS, and RS profiles, whereas a larger difference is observed for the SWS profile. According to Table 6, the SWS profile consists of a 0–2 m silty-clay layer, a 2–4 m silt layer, and an underlying fine silty-sand layer. The layered stratigraphy, together with the differences in stiffness and shear-strength parameters among the soil layers, produces a more spatially variable deformation response around the foundation. Under the combined vertical and horizontal load transfer near the footing edge, the surrounding soil exhibits more localized deformation, whereas the comparatively rigid assembled foundation responds more uniformly. This difference in deformation characteristics contributes to the larger soil–foundation displacement discrepancy observed in the SWS profile.
Figure 16.
Plotted foundation and soil settlement by ground profile for J1 and J2 (mm). The highest displayed point of each J1 series corresponds to CLS for the foundation settlement and SWS for the soil settlement. These categorical plot positions are not spatial coordinates of field maxima.
3.5. Reinforcement Stress
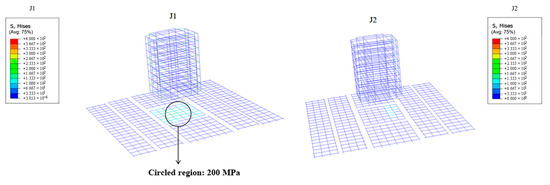
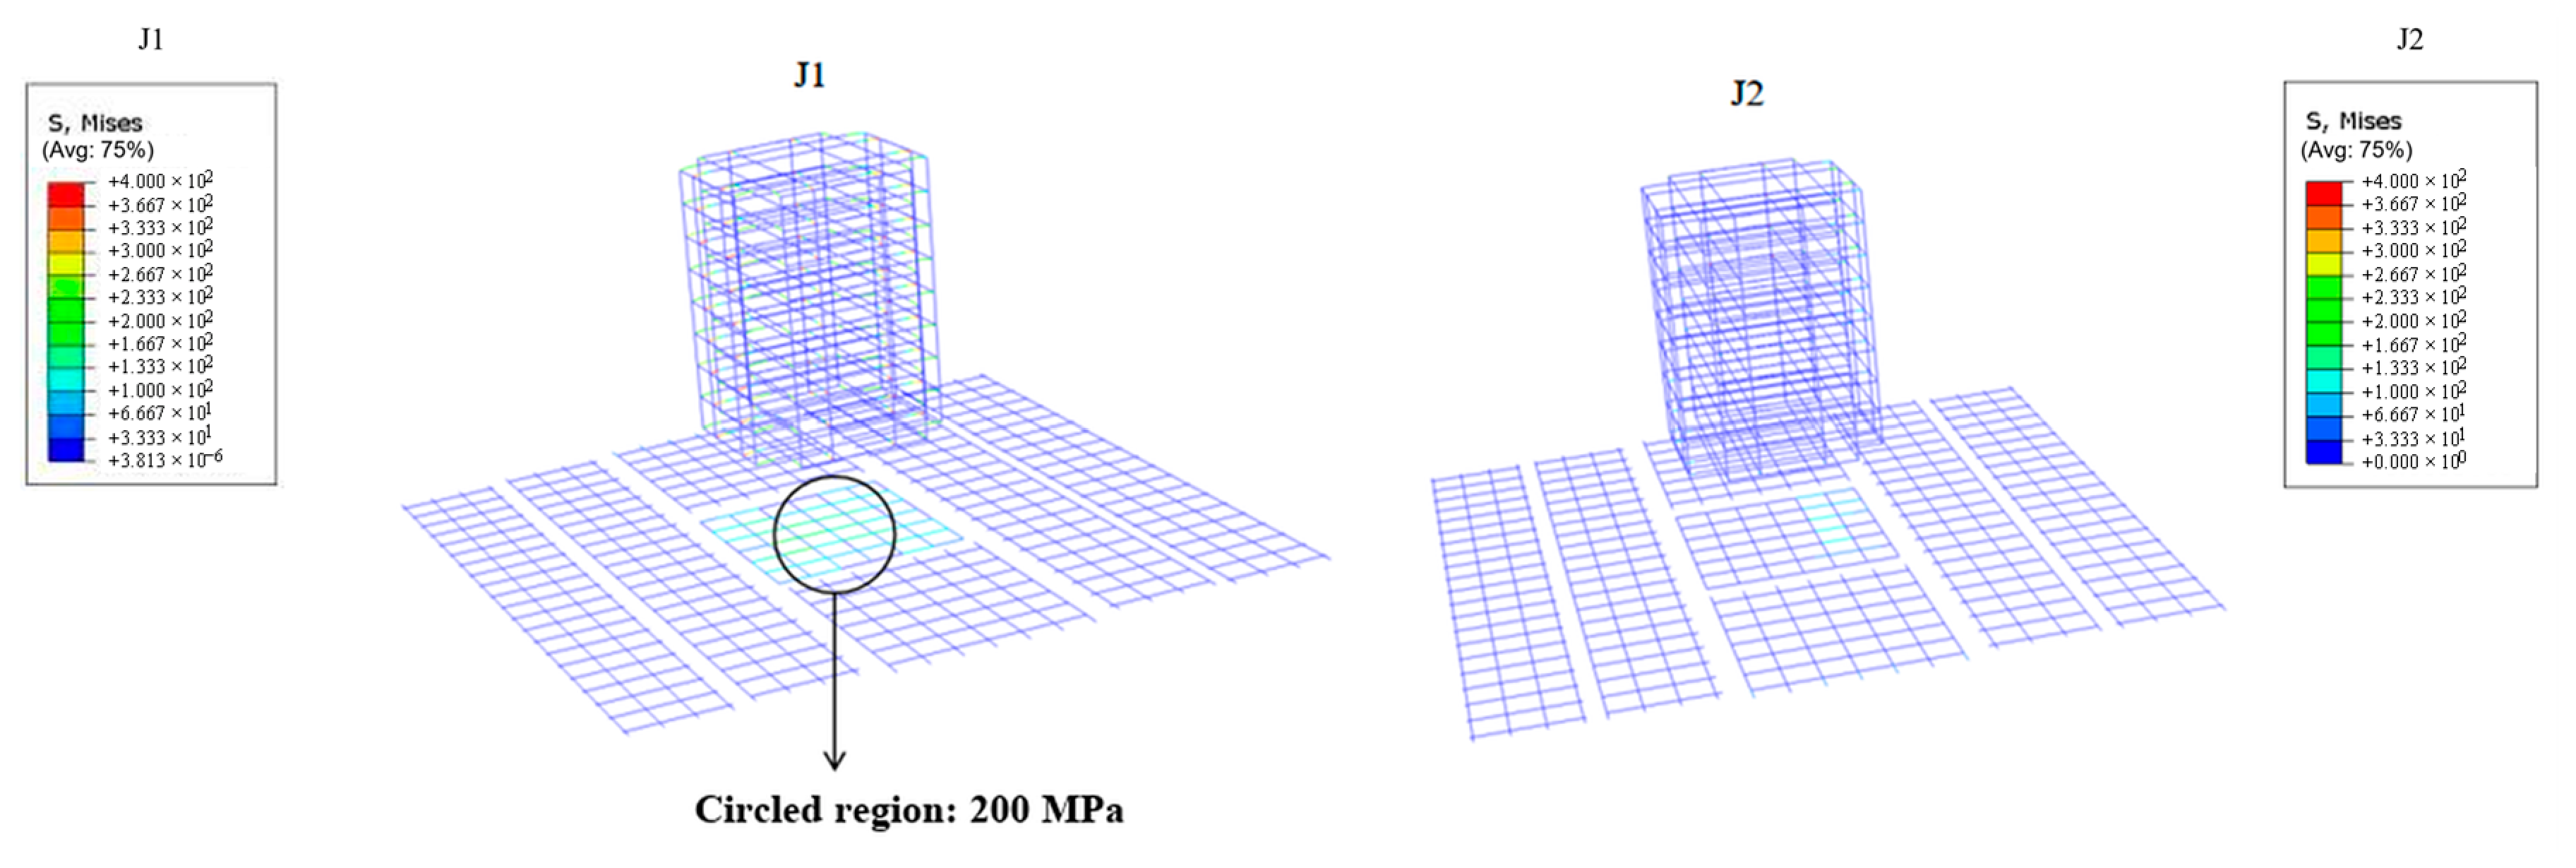
Figure 17 shows the reinforcement stress distributions after static loading for cases J1 and J2 in the CLS profile, which produced the largest settlement. The contour range was limited to 400 MPa to facilitate a consistent comparison between the two cases. The displayed high-stress regions are interpreted together with the prescribed constitutive response. Stress concentrations are mainly observed beneath the pedestal and near the pedestal–footing transition, with a more extensive high-stress region in case J1. Additional localized stress concentrations occur in the outer legs of the six-leg ties and are associated with load transfer through the reinforcement cage.
Figure 17.
Reinforcement von Mises stress for J1 and J2 in CLS (MPa). The common display limit is 400 MPa. The outlined regions highlight local stress concentrations; the color-scale limit does not independently identify the integration-point maximum.
The localized reinforcement yielding beneath the pedestal occurs under the fundamental load combinations, which contain larger design actions than the corresponding characteristic combinations. Under the characteristic load combinations, the reinforcement remains within the elastic range, indicating that yielding is not expected under the corresponding service-level actions.
The yielding is a localized bearing effect at the pedestal–footing transition rather than a global flexural mechanism, and it motivates the confinement and anchorage detailing priorities discussed in Section 3.7.2; re-proportioning the baseline reinforcement, which satisfies the design checks of Section 2.3, is deferred to the follow-up optimization.
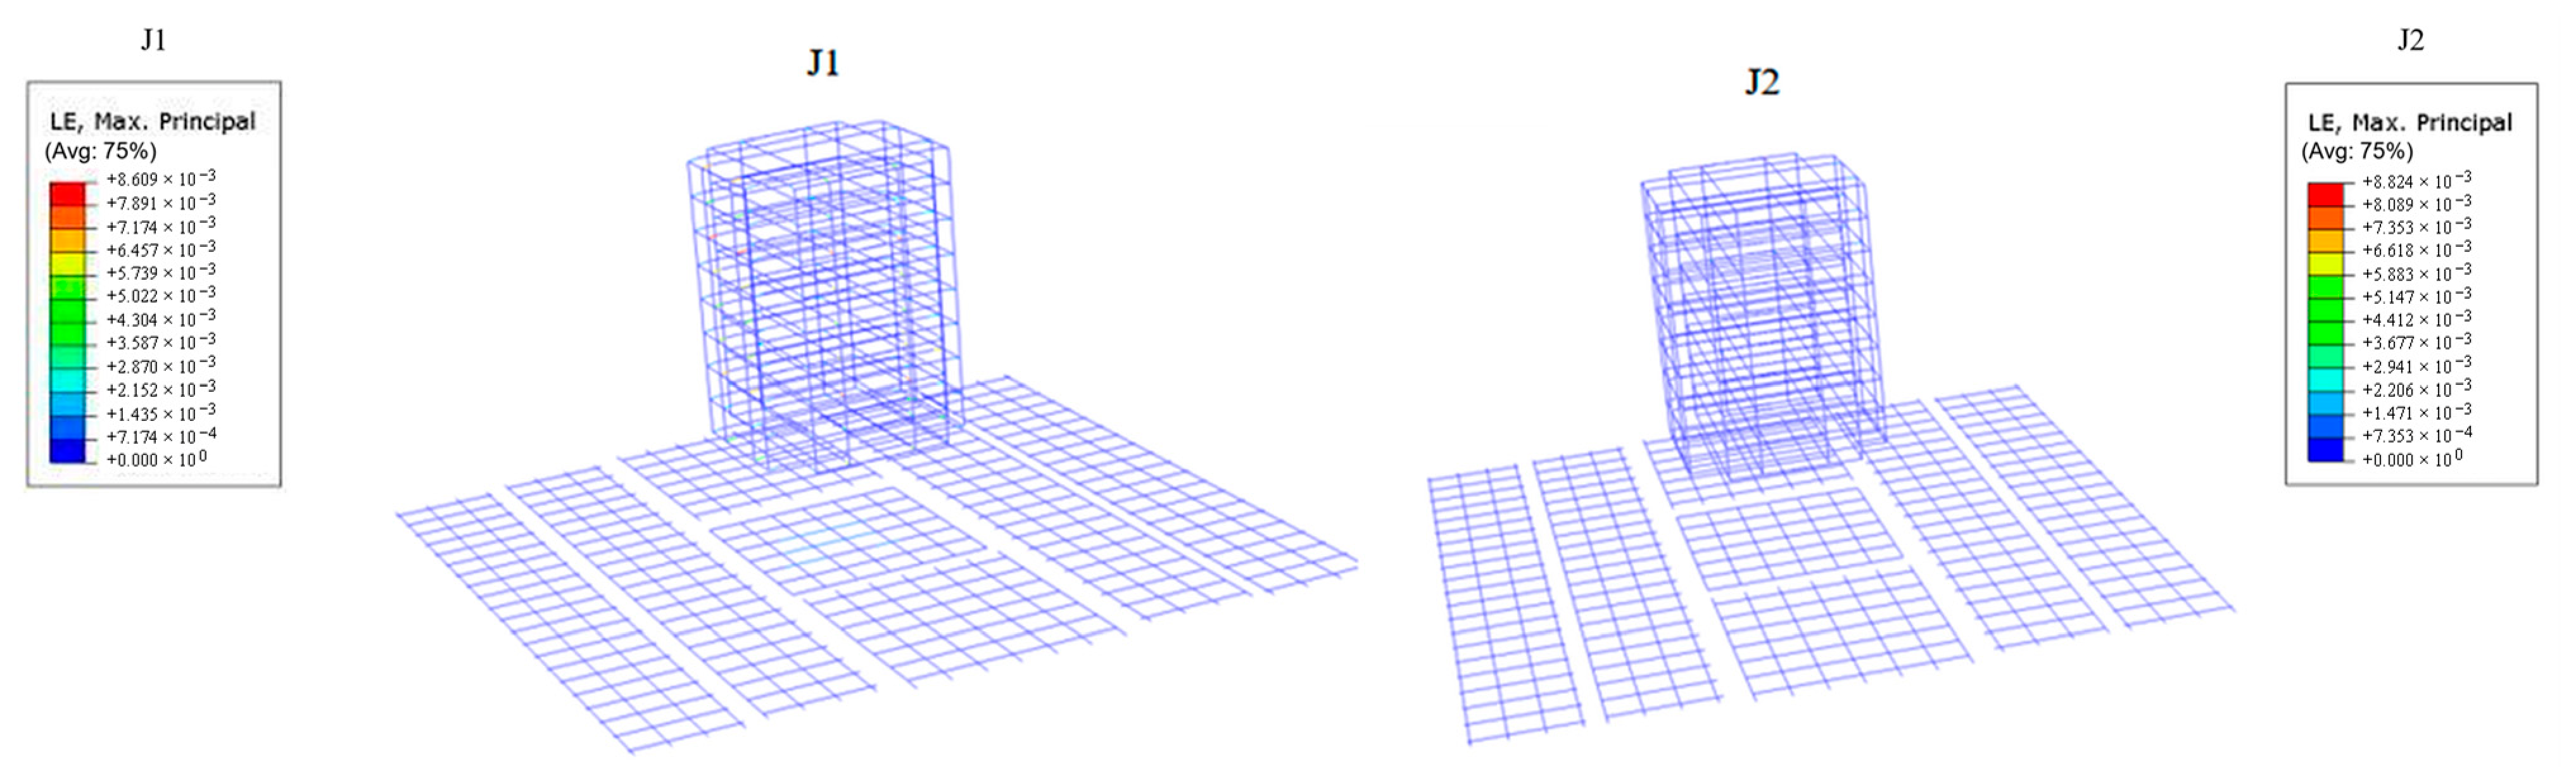
The true-strain contours in Figure 18 show localized reinforcement deformation. The joint-contact and reinforcement responses are considered together when identifying critical details.
Figure 18.
True-strain fields in the reinforcement. Panels correspond to CLS load cases J1 and J2.
3.6. Assembly Deformation, Damage, and Joint Response
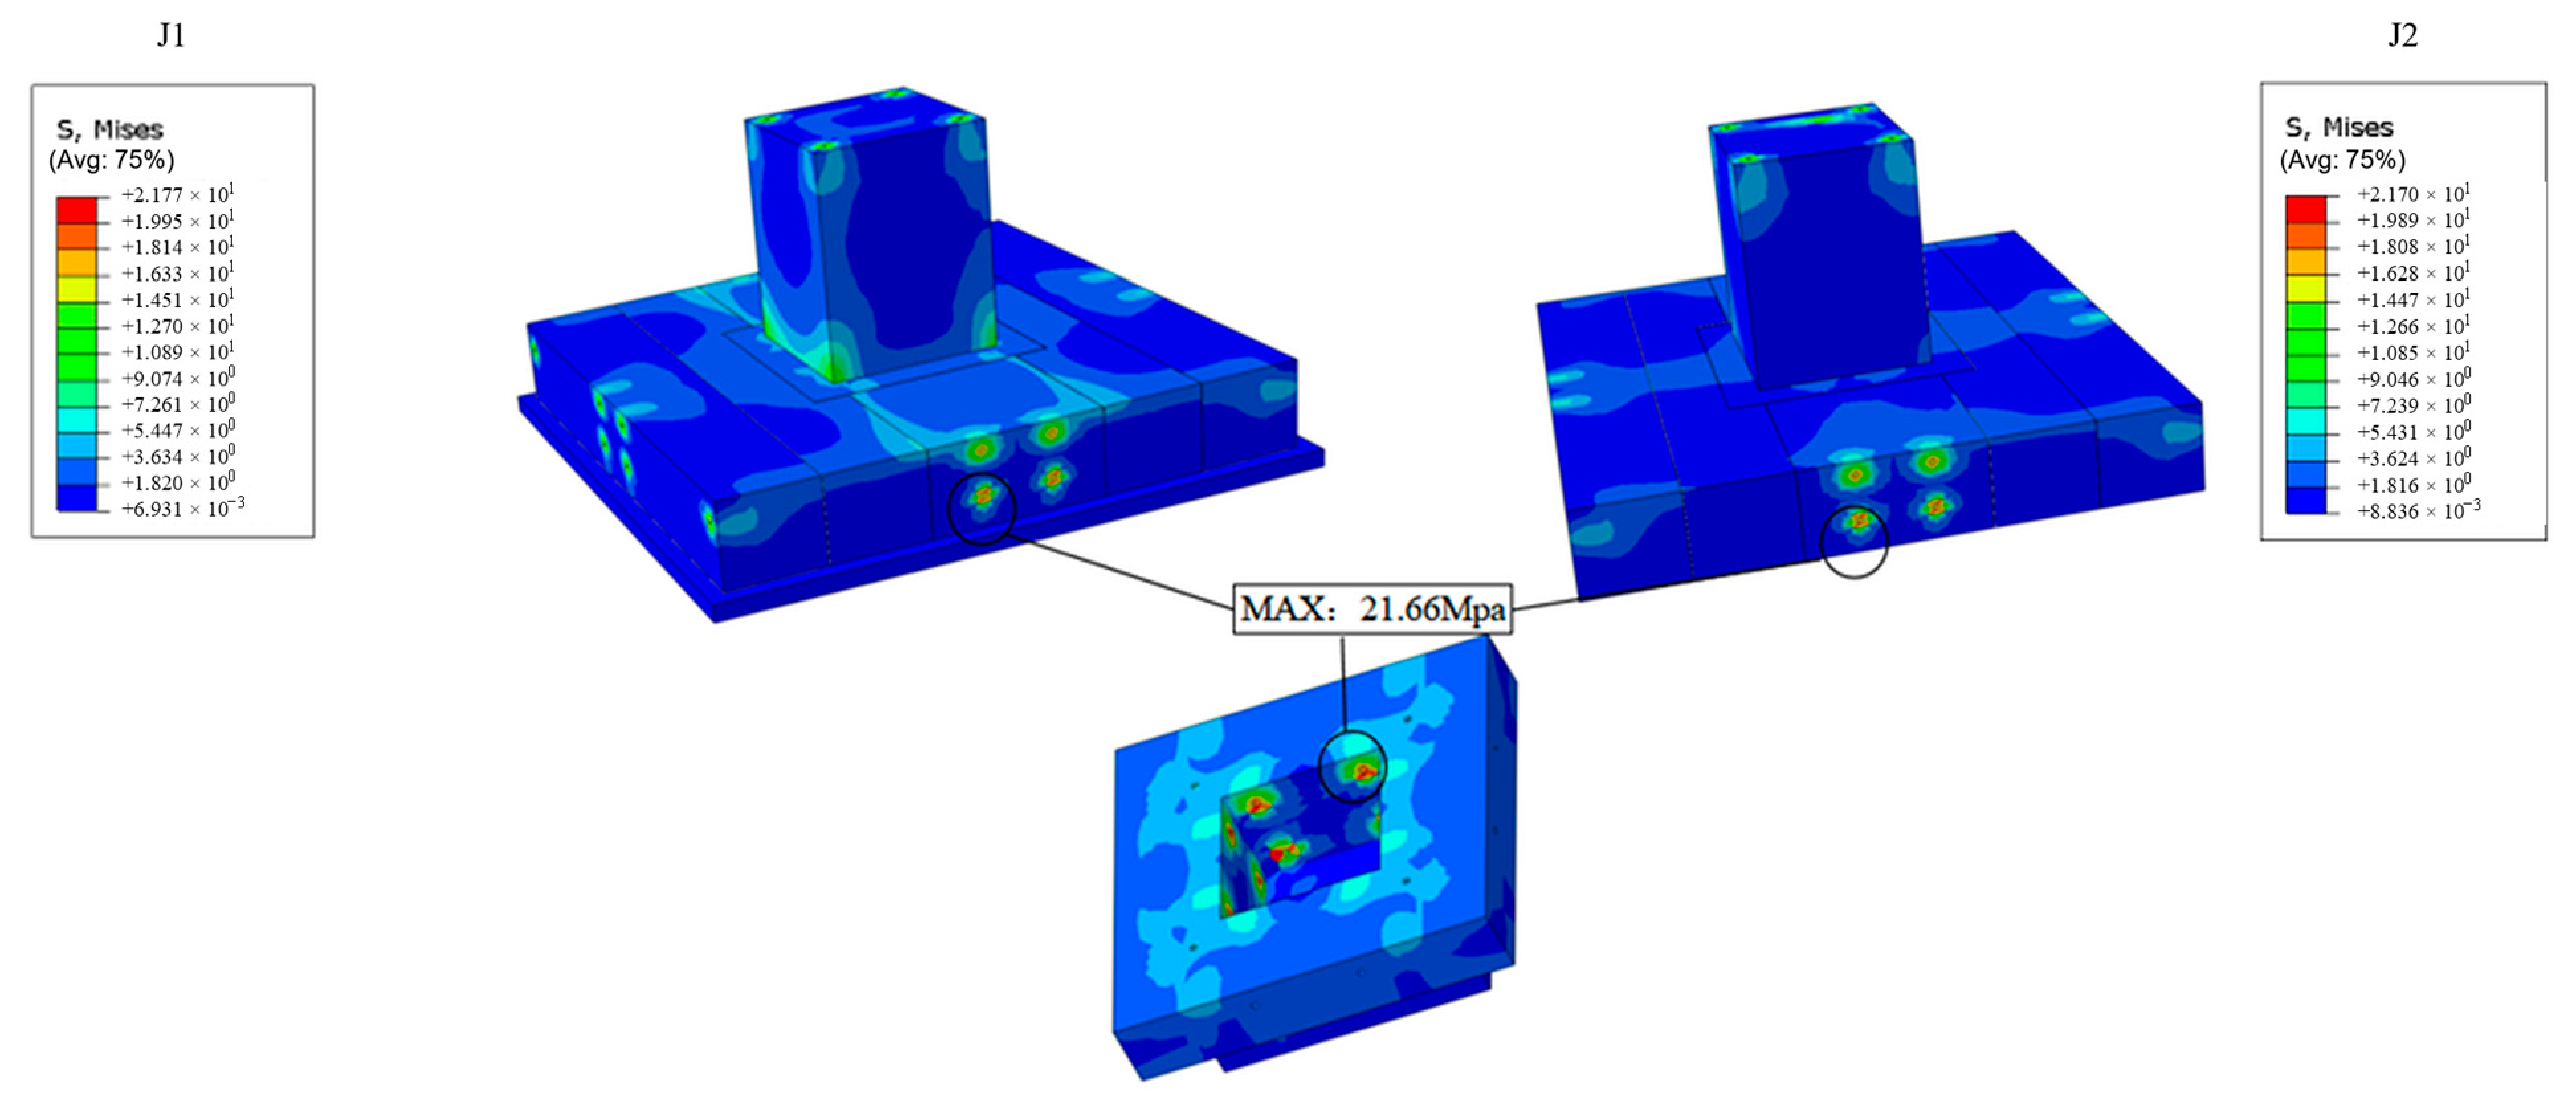
Cases J1 and J2 in the CLS profile were selected for detailed assessment because they produced the largest settlements. The other cases showed similar but smaller stress, strain, and damage responses. Concrete was predominantly in compression, with stress concentrations at the anchorages and interfaces between precast blocks (Figure 19). The maximum reported compressive stress was 21.66 MPa in both cases and occurred in the footing slab beneath the pedestal. This value is not compared directly with the C30 grade designation because cube strength, uniaxial CDP peak strength, and design strength are distinct quantities.
Figure 19.
Concrete stress fields for the governing CLS cases. Panels correspond to CLS load cases J1 and J2.
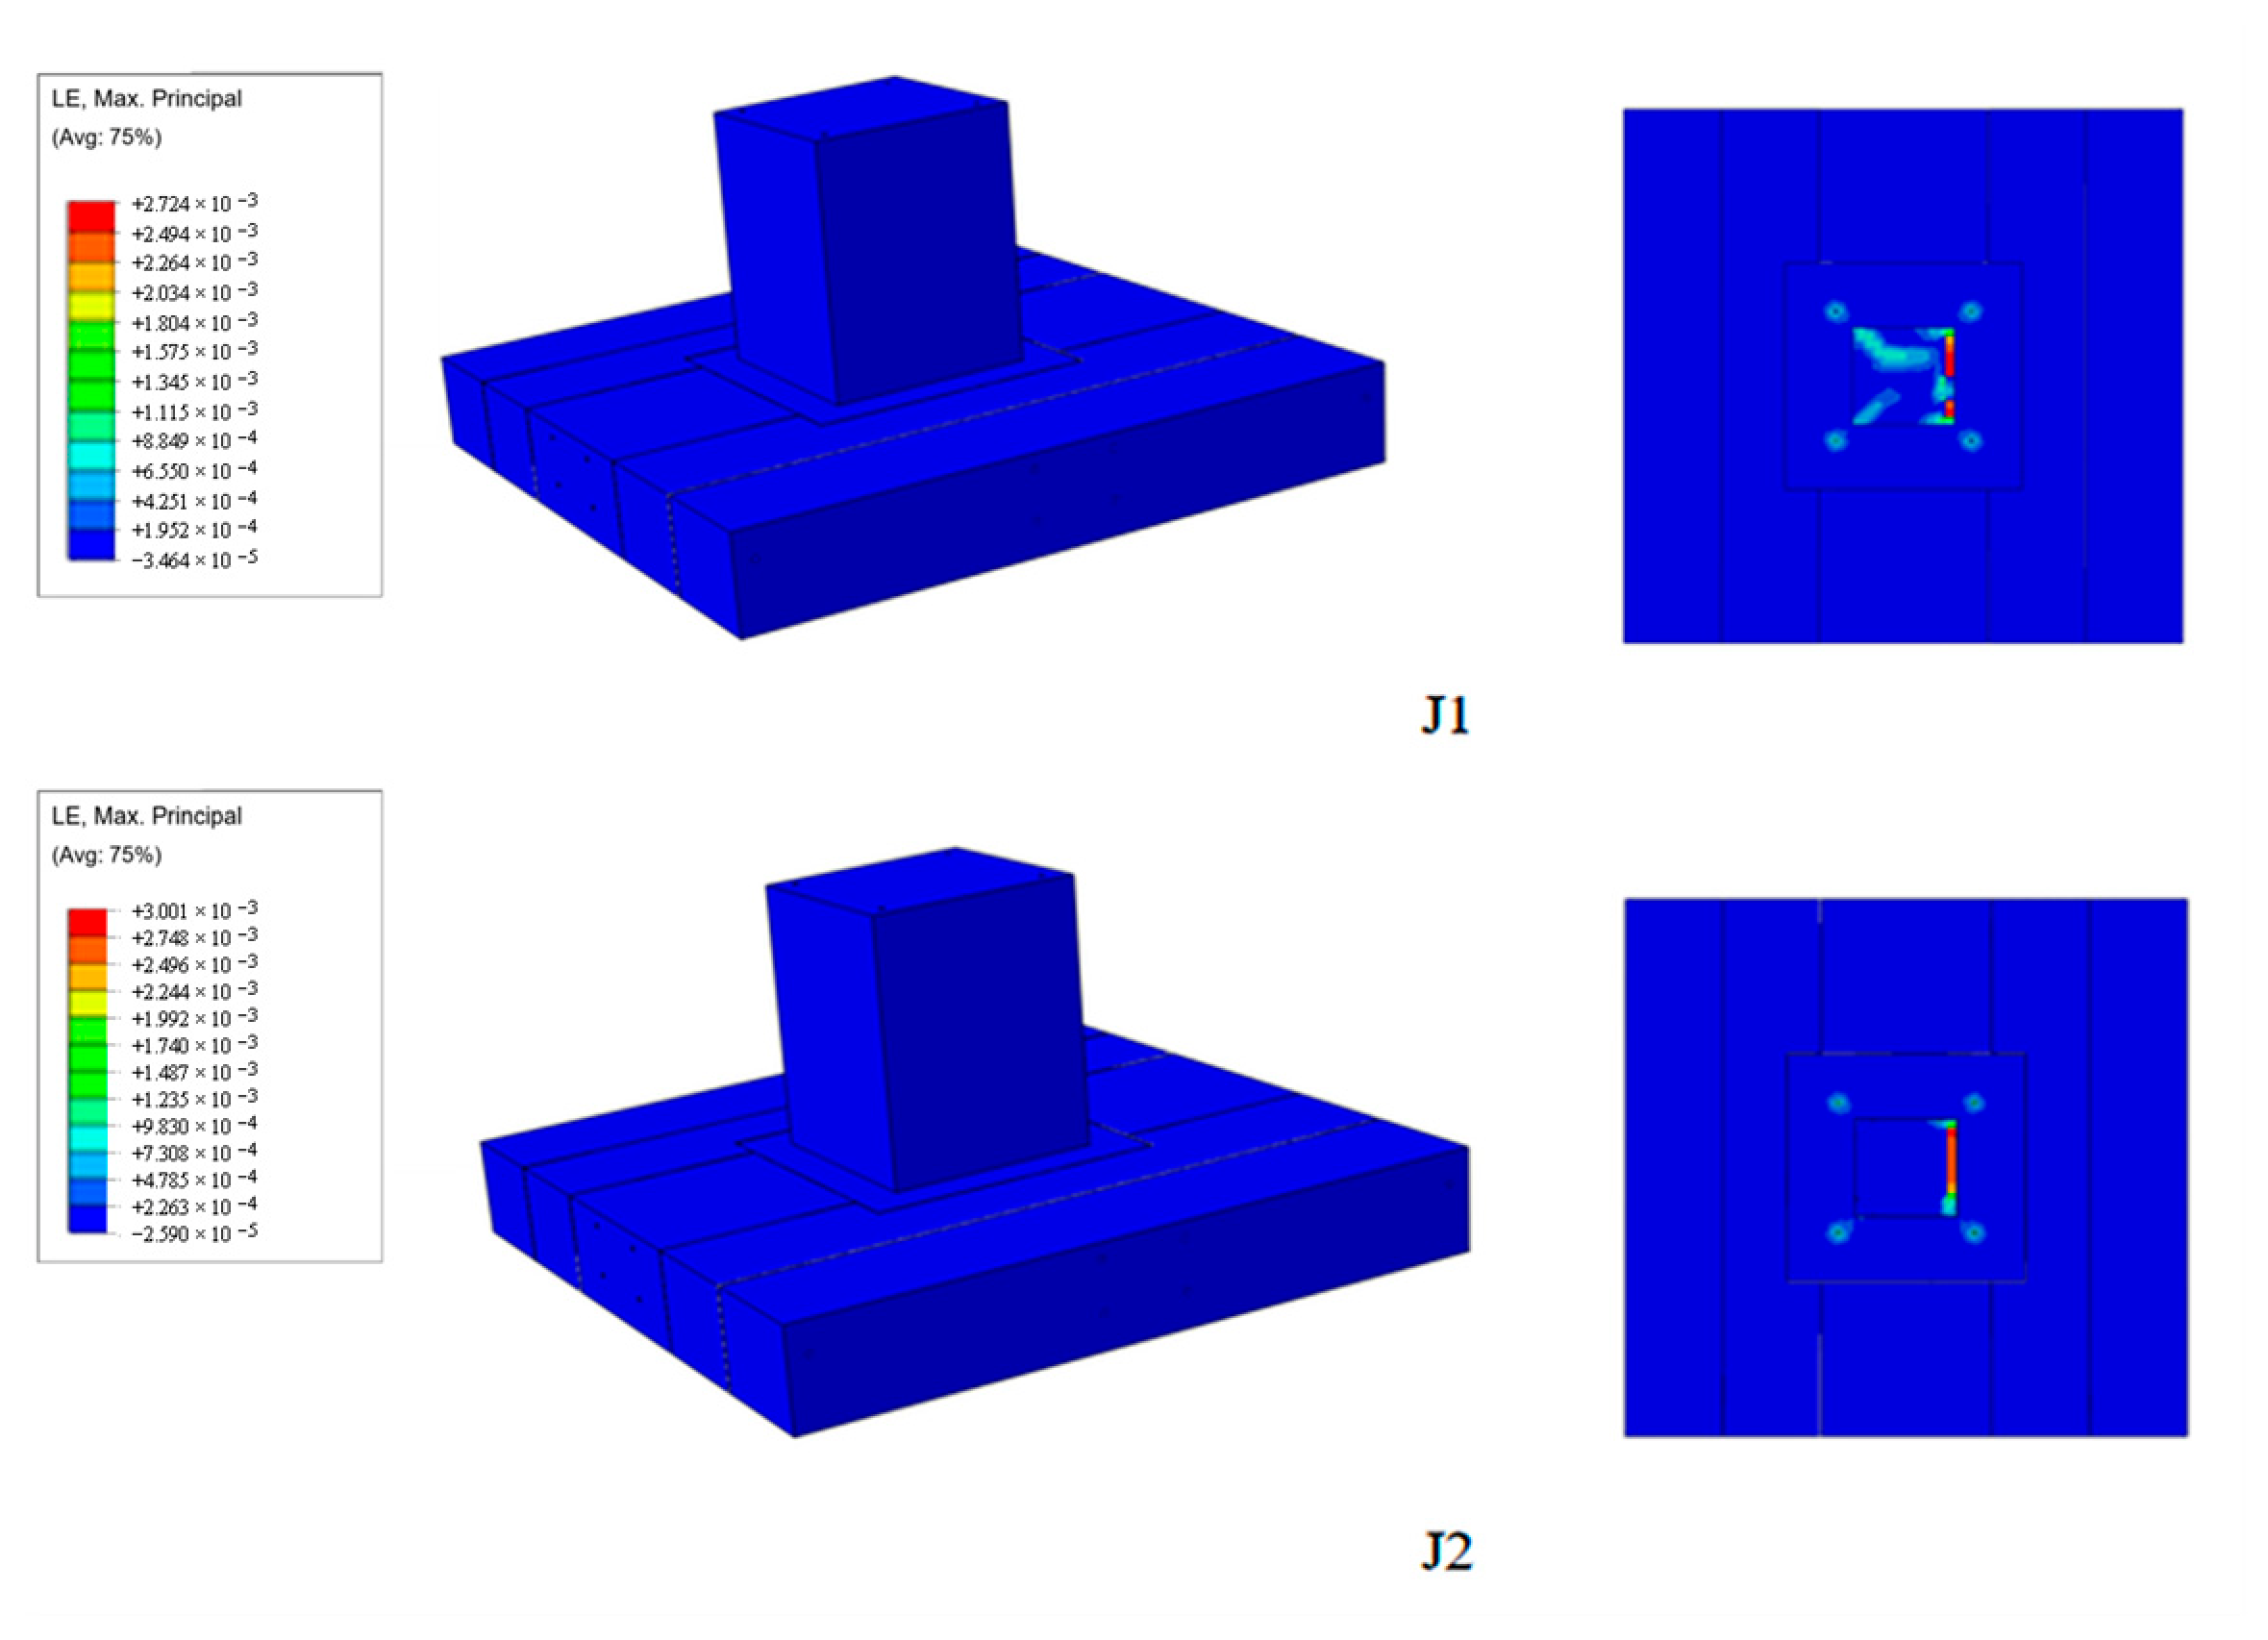
Figure 20 and Figure 21 show the true strain and damage fields for cases J1 and J2 in the CLS profile. The precast slab block beneath the pedestal develops substantially larger true strain than the remainder of the footing. The strain is also larger on the side toward the applied horizontal force than on the opposite side.
Figure 20.
Concrete true-strain fields for the governing CLS cases. Panels correspond to CLS load cases J1 and J2.
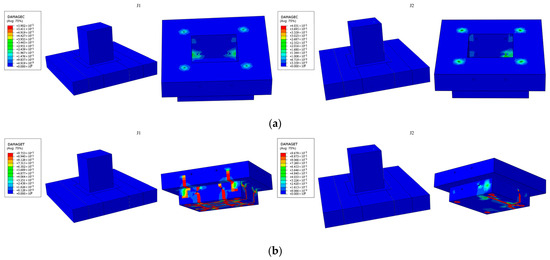
Figure 21.
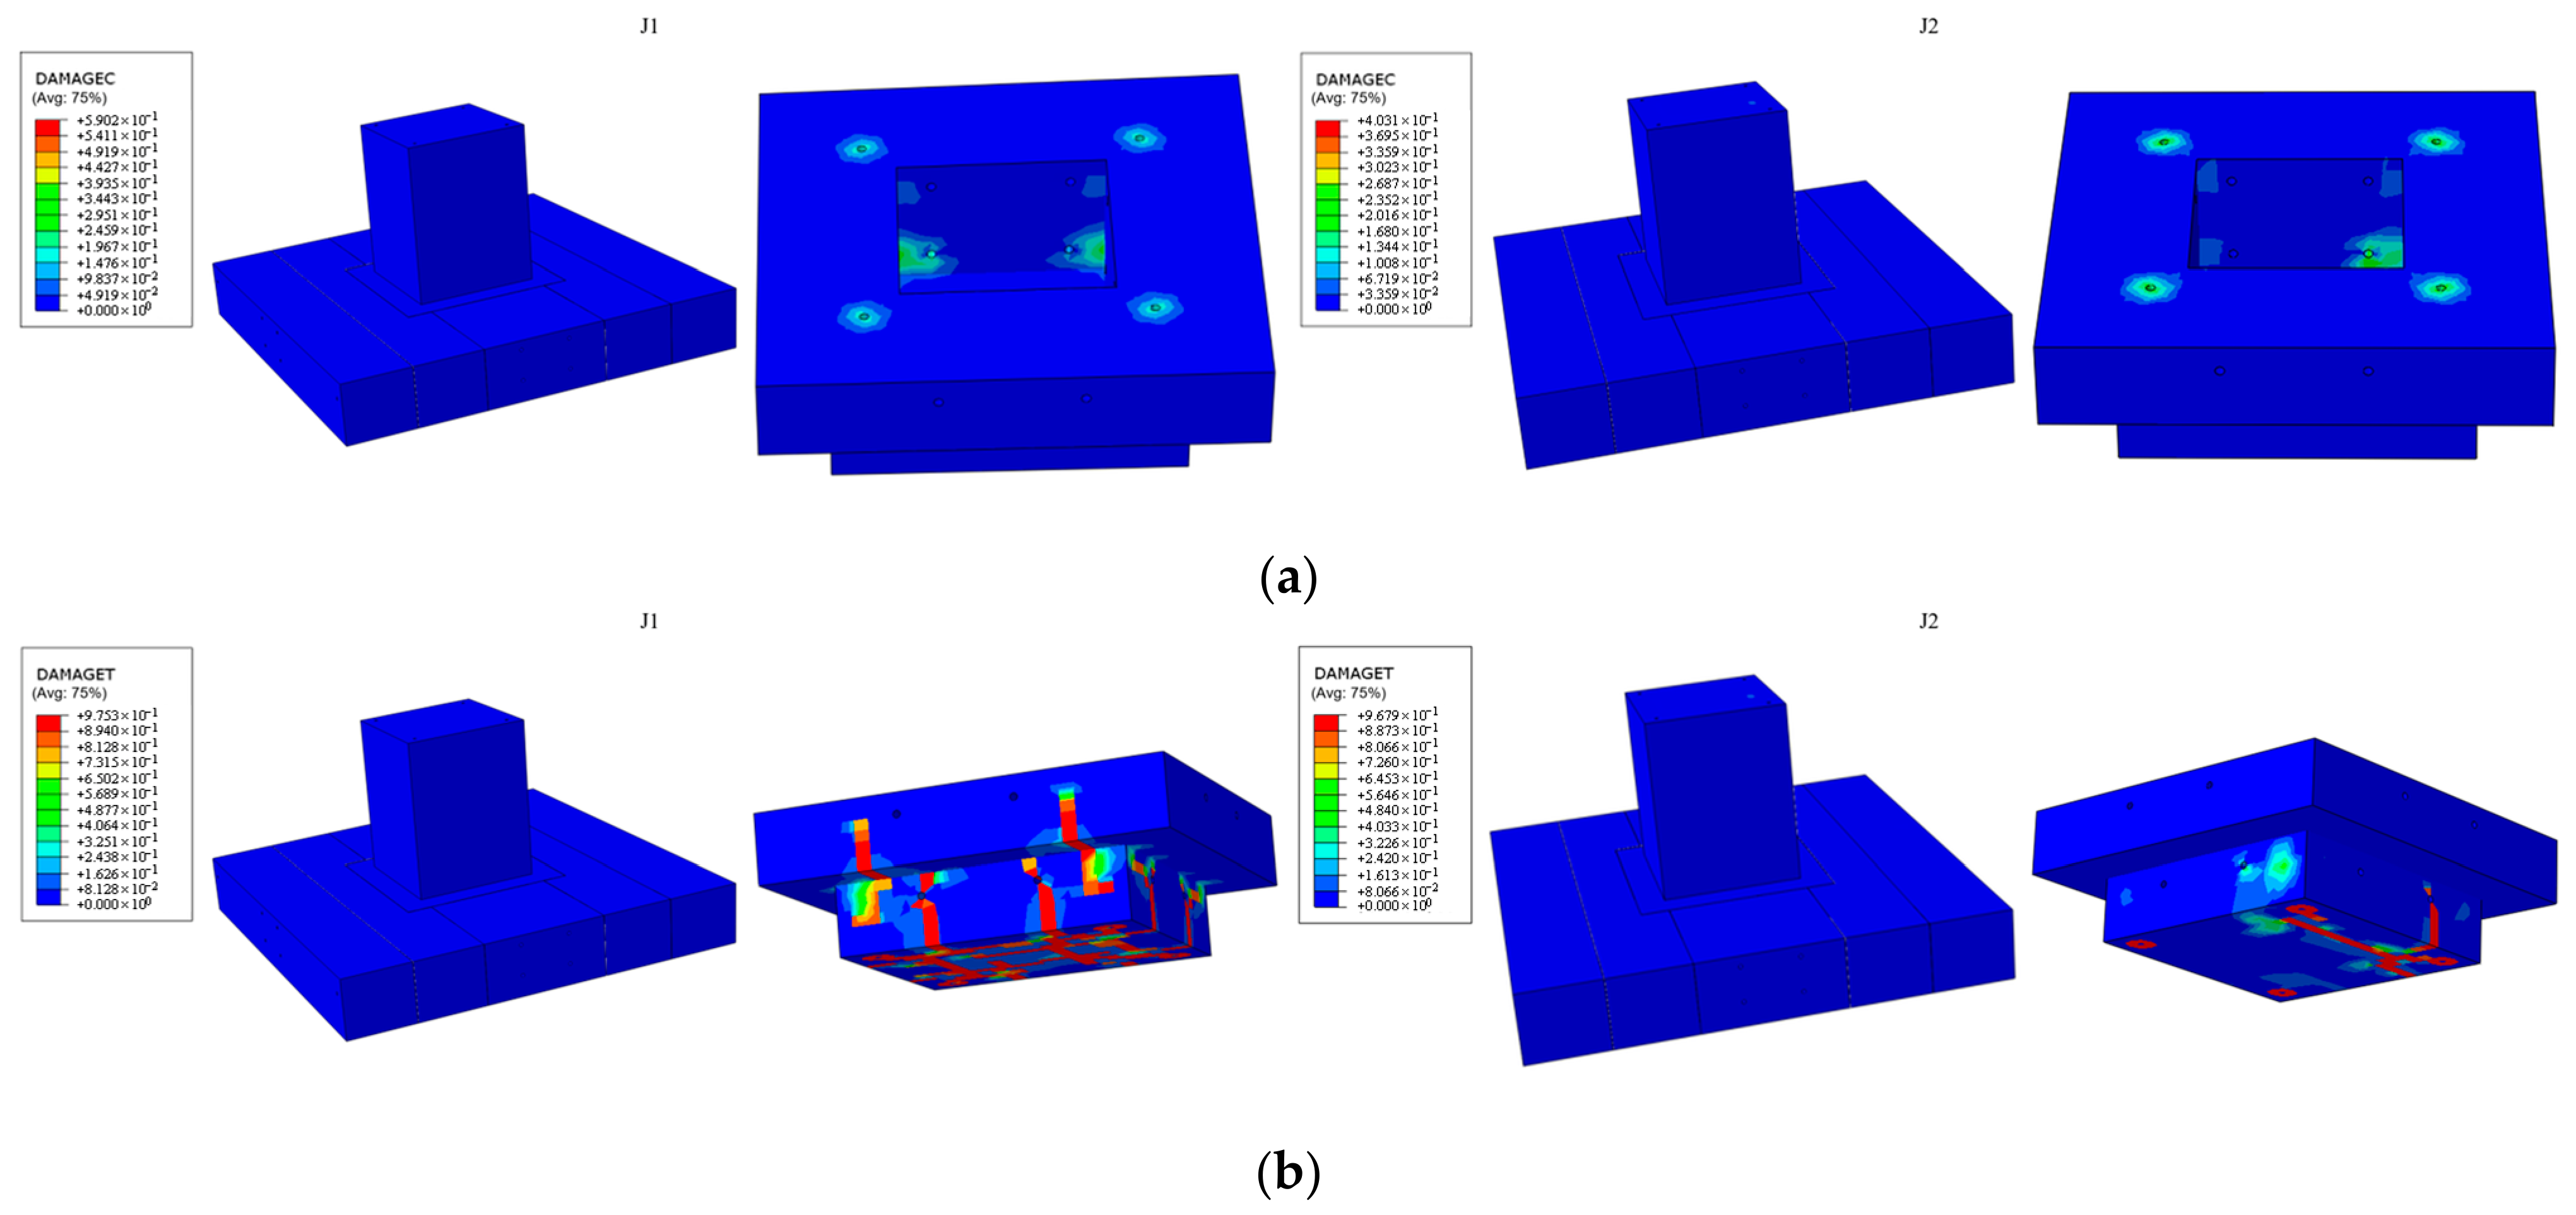
Tensile and compressive damage fields in concrete. (a) Concrete tensile-damage field. (b) Concrete compressive-damage field. The plotted variables are DAMAGET in (a) and DAMAGEC in (b).
The CDP tensile and compressive damage variables, DAMAGET and DAMAGEC, range from 0 for undamaged material to 1 for complete loss of the corresponding stiffness contribution. Tensile damage was concentrated in the slab below the pedestal and reached 0.975 locally, indicating severe stiffness degradation. The high-tensile-damage region is concentrated on the more heavily loaded side of the slab beneath the pedestal, extending toward the slab edge and upward toward the bar ducts. Compression damage was concentrated around the reserved ducts. These results indicate that the anchorage region is a critical area for local detailing and further assessment.
Potential mitigation measures may include localized concrete-strength enhancement, improved confinement and reinforcement detailing, and further assessment of the prestressing-bar diameter and prestress level.
Increased local concrete strength, reinforcement ratio, confinement, and revised bar diameter or prestress should be investigated as potential mitigation measures.
The reported maximum compressive stress of 21.66 MPa should be interpreted in the context of the multiaxial stress state rather than by direct comparison with the uniaxial peak stress alone. The uniaxial compression input reaches a peak stress of 22.8 MPa (Section Constitutive Models and Strength Criteria), while the CDP model accounts for the influence of multiaxial confinement through the biaxial-to-uniaxial compressive yield-stress ratio of 1.16 and . The localized compressive-stress concentration beneath the pedestal is therefore interpreted primarily as a local bearing and load-transfer effect. This interpretation is also consistent with the limited compressive damage observed away from the immediate duct and anchorage regions.
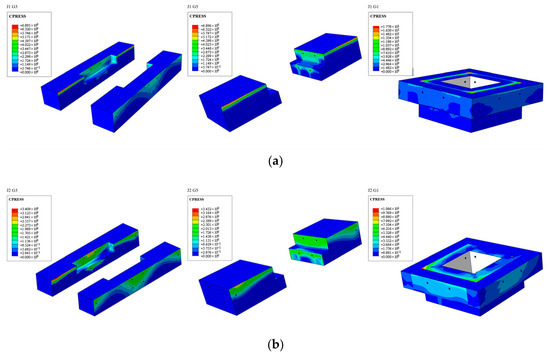
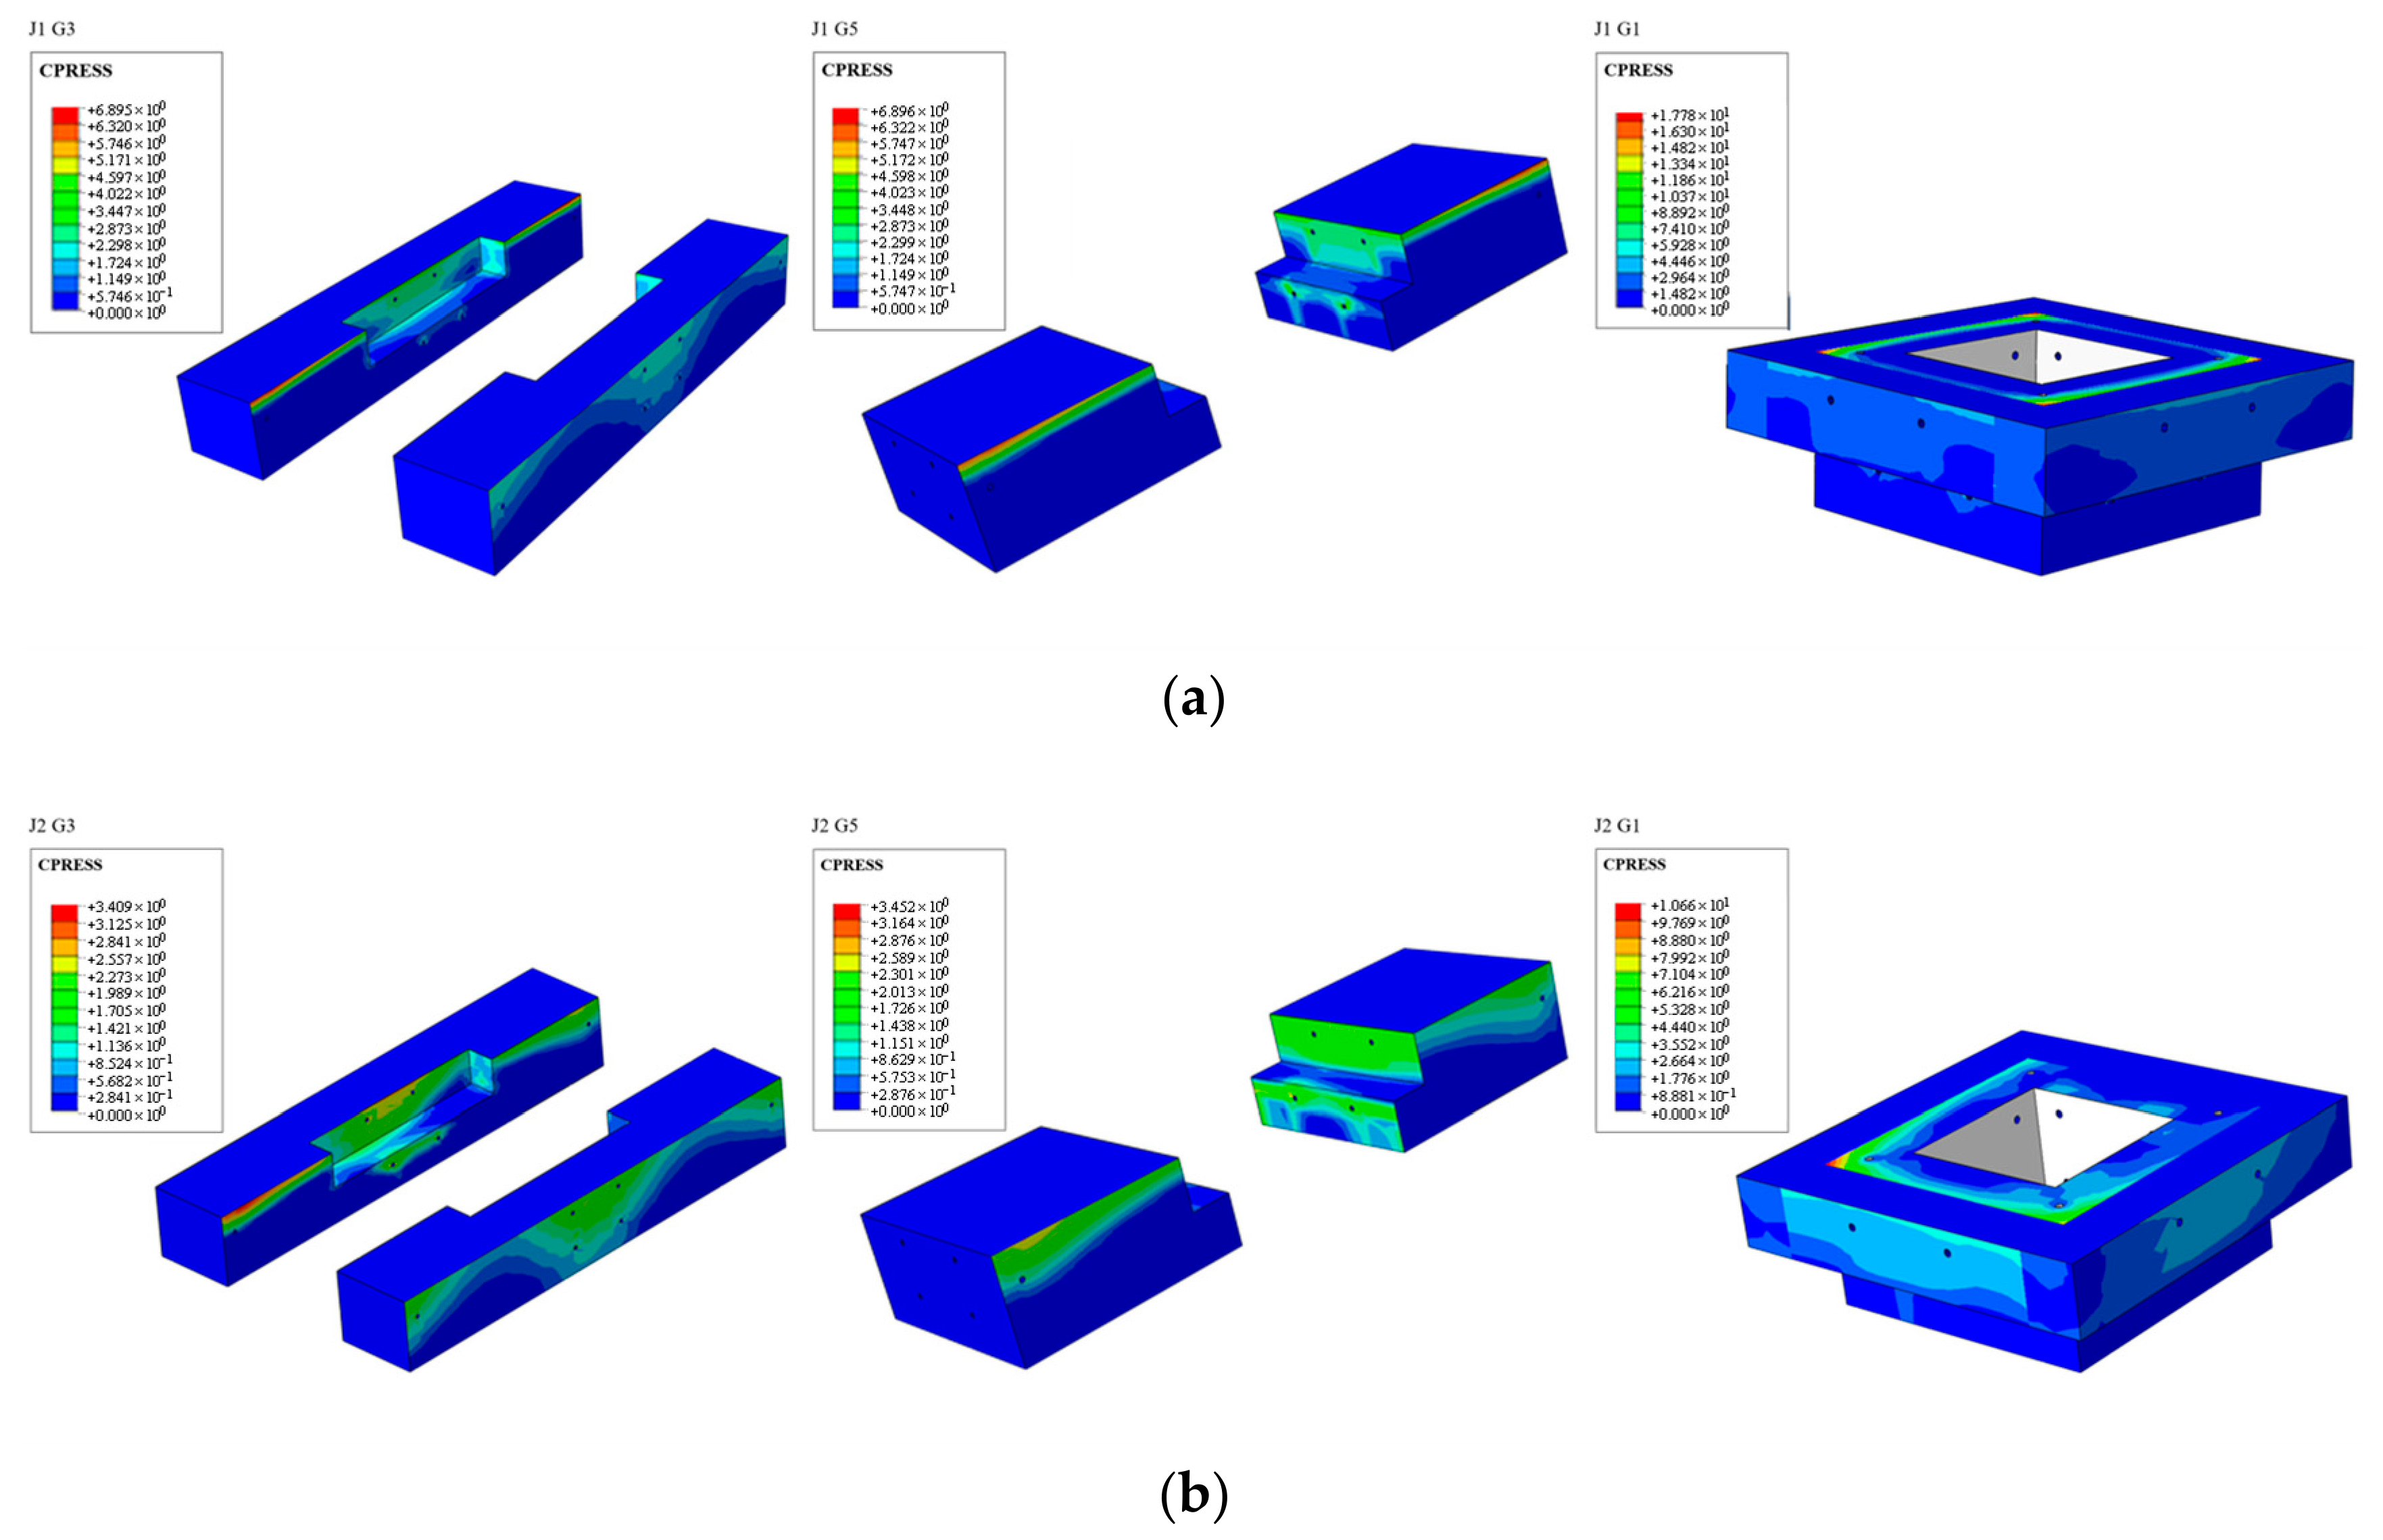
The joint contact responses for cases J1 and J2 in the CLS profile are shown in Figure 22.
Figure 22.
Contact-stress fields at the assembly joints. (a) Joint contact stress in case J1. (b) Joint contact stress in case J2. Both cases use the CLS ground profile.
The interface contact pressures in Figure 22 indicate compressive force transfer between the assembled components. Prestress contributes to this load-transfer mechanism, while the joint response also depends on local opening and tangential relative displacement. Compressive pressure alone is therefore not used as evidence of complete interface closure.
Quantitative contact outputs support this interpretation. Across the 16 design cases, the maximum contact opening (COPEN) at the precast joints is 0.31 mm, localized at the tension-side edge of the joint. This local opening is small relative to the joint dimensions and is consistent with joint rotation under the fundamental load combinations. The negative COPEN values, representing numerical contact penetration, remain below 5 × 10⁻⁴ mm in all cases, indicating negligible penetration relative to the joint dimensions under the adopted hard-contact formulation. The peak contact pressure (CPRESS) reaches 17.78 MPa and is localized around the bearing plates and pedestal edge. This value is of the same order as the nominal bearing stress beneath a 145 × 145 mm plate (210.81 kN over 21,025 mm2, approximately 10 MPa), with the higher local value reflecting edge concentration and moment-induced redistribution. The contact-pressure concentration is therefore interpreted as a localized load-transfer effect. Assessment of local concrete damage should consider contact pressure together with the concrete stress, plastic-strain, and damage fields rather than CPRESS alone.
3.7. Discussion and Engineering Implications
3.7.1. Response Mechanisms and Comparison with Published Evidence
The maximum foundation settlements across the investigated cases range from approximately 1.0 mm in RS to 16.2 mm in CLS, highlighting the influence of ground conditions on the response of the assembled foundation. Deformation of the supporting soil redistributes contact reactions and affects the relative movements between adjacent precast components, thereby linking global settlement to local connection demand. This interpretation is consistent with the importance of soil–structure interaction and construction stages demonstrated by Patrício et al. [18]. In the present study, the four ground profiles represent different combinations of stratigraphy and constitutive parameters, and the resulting settlement differences characterize the response to these combined ground conditions.
Published studies on precast connections provide further insight into the observed force-transfer mechanisms. Baghdadi et al. [5] reported that the minimum and maximum capacities of eight dry-joint frame configurations were 50% and 106% of the monolithic reference, respectively, demonstrating the influence of connection geometry on structural performance. Nascimbene and Bianco [12] combined three full-scale cyclic connection tests with calibrated three-dimensional models, highlighting the importance of connection details and local nonlinear behavior. These findings support examining the anchorage regions, threaded-bar ducts, and interfaces as integral parts of the assembled load path. Table 8 summarizes the research scope, key findings, and relevance of these studies to the present foundation. The comparison focuses on response mechanisms and modeling considerations while accounting for differences in structural configuration, loading, and support conditions.
Table 8.
Evidence and interpretation in the present study and selected published studies.
The supplementary J1 soil-mesh assessment provides a quantitative comparison of the global load–settlement response. At the prescribed compressive load of 895.6 kN, the coarse, medium, and fine meshes give loading-point settlement increments of 15.968, 15.174, and 16.104 mm, respectively. The corresponding endpoint secant stiffnesses, calculated as applied load divided by settlement increment, are 56.09, 59.02, and 55.61 kN/mm. The settlement increments change by −4.97% from the coarse to the medium mesh and by +6.13% from the medium to the fine mesh, indicating a non-monotonic variation over the examined discretizations. These results quantify the sensitivity of the loading-point response to the selected soil meshes. The structural mesh was retained, and the discretization details, displacement reference, and solver releases are documented in Appendix B.
3.7.2. Detailing Priorities
The reported CLS concrete compressive stress maximum of 21.66 MPa and local tensile-damage value of 0.975 identify different aspects of demand near the pedestal and ducts. The damage variable is dimensionless and represents stiffness degradation in the adopted CDP model; it is not a crack width or a percentage loss of foundation capacity. Together with the reinforcement stress concentrations, these outputs support the following detailing priorities. Their expected effects follow the force-transfer mechanisms, while the magnitude of improvement remains a question for controlled design comparisons.
Local confinement should be examined beneath the pedestal and around the threaded-bar ducts. Closed ties and transverse reinforcement placed across regions of concentrated tensile demand may improve the continuity of the local load path. Their spacing and anchorage should be checked together with clear cover and assembly tolerances, rather than increasing the total reinforcement ratio without regard to where demand concentrates.
Anchorage spacing, edge distance, and bearing-plate dimensions should be assessed as a coordinated detail. Separating concentrated transfer zones and distributing the bearing force over an appropriate area may reduce local pressure gradients. The effect must be checked against duct congestion, component dimensions, and plate flexibility; no optimum spacing or plate size is inferred from the present fixed configuration.
A local concrete-strength or toughness upgrade may be evaluated in regions where the damage contours indicate concentrated demand. Such a modification could target the anchorage-region response without requiring changes to all precast components. However, higher compressive strength alone does not determine tensile-softening behavior, so any revised tensile and compressive constitutive properties and their interaction with confinement should be evaluated together.
Prestress should be considered jointly with these detailing measures. Increasing clamping can promote frictional transfer, but it also changes anchorage bearing demand and the initial stress state before external loading. The approximately 425.7 MPa local threaded-bar stress maximum reported after prestressing is therefore used as a stress-level observation, not as an optimization target or proof of uniform axial stress.
3.7.3. Modeling Assumptions and Further Assessment
For the collapsible-loess profile, the adopted parameter set in Table 6 is treated as a simplified degraded-ground representation rather than as a measured post-collapse material state. As stated in Section Material Properties, the analyses do not simulate wetting-induced collapse, pore-pressure evolution, seepage, or consolidation; the wetting-induced collapse strain itself is therefore not included in the computed settlement. The reported CLS settlement should accordingly be interpreted as the mechanical response of the foundation under the adopted CLS parameter set, rather than as an estimate or upper bound of the total field settlement: where collapse deformation is significant, the total settlement may exceed the computed value, and the settlement path during wetting depends on the wetting rate and stress history. A fully coupled hydro-mechanical formulation with a collapse-capable constitutive model is identified as follow-up work in Table 9.
Table 9.
Model scope and corresponding follow-up assessments.
The manufacturing complexity of the multi-part precast system should be considered together with the cost and carbon drivers relevant to remote substation construction. The precast scheme shifts concrete production to a controlled plant environment, which may improve production consistency, reduce on-site curing-water demand, and reduce some site-based formwork and curing activities. It may also reduce the duration of on-site assembly operations, although the actual benefit depends on transport logistics, lifting arrangements, and site access conditions. These potential advantages are accompanied by additional burdens associated with plant energy use, mold fabrication, and component transportation. By contrast, the cast-in-place scheme avoids precast molds and component transportation but requires more extensive on-site concrete placement, formwork, and curing operations. No overall life-cycle cost or embodied-carbon advantage is claimed in the present study. A quantitative cradle-to-site comparison, including transport distance, plant energy, construction duration, and material use, is identified as follow-up work in Table 9.
Table 9 links the main modeling assumptions to the response quantities that they affect and to focused follow-up assessments. The precast interfaces use hard normal contact and prescribed friction, rather than a blanket tied-interface assumption. Thermal contraction is used only to impose prestress; the analyses reported here concern mechanical loading. This scope provides a basis for assessing the selected foundation and for identifying which additional evidence would be relevant to a broader design application.
4. Conclusions
This study investigated the static response of a post-tensioned precast concrete isolated foundation for substation equipment through 16 finite-element analyses covering four ground profiles and four prescribed load cases. A supplementary soil-mesh sensitivity assessment was conducted for case J1 in the LSS profile. The main conclusions are as follows:
(1) Ground conditions substantially affected foundation settlement and deformation compatibility between the assembled components. The maximum settlements across the investigated cases ranged from approximately 1.0 mm in RS to 16.2 mm in CLS, with the largest settlement occurring under J1 in CLS. The layered SWS profile exhibited a more pronounced difference between soil and foundation displacements, highlighting the importance of considering subsurface stratigraphy in addition to near-surface soil properties.
(2) The two load sets produced distinct deformation and force-transfer patterns. The larger compressive axial force in load set 1 concentrated settlement beneath the pedestal, whereas the larger horizontal forces and moments in load set 2 shifted deformation toward the loaded edge. The long horizontal prestressing bars developed the highest stresses among the threaded bars, reflecting their role in connecting the major footing components and accommodating differential movement. These results identify the continuity of the assembled load path as a key consideration in connection design.
(3) Local response was concentrated beneath the pedestal, near the pedestal–footing transition, and around the prestressing-bar ducts and anchorages. In the examined CLS cases, the reported maximum concrete compressive stress was 21.66 MPa, and the local tensile-damage variable reached 0.975. Together with the reinforcement stress concentrations, these results identify local confinement, anchorage arrangement, and bearing-force distribution as priorities for detailing refinement. Global settlement and local connection demand should therefore be assessed together.
(4) For the supplementary J1 assessment in LSS, the coarse, medium, and fine soil meshes produced loading-point settlement increments of 15.968, 15.174, and 16.104 mm, respectively, at a compressive load of 895.6 kN. The successive differences were −4.97% and +6.13%, showing a non-monotonic sensitivity to soil discretization with the structural mesh held fixed. This comparison provides a quantitative basis for interpreting the global settlement response over the examined mesh range.
Overall, the analyses link ground-dependent deformation to force redistribution and localized demand in the assembled foundation. The resulting design priorities are to account for the supporting ground profile, maintain effective force transfer between precast components, and strengthen the critical pedestal and anchorage regions. Within the stated modeling bounds, these findings should be read as a preliminary parametric exploration under prescribed design actions; they are intended to inform detailing refinement and the planning of validation tests, rather than to constitute definitive structural validation of the system.
Author Contributions
Conceptualization, G.W. and F.F.; methodology, G.W. and X.Z.; software, X.Z.; validation, Y.M. and D.S.; formal analysis, Y.M. and D.S.; investigation, Y.M. and Q.Z.; resources, Q.S., G.W., and F.F.; data curation, D.S.; writing—original draft preparation, D.S.; writing—review and editing, G.W., F.F., W.S., X.Z., Y.M., D.S., Q.Z., and Q.S.; visualization, Q.Z. and Y.M.; supervision, Q.S.; project administration, Q.S., G.W.,F.F., and W.S.; funding acquisition, G.W. and Q.S. All authors have read and agreed to the published version of the manuscript.
Funding
This research was funded by the project “2025 Annual Science and Technology Project Plan of China Energy Engineering Group Shanxi Electric Power Engineering Co., Ltd.”, grant number 14-K2025-28-T10, and the National Natural Science Foundation of China, grant number 51978570.
Institutional Review Board Statement
Not applicable.
Informed Consent Statement
Not applicable.
Data Availability Statement
The original contributions presented in this study are included in the article. Further inquiries can be directed to the corresponding author.
Acknowledgments
The authors would like to express their sincere gratitude to China Energy Engineering Group Shanxi Electric Power Engineering Co., Ltd., Taiyuan 030000, China, for providing valuable engineering data, technical support, and constructive suggestions during this study. The authors also appreciate the assistance of relevant engineers and technical staff in the development of the structural scheme and the interpretation of the numerical results.
Conflicts of Interest
Gang Wang, Fei Fan, Weixiao Shi, and Xiaodong Zhu were employed by China Energy Engineering Group Shanxi Electric Power Engineering Co., Ltd., which funded this study and provided engineering data and technical support. The remaining authors declare no conflicts of interest.
Appendix A. Governing Equilibrium and Idealized Contact Conditions
Within each material domain, quasistatic equilibrium is expressed by Equation (A1), where σ is Cauchy stress, ρ is mass density, and b is body-force acceleration.
The displacement and traction conditions are written in Equation (A2), where u is displacement, n is the outward unit normal, and ū and are prescribed displacement and traction on Γu and Γt. The side, base, and pedestal-top conditions are stated in Section 2.4.3.
For the frictional interfaces, let gn be the normal gap, pn the compressive contact pressure, tt the tangential traction, and μ the friction coefficient. Equation (A3) states the ideal unilateral contact and Coulomb bounds. The penalty formulation permits small elastic tangential slip before sliding. Here, a positive normal gap denotes separation.
Embedded reinforcement follows the displacement of its host concrete. Tie constraints impose compatibility at the tied interfaces; these kinematic conditions are distinct from frictional contact.
Appendix B. Soil-Mesh Sensitivity Assessment
J1 in LSS was selected for the supplementary discretization assessment because it represents the load set producing the larger settlement response in the original analysis. All three selected calculations reached the prescribed final load of 895.6 kN. The comparison changes the main-soil discretization while retaining the structural mesh and assigned material tables. B1 and B2 are outside this mesh series and are not included in the supplementary comparison. The software version for all three discretizations is identified as Abaqus 2025 in Table A1.
Table A1.
Actual J1 discretizations and final settlement responses.
Figure A1.
J1 loading-point load–settlement increment curves for the three main-soil meshes in LSS. The prestressed configuration defines zero incremental settlement; the structural mesh is unchanged. All three analyses were performed with Abaqus 2025.
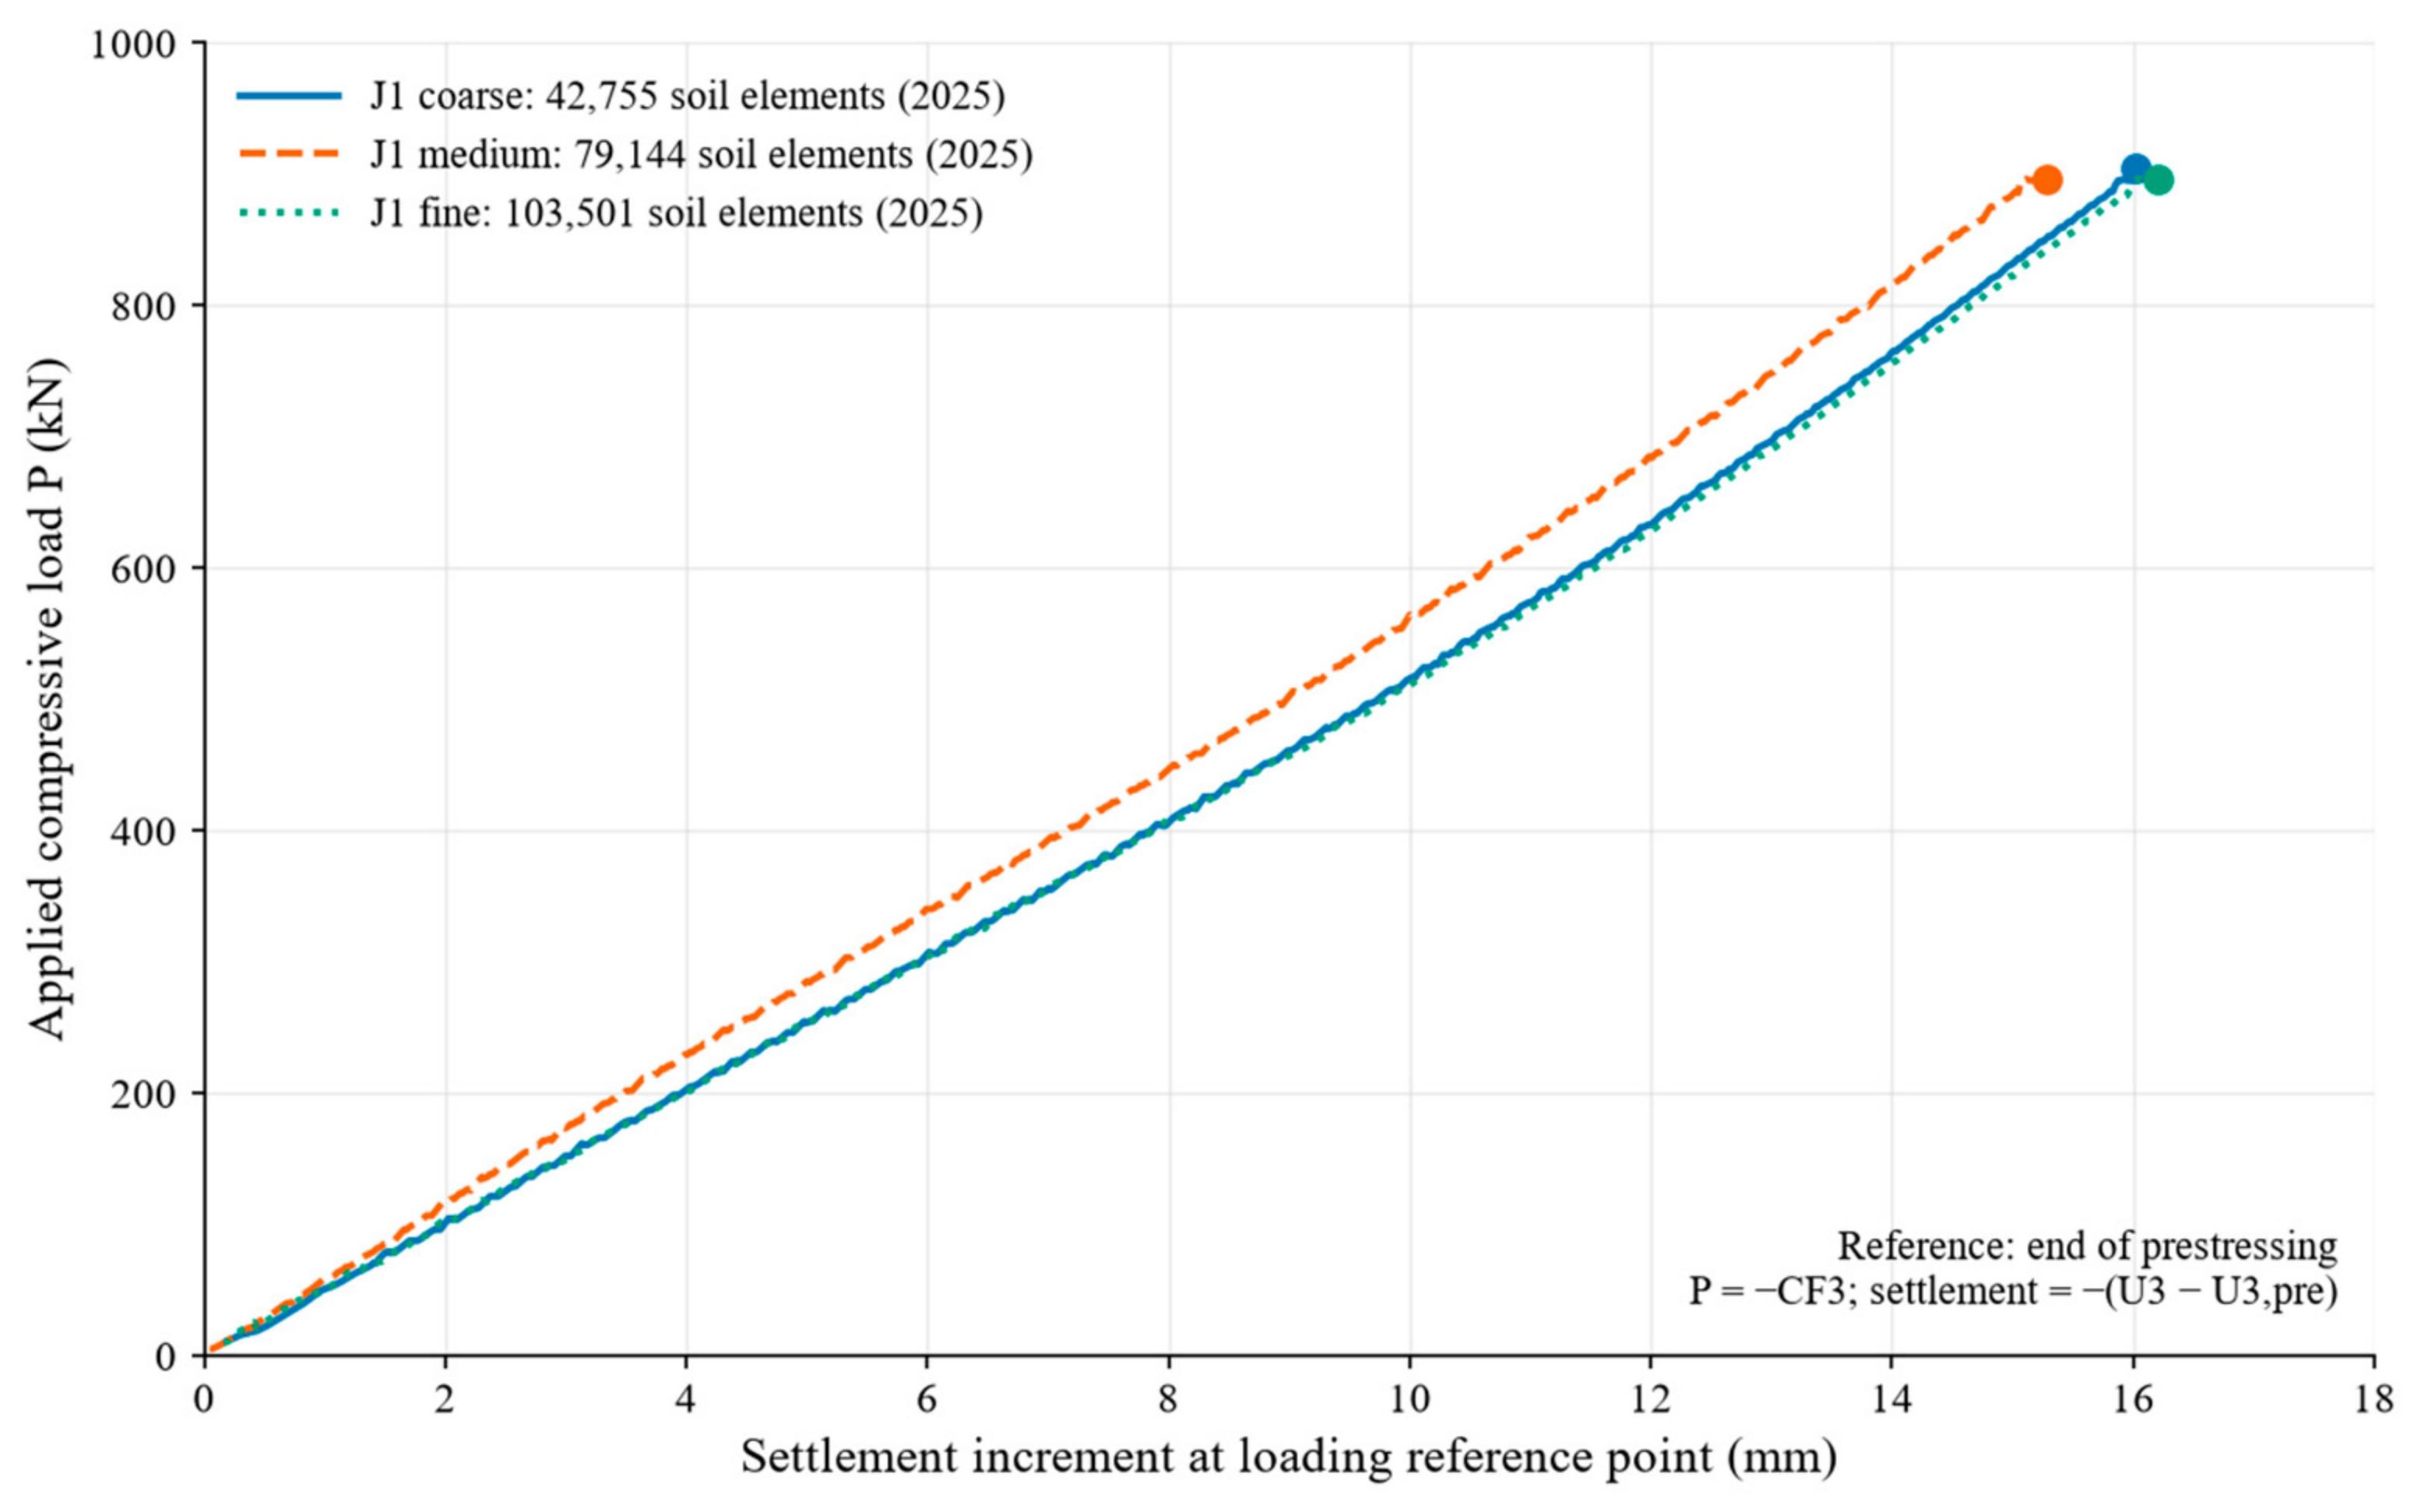
The settlement increment decreases by 4.97% between the coarse and medium meshes and increases by 6.13% between the medium and fine meshes. The corresponding changes in maximum total concrete settlement are −2.74% and +3.82%. Both indicators are reported to distinguish the loading increment from the accumulated displacement. The non-monotonic variation is reported as a soil-discretization sensitivity comparison rather than an asymptotic convergence rate. The structural mesh is fixed in this assessment.
References
- Chang, R.; Zhang, N.; Gu, Q. A Review on Mechanical and Structural Performances of Precast Concrete Buildings. Buildings 2023, 13, 1575. [Google Scholar] [CrossRef] [Scilit]
- Thulasirangan Lakshmidevi, M.; Reddy, K.S.K.K.; Al-Ameri, R.; Kafle, B. A Review on Design Considerations and Connection Techniques in Modular Composite Construction. Appl. Sci. 2025, 15, 5256. [Google Scholar] [CrossRef] [Scilit]
- Zhang, L.Y.; Lang, J.Q.; Sun, Y.J.; Qian, R.F.; Xu, H.G. Prefabricated Assembly Foundation and Its Application in the Base Telecommunication Station. Spec. Struct. 2010, 27, 46–47, 112. (In Chinese) [Google Scholar] [CrossRef]
- Qi, H.; Qin, J.; Zhang, M.; Zhang, Z. A Refined Multi-Spring Model for Prestressed Precast Concrete Connections. Buildings 2025, 15, 4428. [Google Scholar] [CrossRef] [Scilit]
- Baghdadi, A.; Heristchian, M.; Ledderose, L.; Kloft, H. Experimental and Numerical Assessments of New Concrete Dry Connections concerning Potentials of the Robotic Subtractive Manufacturing Technique. Buildings 2023, 13, 210. [Google Scholar] [CrossRef] [Scilit]
- Wu, J.; Liu, D.; Chen, X.; Zhang, J. Experimental study on shear performance of bond-tooth dry joints in prestressed assembled concrete beams. J. Build. Eng. 2023, 68, 106189. [Google Scholar] [CrossRef] [Scilit]
- Hou, Y.; Liu, D.; Qi, D.; Liu, S.; Wang, T.; Zhang, J. Shear Behavior of Large Keyed Dry Joints in Segmental Precast Bridges: Experiment, Numerical Modeling, and Capacity Prediction. Buildings 2025, 15, 3375. [Google Scholar] [CrossRef] [Scilit]
- Chen, B.; Bai, Z.; He, Y.; Wang, L.; Shao, C. Finite Element Analysis of the Connection between Prefabricated Large-Diameter Steel-Reinforced Concrete Hollow Tubular Columns and Foundations. Appl. Sci. 2026, 16, 1651. [Google Scholar] [CrossRef] [Scilit]
- Haraldsson, O.S.; Janes, T.M.; Eberhard, M.O.; Stanton, J.F. Seismic Resistance of Socket Connection between Footing and Precast Column. J. Bridge Eng. 2013, 18, 910–919. [Google Scholar] [CrossRef] [Scilit]
- Cogurcu, M.T.; Uzun, M. Experimental Investigation of a New Precast Column-Foundation Connection under Cyclic Loading. J. Build. Eng. 2022, 50, 104245. [Google Scholar] [CrossRef] [Scilit]
- Yang, J.; Guo, T.; Zeng, C.; Shi, H.; Fu, C. Experimental Investigation of Seismic Behavior of Precast Pier-Footing Socket Connection with Different Design Parameters. Struct. Concr. 2024, 25, 1938–1952. [Google Scholar] [CrossRef] [Scilit]
- Nascimbene, R.; Bianco, L. Cyclic response of column to foundation connections of reinforced concrete precast structures: Numerical and experimental comparisons. Eng. Struct. 2021, 247, 113214. [Google Scholar] [CrossRef] [Scilit]
- Xu, W.; Ma, B.; Duan, X.; Li, J. Experimental investigation of seismic behavior of UHPC connection between precast columns and footings in bridges. Eng. Struct. 2021, 239, 112344. [Google Scholar] [CrossRef] [Scilit]
- Jiao, C.; Liu, W.; Li, Y.; Shi, W.; Long, P. Experimental study of CFST embedded precast concrete bridge column-foundation connection with studs. Soil Dyn. Earthq. Eng. 2023, 168, 107826. [Google Scholar] [CrossRef] [Scilit]
- Meng, Q.; Ning, H.; Yan, K.; Long, S.; Kang, M. Influence of Backfill Soil on the Uplift Bearing Capacity of Prefabricated Foundations for Temporary Transition Towers. Buildings 2025, 15, 4403. [Google Scholar] [CrossRef] [Scilit]
- Yilmazoglu, M.U.; Ozocak, A. Bearing Capacity of Shallow Foundations on Unsaturated Silty Soils. Appl. Sci. 2023, 13, 1308. [Google Scholar] [CrossRef] [Scilit]
- Koltuk, S.; Topçu, S. Determination of Subgrade Reaction Modulus Considering the Relative Stiffnesses of Soil–Foundation Systems. Appl. Sci. 2025, 15, 4714. [Google Scholar] [CrossRef] [Scilit]
- Patrício, J.D.; Gusmão, A.D.; Ferreira, S.R.M.; Silva, F.A.N.; Kafshgarkolaei, H.J.; Azevedo, A.C.; Delgado, J.M.P.Q. Settlement Analysis of Concrete-Walled Buildings Using Soil–Structure Interactions and Finite Element Modeling. Buildings 2024, 14, 746. [Google Scholar] [CrossRef] [Scilit]
- Valiukas, D.; Kaklauskas, G.; Sokolov, A.; Jakubovskis, R. Features of bond-slip relations: 3D finite element analysis based on tests of short RC ties. Case Stud. Constr. Mater. 2024, 20, e03387. [Google Scholar] [CrossRef] [Scilit]
- Sciegaj, A.; Larsson, F.; Lundgren, K.; Runesson, K. On a volume averaged measure of macroscopic reinforcement slip in two-scale modeling of reinforced concrete. Int. J. Numer. Methods Eng. 2020, 121, 1822–1846. [Google Scholar] [CrossRef] [Scilit]
- Minh, H.-L.; Khatir, S.; Abdel Wahab, M.; Cuong-Le, T. A Concrete Damage Plasticity Model for Predicting the Effects of Compressive High-Strength Concrete under Static and Dynamic Loads. J. Build. Eng. 2021, 44, 103239. [Google Scholar] [CrossRef] [Scilit]
- Sümer, Y.; Aktaş, M. Defining Parameters for Concrete Damage Plasticity Model. Chall. J. Struct. Mech. 2015, 1, 149–155. [Google Scholar] [CrossRef] [Scilit]
- Spozito, R.S.; Rodrigues, E.F.C.; Santos, H.F.d.; Oliveira, I.A.d.; Christoforo, A.L.; de Almeida Filho, F.M.; Delalibera, R.G. Numerical Modeling of Four-Pile Caps Using the Concrete Damaged Plasticity Model. Buildings 2024, 14, 2066. [Google Scholar] [CrossRef] [Scilit]
- GB/T 50010-2010; Standard for Design of Concrete Structures, 2024 ed. China Architecture & Building Press: Beijing, China, 2024. (In Chinese)
- EN 1997-1:2004+A1:2013; Eurocode 7: Geotechnical Design—Part 1: General Rules. European Committee for Standardization: Brussels, Belgium, 2013.
- Hu, F.; Shi, G. Constitutive Model for Full-Range Cyclic Behavior of High Strength Steels without Yield Plateau. Constr. Build. Mater. 2018, 162, 596–607. [Google Scholar] [CrossRef] [Scilit]
- Li, D.; Shi, C.; Ruan, H.; Li, B. Shear Characteristics of Soil–Concrete Structure Interaction Interfaces. Appl. Sci. 2022, 12, 9145. [Google Scholar] [CrossRef] [Scilit]
- Liu, H.; Zhu, M.; Li, X.; Dai, G.; Yin, Q.; Liu, J.; Ling, C. Experimental Study on Shear Behavior of Interface between Different Soil Materials and Concrete under Variable Normal Stress. Appl. Sci. 2022, 12, 11213. [Google Scholar] [CrossRef] [Scilit]
- GB 50009-2012; Load Code for the Design of Building Structures. China Architecture & Building Press: Beijing, China, 2012. (In Chinese)

Disclaimer/Publisher’s Note: The statements, opinions and data contained in all publications are solely those of the individual author(s) and contributor(s) and not of MDPI and/or the editor(s). MDPI and/or the editor(s) disclaim responsibility for any injury to people or property resulting from any ideas, methods, instructions or products referred to in the content. |
© 2026 by the authors. Licensee MDPI, Basel, Switzerland. This article is an open access article distributed under the terms and conditions of the Creative Commons Attribution (CC BY) license.