


Abstract
Trans-fatty acids (TFA) occur in food products as a result of natural and technological processes. Quantitative determination was performed by Fourier Transformed Infrared spectroscopy (FT-IR) using the absorption band at 966 cm−1 and a calibration curve developed using glyceryl trioleate and glyceryl trielaidate standards, while method precision was 3.03%, expressed as relative standard deviation (RSD). In order to evaluate the influence of the processing methods on the trans fatty acid content in food products, a multivariate chemometric analysis was conducted, using principal component analysis (PCA) and agglomerative hierarchical clustering (AHC) analyses. Analysis of the 81 samples revealed the highest trans-fatty acid content in panettone (0.36 g/100 g fat) and the lowest in a boiled egg (0.15 g/100 g fat). It was observed that traditional Romanian products contained lower or comparable amounts of trans fatty acids than industrially processed products, which may be attributed to the use of basic, non-processed ingredients such as butter and eggs, the limited use of partially hydrogenated oils and more controllable thermal processing conditions. Overall, all analyzed samples complied with the current regulatory limit of 2 g of TFA per 100 g of fat. Moreover, even in the context of a festive meal, which is generally associated with higher food consumption, TFA intake did not exceed 1% of total dairy energy intake.
1. Introduction
From a nutritional perspective, food products are composed mainly of lipids, proteins and carbohydrates, which serve as the primary sources of energy and essential nutrients for the human body. Lipids, in particular, are highly prone to oxidative degradation, which represents one important factor responsible for the evaluation of food quality during processing and storage [1].
Fats contain both saturated and unsaturated fatty acids, and a balanced diet involves an appropriate intake of each type, given their essential roles in maintaining normal physiological functions in the human body. However, some fatty acids contain one or more double bonds in the trans configuration and differ significantly in structure and biological effects from their cis configuration [2,3]. Oleic acid (18:1) is a commonly found monounsaturated fatty acid in the cis configuration. Upon hydrogenation, this compound can be converted into its trans configuration (elaidic acid). Vaccenic acid is the predominant trans fatty acid from natural sources, whereas industrial hydrogenation processes result in the formation of elaidic acid (C9-trans-18:1), which has been associated with adverse effects on consumer health [4,5,6,7].
From the perspective of their origin, trans fatty acids occur naturally in some foods but are also produced industrially, especially during the partial or complete hydrogenation of vegetable oils. The trans fatty acid content in industrially hydrogenated fats varies considerably and can account for up to 60% of the total fat content [8]. During thermal processing, lipid oxidation and cis–trans isomerization may occur simultaneously and are influenced by similar processing conditions. High-temperature oxidative conditions can promote structural alterations in unsaturated fatty acids and facilitate the isomerization of cis double bonds to the trans configuration. Consequently, trans fatty acid isomers may be formed during thermal treatments such as baking, frying and refining. Prolong heating may further enhance these transformations by intensifying oxidative reactions and promoting the destabilization of unsaturated fatty acid structures [9,10]. Another factor that contributes to the formation of TFAs in food products is the repeated use of frying oils, as this practice accelerates lipid oxidation [9]. Processed foods and refined oils account for over 80% of dietary trans fats [8]. Trans fatty acids from processed food, including fermented products, are associated with adverse health effects, even when present in small quantities, because excessive or frequent consumption of foods containing them can significantly increase the risk of metabolic and cardiovascular disorders [3,11]. Furthermore, TFAs significantly impact the progression of obesity, thereby indirectly contributing to an increased risk of diabetes [12,13].
Trans fatty acids naturally occur in small amounts in ruminant meat as a result of the biohydrogenation reaction that produces them in the rumen under the influence of ruminal bacterial enzymes. Furthermore, trans isomers formed during ruminal biohydrogenation through the isomerization of linoleic and linolenic acids can be absorbed through various mechanisms and distributed to tissues, including the mammary gland. Consequently, certain dairy products also contain naturally occurring trans fatty acids. All trans fatty acids synthesized in the rumen or mammary glands can ultimately be found in meat or in milk fat [3]. For example, cheese represents a relevant source of naturally occurring trans fatty acids. Vaccenic acid and rumenic acid are the most commonly identified trans isomers identified in cheese and other dairy products [6,14,15]. On average, the trans fatty acid content in milk and dairy products is low, accounting for less than 5% of total fatty acids [16,17]. Only 20% of trans fatty acids occur naturally in animal-derived foods [8].
The World Health Organization (WHO) plays a crucial role in promoting the global elimination of industrially produced trans fatty acids. The organization recommends limiting trans fat intake to less than 1% of total daily energy intake, corresponding to less than 2.2 g per day. In response to growing public health concerns, the WHO launched a global initiative in 2018 to eliminate industrial trans fatty acids (TFAs) from foods. By 2023, trans fat elimination policies covered approximately 46% of the global population, representing a substantial increase from only 6% in 2018 [3,18].
Food labeling regulations in the European Union (EU), which implicitly includes Romania, require that foods should have a maximum content of 2 g of trans fatty acids/100 g of fat in the food product, according to EU Regulation 649/2019 [19,20]. In Romania, Law No. 182 of 19 August 2020, coupled with EU Regulation 2019/649 of 24 April 2019, establishes the maximum content of trans fatty acids, other than those naturally occurring in fat of animal origin, allowed in food products intended for human consumption. Therefore, food industry operators may place on the market only food products with the maximum permitted limit of 2 g of trans fatty acids per 100 g of fat [20,21].
Given the strong cultural attachment to traditional cooking practices, reducing trans fatty acid levels in traditional Romanian foods poses specific and complex challenges. Many of these traditional products are prepared using methods such as frying, prolonged baking or the use of partially hydrogenated fats, all of which can promote the formation of trans fatty acids. Moreover, consumer preferences regarding taste, texture and product stability may hinder the complete replacement of these fats with healthier alternatives [22,23,24].
In the field of food analysis, recent studies have demonstrated the value of combining spectrophotometric, chromatographic and electrochemical approaches to determine chemical composition [25,26]. Furthermore, rapid and reliable analytical methods are increasingly needed to assess the composition of food products. FT-IR spectroscopy provides an efficient approach for determining trans fatty acids in foods. Therefore, this study aimed to determine the TFA content of foods produced using industrial and traditional processing methods and to evaluate the findings in relation to the limits established by current European regulations.
To date, Romania lacks a comprehensive baseline dataset on trans fatty acid levels that directly compares traditional Romanian specialty foods with their industrially processed counterparts. This knowledge gap further highlights the necessity of the present study and supports the rationale for undertaking a systematic comparative assessment of trans fatty acid levels in traditional and industrially processed Romanian food products.
2. Materials and Methods
2.1. Materials
Sample selection was guided by the objectives of the study. Foods were chosen based on their potential trans fatty acid content and their relevance to consumer dietary habits, enabling a comparison between traditionally prepared and industrially processed products. The 81 samples were grouped according to their specific characteristics and origin, covering both traditional and industrial products, either commercially available or prepared at the household level. The commercial products were purchased from supermarkets and local stores in Bucharest, Romania, between 1 January 2025 and 1 May 2026. The products were selected based on their availability in the Romanian market. Brand names were not included, as the study focused on product categories rather than individual manufacturers. Six major food categories were thus identified: fast-food products, cozonac (Romanian traditional sweet bread) and panettone, meat and meat products, pastry products, bakery products and other typical ingredients, as shown in Table 1.
Table 1.
Samples collected for analysis.
All reagents and chemicals used in the research were of analytical grade. Petroleum ether 40–65 °C was purchased from Chemical Company (Iași, Romania). The 99% purity glyceryl trioleate (TO) standard was purchased from ThermoFisher Scientific (Waltham, MA, USA), and the 99% purity glyceryl trielaidate (TE) was purchased from LGC Labor GmbH (Augsburg, Germany).
2.2. Methods
2.2.1. Total Fat Analysis
The fat content of the food products was determined by direct extraction using the Soxhlet principle with a Soxtec Avanti 2055 system from FOSS Tecator AB (Höganäs, Sweden) (Foss).
2.2.2. Trans Fatty Acid Analysis
Trans fatty acids were quantified by FT-IR spectrometry using a calibration curve established according to Manolache et al. [27]. The calibration standards and food samples were analyzed under the same experimental conditions, using a consistent analytical protocol throughout the study.
In the present study, FTIR spectroscopy was selected as a rapid screening method for the comparative evaluation of trans fatty acids in diverse sets of food products. The objective was not to obtain a complete fatty acid profile but to identify differences among the investigated product categories based on the characteristic FTIR absorption associated with trans double bonds.
FT-IR spectra were recorded using a Bruker Invenio S spectrometer from Bruker Optics (Ettlingen, Germany) equipped with a horizontal attenuated total reflection (ATR) device and a ZnSe crystal maintained at 65 °C. Measurements were performed in the spectral range 4000–400 cm−1, with 64 scans (sample/background) at a resolution of 4 cm−1. Spectra were acquired directly from the extracted fat without prior sample preparation, using OPUS 8.2.8 software. Approximately 50 µL of each sample was transferred with a disposable pipette to uniformly cover the ATR crystal surface.
The calibration curve was constructed using mixtures of 0.3 g of glyceryl trioleate and glyceryl trielaidate, with concentrations ranging from 0% to 8.75% and the absorbance measured at 966 cm−1, corresponding to the specific absorption band of trans fatty acid bonds [28,29]. Calibration standards for fatty acids were prepared by weighing with a precision of 0.0001 g.
Method precision was evaluated from 20 determinations, comprising 10 replicate measurements performed by each of two operators. It was expressed as the relative standard deviation (RSD, %), using the sample standard deviation of measurements and their corresponding mean value.
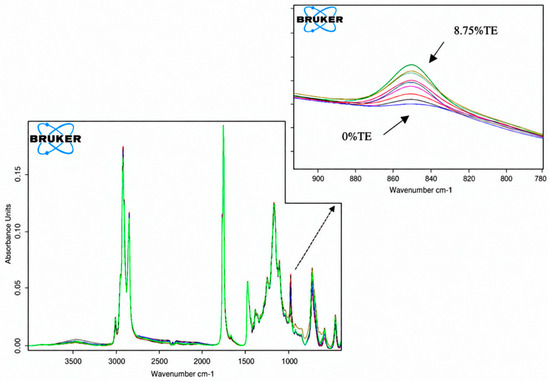
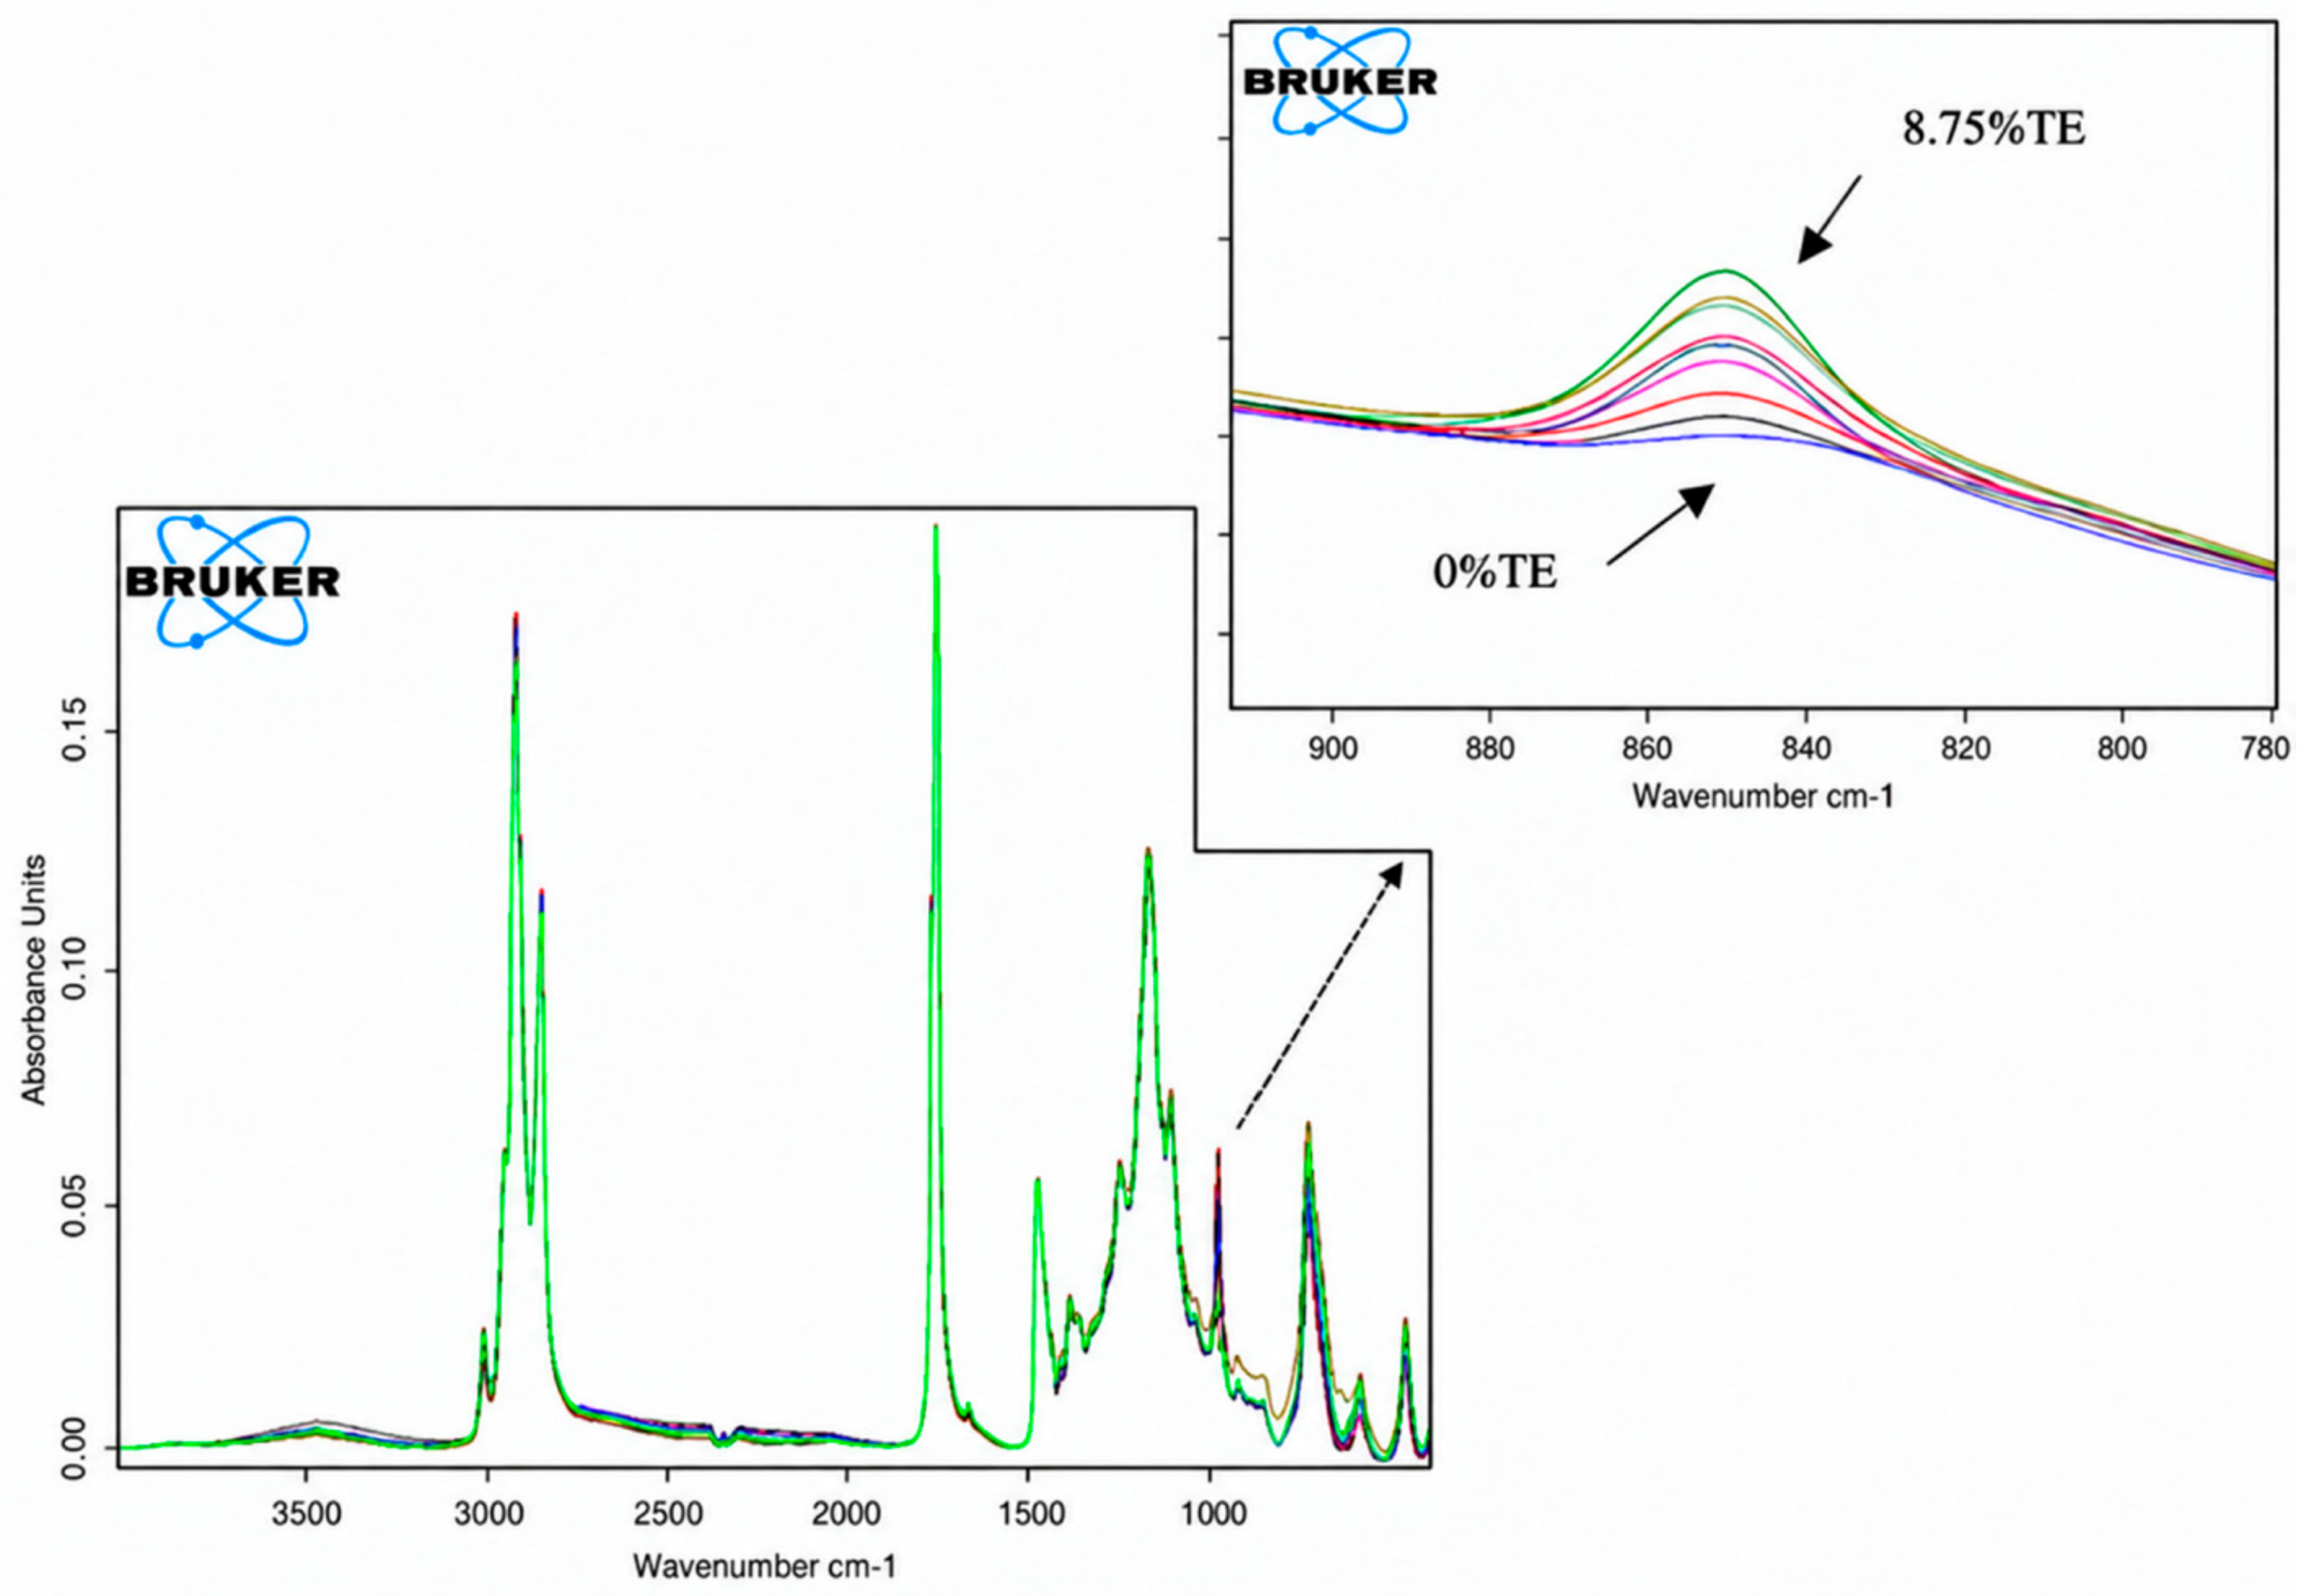
In Figure 1, the ATR-FT-IR spectra of the 10 calibration standards with concentrations ranging from 0% to 8.75% are presented, with the spectral region of interest in this study highlighted around a wavelength of 966 cm−1. It was observed that as the concentration of glyceryl trielaidate increases (the compound used as a source of trans fatty acids), the intensity of the absorption band at 966 cm−1 increases proportionally. This correlation demonstrates that absorption in this spectral region can be employed for the development of a calibration curve. The exact composition of the calibration standards can be observed in Table 2.
Figure 1.
ATR-FTIR spectrum of the calibration standards (10 samples) with concentrations ranging from 0% to 8.75%.
Table 2.
Composition of calibration standards within the concentration range of 0–8.75%.
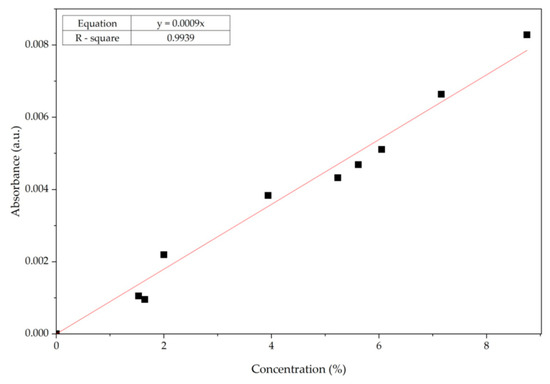
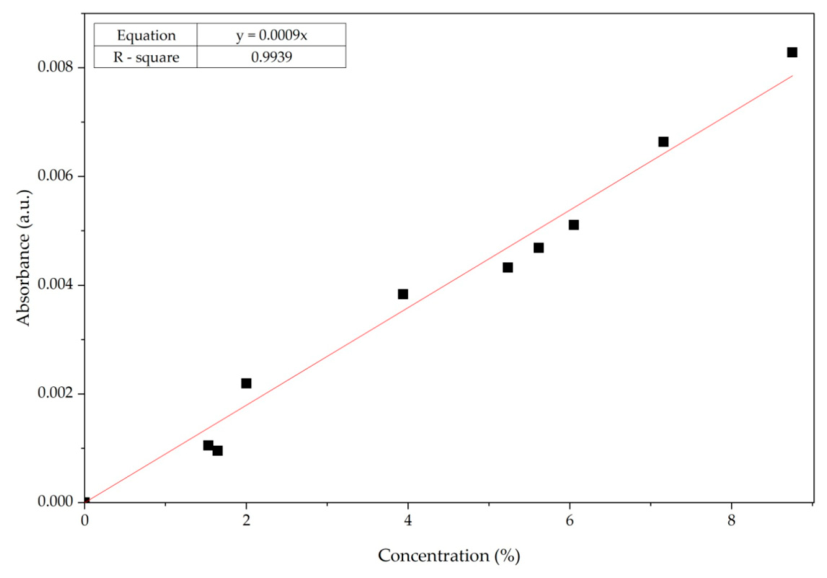
The calibration curve can be observed in Figure 2. The linear regression equation was y = 0.0009x, with a coefficient of determination (R2) of 0.9939. Among the components of the glyceryl trioleate/glyceryl trielaidate mixture, only glyceryl trielaidate contributes significantly to the absorption band characteristic of the trans configuration in the FT-IR spectra, which enables the quantification of trans fatty acids as a function of its concentration.
Figure 2.
Calibration curve: linear regression based on varying TFA concentrations (0–8.75% TE).
Statistical analyses of the obtained experimental data (referring to total fat content, trans fatty acid percentage and spectral parameters) were performed using XLSTAT 2023 software, integrated into Microsoft Excel within the Microsoft Office suite.
Descriptive statistics were carried out for total fats and trans fatty acid contents and are presented as the number of samples, mean ± standard deviation (SD) and variation range (minimum–maximum). The Pearson correlation coefficient (r) was employed to evaluate the linear association between the total fatty acid and trans fatty acid contents of the analyzed samples, with statistical significance defined as p < 0.05. Additionally, the coefficient of determination (R2) was reported to reflect the strength of the linear correlation.
3. Results
The FT-IR spectrum provides valuable information regarding the chemical bonds present in the analyzed sample, with the key absorption bands corresponding to functional groups characteristic of lipid compounds [28]. The region between 1000 and 900 cm−1 is characteristic of stretching vibration of C=C bonds, which may occur in either cis or trans configurations. The corresponding absorbance value at 966 cm−1 of the samples was used in the calibration curve equation to determine the concentration of TFA in the samples from each food group [30,31].
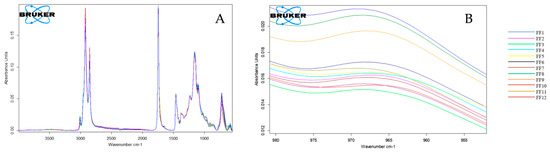
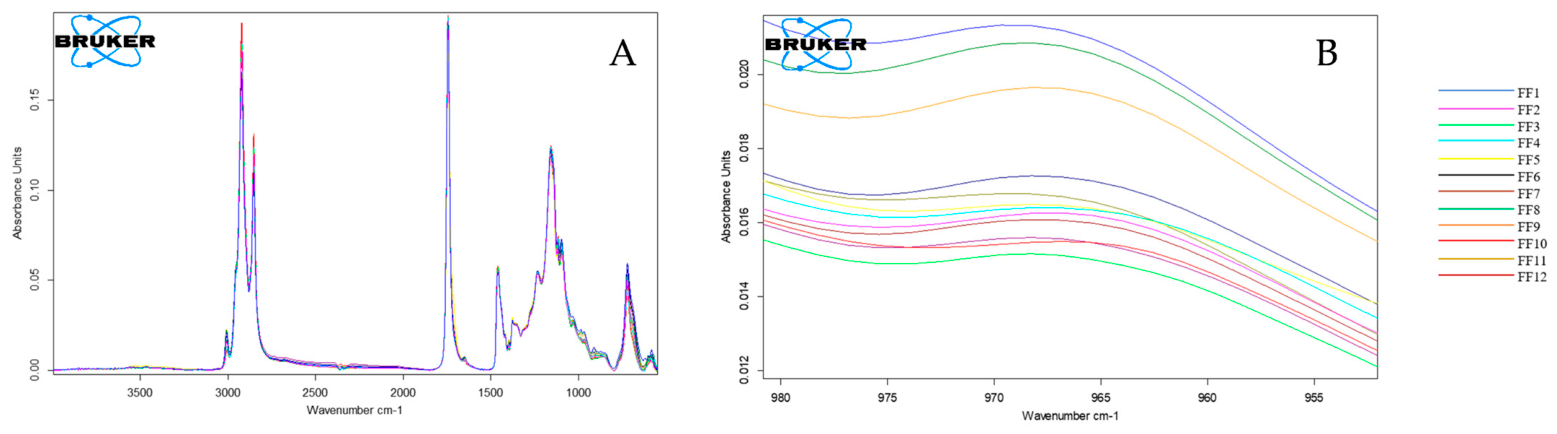
In this study, samples of foods that are traditionally consumed at family holiday meals, such as Easter and Christmas, were analyzed. As an example for the samples analyses, Figure 3A presents the FT-IR spectra of French fry fat samples (FF1–FF12), belonging to the fast-food group, highlighting the characteristic absorption band of trans fatty acids at 966 cm−1 (Figure 3B).
Figure 3.
(A) FT-IR spectra of French fry fat samples (FF1–FF12); (B) trans fatty acid peak region of the French fry samples.
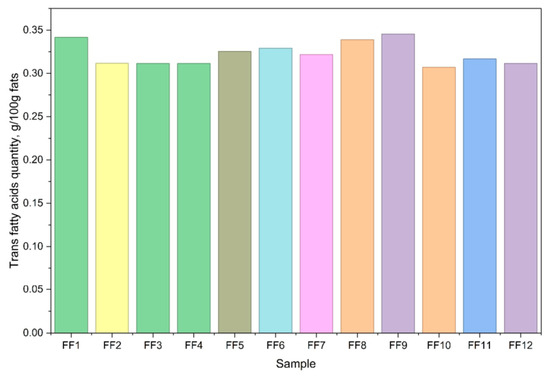
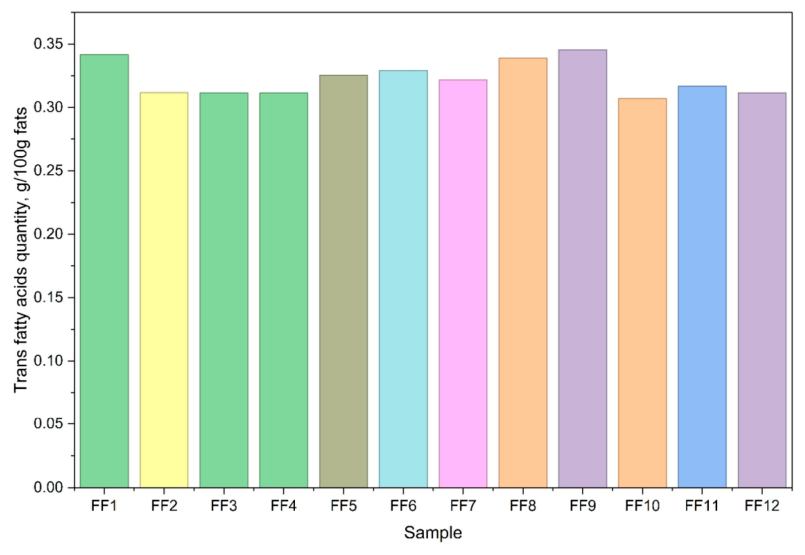
Figure 4 illustrates the quantity of trans fatty acids in the French fry samples, measured using the absorbances determined by FT-IR analysis and the calibration curve. The results presented varied within a limited range, from 0.3069 g/100 g of product FF10 to 0.3455 g/100 g of product in FF9. These differences are either due to variations in the oil used for frying the samples or to the application of different processing conditions during the production of the products. For example, the types of oil identified as being used in the frying process include various blends of sunflower oil and rapeseed oil (FF3, FF6, FF7, and FF12), sunflower oil and palm oil (FF2), sunflower oil only (FF1 and control FF4) and rapeseed oil and palm oil (FF11).
Figure 4.
Trans fatty acids quantity in French fry samples.
Chemometrics was applied on experimental data like the trans fatty acid content, total fat levels and FT-IR absorbances between the 1000 and 800 cm−1 regions to achieve effective differentiation of the samples. Analyses such as principal component analysis (PCA) and hierarchical cluster analysis (AHC) were performed within each product group.
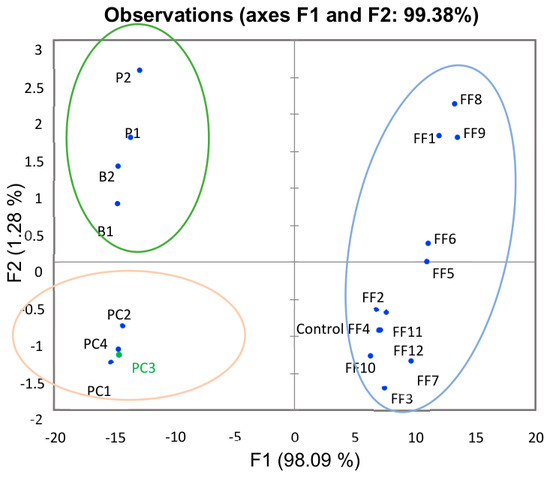
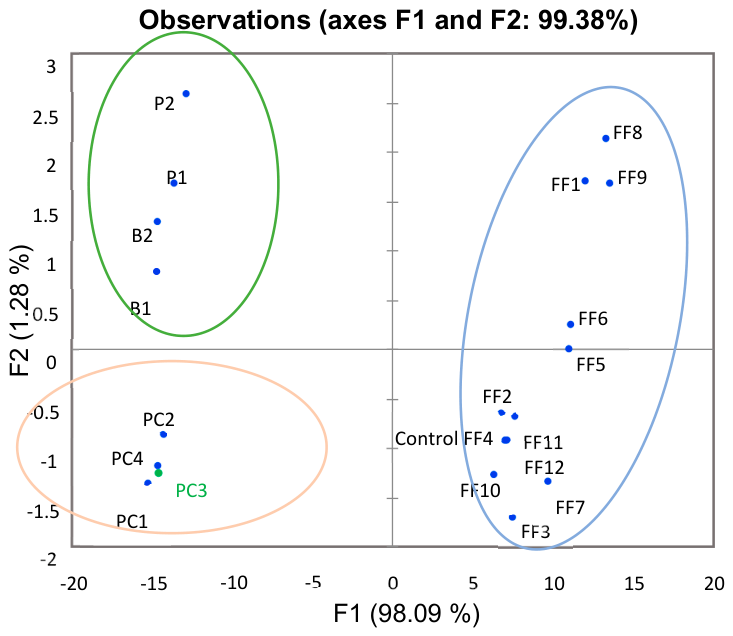
In Figure 5, the graphical representation of the values corresponding to the first two principal components obtained from the PCA analysis can be observed, explaining 98.09% and 1.28% of the total variance. Together, they demonstrate an effective dimensionality reduction with minimal loss of information from the original dataset. The samples are clearly grouped in three distinct clusters according to their origin, reflecting similarities in their processing methods. The first cluster comprised the French fry samples (FF1–FF12), and the second one included the popcorn-type products (PC1–PC4), which differed according to the type of chocolate coating applied. The third cluster included semi-prepared foods, represented by the burger samples, B1 and B2, where sample B2 corresponded to sample B1 with the addition of cheese, and pizza samples, P1 and P2.
Figure 5.
PCA score plot of fast-food group.
In the right-hand region of the plot, the French fry samples can be noticed, which exhibit the highest trans fatty acid content. The control sample (a traditional one) of the French fries is positioned very close to the FF cluster, suggesting that its chemical profile is similar to that of the industrially processed French fry samples.
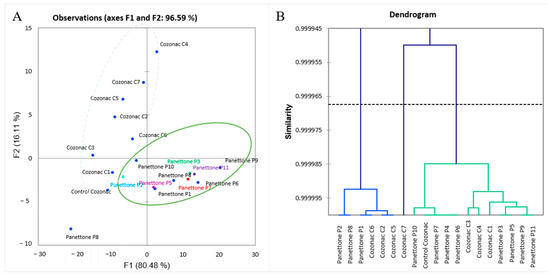
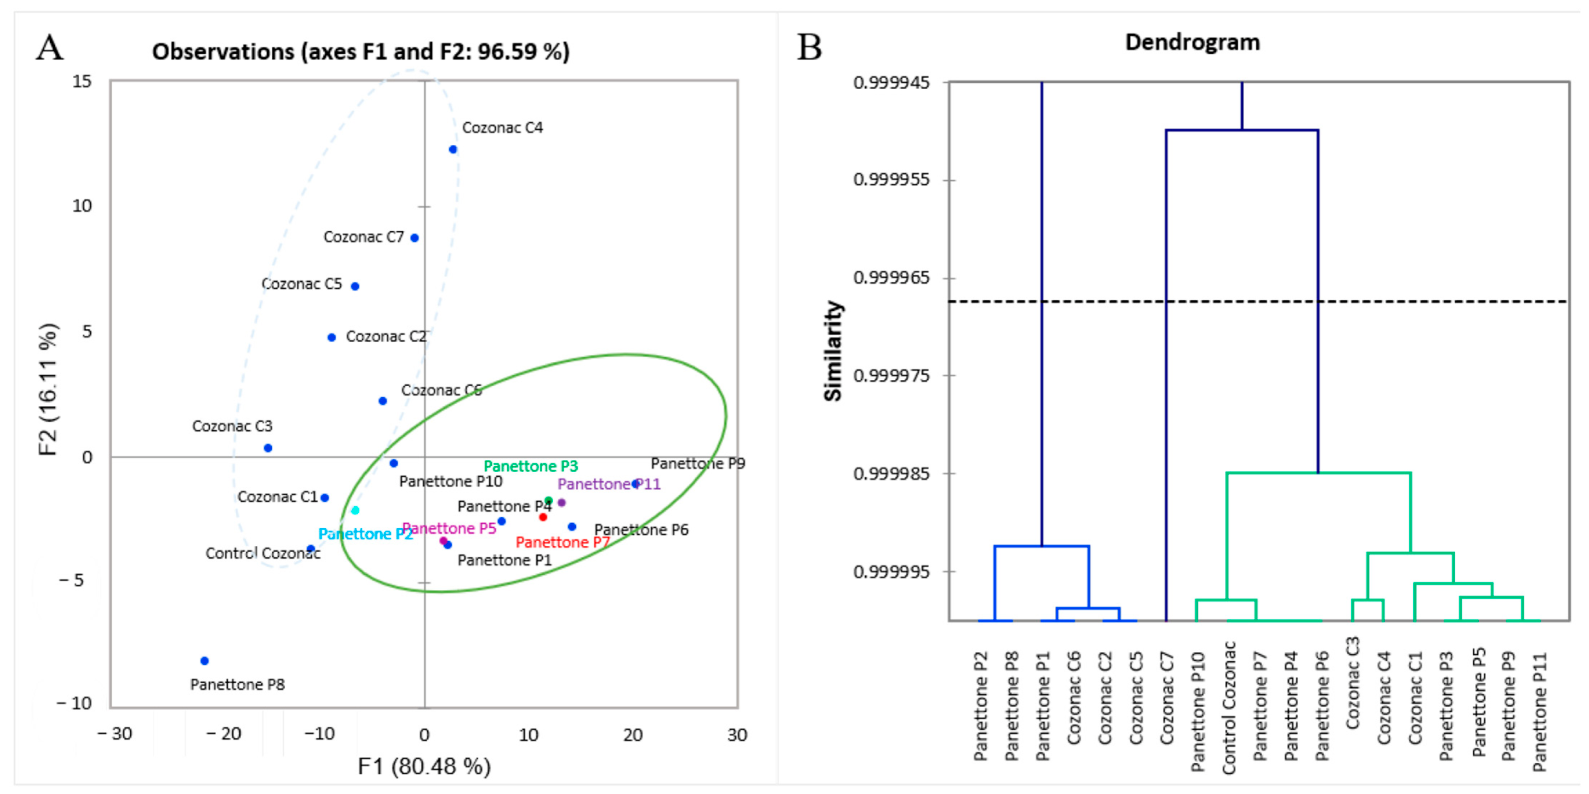
A good separation can be observed in Figure 6A between the cozonac and panettone samples. The control cozonac sample was prepared at the household level, where traditional practices and individual preparation habits may influence the recipe, typically involving higher amounts of butter and egg yolk to enhance sensory properties, as well as a greater quantity of ingredients used in the cream.
Figure 6.
(A) PCA score plot of panettone and cozonac samples; (B) AHC dendrogram.
The AHC plot (Figure 6B) enabled the assessment of similarity among the cozonac (sweet bread) and panettone samples based on both spectral and chemical data. This behavior is likely related to the household recipe used for the control cozonac, which results in a formulation more comparable in terms of trans fatty acid content to that of industrial panettone, where specific ingredients are incorporated to achieve a light and aerated texture. Moreover, industrial panettone formulations commonly include emulsifiers such as mono- and diglycerides of fatty acids, which further influence the lipid profile and may contribute to the high content of trans fatty acids.
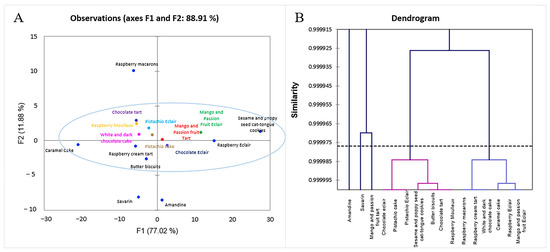
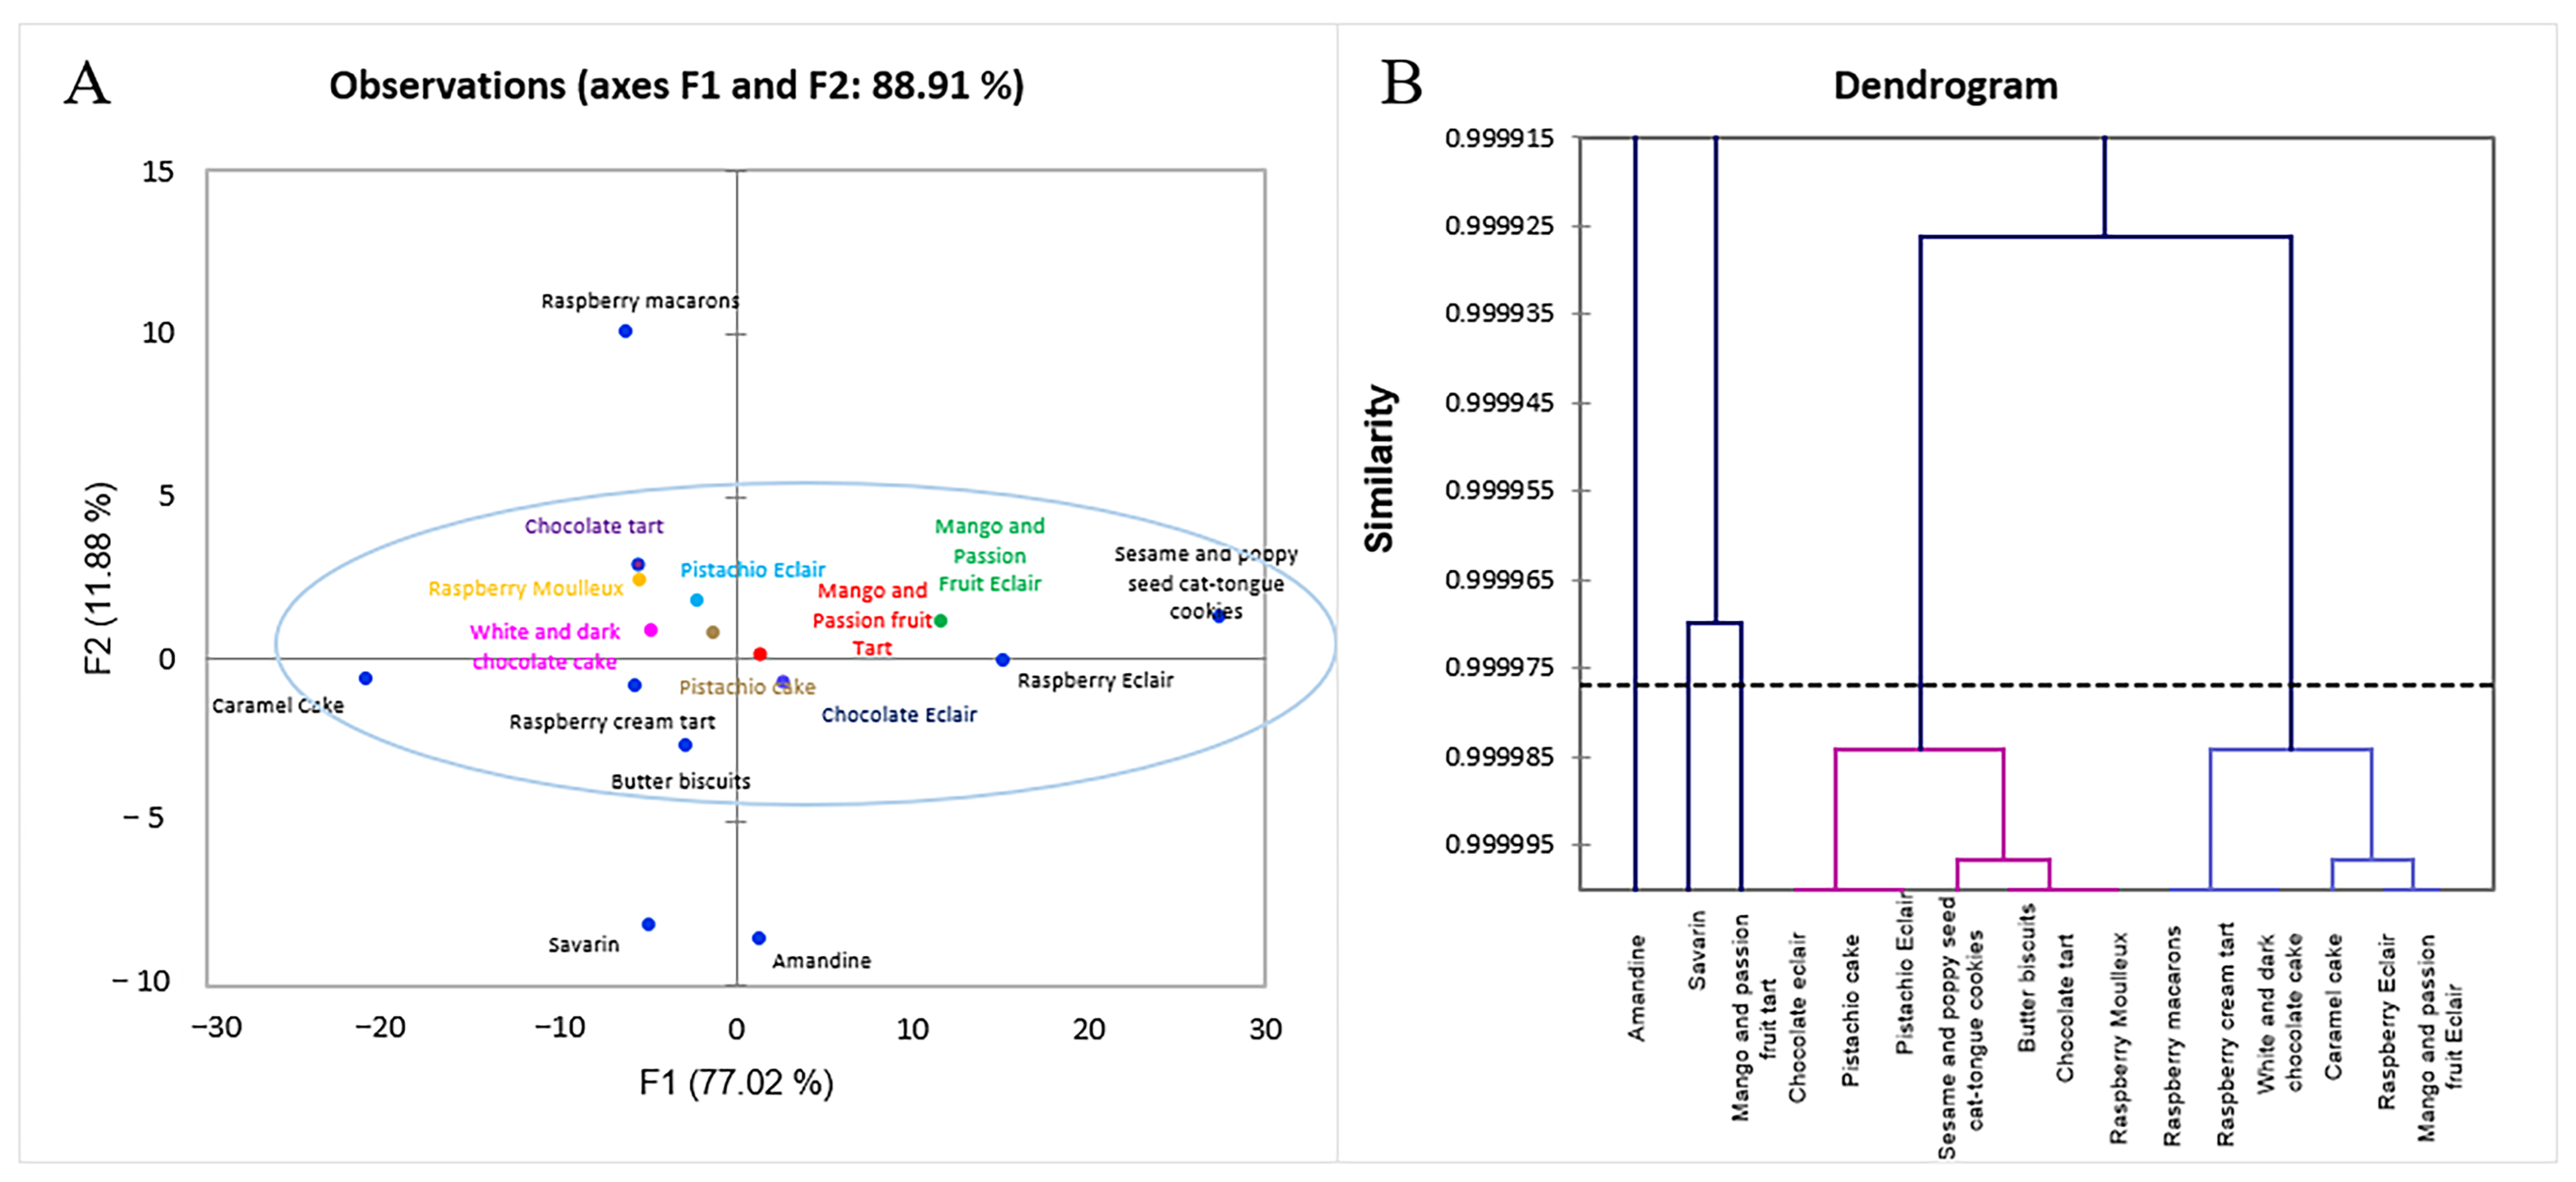
The PCA analysis shown in Figure 7A was also applied to the pastry product group, revealing both clustering of the most samples and the separation of several individual samples. Most samples that are positioned in the central region of the score plot reflect similar qualitative and quantitative characteristics of the extracted lipids, as well as comparable trans fatty acid levels. This clustering may be explained by the similar formulation and technological processes used for these products, including baking, dough preparation, filling and the incorporation of cream or mousse layers. Moreover, many of these products are characterized by biscuit or cake-based structures and similar textures, which may further contribute to their overall composition.
Figure 7.
(A) PCA score plot of pastry group; (B) AHC dendrogram.
In contrast, the “raspberry macaron” sample is positioned in the upper region of the PCA plot, reflecting its lower trans fatty acid content relative to the other samples. These results can be attributed to the use of different ingredients, such as egg whites, which are characterized by a naturally low content of trans fatty acids and are essential for achieving the aerated structure of meringue-based products. Also located away from the central cluster are the “amandine” and “savarin” samples, positioned in the lower region of the PCA representation due to their reduced lipid content. Amandine is a Romanian chocolate cake, while savarin is similar to a rum baba, a French dessert, often soaked in flavored syrup and served with whipped cream or fruit.
Five clusters were formed following the application of AHC, as can be seen in Figure 7B, reflecting the characteristic composition of the samples. The similarity coefficient is extremely high (above 0.999), indicating that all analyzed products exhibit nearly identical profiles with respect to the variables considered. One cluster contains only the “amandine” sample, a traditional Romanian pastry characterized by a syrup-soaked sponge and a dense cream, which together result in a distinct structural and sensory profile.
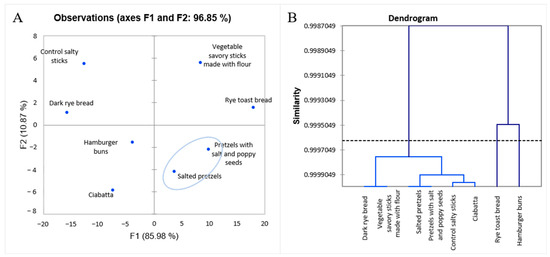
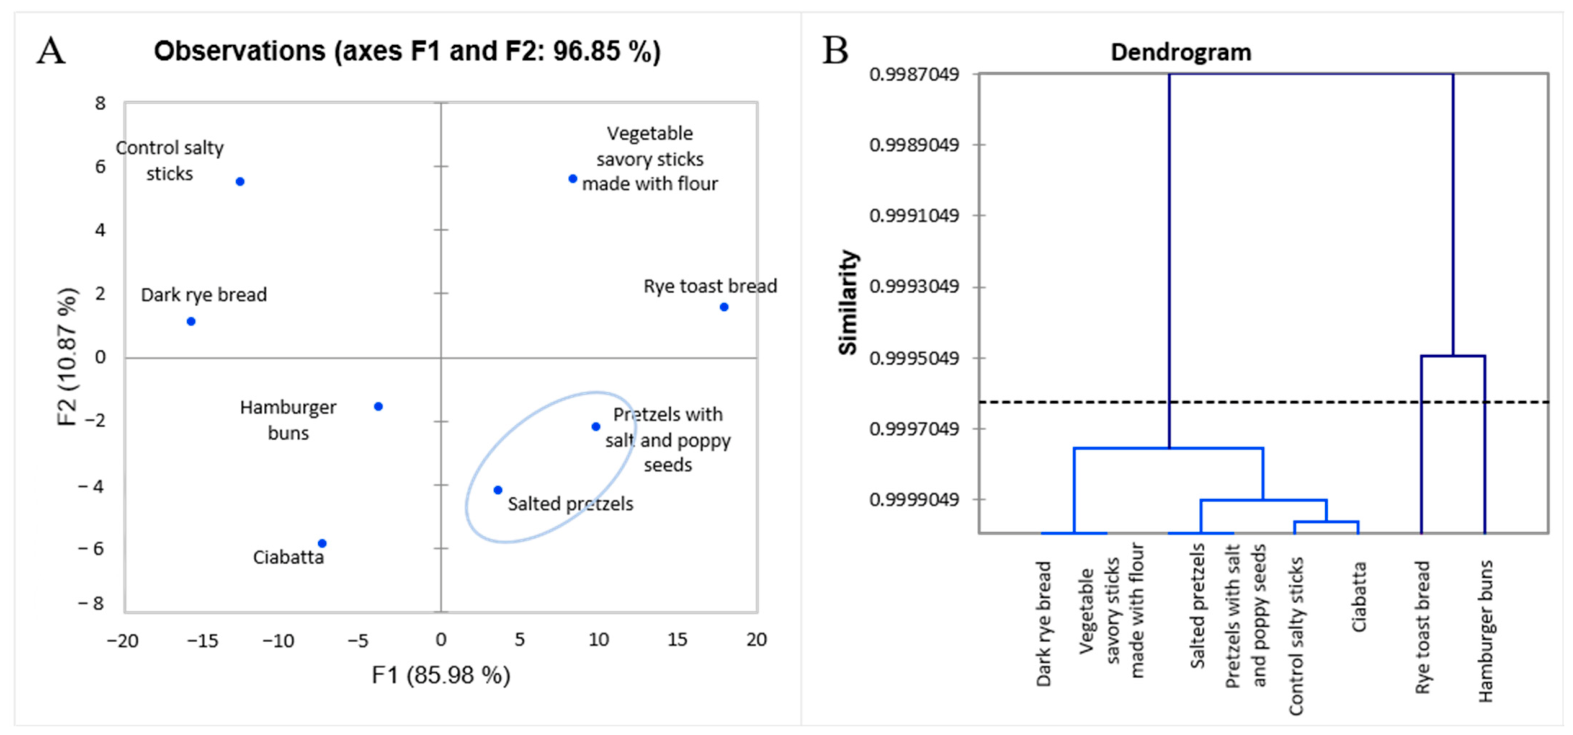
The first two principal components of PCA of the bread group are presented in Figure 8, where the principal component 1 (F1) explained 85.98% of the total variance and effectively separated samples with higher lipid levels from those with lower fat content. Accordingly, samples positioned on the positive side of F1, such as rye toast bread and the pretzel-type products, exhibited comparatively lower lipid concentrations. F2 exhibited a positive correlation with the proportion of trans fatty acids, placing the rye toast bread and stick samples in the upper region of the plot. Also, the samples “pretzels with salt” and “pretzels with salt and poppy seeds” were located within the same region of the PCA, indicating a highly similar lipid profile, both in terms of total fat content and trans fatty acid levels. The AHC analysis complements the PCA results by providing an additional visualization of the degree of similarity between samples. The values close to 1 observed on the vertical axis, which expresses similarity levels, indicate that the analyzed products exhibit a high degree of resemblance.
Figure 8.
(A) PCA score plot of bread group; (B) AHC dendrogram.
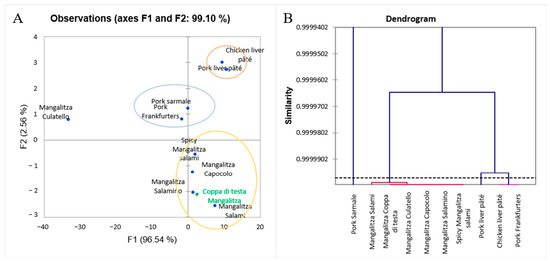
The application of multivariate analysis to the meat product samples revealed a clear separation among them, with PC1 and PC2 together accounting for more than 99% of the total variance. This finding indicates that PCA is a highly effective tool for distinguishing samples based on the ingredients used. On the right side of the PCA plot in Figure 9A, corresponding to positive F1 values, the samples “chicken pâté” and “pork pâté” are located in close proximity, reflecting their nearly identical processing technology and the minimal influence of ingredient differences on their final composition.
Figure 9.
(A) PCA score plot of meat and meat products; (B) AHC dendrogram.
All salami samples were located in the same region of the PCA plot, which can be attributed to the use of the same ingredient, meat originating from the Mangalitza pig breed. An exception is the “Mangalitza Culatello” sample, which appears at the far left of the PCA plot. Although it also derives from the Mangalitza breed, this product is manufactured from the posterior part of the pork thigh, a higher-quality cut characterized by a lower content of unsaturated fatty acids. In Figure 9B, the AHC analysis also shows that the samples of Mangalitza origin cluster together, which is expected given the similar ingredient derived from the same pig breed. Three clusters can be observed, one of which contains only the “pork sarmale” sample. This product is a traditional Romanian cooked dish that, in addition to meat, includes ingredients such as rice and cabbage. Consequently, this distinct composition leads to its separation from the other samples, which contain exclusively animal-derived ingredients.
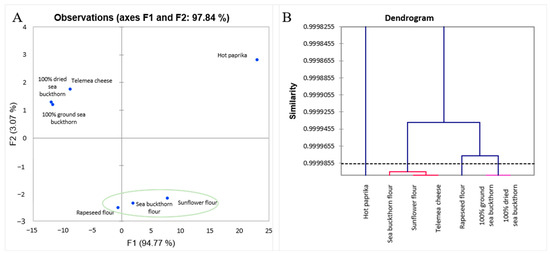
PCA analysis of the ingredient group (Figure 10A) effectively separates the ingredients, reflecting mainly the variation in fat percentage. On the right side of the plot are samples rich in fats, but with a low content of trans fatty acids, such as sunflower flour, rapeseed flour and sea buckthorn flour. Nearby, it is observed that the sea buckthorn products are grouped closely together, suggesting similar chemical profiles and confirming the influence of botanical origin on sample grouping. Boiled egg samples are found separately on the left side of the PCA plot due to their low content of both fat and trans fatty acids. On the other hand, the hot paprika sample was distinctly positioned in the upper-right region of the PCA score plot because this samples had the lower fat content among the analyzed ingredients and the highest level of the trans fatty acids.
Figure 10.
(A) PCA score plot of ingredients group; (B) AHC dendrogram.
The dendrogram (Figure 10B) highlights the degree of similarity between the samples analyzed, with values close to 1 observed on the vertical axis. This similarity between “100% ground sea buckthorn” and “100% dried sea buckthorn” can also be observed, with the dendrogram confirming and supporting the fact that the processing method (grinding or drying) does not significantly influence the lipid characteristics of sea buckthorn. On the other hand, the “hot paprika” sample forms a cluster on its own due to its different origin and specific fat composition.
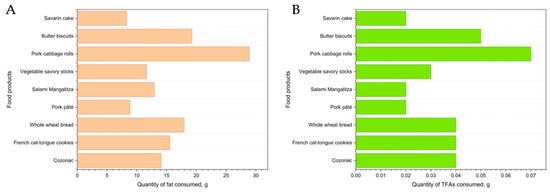
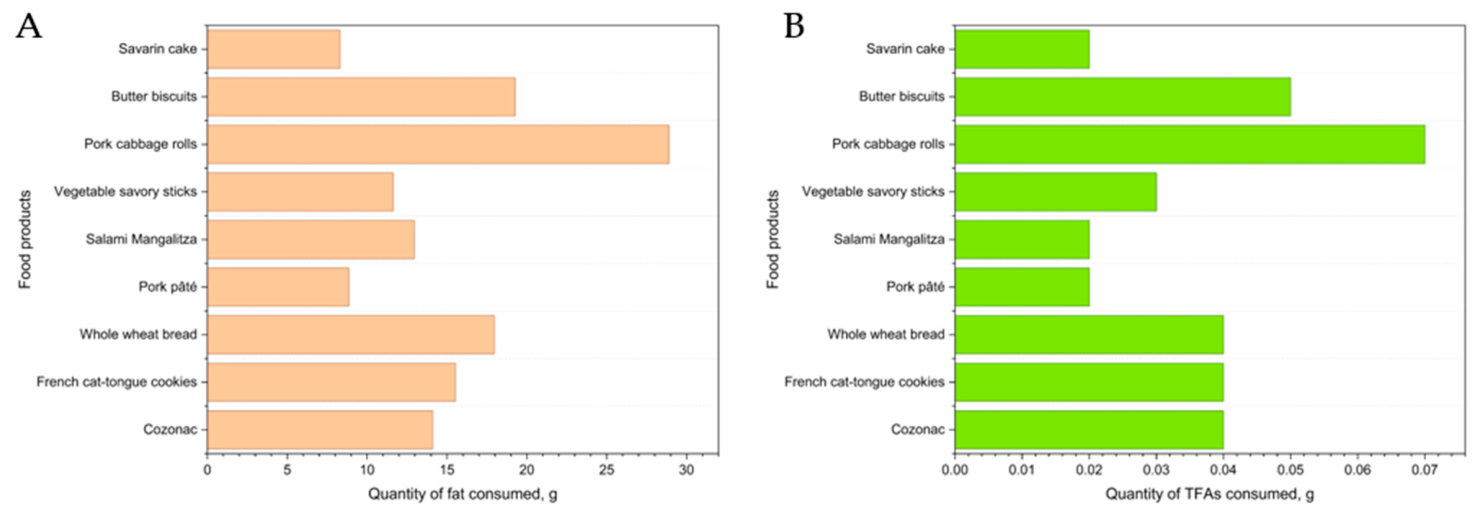
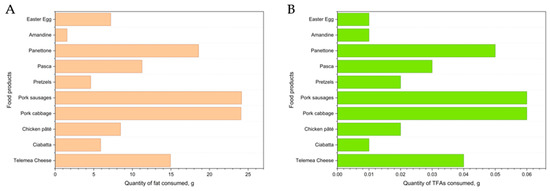
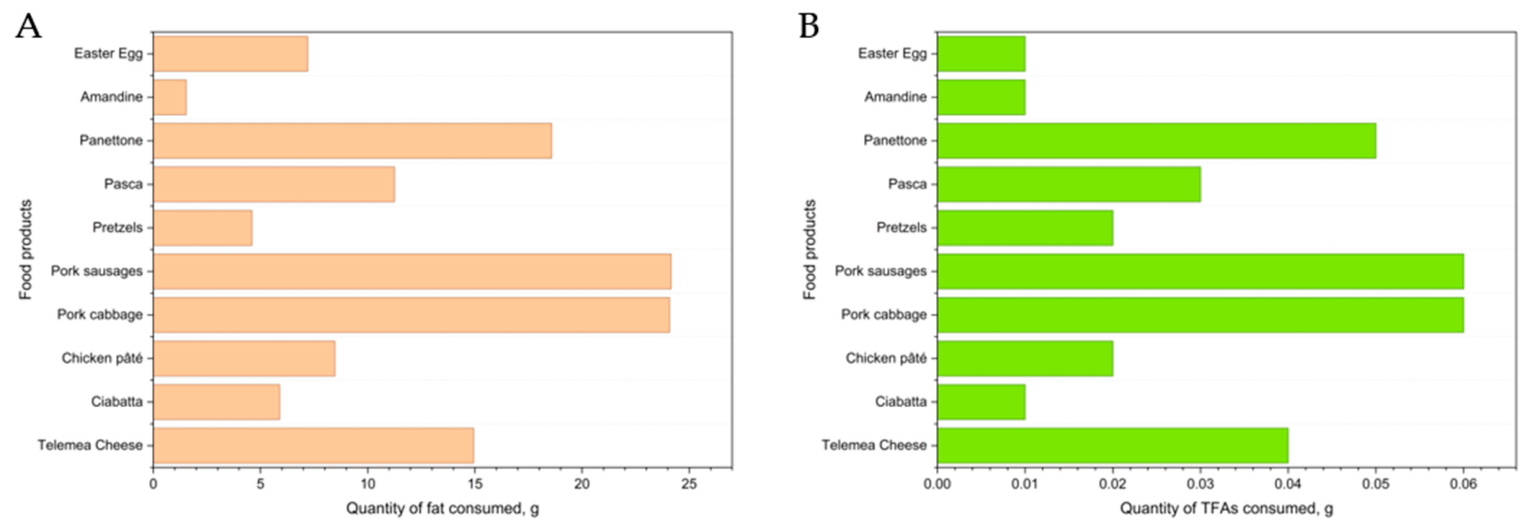
These analyses demonstrate that industrial processing methods have a significant impact on the trans fatty acid levels in foods. All investigated samples in this study adhered to the legal maximum of 2 g TFAs/100 g of fat [20]. Figure 11 and Figure 12 illustrate selected food products from the analyzed samples, commonly consumed during Christmas and Easter meals, along with their corresponding fat and trans-fatty acid contents. Particularly, we show the results for pasca, which is a traditional Romanian Easter cheesecake. The TFA intake per meal reflects a notable contribution of unhealthy unsaturated lipids, emphasizing the need for moderation in consumption.
Figure 11.
Assessment of fat (A) and TFA (B) intake from Christmas meal.
Figure 12.
Assessment of fat (A) and TFA (B) intake from Easter meal.
Based on the results obtained regarding fat and trans fatty acid contents, a specific intake pattern associated with festive meals can be observed. As presented in Table 3, the analyzed food products exhibited trans fatty acid content of 0.34 g per 100 g of fat for the Christmas meal and 0.27 g per 100 g of fat for the Easter meal. Both values strictly adhere to established regulatory frameworks, corresponding to approximately 15% of the maximum allowable level of 2 g of TFAs/100 g of fat [19,20]. Furthermore, these values are consistent with the World Health Organization (WHO) nutritional recommendations, which recommend that trans fat intake be limited to less than 1% of total daily energy intake, which is equivalent to less than 2.2 g per day [3]. However, as representative national data regarding the average consumption of traditional Romanian holiday foods are currently limited, these results should be interpreted as scenario-based estimates rather than as estimates of the habitual intake of the Romanian population.
Table 3.
Assessment of fat and trans fatty acid intake from Christmas and Easter meals.
In order to obtain descriptive statistics and conduct correlation analysis of total fatty acid and trans fatty acid contents (Table 4), all samples were analyzed, as well as each food group and the festive meals served during Easter and Christmas, when consumers tend to consume more food and the probability of exceeding the permissible level of trans fatty acids is increased. Regarding traditional festive meals, strong and highly statistically significant positive linear correlations were observed between total fat content and trans-fatty acid (TFA) levels. For Christmas and Easter meals, strong Pearson correlation coefficients were obtained, indicating that 90.7% of the variance in TFA content in the Christmas meal and 97.5% in the Easter meal were associated with variations in total fatty acid content.
Table 4.
Descriptive statistics and correlation analysis of total fatty acid and trans fatty acid contents in the analyzed samples.
For the food groups, Pearson correlation analysis showed no statistically significant linear relationship (p > 0.05) between total fat content and TFA levels in any of the investigated product categories, in all cases. Also, the negative values of the Pearson correlation coefficient (r < 0) obtained for most food groups (fast-food products, cozonac and panettone samples, bread products and meat products) confirm the statistically insignificant results. These findings indicate that the content of total fatty acids present in a food product is not an independently reliable predictor of its trans fatty acid content. The descriptive analysis showed a pronounced difference in variability between the parameters. Total fat content revealed wide ranges and relatively high standard deviations across the individual product categories, while TFA levels are considerably more narrowly distributed and have smaller standard deviations.
Descriptive statistics and correlation analysis are consistent with the fact that TFA formation is more closely related to the fatty acid composition of the lipid fraction, particularly the presence and transformation of unsaturated fatty acids, as well as to processing conditions, rather than to the total fat content alone. Therefore, products with a higher total fat content do not necessarily contain higher TFA levels, since the formation of trans isomer formation depends primarily on the nature of the fatty acids present and their susceptibility to isomerization under processing conditions.
This research demonstrates that even when consuming more copious meals, the trans fatty acid content remains within legal limits when evaluating these levels in the context of traditional Romanian feasts meals like Christmas and Easter.
4. Discussions
The comparable intake of trans fatty acids obtained in this research, despite variations in total fat content, indicates that TFA levels are determined primarily by the type and origin of the fat, especially the presence of partially hydrogenated oils, and by the thermal processing applied to the product, rather than by the overall lipid content.
Notable differences were observed in the trans fatty acid contents of industrially produced foods compared to similar products prepared in a traditional household manner. In general, the industrial samples contained higher amounts of TFAs, suggesting that both recipe composition and technological processing may influence their final concentration. The lower values observed in the traditionally prepared samples may be related to the use of ingredients such as eggs and butter instead of margarine, together with a reduced degree of processing. Lahmam et al. (2025) highlighted the significance of shortening and margarines as potential dietary sources of industrially produced TFAs, with a focus on fat formulation to influence the final TFA content of pastry and bread products [29].
The impact of processing on food products is detailed in the research conducted by Mavlanov et al. (2025), who identified processing temperature as a principal factor influencing the formation of trans fatty acids during both industrial oil processing and household frying. Frying duration, the fatty acid composition of the oil and sample composition influence the formation of trans isomers. This effect is relevant to the French fry samples, although it may also apply to other food matrices [20].
Compared with the results reported by Yazdanparast et al. (2025), the meat products investigated in the present study exhibited lower TFA contents. This is also due to the fact that differences in raw materials, lipid sources, product formulation and technological processing may substantially influence the final TFA content. The Mangalitza products have low TFA levels despite their comparatively high total fat content, indicating that a higher lipid content does not necessarily correspond to a greater proportion of trans fatty acids within the fat fraction [32].
Although this study found levels below regulatory limits (2 g of TFAs per 100 g of fat) [19,20], these products should still be consumed in moderation, especially when combined with multiple high-fat foods in a festive meal. Regular dishes typically consumed at Christmas and Easter, such as cozonac or pasca, might still affect TFA intake based on their fat content, TFA levels and serving sizes. The results suggest ongoing monitoring of TFAs in traditional and industrial products, emphasizing the need to evaluate TFA content alongside portion sizes and overall dietary patterns.
The present study provides information on the TFA content of foods produced using traditional and industrial processing methods. Nevertheless, several aspects should be considered when interpreting the findings. The samples covered a range of food products, although expanding the number of samples and including additional food categories would provide an even broader picture of TFA occurrence.
Future studies could also consider a wider range of manufacturers, production batches, geographical regions, recipes, raw materials and processing conditions to better capture the variability found on the market. Monitoring several batches of the same product over time would also help evaluate possible variations related to raw materials, reformulation and processing conditions. Accordingly, the current results reflect the products analyzed and provide a useful foundation for larger, nationally representative investigations. Further research should extend the sampling strategy to include additional product categories, particularly frequently consumed foods and products with a relatively high fat content.
FT-IR spectroscopy demonstrated to be a rapid, practical and cost-effective method for screening TFA content across multiple food samples. However, as the method measures the overall spectral response associated with trans double bonds, it does not provide detailed information on individual TFA isomers or clearly distinguish between TFAs of natural origin, such as those present in milk and dairy-derived ingredients, and TFAs originating from industrial processing. Therefore, the measured TFA contents in the products containing dairy should not be interpreted exclusively as indicators of the use of partially hydrogenated oils or industrial processing. Future investigations could therefore combine FT-IR screening with confirmatory gas chromatographic analysis. This complementary approach would allow for a more detailed characterization of fatty acid profiles while retaining the speed and accessibility of FT-IR for routine screening.
Over time, the findings may help in creating a periodically updated national database on TFA content in foods sold in Romania. Such a database could include both traditional Romanian foods and industrially manufactured products of domestic or international origin. With data on food consumption included, it could offer more precise estimates of dietary TFA intake, aid in market surveillance, motivate product modifications and inform consumers about their food choices to help them make informed decisions.
5. Conclusions
This study enabled the quantification of trans fatty acids in Romanian food products in comparison with industrially processed counterparts in order to assess how processing methods influence trans fatty acid content. The analysis was carried out within the framework of national and European legislation, which permits a maximum of 2 g of trans fatty acids per 100 g of fat in the final product. Through this approach, the present work contributes to raising awareness of the nutritional risks linked to trans fatty acid intake and fosters the adoption of healthier eating practices.
Using chemometric approaches, PCA and AHC, it was concluded that processing methods significantly affect the level of trans fatty acids in foods, regardless of the food category, together with the nature of the ingredients used. In addition, the trans fatty acid content of food products is influenced not just by the total lipid content. Noticeable differences were observed between the trans fatty acid contents of industrially processed products and the control samples prepared traditionally under household conditions. Industrial products showed increased and variable TFA levels compared with equivalent traditionally samples, which is attributed, for example, to the use of eggs, butter instead of margarine and minimally processed ingredients. As an example, the trans fatty acid content of the French fry control sample is clearly lower due to the use of fresh sunflower oil and the limited thermal degradation that occurred during the frying process. Overall, the result indicate that traditionally prepared products were mainly associated with lower trans fatty acid contents compared with industrially processed products, but all sample complied with the acceptable content limits.
The food industry can support the development of products with an improved lipidic profile by carefully selecting the type and quality of fats used in food production. The use of suitable alternatives to partially hydrogenated fats, together with regular monitoring of raw materials and final products, can contribute to maintaining a low TFA content and providing consumers with healthier food choices.
Author Contributions
Conceptualization, M.-C.T. and F.-A.M.; methodology, M.-C.T.; software, F.-A.M. and C.-B.P.; validation, C.-B.P., F.-A.M. and M.-C.T.; formal analysis, C.-B.P., F.-A.M. and M.-C.T.; investigation, C.-B.P. and M.-C.T.; resources, M.-C.T. and A.-I.G.; data curation, C.-B.P. and M.-C.T.; writing—original draft preparation, C.-B.P., F.-A.M., A.-I.G. and M.-C.T.; writing—review and editing, F.-A.M. and M.-C.T.; visualization, C.-B.P., A.-I.G. and M.-C.T.; supervision, M.-C.T.; project administration, M.-C.T. All authors have read and agreed to the published version of the manuscript.
Funding
This research received no external funding.
Institutional Review Board Statement
Not applicable.
Informed Consent Statement
Not applicable.
Data Availability Statement
Supporting data are available upon request.
Conflicts of Interest
The authors declare no conflicts of interest. The funders had no role in the design of the study; in the collection, analyses or interpretation of data; in the writing of the manuscript; or in the decision to publish the results.
Abbreviations
The following abbreviations are used in this manuscript:
| AHC | Agglomerative Hierarchical Clustering |
| EU | European Union |
| PCA | Principal Component Analysis |
| TE | Glyceryl Trielaidate |
| TFA | Trans Fatty Acid |
| TO | Glyceryl Trioleate |
| WHO | World Health Organization |
References
- Galanakis, C.M. Functionality of Food Components and Emerging Technologies. Foods 2021, 10, 28. [Google Scholar] [CrossRef] [Scilit] [PubMed]
- Parker, S.F. The Analysis of Vibrational Spectra: Past, Present and Future. Chempluschem 2024, 90, 202400461. [Google Scholar] [CrossRef] [Scilit] [PubMed]
- Nagpal, T.; Sahu, J.K.; Khare, S.K.; Bashir, K.; Jan, K. Trans Fatty Acids in Food: A Review on Dietary Intake, Health Impact, Regulations and Alternatives. J. Food Sci. 2021, 86, 5159–5174. [Google Scholar] [CrossRef] [Scilit] [PubMed]
- Yoo, M.; Lee, H.J.; Lee, K.W.; Seo, D. Analysis of Vaccenic and Elaidic Acid in Foods Using a Silver Ion Cartridge Applied to GC × GC-TOFMS. Front. Nutr. 2023, 10, 1320550. [Google Scholar] [CrossRef] [Scilit] [PubMed]
- Lenighan, Y.M.; McNulty, B.A.; Roche, H.M. Dietary Fat Composition: Replacement of Saturated Fatty Acids with PUFA as a Public Health Strategy, with an Emphasis on α-Linolenic Acid. Proc. Nutr. Soc. 2019, 78, 234–245. [Google Scholar] [CrossRef] [Scilit] [PubMed]
- Guillocheau, E.; Legrand, P.; Rioux, V. Benefits of Natural Dietary Trans Fatty Acids towards Inflammation, Obesity and Type 2 Diabetes: Defining the n-7 Trans Fatty Acid Family. OCL-Oilseeds Fats Crops Lipids 2019, 26, 46. [Google Scholar] [CrossRef] [Scilit]
- Makarewicz-Wujec, M.; Dworakowska, A.; Kozłowska-Wojciechowska, M. Replacement of Saturated and Trans-Fatty Acids in the Diet v. CVD Risk in the Light of the Most Recent Studies. Public Health Nutr. 2018, 21, 2291–2300. [Google Scholar] [CrossRef] [Scilit] [PubMed]
- Hegazy, M.A.; Vidovic, B.; Abobakr, S.; Zeljkovic, A.; Stefanovic, A.; Vekic, J. Hidden Industrial Trans-Fatty Acids: Mechanistic Insights into Dyslipidemia, Cardiovascular Disease, and Metabolic Dysfunction-Associated Steatotic Liver Disease. Int. J. Mol. Sci. 2025, 26, 11715. [Google Scholar] [CrossRef] [Scilit] [PubMed]
- Liu, Z.; Gao, S.; Yuan, Z.; Yang, R.; Zhang, X.; El-Mesery, H.S.; Dai, X.; Lu, W.; Xu, R. Exploring Formation and Control of Hazards in Thermal Processing for Food Safety. Foods 2025, 14, 2168. [Google Scholar] [CrossRef] [Scilit] [PubMed]
- Guo, Q.; Li, T.; Qu, Y.; Liang, M.; Ha, Y.; Zhang, Y.; Wang, Q. New Research Development on Trans Fatty Acids in Food: Biological Effects, Analytical Methods, Formation Mechanism, and Mitigating Measures. Prog. Lipid Res. 2023, 89, 101199. [Google Scholar] [CrossRef] [Scilit] [PubMed]
- Hassen, H.; Topolska, K.; Kij, A.; Sady, M.; Kowalski, S.; Kostogrys, R.B.; Tarko, T.; Franczyk-Żarów, M. Nutritional Value and Fatty Acid Profile of Selected Fermented Food Products (Cheese, Sauerkraut, and Natto) as Vitamin K Sources: Compositional Assessment in the Context of Cardiovascular Disease Risk. Appl. Sci. 2026, 16, 5209. [Google Scholar] [CrossRef] [Scilit]
- Joshi, A.; Ramakrishnan, P.; Fazil, M.; Lakshmanan, P.; Yadav, P. Dietary Unsaturated Fatty Acids Distinctly Associate with the Early Age Sleep-Wake Cycle and Gut Integrity in Aged Fruit Flies, Drosophila melanogaster. Biogerontology 2026, 27, 84. [Google Scholar] [CrossRef] [Scilit] [PubMed]
- Bratu, A.; Mihalache, M.; Hanganu, A.; Chira, N.-A.; Todaşcă, M.-C.; Roşca, S. Quantitative Determination of Fatty Acids from Fish Oils Using GC-MS Method and 1H-NMR Spectroscopy. Sci. Bull. UPB-Ser. B 2013, 75, 23–32. [Google Scholar]
- Todașcă, M.C.; Tociu, M.; Manolache, F.A. Unveiling Adulterated Cheese: A 1H-NMR-Based Lipidomic Approach. Foods 2025, 14, 2789. [Google Scholar] [CrossRef] [Scilit] [PubMed]
- Paszczyk, B.; Tońska, E. Fatty Acid Content, Lipid Quality Indices, and Mineral Composition of Cow Milk and Yogurts Produced with Different Starter Cultures Enriched with Bifidobacterium Bifidum. Appl. Sci. 2022, 12, 6558. [Google Scholar] [CrossRef] [Scilit]
- Gużewska, G.; Monedeiro-Milanowski, M.; Florkiewicz, A.B.; Arendowska, I.; Walczak-Skierska, J.; Białczak, D.; Pomastowski, P.P. Analysis of the Fatty Acid Profile in Cream, Buttermilk Fractions, and Anhydrous Milk Fat: Influence of Physicochemical and Microbiological Parameters on the Fatty Acid Profile. Appl. Sci. 2024, 14, 6117. [Google Scholar] [CrossRef] [Scilit]
- Gómez-Cortés, P.; Juárez, M.; de la Fuente, M.A. Milk Fatty Acids and Potential Health Benefits: An Updated Vision. Trends Food Sci. Technol. 2018, 81, 1–9. [Google Scholar] [CrossRef] [Scilit]
- Mavlanov, U.; Czaja, T.P.; Nuriddinov, S.; Dalimova, D.; Dragsted, L.O.; Engelsen, S.B.; Khakimov, B. The Effects of Industrial Processing and Home Cooking Practices on Trans-Fatty Acid Profiles of Vegetable Oils. Food Chem. 2025, 469, 142571. [Google Scholar] [CrossRef] [Scilit] [PubMed]
- Regulamentul (UE) 1169/2011 (Regulation (EU) No 1169/2011). Available online: https://eur-lex.europa.eu/legal-content/RO/TXT/HTML/?uri=CELEX:32011R1169 (accessed on 15 January 2025).
- Commission Regulation (EU) 2019/649 of 24 April 2019 Amending Annex III to Regulation (EC) No 1925/2006 of the European Parliament and of the Council as Regards Trans Fat, Other Than Trans Fat Naturally Occurring in Fat of Animal Origin. Available online: https://eur-lex.europa.eu/legal-content/RO/TXT/?uri=CELEX:32019R0649&qid=1715422965357 (accessed on 10 December 2025).
- Legea Nr. 182 Din 19 August 2020 Pentru Stabilirea Conținutului de Acizi Grași Trans În Produsele Alimentare Destinate Consumului Uman (Law No. 182 of 19 August 2020 on Establishing the Trans Fatty Acid Content in Food Products Intended for Human Consumpt). Available online: https://op.europa.eu/en/publication-detail/-/publication/8bfc8b3b-6757-11e9-9f05-01aa75ed71a1/language-en?utm_source (accessed on 10 December 2025).
- Voinea, L.; Vicent, D.; Bucur, M.; Negrea, T.M.; Dina, R. Reshaping the Traditional Pattern of Food Consumption in Romania through the Integration of Sustainable Diet Principles. A Qualitative Study. Sustainability 2020, 12, 5826. [Google Scholar] [CrossRef] [Scilit]
- Petroman, C.; Popescu, G.; Szakal, R.; Virgil, P.; Lavinia, P.; Bujanc, G.S.; Chiril, C.A.; Daniel, I.H.; Loredana, V.; Nicoleta, G.H. Fatty Acid Profile of Lipid Fractions of Mangalitza (Sus Scrofa Domesticus) from Northern Romania: A GC-MS-PCA Approach. Foods 2021, 10, 242. [Google Scholar] [CrossRef] [Scilit] [PubMed]
- Hoteit, M.; Zoghbi, E.; Rady, A.; Shankiti, I.; Ibrahim, C.; Al-Jawaldeh, A. Assessment of Industrially Produced Trans Fatty Acids in Traditional Dishes, Arabic Sweets, and Market Food Products and Its Risks on Non-Communicable Diseases in Lebanon. Front. Nutr. 2021, 8, 727548. [Google Scholar] [CrossRef] [Scilit] [PubMed]
- Cojocaru, A.; Badea, G.E.; Maior, I.; Dzitac, S.; Stănășel, O.D.; Sebeșan, M.; Ionaș, C.D.; Creț, P. Electrochemical Investigations of Galium Verum Ethanolic Extract as a Steel Corrosion Eco-Inhibitor in the Acid Media: An Unexpected Versatility of Plant Chemistry. Materials 2025, 18, 2078. [Google Scholar] [CrossRef] [Scilit] [PubMed]
- Badea, G.E.; Maior, I.; Petrehele, A.I.G.; Stănășel, O.D.; Fodor, A.; Sebeșan, M.; Dzitac, S.; Ionaș, C.D. Polyphenol-Driven Interfacial Control: How Achillea Millefolium Extract Modulates Mild Carbon Steel Corrosion in Acid and Neutral Media. Materials 2026, 19, 2008. [Google Scholar] [CrossRef] [Scilit] [PubMed]
- Manolache, F.A.; Iordache, T.A.; Belc, N.; Todaşcă, M.C. Influence of Edible Oil Variety on Trans Fatty Acids Formation During the Frying Process. Rev. Roum. Chim. 2022, 67, 93–99. [Google Scholar] [CrossRef] [Scilit]
- Todașcă, M.C.; Poteraș, C.B.; Iordache, T.A.; Tociu, M.; Tomas, Ș.T.; Ștefan, G.; Manolache, F.A. Quality Evaluation of High-Polyphenol Vinegars Produced from Various Romanian Plum Cultivars. Foods 2025, 14, 3282. [Google Scholar] [CrossRef] [Scilit] [PubMed]
- Lahmam, H.; El Hajjab, A.; El Berri, H.; Gmouh, S.; Mehdad, S.; Benajiba, N.; Attarassi, B.; Aguenaou, H.; Auajjar, N. Mapping the Levels and Sources of Trans Fatty Acids in the Moroccan Diet. Malays. J. Public Health Med. 2025, 25, 108–114. [Google Scholar] [CrossRef] [Scilit]
- Nuriddinov, S.; Mavlonov, U.; Kakhkhorov, S.; Bozorov, S.; Hakimov, B.; Dalimova, D. Ftir-Based Quantification of Thermally Induced Trans Fatty Acids in Commercial Cottonseed Oils: A Spectroscopic and Chemometric Approach. Univers. Chem. Biol. 2025, 131, 28–34. [Google Scholar] [CrossRef] [Scilit]
- Rusita, Y.D.; Rohman, A.; Laksitorini, M.D.; Purwanto, P. The Employment of FTIR Spectroscopy and Multivariate Data Analysis for Authentication Study of Sacha Inchi Seed Oil. Trop. J. Nat. Prod. Res. 2026, 9, 6227–6234. [Google Scholar] [CrossRef] [Scilit]
- Yazdanparast, S.; Mohammadi-Nasrabadi, F.; Hashmati, A.; Rezazadeh, R.; Taheri, M.; Alhouei, B.; Esfarjani, F. Comprehensive Assessment of Fatty Acid Profiles of Meat Products to Develop Action Plan Strategies for Healthier Products. Sci. Rep. 2025, 15, 23188. [Google Scholar] [CrossRef] [Scilit] [PubMed]

Disclaimer/Publisher’s Note: The statements, opinions and data contained in all publications are solely those of the individual author(s) and contributor(s) and not of MDPI and/or the editor(s). MDPI and/or the editor(s) disclaim responsibility for any injury to people or property resulting from any ideas, methods, instructions or products referred to in the content. |
© 2026 by the authors. Licensee MDPI, Basel, Switzerland. This article is an open access article distributed under the terms and conditions of the Creative Commons Attribution (CC BY) license.