


Abstract
Planning lunar construction requires early screening decisions from sparse, instrument-dependent ground observations. This study presents a mechanics-informed evidence-to-decision procedure that separates direct observation, conventional mechanical interpretation, preliminary construction ground zoning, uncertainty closure, and asset-specific verification. Penetration profiles are compared only within a declared compatibility and depth domain. Before any additional state interpretation, density or porosity, grading, particle morphology, stratigraphy, terrain, clasts, disturbance, boundaries, probe configuration, and acquisition limits should be evaluated. A relative mechanical-state hypothesis, formerly described by the analogy, is optional and may be retained only when a compatible response contrast remains after those controls are evaluated and when it changes a defined action beyond the direct observations. It is not a conventional overconsolidation ratio or a design parameter. A worked Apollo 16 example compares compatible Self-Recording Penetrometer records from Station 4 and Station 10/ALSEP over the common upper 20 cm. The published envelopes show a lower, more variable response at Station 4 and a higher, less variable response at Station 10. Density, terrain, and stratigraphic evidence provide plausible conventional explanations, while incomplete co-location and instrument-limited depth prevent demonstrating a residual state effect. The example therefore supports a Class C directional hypothesis and separate preliminary ground units, but no ordinal relative-state class. Station 4 requires denser lateral coverage and stratigraphic correlation; Station 10 requires greater reaction capacity and deeper investigation. These actions follow from the integrated evidence rather than from an designation. The framework contributes an auditable stopping rule, an evidence ledger, and explicit measurements for upgrading, rejecting, or resolving each hypothesis. Design parameters and asset performance remain subject to standardized, project-specific testing.
1. Introduction
The transition from short-duration exploration to sustained lunar operations changes the engineering purpose of surface and subsurface information. Orbital imagery, topography, spectroscopy, radar, and geological interpretation remain essential for regional site selection; construction planning additionally requires the response of the ground within the influence zone of a wheel, blade, footing, drill, anchor, or penetration probe. An engineering ground model must distinguish observation from interpretation, identify the uncertainty controlling each decision, and specify the verification required before designing or accepting an asset. NASA’s recent lunar surface-site-preparation solicitation similarly emphasizes geotechnical site investigation, rock-distribution and stratigraphic characterization, grading, compaction, and verification of constructed regolith infrastructure [1].
The lunar environment prevents a direct transfer of terrestrial overconsolidation ratio (OCR). Terrestrial OCR compares a recoverable maximum past vertical effective stress with the current vertical effective stress. Near the lunar surface, gravity-induced stress is small and approaches zero at the free surface, while impact excavation and ejecta emplacement, gardening, seismic shaking, thermal cycling, mass movement, and human or robotic disturbance alter density, fabric, interlocking, and stratigraphy through non-monotonic and spatially variable paths [2,3]. Apollo and Lunokhod penetration devices measured present response; they were not calibrated to recover a preconsolidation or yield stress. A numerical lunar OCR inferred from those records would therefore imply a historical stress state that was not measured.
This limitation defines the methodological gap addressed here. Before design-grade site investigation is available, construction planners must still decide whether ground areas may remain within one preliminary unit, where subsequent soundings and samples should be placed, how deeply they should extend, which equipment capability is required, and where asset trials must be performed. Direct testing will ultimately establish density, stiffness, strength, load–settlement, mobility, excavation, and anchorage response. The preceding screening decision requires a traceable way to combine sparse present-response observations with terrain, material, stratigraphic, and disturbance evidence without treating the interpretation as a design property.
Apollo and Lunokhod provide the principal legacy evidence of an in situ lunar ground response. Apollo investigations included penetration tests, core-tube sampling, trenching, footprint observations, and trafficability assessment, while Lunokhod produced numerous shallow cone measurements and mobility observations. These records show a general increase in bulk density with depth, substantial local variability, and response contrasts among terrain units [4,5,6,7]. At Apollo 16, compatible Self-Recording Penetrometer (SRP) profiles showed a lower and broader response envelope at Station 4 on Stone Mountain and a higher and narrower envelope in the Station 10/ALSEP area on the Cayley Plains. Adjacent core and drill-stem observations supplied geological context but were not sufficiently co-located to isolate a unique residual state effect [8,9].
Recent work has extended the evidence base through reduced-gravity experiments, terrestrial testbeds, discrete-element simulations, and static and dynamic probe development [10,11,12,13,14,15,16]. These studies strengthen penetration testing as a lunar investigation method, but they do not establish a device-independent resistance scale or a universal conversion to density, strength, or construction performance. Probe geometry, insertion mode, reaction, gravity, preparation, density, particle morphology, stratigraphy, and boundaries remain part of the calibration domain.
This paper presents a mechanics-informed evidence-to-decision procedure for early lunar construction-site screening. Existing practice can compare penetration profiles, describe differences between locations, and discuss possible effects of density, terrain, stratigraphy, or test configuration. The new value of the proposed procedure is the controlled and auditable transition from those observations to a construction decision. It requires the analyst to declare the comparison and decision in advance, confirm data compatibility, evaluate conventional explanations, define preliminary construction ground units, identify the measurements needed to close uncertainty, and specify the asset-level verification that remains necessary.
The procedure also introduces a counterfactual decision test: the work plan obtained from the direct integrated evidence is compared with the work plan obtained after an optional relative mechanical-state interpretation. The interpretation is retained only when it changes a documented ground unit, investigation action, verification test, risk treatment, hold point, or predicted boundary. If the same decision follows from the direct evidence alone, the additional descriptor is omitted. The principal contribution is therefore the decision-control process rather than a new material property or another empirical classification scale.
A relative mechanical-state hypothesis, formerly described by the analogy, remains an optional output. The asterisk denoted only a limited analogy with path-dependent terrestrial response; it does not signify a recovered maximum past stress or a numerical ratio. The revised framework uses neutral terminology because the OCR analogy could otherwise be mistaken for a stress-history measurement.
The paper addresses three questions: (1) how can compatible lunar penetration observations be converted into auditable screening actions; (2) where must the interpretation stop when conventional controls, co-location, or uncertainty data are incomplete; and (3) what future investigation and calibration protocol is required to upgrade, reject, or resolve the resulting hypotheses? The worked Apollo 16 application intentionally tests both the usefulness and the stopping rule of the procedure. It does not rank general site quality or claim quantitative validation.
2. Engineering and Geomechanical Basis
2.1. The Construction Decision Problem
A construction ground model converts observations into a decision-specific representation of ground conditions and is revised as evidence improves. During early lunar planning, the relevant decisions include whether candidate work areas can be treated as one preliminary construction ground unit, where rover or drill investigations should be concentrated, how deeply a probe should investigate, which response range should be carried in equipment and logistics planning, and which assumptions require field trials before final design.
Penetration profiles contribute direct mechanical evidence, but their interpretation is non-unique. A response contrast may reflect density, stratigraphy, particle morphology, fabric, a clast encounter, disturbance, a boundary effect, or the instrument and procedure. The screening product must preserve the measured response and provenance, evaluate alternative explanations, state the confidence and limits, and attach a specific closure or verification action. A relative mechanical-state hypothesis is considered only after these steps and is omitted when it changes no decision beyond the integrated direct evidence.
2.2. Lunar Regolith as a History-Conditioned Granular Material
Lunar regolith develops through impact fragmentation and comminution, excavation and ejecta emplacement, burial and exhumation, impact gardening, seismic disturbance, agglutinate formation, mass movement, thermal exposure, and human or robotic disturbance [2,3]. These processes act over different depths and timescales and can modify bulk density, particle-size distribution, particle morphology, contact orientation and coordination, anisotropy, interlocking, and stratigraphic sequence. A single process may loosen the near surface while burying or densifying an underlying interval. The present state consequently reflects both the constituent material and the path of emplacement and reworking.
Apollo core and drill-stem measurements show a general increase in bulk density through the upper decimeters together with substantial variation among sites, stations, and depth intervals [4,5]. The source literature relates that variation to composition and specific gravity, particle shape, grading, relative density, and geological history. Impact-induced vibration and seismic shaking can rearrange the granular skeleton, while continued gardening can loosen and mix the shallowest material. Thermal cycling contributes to the progressive breakdown of exposed rocks and clasts; its contribution to bulk densification of loose regolith remains a calibration question. High penetration resistance under small gravitational overburden is therefore compatible with established behavior of dense, angular, interlocked granular material and requires no anomalous stress mechanism.
Path dependence is well established in granular mechanics. Materials at a similar void ratio or relative density can exhibit different stiffness, dilatancy, peak strength, and localization because their preparation histories and fabrics differ [17,18,19]. Reduced-gravity tests on CUMT-1 simulant further show that penetration resistance varies with both gravity and relative density, that the gravity effect becomes less pronounced at high relative density, and that the normalized resistance is highly sensitive to both variables. The accompanying discrete-element analysis attributes the response to gravitational stress together with frictional and interlocking force chains above the cone [15]. Penetration response consequently supports a mechanical-state assessment but cannot be inverted uniquely to density, fabric, or loading history.
In this paper, a relative mechanical-state hypothesis denotes a repeatable present-response difference that may be associated with history-conditioned fabric after current confinement, density or porosity, grading, particle morphology, clasts, stratigraphy, disturbance, and test configuration have been evaluated. Fabric comprises particle arrangement and orientation, contact distribution, anisotropy, and interlocking within the granular skeleton. The hypothesis is not retained where conventional controls account for the useful contrast.
2.3. Present Stress and Penetration Response
For dry regolith at depth z, measured positive downward from the local ground surface, the present gravity-induced vertical stress carried by the granular skeleton may be estimated as
where is bulk density at integration coordinate and is lunar gravitational acceleration. This expression provides the present gravitational-overburden reference. The stress field mobilized beneath a penetrator, wheel, blade, footing, or anchor is three-dimensional and depends on the surface boundary, horizontal stress, material anisotropy, and the relative scales of the device, particles, and affected ground volume. Because as , any stress-normalized quantity requires a calibrated lower depth bound and remains undefined at the free surface.
An advancing cone displaces and compacts particles ahead of its tip and mobilizes a three-dimensional zone of compression, radial displacement, and shear. The measured axial force may include cone-tip bearing, shaft friction, seal or mechanism friction, inertial effects, and reaction-system effects. Area-normalized tip resistance is reported only when the source separates the tip force and documents the projected area. Otherwise, the generic source-reported penetration response is retained; conventional CPT notation is reserved for a documented cone-tip measurement with the applicable geometry and procedure [20,21].
Tip resistance develops from the stress level and material response mobilized within the affected zone. Present confinement, density or void ratio, friction, dilatancy, particle angularity and interlocking, grading, particle crushing, fabric anisotropy, and the ratio of cone size to particle size influence the response. Stratigraphic interfaces, clasts, the free surface, and local or testbed boundaries alter the size and shape of the failure mechanism. Lunar gravity reduces gravity-induced confinement but does not remove contact forces, fabric effects, or penetration-induced stress. The response therefore cannot be inverted uniquely to density, strength, or mechanical history without device- and material-specific calibration. Conceptually,
where n is porosity, PSD is particle-size distribution, M represents particle morphology and particle strength, is fabric and interlocking, S is stratigraphy and relevant boundaries, C represents clasts and inclusions, D is disturbance, is probe geometry, is the test procedure, and A is the acquisition system. Within a declared material family, and n are related through particle density; the evaluation uses the better-supported measurement and records the assumed particle density. Equation (2) is a dependency statement. Calibration requires a defined material, instrument, procedure, gravity level, boundary condition, and response quantity. The many-to-one mapping explains why penetration response alone cannot establish a unique state or history.
Static and dynamic probes also mobilize different measurement systems. A static test records force with penetration depth and rate; a dynamic test additionally depends on delivered impact energy, hammer efficiency, inertia, and displacement or blows per impact. Static and dynamic results may be related only through controlled side-by-side calibration over the relevant density, material, gravity, and boundary domain [14].
2.4. Density as a Primary Comparison Control
Density is a primary control on penetration and loading response and must be used where reliable, depth-matched data exist. Each comparison should record the density source, sampled support volume, depth interval, spatial offset from the penetration test, recovery or preparation disturbance, particle-density assumption, and uncertainty. Core density and penetration measurements commonly represent different ground volumes and were rarely co-located in the Apollo record.
Density nevertheless provides only one part of the state description. Comparable bulk density can arise from different particle shapes, gradings, depositional paths, and contact fabrics; disturbance may reorganize contacts and alter resistance before an equivalent bulk-density change is measurable [17]. The screening sequence therefore evaluates density together with stratigraphy, terrain, material characteristics, clasts, disturbance, boundaries, and measurement effects. Where those controls account for the useful response contrast, the direct observations and conventional ground interpretation govern the decision. Missing or non-co-located controls reduce confidence and may restrict the result to a directional hypothesis or unresolved outcome. Section 3 formalizes that stopping rule.
Table 1 separates the evidence, interpretation, screening action, and asset-verification levels. This separation prevents a provisional state class from being used as a strength, stiffness, mobility, excavation, or anchorage parameter.
Table 1.
Separation of direct observation, mechanical interpretation, construction screening, and asset verification.
2.5. Recent Lunar Penetration and Geotechnical Studies
Recent lunar geotechnical work has moved from historical mission interpretation toward controlled testbeds, reduced-gravity experiments, numerical penetration models, and flight-oriented instruments. Li et al. [10] showed that the cone response in the CUMT-1 simulant varies with both gravity and density and that simple gravity normalization does not remove state dependence. Lucas et al. [11] reconstructed Apollo 16-type highlands profiles in a terrestrial testbed and showed that cone response depends on the prepared stratigraphy and the gravity-transfer assumption. Zhao et al. [12] used three-dimensional discrete-element simulations to examine cone penetration and strength-index interpretation in lunar regolith.
Flight-oriented and dynamic systems occupy different calibration domains. Glover et al. [13] reported SPARTA cone measurements intended to inform in situ density and stratigraphy, whereas Slumba et al. [14] developed a dynamic cone system whose response depends on cone geometry, impact energy, density, and conversion to static penetration. Chen et al. [15] further quantified the influence of low gravity on penetration resistance. Complementary testbed work by Jehn et al. [16] showed that simulant fidelity requires density, compressibility, shear strength, grading, and particle morphology to be considered together rather than inferred from particle-size distribution alone.
Together, these studies support penetration testing as an important lunar investigation method but do not establish a device-independent classification or a universal conversion to design parameters. Static cone response, dynamic penetration, plate or wheel response, and numerical strength indices must retain their respective calibration domains. The present framework uses this literature to define compatibility, control variables, uncertainty, and verification requirements; it does not pool unlike instruments into a single resistance scale.
3. Evidence-to-Decision Procedure and Optional State Hypothesis
3.1. Scope, Terminology, and Relation to Established Approaches
The procedure separates five outputs: direct observation, conventional mechanical interpretation, preliminary construction ground zoning, uncertainty-closure action, and asset-specific verification. The first four may be supported during early screening; the fifth requires project-specific tests and analyses. This hierarchy is the principal contribution of the framework.
A relative mechanical-state hypothesis is a comparator-specific interpretation that a present response contrast may reflect a persistent difference in granular fabric or state after conventional controls have been evaluated. For standardized future datasets, a relative state may be described as lower, comparable, higher, mixed, or unresolved over a declared interval and relative to a declared comparator. For sparse legacy evidence, Class C denotes a directional hypothesis only and does not authorize an ordinal class. The notation that motivated the original study is retained only as historical context. It is not used as a calculated quantity in the Apollo 16 application.
Table 2 distinguishes the revised procedure from common geotechnical approaches. The comparison is functional rather than hierarchical: each method answers a different question within its calibration domain.
Table 2.
Comparison with established geotechnical interpretation and classification approaches.
3.2. Compatibility Gate and Evidence Ledger
Direct comparison is permitted for identical instruments and procedures over a common evaluable interval. Different configurations are comparable only where a side-by-side transfer calibration demonstrates that bias and prediction uncertainty are smaller than the predeclared decision margin and do not reverse the directional ranking. For non-identical systems, compatibility is accepted only when the 95% prediction interval of the transfer relation is smaller than the minimum response difference that would change the engineering decision. Table 3 shows that the calibration report, not the legacy record, defines the resulting allowable ranges. Uncalibrated differences fail the gate.
Table 3.
Performance-based compatibility requirements.
The evidence ledger records the construction decision, comparator, coordinates, terrain, common depth interval, spatial support, source response quantity, profile count, variability, uncertainty, censoring, conventional controls, alternative explanations, judgment, confidence, and closure action. Each evidence domain is reported as supporting, opposing, neutral, unavailable, or non-independent. Evidence used to explain a contrast is not counted again as independent confirmation of a residual state effect.
3.3. Decision Sequence and Permitted Outputs
The procedure follows a fixed sequence:
- Declare the comparison. Record the decision, candidate unit, comparator, coordinates, terrain, common interval, spatial support, and response quantity.
- Apply the compatibility gate. Confirm geometry, procedure, acquisition, depth datum, response definition, reaction, boundaries, and overlapping depth support. A failed gate produces an unresolved result.
- Predeclare one primary directional metric. A mean, median, envelope, gradient, transition depth, variability measure, or exceedance frequency is selected before interpretation. Secondary metrics are sensitivity checks, not alternatives chosen after the outcome is known.
- Report variability and limits. State profile count, within-unit variability, measurement uncertainty, spatial offsets, and treatment of instrument-limited or censored observations.
- Evaluate conventional explanations. Consider density or porosity, grading, morphology, stratigraphy, terrain, clasts, disturbance, boundaries, probe configuration, and acquisition limits. Define preliminary units from the integrated evidence.
- Assign the permitted output and action. Conflicting or direction-changing evidence produces mixed or unresolved. Missing controls may limit the result to a Class C directional hypothesis. An ordinal relative-state output is eligible only when a residual contrast remains after the conventional controls have been evaluated and the interpretation changes a defined action beyond the direct observations.
Confidence qualifies the interpretation, not the measured value. Table 4 links evidence quality to the permitted output.
Table 4.
Confidence classes and permitted outputs.
3.4. Added Value Relative to Existing Practice, Stopping Rule, and Rejection
The framework extends conventional descriptive interpretation by requiring every inference to terminate in a documented construction-screening decision. Its added value is not established merely by assigning a new name to a penetration contrast. It is established when the procedure changes how the ground is divided, where and how it is investigated, which equipment range is required, where verification trials are performed, or which uncertainty must be closed before work proceeds.
Table 5 distinguishes this contribution from the normal interpretation of sparse penetration records.
Table 5.
Added value of the evidence-to-decision procedure relative to existing descriptive practice.
Incremental value is tested by comparing the preliminary ground zoning, investigation geometry, equipment requirement, verification plan, and hold points obtained from the integrated direct evidence with those obtained after the optional state interpretation. If the outputs are the same, the descriptor is omitted.
The hypothesis is downgraded or rejected when standardized repeat measurements fail to reproduce its direction, co-located controls remove the residual contrast, the predicted boundary is absent, uncertainty reverses the interpretation, or independent asset-response tests show no added predictive value. If repeated validation cases produce the same decisions as the direct evidence alone, the optional descriptor is withdrawn from that application domain.
3.5. Terminology and Application Restrictions
The applicable domain is early construction-site screening and investigation planning. Penetration response is the generic term for source-reported insertion force or area-normalized response; is reserved for documented cone-tip resistance. A construction ground unit is a revision-controlled ground volume that is sufficiently consistent for a stated investigation or construction decision. A confidence class qualifies an interpretation, not a measurement.
The optional relative-state hypothesis is not terrestrial OCR, a recovered past stress, a numerical design ratio, or a ranking of general site quality. Strength, stiffness, load–settlement response, trafficability, rut depth, drawbar pull, cutting energy, excavation production, anchor capacity, and compaction acceptance must be established through asset-specific testing and analysis. Geological history remains a set of alternative hypotheses unless independently constrained.
4. Worked Legacy-Data Application: Apollo 16
4.1. Data Provenance, Compatibility, and Processing Sequence
Apollo and Lunokhod devices differed in cone diameter, apex angle, penetration mechanics, reaction, and recorded quantity. Cross-mission envelopes are useful for showing the range of response, but they are not a basis for numerical ranking without device-specific transfer calibration [4,5]. The worked example is therefore restricted to Apollo 16: four Station 4 and five Station 10/ALSEP cone tests obtained with the same SRP system.
The processing sequence in Table 6 was applied before interpretation. No individual curves were digitized from the adapted figure, and no new mean, variance, confidence interval, preconsolidation stress, or numerical ratio was calculated. The published resistance envelope is the primary descriptive metric.
Table 6.
Apollo 16 source-data processing and decision sequence.
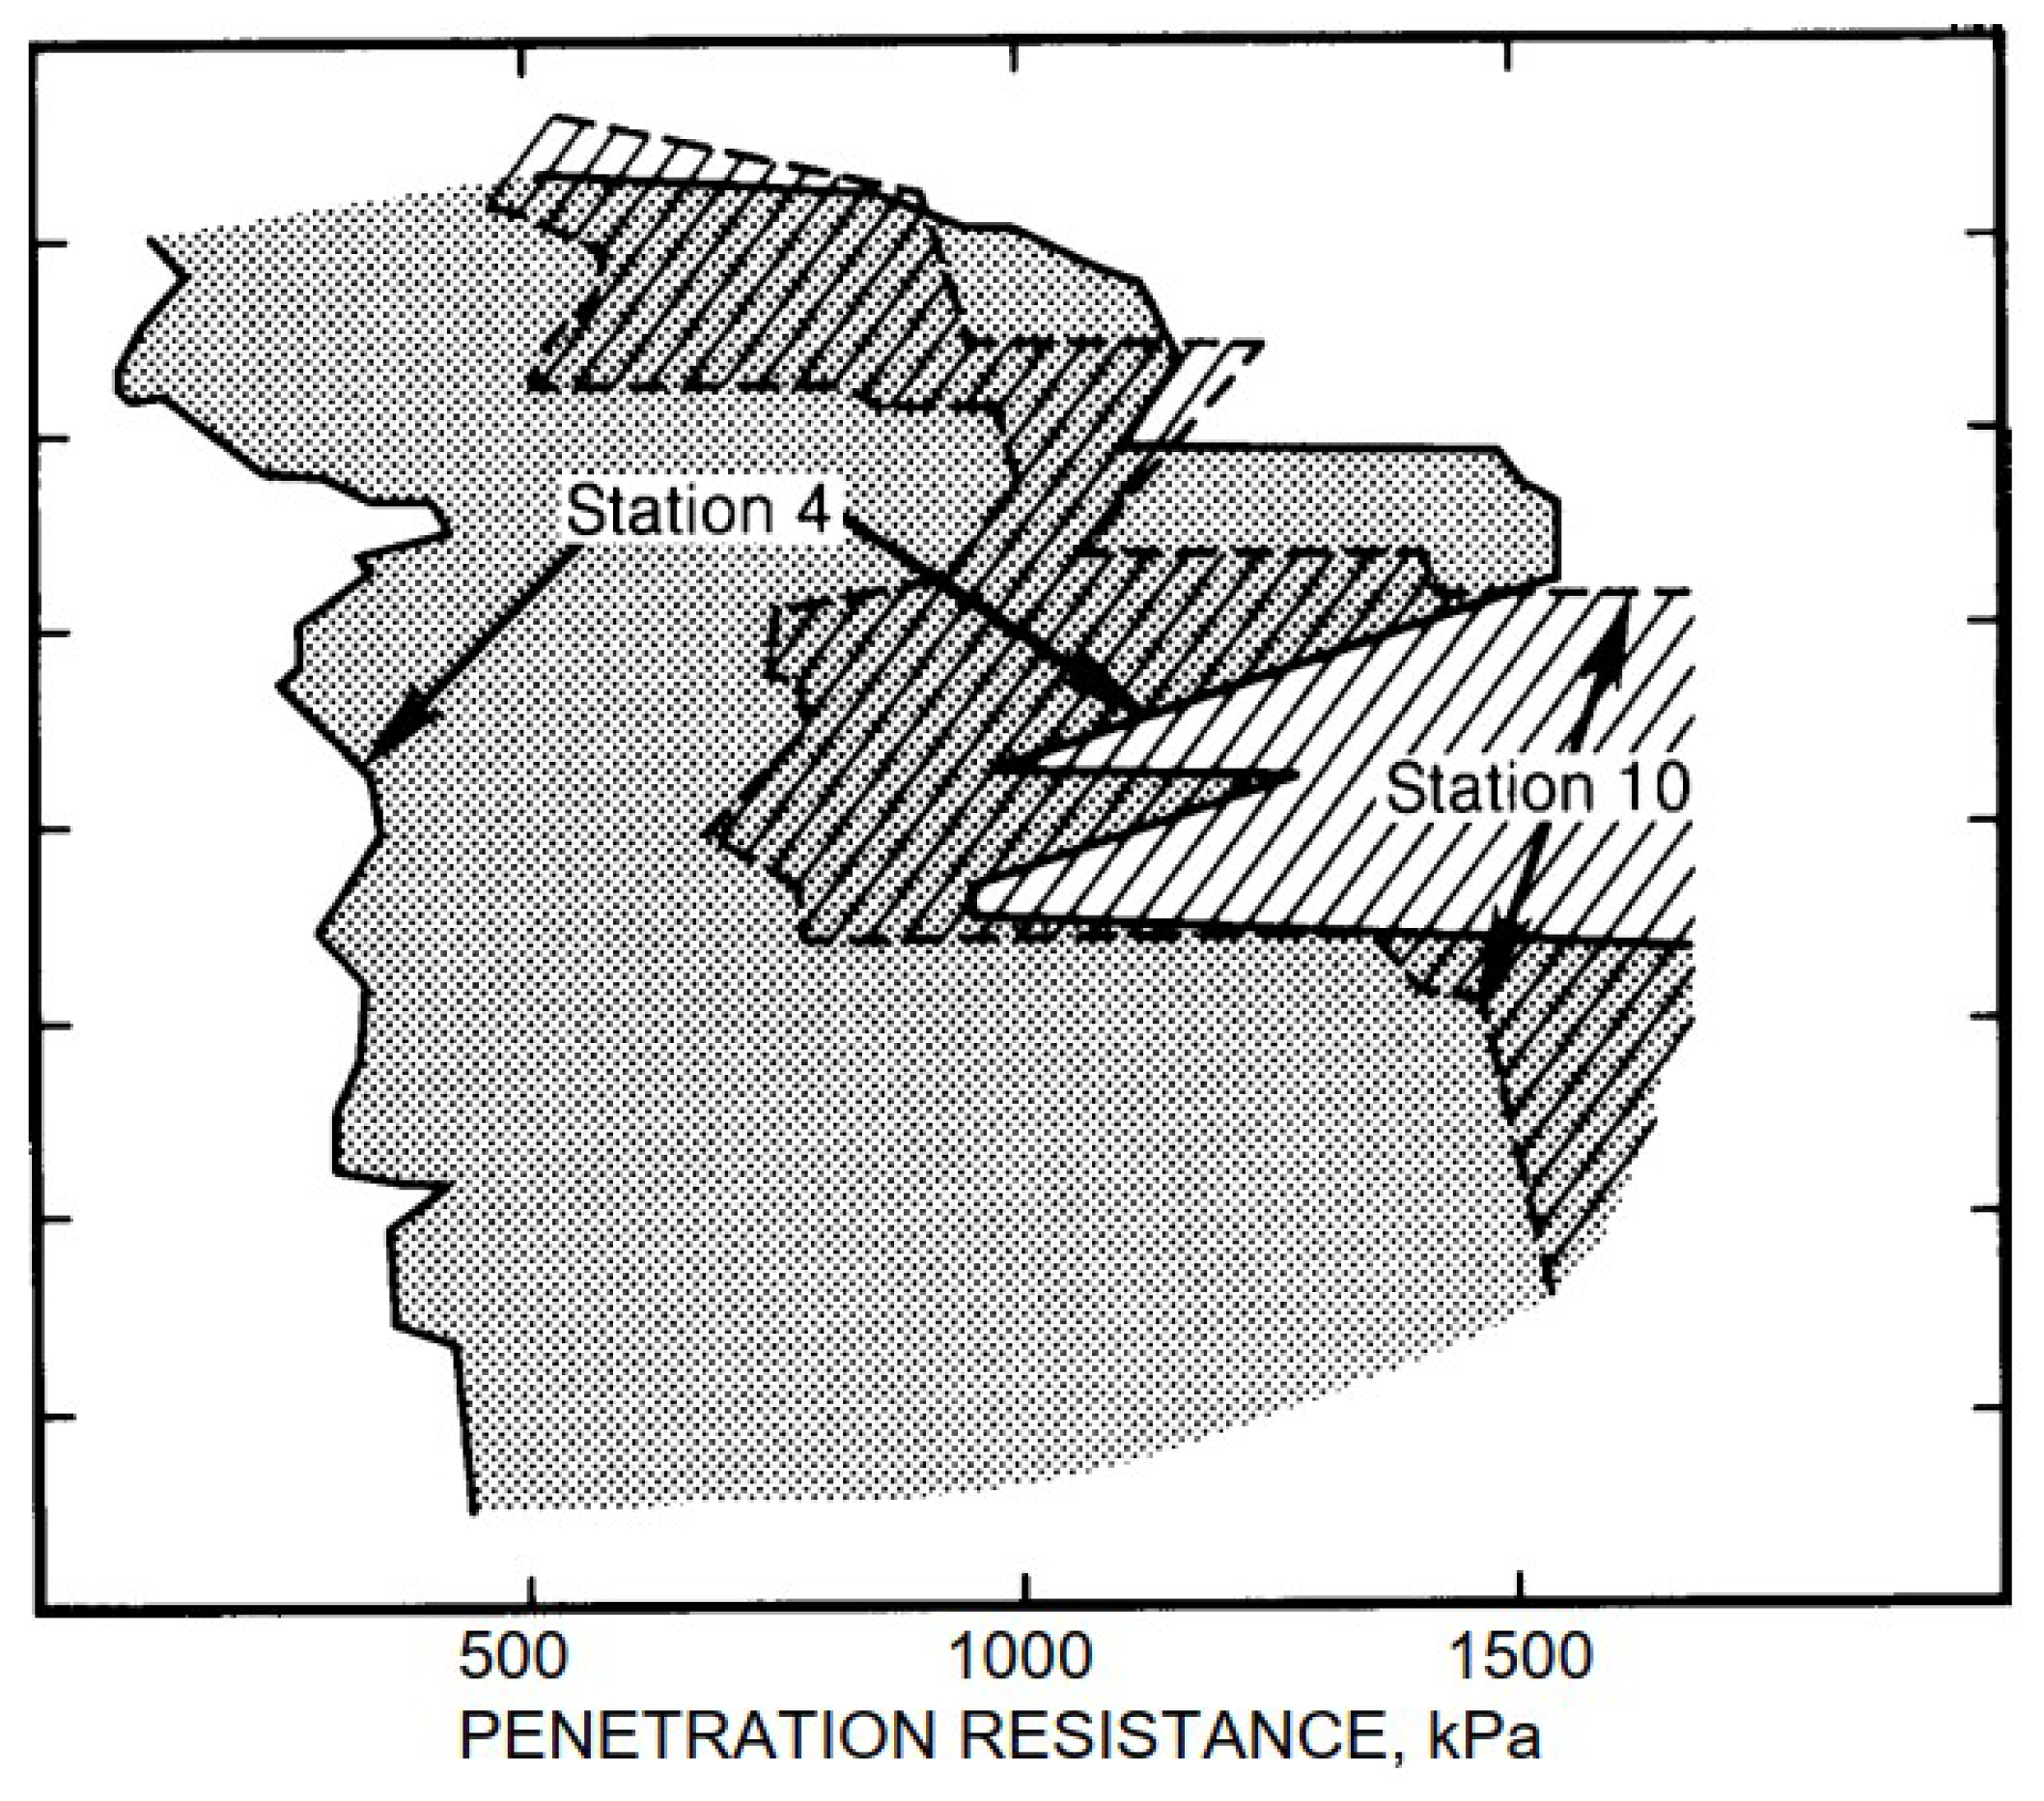
The published resistance envelopes used for the directional comparison are shown in Figure 1.
Figure 1.
Published Apollo 16 Self-Recording Penetrometer (SRP) resistance envelopes for Station 4 and Station 10/ALSEP. The dotted envelope represents Station 4, whereas the diagonally hatched envelope represents Station 10/ALSEP, where ALSEP denotes the Apollo Lunar Surface Experiments Package. Penetration resistance is reported in kilopascals (kPa). The figure is adapted from (Carrier et al. [5], Fig. 9.34) using the original data reported by Mitchell et al. [8]. The envelopes summarize previously reported response ranges and are not new depth-matched analyses or interpreted stratigraphic boundaries. They are used only for the declared directional comparison over the common upper 20 cm.
4.2. Direct Observations and Conventional Controls
Station 4 was located on the Stone Mountain slope in Descartes material affected by South Ray Crater ejecta. The published envelope is broad, and individual records identify local softer intervals between firmer material. Comparison with an adjacent double core led the Apollo investigators to infer an ejecta-related contact varying from approximately 20 to 50 cm over the investigated area [8]. The direct observations are therefore a lower average response, greater lateral and vertical variability, and a complex shallow profile with rock fragments decreasing with depth.
Station 10/ALSEP was located on generally level intercrater terrain on the Cayley Plains. Its envelope is narrower and higher than Station 4. A profile integrating SRP records, the Station 10 core, and the ALSEP drill core identified five interpreted layers attributed to repeated impact deposition and reworking. Density over the investigated depth was generally higher on the Cayley Plains than on Stone Mountain [8]. The Lunar Sourcebook summarized Station 10 as stronger than Station 4 and reported that deeper penetration commonly exceeded the SRP recording capacity below approximately 20 cm [5].
These density, terrain, stratigraphic, and fragment differences are plausible conventional explanations for the response contrast. They are not sufficiently co-located or quantified to calculate a depth-matched residual after their effects are removed. The shaded response envelopes also must not be interpreted as stratigraphic boundaries; genuine vertical interpretation comes from individual profiles and core evidence.
4.3. Evidence Ledger and Permitted Output
Table 7 records the decision-relevant evidence and explicitly separates observation from interpretation. The data support a within-mission directional comparison and separate preliminary ground units, but not lower and higher ordinal state classes.
Table 7.
Apollo 16 evidence ledger and permitted screening output.
4.4. Incremental Value Beyond the Raw Response
The direct SRP observations and conventional supporting evidence already justify separate preliminary units and different investigation programs. Table 8 therefore compares the decisions before and after an optional state interpretation. The outputs do not change, so the stopping rule requires the descriptor to be omitted. The Apollo 16 example demonstrates procedural value—compatibility, provenance, uncertainty, censoring, alternative explanations, and closure actions—but it does not demonstrate a decision uniquely created by .
Table 8.
Direct integrated evidence versus the optional state descriptor.
4.5. Use of Other Apollo and Lunokhod Records
Other Apollo and Lunokhod measurements remain valuable as contextual evidence and targets for reprocessing. They show substantial variation with site, terrain, depth, and probe geometry, and the Lunokhod program provides extensive shallow spatial coverage. Without common-response calibration they support source-specific hypotheses, not an absolute site ranking or cross-mission resistance scale. Their proper use is to identify candidate contrasts, define new-instrument range and resolution requirements, and target standardized co-located investigation.
5. Application to Construction-Site Screening
The construction-screening function of the revised framework is to determine whether preliminary ground units may remain combined, require separate investigation, or require a controlled trial before a design basis is established. The framework is applied after candidate areas and preliminary asset concepts have been identified and source-traceable in situ evidence is available. Its direct output is a change in investigation location, spacing, depth, sequence, method, or verification. An optional relative-state hypothesis is considered only after these direct outputs have been established. Site suitability and asset performance remain products of the complete ground model, project constraints, and asset-specific testing.
The screening unit is the ground engaged by a stated construction activity, rather than an entire landing site. Its lateral extent and depth are defined by the preliminary footprint or alignment, construction method, load-transfer or disturbance zone, and the consequence of encountering conditions outside the assumed range. A mobility route, excavation, prepared work pad, shallow foundation, and anchor may therefore require different screening intervals within the same candidate area.
5.1. Position Within Phased Lunar Site Investigation
Lunar site investigation proceeds from regional context to local measurement and finally to asset-specific verification. Remote sensing, topography, terrain interpretation, and available geophysics identify candidate areas and interfaces requiring field confirmation. They support mapping of slopes, crater and ejecta relations, boulder concentrations, possible regolith-thickness changes, shallow interfaces, and operational constraints [5,25].
Preliminary in situ investigation then obtains replicated penetration profiles and co-located information on density or porosity, grading, particle morphology, clasts, stratigraphy, disturbance, and relevant geophysical interfaces. The evidence is evaluated using the compatibility, directional, convergence, and action rules in Section 3. A provisional relative-state class enters screening only where those rules are satisfied and where it changes a predeclared action beyond the direct evidence. A Class C hypothesis or Class U outcome remains useful for targeting investigation but does not become a construction ground classification. The role of the evidence-to-decision procedure within the phased lunar construction-site investigation is summarized in Table 9.
Table 9.
Role of the evidence-to-decision procedure within phased lunar construction-site investigation.
The legacy application in Section 4 demonstrates the stopping rule. The Apollo 16 Station 4 and Station 10 records support separate investigation of slope and intercrater terrain because their settings and measured responses differ. Incomplete co-location and material, stratigraphic, clast, and procedural controls prevent an ordinal relative-state class. Accordingly, those records define investigation zones and the measurements needed to resolve them, but they do not identify a preferred construction site.
Candidate-site comparison remains broader than the present framework. Terrain, slope, boulder abundance, regolith thickness, shallow rock or voids, illumination, thermal conditions, plume exposure, access, communications, logistics, and mission risk retain their independent roles. The framework may compare the extent and consequence of unresolved ground conditions and the effort required to close them. A candidate with more complete evidence is better characterized, but is not necessarily mechanically superior; unsampled ground remains unclassified rather than being assigned an adverse condition.
5.2. Construction Ground Zoning and Investigation Register
A construction ground unit is a three-dimensional, revision-controlled volume within which the available geological, geophysical, material, and mechanical evidence is sufficiently consistent for a stated investigation or construction decision. It is asset- and depth-dependent. A geomorphic unit may contain more than one construction ground unit where a buried interface, block-rich interval, disturbed surface zone, or repeatable mechanical transition intersects the affected ground volume. Conversely, units should not be subdivided where the apparent difference lies within combined measurement and spatial uncertainty.
Initial zoning is established from terrain, geological, stratigraphic, geophysical, clast, disturbance, and direct mechanical evidence. Penetration profiles test whether the mapped units exhibit a reproducible mechanical contrast. Where an independently measured property or interface explains that contrast, the measured control defines the unit and no additional state label is required. An optional relative-state class may alter an investigation boundary or define a separate verification zone only after the rules in Section 3 are satisfied. An unresolved cause is recorded as an uncertainty requiring investigation, while incompatible or unsampled ground remains unclassified.
Neither a unit name nor an optional relative-state direction carries a favorable or unfavorable construction meaning. The hypothesis identifies a contrast whose spatial extent, cause, and engineering consequence may need to be verified separately. If direct terrain, stratigraphic, material, or mechanical evidence already produces the same boundary and investigation action, the optional label is omitted under the incremental-value rule.
Each evaluated unit and interface is entered in a georeferenced investigation register. Measurement uncertainty, spatial ground variability, and interpretive uncertainty are recorded separately so that a limitation in instrument quality is not concealed within a general ground-risk rating.
Investigation priority increases where an indeterminate contrast intersects a critical foundation, excavation, work pad, anchor zone, or required access route; a terrain or geophysical boundary crosses the asset footprint; available profiles terminate above the formation, excavation, or load-transfer depth; sparse coverage requires unsupported interpolation; or late resolution could change layout, equipment, logistics, construction method, or acceptance testing. Priority is therefore controlled by consequence and uncertainty rather than by an assumed higher or lower state direction. The minimum content required for a construction-screening investigation register is presented in Table 10.
Table 10.
Minimum content of the construction-screening investigation register.
The screening process contains three decision gates. The comparison gate establishes whether the evidence is compatible and covers the relevant ground volume. The interpretation gate applies the assignment and confidence rules in Section 3; a measured conventional control governs where it explains the contrast, and unresolved evidence remains unclassified. The verification gate establishes the required asset–ground response through an independent test representing the applicable geometry, loading, preparation, equipment, and operational sequence.
5.3. Asset-Specific Screening and Verification
The consequence of a mechanical contrast depends on the asset and construction process because each engages a different ground volume. The framework therefore identifies where separate characterization or trials are required, while the response quantities entering design and construction acceptance are established independently.
The following examples illustrate how the procedure can change an actual investigation or construction work plan without converting penetration response directly into a design parameter:
- Mobility corridor. Where a proposed haul or rover route crosses a change in terrain and penetration response, the procedure divides the alignment into separate investigation segments, places closer soundings on both sides of the suspected transition, and locates wheel or track trials within each segment. If the transition is confirmed and materially affects mobility performance, the project may modify the alignment, ground preparation, vehicle operating limit, or recovery provision. Drawbar pull, sinkage, rutting, and trafficability are still established by representative mobility tests.
- Landing-pad, work-pad, or shallow-foundation footprint. Where contrasting response envelopes occur within the anticipated load-influence zone, the procedure requires the units and their boundary to be mapped separately and places plate or foundation trials on both sides of the transition. A hold point is maintained before final formation preparation until the boundary and load-settlement response are verified. The resulting decision may be to combine the units, treat them separately, remove and replace a local zone, modify the foundation concept, or relocate the footprint.
- Shallow excavation or utility trench. Where penetration terminates against a high-response layer or shows irregular intervals consistent with clasts, blocks, or a shallow interface, the framework requires a higher-capacity or alternative probe, boundary traverses, and a representative excavation trial. The output is an equipment-range and investigation decision, including possible provision for ripping, drilling, breaking, or block handling; it is not an inferred excavation-production rate.
- Anchor or hold-down system. Where the proposed embedment interval crosses different preliminary ground units, installation and proof-load trials are allocated to each unit. Installation thrust, torque or energy, pullout response, displacement, and cyclic degradation are measured directly. Penetration response determines where separate verification is required but does not substitute for anchor-capacity testing.
The permitted screening use and independent verification requirements for each asset–ground interface are summarized in Table 11.
Table 11.
Asset-specific screening use and independent verification.
Earthworks require particular care because excavation, transport, placement, processing, and repeated traffic create new material states. A pre-construction screening interpretation may guide selection of source zones or trial locations, but it does not remain an acceptance classification for the placed layer. The constructed condition is accepted from its placement record and measured performance.
The construction-screening deliverable is therefore a georeferenced register and, where the spatial support permits, a map or three-dimensional investigation model showing provisional construction ground units, investigated intervals, unresolved boundaries, unclassified ground, preliminary asset footprints, and verification locations. It records why mapped units may remain combined or require separate investigation; asset response enters design only after the independent verification appropriate to that asset.
6. Future Investigation, Calibration, and Acceptance Protocol
The framework requires a reproducible test program before an ordinal relative-state class or a transferable threshold is used. The protocol below converts the general requirements into a staged procedure for future testbed and mission investigations.
All numerical tolerances, replicate counts, spatial-layout rules, and minimum sample sizes introduced in this section are author-proposed provisional planning values. They have not been validated as universal lunar geotechnical thresholds and are not design parameters, construction acceptance criteria, or equipment-interoperability standards. They are included to make the proposed validation program testable and to prevent uncontrolled differences in instrumentation, procedure, and spatial support from being treated as differences in ground condition.
The governing performance principle is that measurement uncertainty, procedural variation, boundary effects, and transfer-calibration error must remain sufficiently smaller than the project-defined decision margin that they cannot create or reverse the interpreted response contrast. Before project use, the initial values must be evaluated through instrument calibration, repeatability testing, sensitivity analysis, and pilot data obtained for the applicable material, gravity, environmental condition, probe system, and construction decision. A project may tighten, relax, or replace a provisional value only where the resulting qualification study demonstrates that the change does not alter the decision. Until such validation is available, failure to meet a provisional gate requires the datasets to remain in separate response domains or the comparison to be classified as unresolved.
6.1. Step-by-Step Investigation Protocol
- Define the decision and ground volume. State the asset or activity, the affected depth and footprint, the comparator, the smallest response difference that would change an investigation action, the smallest lateral feature that must be resolved, and the consequence of a wrong classification.
- Qualify the material. For returned material or a simulant, document provenance, mineralogy, particle density, grading, particle shape and angularity, agglutinate or glass content where applicable, moisture and atmosphere, reuse, and the ratio of probe diameter to characteristic and maximum particle size. A simulant is accepted only for the properties and response mechanisms it reproduces; no single simulant is assumed to represent all lunar regolith.
- Prepare independent reference states. Homogenize each batch and place it in measured lifts by a predeclared procedure such as controlled pluviation, tamping, or vibration. Prepare at least three independently rebuilt specimens for each target state rather than three tests in one undisturbed container. Verify bulk density or porosity at no fewer than three locations and two depths per specimen. Include at least a loose/reference/denser preparation or an equivalent set of undisturbed, trafficked, loosened, and compacted paths relevant to the decision.
- Qualify the instrument and reaction system. Record cone and shaft geometry, surface condition, tip–shaft separation, alignment, insertion mode, rate control, force range and calibration, sampling rate, depth datum, system compliance, reaction capacity, and boundary distances. Use the provisional gates in Table 12 as initial within-campaign screening criteria before combining profiles. These values must be confirmed or revised through instrument-specific calibration, repeatability testing, and sensitivity analysis for the declared decision margin .Table 12. Author-proposed provisional instrument and acquisition gates for future standardized screening tests. The numerical values are initial planning defaults requiring project-specific qualification and future validation.
- Build the calibration matrix. Obtain at least three penetration profiles in each of the three independent specimens for every reference state, giving a minimum of nine profiles per state. Randomize the test order and position, avoid previously disturbed volumes, and repeat the matrix at each gravity or environmental condition for which transfer is claimed. Use side-by-side tests to calibrate different probe configurations; otherwise, keep their response scales separate.
- Estimate variability and spatial correlation. Use pilot data to estimate measurement repeatability, within-unit variability, the pooled standard deviation of the predeclared metric, and the lateral correlation range . Separate instrument variance, preparation variance, and spatial variance where the design permits.
- Set the field or testbed layout. Use mapping spacing and bracket a suspected boundary with at least two soundings on each side. Profiles counted as statistically independent must be separated by at least the estimated ; closer profiles may map local structure but do not increase the effective independent sample size. Extend the investigation through the complete asset influence zone and below any response transition that could change the decision.
- Acquire co-located controls. At each predefined cluster, obtain or correlate density or porosity, grading, morphology, clast and stratigraphic records, terrain and disturbance observations, and relevant geophysics. Record the spatial support and offset of every control rather than treating station-wide averages as depth-matched measurements.
- Process and classify without outcome-driven choices. Preserve raw force, depth, time, rate, and housekeeping channels. Apply documented zero, compliance, area, and calibration corrections; flag overload and saturation; treat out-of-range values as censored; and use the predeclared depth window, metric, filter, outlier rule, and uncertainty model. Apply the compatibility and evidence gates before assigning any confidence class.
- Verify the decision independently. Test the predicted boundary or state contrast with a held-out penetration set and with at least one response not used to assign it, such as a core or image, small-load stiffness, shear or compression response, plate loading, wheel response, excavation energy, drilling, or anchor behavior. Retain the optional hypothesis only if it changes a documented action and improves the held-out decision beyond the direct evidence.
6.2. Sample Size, Spacing, and Robustness
The required number of profiles depends on the decision, variance, and correlation; no universal count can establish the robustness of a heterogeneous construction ground unit. The nine-profile-per-state calibration matrix described above is an author-proposed minimum repeatability screen for a controlled test program, not validation of a field unit. Similarly, the initial floor of 12 usable profiles per proposed field unit, distributed among at least three spatially separated clusters, is a provisional planning value intended to prevent repeated measurements at one location from being mistaken for independent spatial coverage. Increase it when the power calculation, spatial-correlation model, consequences of misclassifications, or required boundary resolution demand greater coverage. The final effective sample size per comparison group is therefore the larger of the provisional planning floor and. For preliminary field zoning, use at least 12 usable profiles per proposed unit, distributed among at least three spatially separated clusters, and increase that number when the power calculation or spatial model requires it. The final effective sample size per comparison group is the larger of 12 and
where is the two-sided false-positive rate, is power, is the smallest decision-relevant difference, and is obtained from independent pilot profiles. Unless a project justifies alternatives, use and power of at least 0.80. The stated and power values are conventional starting assumptions for planning the validation study, not lunar-specific acceptance thresholds. Select them based on the consequences of a false classification and the decision being supported. Equation (3) is the equal-size normal approximation for a two-group mean comparison. Censored, non-normal, unequal-variance, repeated-measures, or spatially correlated data require simulation or a model-specific power analysis. Nearby profiles reduce the effective sample size; the nominal count must not be substituted for .
Robustness requires more than statistical significance. A result must preserve its direction under predeclared alternative depth windows and reasonable calibration uncertainty, reproduce in each independent preparation or spatial cluster, and remain after identified density, material, clast, boundary, and instrument effects are evaluated. A large number of tightly clustered soundings cannot establish the lateral persistence of a construction ground unit.
Status and basis of the numerical values: The fixed tolerances in Table 12 are provisional engineering starting points rather than experimentally established lunar limits. Their basis is the performance requirement that geometry, rate, force, depth, reaction, and boundary variations remain subordinate to the smallest response difference that would change the screening decision. The percentages and absolute limits must therefore be tested against repeatability, calibration uncertainty, material variability, gravity, environmental conditions, and decision sensitivity before they are adopted for a specific investigation. These values were not applied retrospectively to the Apollo 16 records.
6.3. Acceptance, Upgrading, and Rejection
Table 13 defines the minimum evidence needed to advance an interpretation. Passing these gates permits a classification within the declared domain; it does not produce a design strength or an asset acceptance criterion.
Table 13.
Acceptance gates for a future relative-state interpretation.
The framework is falsifiable. It is rejected for an application domain when standardized repeats fail to reproduce the direction, co-located controls remove the residual contrast, predicted boundaries are absent, transfer uncertainty can reverse the ranking, or independent asset-response tests show no added predictive or decision value. Partial-gravity testing remains necessary because penetration response does not scale trivially with gravity [10,15].
7. Discussion
7.1. Methodological Contribution and Lunar-Specific Need
The study does not claim discovery of lunar densification, stratigraphy, particle angularity, impact reworking, or variable penetration resistance. Its contribution is a traceable procedure for deciding what those observations permit in an early construction-screening context. The procedure records provenance, tests instrument compatibility, predeclares the response comparison, separates alternative explanations from independent support, assigns a confidence-limited output, and links every unresolved interpretation to a closure action.
This function is especially relevant on the Moon because a conventional preconsolidation pressure generally cannot be reconstructed from sparse mission records, current overburden stresses are small, terrestrial sampling and laboratory programs are not yet available at project scale, and probe systems differ markedly. The revised framework therefore uses no numerical historical-stress ratio. It is closer to an evidence ledger and decision gate than to terrestrial OCR, CPT soil-behavior classification, relative density, or rock-mass rating. Those established systems retain their own calibrated inputs and outputs; the comparison in Table 2 identifies the distinction rather than claiming equivalence.
7.2. Legacy-Data Demonstration and Construction Consequence
The Apollo 16 application is a demonstration of the legacy-data path rather than a calibration of a new material parameter. Section 4 reports the source data, compatibility limits, conventional controls, permitted Class C output, and resulting investigation actions. Its principal methodological finding is that a transparent procedure can extract useful zoning and uncertainty-closure decisions from sparse historical evidence while stopping before unsupported numerical or ordinal interpretation.
The construction consequence is similarly limited but operational. Penetration evidence determines where investigation spacing, probe capacity, trial locations, unit boundaries, or hold points must differ. The application examples and required independent response measurements are given in Section 5. Penetration response does not independently determine mobility, excavation, foundation, or anchor performance; those quantities remain subject to representative asset–ground testing.
7.3. Limitations
The principal empirical limitations are sparse spatial support, incomplete probe metadata, non-co-located density and penetration measurements, uncertain particle- and clast-scale effects, shallow and sometimes censored penetration, and the lack of controlled lunar-gravity disturbance tests on actual regolith. The Apollo 16 comparison is descriptive at station scale and is not a ranking of Artemis candidate sites. The confidence classes, provisional tolerances, sample-size floor, and acceptance gates proposed here require validation; they should be revised as flight and testbed data accumulate.
The framework also does not address competent rock, ice-cemented ground, deep interfaces, volatile-bearing material, or long-term thermo-mechanical evolution without additional geological and constitutive treatment. Simulants reproduce selected properties rather than complete lunar regolith behavior, and terrestrial gravity tests cannot establish a lunar transfer relation without supporting reduced-gravity or validated numerical evidence. These limitations restrict the domain of use and define the next measurements; they do not justify converting an unresolved observation into a numerical class.
8. Conclusions
The revised study presents a mechanics-informed evidence-to-decision procedure for early lunar construction-site screening. Its principal conclusions are as follows:
- Penetration response is non-unique. Confinement, density or porosity, grading, particle morphology, fabric, stratigraphy, clasts, disturbance, boundaries, probe configuration, procedure, and acquisition limits must be evaluated before a response contrast is assigned a mechanical-state interpretation.
- The new value relative to existing descriptive practice is an auditable evidence-to-decision sequence. It separates observation, conventional explanation, preliminary construction ground zoning, uncertainty closure, and asset-specific verification, and retains an optional relative-state interpretation only when it changes a documented decision beyond the direct evidence.
- Legacy and future data follow different processing paths. The Apollo 16 records support separate preliminary ground units and a Class C directional hypothesis over the common upper 20 cm, but no numerical or ordinal state class. The Station 4 and Station 10 investigation actions follow from the integrated direct evidence; therefore, the stopping rule omits the additional descriptor.
- The framework can change investigation spacing, probe capacity, boundary traverses, trial locations, verification tests, and hold points for mobility corridors, construction pads, shallow excavations, foundations, and anchors. Future qualification requires standardized instruments, replicated and spatially distributed profiles, co-located controls, quantified uncertainty, held-out tests, and independent asset-response verification. Failure to reproduce the contrast, predict a boundary, or improve the decision rejects the optional hypothesis for that application domain.
The framework therefore converts imperfect but relevant penetration evidence into preliminary zoning, investigation priorities, and verification requirements while preserving the boundary between construction screening and design.
Author Contributions
Conceptualization, R.d.M. and C.P.; methodology, R.d.M.; validation, R.d.M. and C.P.; formal analysis, R.d.M.; investigation, R.d.M.; data curation, R.d.M.; writing-original draft preparation, R.d.M.; writing-review and editing, R.d.M. and C.P.; visualization, R.d.M.; supervision, C.P.; project administration, R.d.M. All authors have read and agreed to the published version of the manuscript.
Funding
This research received no external funding.
Data Availability Statement
No new datasets were generated in this study. The legacy penetration-response information used in the Apollo 16 application is available in the publicly accessible mission reports and publications cited in the manuscript. The published resistance envelopes were used as source-reported evidence and were not digitized to create a new numerical dataset.
Acknowledgments
The authors acknowledge the Apollo and Lunokhod investigators whose mission records provide the basis for continuing lunar soil-mechanics interpretation. Any views expressed in this manuscript are those of the authors and do not necessarily represent the positions of their employers or affiliated institutions.
Conflicts of Interest
The authors declare that they have no known competing financial interests or personal relationships that could have appeared to influence the work reported in this paper.
References
- National Aeronautics and Space Administration. Fiscal Year 2025 Small Business Technology Transfer Phase I Solicitation: Lunar Infrastructure Construction and Geotechnical Investigation Topics; Solicitation, National Aeronautics and Space Administration: Washington, DC, USA, 2025.
- McKay, D.S.; Heiken, G.H.; Basu, A.; Blanford, G.E.; Simon, S.B.; Reedy, R.C.; French, B.M.; Papike, J.J. The Lunar Regolith. In Lunar Sourcebook: A User’s Guide to the Moon; Heiken, G.H., Vaniman, D.T., French, B.M., Eds.; Cambridge University Press: Cambridge, UK, 1991; Chapter 7; pp. 285–356. [Google Scholar]
- Lucey, P.G.; Korotev, R.L.; Gillis, J.J.; Taylor, L.A.; Lawrence, D.J.; Campbell, B.A.; Elphic, R.C.; Feldman, W.C.; Hood, L.L.; Hunten, D.M.; et al. Understanding the Lunar Surface and Space–Moon Interactions. Rev. Mineral. Geochem. 2006, 60, 83–219. [Google Scholar] [CrossRef] [Scilit]
- Mitchell, J.K.; Houston, W.N.; Carrier, W.D., III; Costes, N.C. Apollo Soil Mechanics Experiment S-200: Final Report; Technical Report NASA CR-134306; National Aeronautics and Space Administration: Washington, DC, USA, 1974.
- Carrier, W.D., III; Olhoeft, G.R.; Mendell, W. Physical Properties of the Lunar Surface. In Lunar Sourcebook: A User’s Guide to the Moon; Heiken, G.H., Vaniman, D.T., French, B.M., Eds.; Cambridge University Press: Cambridge, UK, 1991; Chapter 9; pp. 475–594. [Google Scholar]
- Houston, W.N.; Namiq, L.I. Penetration Resistance of Lunar Soils. J. Terramechanics 1971, 8, 59–69. [Google Scholar] [CrossRef] [Scilit]
- Costes, N.C.; Farmer, J.E.; George, E.B. Mobility Performance of the Lunar Roving Vehicle: Terrestrial Studies-Apollo 15 Results; Technical Report NASA TR R-401; National Aeronautics and Space Administration, Marshall Space Flight Center: Huntsville, AL, USA, 1972.
- Mitchell, J.K.; Carrier, W.D., III; Costes, N.C.; Houston, W.N.; Scott, R.F. Surface Soil Variability and Stratigraphy at the Apollo 16 Site. In Proceedings of the Fourth Lunar Science Conference, New York, NY, USA, 5–8 March 1973; Volume 3, pp. 2437–2445. [Google Scholar]
- Mitchell, J.K.; Carrier, W.D., III; Houston, W.N.; Scott, R.F.; Bromwell, L.G.; Durgunoglu, H.T.; Hovland, H.J.; Treadwell, D.D.; Costes, N.C. Soil Mechanics. In Apollo 16 Preliminary Science Report; Number 315 in NASA SP; National Aeronautics and Space Administration: Washington, DC, USA, 1972; pp. 8-1–8-29. [Google Scholar]
- Li, R.; Chen, J.; Zhang, J.; Chen, D.; Zhao, X.; Mo, P.Q.; Zhou, G. Cone Penetration Resistance of CUMT-1 Lunar Regolith Simulant under Magnetic-Similitude Lunar Gravity Condition. Acta Geotech. 2023, 18, 6725–6744. [Google Scholar] [CrossRef] [Scilit]
- Lucas, M.P.; Neal, C.R.; Long-Fox, J.M.; Britt, D.T. Simulating Lunar Highlands Regolith Profiles on Earth to Inform Infrastructure Development and ISRU Activities on the Moon. Acta Astronaut. 2024, 224, 161–171. [Google Scholar] [CrossRef] [Scilit]
- Zhao, X.; Liu, Z.; Li, Y.; Wang, H.; Xu, Z. Numerical Study of Cone Penetration Tests in Lunar Regolith for Strength Index. Appl. Sci. 2024, 14, 10645. [Google Scholar] [CrossRef] [Scilit]
- Glover, A.S.; Long-Fox, J.M.; Anderson, R.C.; Buczkowski, D.L.; King, I.R.; Sollitt, L.S.; Wyrick, D.Y.; Lucas, M.P.; Campins, H.; Britt, D.T. SPARTA Cone Penetration Measurements to Inform In Situ Density and Stratigraphy of Lunar Regolith. In Proceedings of the 56th Lunar and Planetary Science Conference, The Woodlands, TX, USA, 10–14 March 2025. Abstract 2745. [Google Scholar]
- Slumba, K.; Scott, B.T.; Jaksa, M.B. Dynamic Cone Penetration Test in Lunar Highlands Regolith Simulant. Acta Astronaut. 2026, 243, 172–188. [Google Scholar] [CrossRef] [Scilit]
- Chen, J.; Li, R.; Fu, S. Influence of Low Gravity on the Penetration Resistance of Lunar Regolith. npj Microgravity 2026, 12, 18. [Google Scholar] [CrossRef] [Scilit] [PubMed]
- Jehn, I.E.; Casasbuenas Cabezas, Y.I.; Bounds, T.D.; Houston, G.G.N.; Dreyer, C.B.; Johnson, C.; Murphy, D.; Smith, S.; Williams, T.; Caluk, N.; et al. Implications of Lunar Simulant Geotechnical Properties on Testbed Experimentation and Engineering Analysis and Reported Properties of Colorado School of Mines Highland Simulant. Space Planet. Resour. 2025, 1, 5. [Google Scholar] [CrossRef] [Scilit]
- Oda, M. Initial Fabrics and Their Relations to Mechanical Properties of Granular Material. Soils Found. 1972, 12, 17–36. [Google Scholar] [CrossRef] [Scilit]
- Lee, K.L.; Seed, H.B. Drained Strength Characteristics of Sands. J. Soil Mech. Found. Div. ASCE 1967, 93, 117–141. [Google Scholar] [CrossRef] [Scilit]
- Bolton, M.D. The Strength and Dilatancy of Sands. Géotechnique 1986, 36, 65–78. [Google Scholar] [CrossRef] [Scilit]
- Lunne, T.; Robertson, P.K.; Powell, J.J.M. Cone Penetration Testing in Geotechnical Practice; Blackie Academic & Professional: London, UK, 1997. [Google Scholar]
- Robertson, P.K. Interpretation of Cone Penetration Tests—A Unified Approach. Can. Geotech. J. 2009, 46, 1337–1355. [Google Scholar] [CrossRef] [Scilit]
- Barton, N.; Lien, R.; Lunde, J. Engineering Classification of Rock Masses for the Design of Tunnel Support. Rock Mech. 1974, 6, 189–236. [Google Scholar] [CrossRef] [Scilit]
- Bieniawski, Z.T. Engineering Rock Mass Classifications; John Wiley & Sons: New York, NY, USA, 1989. [Google Scholar]
- Hoek, E.; Kaiser, P.K.; Bawden, W.F. Support of Underground Excavations in Hard Rock; A. A. Balkema: Rotterdam, The Netherlands, 1995. [Google Scholar]
- Plescia, J.B.; Cahill, J.T.S.; Greenhagen, B.T.; Hayne, P.O.; Mahanti, P.; Robinson, M.S.; Spudis, P.D.; Siegler, M.A.; Stickle, A.M.; Williams, J.P.; et al. Lunar Surface Processes. Rev. Mineral. Geochem. 2023, 89, 651–690. [Google Scholar] [CrossRef] [Scilit]

Disclaimer/Publisher’s Note: The statements, opinions and data contained in all publications are solely those of the individual author(s) and contributor(s) and not of MDPI and/or the editor(s). MDPI and/or the editor(s) disclaim responsibility for any injury to people or property resulting from any ideas, methods, instructions or products referred to in the content. |
© 2026 by the authors. Licensee MDPI, Basel, Switzerland. This article is an open access article distributed under the terms and conditions of the Creative Commons Attribution (CC BY) license.