


Abstract
Food analysis is essential for ensuring food quality and safety, with protein content being one of the most relevant compositional parameters from both nutritional and technological perspectives. Although the Kjeldahl method is the reference technique for protein quantitation, reversed-phase high-performance liquid chromatography (RP-HPLC) provides high specificity for individual proteins and was used in this study as an independent comparative method. Unlike nitrogen-based methods, RP-HPLC enables direct quantitation of defined protein standards. This work proposes the determination of protein concentration using the Bradford assay combined with digital image analysis (DIA), replacing conventional spectrophotometric detection. A glass slide was evaluated as a sample support, requiring only 14 µL of sample, substantially less than conventional microplates. Images were acquired with a smartphone, and the complete analytical workflow, from image acquisition to protein concentration calculation, was semi-automated using MATLAB software. The method was evaluated using bovine serum albumin (BSA) and casein standards and applied to food samples. Protein concentrations obtained by the Bradford-DIA method showed good agreement with RP-HPLC, with errors ranging from 1.7% to 17% for standards and from 1.1% to 23% compared with labelled protein values. The proposed approach provides a rapid, low-cost, and miniaturised alternative for protein determination.
1. Introduction
Proteins are large, structurally complex biomolecules composed of long chains of amino acids, typically numbering in the hundreds or thousands. They fulfil a wide range of essential biological functions, including the execution of critical cellular processes such as DNA replication and transcription, as well as the formation, maintenance, and regulation of tissues and organ systems [1].
While many proteins—such as those involved in intracellular processes—are synthesised endogenously through gene expression, others must be acquired exogenously through dietary intake. Dietary proteins can be broadly categorised according to their origin as plant-derived or animal-derived proteins. Protein composition varies depending on the source. In bovine milk, for example, total protein is composed of approximately 80% caseins and 20% whey proteins. Casein, also referred to as calcium or sodium caseinate, comprises four main isoforms: αs1-casein, αs2-casein, β-casein, and κ-casein, with molecular weights ranging from 25 to 35 kDa. Whey proteins, on the other hand, are those that remain dissolved in the milk serum after casein precipitation during cheese or casein production. This fraction comprises a variety of proteins with distinct functional roles, the most abundant being α-lactalbumin, β-lactoglobulin, bovine serum albumin (BSA), immunoglobulins, and proteose-peptones [2]. BSA, with a molecular weight of approximately 66.382 kDa [3], is commonly used as a standard in protein quantification assays due to its high stability, low cost, and ease of large-scale production.
The Kjeldahl method is considered a reference method for total protein determination in food matrices because of its robust estimation of total nitrogen content. However, Kjeldahl analysis is time-consuming, requires relatively large sample amounts, and does not provide molecular specificity. Alternative approaches include quantitative amino acidsanalysis (AAA), which involves hydrolysis followed by chromatographic separation of the resulting amino acid mixture; protein analysis by liquid chromatography [4,5,6,7]; UV absorbance [8]; and colorimetric assays, such as the Coomassie Brilliant Blue G-250 dye-binding assay (Bradford) [9,10] and the bicinchoninic acid (BCA) assay [11].
Colorimetric methods are attractive because they are simple and rapid; however, their trueness can be strongly affected by the choice of protein standard and the sample matrix, potentially leading to over- or underestimation of protein content in some cases [12]. Nevertheless, several studies have reported no statistically significant differences between Bradford and Kjeldahl results in bovine milk samples when appropriate standards, such as BSA or casein, are used [13,14].
The Bradford assay is a widely used colorimetric method for protein quantitation, based on the binding of Coomassie Brilliant Blue G-250 dye to proteins under acidic conditions. Upon interaction with basic and aromatic amino acid residues, the dye undergoes a spectral shift from its red (cationic) form to a blue (anionic) form, resulting in a pronounced change in colour intensity [15]. This visible transition forms the basis of the assay’s colorimetric detection, with the intensity of the blue coloration increasing with protein concentration. Traditionally, this colour change has been quantified by measuring absorbance at a single wavelength, typically 595 nm, or by using absorbance ratios, such as A595/A450, which improve linearity [16,17]. These measurements are commonly performed using spectrophotometry, although closely related wavelengths have also been employed depending on the instrumentation and protocol used [18].
In recent years, digital image analysis (DIA) has gained significant attention for colorimetric analysis due to its versatility, low environmental impact, and applicability across diverse fields, including medicine, pharmaceuticals, and environmental science. Notably, DIA has been applied to a wide range of analytical tasks, from cancer diagnostics [19] to the detection of pharmaceutical compounds using mobile devices [20]. One of its key advantages is its alignment with the principles of green chemistry, as image-based approaches can reduce reagent consumption and waste generation [21]. Microplates have traditionally been among the most common sample supports for DIA; however, miniaturised formats based on supports with lower sample capacity, such as paper-based analytical devices, have emerged as practical and cost-effective platforms for colorimetric detection. A typical approach is the spot-test method, in which small volumes of the analyte are deposited onto defined detection zones on a solid support. This format is particularly attractive because of its simplicity, low reagent consumption, and minimal equipment requirements [22]. The combination of colorimetric assays with digital image analysis has also enabled the development of simplified and portable analytical approaches, including smartphone-assisted protein determination based on the Bradford assay [23,24,25]. These studies demonstrate the feasibility of using image acquisition and analysis as an alternative to conventional spectrophotometric measurements while maintaining satisfactory analytical performance. However, the reported smartphone-based Bradford methods mainly rely on conventional cuvettes or microplates. The use of a miniaturised spot-test format could further reduce sample and reagent consumption and simplify the analytical setup. Paper is particularly attractive for spot-test applications because of its low cost and widespread availability. However, cellulose fibres are susceptible to degradation through acid-catalysed hydrolysis of the β-1,4-glycosidic bonds and may therefore be incompatible with strongly acidic or alkaline reaction conditions [26]. In particular, paper has previously been reported to be unsuitable for the Bradford assay [27], likely due to the high phosphoric acid content of the reagent. Therefore, an alternative solid support compatible with the Bradford reagent is needed to implement the spot-test format for protein determination.
In this study, DIA was employed to estimate protein concentrations in milk samples using the Bradford method in an at-home fabricated spot-test format implemented on microscope glass slides (DIA-glass). Protein quantitation was based on the colorimetric response of the Bradford reagent, whose blue coloration increases with protein concentration. The proposed procedure is straightforward and provides a proportional analytical response while reducing reagent consumption and waste generation. Milk samples were analysed using a spot-test format on standard microscope glass slides, providing a practical and accessible alternative to conventional microplate-based assays or chromatographic techniques such as HPLC. Additionally, the integration of a custom MATLAB® function for method automation streamlines data processing and analysis. Owing to its operational simplicity, low cost, and minimal infrastructure requirements, this approach is particularly well suited to small-scale laboratories for the determination of bovine milk proteins.
2. Materials and Methods
Albumin (BSA) Fraction V (pH 7.0) for Western blotting (A6588; ITW Reagents, Darmstadt, Germany) was employed to prepare calibration standards for both high-performance liquid chromatography (HPLC) and digital image analysis (DIA). Casein (Laboratorios J. Suñol Tintoré, Barcelona, Spain) was utilised exclusively for the preparation of standard solutions in HPLC analysis. The Bradford solution for protein determination (A6932; ITW Reagents, Darmstadt, Germany) served as the colorimetric reagent in DIA, and Coomassie Brilliant Blue G-250 (CBB) dye (Bio-Rad, 1610406, Hercules, CA, USA) was used as a colour intensifier. The mobile phase for HPLC consisted of a mixture of Acetonitrile GC/HPLC grade (LabKem, 99.9%; Labbox Labware S.L., Premià de Dalt, Barcelona, Spain), trifluoroacetic acid (TFA, 99.0%; Merck KGaA, Darmstadt, Germany), and Milli-Q water.
A total of nine commercially available milk samples, differing in matrix composition and nutritional profiles, were analysed. The declared protein content was indicated on the label of each sample, and these values are summarised in Table 1.
Table 1.
Samples analysed in the research. They show different proteins amounts declared on the label.
2.1. Standards and Samples
For HPLC analysis, separate stock solutions of bovine serum albumin (BSA) and casein were prepared at a concentration of 1200 µg/mL. In the case of BSA, both the stock solution and the calibration standards were prepared in phosphate-buffered saline (PBS; A9162; pH 7.4 tablets; ITW Reagents, Darmstadt, Germany) by dissolving one tablet in 100 mL of water according to the manufacturer’s instructions. For casein, a solution formed by Milli-Q water, Acetonitrile, and TFA (52.45%, 47.5%, and 0.05% respectively) was used as the solvent because the casein is not very soluble in water. Individual calibration curves for each protein were constructed using seven standard solutions ranging from 50 to 1050 µg/mL. For BSA, the peak area corresponding to the BSA chromatographic peak was plotted against the protein concentration. For casein, the peak area of each identified casein isomer (α-, β-, and κ-casein) was plotted against its corresponding concentration to construct individual calibration curves. All solutions were filtered through 0.45 µm pore-size nylon membrane filters prior to injection into the chromatographic system. Only casein and BSA were analysed. Casein was selected as it is the predominant protein fraction in bovine milk (approximately 80%), whereas BSA, despite being present at much lower concentrations, was included as a representative whey protein and a widely used analytical standard [28].
For the DIA assay, a BSA stock solution at 700 µg/mL was prepared, along with twelve calibration standards ranging from 100 to 700 µg/mL. Both stock solution and standards were prepared in PBS. BSA was used as the sole calibration standard because of its widespread use, good stability, availability, and established application in Bradford-based protein assays. However, it should be noted that the Bradford response depends on the amino acid composition and structure of the protein, and therefore different proteins may exhibit different dye-binding responses. This aspect is particularly relevant for milk samples, in which caseins constitute the major protein fraction. Consequently, calibration with BSA may not provide an absolute measure of total milk protein and may result in some degree of protein-dependent bias. Nevertheless, BSA calibration was considered appropriate for the present study to evaluate the analytical performance of the proposed DIA method and to provide a consistent basis for comparison with previously reported Bradford-based methods. The results should therefore be interpreted as BSA-equivalent protein concentrations rather than as an absolute determination of the total protein content of milk.
For milk samples, the labelled protein content was used as a reference for sample dilution. All samples were diluted to a final concentration of 450 µg/mL with PBS for both HPLC and DIA. Prior to HPLC injection, the samples were filtered through 0.45 µm pore-size nylon filters to remove particulate matter.
For the DIA colorimetric analysis, each reaction spot was prepared by sequentially adding 12 µL of commercial Bradford reagent, 1 µL of either a calibration standard or a sample, and 1 µL of a 400 µg/mL Coomassie Brilliant Blue G-250 (CBB) solution in water. The additional CBB solution was incorporated to enhance colour development and improve analytical sensitivity. The resulting colorimetric spots contained final protein concentrations ranging from 7 to 50 µg/mL. All reactions were carried out directly on the microscope glass slide. The total reaction volume was only 14 µL, substantially lower than that employed in conventional Bradford-based microplate assays [27], thereby reducing reagent consumption and waste generation in accordance with green analytical chemistry principles [28]. For the milk samples analysed in this study, the use of 1 µL of the 450 µg/mL sample solution in the 14 µL reaction volume resulted in a final protein concentration of approximately 32 µg/mL, which falls within the established linear range. Therefore, no additional dilution was required for the samples investigated. However, samples with substantially higher protein concentrations would require an appropriate preliminary dilution to ensure that the final protein concentration falls within the 7–50 µg/mL linear range, which may be particularly relevant for high-protein matrices such as powdered milk.
2.2. HPLC
Protein quantitation was performed using a Shimadzu LC-20AD high-performance liquid chromatography (HPLC) system (Shimadzu Corporation, Kyoto, Japan) equipped with a diode array detector (SPD-M20A). Chromatographic separation was achieved using a SunFire C18 column (5 µm particle size, 4.6 mm internal diameter, 250 mm length; Waters Corporation, Milford, MA, USA). The chromatographic conditions employed for the analysis are summarised in Table 2; however, it should be noted that minor adjustments may be necessary depending on the specific instrumentation used. Under the established conditions, bovine serum albumin (BSA) eluted at a retention time of 2.5 min, α-casein at 3.5 min, β-casein at 7.0 min, and κ-casein at 1.5 min, with a total run time of 14 min. After completion of the gradient, the column was returned to the initial mobile-phase composition (36% B). No fixed re-equilibration time was programmed. The interval between consecutive injections, required for sample preparation and injector conditioning, allowed the column to remain under the initial conditions before the subsequent injection. Before HPLC analysis, UV-Vis spectrophotometry was also used to determine the wavelength of maximum absorbance (λmax) for BSA and casein. This step aims to identify the optimal wavelengths for HPLC detection by correlating the spectral data with chromatographic results. A concentration of 400 µg/mL of both proteins was employed, and their absorbance spectrum was recorded to determine the λmax.
Table 2.
HPLC conditions for determination of protein, BSA and casein in milks.
2.3. Digital Image Analysis (DIA)
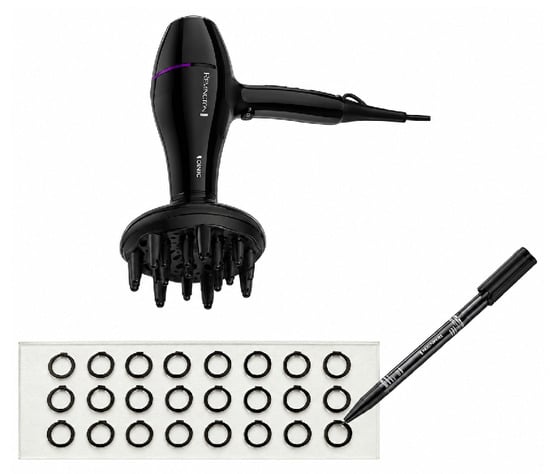
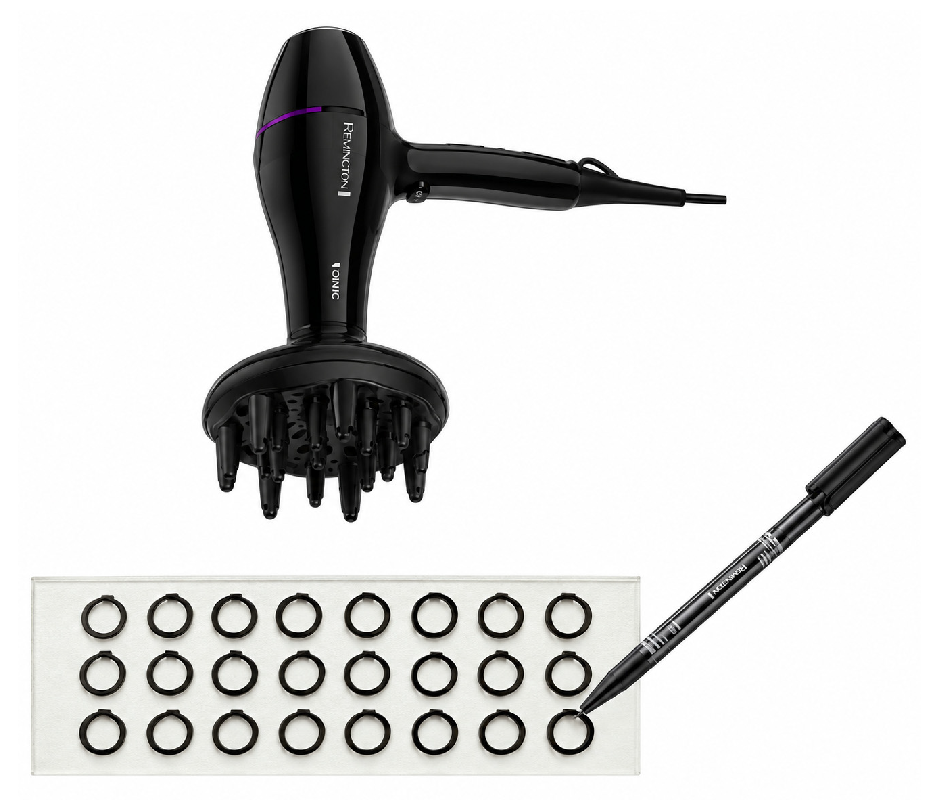
For the DIA-glass method, microscope glass slides were prepared following a methodology adapted from the work of Pravin Pokhrel et al. [27], in which hydrophobic reaction zones were delineated using a permanent oil-based ink marker. In the present study, microscope glass slides were selected because of the potential incompatibility of the acidic Bradford reagent with paper. As well as the reusability of glass, in accordance with the principles of green chemistry. As in the original procedure, the reaction zones were drawn using a permanent marker (Staedtler Lumocolor; Staedtler SE, Nuremberg, Germany). A template was used to ensure uniform circular zones, after which the ink was dried using a Philips Ionic DryCare Pro 2200 W hairdryer (Philips, Amsterdam, The Netherlands) set to medium heat. A schematic representation of the preparation procedure is shown in Figure 1.
Figure 1.
Visual diagram of how the glass slide was prepared with individual spots for a total of twenty-four (3 rows × 8 columns) detection zones.
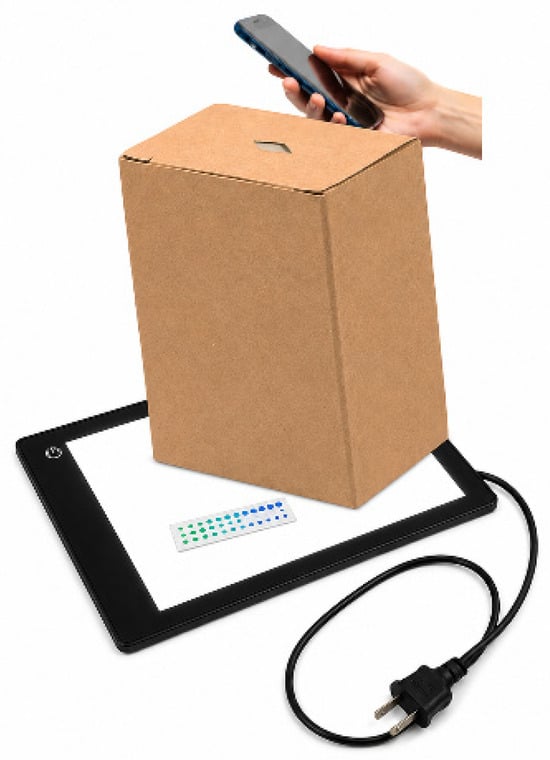
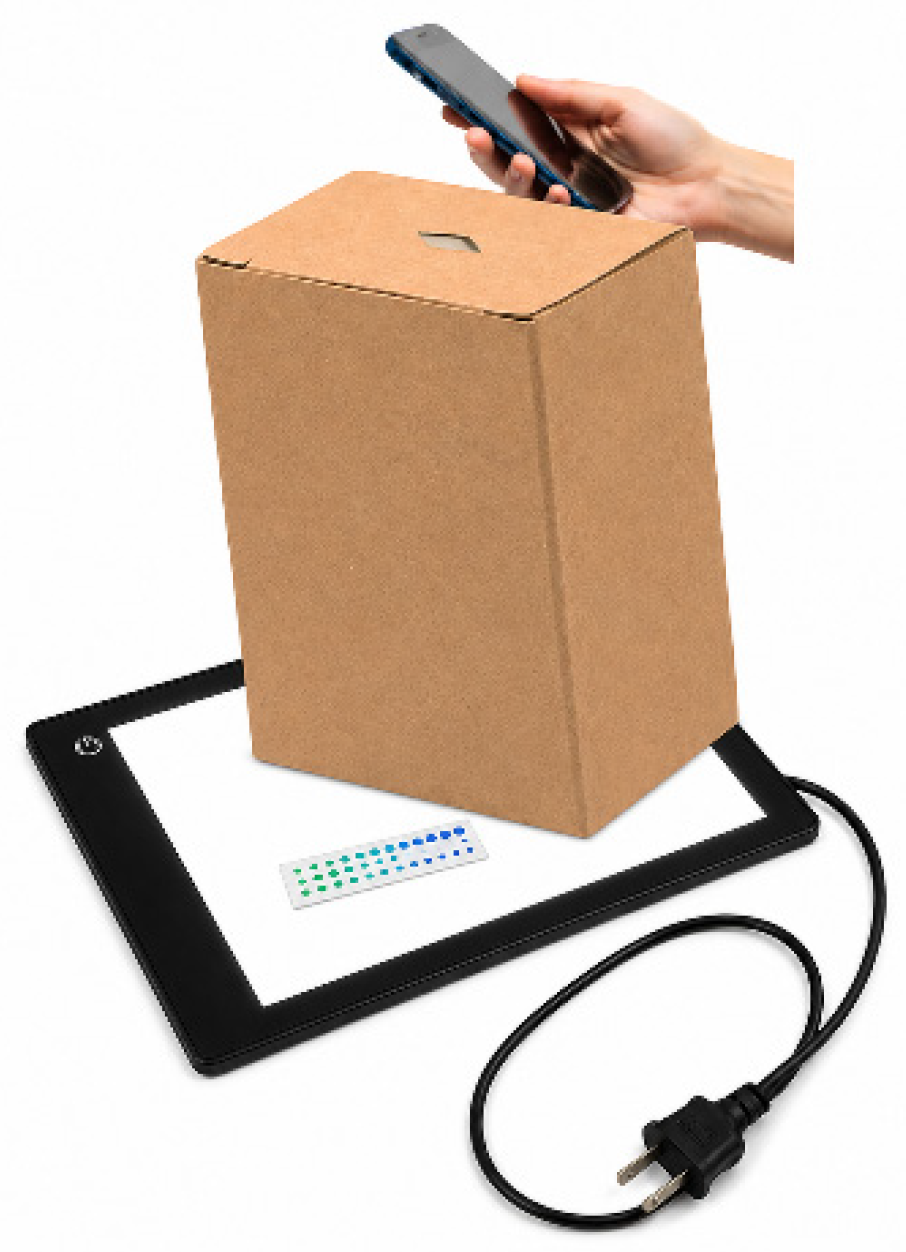
For the image analysis conducted in this study, a uniform illumination system was implemented from the bottom using an A4 LED light plate (TSOCOS, China). To minimise ambient light interference and enhance image reproducibility, the setup was enclosed within a plain cardboard box with an opening on the top to accommodate the mobile phone. All images were captured using an iPhone 16 Pro Max. The camera settings during the acquisition were as follows: aperture f/1.78, automatic ISO, autofocus mode, 48 MP resolution, and a focal length of 24 mm.
Before image analysis, the reaction kinetics were monitored using an Agilent 8453 diode-array spectrophotometer (Agilent Technologies, Santa Clara, CA, USA) to determine the time required to achieve the optimum colour development. Subsequent image processing and analysis were performed using MATLAB® software (R2023b). A schematic representation of the photographic setup and equipment used is shown in Figure 2.
Figure 2.
Setup of the equipment used to take pictures: the smartphone, the cardboard box, the LED light plate and the microplate.
2.4. Validation Analysis
The DIA method and HPLC were validated by evaluating several figures of merit. For comparison purposes, BSA was the only protein considered in HPLC, as it is also the sole protein used in DIA. The limit of detection (LOD) and limit of quantitation (LOQ) for each technique were calculated according to the ICH guidelines by multiplying the standard error of the regression by 3.3 and 10, respectively, and dividing the resulting values by the slope of the calibration curve. Method trueness and precision were evaluated using BSA standards. Trueness was assessed by comparing the measured concentrations with the nominal concentrations of the standards and expressing the results as relative error (RE, %). Precision was evaluated in terms of repeatability (intraday), using replicates of standards prepared and analysed on the same day, and intermediate precision (interday), using replicate standards prepared and analysed on three different days over a one-month period. The results were expressed as coefficients of variation (CV, %).
Additionally, recovery analyses were performed using spiked milk samples. For DIA-glass analysis, HW and HLF samples were used. A dilution of each milk was prepared to obtain a final protein concentration of 16.0 µg/mL based on the labelled concentration. Known volumes of the BSA stock solution were then added at two levels to reach final concentrations of 20.4 µg/mL and 24.6 µg/mL. For HPLC analysis, HSS and HW samples were used. A concentrated solution of 90.0 µg/mL was prepared, and the BSA stock solution was subsequently added at two levels to obtain final concentrations of 250 µg/mL and 410 µg/mL. The spiked samples were then analysed using the corresponding analytical procedure.
2.5. Automation of the Bradford Method in DIA-Glass Using MATLAB®
The Bradford method for DIA-glass was semi-automated through a custom function developed in MATLAB® software. This function was based on the optimised final protocol for Bradford assays on glass substrates, but it can also be adapted for use in paper-based systems, provided the paper is chemically compatible with the reagents employed and meets the specified structural requirements. The necessary organisation of the microscope glass slide is illustrated in Supplementary Figure S1, and the following requirements must be met:
- -
- The function is designed to analyse two aligned microscope glass slides imaged simultaneously: one positioned on the upper level for calibration and the other on the lower level for sample analysis.
- -
- The upper slide is for calibration. Twelve standards are analysed in duplicate, yielding a total of 24 measurement points.
- -
- The lower slide is used for sample analysis and accommodates up to eight samples arranged in columns, each analysed in triplicate, resulting in a total of 24 measurement points.
- -
- A dedicated MATLAB® folder must be created to store both the image to be analysed and the MATLAB® function.
- -
- This folder should be opened in the MATLAB® “Current Folder” panel.
- -
- The function is then executed from the MATLAB® “Command Window”.
- -
- For calibration curve linearisation, the analytical signal is calculated as the ratio of the Blue (B) to the Red (R) channel intensities (B/R).
The function is designed to operate in an interactive manner, guiding the user step by step through the analytical workflow to determine the total protein concentration in the analysed samples.
3. Results
3.1. Determination of Protein Concentration
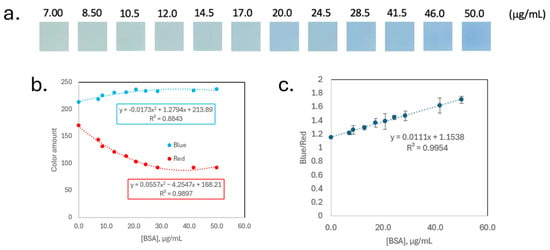
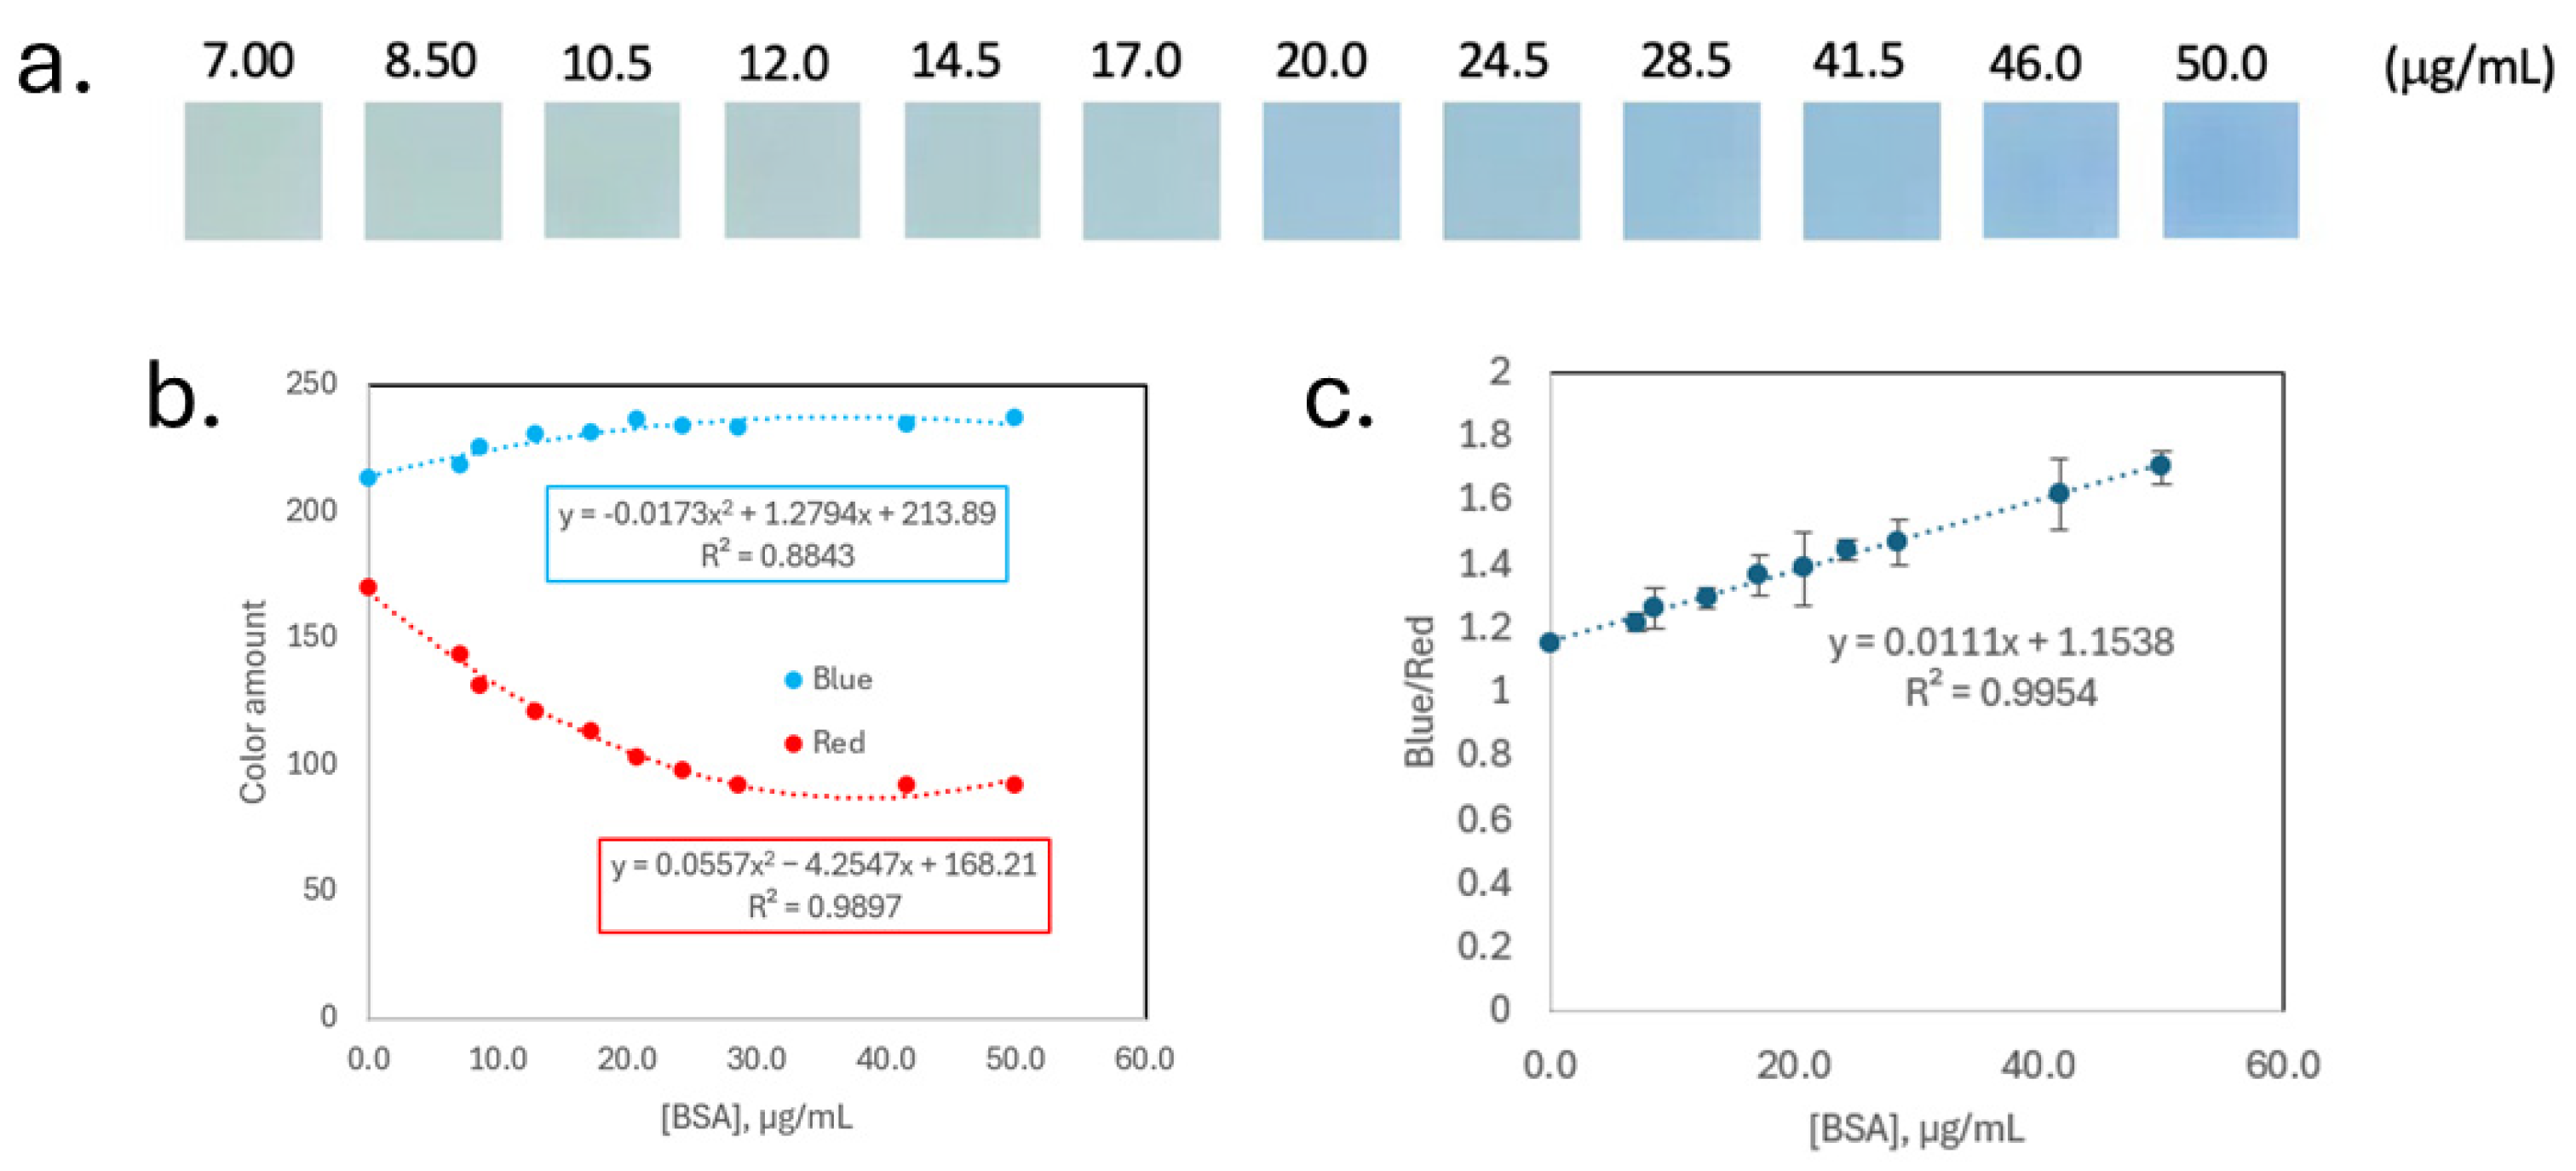
Prior to the DIA, the reaction kinetics between the Bradford reagent and BSA were evaluated by UV-Vis spectrophotometry. Absorbance at both 590 nm and 450 nm was monitored, as the A590/A450 ratio has previously been shown to provide the best linearity for Bradford protein quantitation by spectrophotometry [16]. As shown in Supplementary Figure S2, the absorbance at 590 nm reached a maximum approximately at 370 s (about 6 min) after the reaction was initiated. In contrast, the absorbance at 450 nm continued to increase over time, although the rate of increase decreased markedly after approximately 6 min. Therefore, an incubation time of 6 min after reagent addition was selected for the DIA assay to ensure sufficient colour development while maintaining consistent measurement conditions. After incubation, an image was captured, and a region of interest (ROI) of 8 × 8 pixels was extracted of each spot using MATLAB®, as shown in Figure 3a. The intensity values of the Red (R) and Blue (B) channels are shown in Figure 3b, where a nonlinear relationship can be observed. This analysis yielded a coefficient of determination (R2) of 0.9954 and a regression slope of 0.0111, as shown in Figure 3c.
Figure 3.
(a) Cropped image regions from microscope glass slide assays using commercial Bradford reagent (total volume: 14 μL), (b) Blue (B) and Red (R) channels vs. BSA concentration in DIA, and (c) ratio between the Blue (B) and Red (R) channels vs. BSA concentration in DIA.
Before the HPLC analysis, BSA and casein UV-Vis spectra of BSA and casein were recorded to identify their characteristic absorbance wavelengths for chromatographic analysis (Supplementary Figure S3). Both proteins exhibited a maximum absorbance at 279 nm, which was subsequently selected as the detection wavelength for HPLC chromatogram acquisition.
Calibration standards were subsequently analysed by HPLC (reference technique), yielding a single calibration curve for BSA (y = 607.63x + 11,974; R2 = 0.9949) and three individual calibration curves for each casein isomer: α-casein (y = 32.517x − 5245.6, R2 = 0.9910), β-casein (y = 384.1x − 51,722, R2 = 0.9930), and κ-casein (y = 91.257x − 41,757, R2 = 0.9993). The corresponding retention times under the applied chromatographic conditions were 2.5 min for BSA, 3.5 min for α-casein, 7.0 min for β-casein, and 1.5 min for κ-casein, as can be seen in Supplementary Figure S4 [29]. It is worth noting that the selected chromatographic column and mobile phase enabled not only effective separation between BSA and casein but alsosufficient resolution of the individual casein isomers.
Following this, both analytical approaches—DIA-glass and HPLC—were validated to enable direct comparison. The validation results are summarised in Table 3.
Table 3.
Comparison of the validation parameters obtained for the two techniques used to determinate protein content. These parameters include linearity, regression performance, limit of detection (LOD), Limit of Quantification (LOQ), trueness, and precision, evaluated by repeatability (intraday) and intermediate precision (interday). BSA was used as the protein standard for both techniques for comparison purposes. Additionally, recovery results were obtained for samples HW and HLF using DIA-glass and for samples HSS and HW using HPLC, after spiking at two BSA concentration levels (low and high).
Following method validation, the nine milk samples were analysed using both techniques. The corresponding results are presented in Table 4, with the total protein content expressed in grams. For the DIA-glass method, total protein content was estimated assuming that all proteins exhibited the same response as BSA, whereas for HPLC, the total protein content was calculated as the sum of BSA and casein. A comparison between the two techniques, as well as between the DIA-glass results and the protein content reported on the product label, is also reported. Importantly, to ensure the consistency and reliability of the DIA measurements, calibration standards were included in the image at the time of sample analysis. As previously described, two aligned microscope glass slides were positioned and photographed simultaneously, with the upper slide used for calibration and the lower slide used for sample analysis.
Table 4.
Obtained results of determination of total protein in different samples by Bradford method with DIA-glass, and HPLC. Comparison between these two techniques and DIA-glass vs. product label is also reported.
To evaluate whether significant differences exist between methods, a statistical analysis using the paired t-test was performed, comparing results from the DIA-glass with those obtained via HPLC. The t-test was conducted using Equation (1), where represents the mean difference between paired observations, Sd the standard deviation of these differences, and n the number of samples.
The calculated t-value for the comparison between DIA-glass and HPLC was 1.24. The critical t-value for a 95% confidence level (n = 7) was 2.45 (p = 0.05). Since the absolute value of the calculated t-statistics were below the critical threshold in both cases, it was concluded that there were no statistically significant differences between the DIA-glass results and those obtained using HPLC.
Furthermore, an analysis of variance (ANOVA) F-test was conducted at a 95% confidence level, which corroborated the absence of statistically significant differences among the two analytical methods. The obtained F and critical F values were 0.041 and 4.96, respectively, for the DIA-glass vs. HPLC comparison.
3.2. Analytical Greenness Evaluation of the Proposed Methods
Considering the increasing awareness of the environmental footprint associated with chemical methodologies, it is essential to evaluate the environmental sustainability of newly developed analytical procedures. Given the significant advancements achieved from a green analytical chemistry (GAC) standpoint, the environmental performance of the DIA method, in comparison with HPLC, was comprehensively assessed using the AGREE metric [30]. Based on the AGREE assessment, the DIA-glass obtained a score of 0.76, higher than the 0.47 obtained for the HPLC method (Supplementary Figure S5).
3.3. Semi-Automated MATLAB® Workflow for Bradford Spot Test Analysis
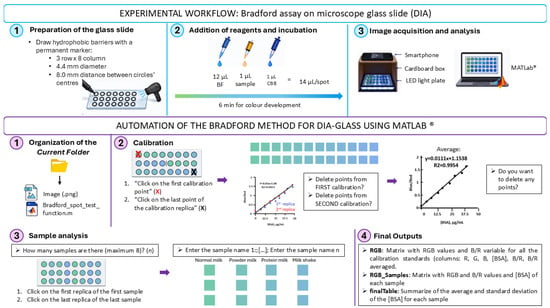
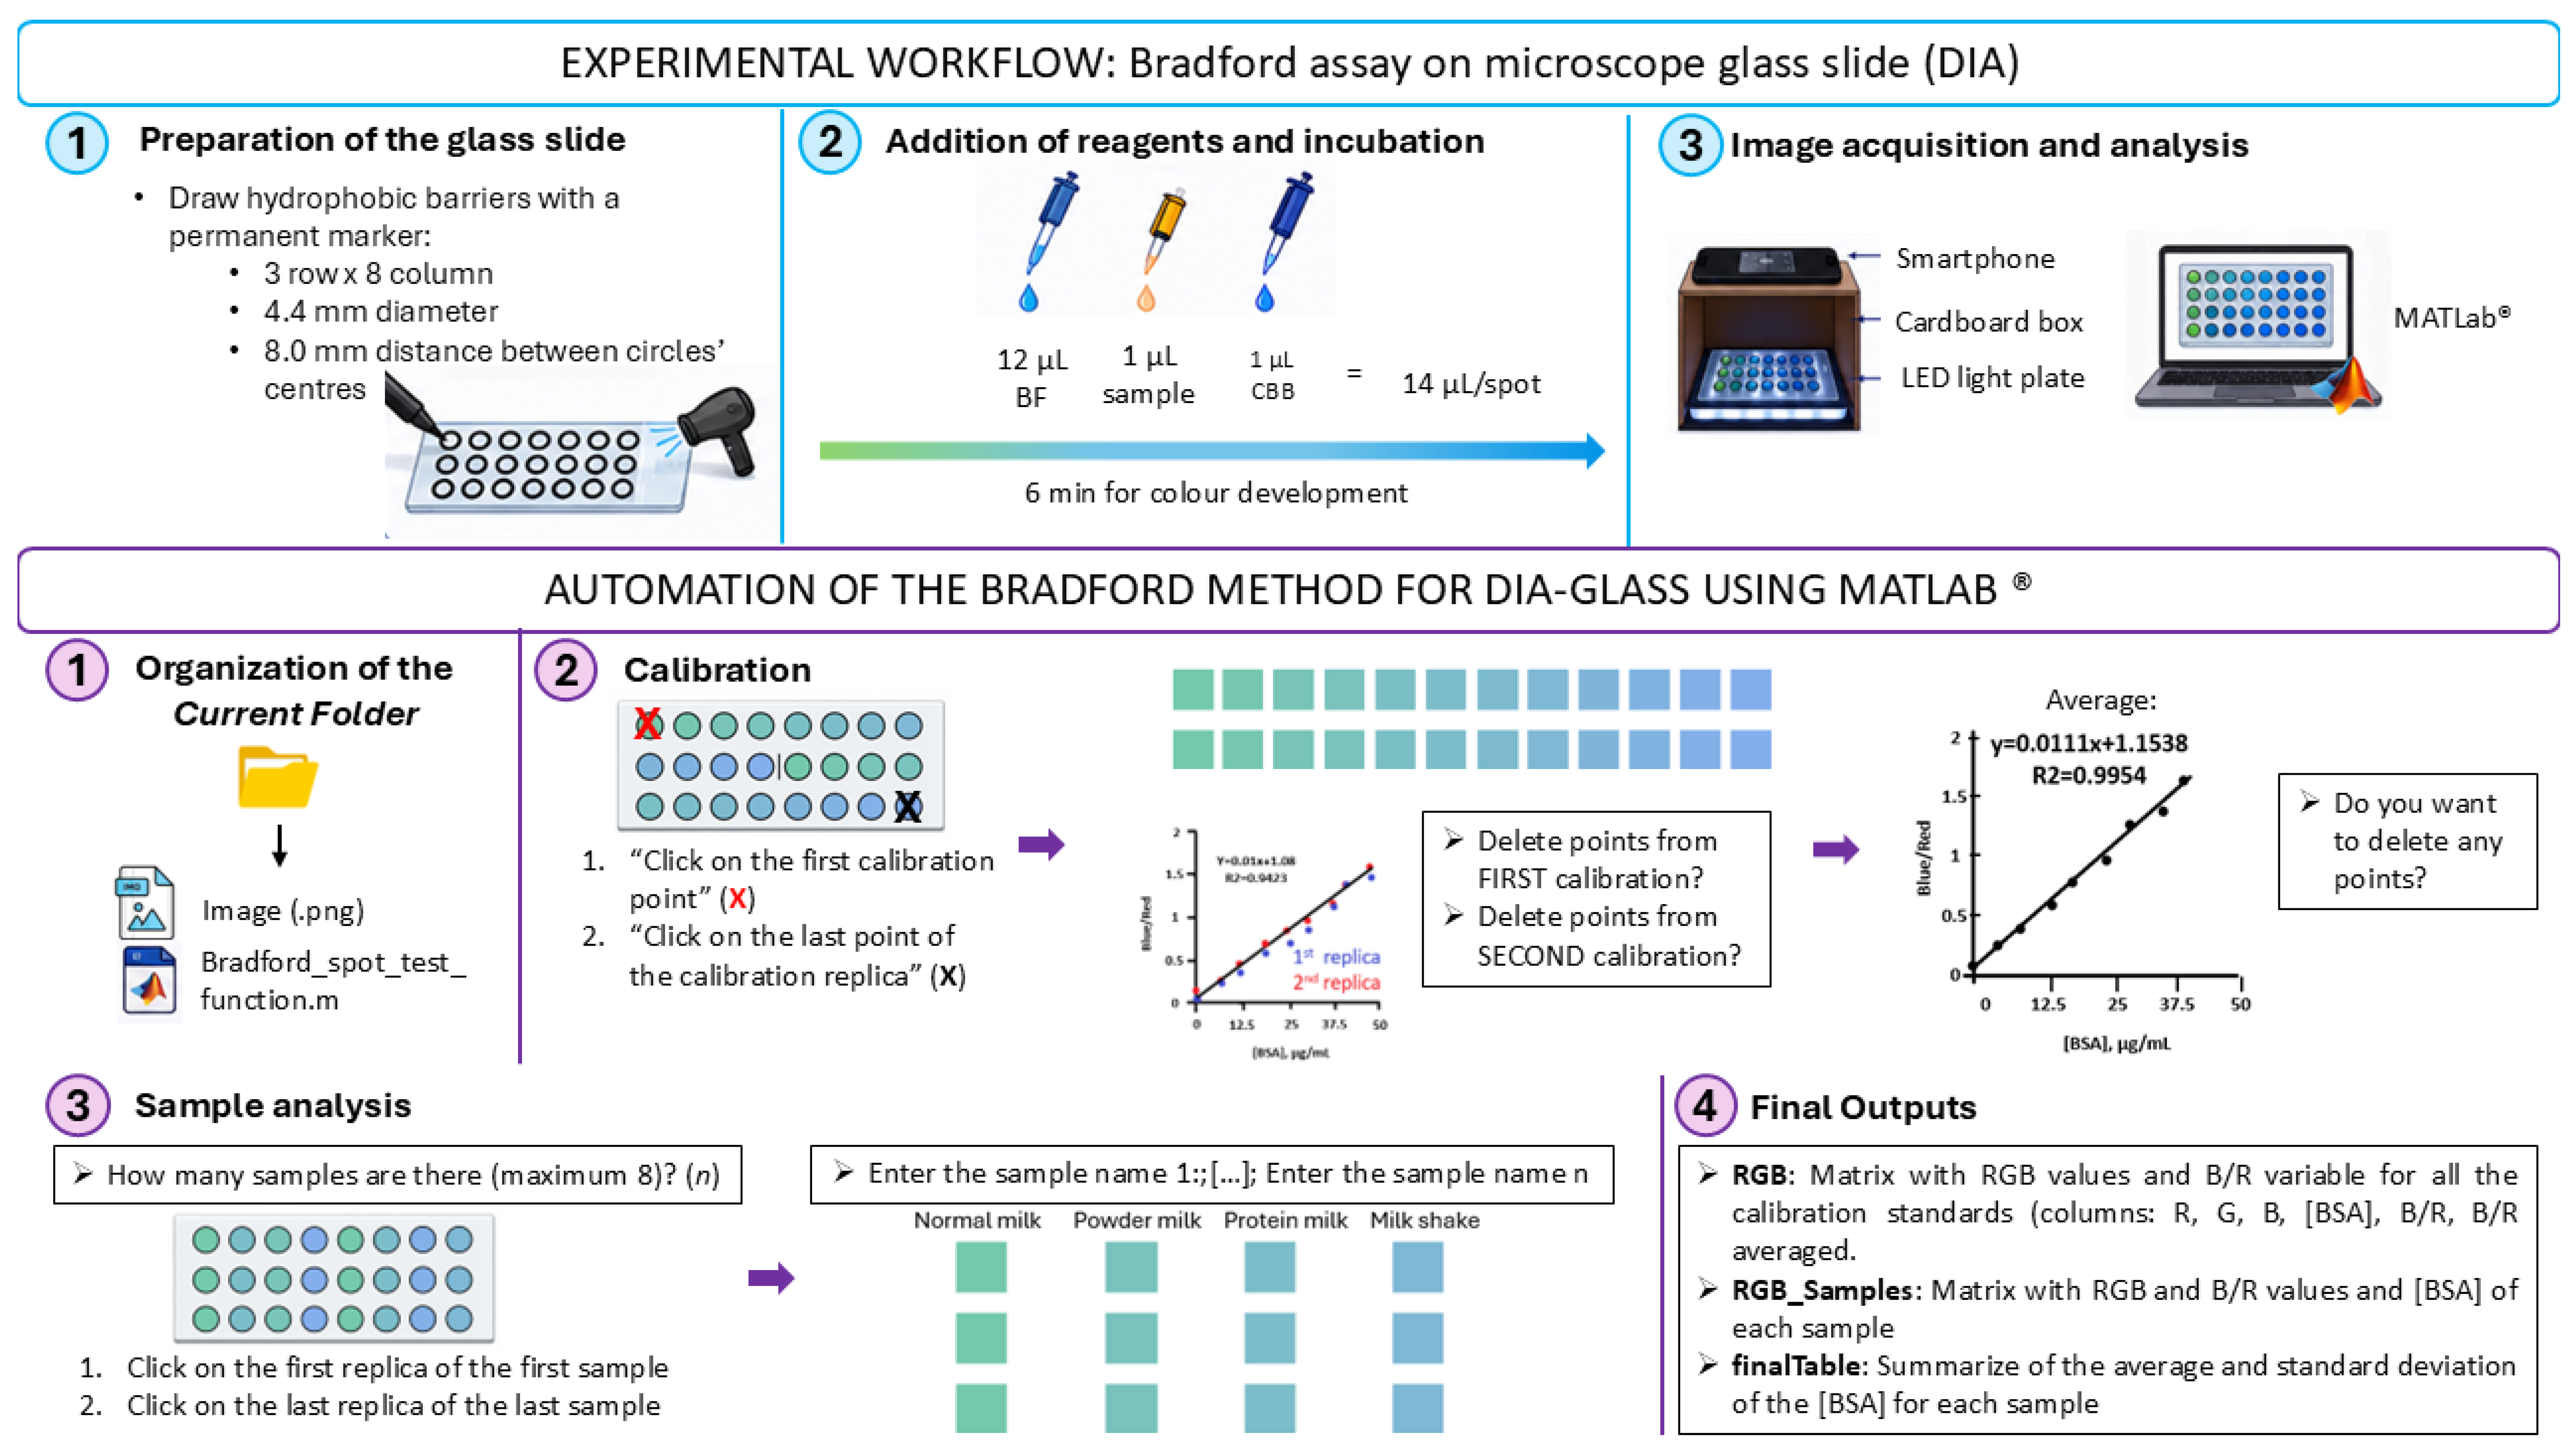
Figure 4 illustrates the workflow of the developed MATLAB® function (Bradford_spot_test_function.m) for protein quantitation from the acquired images. In addition, the figure summarises the preparation of the microscope glass slides, the volume of Bradford reagent added to each spot, and the incubation time required prior to image acquisition.
Figure 4.
Schematic illustration of microscope glass slide preparation and the workflow of the MATLAB function for calibration and sample analysis.
The developed MATLAB® function was designed to semi-automate image processing and quantitative analysis of the Bradford spot test. The function is configured to analyse images with the same layout as that shown in Supplementary Figure S1, consisting of two microscope glass slides arranged vertically, each containing an 8 × 3 array of spots. The upper slide contains 12 BSA calibration standards analysed in duplicate, whereas the lower slide accommodates up to eight samples analysed in triplicate. The lower slide does not need to be fully occupied. Before starting the analysis, the only information required from the user is the concentration of the BSA standards and the names assigned to each sample.
To initiate the analysis, the user places the acquired image together with the MATLAB® function in the Current Folder. Once executed, the function automatically opens the image and prompts the user through the MATLAB® Command Window with the following instructions:
>> Click on the first calibration point.
>> Click on the last point of the calibration replica.
These selections define the calibration area and enable the automatic localisation of all reaction spots. Each spot is subsequently detected and cropped (3 × 3 pixels in this study), after which the RGB values are extracted. The analytical response is calculated as the blue-to-red (B/R) intensity ratio, which is used for subsequent quantitative analysis.
Using the calculated B/R ratios together with the introduced BSA concentrations, the function automatically constructs the calibration curve by linear regression and displays the corresponding regression equation and coefficient of determination (R2). Before sample quantitation, the user is asked whether any calibration points should be excluded by displaying the following messages:
>> Delete points from FIRST calibration?
>> Delete points from SECOND calibration?
The selected calibration points are excluded, and the calibration model is automatically recalculated by averaging the replicates. The updated regression equation and R2 value are then displayed. The function subsequently prompts the user to remove any additional points from the averaged calibration curve, if necessary, and displays the final calibration equation and R2 value, which are then used for sample analysis:
>> Do you want to delete any extra points?
The function then proceeds to sample analysis by requesting the number of samples to be analysed:
>> How many samples are there (maximum 8)?
Subsequently, the analysis area is defined through the following instructions:
>> Click on the first replicate of the first sample.
>> Click on the third replicate of the last sample.
Once the analysis area has been established, the user enters the corresponding sample names. The function automatically applies the same image-processing procedure used during calibration, extracting the RGB values, calculating the B/R ratio for each replicate, and determining the protein concentration from the calibration model.
After completion of the analysis, three output variables are generated in the MATLAB® Workspace. The variable RGB contains the RGB values and B/R ratios corresponding to the calibration standards; RGB_Samples contains the RGB values, B/R ratios, and calculated protein concentrations for all sample replicates, and the final table summarises the final analytical results, including the mean ± standard deviation of both the B/R ratios and the calculated protein concentrations for each analysed sample.
3.4. Comparison with Other Methods for Protein Determination
Various analytical methods have been reported for protein determination in a wide range of matrices, including water, biological fluids, food products, medical devices, and environmental samples. Table 5 summarises the analytical performance of representative protein quantitation techniques reported in the literature, including Kjeldahl, chromatographic, and colorimetric methods. As shown in the table, most methods exhibit excellent linearity, with coefficients of determination (R2) generally higher than 0.99. The highest values were reported for RP-HPLC and Biuret-UV–Vis spectrophotometry (R2 = 0.9999), while Bradford-based assays and the Lowry method also demonstrated strong linear relationships, with R2 values ranging from 0.9954 to 0.9991.
Table 5.
Comparison with other methods for protein determination.
The reported linear ranges differ substantially among methods. Bradford assays covered concentration intervals from low microgram levels up to 1000 µg mL−1, while BCA and Lowry methods provided broader working ranges of 20–2000 mg L−1 and 25–200 mg L−1, respectively. Instrumental techniques such as RP-HPLC and HPLC-UV offered highly reliable quantitation within narrower concentration intervals, reflecting their suitability for targeted analytical applications.
Limits of detection (LOD) also varied considerably among the methods, ranging from 0.05 mg L−1 for the Biuret-UV–Vis method applied to dairy products to 20 mg L−1 for the BCA assay used in birch pollen samples. Chromatographic methods, particularly RP-HPLC, showed low detection limits and excellent linearity, making them suitable for the analysis of complex biological and medical samples. Among the colorimetric approaches, Bradford-based assays achieved LOD values between 5.16 and 11.15 µg mL−1, whereas the Lowry solid-phase spectrophotometric method presented an LOD of 17 mg L−1.
4. Discussion
4.1. Protein Concentration
Regarding Figure 3b, intensity values of Red (R) and Blue (B) channels show that there is no linear relationship against the concentration; consequently, the ratio between the Blue (B) and Red (R) channel intensities was calculated to linearise the response following the approach described by Orna Ernst et al. [17]. The calibration curve exhibited a relatively high intercept compared to the slope, which can be attributed to the intrinsic background signal of the Bradford reagent and the imaging system. This is common in DIA methods [38,39]. Nevertheless, the method showed good linearity within the studied concentration range and provided adequate sensitivity for protein determination in milk samples.
As shown in Table 3, both methods exhibited a similar analytical performance (R2 = 99.49% in HPLC vs. R2 = 99.54% in DIA-glass). The linear calibration ranges were selected according to the limitations of each technique: 7–50 µg/mL for DIA-glass, to avoid colour saturation at high protein concentrations, and 100–1050 µg/mL for HPLC, to ensure chromatographic peak areas that could be reliably distinguished from the baseline at low concentrations. Despite the different concentration ranges, both methods enabled accurate protein quantitation within their respective linear ranges. DIA-glass exhibited substantially higher analytical sensitivity under the experimental conditions evaluated, as demonstrated by its approximately 15-fold lower LOD (5.16 µg/mL) compared with HPLC (78.2 µg/mL). However, this result should not be interpreted as evidence that DIA is intrinsically more sensitive than chromatographic techniques, which can provide highly sensitive determinations depending on the analytical configuration and operating conditions. The LOD is a characteristic of the complete analytical procedure and depends on factors such as the calibration range, sample preparation, detector response, and the experimental conditions and parameters used for its calculation. In the present study, the lower LOD obtained for DIA-glass reflects the performance of the Bradford colorimetric reaction combined with image acquisition and digital processing under the optimised conditions employed. Conversely, the HPLC LOD reflects the performance of the specific chromatographic procedure used in this study. Therefore, the approximately 15-fold lower LOD observed for DIA-glass should be considered a method-specific result rather than a general indication of superior sensitivity compared with HPLC. Nevertheless, this result demonstrates that the proposed DIA-glass approach provides adequate sensitivity for the determination of low protein concentrations within the concentration range investigated. The lower limits of the calibration ranges were selected above the corresponding LOD values. Although some calibration points were below the calculated LOQ, they were retained in the linearity study because they exhibited a consistent linear response and contributed to excellent calibration models (R2 > 0.99). These points were included to characterise the analytical response of each method at low concentrations rather than to demonstrate routine quantitative performance below the LOQ.
Regarding trueness and precision, HPLC yielded the most favourable results. The DIA method exhibited slightly higher relative error (RE) and coefficient of variation (CV) values than HPLC, which may be related to the additional sources of variability inherent to image-based measurements, including image acquisition, spot homogeneity, and colour distribution within the detection area. Nevertheless, these differences were relatively small, and all relative error and CV values remained below 20%, indicating satisfactory trueness and precision, supporting the suitability of both methods for protein quantitation under the conditions evaluated. More controlled image acquisition may help minimise these sources of variability and improve the reproducibility of the DIA approach.
In the recovery study, both the HPLC and DIA methods achieved satisfactory results, with all recovery values falling within the acceptable range of 80–120%. Some recovery values were, however, slightly above 110% or below 90%. These deviations from the nominal value may be attributed to several factors, including matrix effects, differences in the response of the analytical methods to the different protein species present in milk, and, in the case of DIA, variability associated with spot formation and image acquisition. Nevertheless, all recovery values remained within the predefined acceptance range, indicating that these effects did not compromise the overall quantitative performance of either method under the conditions evaluated. Overall, the recovery results support the reliability of both analytical procedures for protein quantitation in milk samples.
As observed in Table 4, when comparing the protein content declared on the product labels with the values obtained using both techniques, lower errors were observed for samples with simpler matrices than for those with more complex matrices, such as VM or PW. This trend was observed both when comparing DIA-glass results with those obtained by HPLC and when comparing the DIA-glass results with the protein content declared on the product labels. The larger discrepancies observed for VM and PW may be related to their more complex composition and higher protein content, which can result in a different response of the Bradford assay compared with the BSA-based calibration. In particular, differences in the relative proportions of caseins and whey proteins may affect Coomassie Brilliant Blue binding and consequently the measured colour intensity. Other matrix components present in these protein-enriched samples may also contribute to differences during sample preparation and colour development. Nevertheless, the results demonstrate that protein quantification using the Bradford assay can be successfully performed on microscope glass slides while substantially reducing reagent consumption to only just 14 µL per sample. HPLC, as a well-established reference technique, can be used when further validation or confirmation of the results is required.
As expected, the HO sample yielded protein concentrations below the detection limit of both methods. This result is consistent with the nature of the sample, as it is a plant-based beverage that does not contain bovine proteins.
4.2. Analytical Greenness Evaluation of the Proposed Methods
Considering that DIA-glass generates minimal amounts of waste and requires either non-toxic reagents or very small quantities of potentially hazardous chemicals, it offers a favourable environmental profile. In addition, DIA allows the simultaneous processing of multiple samples and provides greater portability and miniaturisation compared to conventional analytical techniques. The higher AGREE score obtained for DIA-glass (0.76) compared to HPLC (0.47) can be mainly attributed to its miniaturised spot-test format, which requires only 14 µL of reagents per determination and generates less waste, together with the use of digital image analysis instead of conventional chromatographic instrumentation. These features make DIA-glass a more sustainable approach for protein determination than conventional liquid chromatography.
4.3. Automated MATLAB® Workflow for Bradford Spot Test Analysis
The developed MATLAB® function successfully semi-automated the complete workflow required for image processing and protein quantification using the Bradford spot test. User intervention was limited to the selection of the calibration and sample regions and the introduction of the calibration concentrations and sample names, while all subsequent processing steps, including spot detection, RGB extraction, calculation of the B/R ratio, calibration modelling, and protein quantitation, were performed semi-automatically. This workflow substantially reduces the amount of manual data processing required and minimises the risk of operator-dependent errors.
The implementation of automatic spot detection ensures that all reaction zones are processed using identical image-analysis criteria, thereby improving the consistency and reproducibility of the analytical procedure. In addition, the possibility of excluding individual calibration points and automatically recalculating the calibration model provides sufficient flexibility to deal with occasional anomalous measurements without requiring the complete analysis to be repeated.
Another relevant feature of the developed software is its adaptability to routine laboratory analysis. Since the lower microscope glass slide does not need to be fully occupied, different numbers of samples can be analysed without modifying the image-processing workflow. Furthermore, the automatic generation of structured output variables containing both intermediate image-processing data and final quantitative results facilitates data traceability and subsequent statistical analysis. Overall, the developed MATLAB® function complements the proposed Bradford spot test methodology by providing a standardised, rapid, and reproducible image-analysis workflow suitable for routine protein determination.
4.4. Comparison with Other Methods for Protein Determination
Overall, the data presented in Table 5 indicate that both instrumental and colorimetric methods can provide accurate and reliable protein quantitation when properly validated. While chromatographic techniques generally offer high sensitivity and selectivity, spectrophotometric methods such as Bradford, Lowry, Biuret, and BCA remain attractive alternatives because of their simplicity, lower cost, and satisfactory analytical performance. Furthermore, the Bradford spot test–DIA method developed in the present work exhibited a low LOD (5.16 µg mL−1), a linear range of 7.0–50 µg/mL, and good linearity (R2 = 0.9954), demonstrating its suitability for routine protein determination in milk samples. Compared with previously reported smartphone-based Bradford methods, the proposed approach showed a lower reported LOD, although direct comparison should be made with caution because these methods were developed for different sample matrices and concentration ranges. Nevertheless, the results demonstrate that the spot-test format combined with digital image analysis can provide suitable analytical performance while avoiding the need for conventional spectrophotometric instrumentation.
5. Conclusions
A simple, rapid, and cost-effective method for protein determination in milk samples was developed based on the combination of spot test methodology and digital image analysis (DIA). A microscope glass slide was used as the reaction platform, and protein quantitation was achieved by correlating the colour intensity generated by the Bradford assay with protein concentration. The analytical performance of the proposed method was assessed against high-performance liquid chromatography (HPLC), used as the reference technique. Using HPLC, bovine serum albumin (BSA) and the main casein isoforms (α-casein, β-casein, and κ-casein) were individually quantified, allowing the relative contribution of each major protein fraction to the total protein content of the samples to be determined.
Compared with HPLC, the DIA-glass method exhibited markedly higher analytical sensitivity, with LOD and LOQ values more than one order of magnitude lower. Accordingly, DIA-glass covered a lower calibration range (7–50 µg/mL), whereas HPLC covered a higher concentration range (100–1050 µg/mL). Although HPLC provided slightly better trueness and precision, DIA-glass achieved satisfactory results, with acceptable recovery, trueness, and precision, together with excellent linearity (R2 = 99.54%). Its low reagent consumption, straightforward implementation, and semi-automated MATLAB®-based image analysis make it a practical, cost-effective, and sustainable approach for routine total protein analysis and screening applications.
However, the use of BSA as a single calibration standard may result in differences in response depending on the protein composition of the sample, and DIA-glass does not provide information on individual protein fractions. HPLC therefore remains preferable when accurate quantitation and differentiation of individual protein fractions are required. Further studies are needed to assess the applicability of DIA-glass to other food matrices beyond the milk products evaluated in this work.
Supplementary Materials
The following supporting information can be downloaded at: https://www.mdpi.com/article/10.3390/app16199643/s1, Figure S1: How the glass slide should be divided to enable the use of the MATLAB function; Figure S2: Kinetic curves for the reaction between Bradford reagent and BSA at 590 and 450 nm; Figure S3: UV/Vis spectra of 400 µg/mL BSA and casein standards; Figure S4: Comparative analysis of the 800 µg/mL BSA and casein standards. The left y-axis corresponds to BSA, and the right y-axis corresponds to casein; Figure S5: AGREE metrics comparing HPLC analysis (left), microplate DIA analysis (center), and spot test DIA analysis (right) for protein estimation.
Author Contributions
A.L.: Formal Analysis, Investigation, Validation, Visualisation, Writing—original draft. M.O.: Writing—Review and Editing, Funding acquisition. A.B.: Writing—Review and Editing. R.G.-A.: Writing—Review and Editing. M.V.: Conceptualisation, Methodology, Project Administration, Supervision, Validation, Visualisation, Resources, Writing—Original Draft Preparation, Writing—Review and Editing. All authors have read and agreed to the published version of the manuscript.
Funding
This work was supported by the Basque Government (Research Group IT1662/22).
Institutional Review Board Statement
Not applicable.
Informed Consent Statement
Not applicable.
Data Availability Statement
The data presented in this study are available upon reasonable request. The original data are held by the co-author who performed the experiments and can be requested from the co-author.
Acknowledgments
The authors gratefully acknowledge Lide Arana Urbieta (UPV/EHU) for his assistance in providing the casein that allowed the HPLC analysis to be performed. During the preparation of this work the authors used ChatGPT 4o and Gemini Version 1.5 Pro to improve the readability and conciseness of the text. After using these tools, the authors reviewed and edited the content as needed and take full responsibility for the content of the published article.
Conflicts of Interest
The authors declare no conflicts of interest.
References
- What Are Proteins and What Do They Do? MedlinePlus Genetics. Available online: https://medlineplus.gov/genetics/understanding/howgeneswork/protein/ (accessed on 24 March 2026).
- Perez-Gago, M.B.; Serra, M.; Alonso, M.; Mateos, M.; Río, M.A.D. Effect of Solid Content and Lipid Content of Whey Protein Isolate-Beeswax Edible Coatings on Color Change of Fresh-cut Apples. J. Food Sci. 2003, 68, 2186–2191. [Google Scholar] [CrossRef] [Scilit]
- Huang, B.X.; Kim, H.-Y.; Dass, C. Probing Three-Dimensional Structure of Bovine Serum Albumin by Chemical Cross-Linking and Mass Spectrometry. J. Am. Soc. Mass Spectrom. 2004, 15, 1237–1247. [Google Scholar] [CrossRef] [Scilit] [PubMed]
- Rios, A.G.; Ribeiro, A.M.; Rodrigues, A.E.; Ferreira, A.F.P. Bovine Serum Albumin and Myoglobin Separation by Size Exclusion SMB. J. Chromatogr. A 2020, 1628, 461431. [Google Scholar] [CrossRef] [Scilit] [PubMed]
- Bordin, G.; Cordeiro Raposo, F.; De La Calle, B.; Rodriguez, A.R. Identification and Quantification of Major Bovine Milk Proteins by Liquid Chromatography. J. Chromatogr. A 2001, 928, 63–76. [Google Scholar] [CrossRef] [Scilit] [PubMed]
- Holland, B.; Rahimi Yazdi, S.; Ion Titapiccolo, G.; Corredig, M. Short Communication: Separation and Quantification of Caseins and Casein Macropeptide Using Ion-Exchange Chromatography. J. Dairy Sci. 2010, 93, 893–900. [Google Scholar] [CrossRef] [Scilit] [PubMed]
- Innocente, N.; Biasutti, M.; Blecker, C. HPLC Profile and Dynamic Surface Properties of the Proteose–Peptone Fraction from Bovine Milk and from Whey Protein Concentrate. Int. Dairy J. 2011, 21, 222–228. [Google Scholar] [CrossRef] [Scilit]
- Kreusch, S.; Schwedler, S.; Tautkus, B.; Cumme, G.A.; Horn, A. UV Measurements in Microplates Suitable for High-Throughput Protein Determination. Anal. Biochem. 2003, 313, 208–215. [Google Scholar] [CrossRef] [Scilit] [PubMed]
- Sherovski, P.; Stojković, G.; Ristovska, N. Development, Validation and Application of First Derivative Spectroscopy Ratio Method for Estimation of Bradford Assay. Anal. Biochem. 2018, 558, 35–40. [Google Scholar] [CrossRef] [Scilit] [PubMed]
- Karimi, F.; Hamidian, Y.; Behrouzifar, F.; Mostafazadeh, R.; Ghorbani-HasanSaraei, A.; Alizadeh, M.; Mortazavi, S.-M.; Janbazi, M.; Naderi Asrami, P. An Applicable Method for Extraction of Whole Seeds Protein and Its Determination through Bradford’s Method. Food Chem. Toxicol. 2022, 164, 113053. [Google Scholar] [CrossRef] [Scilit] [PubMed]
- Cortés-Ríos, J.; Zárate, A.M.; Figueroa, J.D.; Medina, J.; Fuentes-Lemus, E.; Rodríguez-Fernández, M.; Aliaga, M.; López-Alarcón, C. Protein Quantification by Bicinchoninic Acid (BCA) Assay Follows Complex Kinetics and Can Be Performed at Short Incubation Times. Anal. Biochem. 2020, 608, 113904. [Google Scholar] [CrossRef] [Scilit] [PubMed]
- Reinmuth-Selzle, K.; Tchipilov, T.; Backes, A.T.; Tscheuschner, G.; Tang, K.; Ziegler, K.; Lucas, K.; Pöschl, U.; Fröhlich-Nowoisky, J.; Weller, M.G. Determination of the Protein Content of Complex Samples by Aromatic Amino Acid Analysis, Liquid Chromatography-UV Absorbance, and Colorimetry. Anal. Bioanal. Chem. 2022, 414, 4457–4470. [Google Scholar] [CrossRef] [Scilit] [PubMed]
- Hueso, D.; Fontecha, J.; Gómez-Cortés, P. Comparative Study of the Most Commonly Used Methods for Total Protein Determination in Milk of Different Species and Their Ultrafiltration Products. Front. Nutr. 2022, 9, 925565. [Google Scholar] [CrossRef] [Scilit] [PubMed]
- Kamizake, N.K.K.; Gonçalves, M.M.; Zaia, C.T.B.V.; Zaia, D.A.M. Determination of Total Proteins in Cow Milk Powder Samples: A Comparative Study between the Kjeldahl Method and Spectrophotometric Methods. J. Food Compos. Anal. 2003, 16, 507–516. [Google Scholar] [CrossRef] [Scilit]
- Kruger, N.J. The Bradford Method for Protein Quantitation. In The Protein Protocols Handbook; Walker, J.M., Ed.; Humana Press: Totowa, NJ, USA, 2009; pp. 17–24. [Google Scholar]
- Zor, T.; Selinger, Z. Linearization of the Bradford Protein Assay Increases Its Sensitivity: Theoretical and Experimental Studies. Anal. Biochem. 1996, 236, 302–308. [Google Scholar] [CrossRef] [Scilit] [PubMed]
- Ernst, O.; Zor, T. Linearization of the Bradford Protein Assay. J. Vis. Exp. 2010, e1918. [Google Scholar] [CrossRef] [Scilit] [PubMed]
- Giles, H.; Gallagher, J.; Warren-Walker, D.; Bull, S.P.; Lignou, S.; Methven, L.; Hughes, A. An Investigative Study into the Suitability of the Bradford Assay for Rapid Protein Determination in Whey. Food Chem. 2026, 499, 147375. [Google Scholar] [CrossRef] [Scilit] [PubMed]
- Lee, H.; Chen, Y.-P.P. Image Based Computer Aided Diagnosis System for Cancer Detection. Expert Syst. Appl. 2015, 42, 5356–5365. [Google Scholar] [CrossRef] [Scilit]
- Sefid-Sefidehkhan, Y.; Jouyban, A.; Soleymani, J.; Khoubnasabjafari, M.; Jouyban-Gharamaleki, V.; Rahimpour, E. Spot Test with Smartphone Digital Image Analysis for Determination of Methadone in Exhaled Breath Condensate. Spectrochim. Acta Part A Mol. Biomol. Spectrosc. 2025, 329, 125612. [Google Scholar] [CrossRef] [Scilit] [PubMed]
- Armenta, S.; Garrigues, S.; De La Guardia, M. Green Analytical Chemistry. TrAC Trends Anal. Chem. 2008, 27, 497–511. [Google Scholar] [CrossRef] [Scilit]
- Jungreis, E. Spot Test Analysis. In Encyclopedia of Analytical Chemistry; Meyers, R.A., Ed.; Wiley: Hoboken, NJ, USA, 2000. [Google Scholar]
- Moreira, D.C. RGBradford: Protein Quantitation with a Smartphone Camera. J. Vis. Exp. 2023, 65547. [Google Scholar] [CrossRef] [Scilit] [PubMed]
- De Camargo, C.; Vicentini, M.; Gobbi, A.; Martinez, D.; Lima, R. Smartphone for Point-of-Care Quantification of Protein by Bradford Assay. J. Braz. Chem. Soc. 2016, 28, 689–693. [Google Scholar] [CrossRef] [Scilit]
- Polat, F. The Determination of Total Protein in Saliva Using Smartphone-Assisted Colorimetric Analysis: A Noninvasive Approach Based on the Bradford Method. Chem. Pap. 2026, 80, 6985–6993. [Google Scholar] [CrossRef] [Scilit]
- Marinho, E. Cellulose: A Comprehensive Review of Its Properties and Applications. Sustain. Chem. Environ. 2025, 11, 100283. [Google Scholar] [CrossRef] [Scilit]
- Pokhrel, P.; Jha, S.; Giri, B. Selection of Appropriate Protein Assay Method for a Paper Microfluidics Platform. Pract. Lab. Med. 2020, 21, e00166. [Google Scholar] [CrossRef] [Scilit] [PubMed]
- De Azeredo, H.M.C.; Rosa, M.F.; De Sá, M.; Souza Filho, M.; Waldron, K.W. The Use of Biomass for Packaging Films and Coatings. In Advances in Biorefineries; Elsevier: Amsterdam, The Netherlands, 2014; pp. 819–874. [Google Scholar]
- Veloso, A.C.A.; Teixeira, N.; Ferreira, I.M.P.L.V.O. Separation and Quantification of the Major Casein Fractions by Reverse-Phase High-Performance Liquid Chromatography and Urea–Polyacrylamide Gel Electrophoresis. J. Chromatogr. A 2002, 967, 209–218. [Google Scholar] [CrossRef] [Scilit] [PubMed]
- Pena-Pereira, F.; Wojnowski, W.; Tobiszewski, M. AGREE—Analytical GREEnness Metric Approach and Software. Anal. Chem. 2020, 92, 10076–10082. [Google Scholar] [CrossRef] [Scilit] [PubMed]
- Balarajah, T.; Niroshan, M.; Udagedara, T. Validation of the Kjeldahl Method for Total Kjeldahl Nitrogen Analysis in Dry Aru Reservoir. In Proceedings of the International Water Conference 2025, Kilinochchi, Sri Lanka, 19–20 March 2025. [Google Scholar]
- Eertmans, F.; Bogaert, V.; Puype, B. Development and Validation of a High-Performance Liquid Chromatography (HPLC) Method for the Determination of Human Serum Albumin (HSA) in Medical Devices. Anal. Methods 2011, 3, 1296. [Google Scholar] [CrossRef] [Scilit]
- Borowczyk, K.; Wyszczelska-Rokiel, M.; Kubalczyk, P.; Głowacki, R. Simultaneous Determination of Albumin and Low-Molecular-Mass Thiols in Plasma by HPLC with UV Detection. J. Chromatogr. B 2015, 981–982, 57–64. [Google Scholar] [CrossRef] [Scilit] [PubMed]
- Rekowski, A.; Langenkämper, G.; Dier, M.; Wimmer, M.A.; Scherf, K.A.; Zörb, C. Determination of Soluble Wheat Protein Fractions Using the Bradford Assay. Cereal Chem. 2021, 98, 1059–1065. [Google Scholar] [CrossRef] [Scilit]
- Liang, Q.-Q.; Li, Y.-S. A Rapid and Accurate Method for Determining Protein Content in Dairy Products Based on Asynchronous-Injection Alternating Merging Zone Flow-Injection Spectrophotometry. Food Chem. 2013, 141, 2479–2485. [Google Scholar] [CrossRef] [Scilit] [PubMed]
- Capitán-Vallvey, L.F.; Duque, O.; Mirón-García, G.; Checa-Moreno, R. Determination of Protein Content Using a Solid Phase Spectrophotometric Procedure. Anal. Chim. Acta 2001, 433, 155–163. [Google Scholar] [CrossRef] [Scilit]
- Pour Nouroozi, R. Determination of Protein Concentration Using Bradford Microplate Protein Quantification Assay. Int. Electron. J. Med. 2015, 4, 11–17. [Google Scholar] [CrossRef] [Scilit]
- Lucas, B.N.; Nora, D.; Boeira, C.P.; Verruck, S.; Rosa, C.S.D. Determination of Total Phenolic Compounds in Plant Extracts via Folin-Ciocalteu’s Method Adapted to the Usage of Digital Images. Food Sci. Technol. 2022, 42, e35122. [Google Scholar] [CrossRef] [Scilit]
- Richardson, M.D.; Karcher, D.E.; Purcell, L.C. Quantifying Turfgrass Cover Using Digital Image Analysis. Crop Sci. 2001, 41, 1884–1888. [Google Scholar] [CrossRef] [Scilit]

Disclaimer/Publisher’s Note: The statements, opinions and data contained in all publications are solely those of the individual author(s) and contributor(s) and not of MDPI and/or the editor(s). MDPI and/or the editor(s) disclaim responsibility for any injury to people or property resulting from any ideas, methods, instructions or products referred to in the content. |
© 2026 by the authors. Licensee MDPI, Basel, Switzerland. This article is an open access article distributed under the terms and conditions of the Creative Commons Attribution (CC BY) license.