


Abstract
Ultrasonic guided waves acquired using permanently bonded piezoelectric transducers enable large-area monitoring of composite structures. For practical structural health monitoring; however, both the location and the condition of a structural change are critical. This paper presents a data-driven multi-task framework for a carbon-fiber-reinforced polymer plate using a circular PZT array. To generate a large, precise, and repeatable experimental dataset without permanently damaging the specimen, paired magnets were placed on opposite surfaces of the plate and moved using a two-axis positioning system over a uniform grid. Four magnet-pair configurations were used to form four balanced experimental classes. For each case, ultrasonic guided-wave signals from all actuator–sensor paths were concatenated and processed by a shared convolutional neural network and long short-term memory architecture. The model simultaneously estimates the spatial coordinates through two regression branches and identifies the magnet-pair perturbation configuration through a classification branch. An automated hyperparameter search was used to select the principal architectural and training parameters. Performance was evaluated using five-fold training/validation cross-validation. The selected configuration achieved a classification accuracy of and a macro F1-score of . The mean normalized Euclidean localization error was , and of the de-normalized localization errors were at or below . The shared architecture therefore performs simultaneous perturbation-configuration classification and two-dimensional localization from the same multi-path guided-wave measurements under the investigated controlled perturbation conditions.
1. Introduction
Carbon-fibre-reinforced polymer (CFRP) laminates are widely used in aerospace and other weight-sensitive structures because of their high specific stiffness and strength. Their layered construction, however, permits internal damage such as delamination and matrix cracking that can develop with limited surface evidence [1]. Ultrasonic guided waves (UGWs) are attractive for structural health monitoring (SHM) because a sparse network of permanently bonded piezoelectric transducers (PZTs) can interrogate a comparatively large area through multiple propagation paths [2,3,4,5].
Most UGW-based localization methods convert waveform changes into damage indices based on amplitude, energy, phase, correlation, or time of flight and then combine the path-wise indices using an imaging rule. Such methods are physically interpretable, but their performance can depend strongly on the selected mode, time window, threshold, baseline, and compensation procedure. These choices become difficult in CFRP plates because anisotropy, dispersion, multimodal propagation, boundary reflections, and transducer variability produce complex signals [6,7]. Data-driven models offer a complementary route by learning task-relevant representations directly from measured responses, reducing the dependence on manually designed features [8,9,10]. In CFRP adhesive joints, unsupervised data-driven approaches based on K-means clustering and autoencoders have also been investigated for baseline-free damage imaging and disbond characterization [11,12]. Recent studies have also shown that neural networks can detect and localize contact-induced ultrasonic guided-wave perturbations with high accuracy when the sensing geometry is represented appropriately [13]. Recent CFRP-specific studies have further investigated data-driven damage localization using transfer learning and distributionally robust guided-wave approaches [14,15].
Using the same CFRP plate and the same circular network of twelve PZTs, Zhang et al. [16] recently proposed a physics-based baseline-free localization method in which the amplitudes of the direct-arrival wave packets were compensated for propagation distance and direction and then integrated into RAPID imaging. The study used manually positioned 20 mm absorbent mud to emulate damage and evaluated 460 locations. The distance- and direction-compensated method placed 96.74% of the localization errors at or below , compared with 91.09% for path matching and 84.13% for virtual time reversal; its maximum reported error was 29.83 mm. This study provides the closest physics-based reference for the present work because the specimen and PZT network are identical, although the perturbation mechanism, spatial sampling, and validation procedures are different.
A recent study by Azad et al. [17] demonstrated an integrated multi-task transfer-learning framework based on a 1D-CNN and guided Lamb-wave measurements for damage detection, localization, and severity assessment in laminated composites. Their framework was evaluated using three damage-severity levels at nine locations and employed Bayesian optimization for hyperparameter selection, reporting an of 93.82% for damage localization and 87.04% accuracy for severity assessment. This work demonstrates that CNN-based multi-task learning and automated hyperparameter optimization have already been applied successfully to composite damage assessment. Accordingly, the novelty of the present study does not lie in the use of CNNs, recurrent layers, multi-task learning, or hyperparameter optimization individually. Instead, the contribution lies in integrating automated and repeatable dense-grid perturbation placement with multi-path ultrasonic guided-wave acquisition and joint two-dimensional localization and perturbation-configuration classification.
Existing studies have often relied on relatively limited or manually sampled damage locations, which can constrain the spatial resolution and repeatability of the resulting datasets. Moreover, localization and perturbation-configuration identification are commonly treated as separate objectives, despite both being encoded in the spatially distributed ultrasonic guided-wave response. A systematic dataset acquired over a dense and uniform spatial grid therefore provides an opportunity to investigate whether a shared learned representation can simultaneously capture information related to perturbation position and perturbation configuration. Localization and perturbation-configuration identification are related but distinct tasks. A position estimate should be sensitive to the spatial pattern across propagation paths, whereas classification should retain information associated with the magnitude and form of the local perturbation. Multi-task learning uses a shared representation for related outputs and can improve data efficiency or regularize the individual tasks when their information is complementary [18,19,20].
The authors’ I2MTC 2026 proceedings paper [21] introduced a CNN–LSTM model for two-dimensional localization using 183 manually positioned absorbent-mud perturbations. The present study differs from that work both experimentally and methodologically. Manual perturbation placement is replaced by an automated two-axis positioning system that moves a reversible magnet-pair perturbation over a uniform spatial grid. Four magnet-pair perturbation configurations are measured at every coordinate, increasing the dataset to 1764 observations and enabling the same spatial locations to be examined under four distinct perturbation configurations. In addition, the localization-only formulation of the conference study is extended to a multi-task model that jointly estimates the two-dimensional perturbation coordinates and classifies the perturbation configuration. Thus, the principal extension is the combination of automated dense-grid experimental acquisition with joint localization and perturbation-configuration classification.
The main contributions are threefold: (1) an automated experimental platform that enables precise and repeatable acquisition of ultrasonic guided-wave measurements over a dense spatial grid; (2) a balanced experimental dataset comprising four magnet-pair perturbation configurations at each of the 441 coordinates, enabling localization and perturbation-configuration information to be learned from the same multi-path measurements; and (3) integration of these measurements within a shared multi-task CNN–LSTM framework for simultaneous two-dimensional localization and perturbation-configuration classification, followed by five-fold experimental evaluation using classification and localization metrics.
2. Materials and Methods
2.1. Specimen and Ultrasonic Guided-Wave Measurements
The specimen is a quasi-isotropic CFRP plate with dimensions of and reinforcement directions at and , supplied from Easy Composite (product code: CFS-RI-1-0225). Twelve circular PZT-4 transducers, approximately in diameter and thick, are bonded to the plate with two-component epoxy from UHU (Plus SCHNELLFEST 2K-Epoxy, 5-min curing), and arranged on a circle of approximately radius. The network provides 66 unique actuator–sensor paths, considering a single direction for each sensor pair. During acquisition, both transmission directions were recorded, yielding 132 directed responses per observation. Both placement and coupling were experimentally validated to ensure proper signal transmission. This specimen and PZT network are the same as those used for the physics-based baseline-free localization study in [16]. The 12-PZT configuration was retained from this previously established experimental platform rather than selected as an optimized sensor count. With pairwise acquisition, it provides 66 unique actuator–sensor paths.
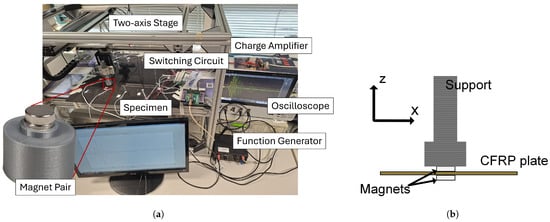
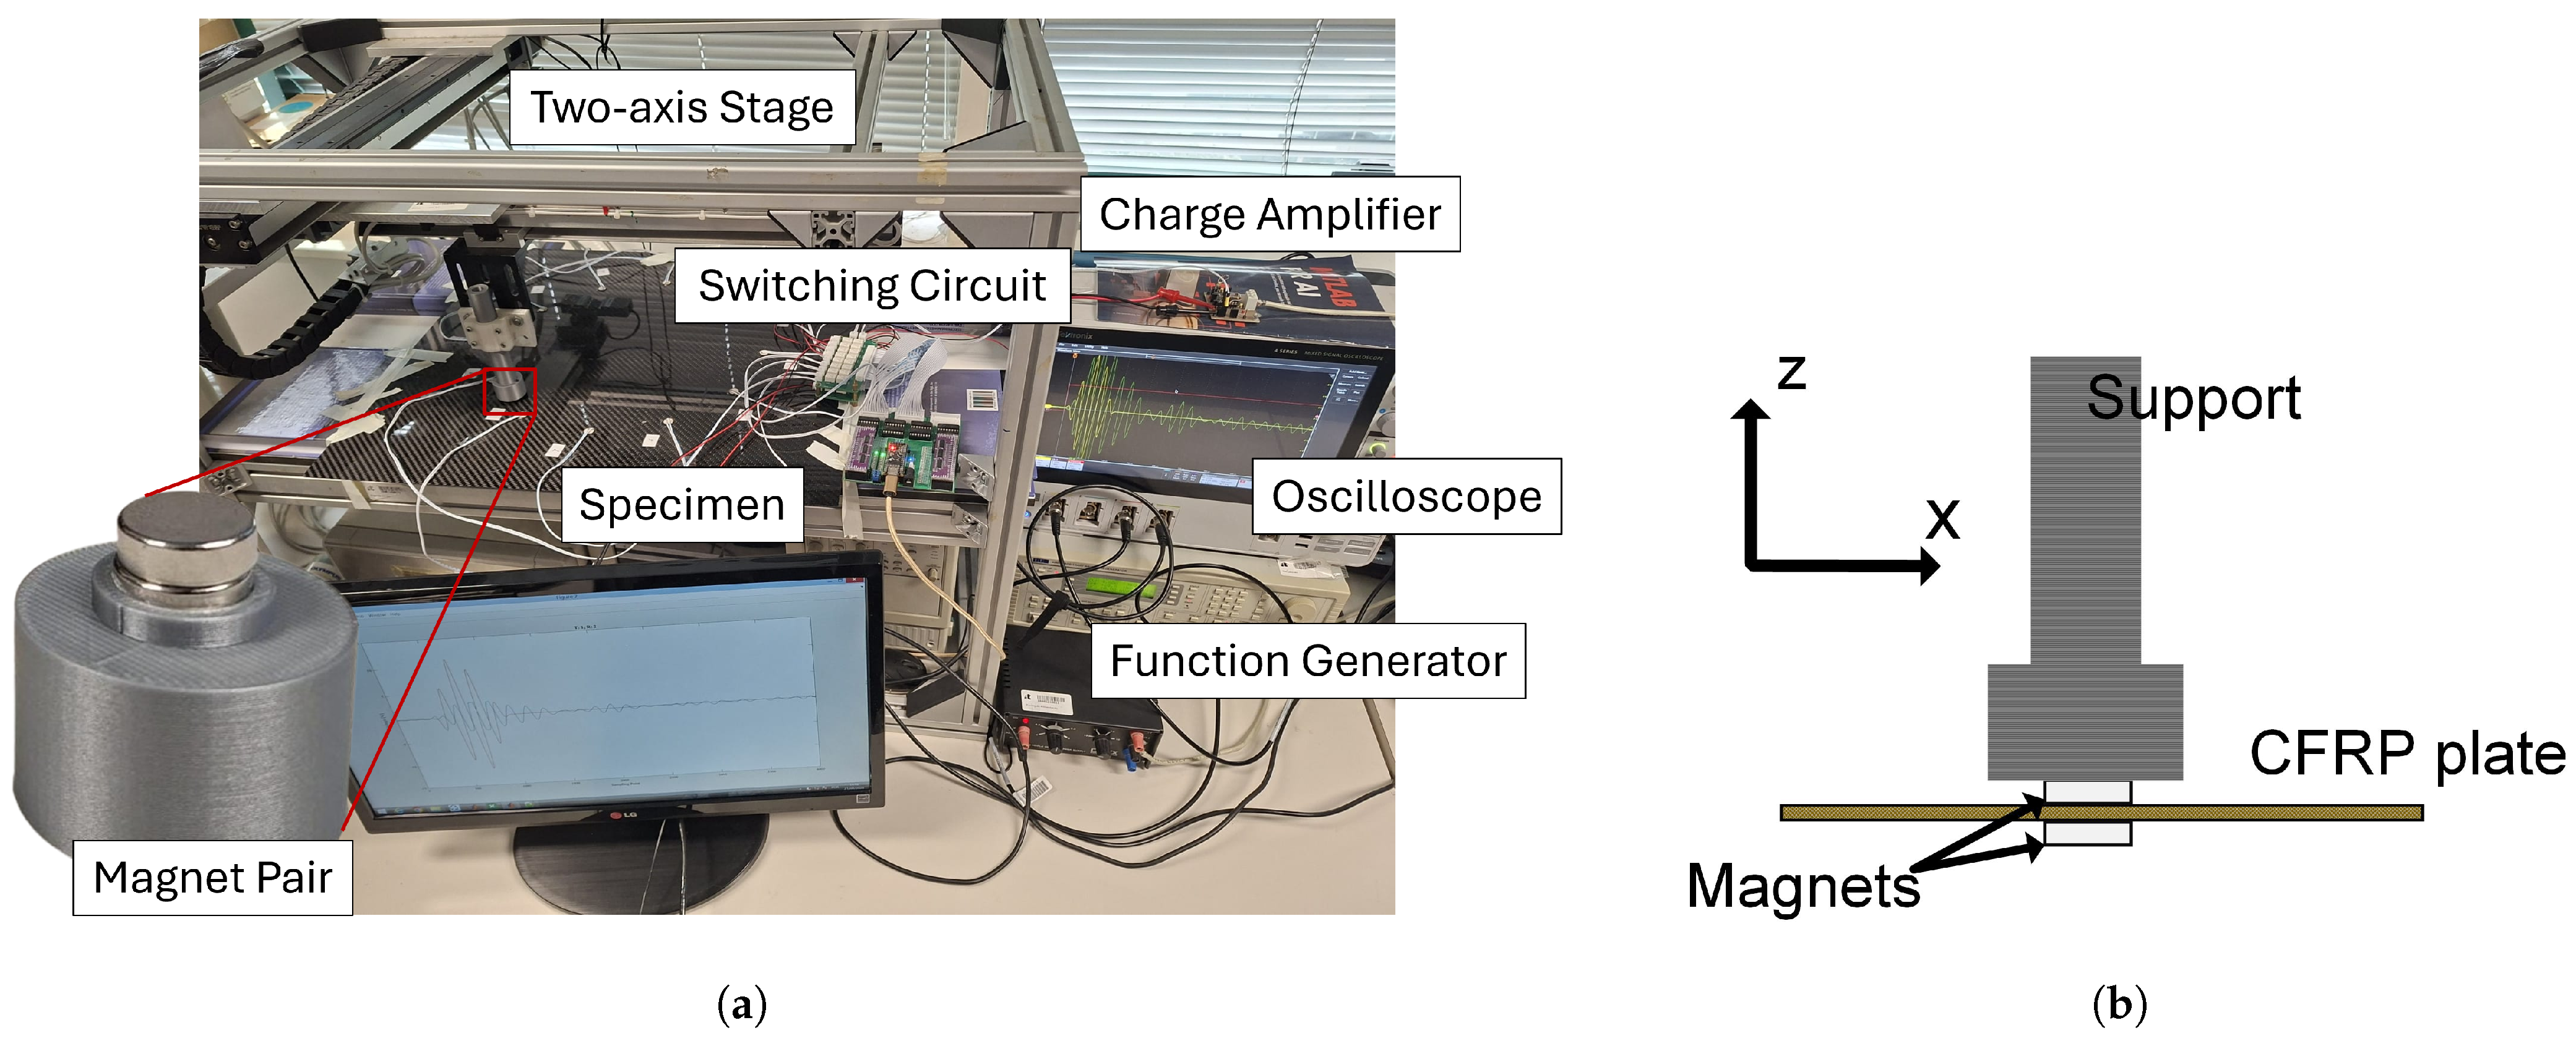
The measurement chain comprises a TGA1242 arbitrary waveform generator, an MSO44 oscilloscope, a charge amplifier, and a custom relay-based multichannel switching circuit, also used in Ref. [16], with Toshiba ULN2003APG Darlington driver arrays controlling the signal relays for sequential transmitter–receiver selection, as denoted in Figure 1a. Each actuator is excited by a five-cycle, Hann-windowed sinusoidal tone burst with an amplitude of . In Ref. [16], frequencies between 40 and were experimentally investigated. The measurements showed a dominant response at and a dominant response at higher frequency, with the mode at providing greater sensitivity to the localized perturbation. This frequency was therefore retained in the present study. For the present CFRP plate, the group velocity at is direction dependent and is approximately – over the investigated propagation directions; the corresponding experimental dispersion characterization is reported in [16]. Responses are sampled at and stored as 4000-point signals for each path. Each signal is downsampled by a factor of 4, reducing the sampling frequency to . A cosine bandpass filter is then applied, with a lower cutoff frequency of , an upper cutoff frequency of , and a transition bandwidth. No software waveform averaging was performed. At each spatial position, the actuator–sensor pairs were selected sequentially through the relay-based switching circuit with triggered excitation, and no post-acquisition temporal-alignment operation was applied.
Figure 1.
Experimental setup for the PZT sensor network with controlled localized perturbation using a magnet pair. (a) Overall experimental arrangement, including the CFRP specimen, two-axis positioning stage, multichannel switching circuit, charge amplifier, function generator, and oscilloscope. (b) Schematic of the magnet–specimen interaction. The upper magnet is attached to the positioning support, while magnetic attraction keeps the lower magnet aligned on the opposite surface of the CFRP plate. Both magnets remain in contact with the plate surfaces during positioning.
2.2. Automated Magnet-Pair Scan
A two-axis positioning stage is used to move the loading assembly within the specimen plane. This enables automated data acquisition with controlled and repeatable positioning of the localized perturbation. At each coordinate, a magnet attached to the moving support interacts with a second magnet placed beneath the CFRP plate. This magnet–specimen arrangement is illustrated in Figure 1b. At each coordinate, data acquisition was initiated only after the positioning stage and magnet pair had reached a stable position, while the same mechanical arrangement was maintained for all measurements of a given magnet-pair configuration. The resulting magnetic interaction introduces a localized and reversible mechanical perturbation that modifies the ultrasonic guided-wave field without permanently damaging the specimen. Removable magnets placed on opposite sides of composite plates have previously been used as simulated-damage or scattering targets for guided-wave SHM experiments [22,23]. In the present study, the term “damage-like perturbation” refers specifically to this ability to introduce a localized guided-wave disturbance suitable for localization studies. It does not imply that the magnet pair reproduces the physical morphology or scattering behaviour of a particular damage mechanism. In particular, previous measurements have demonstrated that magnet-induced scattering can differ substantially from that produced by an actual delamination [22].
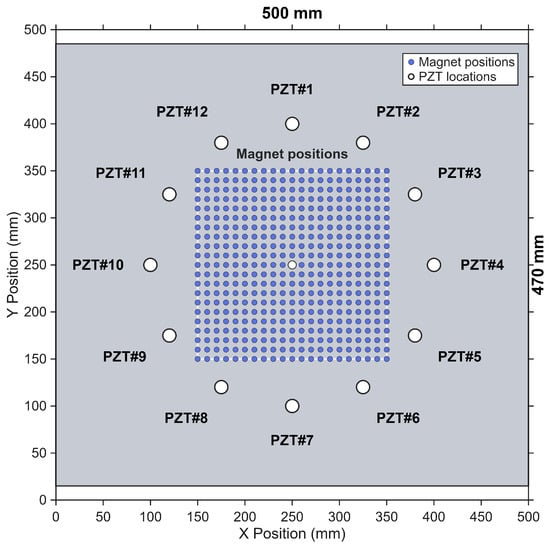
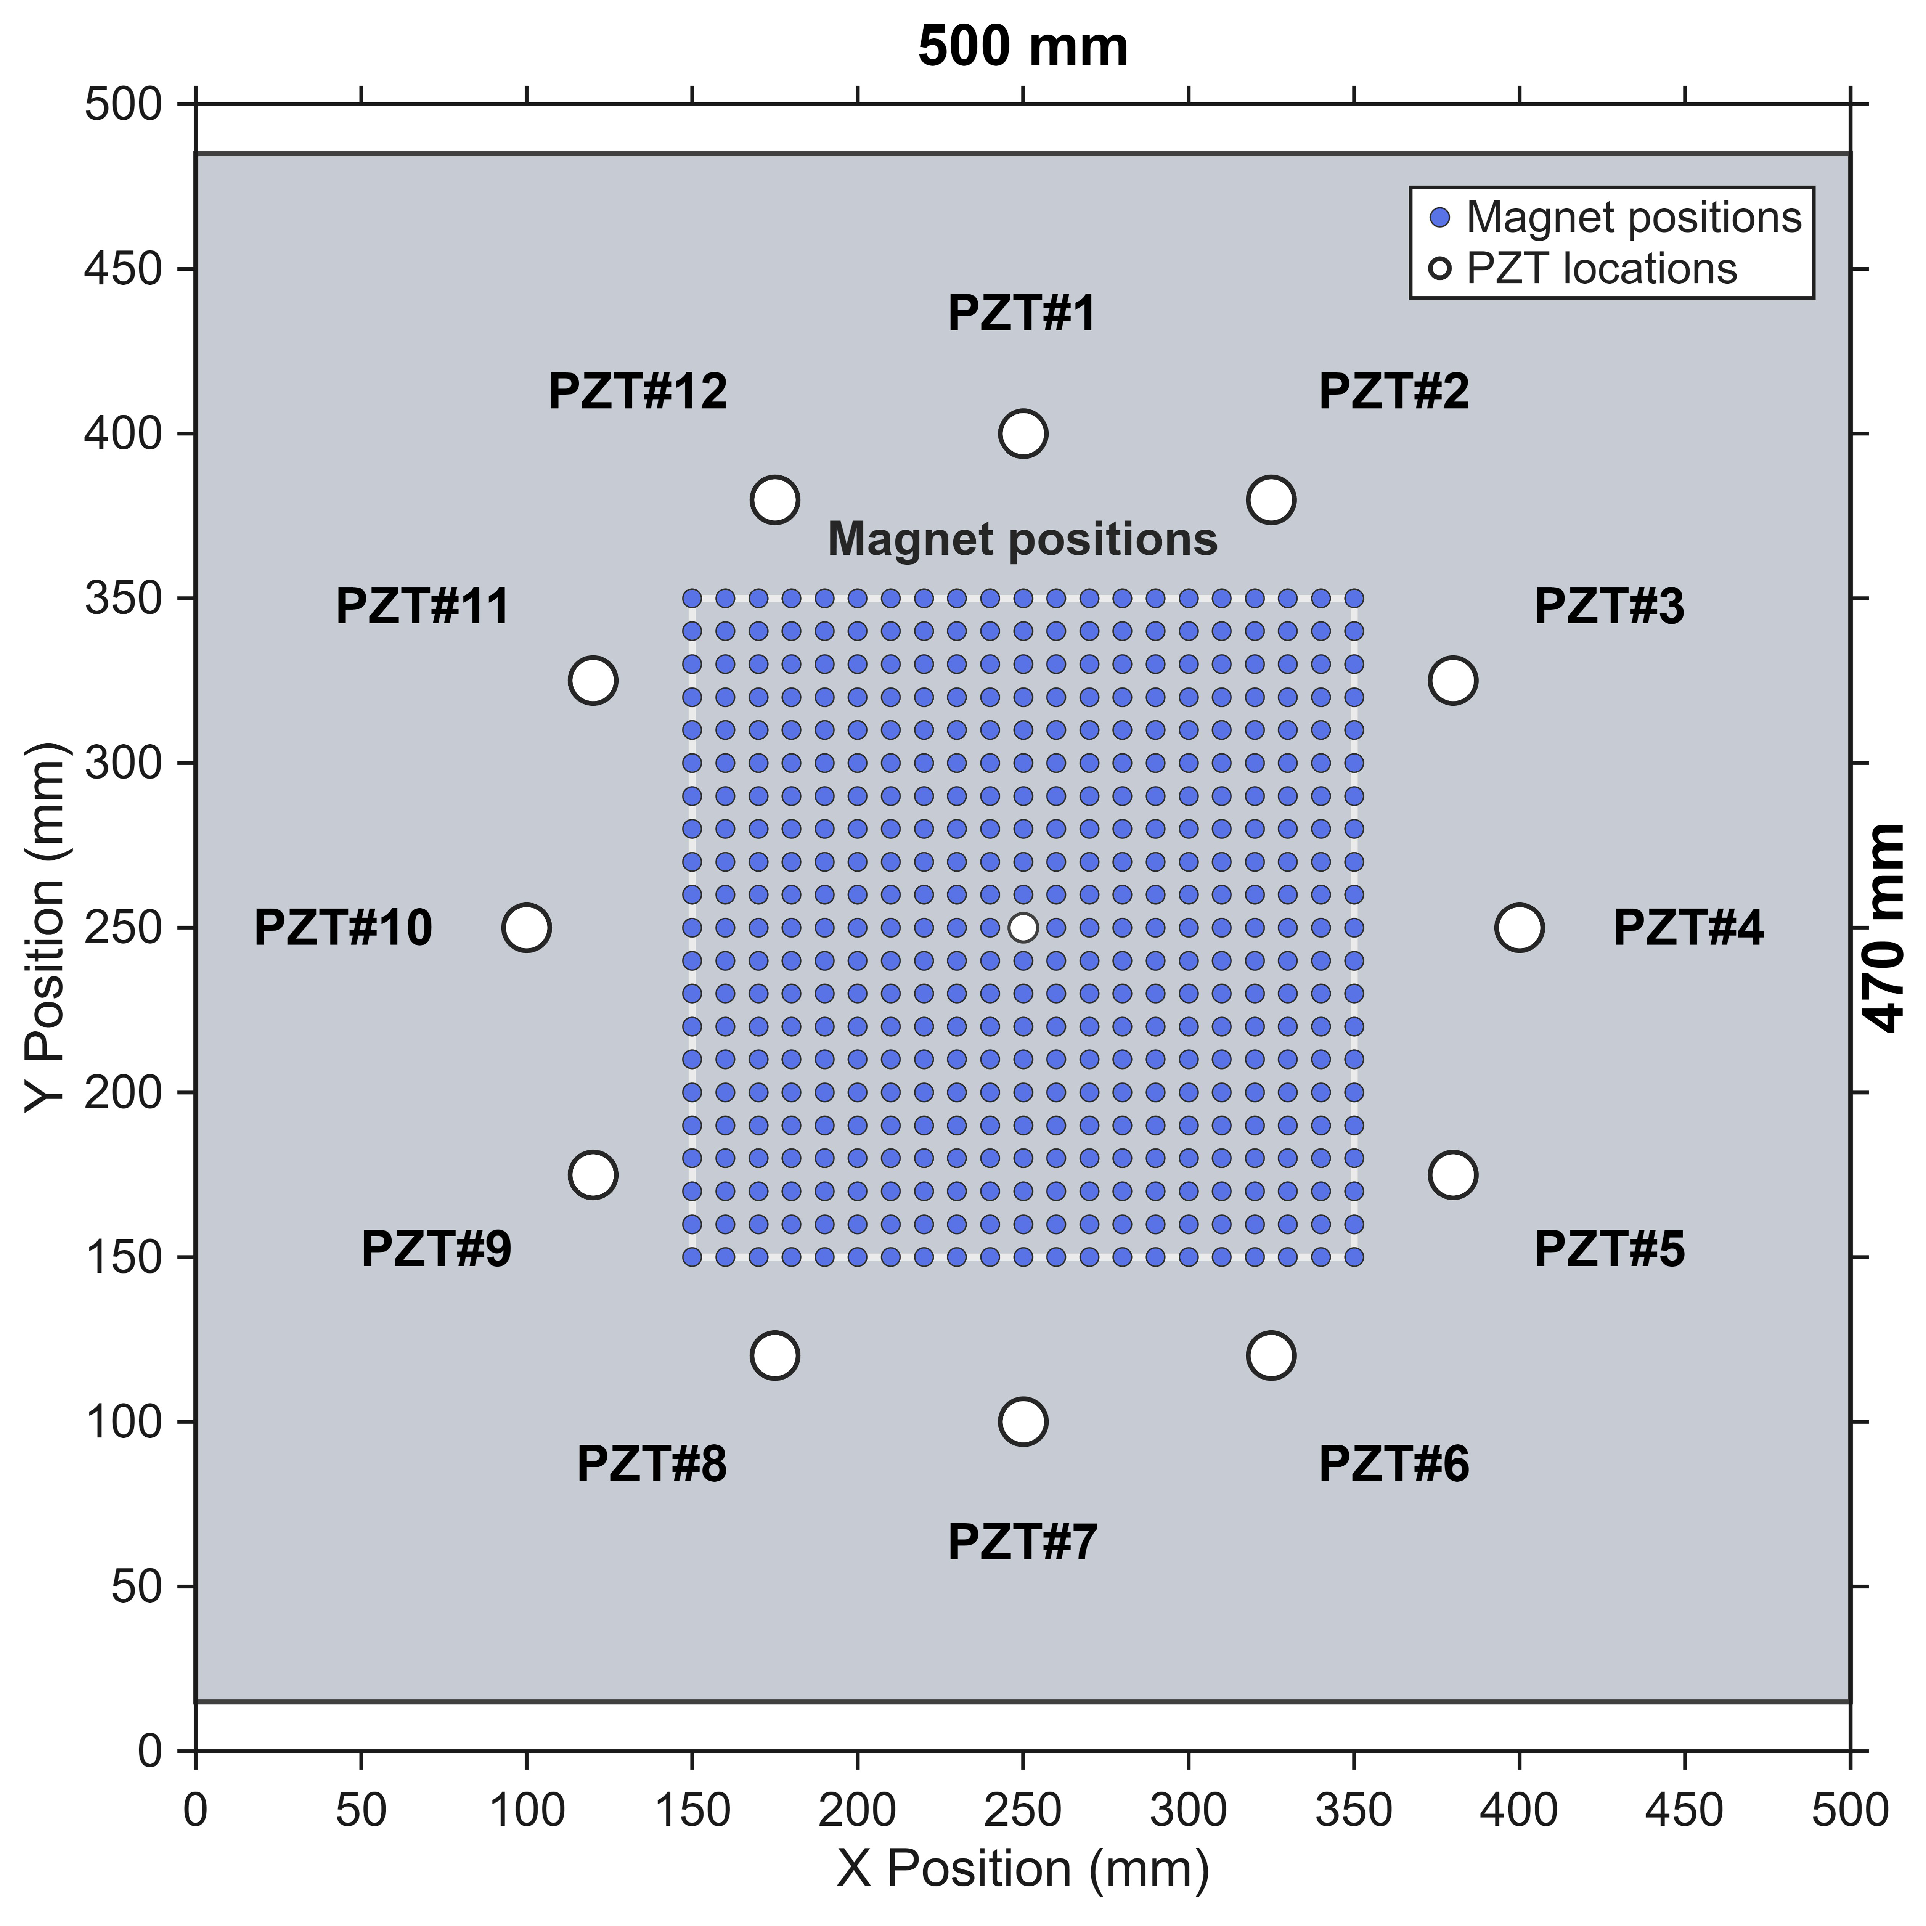
The scan comprises 21 positions along each axis, resulting in a total of 441 measurement locations, with nominal increments , covering a scan region of . The XY positioning system has an in-plane resolution of . The initial bottom-left reference position was established manually using a ruler with graduations, corresponding to a reference-position uncertainty of . This value refers to the establishment of the initial absolute reference position and not to the uncertainty of each nominal stage movement. Figure 2 illustrates the arrangement of the twelve PZT transducers and the complete set of measurement locations within the scanned region. The positioning stage enables the localized perturbation to be sequentially positioned at each location, allowing the measurements to be acquired systematically across the entire scan area.
Figure 2.
Arrangement of the twelve PZT transducers and the 441 perturbation positions within the scanned region, with nominal spacing along both axes.
Four acquisitions are associated with each coordinate, corresponding to four different NdFeB magnet-pair configurations. The magnets were purchased from Supermagnete and are denoted as M1–M4. Table 1 defines the class labels corresponding to each magnet and lists their product codes, dimensions, and nominal forces. The dimensions are reported as diameter × thickness. All magnet pairs have the same manufacturing tolerance of . The nominal supplier holding force is reported only to identify the magnets and is not treated as the applied force on the plate. The resulting dataset is balanced, comprising 441 observations per class and 1764 observations in total.
Table 1.
Magnet specifications and class assignments used for data acquisition.
2.3. Input Representation
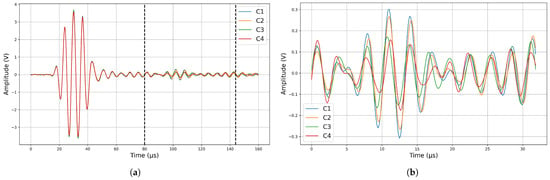
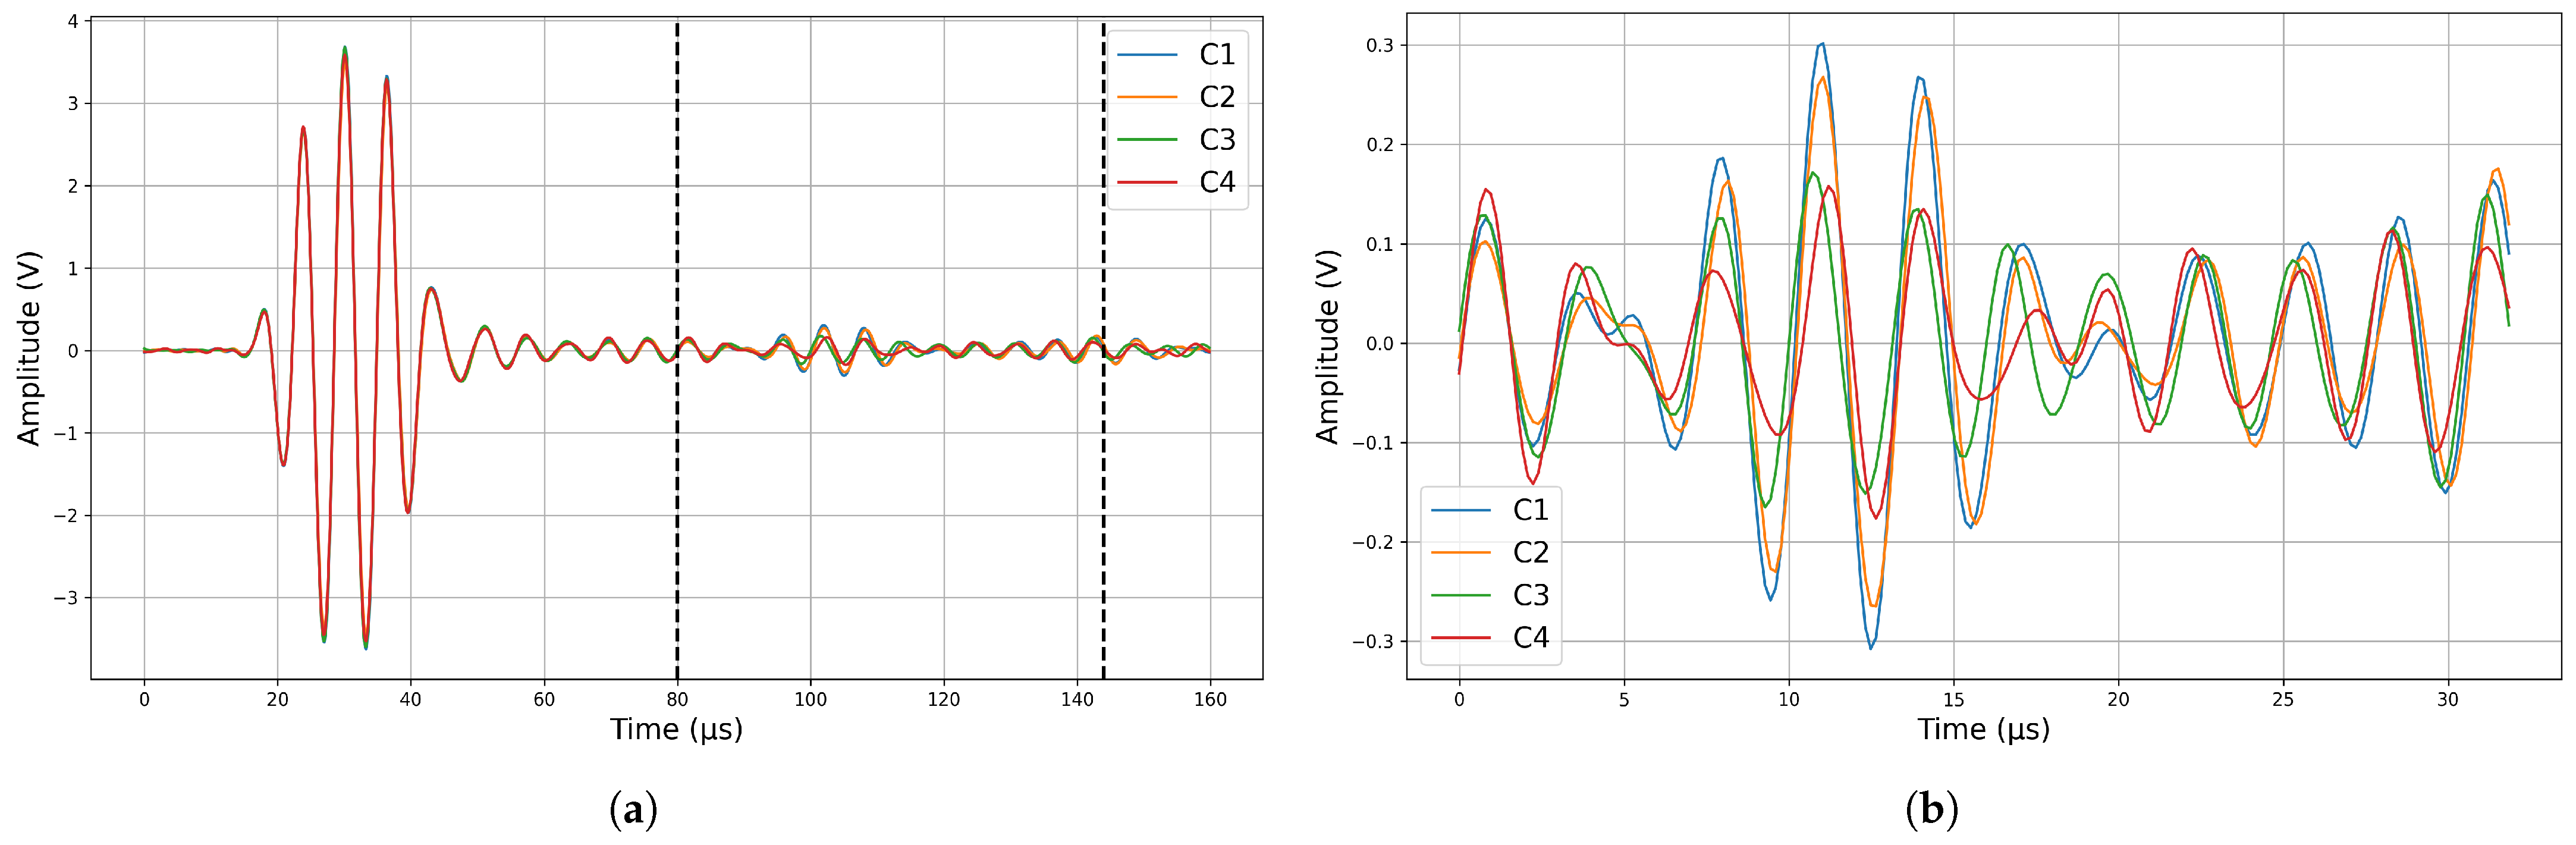
From the 132 preprocessed responses, one direction from each reciprocal pair is retained, giving a matrix. The PZT-pair grouping and distance-dependent direct-arrival windowing follow the procedure defined in [16]. Because the arrival time of the ultrasonic guided-wave response varies with the propagation distance between PZT pairs, a distance-dependent time window containing the direct-arrival wave packet is extracted from each signal. As illustrated in Figure 3a, representative raw responses for all four magnet-pair perturbation configurations (C1–C4), measured along the PZT#1–PZT#7 actuator–sensor path, are shown. The initial high-amplitude transient corresponds to electrical crosstalk/feedthrough associated with the actuation and acquisition circuitry, and is therefore excluded from the model input. The direct-arrival wave packet was selected because this portion of the response has previously been shown to contain damage-sensitive information for ultrasonic guided-wave localization using the same CFRP specimen and PZT network [16]. For paths with the same propagation distance, the direct-arrival wave packet occurs at a similar temporal position, allowing a common window to be applied. Depending on the path group, the 400-sample windows start at samples 201, 301, 401, or 501 of the 1000-point responses. The extracted 400-sample windows are subsampled by a factor of two to 200 points, as shown by the representative processed waveforms in Figure 3b, reducing the input dimensionality while retaining the direct-arrival ultrasonic guided waves information used by the model.
Figure 3.
Representative raw and processed ultrasonic guided-wave responses for the four magnet-pair perturbation configurations (C1–C4), measured along the PZT#1–PZT#7 actuator–sensor path. (a) Raw responses prior to preprocessing. The initial high-amplitude transient corresponds to electrical crosstalk/feedthrough and is excluded from the model input; the dashed vertical lines indicate the time window used to isolate the direct-arrival wave packet. (b) Corresponding processed responses after window extraction and subsampling to 200 points.
The 66 paths are then concatenated according to the path-group ordering defined in [16] to form a 13,200-sample one-dimensional input. Max-absolute normalization is applied to scale each input feature vector to the range . The normalization factor is given by the maximum absolute value within each vector:
Note that, for an all-zero feature vector, the normalization factor is set to 1, avoiding a division by zero. Since a single normalization factor is applied to the complete 13,200-sample vector, this operation removes the absolute overall signal magnitude of each observation. However, it preserves the sign and relative amplitudes of the samples, the relative responses among the 66 paths, and the spatial/signal pattern represented by their fixed concatenation order. Consequently, the classification task cannot rely solely on differences in absolute signal magnitude between the four magnet conditions, but can exploit differences in their normalized response patterns. The coordinate targets are min–max normalized using the physical limits of the scan region, scaled to the range . The condition label is encoded as an integer ranging from 0 to 3, corresponding to the classes presented in Table 1.
2.4. Network Architecture
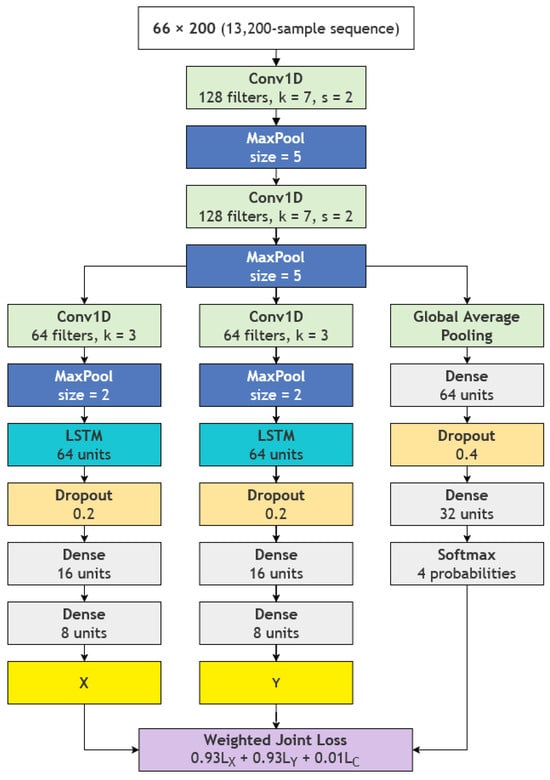
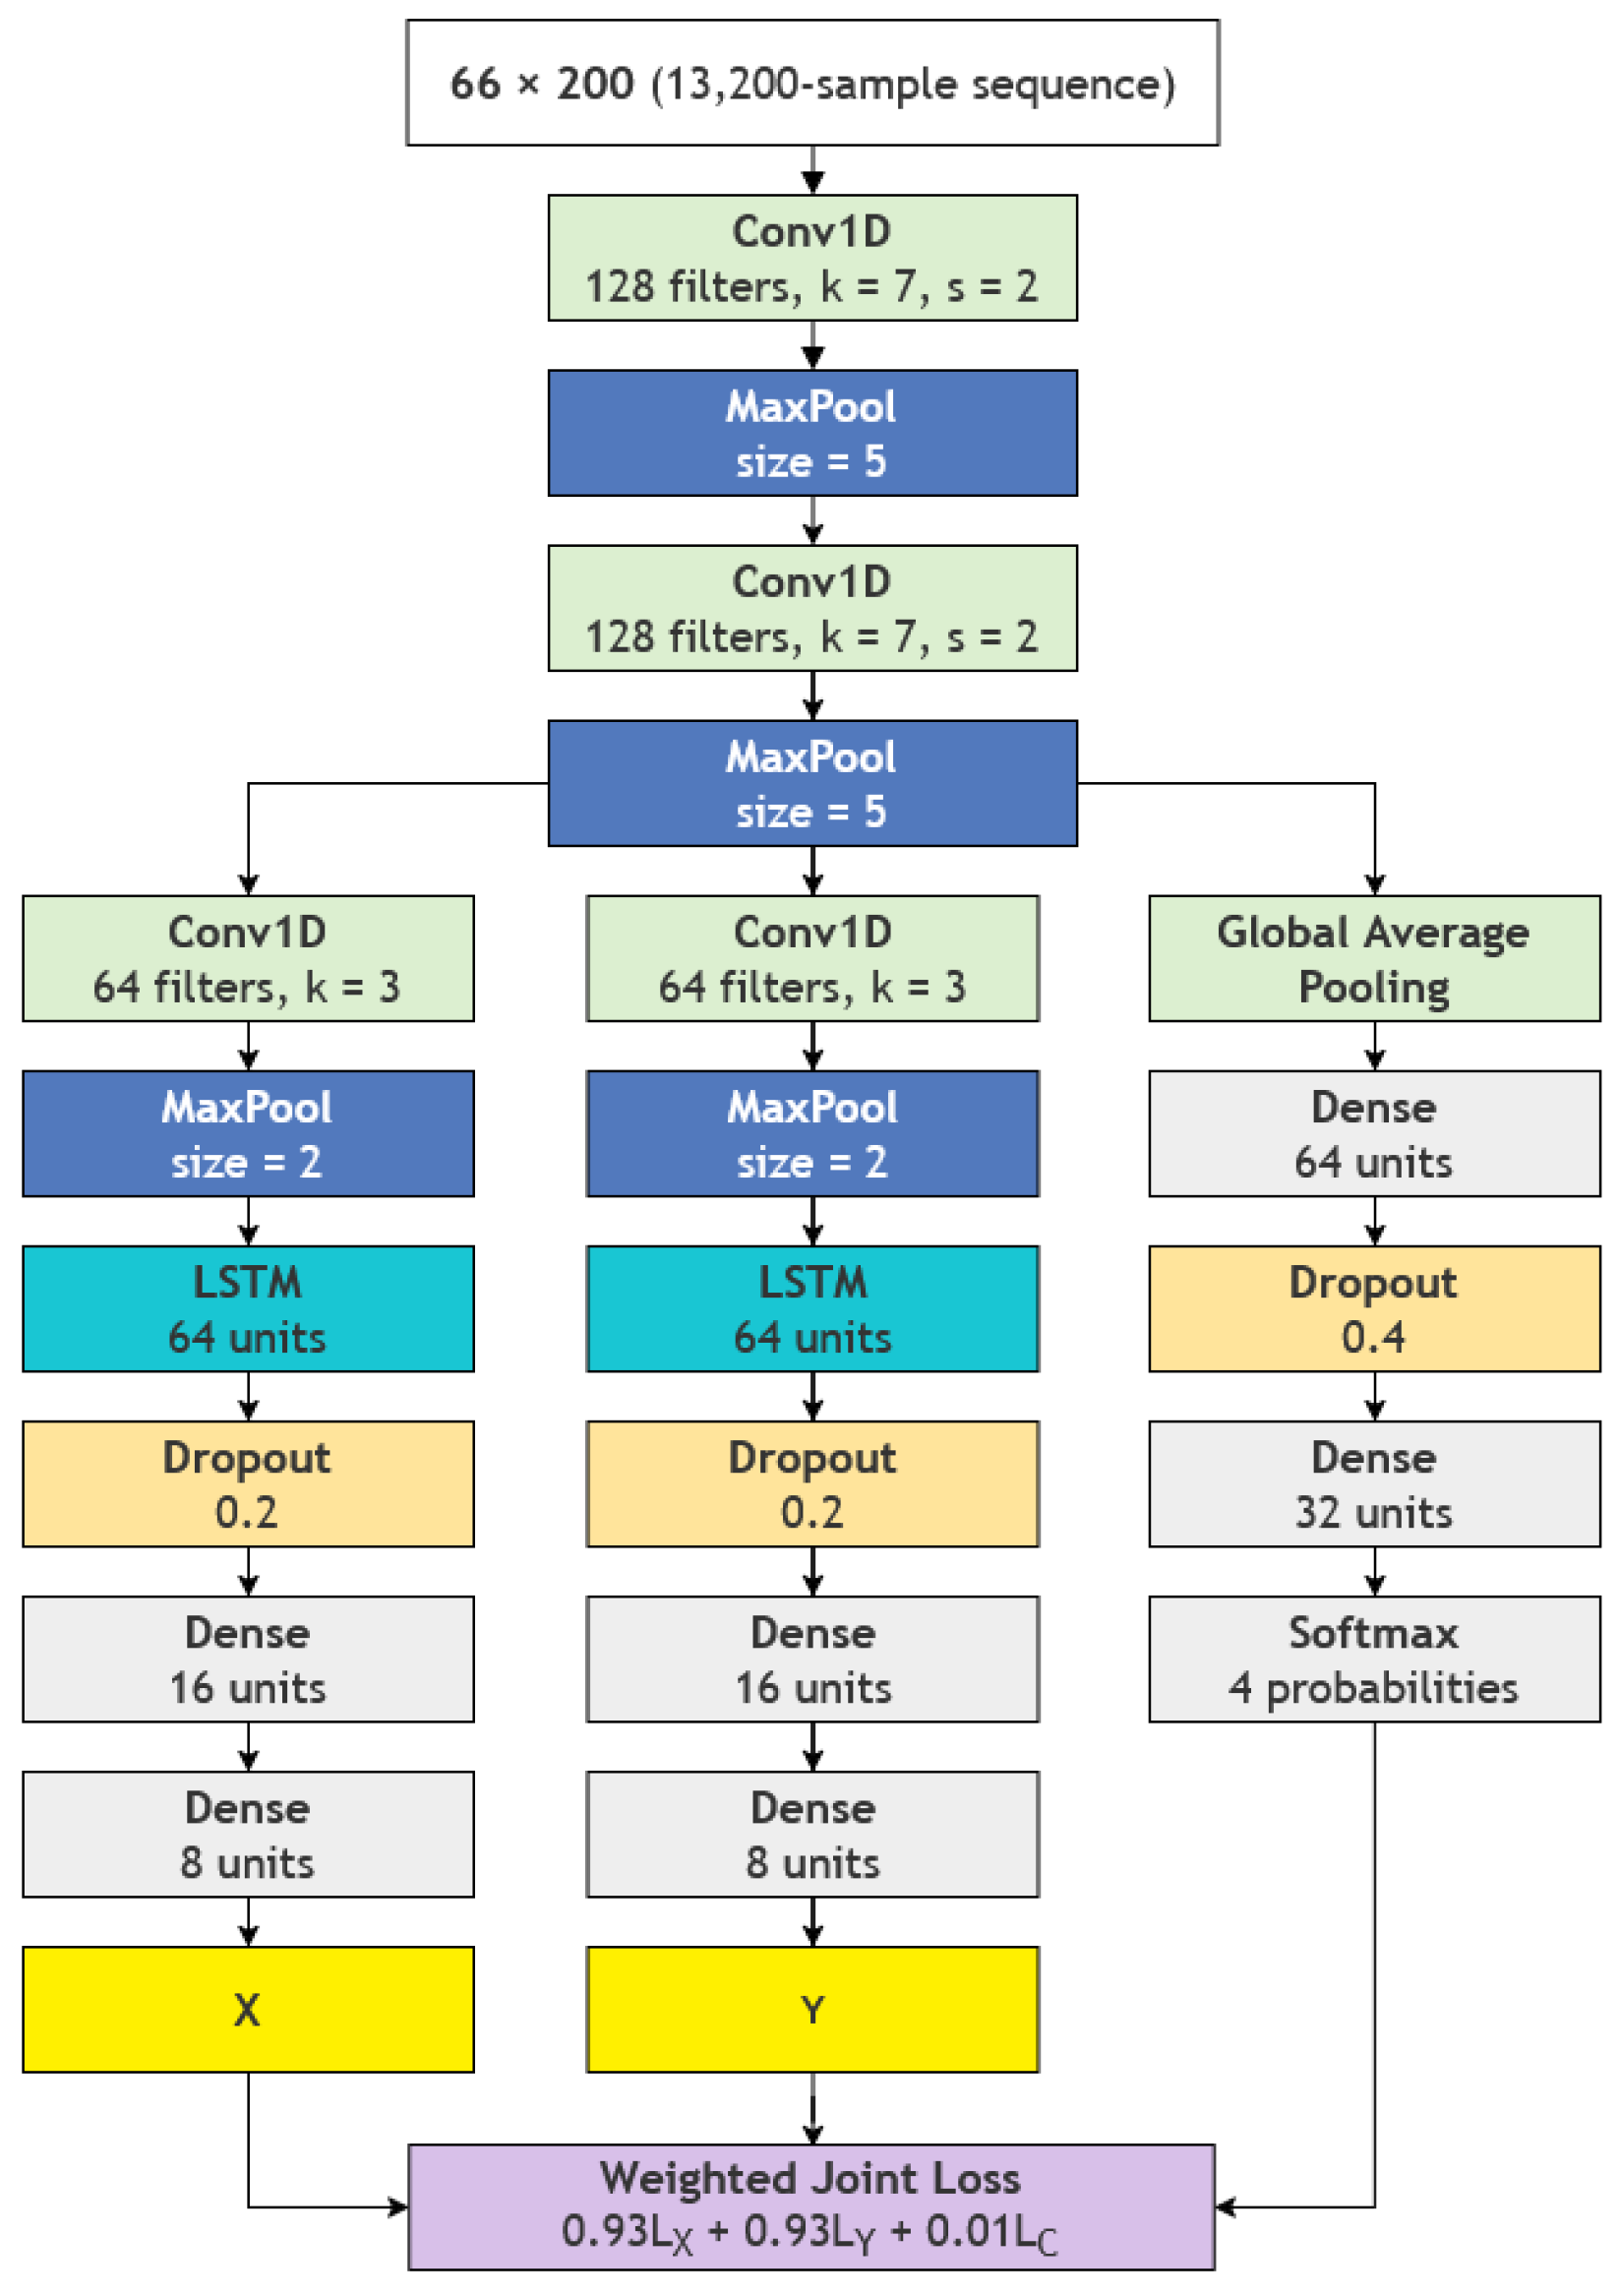
The proposed model consists of a shared convolutional trunk followed by three task-specific branches. Two coordinate branches predict the position of the localized perturbation on the specimen, outputting x and y, while a classification branch identifies the corresponding magnet-pair perturbation configuration. The four classes therefore represent four controlled perturbation configurations and are not interpreted as different damage types or calibrated damage-severity levels. The architecture of the model is shown in Figure 4. The trunk contains two Conv1D layers with 128 filters, a kernel size of 7, a stride of 2, GELU activation, layer normalization, and max pooling. Each coordinate branch contains an additional 64-filter Conv1D block, a 64-unit LSTM, dropout, and dense layers with 16 and 8 units before a linear output. The classification branch uses global average pooling, dense layers with 64 and 32 units, dropout, and a four-unit softmax output. For the 13,200-sample input representation used in this study, the resulting multi-task network contains 373,894 trainable parameters and no non-trainable parameters. The mean CPU inference time for a single observation was . This shared trunk allows the three outputs to utilize common waveform features while the branches retain task-specific representations. The architecture was selected to match the one-dimensional multi-path waveform representation and the joint localization–classification task. The Conv1D layers provide local feature extraction from the concatenated guided-wave signals, while the LSTM layers in the coordinate branches capture dependencies over broader portions of the ordered feature representation that are relevant to position estimation. A shared convolutional trunk is used because both perturbation location and perturbation configuration are encoded in the same multi-path measurements, whereas separate task-specific branches allow the regression and classification outputs to learn different mappings from these shared features. Global average pooling is used in the classification branch to aggregate the learned features into a compact representation for perturbation-configuration classification.
Figure 4.
Schematic of the proposed multi-task architecture for localization and perturbation-configuration classification of the damage-like perturbation using a network of PZT transducers, consisting of a shared convolutional trunk followed by three task-specific branches.
The training objective of the proposed model is
where CE denotes sparse categorical cross-entropy, chosen because softmax output produces a probability distribution across the four classes, while CE considers the predicted probability associated with the true class. MSE denotes Mean Squared Error and minimizes the squared difference between the predicted and true values, thereby penalizing larger errors more strongly. The selected loss weights were and . Although the classification weight is substantially smaller than the regression weights, the individual loss terms operate on different numerical scales. Across the five cross-validation folds, evaluated at the selected validation epoch, the mean unweighted losses were , , and . The classification loss was therefore approximately 73 and 90 times larger than the x- and y-coordinate losses, respectively, before weighting. After applying the corresponding weights, the mean contributions to the total loss were , , and . These correspond to mean relative contributions of , , and , respectively. The smaller classification weight therefore compensates for the larger numerical scale of the cross-entropy loss, resulting in contributions of comparable magnitude from the three loss components.
2.5. Hyperparameter Selection and Validation
The final hyperparameter configuration presented in Table 2 was selected using Optuna, an open-source automatic hyperparameter optimization framework [24], with the objective function defined as the Euclidean error between the predicted and true values, which was minimized during the optimization process over 50 trials. The hyperparameters and their corresponding search spaces explored during the optimization are summarized in Table 3. Categorical hyperparameters were selected from the predefined discrete sets, while the dropout rates and loss weights were sampled within their specified ranges. The learning rate was sampled on a logarithmic scale between and . Each trial was conducted for 500 epochs using 5-fold cross-validation. For each fold, 80% of the data were used for training and the remaining 20% for validation. No custom pruning strategy was specified; the default Optuna pruning mechanism was used to terminate unpromising trials during the optimization. Because hyperparameter selection was conducted using the same overall dataset, the reported cross-validation results may retain some model-selection bias. A more stringent evaluation using nested cross-validation or a test set excluded from all hyperparameter optimization should be considered in future work.
Table 2.
Final hyperparameter configuration selected after optimization.
Table 3.
Hyperparameter search spaces explored by Optuna.
Performance is assessed using five class-balanced folds generated by shuffling the spatial-coordinate indices with a fixed random seed of 42, with 80% of the data used for training and the remaining 20% for validation in each fold. The same fold assignment is applied across the four condition-specific datasets so that the observations corresponding to the perturbation configurations – at a given spatial coordinate are always assigned to the same partition. This prevents coordinate-level leakage by ensuring that observations from different perturbation configurations at the same spatial coordinate are not distributed between the training and validation sets. The reported performance metrics correspond to the validation predictions obtained across the five folds.
Classification is evaluated using accuracy, macro F1-score, class-wise precision and recall, the confusion matrix, and one-versus-rest ROC AUC. Localization is evaluated using coordinate MAE, MSE, , and Euclidean distance. After de-normalization, the physical distance error is
where and are the physical scan spans.
For the reported five-fold model training, each fold was trained for a maximum of 500 epochs with early stopping based on the validation loss using a patience of 300 epochs and restoration of the weights corresponding to the minimum validation loss. No additional fixed random seed was specified for neural network weight initialization.
3. Results
3.1. Perturbation-Configuration Classification
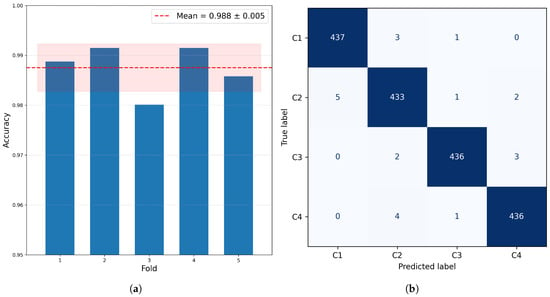
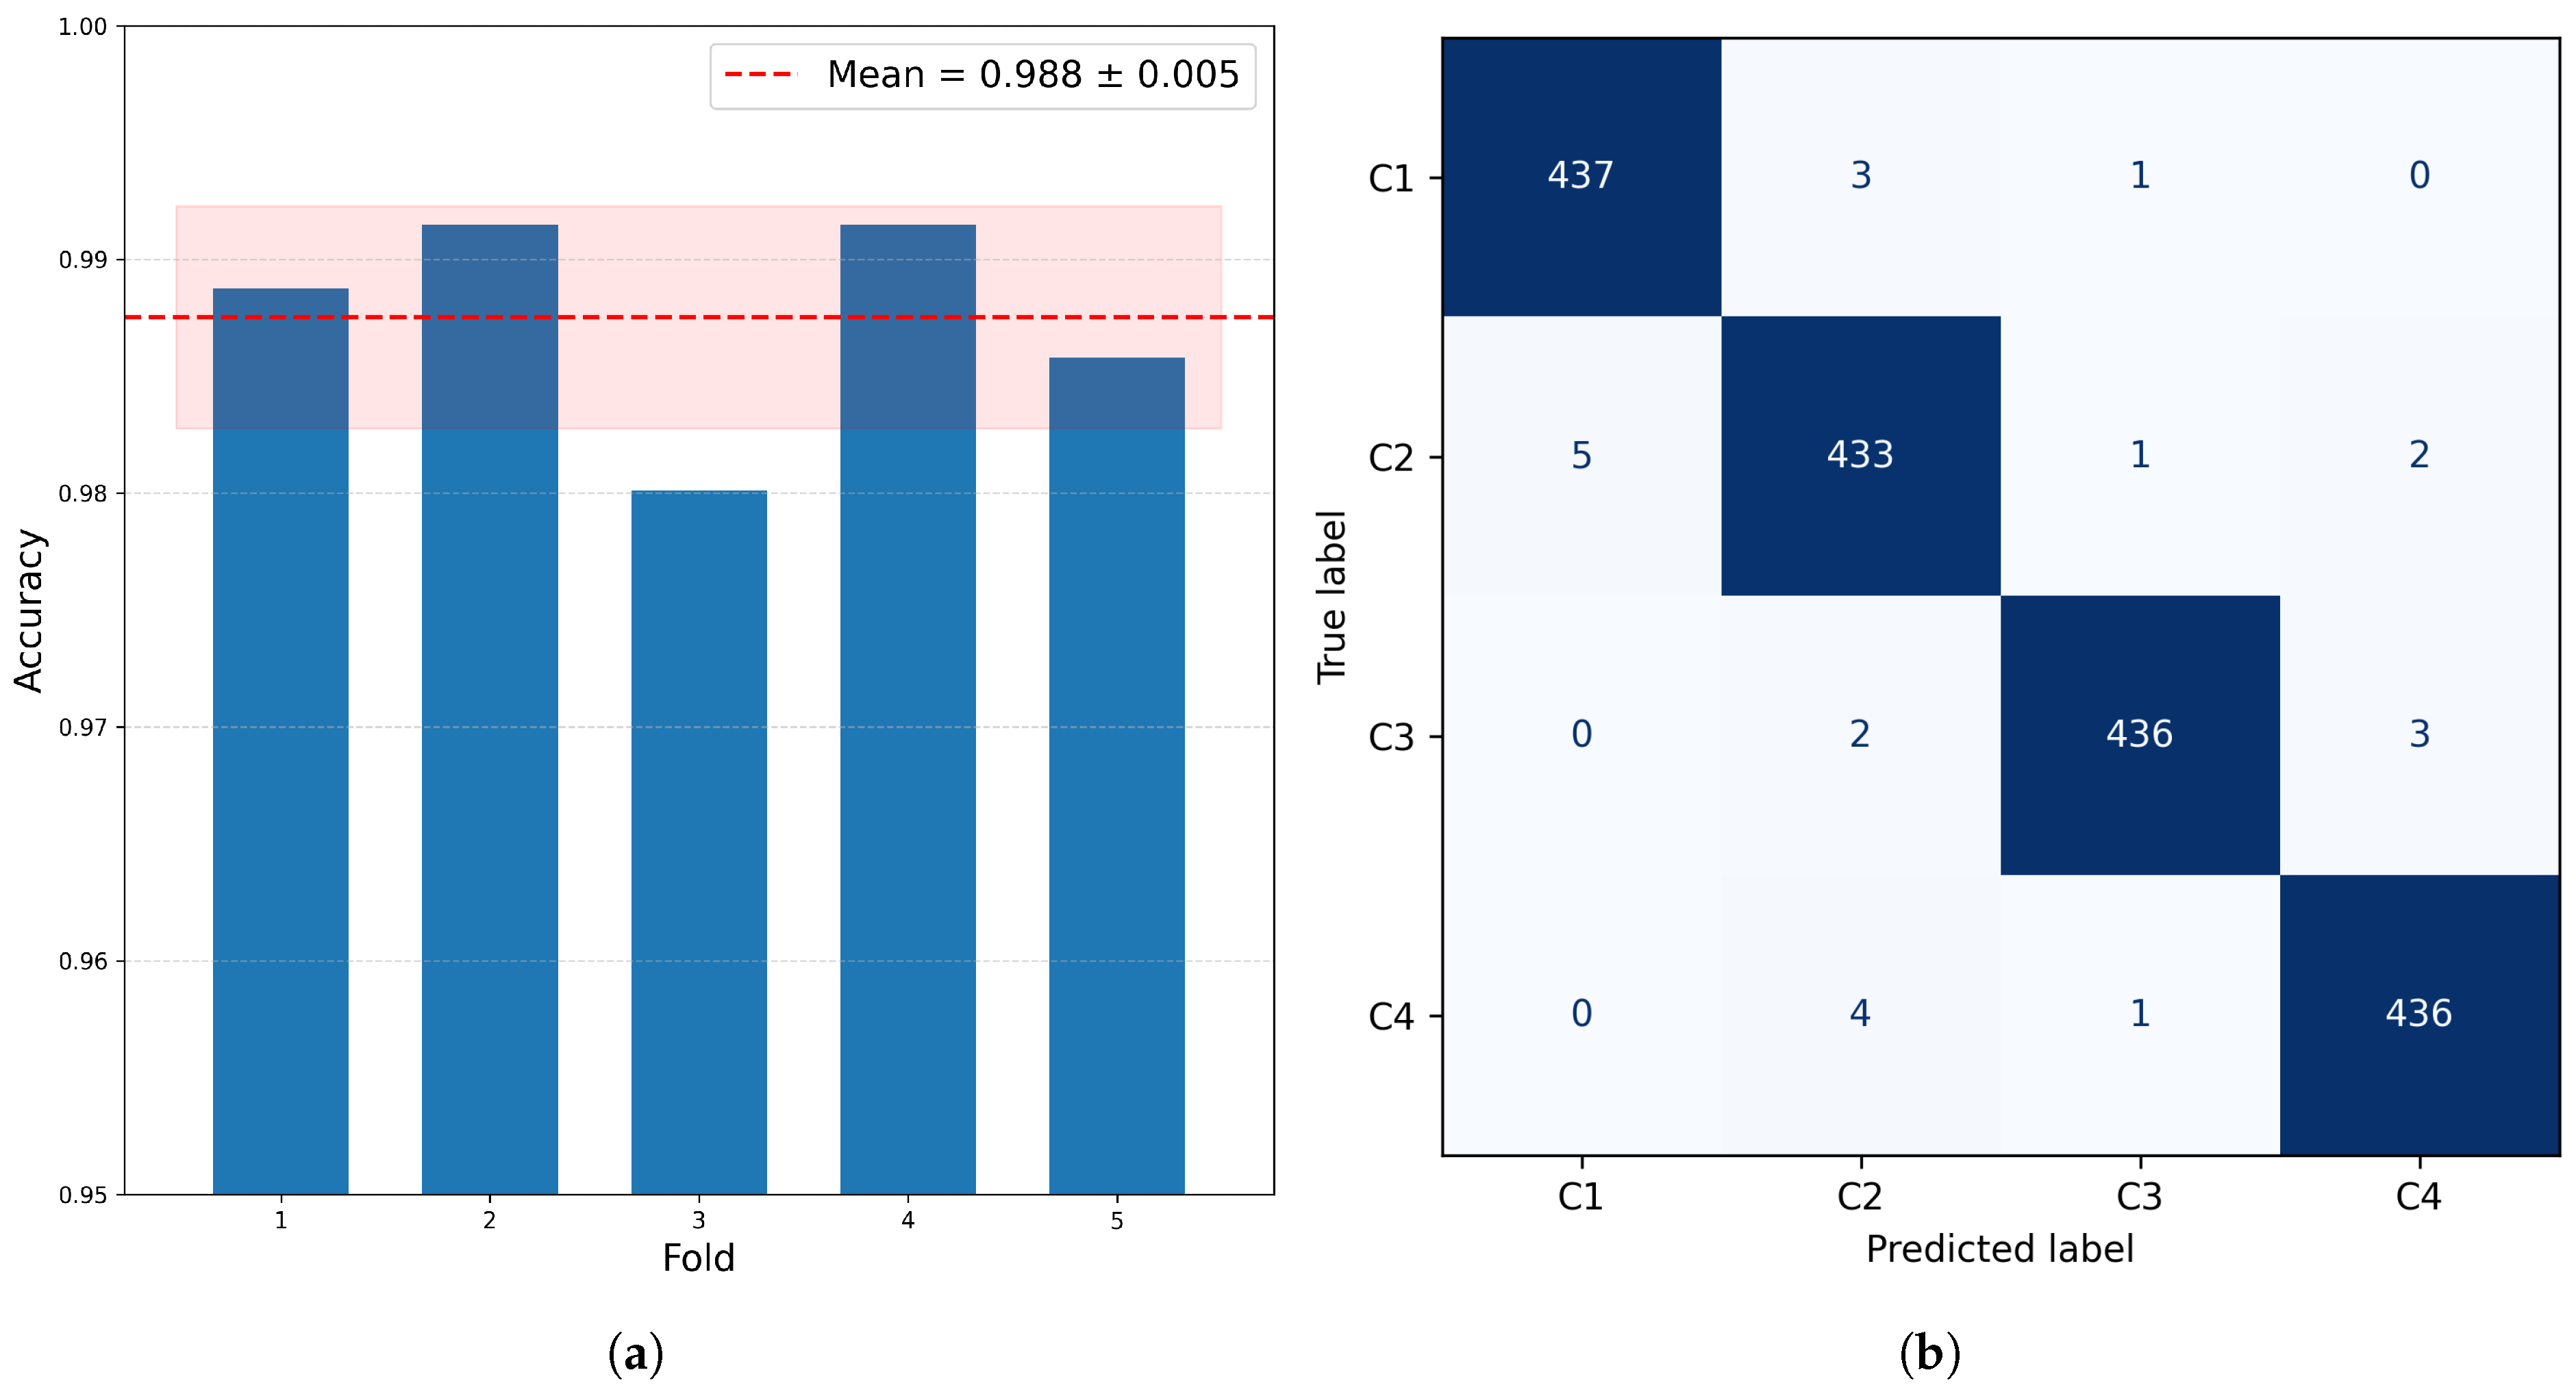
The fold accuracies for the classification task are , , , , and , corresponding to a mean value of with a standard deviation of , as shown in Figure 5a.
Figure 5.
Five-fold condition-classification performance: (a) fold-wise accuracy and (b) pooled out-of-fold confusion matrix.
The macro F1-score, which is the harmonic mean of precision and recall, is , while the mean macro one-versus-rest ROC AUC is , demonstrating the model’s ability to distinguish between multiple classes, with each class receiving equal weight.
The pooled out-of-fold confusion matrix, shown in Figure 5b, contains a total of 1742 correct predictions among the 1764 observations. The pooled recalls for all four classes, –, are , , , and , respectively. The largest number of errors occurs for : five cases are predicted as , one as , and two as , giving eight errors in total. This indicates that the M2/ condition exhibits the greatest overlap with the other experimental conditions, whereas is the most clearly separated.
3.2. Two-Dimensional Localization
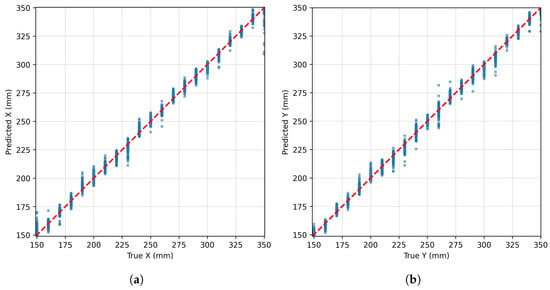
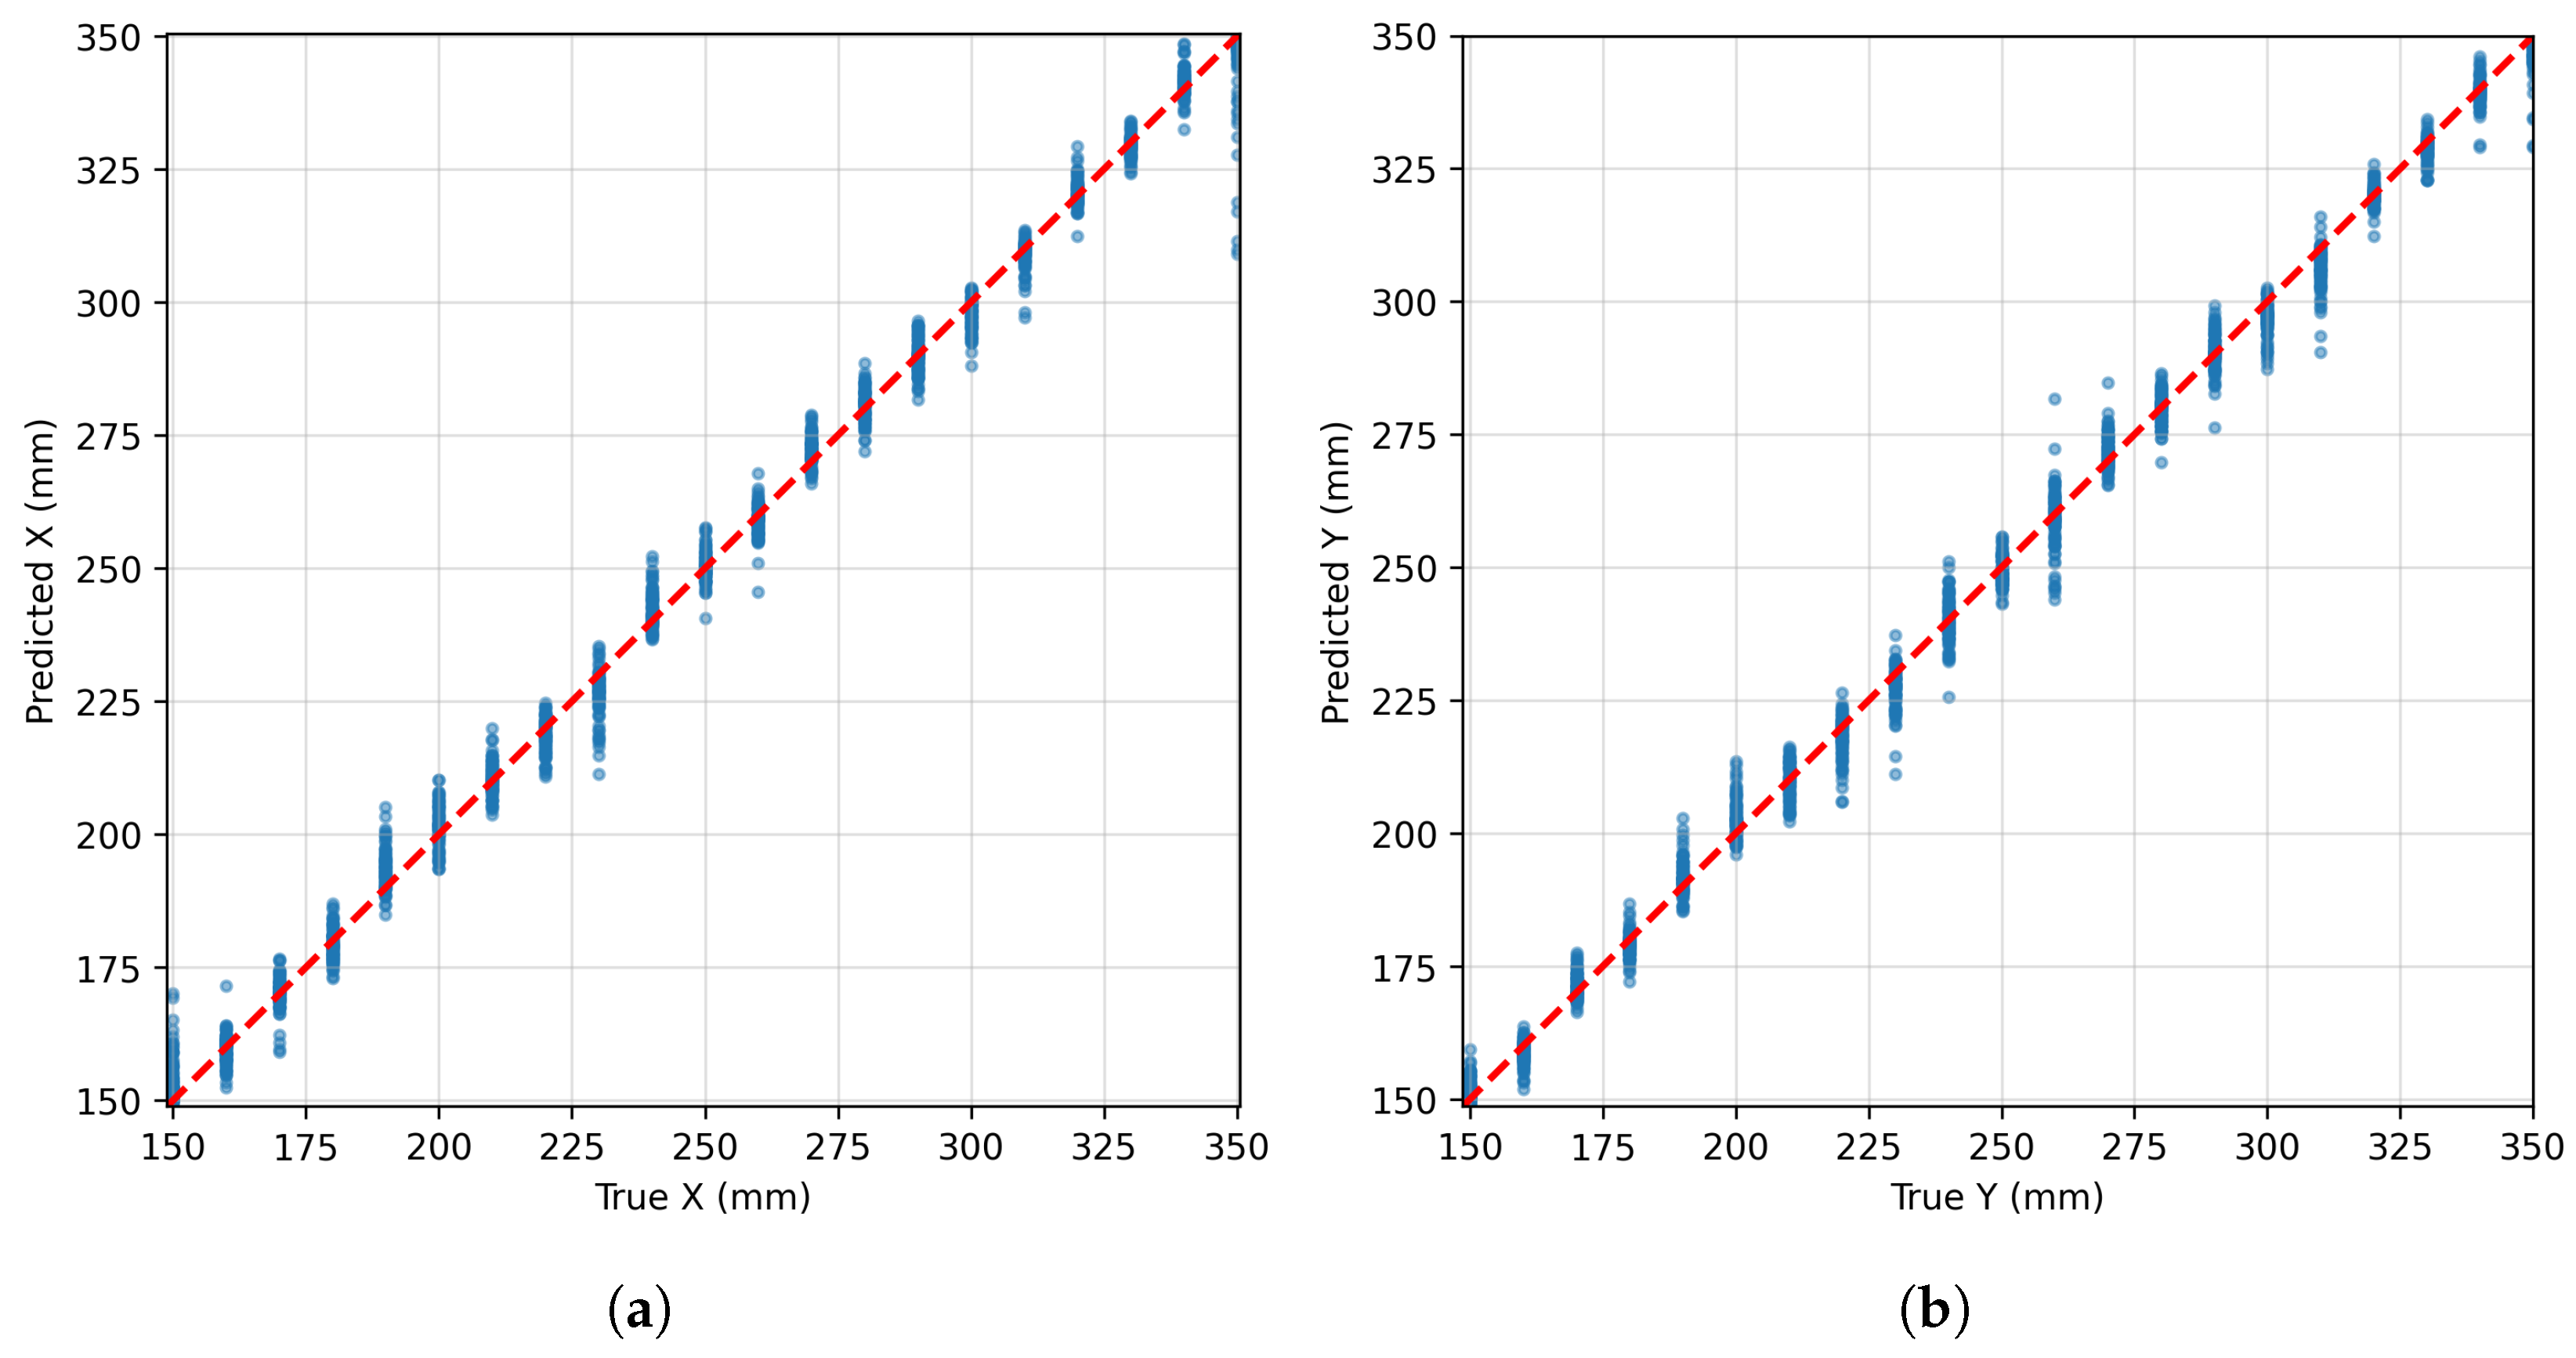
The predicted coordinates showed close agreement with the corresponding true coordinates across all folds. As shown in Figure 6a,b, both and coordinates were concentrated around the identity line, with the predictions remaining close to the true values across the full measurement range. Two additional metrics used to quantitatively evaluate the model’s localization performance are the Mean Absolute Error (MAE) and the coefficient of determination (), both of which provide information on how well the model fits the data. The average normalized MAE is for and for . The corresponding values are and , respectively, indicating a high degree of agreement between the predicted and true coordinates.
Figure 6.
Pooled out-of-fold localization results: predicted versus true coordinates for the two-dimensional localization task. (a) Predicted x-coordinate as a function of the true x-coordinate. (b) Predicted y-coordinate as a function of the true y-coordinate. The red dashed lines indicate the identity relation, corresponding to perfect agreement between predicted and true coordinates.
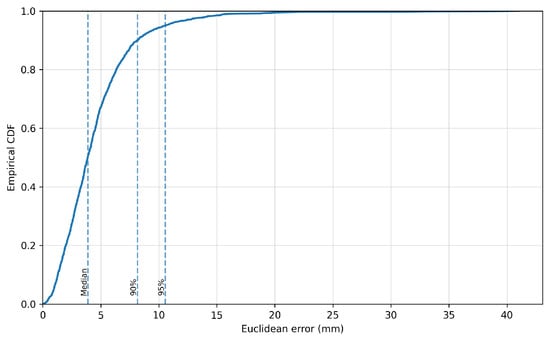
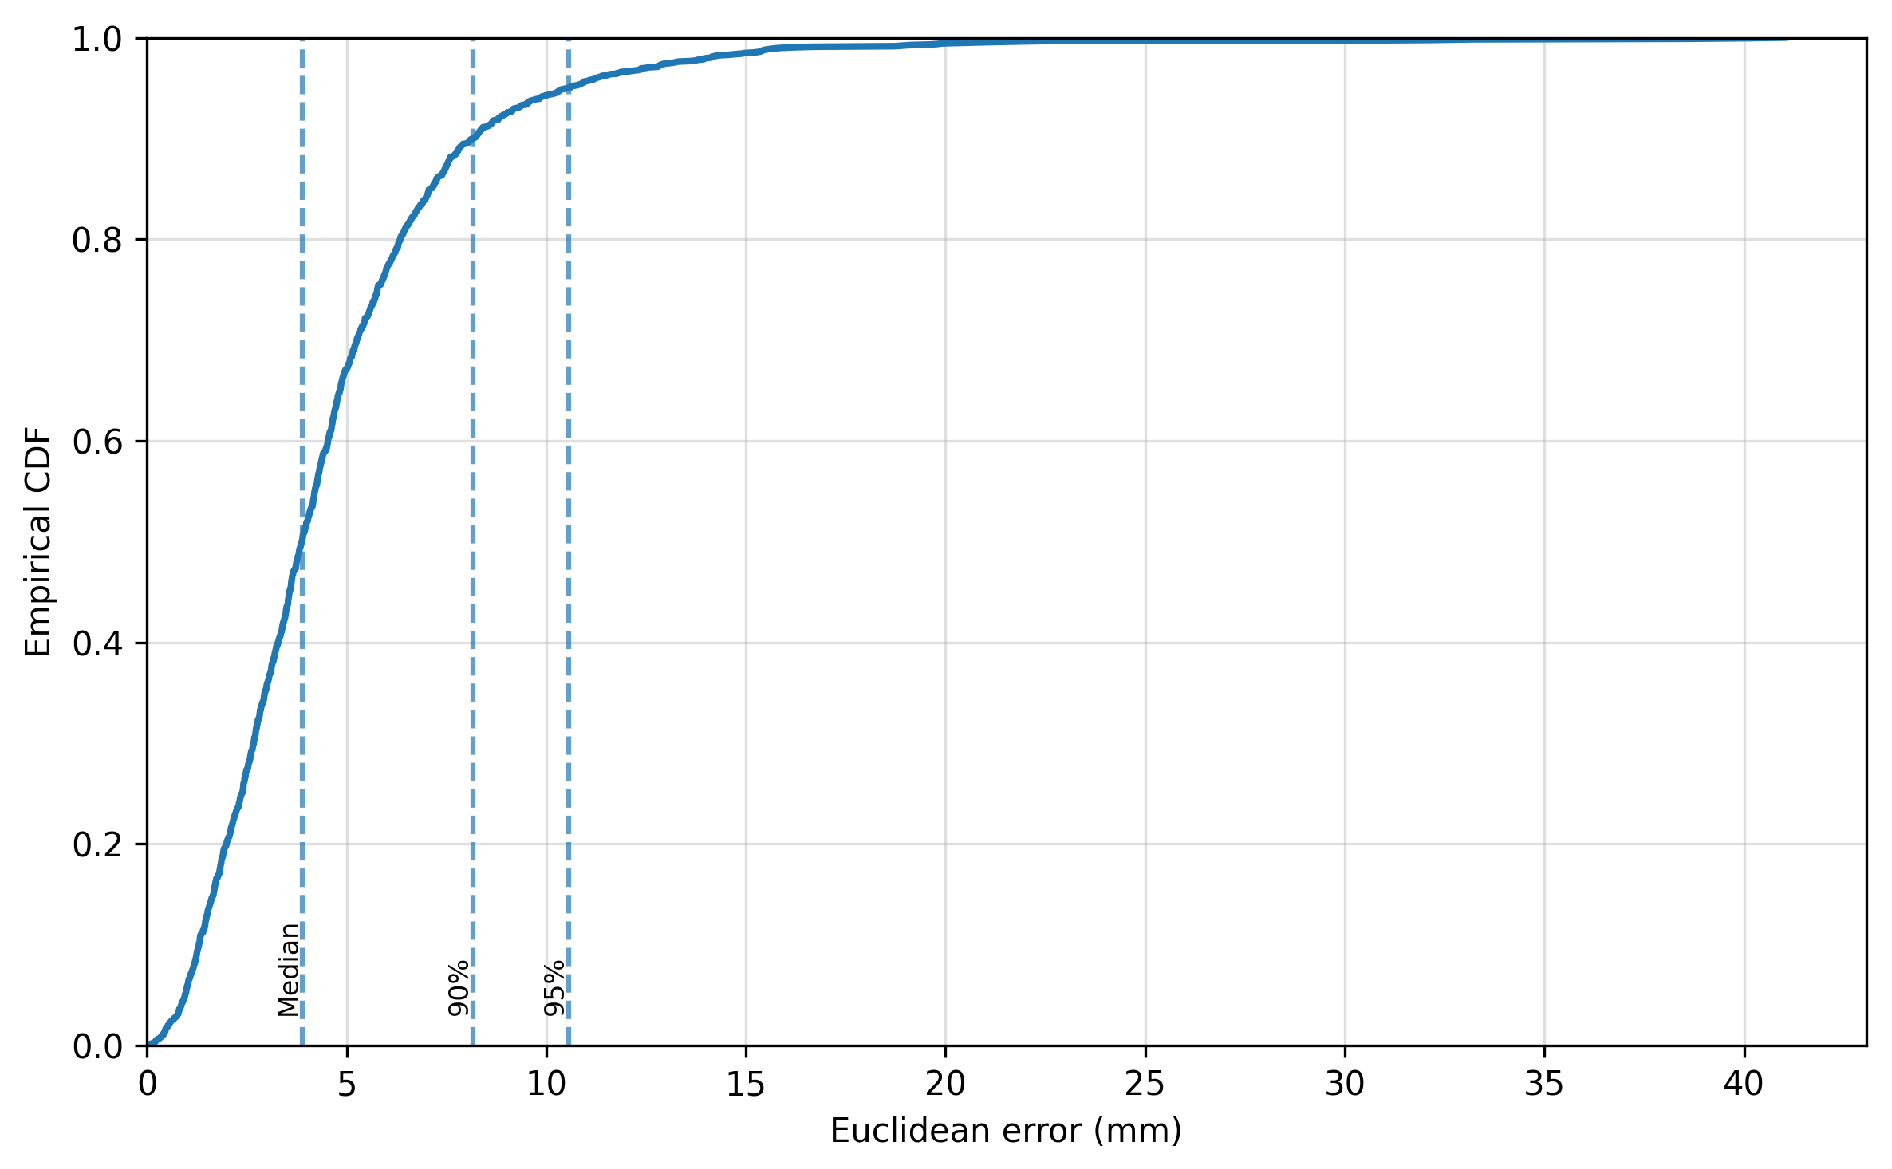
Considering both coordinates simultaneously, the normalized average localization error across the five folds is , with a median of . The lower median relative to the mean value reflects a small number of larger errors. As shown by the empirical cumulative distribution in Figure 7, the mean 90th- and 95th-percentile errors are and , respectively.
Figure 7.
Pooled out-of-fold localization results: empirical cumulative distribution function (CDF) of the Euclidean localization error. The vertical dashed lines indicate the median, 90th-percentile, and 95th-percentile errors.
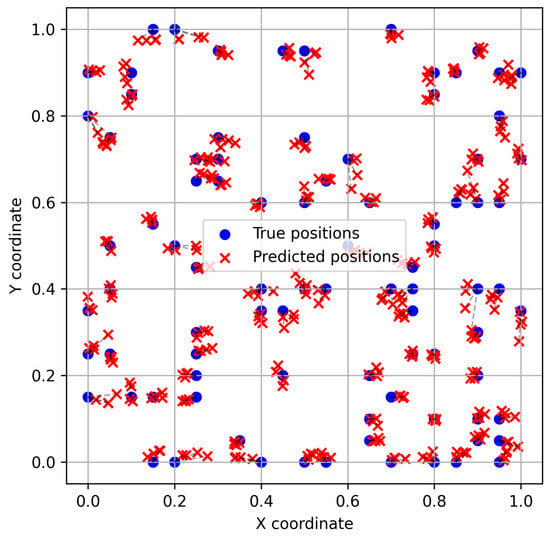
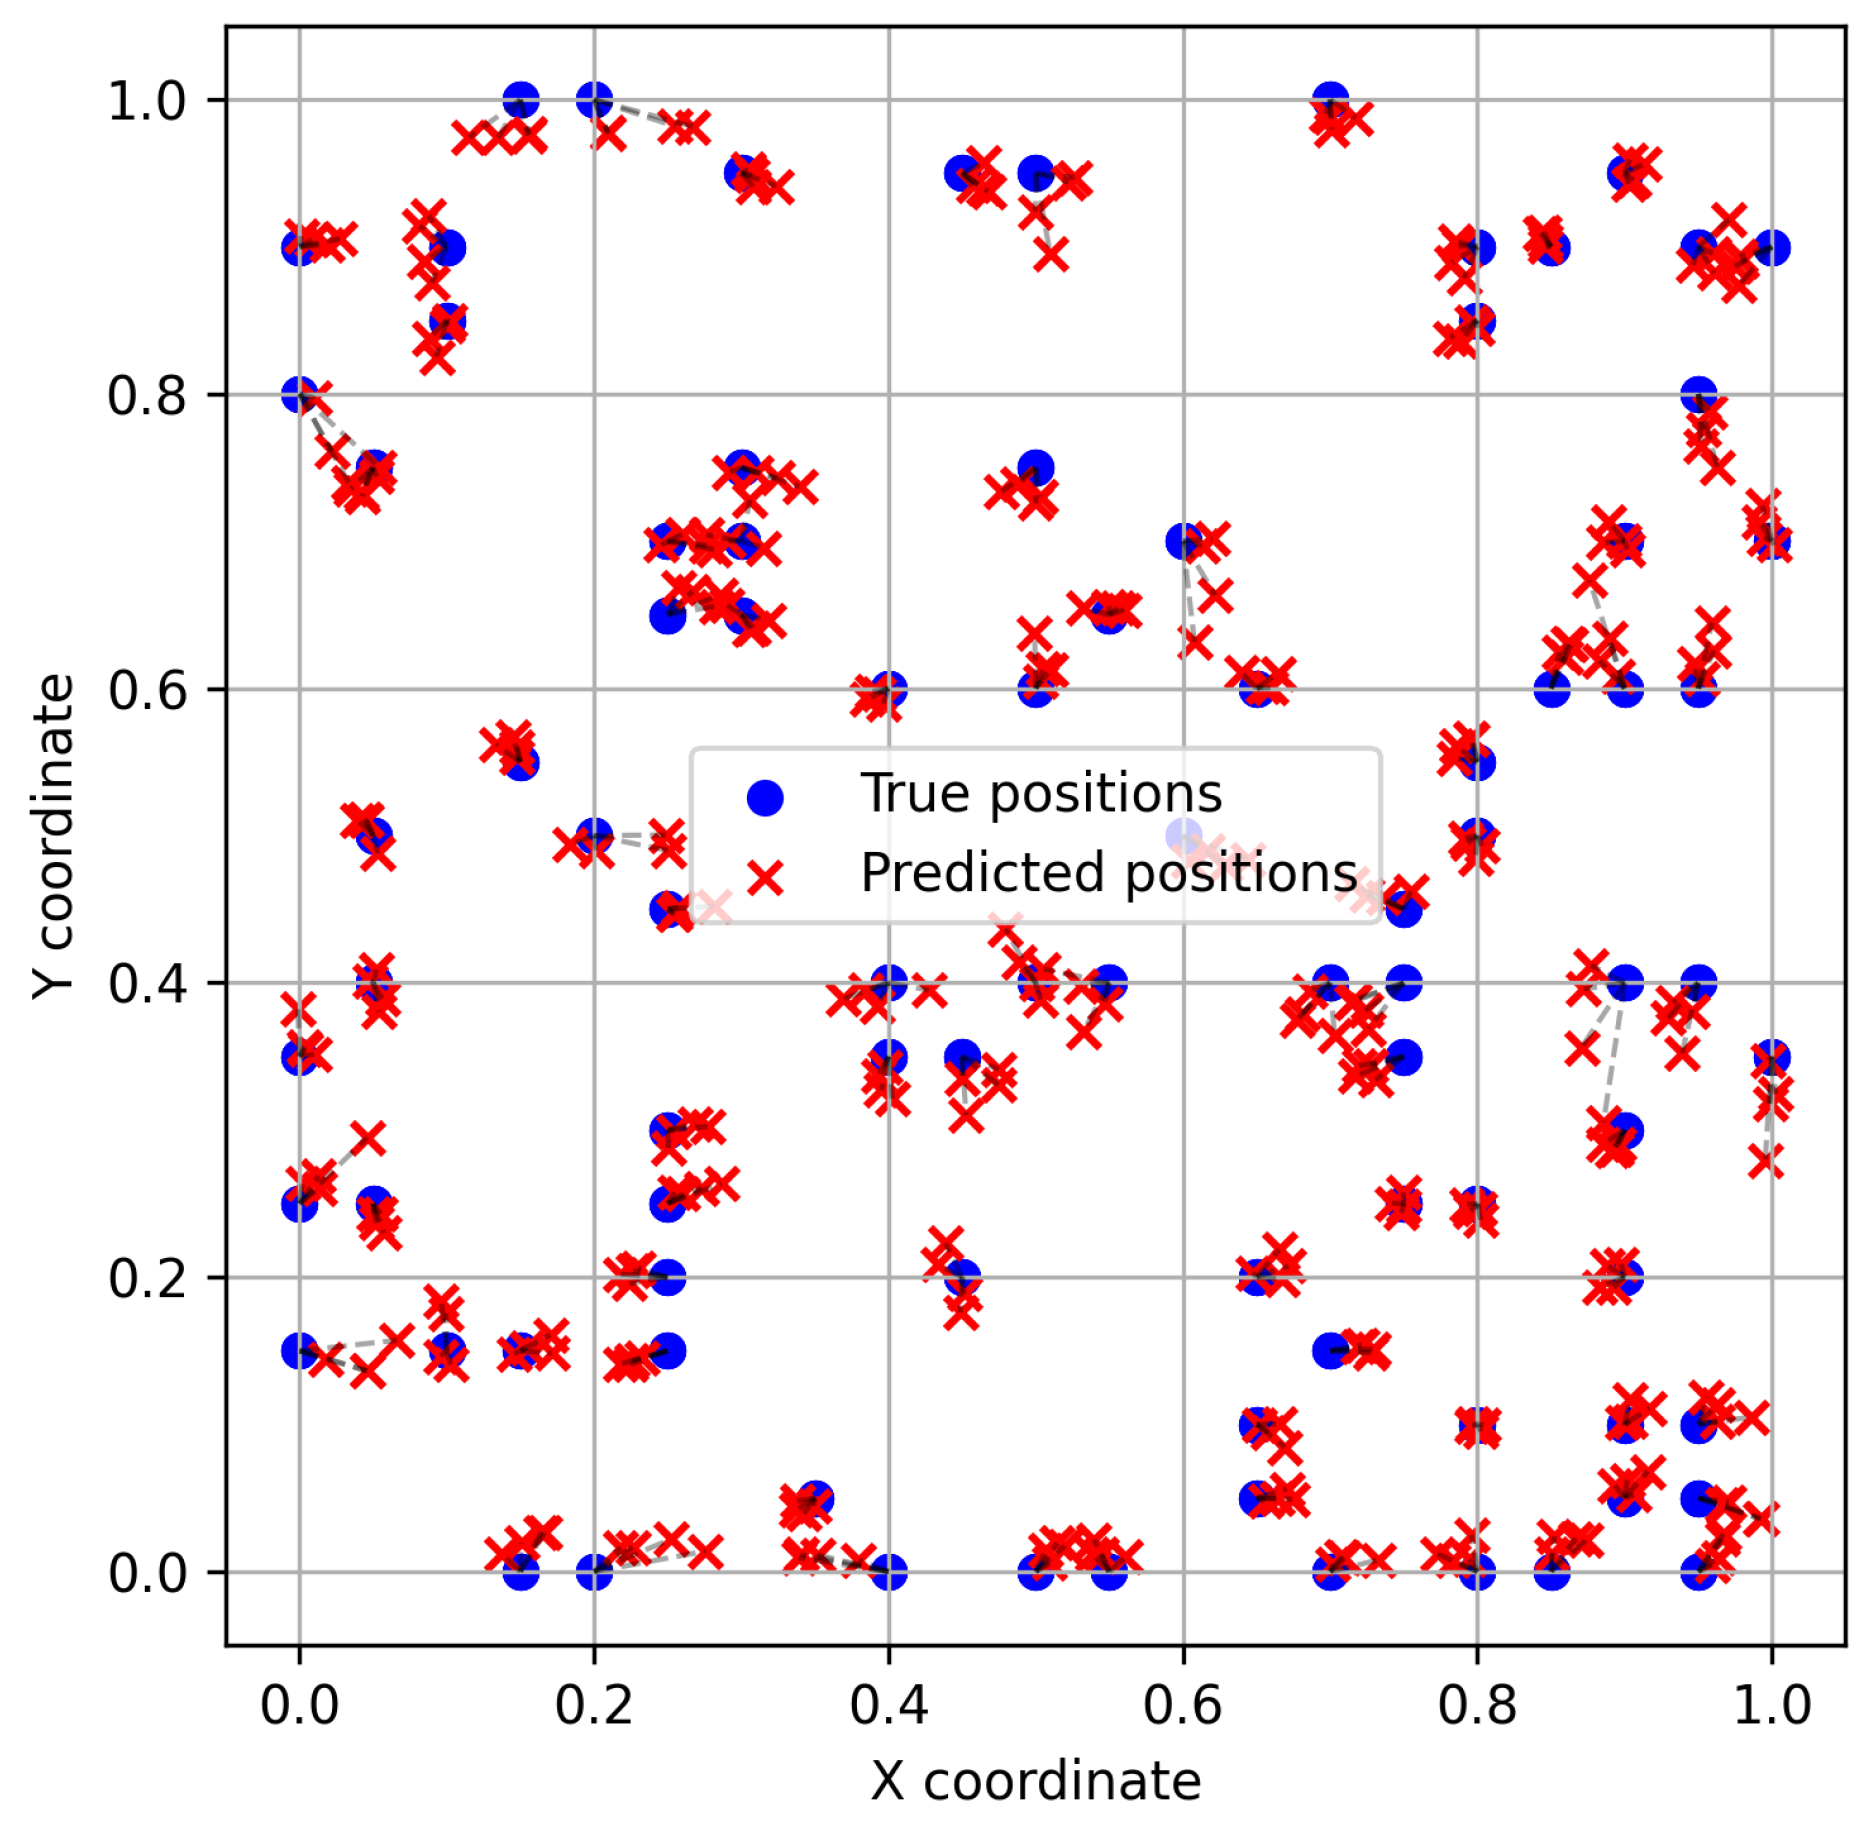
To further evaluate the model, the predicted perturbation positions were compared with their actual positions. An example of the results is shown in Figure 8, illustrating the spatial distribution of the true and predicted positions across the two-dimensional measurement region for one of the five folds. It should be noted that the model outputs are normalized values, as previously described. The model correctly predicts the general distribution of the perturbation positions, with most predictions remaining close to the actual values. However, slight deviations can still be observed.
Figure 8.
Spatial distribution of true and predicted positions across the normalized two-dimensional measurement region for one of the five folds trained over 500 epochs. Blue circles indicate the true positions, while red crosses indicate the corresponding predicted positions. The displacement between each true and predicted position represents the normalized localization error.
Table 4 presents a combination of the results for both the classification and localization tasks based on the previously discussed metrics, allowing the model’s performance across the five folds to be evaluated in terms of the mean ± standard deviation.
Table 4.
Five-fold performance (mean ± standard deviation).
3.3. Ablation Study
To assess the contributions of the recurrent and multi-task components, three reduced deep learning variants were evaluated using the same five coordinate-grouped folds as the proposed model: a multi-task CNN without the LSTM layers, a localization-only CNN–LSTM, and a classification-only model. In addition, a Random Forest was evaluated as a non-deep learning baseline using the same fold assignments. For each of the 66 actuator–sensor paths, three handcrafted features were extracted: the Hilbert-envelope peak amplitude, the corresponding time of flight, and the spectral centroid, resulting in 198 input features. Separate Random Forest regression and classification models with 300 trees were used for localization and perturbation-configuration classification, respectively. The corresponding ablation and baseline results are summarized in Table 5.
Table 5.
Five-fold ablation and baseline results (mean ± standard deviation). A dash indicates that the corresponding task is not included in the model.
Compared with the full CNN–LSTM model in Table 4, removing the LSTM layers increased the mean normalized localization error from to , while classification accuracy remained essentially unchanged. The localization-only model achieved a mean normalized error of , indicating that the full multi-task CNN–LSTM retained comparable localization performance while simultaneously providing perturbation-configuration classification. In contrast, the classification-only model exhibited substantially lower and more variable performance. The Random Forest baseline achieved a classification accuracy of but a considerably larger mean normalized localization error of . Overall, the results indicate that the LSTM component mainly contributes to localization performance, while the shared multi-task architecture enables simultaneous localization and classification; the substantially larger localization error of the Random Forest also indicates the benefit of learning signal representations directly from the multi-path waveforms compared with the investigated handcrafted-feature baseline.
3.4. Localization by Perturbation Configuration
Table 6 presents the class-wise localization performance obtained through five-fold cross-validation. The mean normalized localization error ranges from for to for . The corresponding median errors range from to . The 90th-percentile error ranges from for to for .
Table 6.
Results for localization error across the four classes. Mean error, median error, and 90th-percentile error are reported in normalized units as mean ± standard deviation across the five folds. The percentage of predictions with localization error at or below and the maximum localization error are reported in physical units.
The percentage of predictions with a localization error at or below exceeds 99% for all four classes, ranging from 99.10% for to 99.77% for . The maximum observed localization errors, after denormalization, are 40.10 mm, 41.01 mm, 30.40 mm, and 38.60 mm for , , , and , respectively. The standard deviations across the five folds remain relatively small for the reported mean, median, and 90th-percentile errors. Overall, 99.43% (1754/1764) of the observations had a localization error , with only 10 observations (0.57%) exceeding 20 mm.
3.5. Comparison with Physics-Based Baseline-Free Localization
The physics-based study in [16] provides the closest available comparison with the present work because it employed the same CFRP plate, the same 12-PZT circular array, and the same 66 actuator–sensor paths. However, it is not a controlled head-to-head comparison because certain aspects differ. Table 7 summarizes the published localization results and those of the present data-driven framework, comparing the performance of both localization approaches. The earlier study used manually positioned absorbent mud and reported physical localization errors directly in millimetres, whereas the present study uses automated magnet-pair perturbations and currently reports normalized errors. Therefore, the percentage of the present errors at or below was calculated from the pooled, untouched out-of-fold predictions after de-normalization to report the same threshold for contextual comparison.
Table 7.
Contextual localization comparison on the same CFRP specimen and PZT network.
The comparison highlights two complementary directions. The compensated RAPID method is physics-based, interpretable, and does not require a training dataset, while achieving 96.74% of the errors at or below . On the other hand, the present framework requires a larger labeled dataset but automates the spatial acquisition and jointly provides localization and four-class characterization from the same measurements. Accordingly, the numerical values in Table 7 are retained as a contextual comparison on the same CFRP specimen and PZT network and should not be interpreted as a direct ranking of the localization methods.
4. Discussion
4.1. Interpretation of the Localization and Classification Results
The current results demonstrate that the proposed network can infer the perturbation location and distinguish among the four magnet-pair perturbation configurations directly from the multi-path ultrasonic guided-wave measurements. The four classes represent distinct controlled perturbation configurations and should not be interpreted as different physical damage types or calibrated damage-severity levels. Accordingly, the classification results demonstrate discrimination among the four magnet-induced perturbation configurations, but do not establish identification of damage type, quantitative damage severity, or applied force. The use of the 66-path waveform set provides the model with responses recorded along different propagation paths, which vary according to their geometric relationship with the perturbation location. Consequently, the spatial pattern contained across the measured paths provides information that can be used for coordinate regression, while differences in the measured waveforms between the experimental conditions provide information for perturbation-configuration classification. The same 66-path waveform representation therefore supported both coordinate regression and perturbation-configuration classification within the shared architecture.
The physical interpretation of the classification results requires some caution. The four classes correspond to controlled reversible perturbations rather than real delamination levels. Although the configurations were selected to provide different nominal holding forces, the nominal force specified by the manufacturer does not directly represent the local force applied to the specimen, which is dependent on factors including magnet separation, alignment, support compliance, and plate deformation. Therefore, the classification results demonstrate discrimination between the experimentally defined perturbation conditions, but do not establish a quantitative estimation of damage severity or applied force.
Similarly, the localization results demonstrate the ability of the proposed model to identify the position of the controlled perturbation under the experimental conditions, but they do not yet establish localization performance for actual delamination damage on the specimen. The magnetic perturbations provide a repeatable and reversible means of generating localized changes in the ultrasonic guided-wave response, which is advantageous for implemented systematic data acquisition, but they do not reproduce all physical characteristics of a real internal delamination. Consequently, the present results should be interpreted as a validation of the proposed data-driven approach under controlled laboratory perturbations. Validation using manufactured or naturally occurring delaminations, together with calibrated loading conditions, would still be required before extending these conclusions to quantitative damage characterization.
4.2. Influence of the Perturbation Configuration on Localization
The class-wise results have demonstrated a consistently accurate localization across all four magnet classes, with only slight differences in performance between them. exhibited the lowest mean, median, and 90th-percentile errors, together with the highest proportion of predictions localized within 20 mm. Conversely, exhibited the largest errors across these measures. Despite these differences, the performance remained highly consistent across all classes, as more than 99% of predictions were within 20 mm.
The relatively small standard deviations observed indicate that the reported localization performance is stable within the particular training-validation split. This consistency is important because it suggests that the model’s performance is not strongly dependent on a specific subset of the data.
The maximum errors were substantially larger than the corresponding median and 90th-percentile errors, particularly for and . This indicates the presence of a small number of larger localization deviations despite the otherwise low error distribution. Nevertheless, these outliers have limited influence on the overall performance, given that more than 99% of predictions for every class have an error at or below .
Localization accuracy varied only modestly across the four classes: the mean normalized error ranged from for to for , and more than of the predictions in every class had a localization error at or below .
4.3. Comparison with Physics-Based Localization
The proposed data-driven approach provides an alternative to physics-based localization methods, in which the perturbation location is inferred from changes in ultrasonic guided-wave propagation using an explicit physical or propagation-based formulation. In the present approach, the relationship between the measured multi-path waveform responses and the perturbation location is instead learned directly from experimental data. The 66-path input provides the model with spatially distributed wave-response information, while the shared network additionally enables classification of the experimentally defined perturbation conditions.
The two approaches have different practical requirements. Physics-based methods have the advantage of not requiring a supervised training dataset and can provide a localization procedure directly related to the underlying wave-propagation behaviour. The proposed approach instead requires representative experimental data covering the spatial region and perturbation conditions of interest. The automated positioning system facilitates this data collection by providing repeatable measurements over a regular spatial grid. Once trained, however, the proposed model can directly map the acquired multi-path waveform set to the perturbation location and condition without requiring an explicit localization procedure based on wave-propagation modelling.
A direct numerical comparison should nevertheless be interpreted with caution because the approaches were not evaluated under an identical experimental protocol. Differences in perturbation type, spatial sampling, and evaluation procedure may influence the measured localization performance independently of the underlying methodology. Therefore, the present results do not establish that the data-driven approach is intrinsically superior to physics-based localization. Rather, the present data-driven approach yielded of localization errors at or below , whereas the compensated RAPID method reported under a different experimental protocol; these values should therefore be interpreted as contextual rather than as a direct ranking of the two methods.
4.4. Limitations and Generalization
Several limitations should be considered when interpreting the present results. The magnet-pair perturbations used in this study provide controlled and reversible localized disturbances, but they do not reproduce the physical characteristics of an actual delamination. In addition, the nominal holding forces reported for the magnets do not correspond directly to the force applied locally to the CFRP plate. The actual interaction depends on factors such as magnet separation, alignment, support compliance, and plate deformation. Therefore, the four experimental conditions should be interpreted as controlled perturbation conditions rather than calibrated damage-severity levels. Validation using manufactured delaminations and independently characterized loading conditions would be required to establish the applicability of the proposed approach to actual damage.
The experimental validation was performed on a single CFRP specimen using one PZT configuration, one excitation condition, and a controlled laboratory environment. Consequently, the reported performance demonstrates the capability of the proposed framework under these conditions, but does not establish a generalization to other structures or operating conditions. In particular, changes in temperature, applied load, sensor coupling, boundary conditions, laminate thickness, material properties, or excitation conditions may modify the measured ultrasonic guided-wave responses and introduce a distribution shift relative to the data used to train the model. Similarly, cross-specimen generalization remains to be established. Evaluating the model across multiple specimens and under varying environmental and measurement conditions would therefore be necessary to assess its robustness for practical structural health monitoring applications.
Unlike physics-based localization methods that do not require supervised training for the localization task, the proposed approach depends on experimentally acquired data covering both spatial region and perturbation conditions of interest. The automated positioning system facilitates the systematic generation of such datasets, but the requirement for representative training data remains an inherent limitation of the data-driven approach. The ability to reduce this dependence through transfer learning, data augmentation, or training across multiple specimens could be investigated in future work.
Because each coordinate–configuration pair was represented by a single acquisition, the present dataset does not permit a statistical assessment of measurement repeatability or instrumental drift.
4.5. Practical Implications and Future Work
The automated acquisition procedure developed in this study provides a practical basis for generating spatially distributed ultrasonic guided-wave datasets in a repeatable manner. The controlled positioning of the perturbation over the regular measurement grid reduces the dependence on manual positioning and enables systematic acquisition over a large number of locations and experimental conditions, with reliable precision. The permanent PZT network provides a fixed sensing configuration for repeated monitoring, ensuring that the actuator–sensor paths and their spatial relationships remain consistent between measurements. The two-axis positioning system and magnet pair are used here as laboratory data-generation tools and are not intended to form part of an operational SHM system.
The proposed deep learning framework also has potential for rapid inference once the model has been trained. The trained network directly maps the acquired multi-path waveform set to the perturbation coordinates and experimental condition, without requiring an iterative localization procedure during inference. However, deployment would additionally require reliable automated data acquisition, stable sensor coupling, appropriate baseline and calibration procedures, and a model trained on data representative of the expected structural and environmental conditions.
Further experimental validation is therefore required before application to practical damage detection. The use of calibrated loading conditions would provide a more quantitative relationship between the applied perturbation and the measured ultrasonic guided-wave response, while manufactured delaminations would allow the model to be evaluated using defects that more closely reproduce the physical characteristics of actual composite damage. Environmental robustness should also be investigated under variations such as temperature and sensor coupling, as these factors may modify the measured waveforms and affect the learned model. Finally, experiments involving multiple CFRP specimens would be necessary to assess whether the learned relationship between the multi-path waveforms and perturbation location transfers beyond the specimen used for training.
5. Conclusions
An automated two-axis magnet-pair platform and a multi-task CNN–LSTM were developed for ultrasonic guided-wave assessment of a CFRP plate. The platform produced 1764 balanced measurements over a grid, and the network jointly estimated two normalized coordinates and one of four perturbation configurations directly from concatenated multi-path signals. The current five-fold results provide a classification accuracy and macro F1-score of approximately , coordinate values of and , and a mean normalized Euclidean error of . The principal classification ambiguity occurs for the intermediate magnet condition. Compared with the previously reported physics-based methods on the same specimen and sensor network, the present approach adds automated data acquisition and simultaneous condition characterization. The work demonstrates the feasibility of combining repeatable automated measurements with shared multi-task learning for simultaneous ultrasonic guided-wave localization and characterization. The reported performance is therefore limited to the controlled magnet-pair perturbations investigated on the present CFRP specimen. Future work will evaluate manufactured defects, calibrated loading, environmental variability, and transfer across specimens.
Author Contributions
Conceptualization, M.B.; methodology, D.L.M., M.Z., F.A.A. and M.B.; software, D.L.M.; validation, D.L.M. and M.Z.; formal analysis, D.L.M. and M.B.; investigation, M.Z.; resources, H.G.R.; data curation, D.L.M.; writing—original draft preparation, D.L.M. and M.B.; writing—review and editing, M.Z., H.G.R., F.A.A. and M.B.; visualization, D.L.M.; supervision, F.A.A. and M.B.; project administration, H.G.R.; funding acquisition, H.G.R. All authors have read and agreed to the published version of the manuscript.
Funding
This work was supported in part by National Funds through Fundação para a Ciência e a Tecnologia (FCT), I.P.; when eligible, co-funded by European Union (EU) funds through Instituto de Telecomunicações under Grant UID/50008/2025 (DOI: 10.54499/UID/50008/2025).
Institutional Review Board Statement
Not applicable.
Informed Consent Statement
Not applicable.
Data Availability Statement
The raw and processed datasets supporting this study are publicly available on Zenodo at DOI: 10.5281/zenodo.22920540.
Conflicts of Interest
The authors declare no conflicts of interest.
References
- Diamanti, K.; Soutis, C. Structural health monitoring techniques for aircraft composite structures. Prog. Aerosp. Sci. 2010, 46, 342–352. [Google Scholar] [CrossRef] [Scilit]
- Su, Z.; Ye, L.; Lu, Y. Guided Lamb waves for identification of damage in composite structures: A review. J. Sound Vib. 2006, 295, 753–780. [Google Scholar] [CrossRef] [Scilit]
- Raghavan, A.; Cesnik, C. Review of Guided-wave Structural Health Monitoring. Shock Vib. Dig. 2007, 39, 91–114. [Google Scholar] [CrossRef] [Scilit]
- Mitra, M.; Gopalakrishnan, S. Guided wave based structural health monitoring: A review. Smart Mater. Struct. 2016, 25, 053001. [Google Scholar] [CrossRef] [Scilit]
- Rose, J.L. Ultrasonic Guided Waves in Solid Media; Cambridge University Press: Cambridge, UK, 2014. [Google Scholar]
- Zhu, H.; Sharif Khodaei, Z.; M. H. Aliabadi, F. Appraisal of linear baseline-free techniques for guided wave based structural health monitoring. Ultrasonics 2024, 144, 107445. [Google Scholar] [CrossRef] [Scilit] [PubMed]
- Lu, H.; Chandran, B.; Wu, W.; Ninic, J.; Gryllias, K.; Chronopoulos, D. Damage features for structural health monitoring based on ultrasonic Lamb waves: Evaluation criteria, survey of recent work and outlook. Measurement 2024, 232, 114666. [Google Scholar] [CrossRef] [Scilit]
- Farrar, C.R.; Worden, K. Structural Health Monitoring: A Machine Learning Perspective; Wiley: Chichester, UK, 2012. [Google Scholar]
- Rautela, M.; Senthilnath, J.; Monaco, E.; Gopalakrishnan, S. Delamination prediction in composite panels using unsupervised-feature learning methods with wavelet-enhanced guided wave representations. Compos. Struct. 2022, 291, 115579. [Google Scholar] [CrossRef] [Scilit]
- Rautela, M.; Maghareh, A.; Dyke, S.; Gopalakrishnan, S. Deep generative models for unsupervised delamination detection using guided waves. arXiv 2023, arXiv:2308.05350. [Google Scholar]
- Barzegar, M.; Cherati, S.M.; Pasadas, D.J.; Pernechele, C.; Ribeiro, A.L.; Ramos, H.G. Baseline-free damage imaging of CFRP lap joints using K-means clustering of guided wave signals. Mech. Syst. Signal Process. 2025, 229, 112562. [Google Scholar] [CrossRef] [Scilit]
- Barzegar, M.; Cherati, S.M.; Zhan, M.; Pasadas, D.J.; Ribeiro, A.L.; Ramos, H.G. Unsupervised Disbond Detection in CFRP Joints via Guided Waves and Autoencoders. IEEE Trans. Instrum. Meas. 2026, 75, 1–9. [Google Scholar] [CrossRef] [Scilit]
- Amarel, J.; Rudolf, C.; Iliopoulos, A.; Michopoulos, J.G.; Smith, L.N. Symmetry constrained neural networks for detection and localization of damage in metal plates. APL Mach. Learn. 2025, 3, 26106. [Google Scholar] [CrossRef] [Scilit]
- Zhuojun, X.; Hao, L.; Jianbo, Y.; Jingwen, Y. A transfer learning approach for data-driven localization of damage areas in plate-like structures of CFRP materials. Eng. Struct. 2024, 314, 118352. [Google Scholar] [CrossRef] [Scilit]
- Ye, M.; Teng, F.; Zhang, H.; Lv, S.; Zhang, L.; Zhang, F.; Jiang, M. Damage localization in CFRP composites based on distributionally robust methods and ultrasonic guided waves. IEEE Trans. Instrum. Meas. 2025, 74, 1–16. [Google Scholar] [CrossRef] [Scilit]
- Zhang, M.; Barzegar, M.; Pasadas, D.J.; Ribeiro, A.L.; Ramos, H.G. Baseline-free Damage Localization in Composites using Distance and Direction-compensated Ultrasonic Guided Waves. IEEE Trans. Instrum. Meas. 2026, 75, 6004510. [Google Scholar] [CrossRef] [Scilit]
- Azad, M.M.; Jung, J.; Kim, H.S.; Munyaneza, O.; Sohn, J.W.; Huang, B. An integrated multi-task transfer learning for damage detection, localization, and severity assessment of laminated composite plate. Compos. Struct. 2025, 371, 119478. [Google Scholar] [CrossRef] [Scilit]
- Caruana, R. Multitask learning. Mach. Learn. 1997, 28, 41–75. [Google Scholar] [CrossRef] [Scilit]
- Kendall, A.; Gal, Y.; Cipolla, R. Multi-task learning using uncertainty to weigh losses for scene geometry and semantics. In Proceedings of the IEEE Conference on Computer Vision and Pattern Recognition; IEEE: New York, NY, USA, 2018; pp. 7482–7491. [Google Scholar]
- Bee, S.; Bull, L.; Dervilis, N.; Worden, K. When is an SHM problem a multi-task-learning problem? arXiv 2023, arXiv:2305.09425. [Google Scholar]
- Barzegar, M.; Mourinho, D.; Zhang, M.; Alegria, F.; Ramos, H.G. Data-Driven Damage Localization in CFRP Plate Using a Network of Guided Wave Signals. Presented at the 2026 IEEE International Instrumentation and Measurement Technology Conference (I2MTC), Nancy, France, 25–28 May 2026. [Google Scholar]
- Hervin, F.; Fromme, P. Anisotropy influence on guided wave scattering for composite structure monitoring. Struct. Health Monit. 2023, 22, 2626–2640. [Google Scholar] [CrossRef] [Scilit]
- Salmanpour, M.; Sharif Khodaei, Z.; Aliabadi, M. Guided wave temperature correction methods in structural health monitoring. J. Intell. Mater. Syst. Struct. 2017, 28, 604–618. [Google Scholar] [CrossRef] [Scilit]
- Akiba, T.; Sano, S.; Yanase, T.; Ohta, T.; Koyama, M. Optuna: A next-generation hyperparameter optimization framework. In Proceedings of the 25th ACM SIGKDD International Conference on Knowledge Discovery & Data Mining; ACM: New York, NY, USA, 2019; pp. 2623–2631. [Google Scholar]

Disclaimer/Publisher’s Note: The statements, opinions and data contained in all publications are solely those of the individual author(s) and contributor(s) and not of MDPI and/or the editor(s). MDPI and/or the editor(s) disclaim responsibility for any injury to people or property resulting from any ideas, methods, instructions or products referred to in the content. |
© 2026 by the authors. Licensee MDPI, Basel, Switzerland. This article is an open access article distributed under the terms and conditions of the Creative Commons Attribution (CC BY) license.