


Abstract
No. 5 and No. 8 coal seams in the Yichuan area, Ordos Basin, are primary targets for coalbed methane (CBM) development, yet their pore structure differences and controlling factors remain poorly understood. This study integrates CO2 adsorption, low-temperature N2 adsorption, and mercury intrusion porosimetry to characterize the pore structure across the full pore-size range, with fractal dimensions quantified by V-S, FHH, and J-function models. The results show that the No. 8 coal has greater CO2-accessible specific surface area and micropore volume, with micropores (<2 nm) accounting for 58–81%. In contrast, the No. 5 coal exhibits higher mesopore (2–50 nm: 1–4%) and macropore (>50 nm: 31–48%) proportions, along with higher porosity and permeability, and better pore openness and connectivity. Fractal analysis indicates that the No. 5 coal has higher V-S and FHH fractal dimensions, suggesting greater micropore–mesopore structural complexity, while the No. 8 coal exhibits a higher J-function fractal dimension, reflecting stronger pore throat heterogeneity. Correlation analysis further indicates that micropore development is closely associated with coalification degree and vitrinite content; mesopore characteristics are associated with mineral matter and show a non-monotonic relationship with ash yield; and macropore–fracture systems are related to depositional setting and burial depth. The delta-plain-sourced No. 5 coal, with shallower burial and greater lithological heterogeneity, appears to retain better-developed seepage pathways, whereas the marine–continental transitional No. 8 coal, buried deeper and more compacted, is characterized by a dominance of adsorption space with limited connectivity. Accordingly, the pore structure of the No. 5 coal appears more favorable for gas seepage, while that of the No. 8 coal appears more favorable for gas adsorption. These pore-structure-based interpretations may provide a basis for differentiated CBM development strategies in the study area, although they should be regarded as preliminary pending validation with production data.
1. Introduction
The pore structure of coal reservoirs exerts primary control over the adsorption, desorption, diffusion, and seepage of coalbed methane (CBM). Coal is intrinsically a multiscale porous medium, in which micropores and ultramicropores provide the dominant adsorption space for methane, mesopores govern gas diffusion, and macropores together with natural fractures constitute the principal conduits for gas seepage and production [1,2,3]. Therefore, full pore-size range characterization is of great significance for elucidating the occurrence mechanisms of coalbed methane, evaluating reservoir quality, and guiding coalbed methane development.
The eastern and southeastern margins of the Ordos Basin host extensively developed Upper Paleozoic coal-bearing strata and represent pivotal regions for CBM exploration in China. Guan et al. [4] documented favorable coal-seam development conditions in the Lower Shanxi and Upper Taiyuan formations. Chen et al. [5] further established that CBM enrichment is closely governed by structural setting, burial depth, and preservation conditions. More recently, investigations in the Daning–Jixian block have revealed that deep coal reservoirs there are characterized by strong heterogeneity, and that pore structure and fractal attributes significantly influence gas storage and producibility [6,7].
The Yichuan area, in the southwest of the Daning–Jixian block, hosts the No. 5 and No. 8 coals as its main CBM targets. However, deep CBM research and development across the Daning–Jixian block have long been biased toward the No. 8 seam, leaving the No. 5 seam comparatively underexplored. Compared with the Daning–Jixian block, the Yichuan area is characterized by thinner coal seams, and current CBM extraction is dominated by single-seam production of the No. 8 coal seam and commingled production of the No. 5 and No. 8 coal seams. However, systematic comparisons of pore structure differences between the two seams in this area are lacking. Such comparative analysis is necessary for guiding commingled production, as pore structure and fractal heterogeneity directly influence gas flow and recovery.
Because coal reservoirs span a wide range of pore sizes and exhibit complex pore geometry, no single experimental method can fully characterize the entire pore system. High-pressure mercury intrusion (MIP) is well suited for characterizing mesopores, macropores, and pore-throat connectivity; low-temperature N2 adsorption effectively reveals mesopore structure, specific surface area, and pore-surface heterogeneity; and CO2 adsorption is highly sensitive to ultramicropores smaller than 2 nm [1,2,3,8]. The integrated application of these three methods enables continuous characterization from ultramicropores to macropores, substantially enhancing the completeness and reliability of pore structure evaluation.
For quantitative evaluation, the Leverett J-function based on MIP data has been widely used to characterize pore-throat architecture [9,10], while the Frenkel–Halsey–Hill (FHH) model applied to N2 adsorption data offers a robust means of evaluating pore-surface roughness and structural complexity [11,12]. Yao et al. [13] demonstrated that the FHH model effectively captures coal pore heterogeneity and its bearing on methane adsorption capacity. Meanwhile, the volume-specific surface area (V-S) model applied to CO2 adsorption data serves as a valuable tool for describing the scaling relationship between micropore volume and surface area.
To compare the pore structure differences between the No. 5 and No. 8 coal seams in the Yichuan area, continuous full-scale pore characterization was conducted by integrating MIP, N2 adsorption, and CO2 adsorption. Multi-scale fractal dimensions were derived using the V-S, FHH, and J-function models to quantify structural complexity at micro-, meso-, and macropore scales. The key controlling factors responsible for the observed variations in pore structure and fractal characteristics between the two seams were also identified. This study addresses the insufficient comparative research between the No. 5 and No. 8 coals in this area, and provides a petrophysical basis for differentiated commingled production strategies.
2. Geological Background
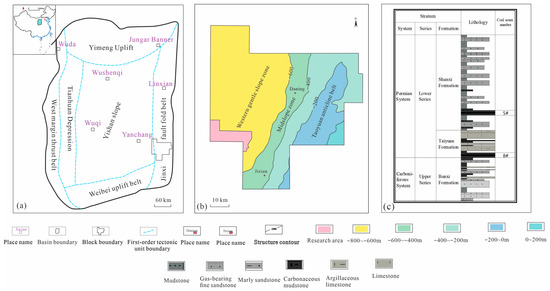
The Yichuan area is located on the southeastern margin of the Ordos Basin, adjacent to the Daning–Jixian block, and represents an important area for coalbed methane exploration and development along the eastern margin of the basin (Figure 1). Although the Ordos Basin is generally tectonically stable, its eastern margin has been affected by tectonic activity since the Yanshanian period, resulting in the local development of folds, faults, and flexural structures. These tectonic features exert important controls on coal seam burial depth, preservation conditions, fracture development, and coalbed methane enrichment [14,15,16].
Figure 1.
Regional geological setting map. (a) Tectonic subdivisions of the Ordos Basin. (b) Location of the study area and contour map of the coal seam floor of the Daning–Jixian block. (c) Stratigraphic columns of the coal-bearing strata.
The main coal-bearing strata in the study area are the Upper Paleozoic Benxi, Taiyuan, and Shanxi formations, among which the No. 8 and No. 5 coal seams are the principal target seams. The Taiyuan Formation was strongly influenced by marine transgression and regression and is mainly characterized by marine–continental transitional deposits, whereas the Shanxi Formation gradually evolved toward delta-plain and fluvial–swamp depositional environments. These contrasting depositional settings resulted in distinct differences between the No. 5 and No. 8 coal seams in terms of coal petrographic composition, roof and floor lithology, mineral input, and pore structure [4,5,17].
3. Samples and Methods
3.1. Sample Collection and Basic Information
Coal samples were collected from drilling cores of the No. 5 and No. 8 seams in the Yichuan area, on the southeastern margin of the Ordos Basin. Based on coal seam integrity, burial depth variation, and sample representativeness, a total of 12 coal samples were collected, including five samples from the No. 5 coal (A1–A5) and seven samples from the No. 8 coal (B1–B7). The burial depths of the samples range from 1853.85 to 2265.00 m, with the maximum vitrinite reflectance values (Ro,max) ranging from 2.34% to 2.68% (Table 1), indicating an overall high-maturity to over-mature anthracite stage. Previous studies have shown that deep coal reservoirs along the eastern margin of the Ordos Basin generally exhibit high coal rank, low porosity and permeability, and strong heterogeneity [1,2].
Table 1.
Basic test results of coal samples.
3.2. Coal Petrographic and Coal Quality Analyses
Proximate analysis was conducted on air-dried coal samples following Chinese national standard (GB/T 212-2008, 2008), including ash yield, moisture content, volatile matter, and fixed carbon [18]. The results are reported on an air-dried basis as Mad, Aad and Vad. Coal maceral composition and vitrinite reflectance were analyzed in accordance with the ISO 7404 standard [19]. During the experiment, coal samples were prepared as polished coal blocks. The contents of vitrinite, inertinite, and liptinite were determined under an oil-immersion reflected-light microscope, and the maximum vitrinite reflectance (Ro,max) was measured. Maceral classification was conducted following the classification system of the International Committee for Coal and Organic Petrology (ICCP) [20].
3.3. CO2 Adsorption, N2 Adsorption, and Mercury Intrusion Porosimetry Experiments
In this study, CO2 adsorption, low-temperature N2 adsorption, and mercury intrusion porosimetry (MIP) experiments were used to characterize the pore structure of coal samples across the full pore-size range. The CO2 adsorption experiment was conducted at 273 K using a Micromeritics ASAP 2460 adsorption analyzer (Micromeritics Instrument Corporation, Norcross, GA, USA). This method was mainly used to characterize micropore structures smaller than 2 nm and to obtain micropore volume, specific surface area (SSA), and fractal characteristics [21,22]. The CO2 adsorption data were analyzed using Density Functional Theory (DFT) to derive the micropore size distribution. According to the original instrument analysis files, the DFT kernel model adopted in this study is “CO2 at 273 K on Carbon, Slit Pores,” i.e., the pore size distribution was calculated using the adsorption model of CO2 on carbonaceous materials with slit-shaped pores at 273 K. The micropore specific surface area was calculated using Density Functional Theory (DFT-SSA), and the micropore volume was calculated using Density Functional Theory (DFT-PV) [22]. According to the IUPAC pore-size classification, pores with diameters smaller than 2 nm are classified as micropores [22].
Low-temperature N2 adsorption experiments were performed using a Micromeritics ASAP 2460 surface area and pore size analyzer. The coal samples were crushed to 60–80 mesh and vacuum-degassed at 105 °C for 12 h before testing. This method was mainly used to analyze mesopore structures and specific surface area characteristics within the pore-size range of 2–50 nm [22]. In this study, the BJH method was applied to the desorption branch data to calculate the pore size distribution. The Brunauer–Emmett–Teller (BET) model and Barrett–Joyner–Halenda (BJH) model were used to calculate the SSA, pore volume (PV), and pore-size distribution of mesopores, respectively [8,22].
MIP was conducted using an AutoPore IV 9500 mercury porosimeter (Micromeritics Instrument Corporation, Norcross, GA, USA), with a maximum pressure of 413 MPa, corresponding to a minimum detectable pore diameter of approximately 3 nm. Before testing, the coal samples were processed into regular particles and vacuum-dried at 105 °C for 24 h. This method was mainly used to reveal the development characteristics of mesopores, macropores, connected pore throats, and fracture systems. Pores with diameters larger than 50 nm were classified as macropores [22]. The parameters used to calculate the MIP pore volume in this study are sample mass, total pore volume, and cumulative mercury intrusion saturation.
In this study, each coal sample was measured only once for the CO2 adsorption, N2 adsorption, and MIP experiments; no replicate measurements were performed on the same sample. All instruments were calibrated before testing and operated under the same standardized conditions. Because replicate measurements were not performed, the repeatability and sample-specific experimental uncertainty could not be quantified from the present dataset. The absolute pore structure parameters should therefore be regarded as single-measurement estimates, whereas the relative differences between the No. 5 and No. 8 coals were obtained under identical protocols and are considered indicative.
3.4. Fractal Dimension Calculation
3.4.1. V-S Model
The micropore fractal dimension was calculated from low-pressure CO2 adsorption data using the volume-specific surface area (V-S) model. This model describes the double-logarithmic relationship between cumulative micropore volume (V) and cumulative specific surface area (S) [23,24]:
where V is the CO2 adsorption amount or cumulative micropore volume, S is the cumulative specific surface area, Dc is the micropore fractal dimension, and C is a constant. In linear fitting:
Therefore, the micropore fractal dimension (Dc) can be calculated as:
A higher Dc indicates a more complex micropore structure and a larger adsorption surface, providing more methane adsorption sites [23].
3.4.2. FHH Model
The Frenkel–Halsey–Hill (FHH) model was used to characterize mesopore-scale fractal features based on low-temperature N2 adsorption data [11,12]. The model is expressed as:
where V is the adsorption amount, (P/P0) is the relative pressure, A is the fitting slope, and C is a constant. In Equation (4), as P/P0 → 1, lnP0/P) → 0, making ln[ln(P0/P)] approach −∞. Because the adsorption amount V increases sharply, the slope A is inherently negative (typically −1 < A < 0). The fractal dimension is calculated as [25,26,27]:
The low-pressure fractal dimension (D1) mainly reflects pore-surface roughness, whereas the high-pressure fractal dimension (D2) reflects pore-body complexity and pore-size heterogeneity related to capillary condensation. Generally, D ranges from 2 to 3, with higher values indicating rougher pore surfaces, more complex pore structures, and stronger heterogeneity [26,27,28].
3.4.3. J-Function Model
The J-function model was used to calculate fractal dimensions from mercury intrusion data [29]. Based on fractal capillary theory, the Leverett J-function and effective wetting-phase saturation Se follow a power-law relationship [29,30,31]:
Taking logarithms on both sides gives:
where B is the slope of the double-logarithmic fitting line between lg J and lg Se. The pore fractal dimension D can be calculated as follows:
In general, D ranges from 2 to 3. A larger D indicates a more complex pore-throat structure, rougher pore walls, and stronger heterogeneity, whereas a smaller D suggests a simpler and more uniform pore-throat system.
4. Results
4.1. Coal Petrographic and Coal Quality Characteristics
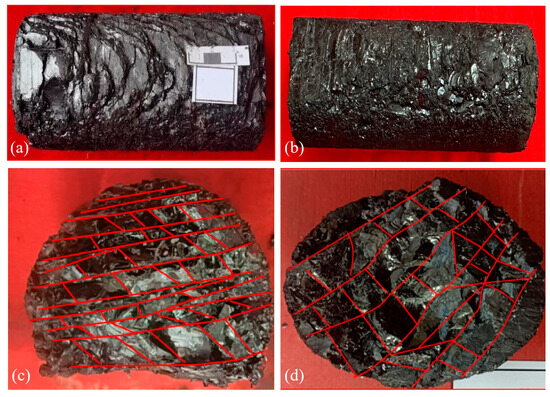
The macroscopic coal lithotypes of the No. 5 and No. 8 coals are mainly bright coal and semi-bright coal, with vitreous luster and stepped fractures. The coal samples are dominated by primary structures, and the cores mainly occur as columnar and massive forms (Figure 2a,b). Cleats and fractures are developed in both coal seams, showing linear to network-like distributions, which are favorable for gas production. The No. 5 coal has a higher fracture density than the No. 8 coal (Figure 2c,d).
Figure 2.
Core photographs of the No. 5 and No. 8 coals in the Yichuan area. (a) Core photograph of the No. 5 coal, Well A1, 2089.40 m; (b) core photograph of the No. 8 coal, Sample A3, 2099.43 m; (c) fracture photograph of the No. 5 coal, Sample A2, 2079.07 m; (d) fracture photograph of the No. 8 coal, Sample B6, 1855.24 m.
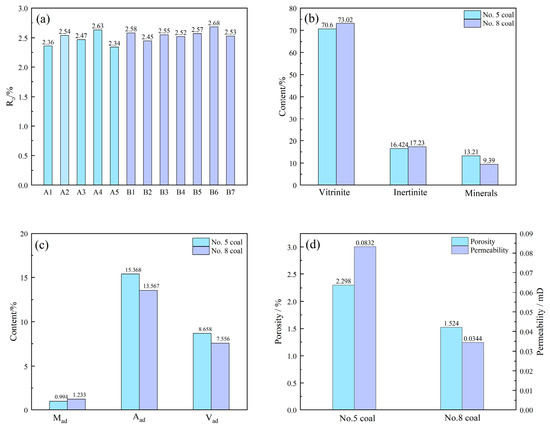
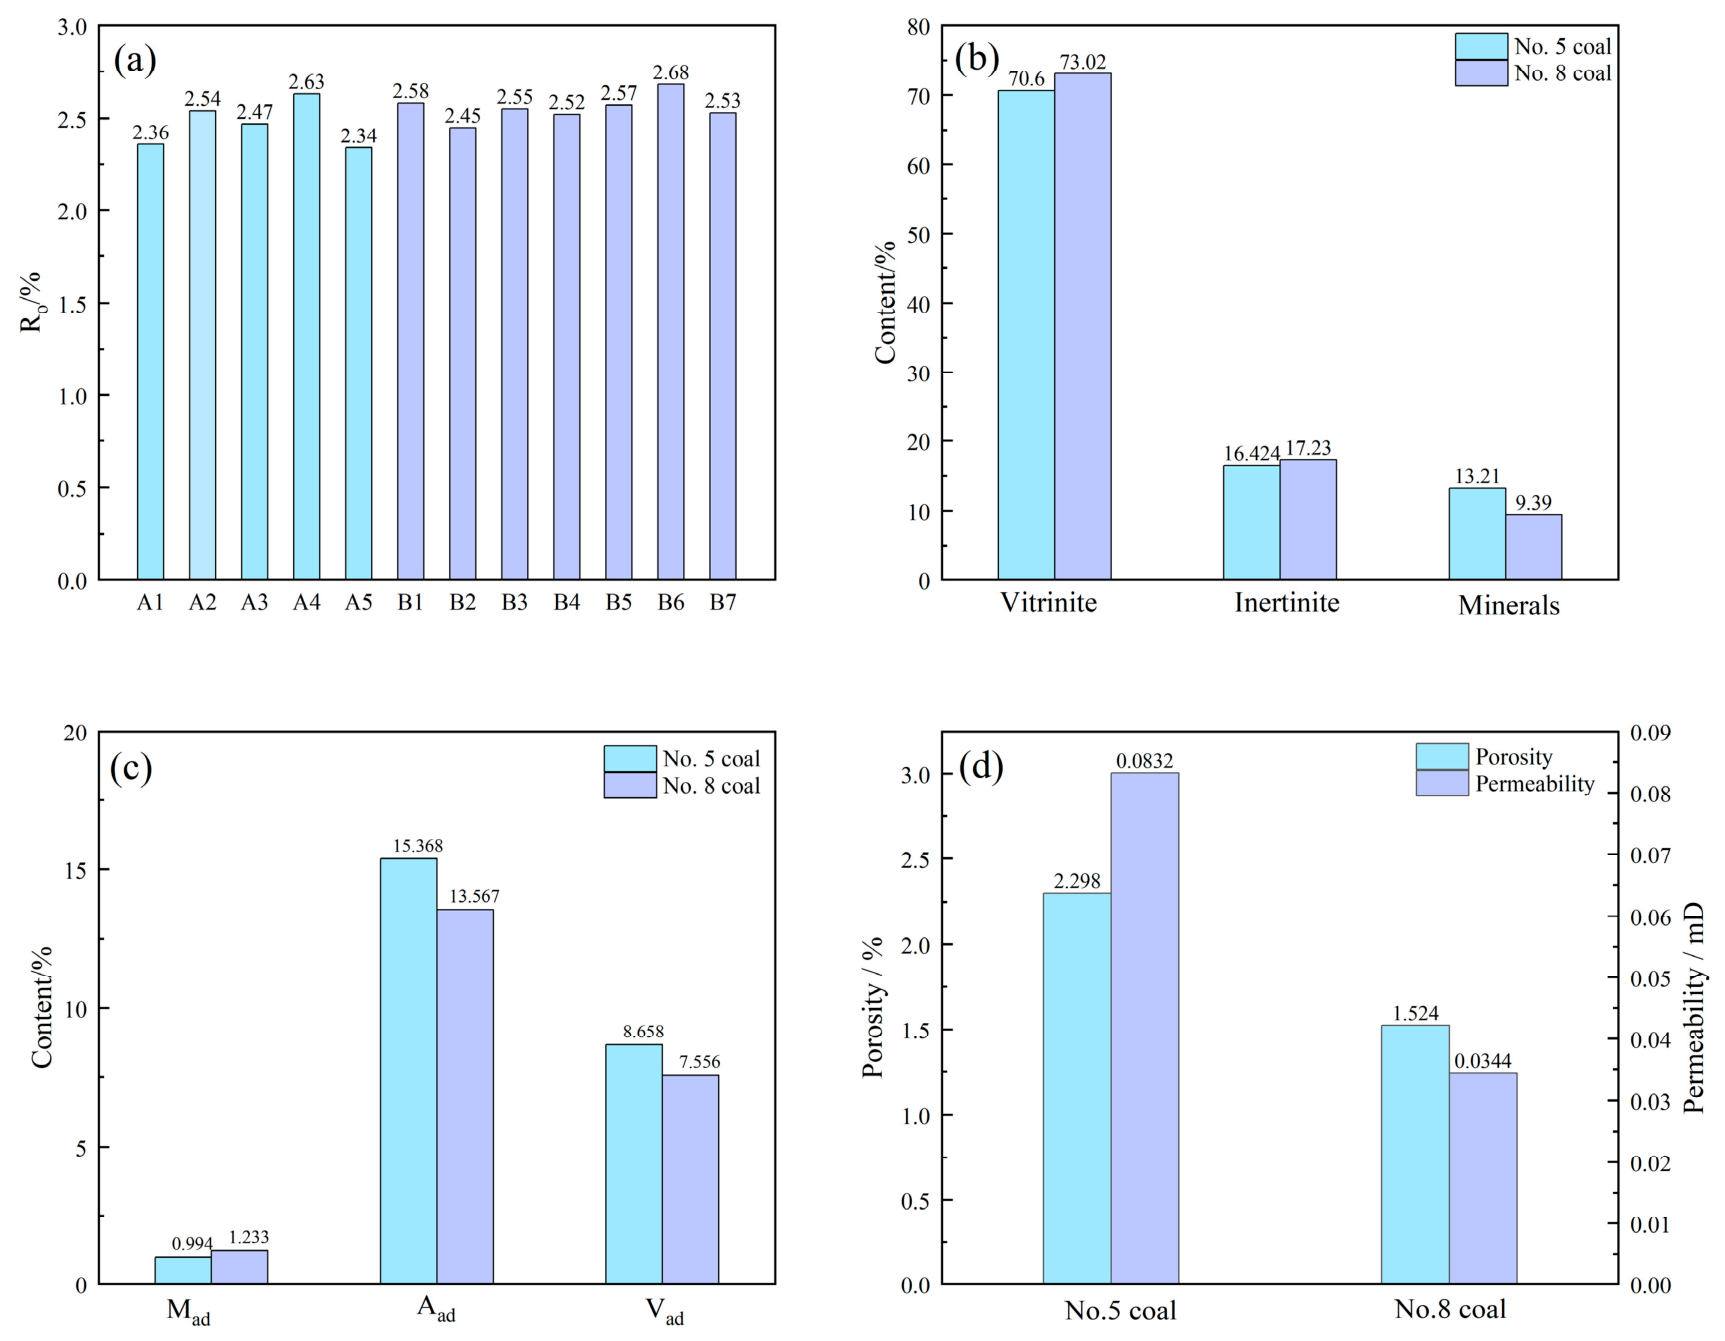
The vitrinite reflectance experiment results indicate that both the No. 5 and No. 8 coals in the study area are of relatively high coal rank. The Ro,max values of the No. 5 coal range from 2.34% to 2.63%, with an average of 2.47%, whereas those of the No. 8 coal range from 2.45% to 2.68%, with an average of 2.55%, indicating that the No. 8 coal has a slightly higher coalification degree than the No. 5 coal (Table 1, Figure 3a). Proximate analysis shows that the moisture content (Mad) of the No. 5 coal ranges from 0.40% to 1.72%, averaging 0.99%; the ash yield (Aad) ranges from 6.38% to 30.68%, averaging 15.37%; and the volatile matter content (Vad) ranges from 6.80% to 12.86%, averaging 8.66% (Figure 3b). For the No. 8 coal, Mad ranges from 0.56% to 2.44%, with an average of 1.23%; Aad ranges from 6.16% to 32.00%, with an average of 13.57%; and Vad ranges from 6.13% to 12.54%, with an average of 7.56% (Table 1). Overall, both seams are high-rank coals, with the No. 8 seam being slightly more mature and the No. 5 seam showing greater variability in inorganic and volatile components.
Figure 3.
Bar charts of basic data for the No. 5 and No. 8 coals. (a) Vitrinite reflectance (Ro,max); (b) proximate analysis; (c) maceral composition; and (d) porosity and permeability.
Maceral composition analysis (Table 1) shows that vitrinite is the dominant maceral group in both the No. 5 and No. 8 coals. The vitrinite content of the No. 5 coal ranges from 66.93% to 75.00%, with an average of 70.60%; the inertinite content ranges from 4.80% to 23.83%, averaging 16.42%; and the mineral matter content ranges from 3.68% to 27.10%, averaging 13.48 (Figure 3c). For the No. 8 coal, the vitrinite content ranges from 65.34% to 82.21%, with an average of 73.02%; the inertinite content ranges from 5.93% to 26.82%, averaging 17.23%; and the mineral matter content ranges from 4.80% to 19.89%, averaging 9.75%. The No. 5 coal has a slightly higher average vitrinite content, whereas the No. 8 coal contains a relatively higher average inertinite content. In addition, the wider variation in mineral matter content in the No. 5 coal indicates stronger heterogeneity in its petrographic composition.
The petrophysical parameters show that the porosity of the No. 5 coal ranges from 1.21% to 3.04%, with an average of 2.30%, and its permeability ranges from 0.018 to 0.245 mD, averaging 0.083 mD (Figure 3d). The porosity of the No. 8 coal ranges from 1.28% to 1.79%, with an average of 1.52%, whereas its permeability ranges from 0.011 to 0.105 mD, with an average of 0.034 mD. Overall, both seams are characterized by low porosity and low permeability, yet the No. 5 coal exhibits relatively higher porosity and permeability than the No. 8 coal.
4.2. Full Pore-Size Characterization of Pore Structure
4.2.1. Micropore Structure Characteristics Based on CO2 Adsorption
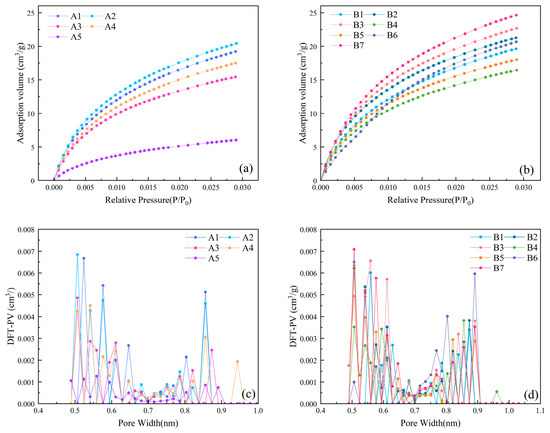
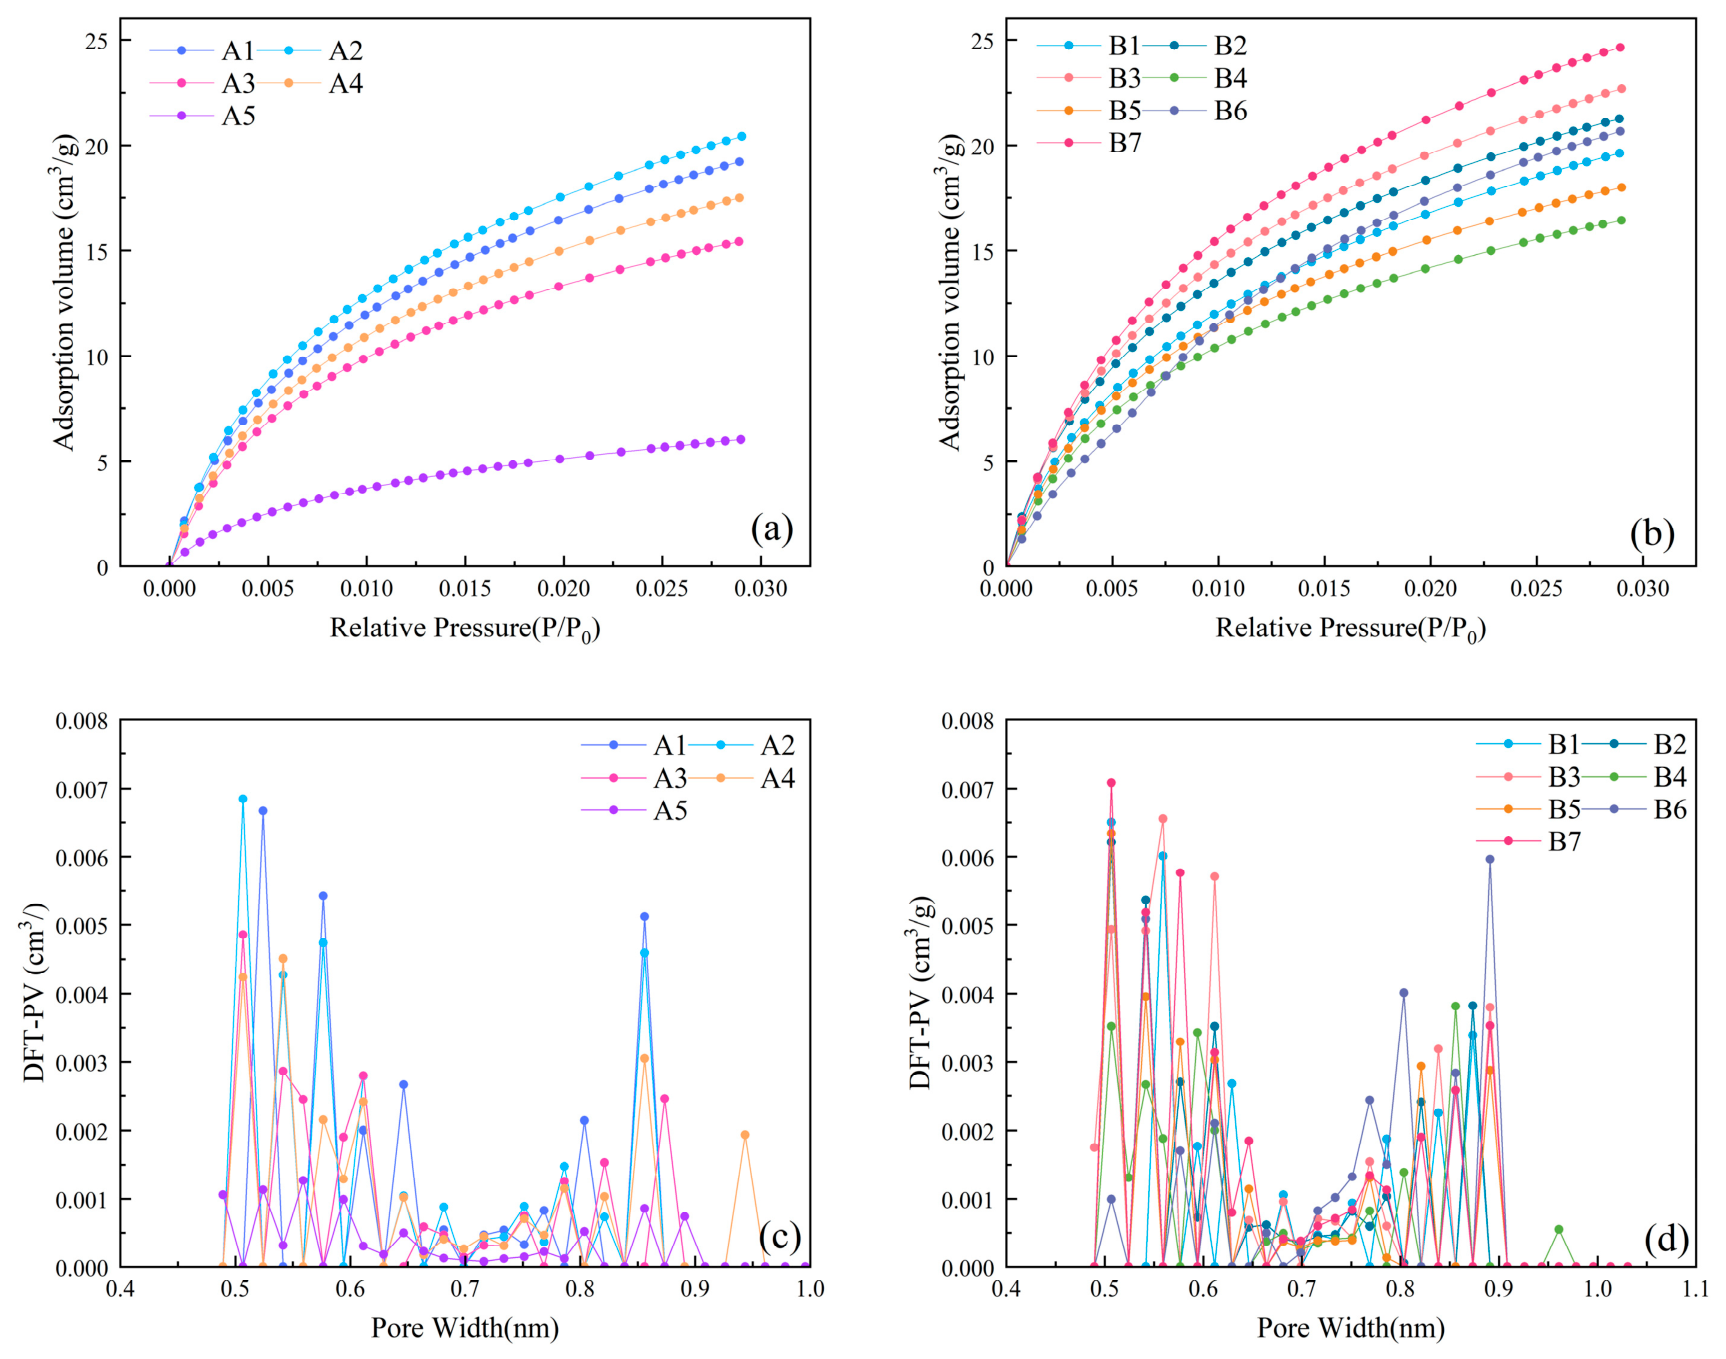
Because micropores are the main spaces for CBM adsorption and occurrence, CO2 adsorption curves can further reflect differences in adsorption capacity among coal samples [32,33,34]. The experimental results show that the CO2 adsorption curves of the No. 5 and No. 8 coals have similar shapes. The adsorption volume gradually increases with increasing relative pressure and rises rapidly at the low relative pressure stage (Figure 4a,b). This feature indicates that both coal seams develop a certain amount of micropore structures.
Figure 4.
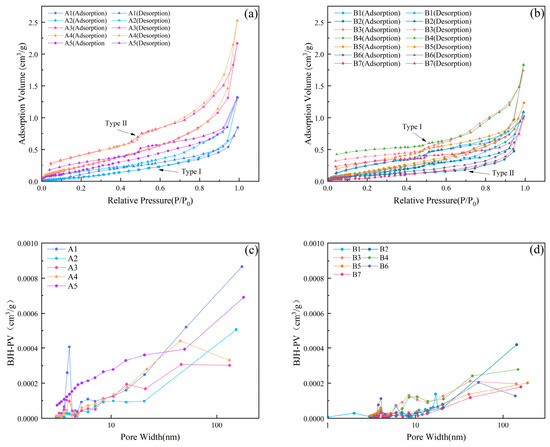
CO2 adsorption curves and DFT micropore pore-size distributions of No. 5 and No. 8 coals in the Yichuan area. (a) CO2 adsorption curves of No. 5 coal; (b) CO2 adsorption curves of No. 8 coal; (c) DFT-PV vs. pore width of No. 5 coal; (d) DFT-PV vs. pore width of No. 8 coal.
For the No. 5 coal, the DFT-SSA ranges from 46.206 to 154.343 m2/g, with an average of 121.5794 m2/g. The No. 8 coal exhibits slightly higher values, ranging from 127.548 to 182.250 m2/g, with an average of 153.508 m2/g (Table 2). The DFT-PV ranges from 0.00899 to 0.03348 cm3/g (avg. 0.025568 cm3/g) (Figure 4c), while the No. 8 coal shows higher values of 0.02644–0.03972 cm3/g (avg. 0.03261 cm3/g) (Figure 4d). Overall, the No. 8 coal possesses higher CO2-accessible specific surface area and micropore volume, indicating a more developed micropore system with greater adsorption capacity. The pore diameter distribution is comparable between the two seams, which is predominantly concentrated in the 0.50–0.65 nm range, with an additional minor peak near 0.80–0.90 nm (Figure 4c,d).
Table 2.
Results of low-pressure CO2 and low-temperature N2 adsorption experiments of the coal samples.
4.2.2. Mesopore Structure Characteristics Based on Low-Temperature N2 Adsorption
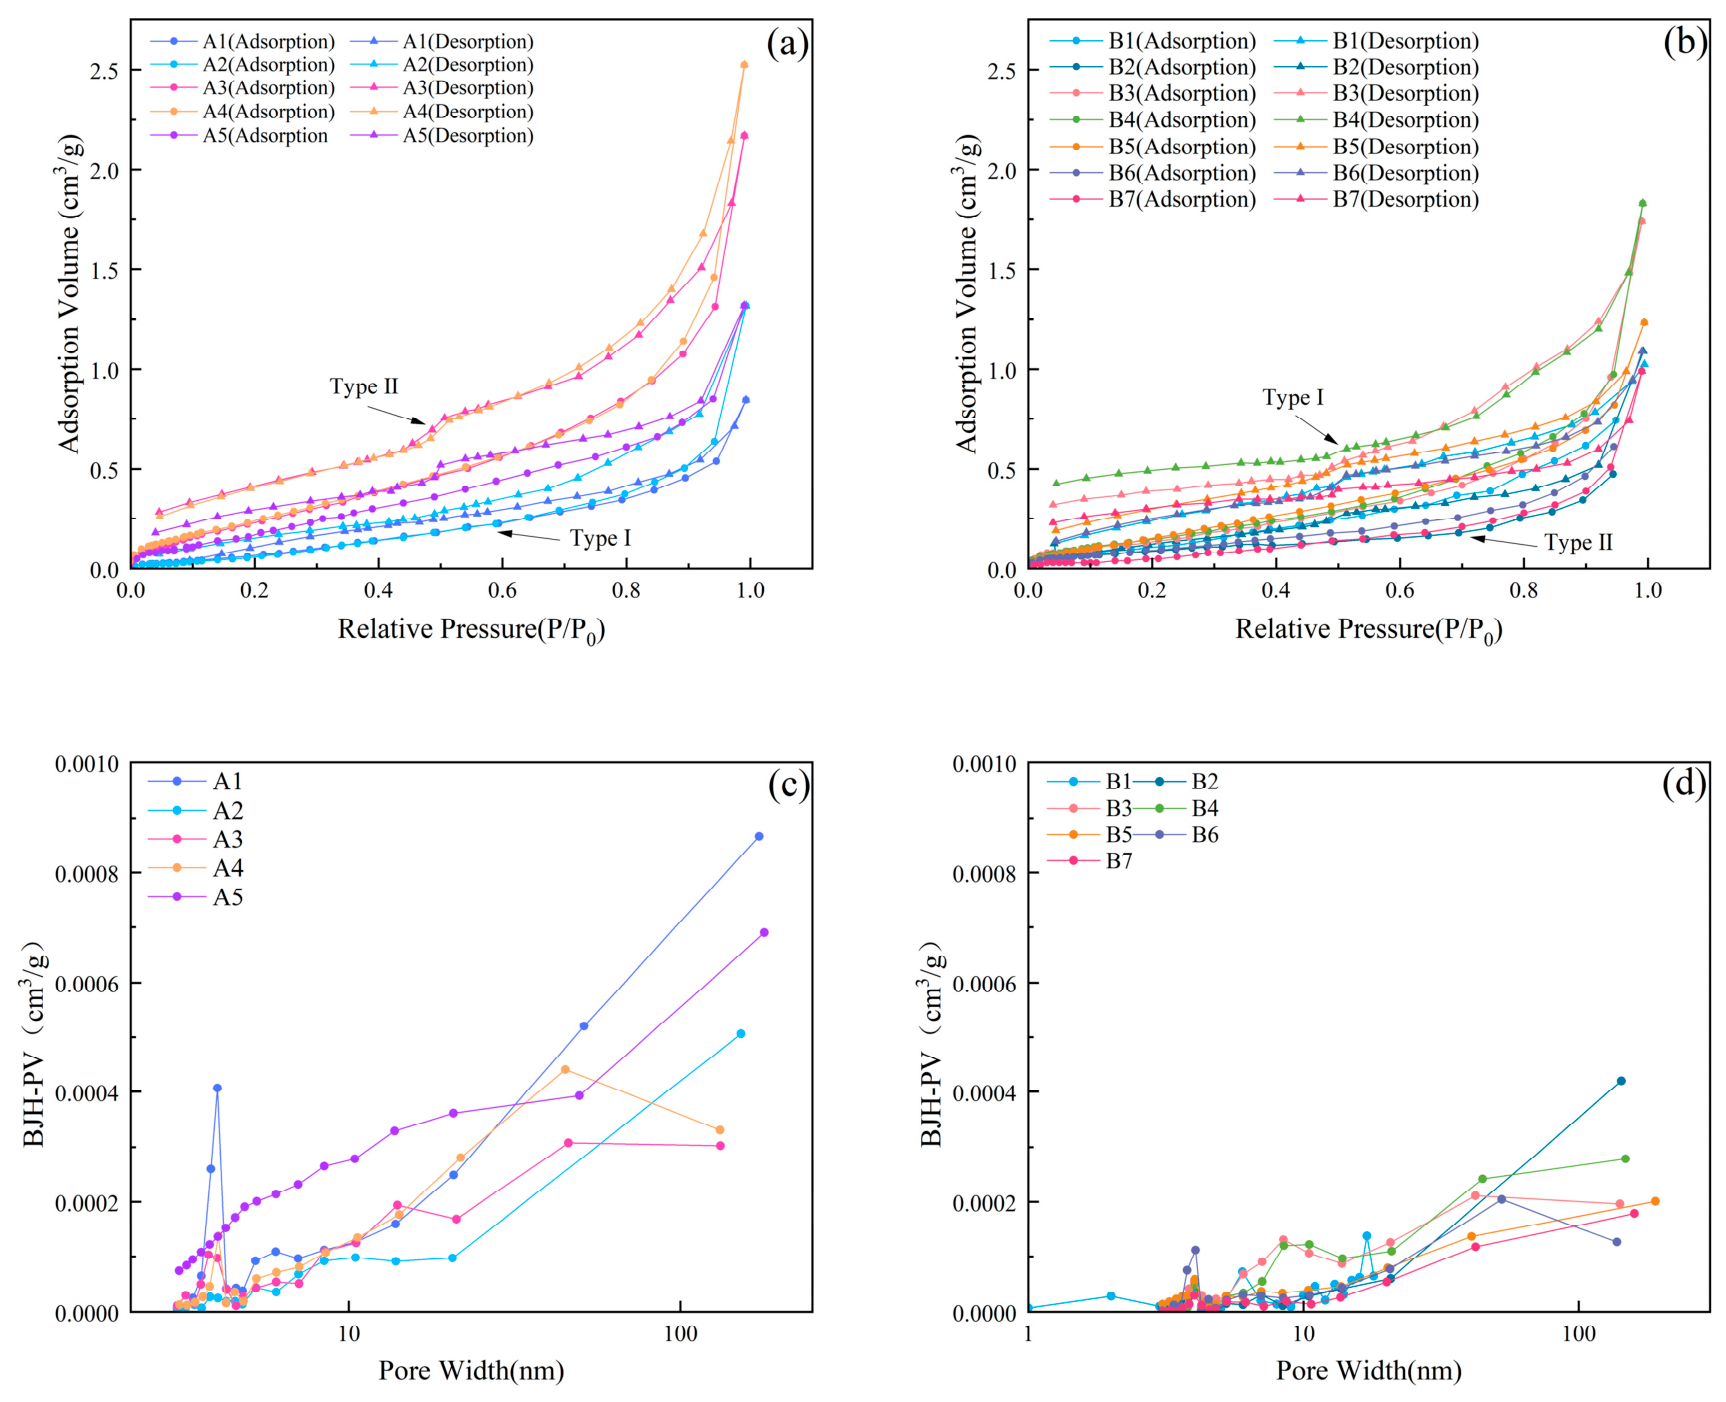
In general, variations in adsorption amount at low relative pressures are mainly related to micropore filling and surface adsorption, whereas increases in adsorption amount at medium to high relative pressures are mostly associated with capillary condensation in mesopores, macropores, and fracture-related pores [22,35,36]. Therefore, the morphology of low-temperature N2 adsorption curves can be used to identify pore types, pore-size assemblages, and pore connectivity in coal samples [33,34,37].
The experimental results show that the adsorption–desorption curves of both the No. 5 and No. 8 coals gradually increase with increasing relative pressure, followed by a rapid increase at high relative pressures. This indicates that both coal seams contain a certain number of mesopores and open pores. The BJH pore volume distribution of the No. 5 coal shows a unimodal pattern as a function of pore diameter, whereas the No. 8 coal exhibits a bimodal pore volume distribution. Based on curve morphology and hysteresis-loop characteristics, the adsorption curves can be divided into two types: Type I and Type II (Figure 5a,b). Type I curves are characterized by relatively low adsorption capacity and narrow hysteresis loops, indicating that the pores are mainly slit-shaped pores, closed-end pores, or semi-closed pores. Type II curves show higher adsorption capacity and more obvious hysteresis loops, suggesting that open pores, ink-bottle-shaped pores, or narrow-throat–wide-body pores are relatively developed, with a higher degree of pore structure complexity.
Figure 5.
Low-temperature N2 adsorption curves and BJH mesopore pore-size distributions of No. 5 and No. 8 coals in the Yichuan area. (a) N2 adsorption curves of No. 5 coal; (b) N2 adsorption curves of No. 8 coal; (c) BJH-PV distribution of No. 5 coal; (d) BJH-PV distribution of No. 8 coal.
Among the No. 5 coal samples, A1 and A2 mainly exhibit Type I curve characteristics, whereas A3, A4 and A5 show more obvious Type II curve characteristics. The BET-SSA of the No. 5 coal ranges from 0.288 to 0.644 m2/g, with an average of 0.4564 m2/g. The BJH-PV ranges from 0.00117 to 0.00322 cm3/g, with an average of 0.00177 cm3/g. The average pore diameter ranges from 7.73 to 44.72 nm, with an average of 17.822 nm (Table 2). The pore volume distribution is mainly concentrated within the ranges of 3–5 nm and 10–22 nm, indicating that mesopores are relatively developed in the No. 5 coal and that larger mesopores make a notable contribution to pore volume in some samples (Figure 5c).
The No. 8 coal samples are generally dominated by Type I curves, while some samples show Type II or transitional curve characteristics. The BET-SSA of the No. 8 coal ranges from 0.180 to 0.428 m2/g, with an average of 0.280 m2/g. The BJH-PV ranges from 0.00053 to 0.00120 cm3/g, with an average of 0.00086 cm3/g. The average pore diameter ranges from 7.85 to 16.89 nm, with an average of 12.81 nm (Table 2). The pore volume is mainly distributed in the small mesopore range of 3–5 nm, and some samples also show a certain pore volume contribution within the range of 6–21 nm (Figure 5c). However, both the total pore volume and specific surface area of the mesopores of the No. 8 coal are generally lower than those of the No. 5 coal.
4.2.3. Macropore Structure Characteristics Based on MIP
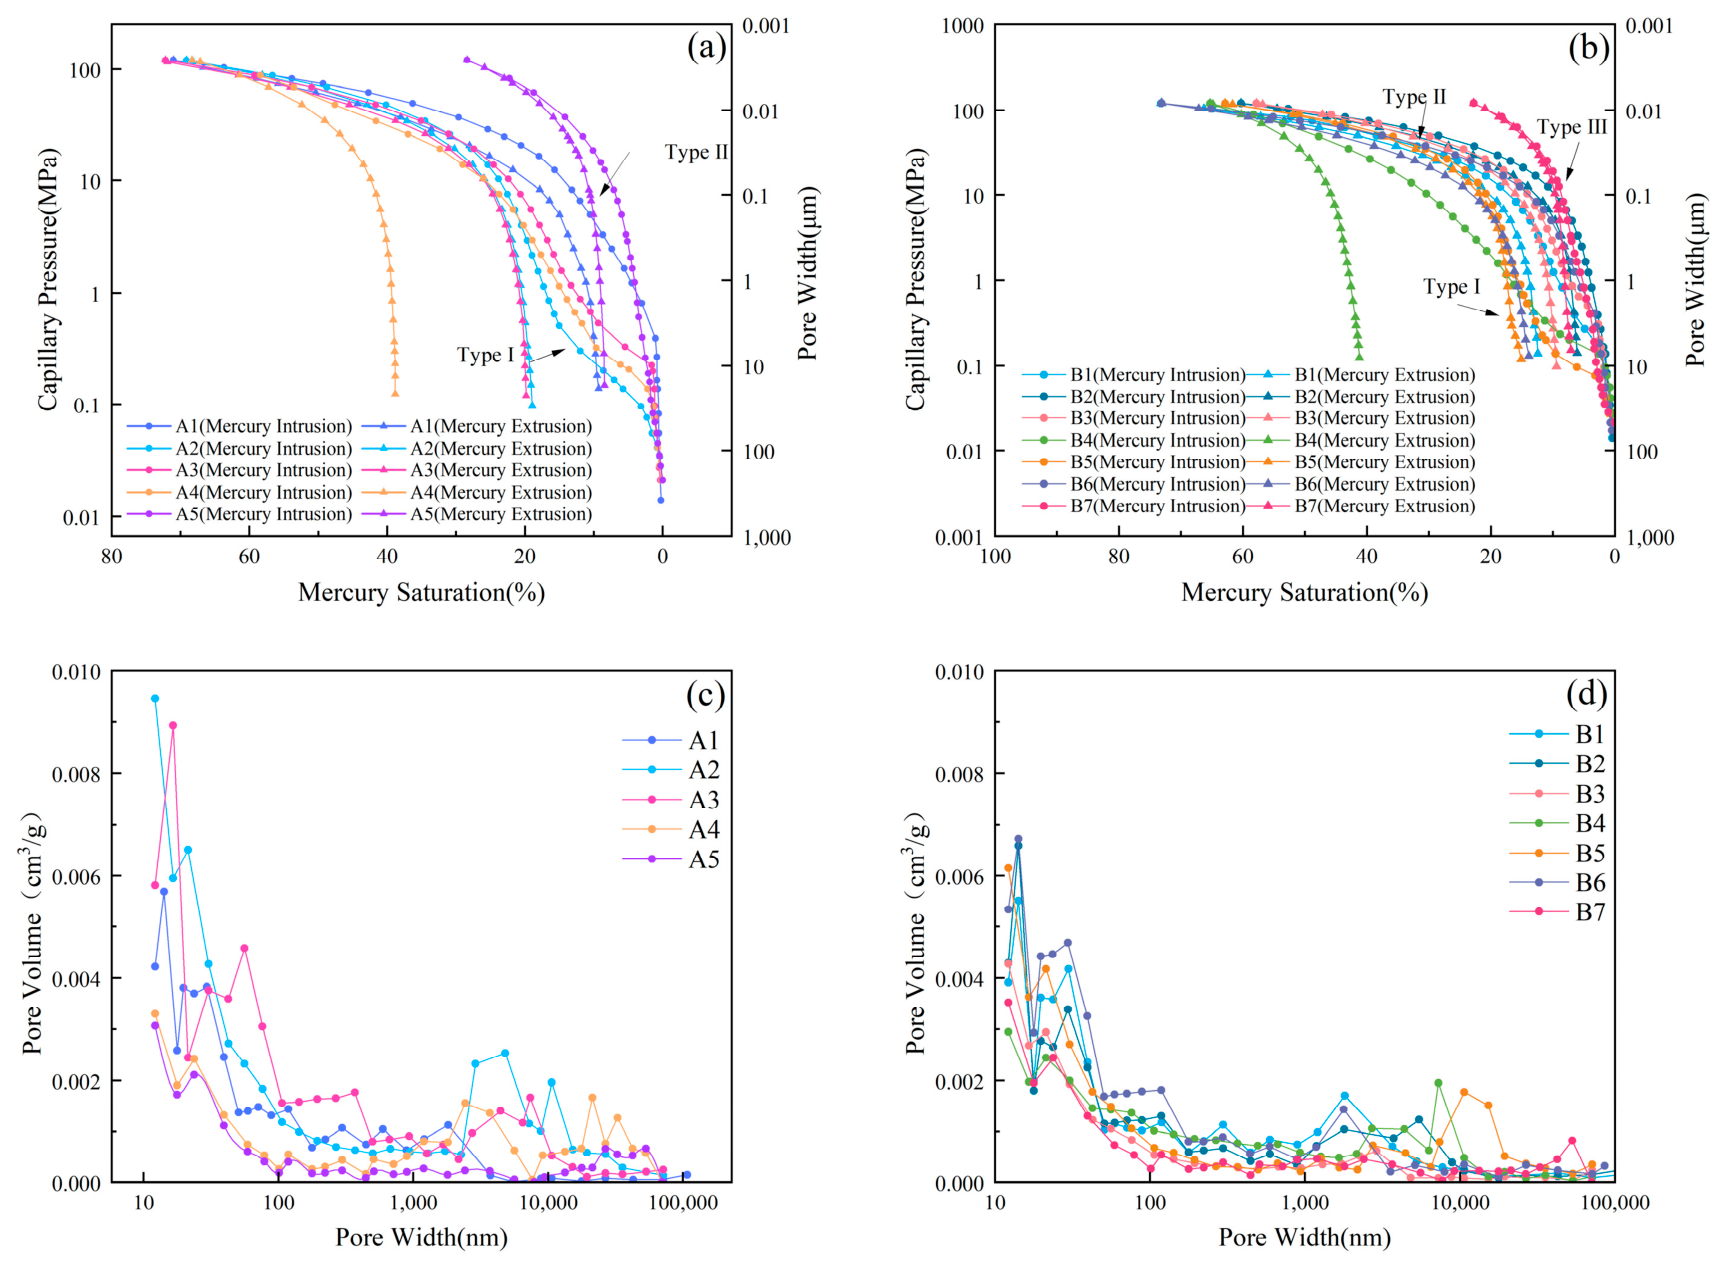
Mercury intrusion at high-pressure stages mainly reflects the development characteristics of small pore throats, whereas mercury intrusion at medium- to low-pressure stages is mostly associated with mesopores, macropores, or fractures [9,38,39]. The MIP-derived porosity in Table 3 is the apparent porosity without the high-pressure matrix compression correction as in [39]. Matrix compression at high pressure can overestimate mercury intrusion volume, and MIP only accesses connected pore throats; this value is therefore not directly equivalent to helium or petrophysical porosity. Compared with the measured helium porosity, the MIP-derived porosity is generally higher, consistent with high-pressure matrix compression and the different accessible pore ranges of the two methods. The MIP results show that the mercury intrusion–extrusion curves of both the No. 5 and No. 8 coals exhibit hysteresis to varying degrees, indicating that the pore-throat structures of the two coal seams are complex and that open pores, semi-closed pores, and narrow-throat–wide-body pores are developed. Both No. 5 and No. 8 coals show bimodal pore volume distributions as a function of pore diameter, while the maximum peak value of the No. 5 coal is higher than that of the No. 8 coal (Figure 6c,d).
Table 3.
Results of mercury intrusion porosimetry experiments of the coal samples.
Figure 6.
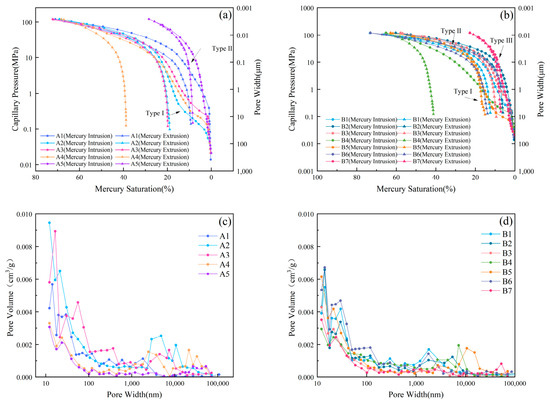
Mercury intrusion curves and pore volume distributions as a function of pore diameter for No. 5 and No. 8 coals in the Yichuan area. (a) Mercury intrusion curves of No. 5 coal; (b) mercury intrusion curves of No. 8 coal; (c) pore volume versus pore diameter of No. 5 coal; (d) pore volume versus pore diameter of No. 8 coal.
Based on curve morphology and mercury intrusion parameters, the mercury intrusion curves of the coal samples can be divided into three types: Type I, Type II, and Type III (Figure 6a,b). The Type I mercury intrusion curve shows a three-stage pattern. When the capillary pressure is 0.01–0.1 MPa, the curve is steep, with almost no mercury intrusion, indicating that macropores or fractures larger than 10 μm are poorly developed. When the capillary pressure ranges from 0.1 to 10 MPa, the curve slope decreases and the mercury intrusion volume increases slowly. When the capillary pressure exceeds 10 MPa, the mercury intrusion volume increases rapidly, indicating that macropores with pore diameters smaller than 100 nm and some mesopores are the most developed in these samples, followed by macropores of 100 nm–10 μm.
The Type II curve also shows a three-stage pattern and resembles Type I at both low-pressure (<0.1 MPa) and high-pressure (>10 MPa) stages. At low pressures, mercury intrusion is negligible, whereas at high pressures (>10 MPa), mercury saturation increases rapidly, indicating well-developed pores smaller than 100 nm. The key distinction lies in the intermediate pressure range (0.1–10 MPa), where the Type II curve exhibits a convex-upward shape with a marked increase in mercury saturation, contrasting with the concave-downward, slower increase of Type I. This contrast indicates that pore throats in the 100 nm–10 μm range are better developed and more effectively connected in Type II samples than those in Type I. The Type III mercury intrusion curve exhibits a steep pattern, characterized by generally low mercury saturation throughout the entire pressure range, indicating poorly developed pore systems. Mercury intrusion is negligible at capillary pressures below 10 MPa, with only a minor amount of mercury entering the pores at pressures exceeding 10 MPa.
In the No. 5 coal, Samples A2–A4 are characterized by Type I curves (Figure 6a), with displacement pressures ranging from 0.0963 to 0.2256 MPa and maximum mercury saturations between 38.20% and 72.20% (Table 3). Samples A1 and A5 exhibit Type II curves, with relatively higher displacement pressures of 0.3920 MPa and 8.2451 MPa, respectively. In the No. 8 coal, samples B1, B4, and B5 display Type I curves (displacement pressure: 0.076–0.400 MPa), with sample B4 showing a notably low mercury extrusion efficiency of only 36%; samples B2, B3, and B6 are characterized by Type II curves, with displacement pressures ranging from 0.1652 to 0.4112 MPa (Figure 6b). Sample B7 displays a Type III curve, with a maximum mercury saturation of only 22.78%, reflecting extremely limited interconnected pore volume. Overall, the No. 5 coal is dominated by Type I curves with a subordinate Type II component, indicating moderate to locally enhanced pore connectivity. In contrast, the No. 8 coal exhibits a wider range of curve types, including a Type III sample with extremely low mercury saturation, reflecting stronger heterogeneity and generally poorer connectivity. These contrasting characteristics are consistent with the higher porosity and permeability of the No. 5 coal (Section 4.1). Therefore, we consider the No. 5 coal more favorable for gas migration, whereas the No. 8 coal is more conducive to gas adsorption.
4.2.4. Integrated Characterization of Full-Scale Pore–Fracture Structures
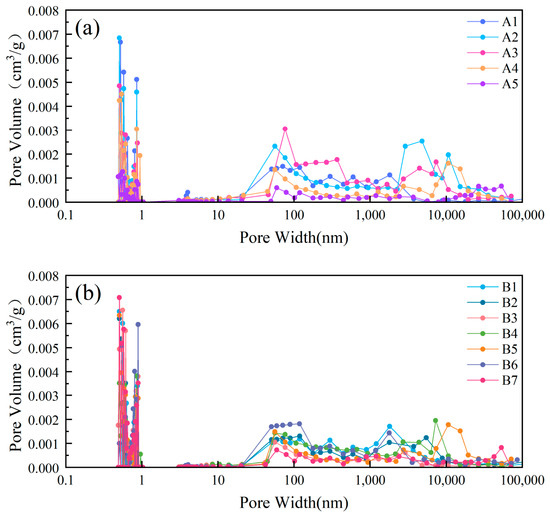
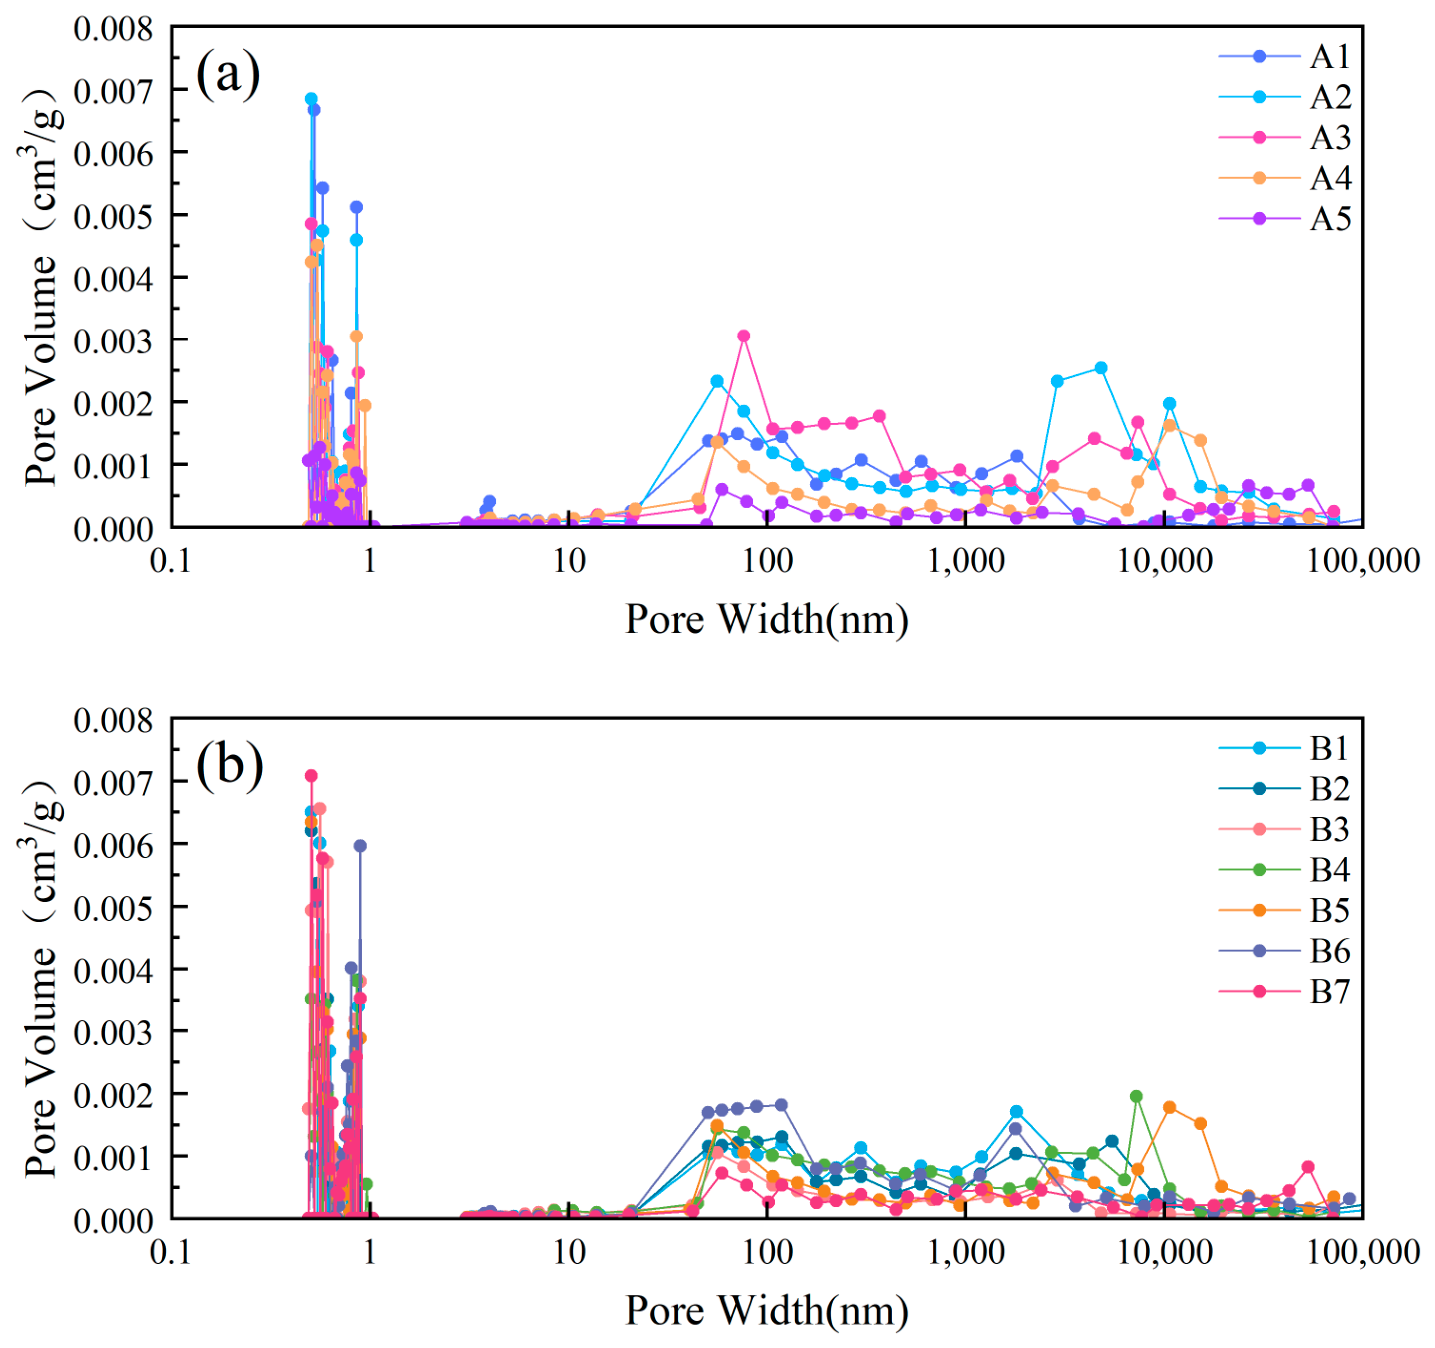
Full pore-size range characterization provides a more comprehensive understanding of coal reservoir pore structures, and the combined application of multiple methods improves the completeness and reliability of pore structure evaluation [18,22,40,41]. The results from high-pressure mercury intrusion (MIP), low-temperature N2 adsorption, and CO2 adsorption indicate that both the No. 5 and No. 8 coals in the study area contain multiscale pore systems composed of micropores, mesopores, macropores, and fractures, although their dominant pore-size ranges differ markedly. To obtain the full pore-size distribution curves, we adopted a piecewise splicing approach, with truncation points set at the optimal applicability boundaries of each method (2 nm and 50 nm). Specifically, CO2 adsorption data were used for ultramicropores < 2 nm, N2 adsorption data for mesopores in the 2–50 nm range, and MIP data for macropores > 50 nm. The datasets were directly truncated at the 2 nm and 50 nm boundaries, and no processing was applied to the overlapping ranges because each method provides its highest data accuracy within its respective optimal range, and truncation splicing avoids errors that may arise from methodological discrepancies.
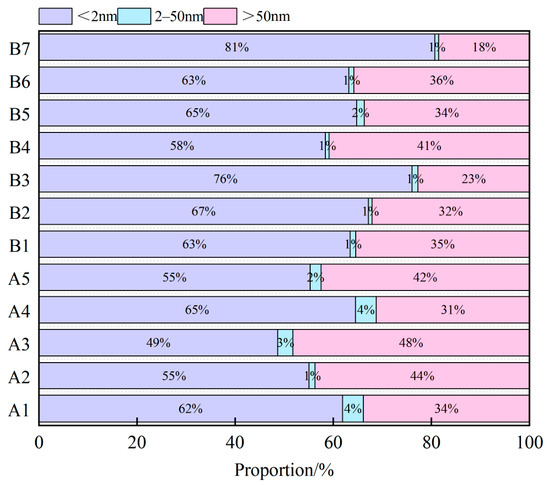
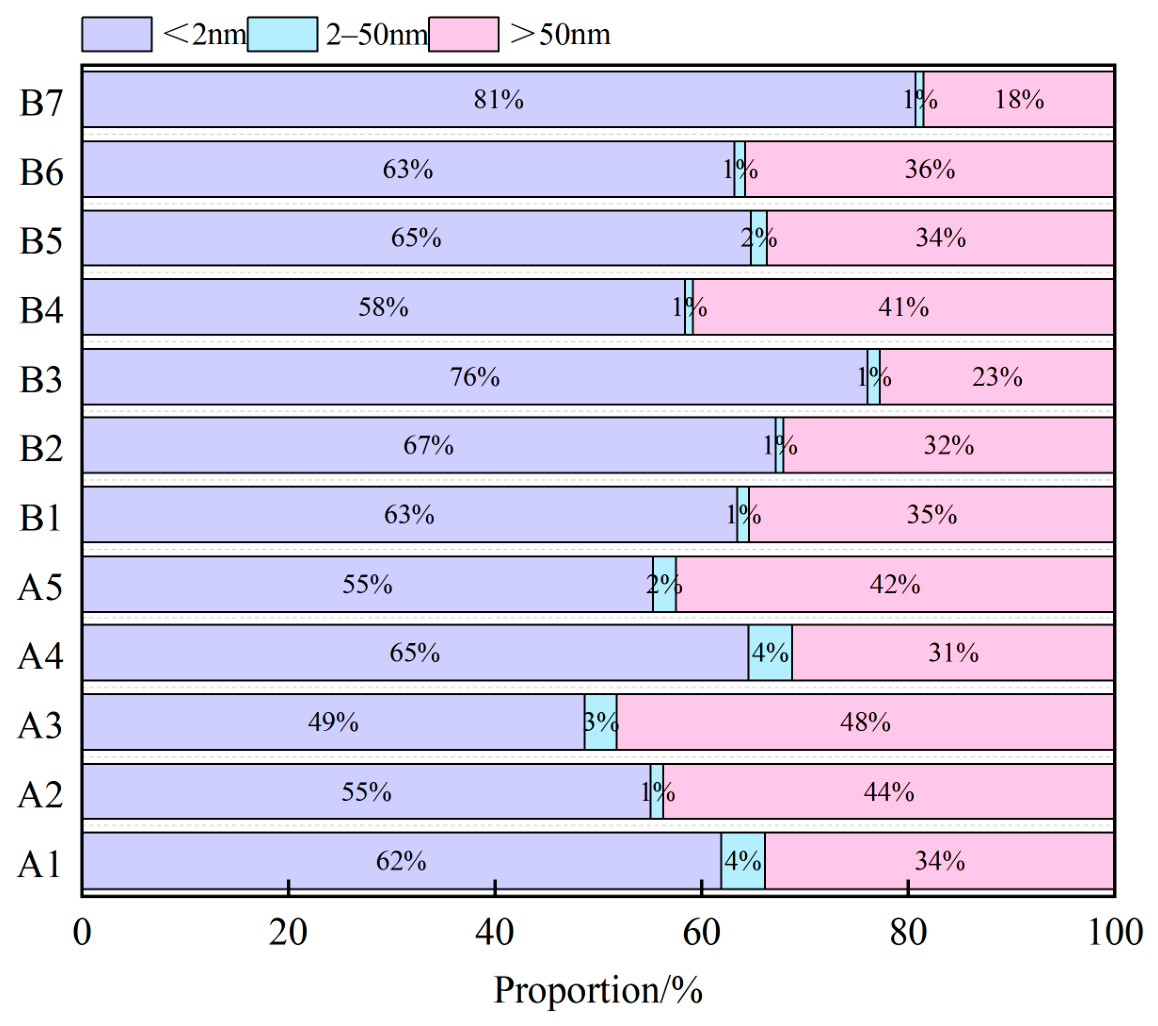
In terms of the pore-volume distribution across the full pore-size range, both coal seams exhibit multimodal characteristics (Figure 7). In the No. 5 coal, micropores smaller than 2 nm account for 49–65%, with an average of 57.20%, whereas in the No. 8 coal, they account for 58–81%, averaging 67.57%. The markedly higher micropore proportion in the No. 8 coal indicates more developed micropore adsorption space, which is favorable for coalbed methane adsorption and storage [32,33,42]. In contrast, mesopores of 2–50 nm account for 1–4% in the No. 5 coal, with an average of 2.80%, higher than the 1–2% range and 1.14% average of the No. 8 coal. In particular, the mesopore proportion in Samples A1 and A4 reaches 4%, indicating relatively well-developed mesopores and gas diffusion pathways in the No. 5 coal (Figure 8). In addition, pores larger than 50 nm account for 31–48% in the No. 5 coal, with an average of 39.80%, whereas they account for 18–41% in the No. 8 coal, averaging 31.29%. This indicates that macropores and fractures contribute more strongly in the No. 5 coal, reflecting relatively better pore openness and connectivity, while the macropore–fracture system of the No. 8 coal is generally less developed.
Figure 7.
Full pore-size distribution of No. 5 and No. 8 coal samples jointly characterized by high-pressure mercury intrusion, N2 adsorption, and CO2 adsorption. (a) Full pore-size distribution of the No. 5 coal; (b) full pore-size distribution of the No. 8 coal.
Figure 8.
Proportions of pore volume in different pore size ranges of No. 5 and No. 8 coal samples.
Overall, the No. 8 coal is dominated by micropores (<2 nm), which account for 67.57% of the total pore volume on average, and its pore structure is more favorable for gas adsorption. By contrast, the No. 5 coal shows substantially greater contributions from mesopores (2–50 nm, averaging 2.80%) and macropores (>50 nm, averaging 39.80%), and its pore structure is more favorable for gas seepage.
To further quantify the structural complexity and heterogeneity underlying this pore structure distinction, the fractal characteristics of the two coal seams are analyzed in the following section using the V-S, FHH, and J-function models across different pore-size scales.
4.3. Multi-Scale Fractal Characteristics
4.3.1. Micropore Fractal Characteristics
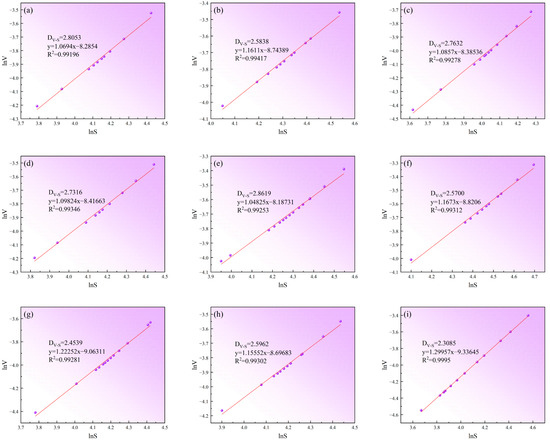
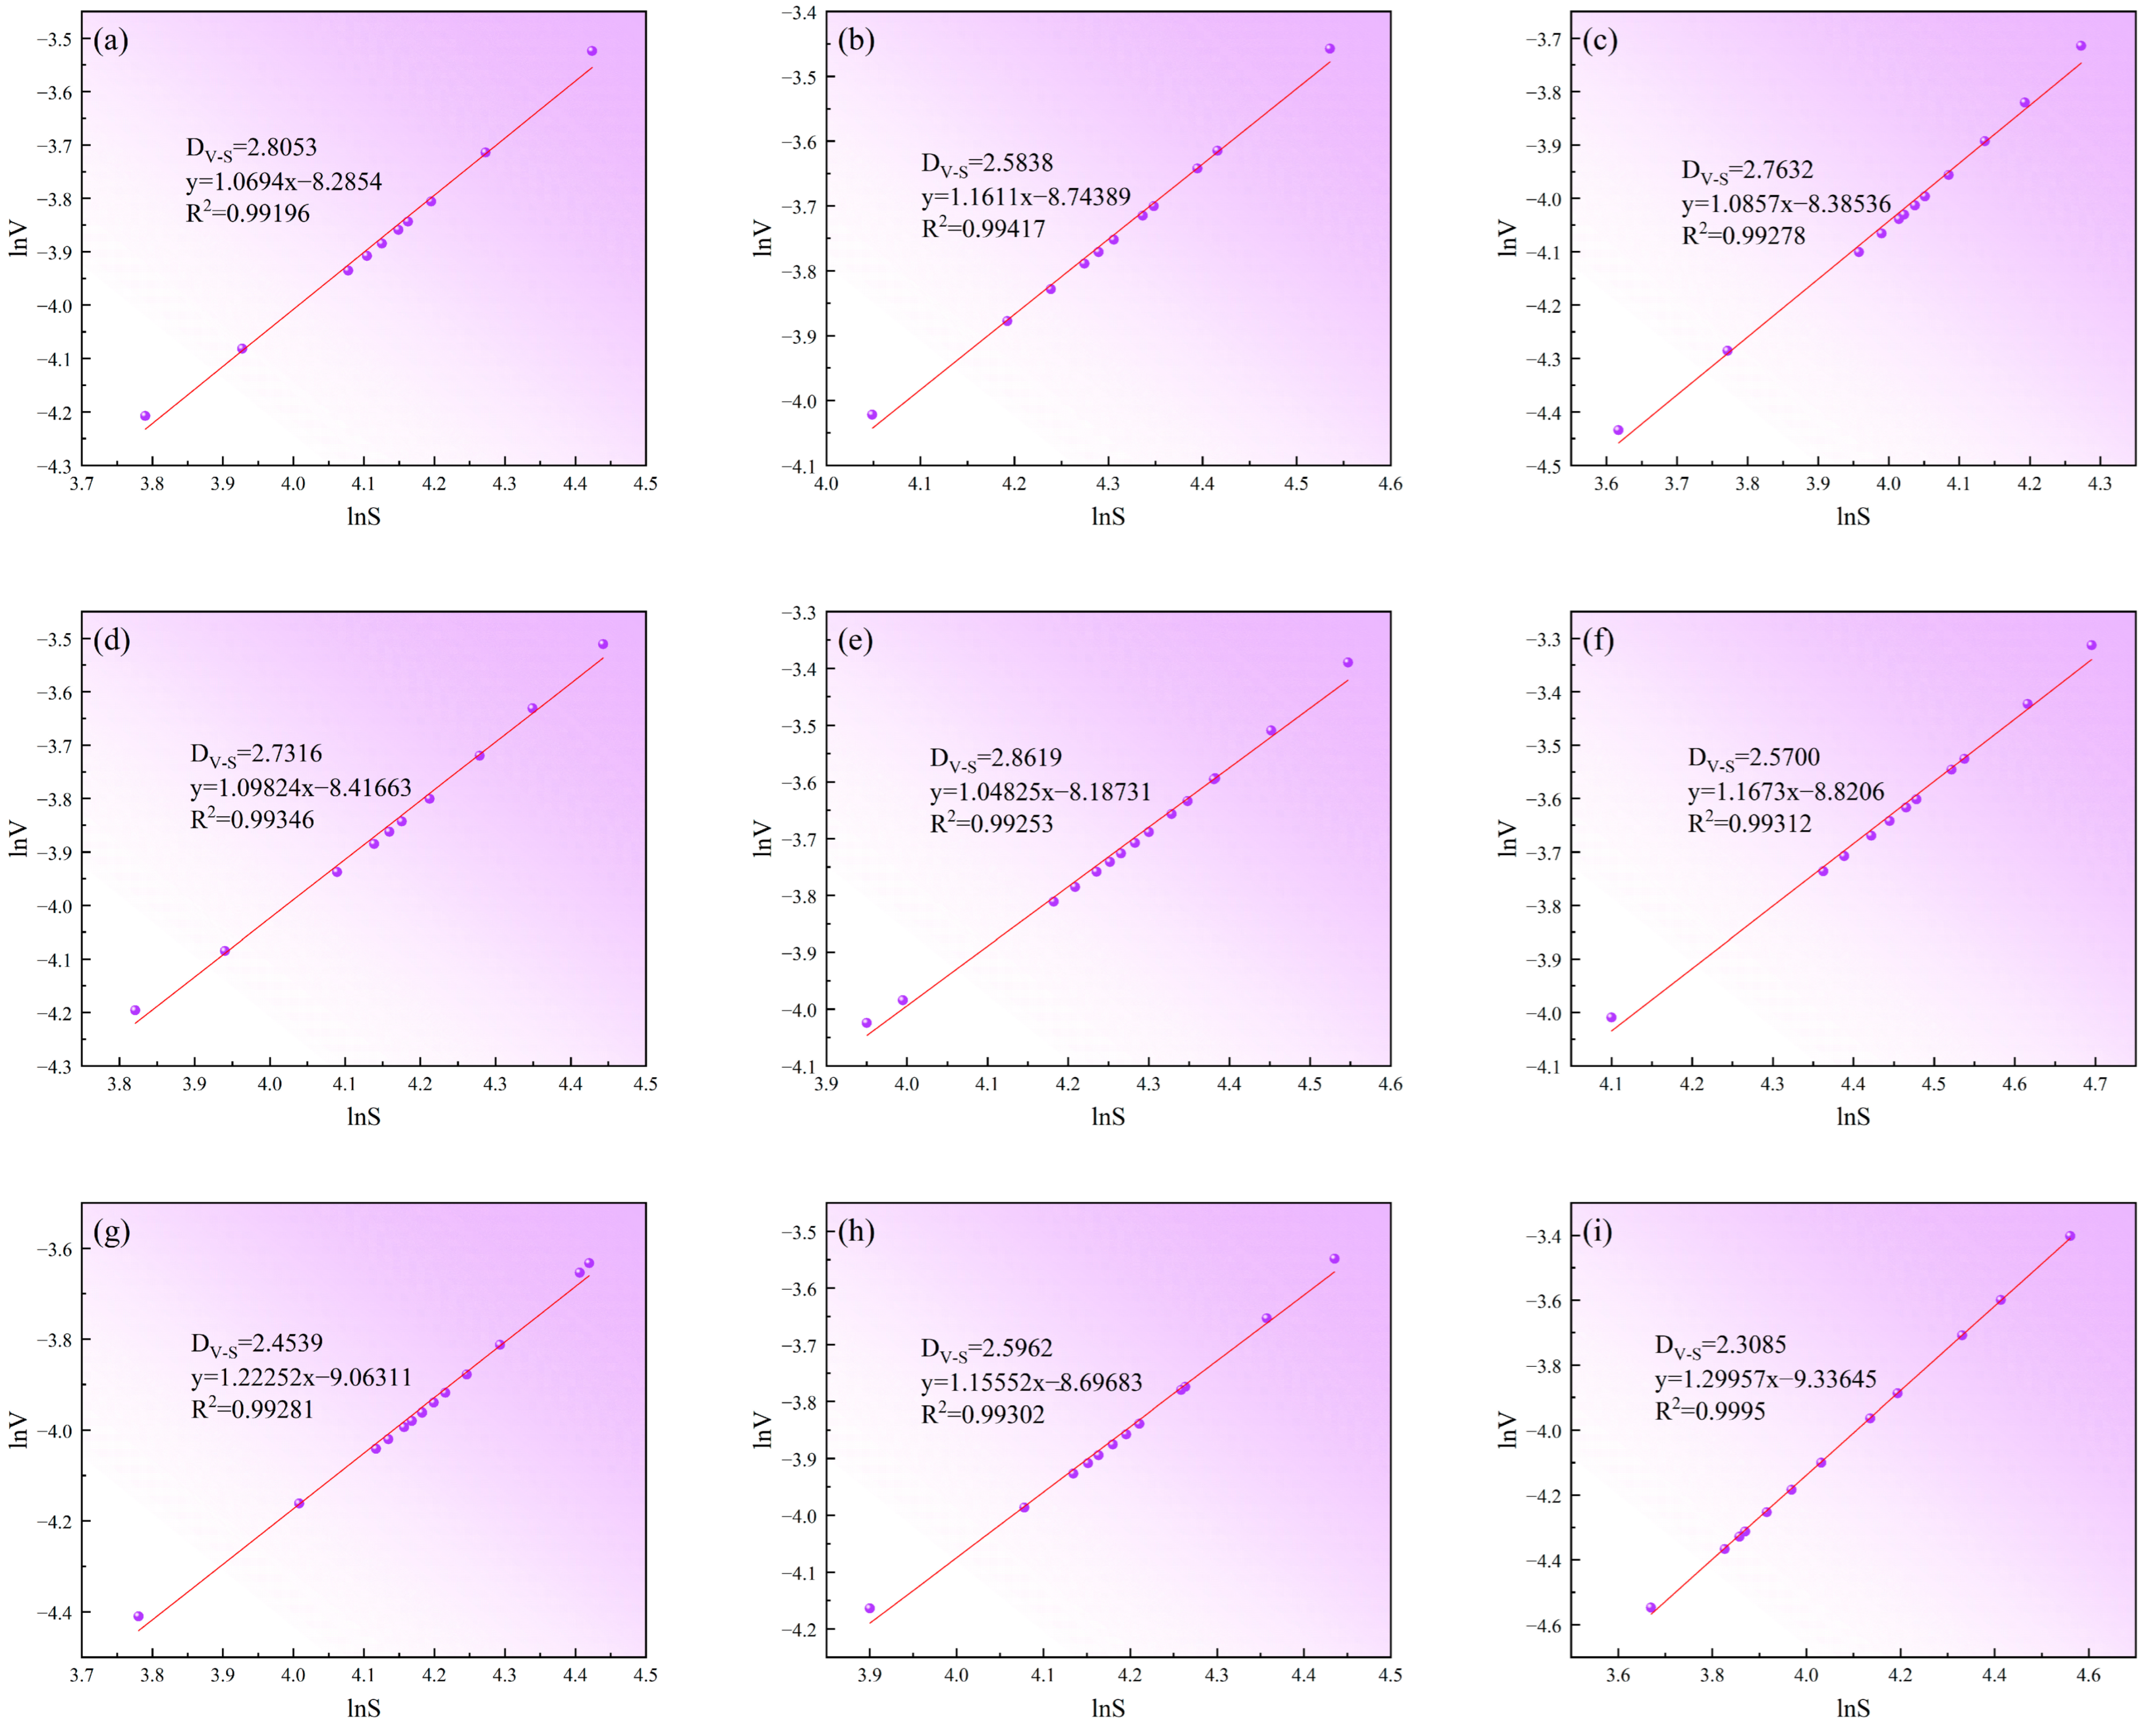
Based on CO2 adsorption data and the V-S model, the micropore fractal dimensions DV-S of the 12 measured coal samples range from 2.3085 to 2.8619, all falling between 2 and 3, with fitting coefficients of determination (R2) > 0.99 (Table 4, Figure 9). These high correlation coefficients confirm a strong linear relationship between lnV and lnS, demonstrating that the micropore systems of both seams exhibit distinct fractal characteristics and that the V-S model is well suited for characterizing their micropore fractal properties [23,24].
Table 4.
Fractal dimensions calculated from FHH and V-S models.
Figure 9.
Representative V-S fractal fitting curves derived from CO2 adsorption data for No. 5 and No. 8 coals in the Yichuan area. (a–c) No. 5 coal samples; (d–i) No. 8 coal samples.
A higher micropore fractal dimension generally reflects a more complex pore surface and, for a given pore volume, a larger adsorption surface area [43,44]. The DV-S values of the No. 5 coal range from 2.5265 to 2.8053 (avg. 2.6806), whereas those of the No. 8 coal range from 2.3085 to 2.8619 (avg. 2.5879). The higher mean DV-S value of the No. 5 coal indicates rougher micropore surfaces and greater average structural complexity, whereas the wider DV-S range of the No. 8 coal (0.5534 vs. 0.2788) reflects stronger sample-to-sample variability in micropore heterogeneity.
4.3.2. Mesopore Fractal Characteristics
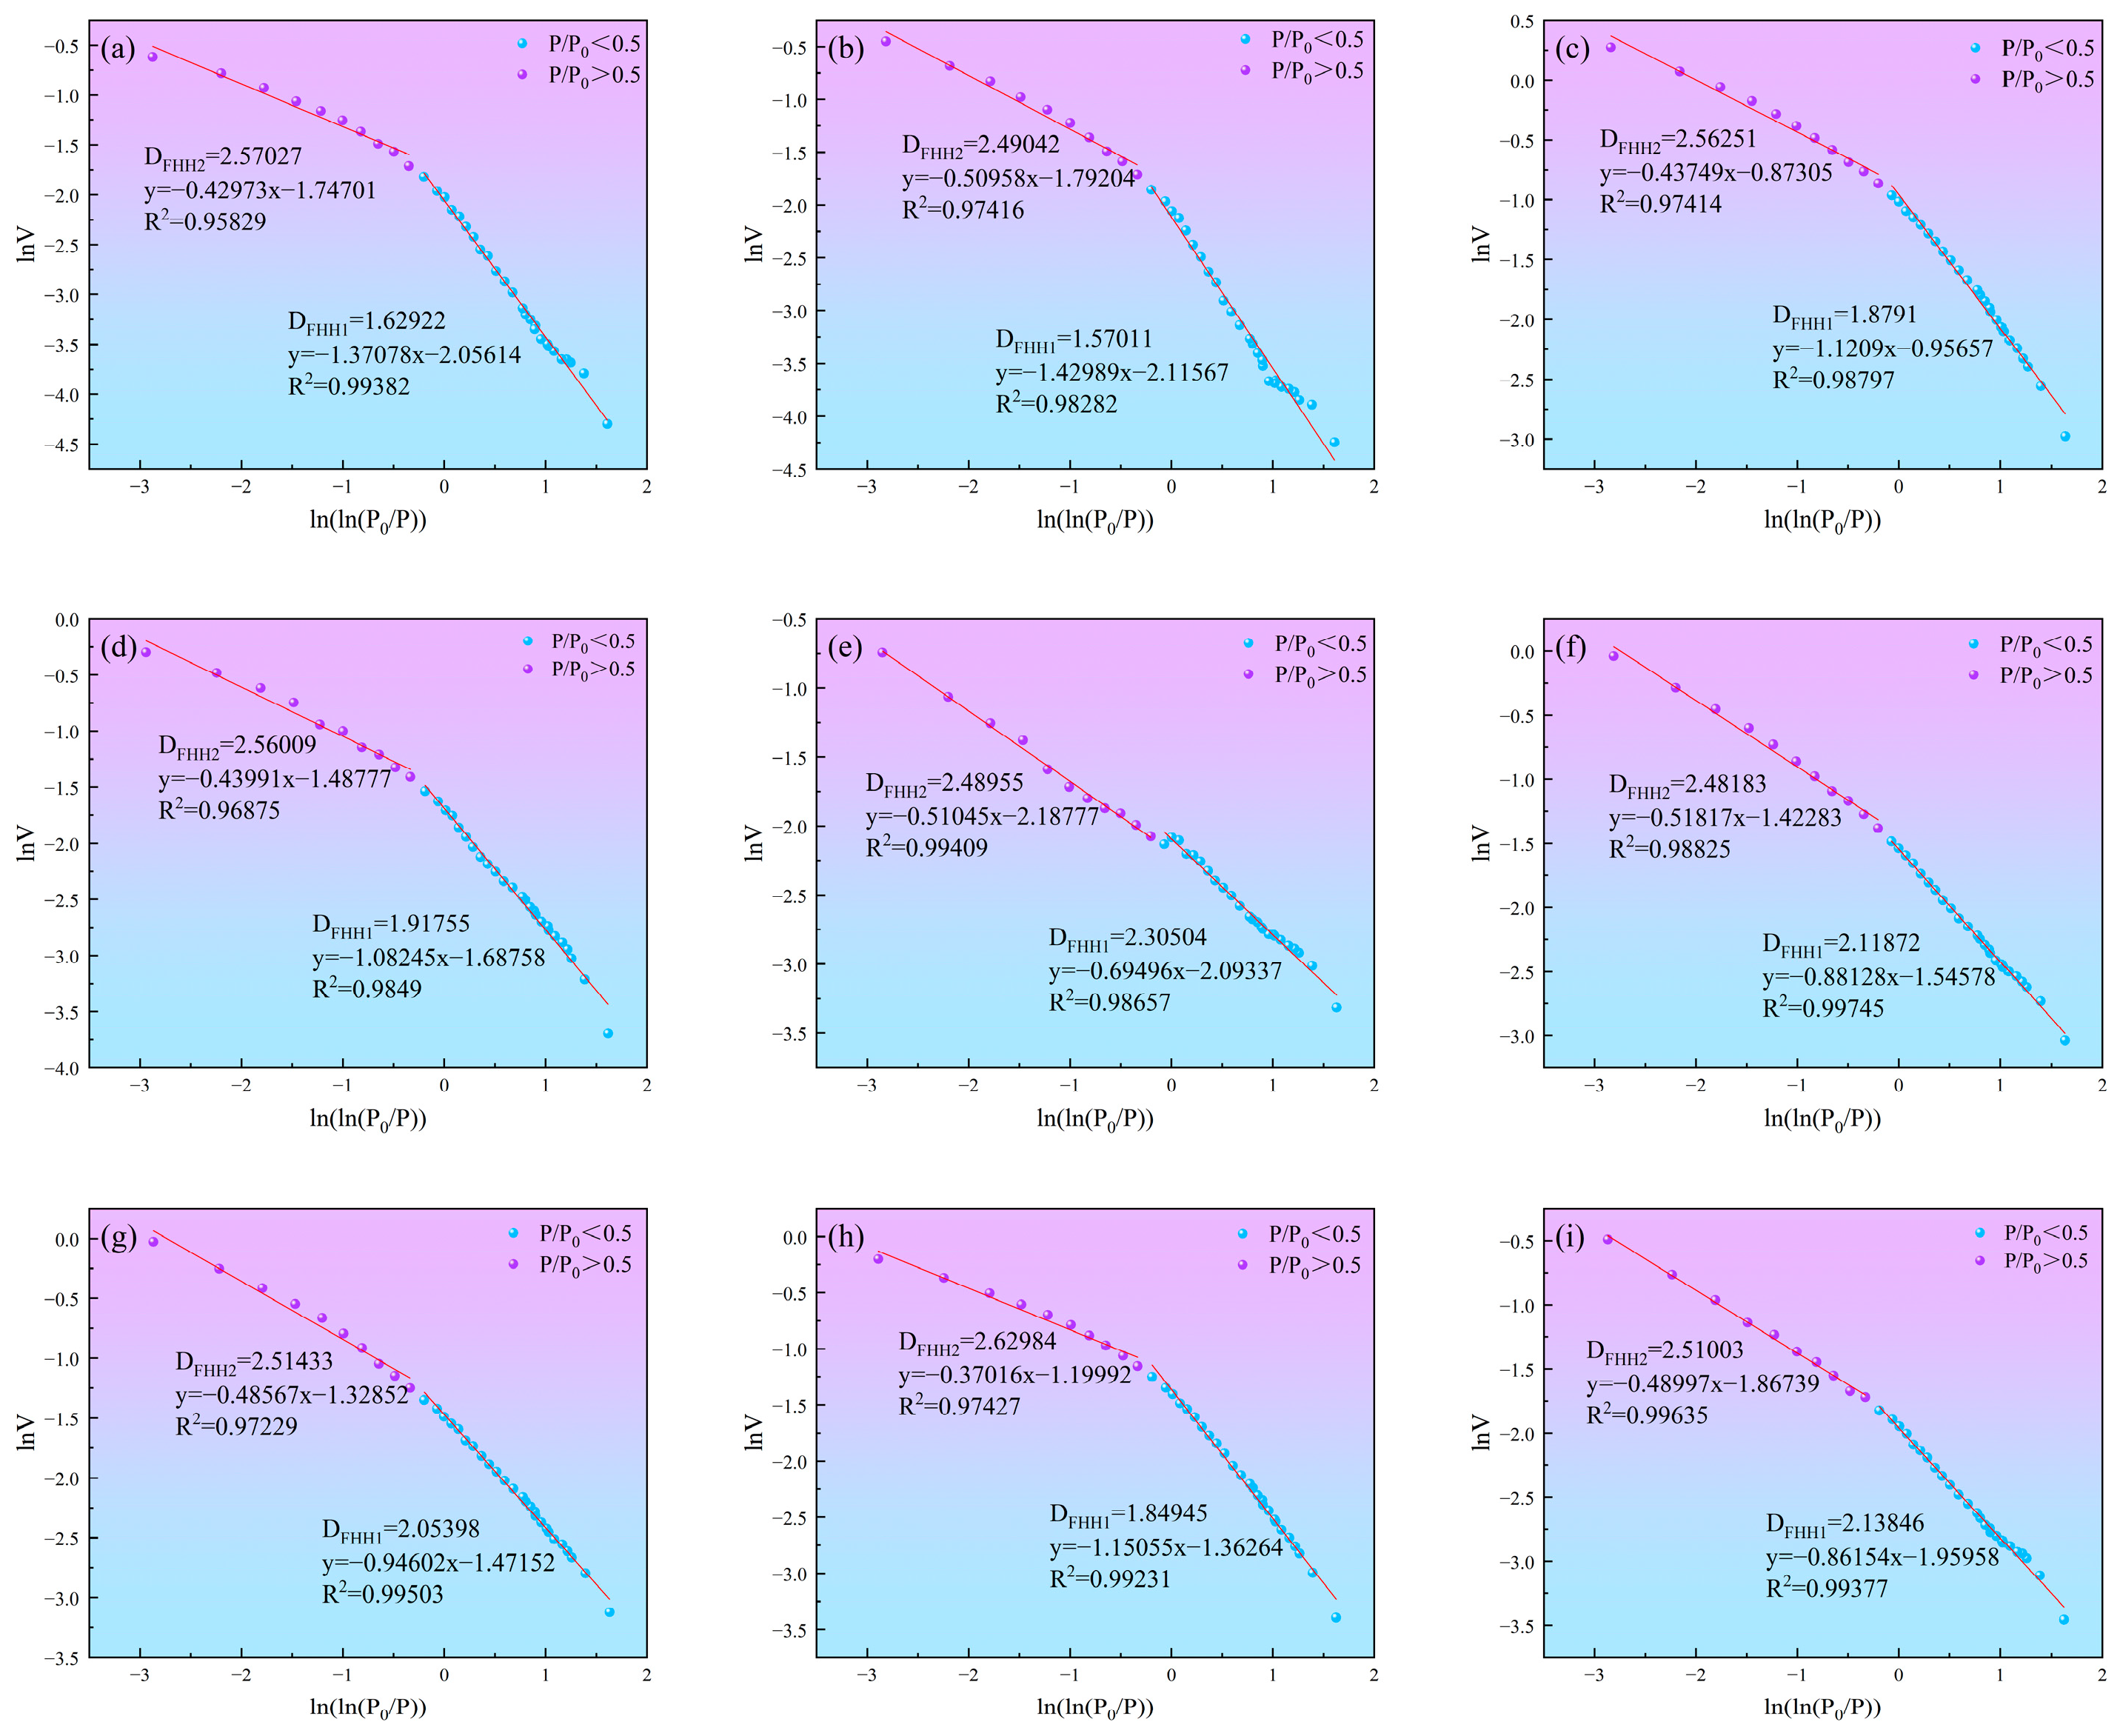
Based on low-temperature N2 adsorption data, the FHH model was used to calculate the fractal dimensions of 12 coal samples at different relative pressure stages. The DFHH1 and DFHH2 values calculated using the FHH model represent pore fractal characteristics at different adsorption stages. Specifically, DFHH1 mainly reflects pore-surface roughness and adsorption-surface heterogeneity at the low relative pressure stage, whereas DFHH2 mainly reflects pore-body structural complexity and pore-size distribution heterogeneity of mesopores and some macropores at the high relative pressure stage. Compared with DFHH1, DFHH2 can better characterize the influence of mesopore structures on pore complexity and gas diffusion pathways in coal samples.
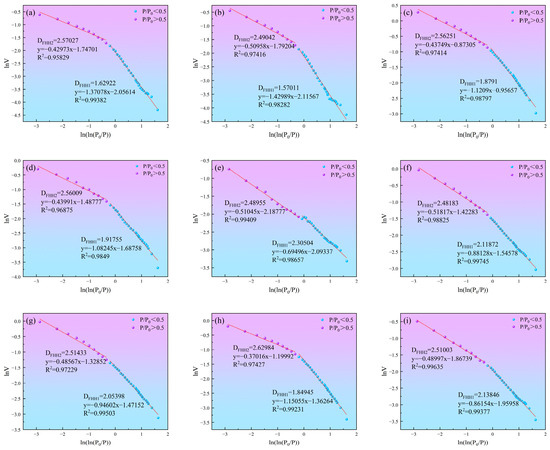
The DFHH2 values range from 2.47390 to 2.85524 (overall avg. 2.56218), all within 2–3, with high fitting reliability (R2 = 0.95490–0.99635), confirming well-defined fractal characteristics for the mesopore–macropore systems (Table 4; Figure 10). The No. 5 coal exhibits a higher average DFHH2 (2.61731) than the No. 8 coal (2.52280), indicating greater mesopore structural complexity and broader pore-size heterogeneity in the No. 5 seam—consistent with its larger mesopore volume and BET surface area (Section 4.3.2). DFHH1 values (1.57011–2.62440) are less diagnostic and are not considered further, as they reflect surface roughness rather than pore-body complexity [25,26,27].
Figure 10.
Representative FHH fractal fitting curves of No. 5 and No. 8 coals in the Yichuan area. (a–c) No. 5 coal samples; (d–i) No. 8 coal samples.
4.3.3. Fractal Characteristics of Pore Throats and Fractures
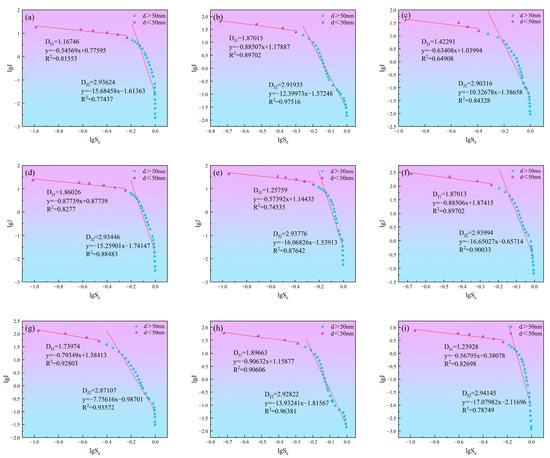
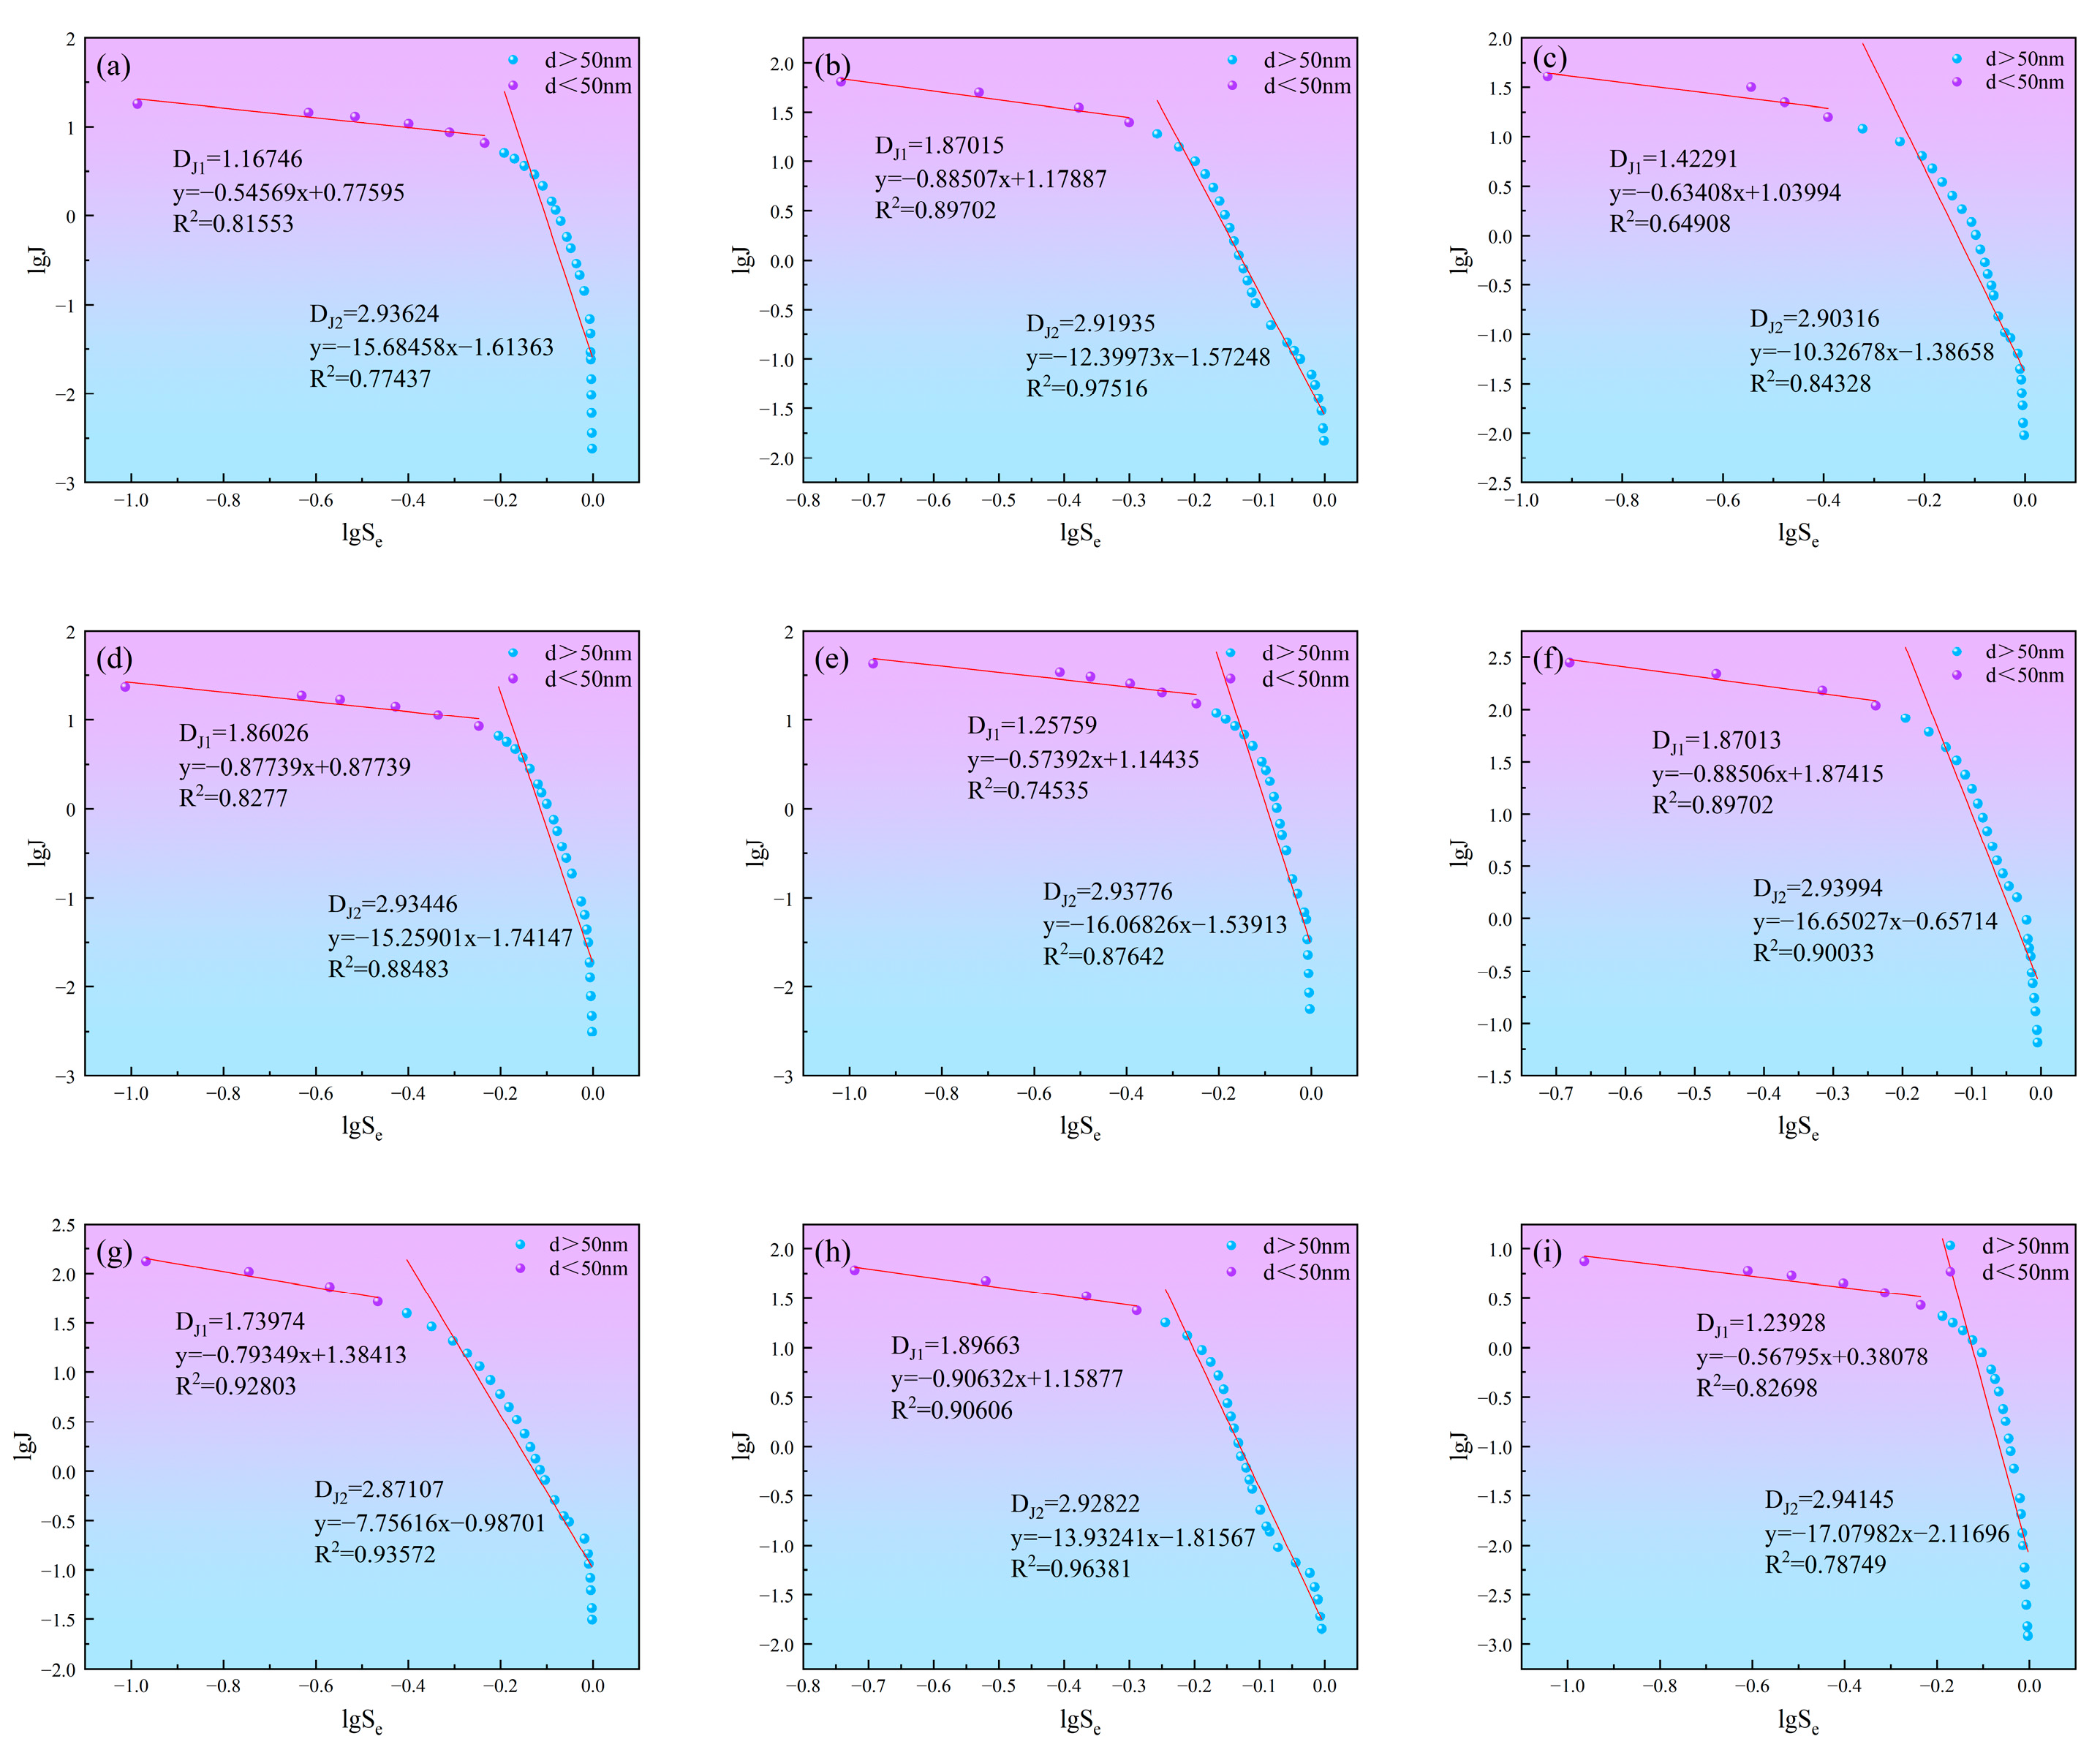
Considering that mercury intrusion curves may be affected by interparticle pore filling at low pressures and matrix compression at high pressures, pore-size intervals with good linear relationships and relatively high fitting coefficients were selected for fractal dimension calculation. The Leverett J-function model yields DJ2 (for d > 50 nm) values ranging from 2.66643 to 2.94145, with an overall average of 2.88021—all within the theoretical range of 2–3 and indicating well-defined fractal characteristics and strong heterogeneity in the macropore–fracture pore-throat systems (Figure 11; Table 5). Specifically, the average DJ2 is 2.85638 for the No. 5 coal and 2.89722 for the No. 8 coal, suggesting that the macropore–fracture pore-throat structure of the No. 8 coal is slightly more complex. Notably, sample A5 exhibits the lowest DJ2 (2.66643), which may reflect limited fracture development or extensive mineral filling in this particular sample.
Figure 11.
Representative J-function fractal fitting curves based on mercury intrusion porosimetry data for No. 5 and No. 8 coals in the Yichuan area. (a–c) No. 5 coal samples; (d–i) No. 8 coal samples.
Table 5.
Fractal dimensions calculated using the J-function model.
For pores smaller than 50 nm, DJ1 ranges from 1.08183 to 2.95003, with an average of 1.69127, showing substantially greater variation and including some values below 2. Because matrix compression may occur under high-pressure conditions (>10 MPa), mercury intrusion volume at these stages may not fully represent the true pore volume [45]. Additionally, the extremely low R2 value for sample A5 in the DJ1 fit (R2 = 0.20221) indicates poor reliability of the smaller-pore fractal dimension. Therefore, DJ1 is used only as an auxiliary indicator, whereas DJ2 is adopted as the primary fractal parameter for characterizing pore-throat heterogeneity.
4.3.4. Integrated Analysis of Multi-Scale Pore Fractal Characteristics
To characterize the multiscale pore complexity of the No. 5 and No. 8 coals, three fractal models were applied: V-S for micropores (CO2 adsorption), FHH for mesopores (N2 adsorption), and J-function for macropores/pore throats (mercury intrusion). These dimensions capture different pore attributes and should not be directly compared numerically.
Multiscale fractal analysis indicates that the No. 5 coal shows higher micropore and mesopore fractal dimensions (DV-S: 2.68056 vs. 2.58793; DFHH2: 2.61731 vs. 2.52280) and moderate macropore fractal dimension (DJ2: 2.85638), supporting the interpretation of relatively well-developed pore–fracture connectivity favorable for gas migration. In contrast, the No. 8 coal, dominated by micropore adsorption space, exhibits a higher J-function dimension (2.89722 vs. 2.85638)—reflecting stronger pore throat heterogeneity rather than better seepage capacity—consistent with a pore structure more favorable for gas adsorption. These interpretations are based on pore structure characteristics and should be regarded as preliminary, pending validation with production data.
5. Discussion
5.1. Influencing Factors of Pore Structure
To clarify the pore structure characteristics of the coal reservoirs in the study area, this paper systematically compares the pore volume, specific surface area (SSA), and coal petrological parameters of the No. 5 and No. 8 coals with previously published data [46,47,48,49] from coals in the Ordos Basin with similar depositional settings (Table 6). The literature data are used only for contextual comparison and are not treated as additional statistical samples or merged with the present dataset for statistical inference. Overall, the pore volumes and SSAs of the coal samples in this study area are generally lower than those of similar coal samples reported in the literature. However, the No. 5 and No. 8 coals show marked differences in pore structure and coal petrological characteristics, which are closely related to their different depositional environments and diagenetic alteration processes.
Table 6.
Comparison of pore structure and coal quality parameters between this study and literature data for No. 5 and No. 8 coals.
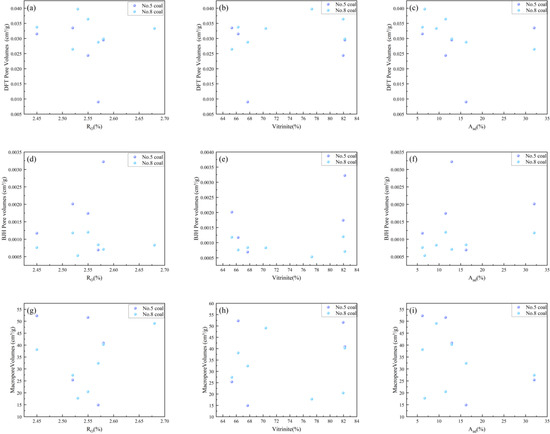
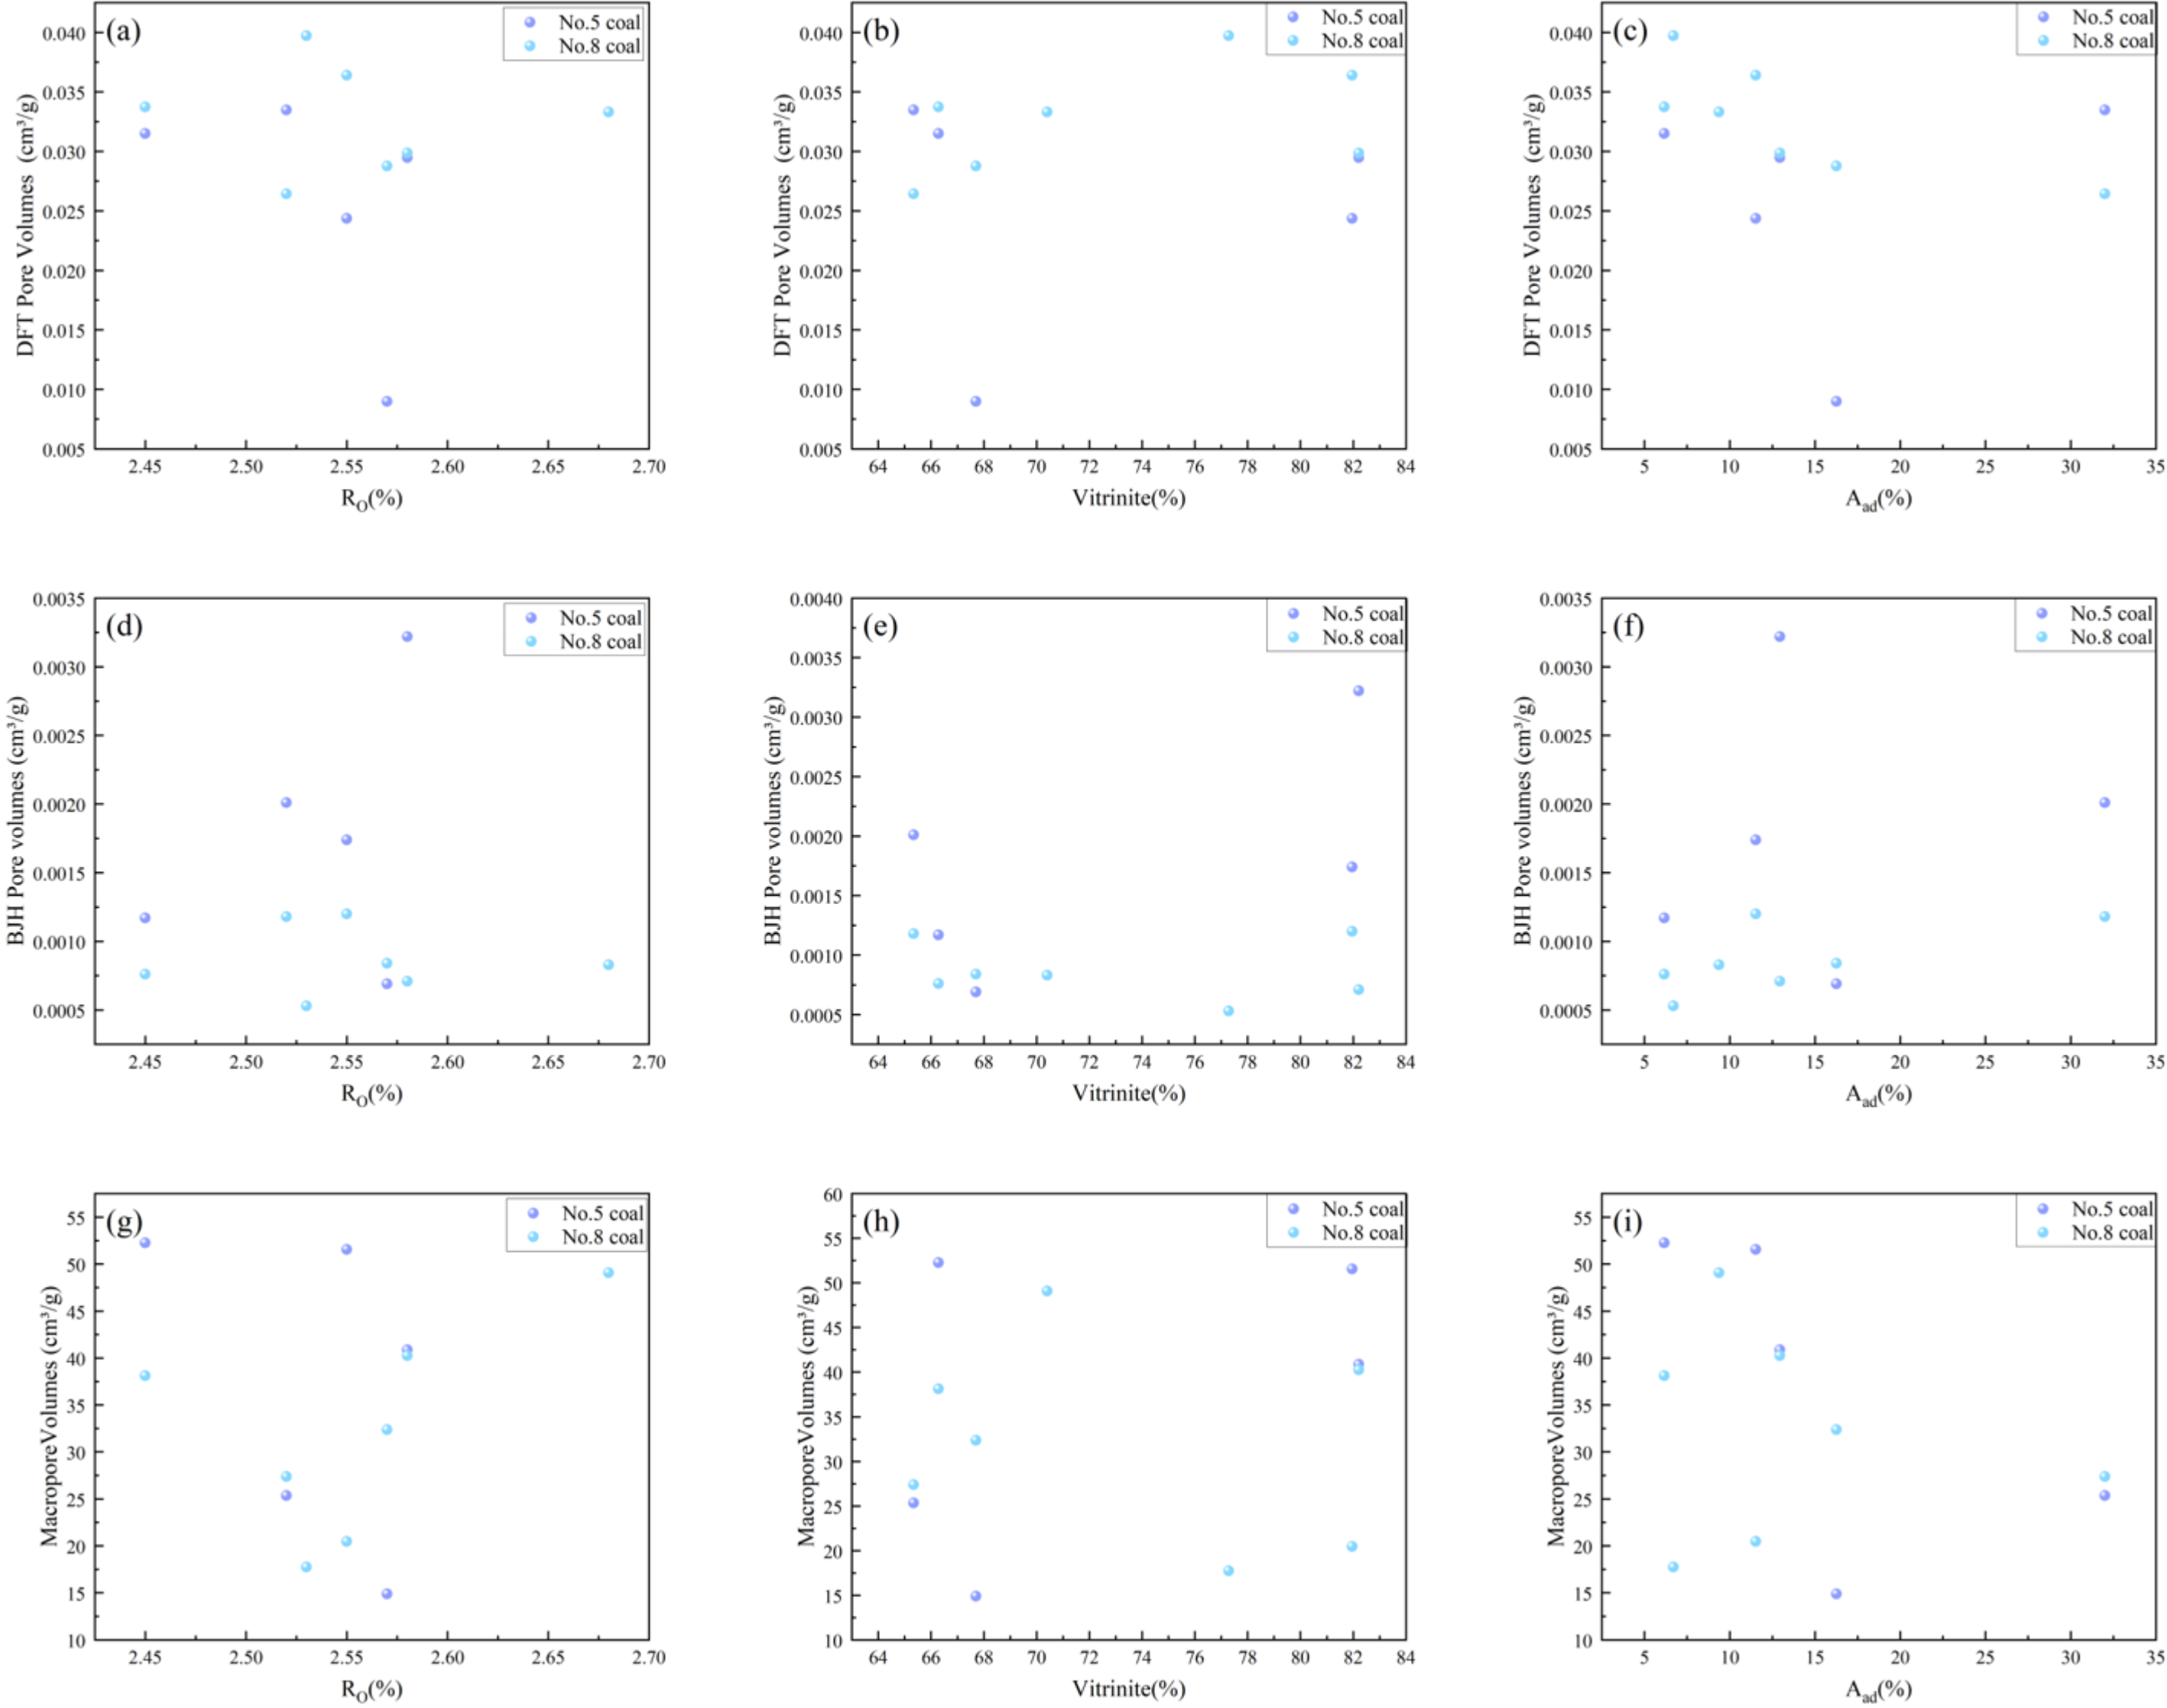
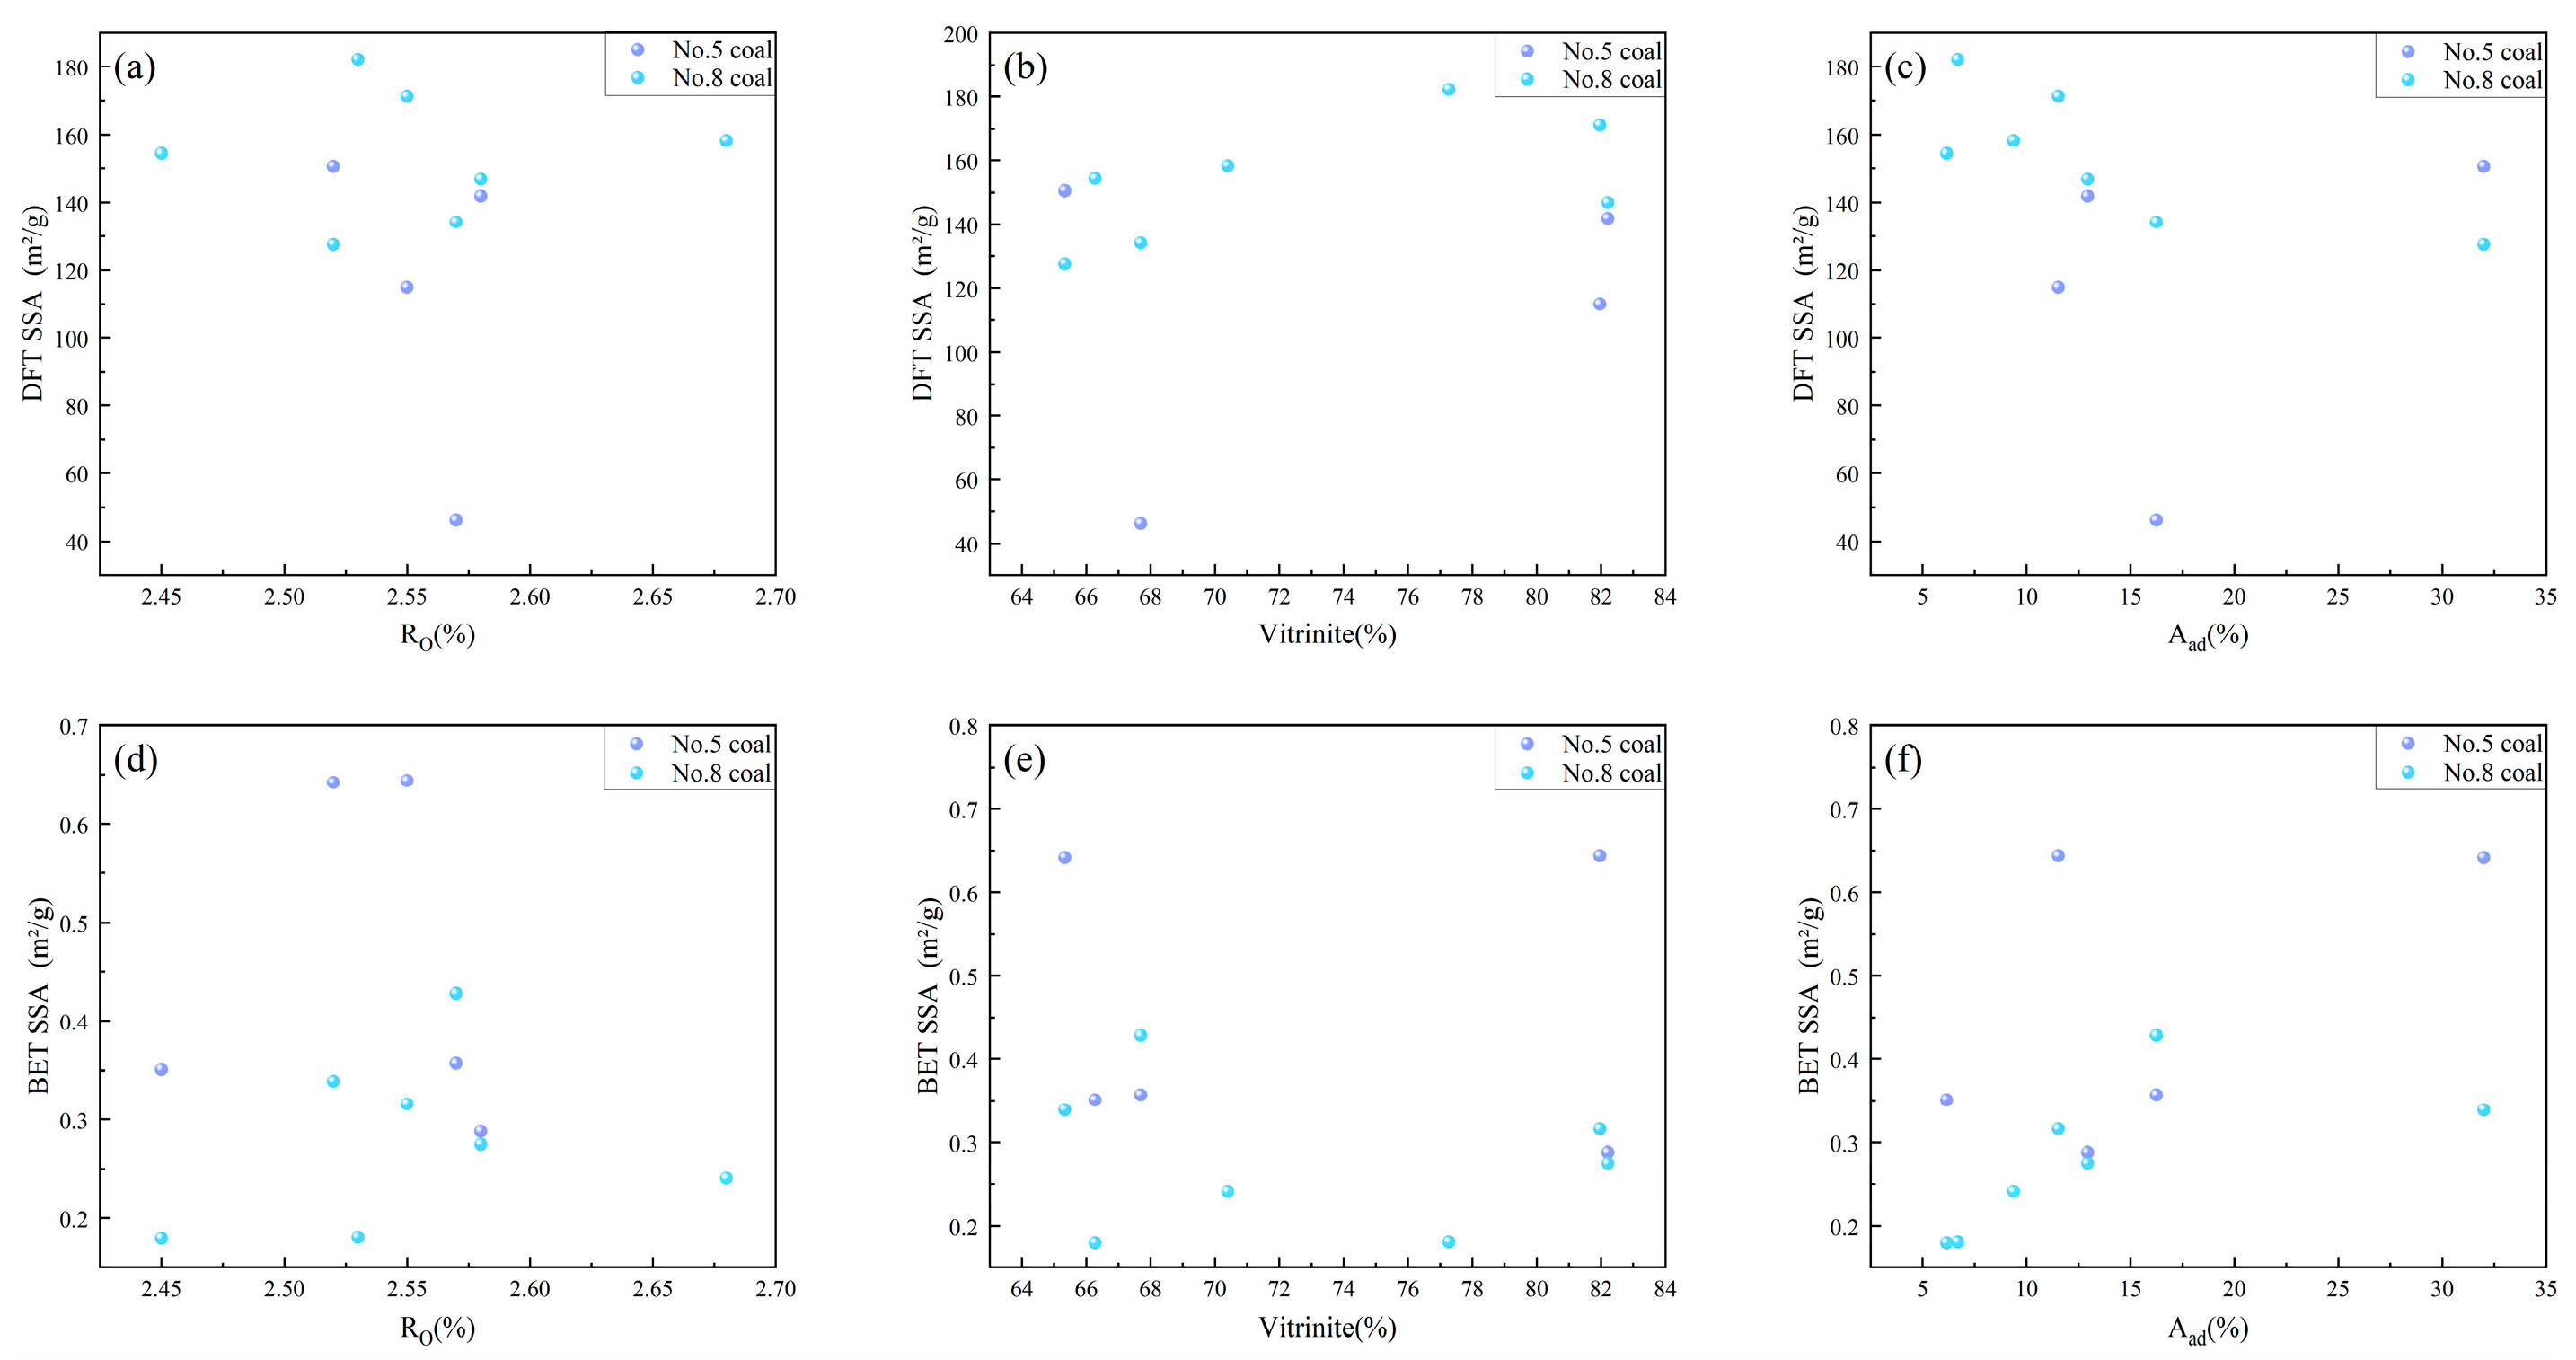
The No. 5 coal formed in a delta front–littoral shallow marine facies belt and was jointly influenced by terrigenous clastic input and seawater. In this study, the mean DFT pore volume, mean BJH pore volume, and mean DFT SSA of the No. 5 coal are 0.0256 cm3/g, 0.0018 cm3/g, and 121.58 m2/g, respectively, all lower than the literature averages (0.0651 cm3/g, 0.002 cm3/g, and 215.72 m2/g, respectively). Its mean ash yield reaches 15.368%, and some samples (e.g., A5, with Aad as high as 30.68%) have anomalously high ash contents. The abundant terrigenous clastic minerals supplied by the delta front environment are highly prone to infilling pore throats during diagenesis, resulting in substantial decreases in SSA and pore volume. Meanwhile, the coal body structure formed in this environment is strongly heterogeneous (the scatter points in Figure 12 and Figure 13 are highly dispersed), and local differences in mineral infilling cause great variations in pore parameters within the same coal seam. In addition, the mean vitrinite content of the No. 5 coal is 70.598%, slightly higher than the literature value (64.812%); however, the higher vitrinite content did not produce a higher pore volume, further confirming the destructive effect of mineral infilling on pores. Figure 4 shows that the permeability of the No. 5 coal ranges from 0.018 to 0.245 mD, which is generally low, also reflecting that its pore connectivity is markedly affected by mineral infilling.
Figure 12.
Scatter plots of pore volumes at different scales versus Ro,max, vitrinite content, and Aad. (a) DFT-PV versus Ro,max; (b) DFT-PV versus vitrinite; (c) DFT-PV versus Aad; (d) BET-PV versus Ro,max; (e) BET-PV versus vitrinite; (f) mesopore volume versus Aad; (g) macropore volume versus Ro,max; (h) macropore volume versus vitrinite; (i) macropore volume versus Aad.
Figure 13.
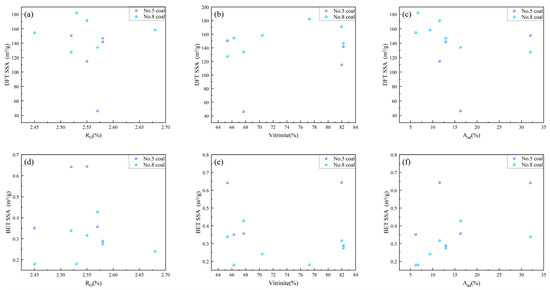
Scatter plots of micropore and mesopore specific surface area versus Ro,max, vitrinite content, and Aad. (a) DFT SSA versus Ro,max; (b) DFT SSA versus vitrinite; (c) DFT SSA versus Aad; (d) BJH SSA versus Ro,max; (e) BJH SSA versus vitrinite; (f) BJH SSA versus Aad.
The No. 8 coal formed in a marine tidal flat–lagoon sedimentary environment, with weak hydrodynamic conditions and relatively strong reducing conditions. In this study, the mean DFT pore volume and mean BET SSA of the No. 8 coal are 0.03261 cm3/g and 0.28 m2/g, respectively, which are also markedly lower than the literature data (means of 0.068 cm3/g and 1.59 m2/g, respectively). Notably, the mean vitrinite content of the No. 8 coal is as high as 73.02%, markedly higher than the literature data (63.96%), whereas the mean Ro,max (2.55%) is markedly lower than that in the literature (2.98%). The tidal flat–lagoon environment is favorable for the enrichment and preservation of vitrinite, but this environment is often accompanied by the formation of fine-grained muddy deposits and authigenic minerals such as pyrite. These fine-grained minerals and sulfides are highly prone to blocking micropores and mesopores during diagenesis, so despite the relatively high vitrinite content, micropore and mesopore volumes did not increase correspondingly. Figure 4 shows that the permeability of the No. 8 coal is extremely low (0.011–0.105 mD), indirectly confirming its poor pore connectivity, which may be markedly affected by fine-grained mineral infilling in the tidal flat facies.
Integrating the characteristics of the No. 5 and No. 8 coals, the marked differences between the data in this study and the literature data are mainly attributed to differences in depositional environment and mineral infilling, coal rank, and maceral composition.
The coal samples covered by the literature data have diverse depositional environments, whereas the No. 5 and No. 8 coals in this study area were controlled by delta front and marine tidal flat–lagoon environments, respectively, with severe infilling by terrigenous clastics and authigenic minerals such as pyrite. This difference in depositional setting led to generally high ash yields of the coal samples in the study area (mean of 15.368% for the No. 5 coal and 13.57% for the No. 8 coal), and mineral infilling blocked numerous pores, making pore volume and SSA generally low.
The literature data cover a wider coal rank range (Ro,max up to more than 3.3%), and high-rank coals generally develop abundant micropores, resulting in generally higher pore volumes and SSAs [50]. Meanwhile, the maceral distribution range in the literature data is wider, and differences in the contribution of different macerals to pores also enlarged the literature data averages. In the study area, the coal rank is relatively concentrated (Ro,max = 2.34–2.68%), and the control of macerals on pores is masked by intense mineral infilling.
In summary, the No. 5 coal is more markedly affected by terrigenous mineral infilling, whereas the No. 8 coal is controlled by fine-grained mineral infilling of the tidal flat facies. Owing to differences in depositional setting, coal rank, and testing models, the literature data cannot directly replace reservoir evaluation in this area.
5.2. Influencing Factors of Fractal Dimensions
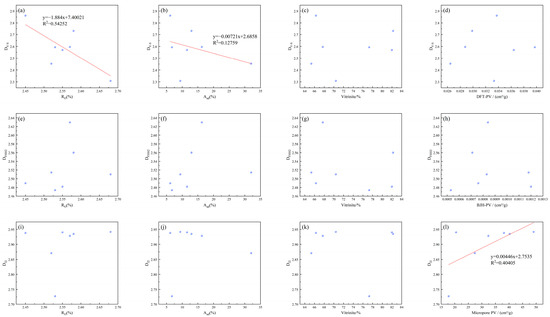
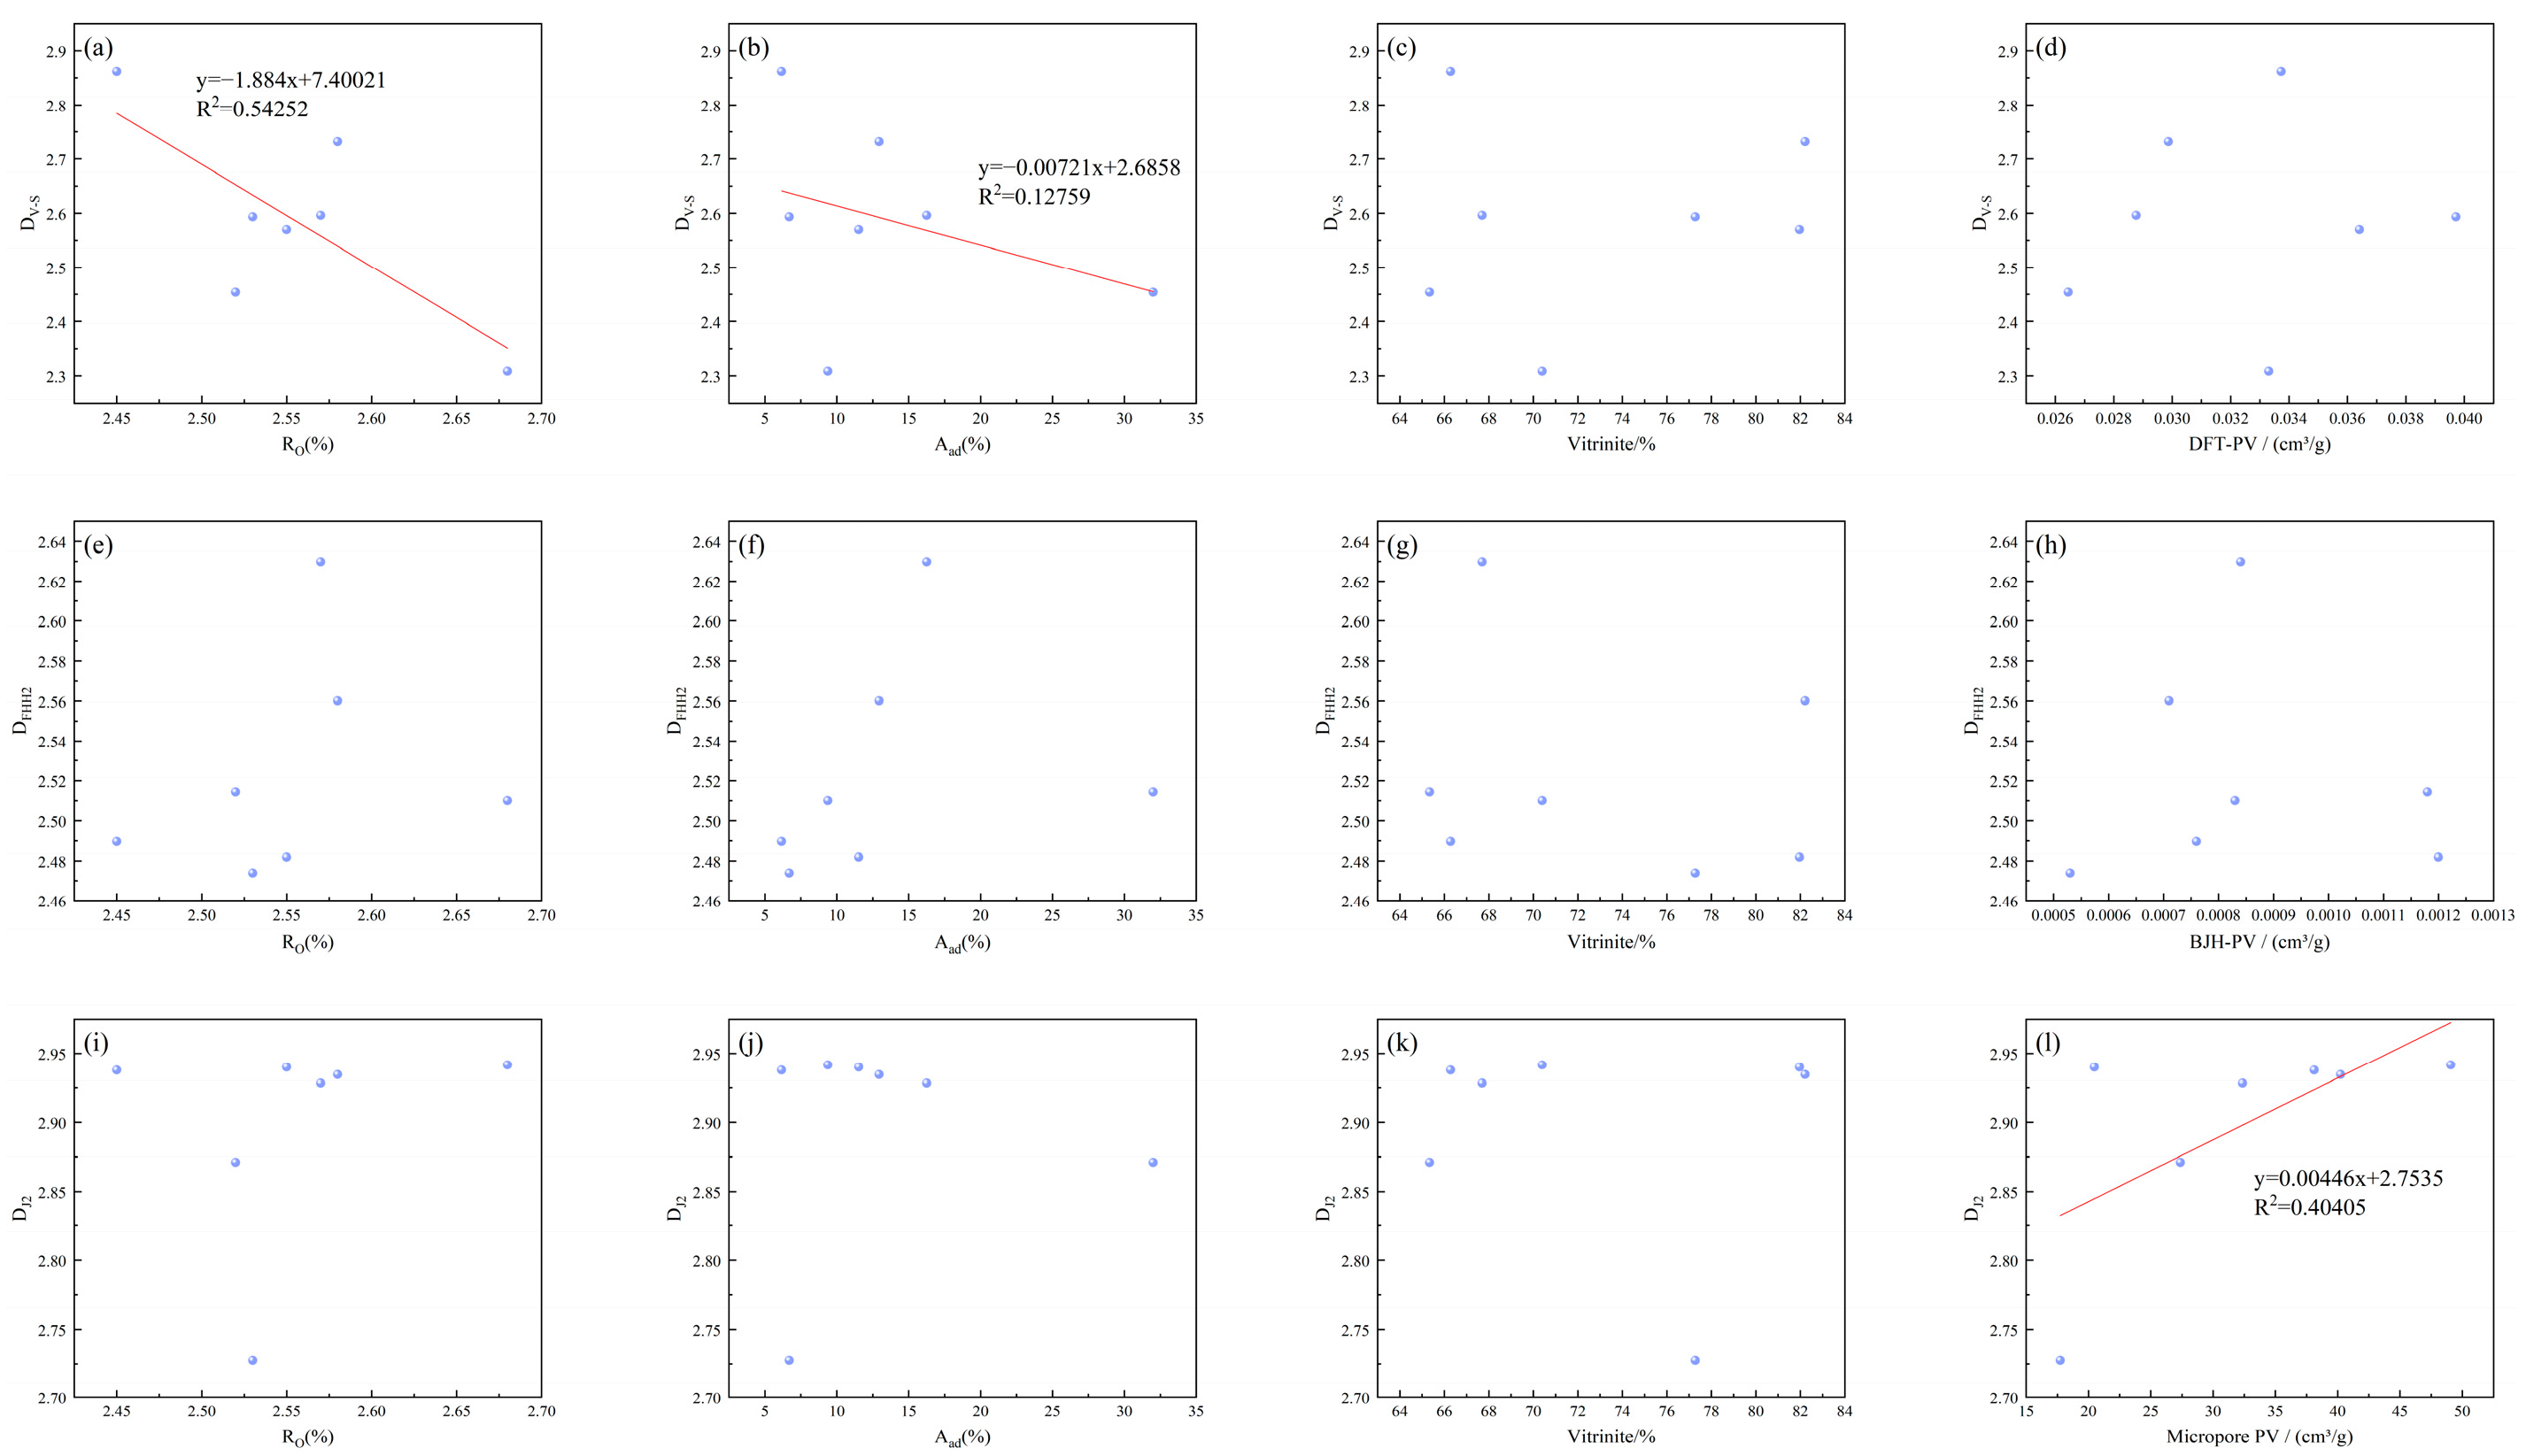
It should be noted that, in the following scatter plots (Figure 14 and Figure 15), the panels without R2 labels indicate poor linear fitting results. However, these panels are retained for comparative purposes and to present a complete picture of the data, allowing for visual inspection of data-point distribution and potential trends.
Figure 14.
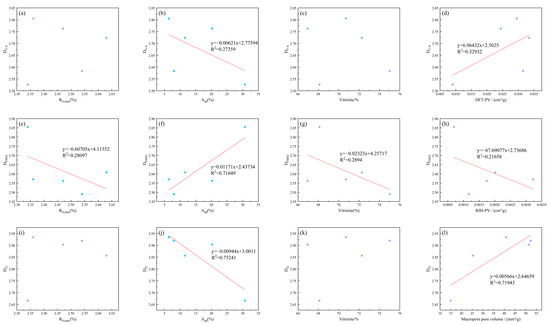
Scatter plots of different fractal dimensions versus Ro,max, ash content, vitrinite content, and corresponding pore volumes for the No. 5 coal: (a) DV-S versus Ro,max; (b) DV-S versus Aad; (c) DV-S versus vitrinite; (d) DV-S versus DFT-PV; (e) DFHH2 versus Ro,max; (f) DFHH2 versus Aad; (g) DFHH2 versus vitrinite; (h) DFHH2 versus BJH-PV; (i) DJ2 versus Ro,max; (j) DJ2 versus Aad; (k) DJ2 versus vitrinite; (l) DJ2 versus macropore PV.
Figure 15.
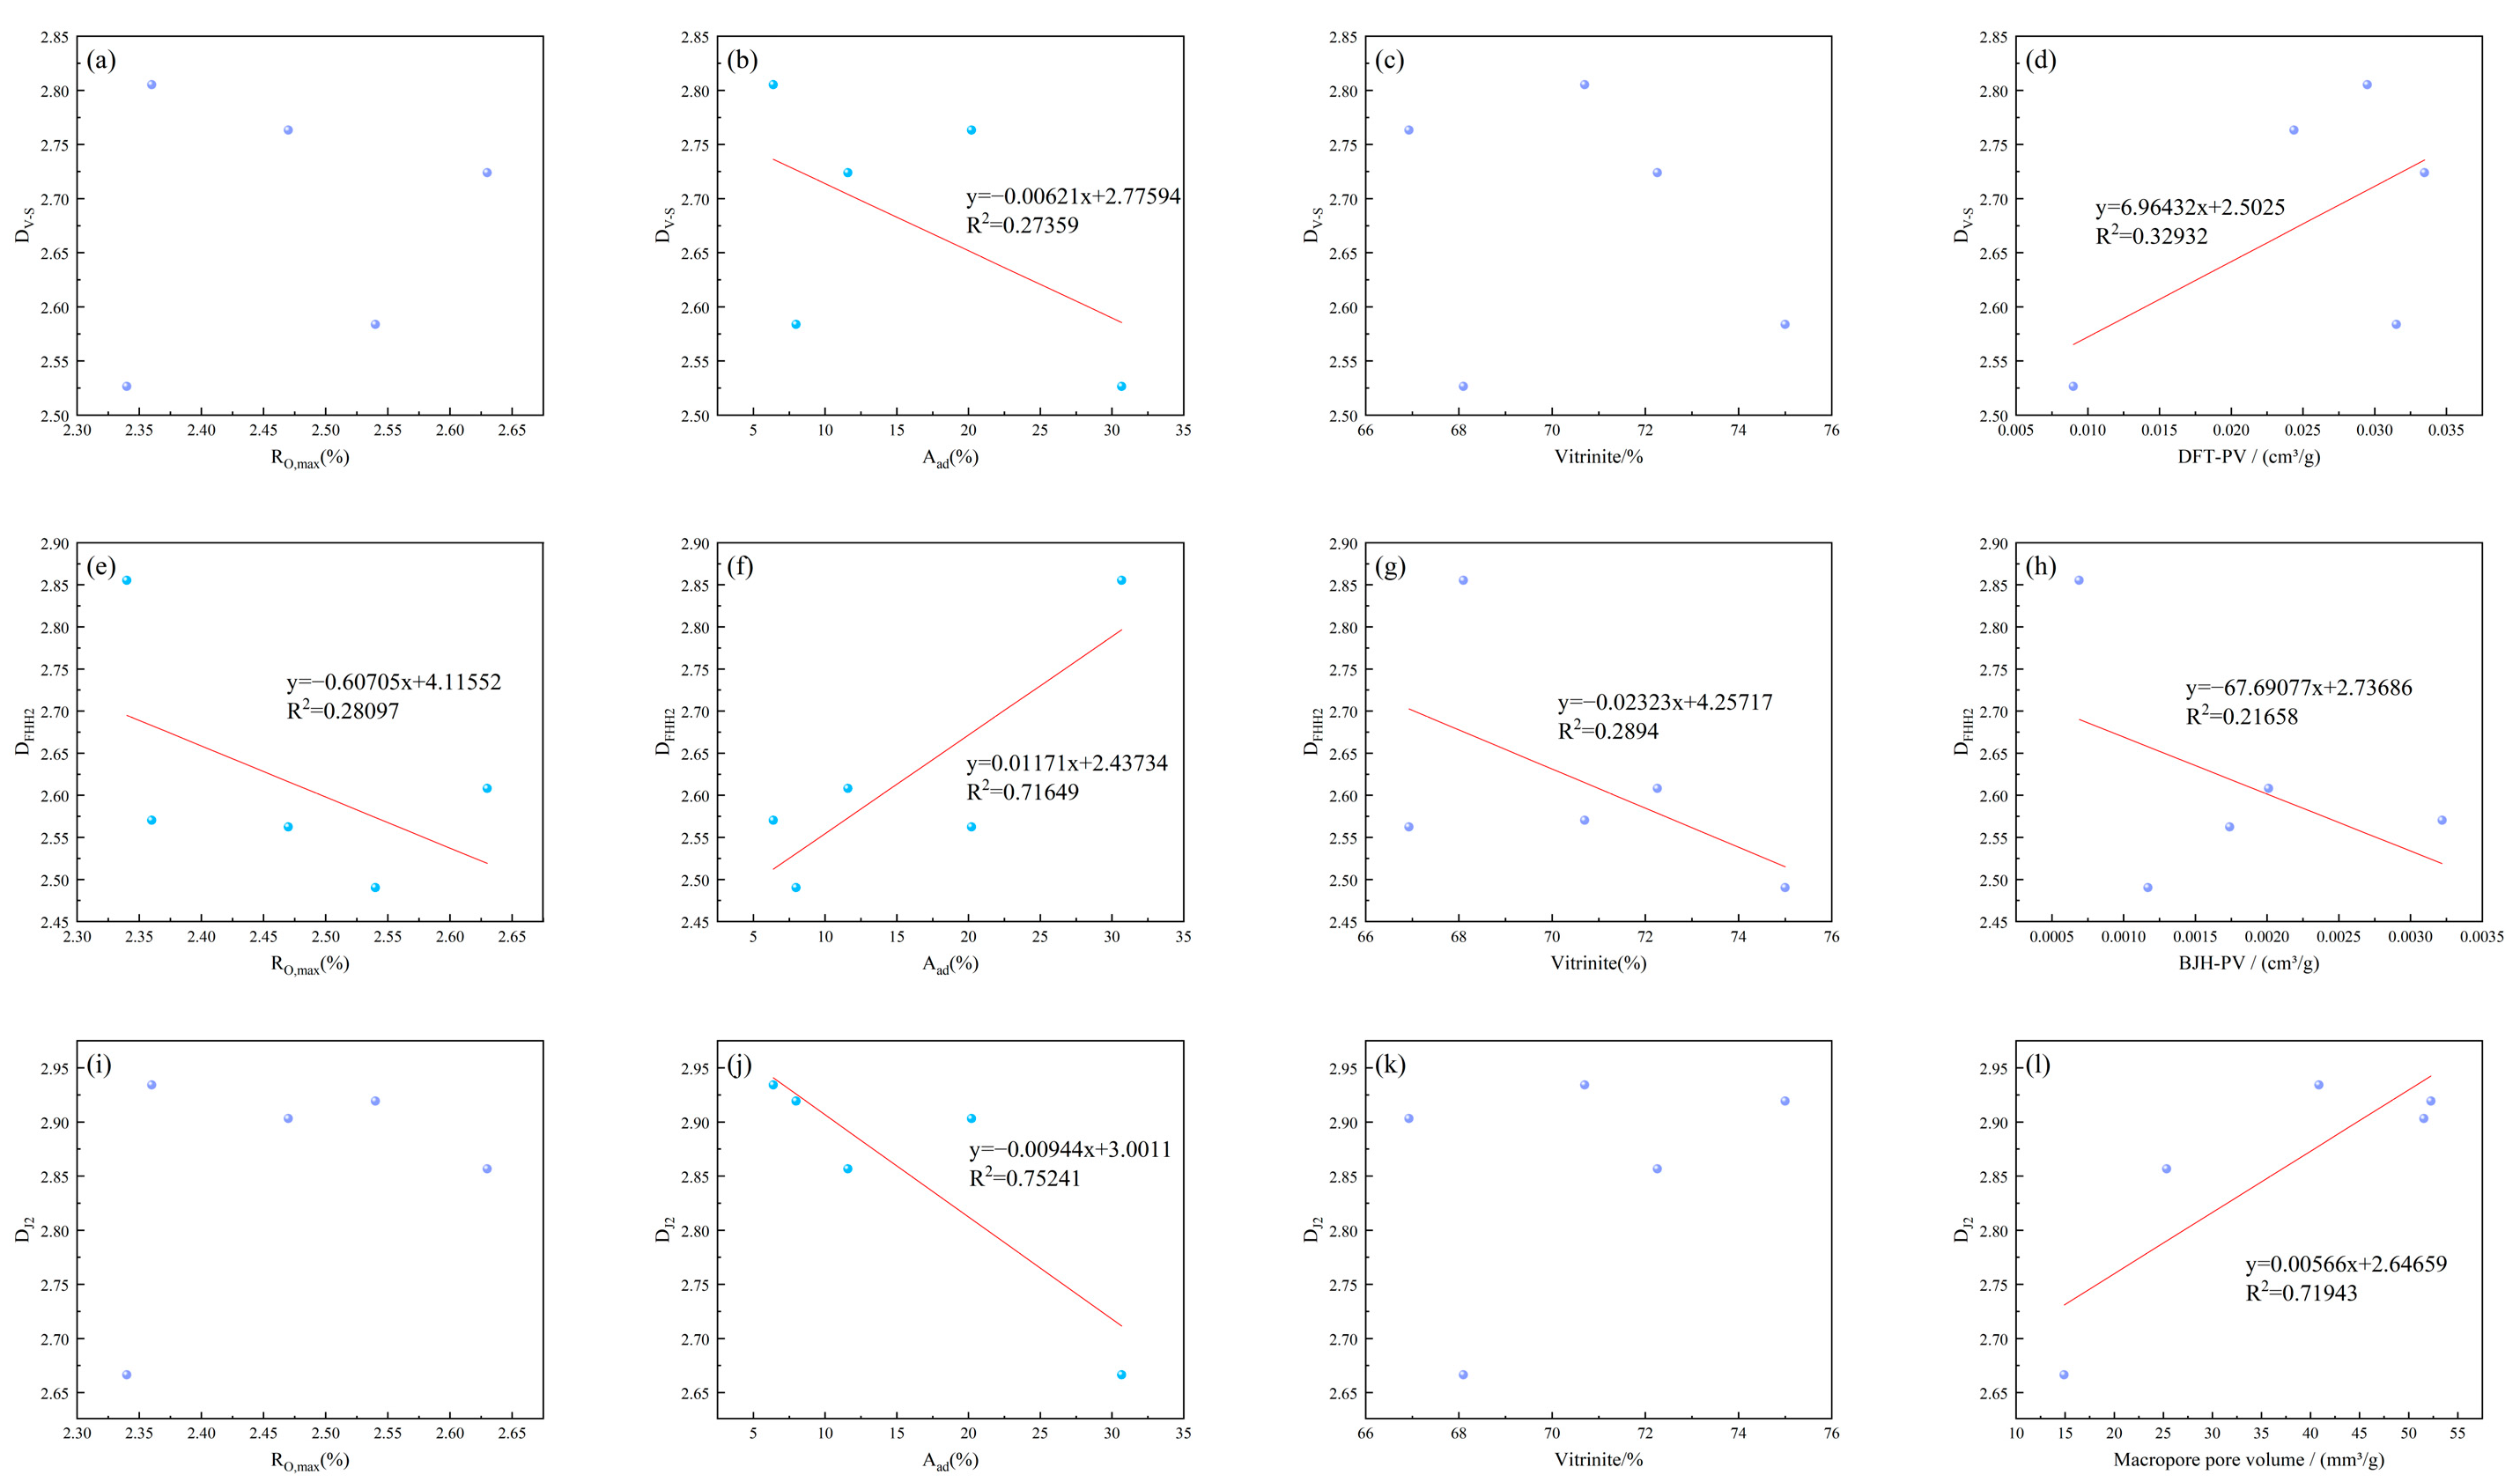
Scatter plots of different fractal dimensions versus Ro,max, ash content, vitrinite content, and corresponding pore volumes for the No. 8 coal: (a) DV-S versus Ro,max; (b) DV-S versus Aad; (c) DV-S versus vitrinite; (d) DV-S versus DFT-PV; (e) DFHH2 versus Ro,max; (f) DFHH2 versus Aad; (g) DFHH2 versus vitrinite; (h) DFHH2 versus BJH-PV; (i) DJ2 versus Ro,max; (j) DJ2 versus Aad; (k) DJ2 versus vitrinite; (l) DJ2 versus macropore PV.
The micropore fractal dimension (Dv-s) does not show a clear linear trend with Ro,max in either seam (Figure 14a and Figure 15a). Regarding the relationship between Dv-s and vitrinite content (Figure 14b and Figure 15b), Dv-s shows no clear linear trend with vitrinite content. The No. 5 coal has relatively high Dv-s at 70–74% vitrinite, while the No. 8 coal is relatively concentrated at >76% vitrinite but still lacks a monotonic trend. Dv-s shows a certain positive correlation with micropore pore volume in both seams (Figure 14d and Figure 15d). The relationship between Dv-s and ash content (Figure 14c and Figure 15c) is complex in both seams, possibly reflecting variations in mineral composition and occurrence state. The mesopore fractal dimension (DFHH2) differs markedly between the two seams. For the No. 5 coal, DFHH2 shows a relatively wide range (2.49–2.86) and exhibits a certain non-monotonic relationship with ash content (Figure 14f) and a negative correlation trend with mesopore pore volume (Figure 14h). For the No. 8 coal, DFHH2 varies within a narrow range (2.47–2.63) and is generally low, showing no clear correlation with any of the examined factors (Figure 15e–h), reflecting that the mesopore system in this seam is poorly developed and structurally relatively simple. The macropore fractal dimension (DJ2) remains at relatively high levels in both seams. For the No. 5 coal, DJ2 (2.67–2.93) shows certain positive correlations with Ro,max (Figure 14i) and macropore pore volume (Figure 14l), and a negative correlation with ash content (Figure 14j). For the No. 8 coal, DJ2 is generally high (2.73–2.94), with weak correlations with the examined factors (Figure 15i–l), except for a slight decrease at the highest ash content (Figure 15j).
The difference in fractal characteristics between the two seams is mainly manifested in the mesopore fractal dimension. The No. 5 coal shows a wider range of DFHH2 (Figure 14e–h) and certain correlations with ash content and mesopore pore volume; in contrast, the No. 8 coal shows a narrow and generally low DFHH2 (Figure 15e–h) with no clear correlations. This difference may be related to their contrasting depositional settings—the delta plain setting of the No. 5 coal favored the development of mesopore systems and increased structural complexity, whereas the marine–continental transitional setting of the No. 8 coal mainly favored the retention and development of micropores, while mesopore systems remained poorly developed. The macropore fractal dimension remains high in both seams, but the No. 5 coal shows certain correlations with Ro,max (Figure 14i) and macropore pore volume (Figure 14l), while the No. 8 coal shows no significant correlations (Figure 15i–l).
It should be noted that the examined factors may themselves be interrelated, and some analyses are limited by the sample size. Therefore, the above trends should be interpreted as associations rather than statistically confirmed correlations.
5.3. Limitation
The primary limitations of this study are as follows:
- (1)
- The conclusions are mainly applicable to high-rank coals with similar depositional settings in the Yichuan area, southeastern Ordos Basin, and should be extrapolated to other regions with caution.
- (2)
- The relatively small sample size limits the statistical power of correlation analyses and precludes robust multivariate statistical analysis. Therefore, the relationships reported in this study are interpreted as descriptive associations rather than formally tested statistical relationships. Comparative statements are expressed descriptively (e.g., marked/apparent differences, no clear trend, or no obvious association), and terms implying statistical significance are avoided where no significance testing was performed. The literature data are used only for contextual comparison and are not treated as additional statistical samples or combined with the present dataset for statistical inference, unless methodological comparability among datasets can be demonstrated.
- (3)
- Coal rank, burial depth, mineral content, and depositional environment are interrelated, and their individual contributions cannot be fully separated with the current dataset. The relationships between these factors and pore structure parameters are therefore interpreted as descriptive associations rather than causal relationships or formally tested correlations. The main aim of this study is to document systematic differences in multiscale pore development between the two seams, rather than to quantitatively attribute the observed variations to any specific factor.
- (4)
- The pore-structure-based classification of reservoir types requires further validation using gas adsorption/desorption or production data.
Future work with larger sample sizes and multivariate statistical methods is needed to further disentangle the contributions of individual factors.
6. Conclusions
The following conclusions can be drawn from this study:
- (1)
- The No. 8 coal exhibits relatively higher CO2-accessible specific surface area and micropore volume than the No. 5 coal, with micropores (<2 nm) accounting for 58–81% of total pore volume versus 49–65% in the No. 5 coal. The No. 5 coal, however, shows greater mesopore (1–4% vs. 1–2%) and macropore (>50 nm: 31–48% vs. 18–41%) proportions, along with higher porosity (2.30% vs. 1.52%) and permeability (0.083 vs. 0.034 mD), reflecting better pore openness and connectivity.
- (2)
- Multi-scale fractal analysis reveals that the No. 5 coal has higher V-S and FHH fractal dimensions, indicating greater micropore–mesopore structural complexity, whereas the No. 8 coal exhibits a higher J-function fractal dimension, reflecting stronger pore-throat heterogeneity rather than superior seepage.
- (3)
- Compared with published data, the No. 5 and No. 8 coals in the study area generally have lower pore volumes and specific surface areas. The No. 5 coal was mainly affected by terrigenous mineral infilling in a delta front–littoral shallow marine setting, whereas the No. 8 coal was controlled by fine-grained mud and pyrite infilling in a marine tidal flat–lagoon setting. Although the No. 8 coal has higher vitrinite content, its micropore and mesopore volumes did not increase correspondingly due to mineral blockage. These differences are mainly attributed to the depositional environment, mineral infilling, coal rank, and maceral composition.
- (4)
- The micropore fractal dimension DV-S shows a certain positive correlation trend with coalification degree and vitrinite content, whereas ash yield and moisture content generally show negative correlation trends. The mesopore fractal dimension DFHH2 is strongly associated with mineral matter and hydrophilic pores. The macropore fractal dimension DJ2 is mainly associated with coalification degree, inertinite content, fractures, and mineral filling, with mineral filling showing a dual effect.
Author Contributions
Conceptualization, J.Z.; Methodology, J.Z.; Validation, L.X. and Y.Z.; Formal analysis, S.C.; Investigation, C.W.; Resources, S.T.; Data curation, L.X.; Writing—original draft preparation, J.Z.; Writing—review and editing, S.T.; Visualization, Y.Z.; Supervision, S.T. and S.C.; Project administration, S.T.; Funding acquisition, S.T. All authors have read and agreed to the published version of the manuscript.
Funding
The research was financially supported by the Oil & Gas Major Project (Grant No. 2025ZD1404202) and the National Natural Science of China (Grant No. 42372196).
Institutional Review Board Statement
Not applicable.
Informed Consent Statement
Not applicable.
Data Availability Statement
The data presented in this study are available on request from the corresponding author.
Conflicts of Interest
The authors declare no conflicts of interest.
References
- Clarkson, C.R.; Freeman, M.; He, L.; Agamalian, M.; Melnichenko, Y.B.; Mastalerz, M.; Bustin, R.M.; Radliński, A.P.; Blach, T.P. Characterization of tight gas reservoir pore structure using USANS/SANS and gas adsorption analysis. Fuel 2012, 95, 371–385. [Google Scholar] [CrossRef] [Scilit]
- Mastalerz, M.; Drobniak, A.; Strąpoć, D.; Solano-Acosta, W.; Rupp, J. Variations in pore characteristics in high volatile bituminous coals: Implications for coal bed gas content. Int. J. Coal Geol. 2008, 76, 205–216. [Google Scholar] [CrossRef] [Scilit]
- Clarkson, C.R.; Bustin, R.M. Variation in micropore capacity and size distribution with composition in bituminous coal of the Western Canadian Sedimentary Basin: Implications for coalbed methane potential. Fuel 1996, 75, 1483–1498. [Google Scholar] [CrossRef] [Scilit]
- Guan, Y.; Guo, Q.; Pu, R.; Gao, X.; Chen, S.; Ji, T. Distribution of Upper Paleozoic Coal Seams in the Southeastern Ordos Basin. Energies 2022, 15, 5110. [Google Scholar] [CrossRef] [Scilit]
- Chen, Y.; Tang, D.Z.; Xu, H.; Li, Y.; Meng, Y.J. Structural controls on coalbed methane accumulation and high production models in the eastern margin of Ordos Basin, China. J. Nat. Gas Sci. Eng. 2015, 23, 524–537. [Google Scholar] [CrossRef] [Scilit]
- Li, B.; Guo, Y.Q.; Hu, X.; Wang, T.; Wang, R.; Chen, X.; Fan, W.; Deng, Z. Pore Structure and Heterogeneity Characteristics of Deep Coal Reservoirs: A Case Study of the Daning–Jixian Block on the Southeastern Margin of the Ordos Basin. Minerals 2025, 15, 116. [Google Scholar] [CrossRef] [Scilit]
- Zhang, B.; Wang, H.; Sun, B.; Ouyang, Z.; Dou, W.; Wang, B.; Lai, P.; Hu, Z.; Luo, B.; Yang, M.; et al. Pore Size Distribution and Fractal Characteristics of Deep Coal in the Daning–Jixian Block on the Eastern Margin of the Ordos Basin. ACS Omega 2024, 9, 32837–32852. [Google Scholar] [CrossRef] [Scilit]
- Sing, K.S.W.; Everett, D.H.; Haul, R.A.W.; Moscou, L.; Pierotti, R.A.; Rouquerol, J.; Siemieniewska, T. Reporting physisorption data for gas/solid systems with special reference to the determination of surface area and porosity. Pure Appl. Chem. 1985, 57, 603–619. [Google Scholar] [CrossRef] [Scilit]
- He, C.Z.; Hua, M.Q. Fractal Geometry Description of Reservoir Pore Structure. Oil Gas Geol. 1998, 19, 15–23. (In Chinese) [Google Scholar]
- Adeoti, L.; Ayolabi, E.A.; James, L. An Innovative Technique for Estimating Water Saturation from Capillary Pressure in Clastic Reservoirs. J. Afr. Earth Sci. 2017, 135, 41–53. [Google Scholar] [CrossRef] [Scilit]
- Pfeifer, P.; Avnir, D. Chemistry in noninteger dimensions between two and three. I. Fractal theory of heterogeneous surfaces. J. Chem. Phys. 1983, 79, 3558–3565. [Google Scholar] [CrossRef] [Scilit]
- Avnir, D.; Jaroniec, M. An isotherm equation for adsorption on fractal surfaces of heterogeneous porous materials. Langmuir 1989, 5, 1431–1433. [Google Scholar] [CrossRef] [Scilit]
- Yao, Y.; Liu, D.; Tang, D.; Tang, S.; Huang, W. Fractal characterization of adsorption-pores of coals from North China: An investigation on CH4 adsorption capacity of coals. Int. J. Coal Geol. 2008, 73, 27–42. [Google Scholar] [CrossRef] [Scilit]
- Yang, X.C.; Qu, Z.H.; Jiang, B.; Zhou, K.; Zhang, J.K. Mesozoic–Cenozoic structural features and their evolution in Daning–Jixian area, Shanxi. Coal Geol. China 2013, 25, 1–6. (In Chinese) [Google Scholar]
- Yan, T.; He, S.; Zheng, S.; Bai, Y.; Chen, W.; Meng, Y.; Jin, S.; Yao, H.; Jia, X. Critical tectonic events and their geological controls on deep buried coalbed methane accumulation in Daning–Jixian Block, eastern Ordos Basin. Front. Earth Sci. 2023, 17, 197–217. [Google Scholar] [CrossRef] [Scilit]
- Li, C.; Jiang, B.; Ju, W.; Cheng, G.; Song, Y. Characteristics of tectonic deformation in the Daning-Jixian region, eastern Ordos Basin: Implications for the exploration and development of coalbed methane. Energy Explor. Exploit. 2019, 37, 907–921. [Google Scholar] [CrossRef] [Scilit]
- Tian, W.; Zhao, S.; Tian, F.; Li, X.; Huo, W.; Zhong, G.; Li, S. Symbiotic Combination and Accumulation of Coal Measure Gas in the Daning–Jixian Block, Eastern Margin of Ordos Basin, China. Energies 2023, 16, 1737. [Google Scholar] [CrossRef] [Scilit]
- GB/T 212-2008; Proximate Analysis of Coal. Standards Press of China: Beijing, China, 2008.
- ISO 7404-2:2025; Coal—Methods for Petrographic Analysis—Part 2: Method of Preparing Coal Samples. International Organization for Standardization: Geneva, Switzerland, 2025.
- GB/T 15588-2013; Classification of Macerals for Bituminous Coal. Standards Press of China: Beijing, China, 2014.
- Clarkson, C.R.; Bustin, R.M. Binary gas adsorption/desorption isotherms: Effect of moisture and coal composition upon carbon dioxide selectivity over methane. Int. J. Coal Geol. 2000, 42, 241–271. [Google Scholar] [CrossRef] [Scilit]
- Thommes, M.; Kaneko, K.; Neimark, A.V.; Olivier, J.P.; Rodriguez-Reinoso, F.; Rouquerol, J.; Sing, K.S.W. Physisorption of gases, with special reference to the evaluation of surface area and pore size distribution (IUPAC Technical Report). Pure Appl. Chem. 2015, 87, 1051–1069. [Google Scholar] [CrossRef] [Scilit]
- Chen, H.; Wang, H.; Fan, J.; He, S.; Wang, L.; Li, Z.; Sun, K.; Tong, X.; Chen, J. Pore structure of deep high-rank coal and its impact on coalbed methane adsorption: A case study of the Daning-Jixian block, Eastern Ordos Basin. Sci. Rep. 2026, 16, 16362. [Google Scholar] [CrossRef] [Scilit]
- Zhang, K.; Liu, H.; Ma, M.; Xu, H.; Fang, H. Multiscale Fractal Characterization of Pore–Fracture Structure of Tectonically Deformed Coal Compared to Primary Undeformed Coal: Implications for CO2 Geological Sequestration in Coal Seams. Processes 2023, 11, 2934. [Google Scholar] [CrossRef] [Scilit]
- Zhang, S.; Tang, S.; Tang, D.; Huang, W.; Pan, Z. Determining fractal dimensions of coal pores by FHH model: Problems and effects. J. Nat. Gas Sci. Eng. 2014, 21, 929–939. [Google Scholar] [CrossRef] [Scilit]
- Wood, D.A. Deriving coal fractal dimensions from low-pressure nitrogen adsorption isotherms applying an integrated method. Appl. Geochem. 2021, 131, 105042. [Google Scholar] [CrossRef] [Scilit]
- Ullah, B.; Cheng, Y.; Wang, L.; Yang, W.; Jiskani, I.M.; Hu, B. Experimental analysis of pore structure and fractal characteristics of soft and hard coals with same coalification. Int. J. Coal Sci. Technol. 2022, 9, 58. [Google Scholar] [CrossRef] [Scilit]
- Zhou, X.; He, Q.; Hou, H. Investigation on Adsorption Pore and Fractal Analyses of Low-Rank Coals in the Northern Qaidam Basin. ACS Omega 2024, 9, 9823–9834. [Google Scholar] [CrossRef] [Scilit]
- Friesen, W.I.; Mikula, R.J. Fractal dimensions of coal particles. J. Colloid Interface Sci. 1987, 120, 263–271. [Google Scholar] [CrossRef] [Scilit]
- Xu, W.S.; Luo, P.Y.; Sun, L.; Lin, N. A Prediction Model of the Capillary Pressure J-Function. PLoS ONE 2016, 11, e0162123. [Google Scholar] [CrossRef] [Scilit]
- Gao, H.; Yu, B.; Duan, Y.; Fang, Q. Fractal analysis of dimensionless capillary pressure function. Int. J. Heat Mass Transf. 2014, 69, 26–33. [Google Scholar] [CrossRef] [Scilit]
- Song, D.Y.; Ji, X.F.; Li, Y.B.; Zhao, H.T.; Song, B.Y.; He, K.K. Heterogeneous development of micropores in medium-high rank coal and its relationship with adsorption capacity. Int. J. Coal Geol. 2020, 226, 103497. [Google Scholar] [CrossRef] [Scilit]
- Zhao, J.; Xu, H.; Tang, D.; Mathews, J.P.; Li, S.; Tao, S. A comparative evaluation of coal specific surface area by CO2 and N2 adsorption and its influence on CH4 adsorption capacity at different pore sizes. Fuel 2016, 183, 420–431. [Google Scholar] [CrossRef] [Scilit]
- Wang, G.; Wang, K.; Ren, T. Improved analytic methods for coal surface area and pore size distribution determination using 77 K nitrogen adsorption experiment. Int. J. Min. Sci. Technol. 2014, 24, 329–334. [Google Scholar] [CrossRef] [Scilit]
- Bhatia, S.K.; Sonwane, C.G. Capillary Coexistence and Criticality in Mesopores: Modification of the Kelvin Theory. Langmuir 1998, 14, 1521–1524. [Google Scholar] [CrossRef] [Scilit]
- Song, B.; Zhai, X.W.; Ma, T.; Wang, B.; Hao, L.; Zhou, Y. Effect of Water Immersion on Pore Structure of Bituminous Coal with Different Metamorphic Degrees. Energy 2023, 274, 127449. [Google Scholar] [CrossRef] [Scilit]
- Yue, J.W.; Wang, Z.F.; Chen, J.S.; Zheng, M.H.; Wang, Q.; Lou, X.F. Investigation of pore structure characteristics and adsorption characteristics of coals with different destruction types. Adsorpt. Sci. Technol. 2019, 37, 623–648. [Google Scholar] [CrossRef] [Scilit]
- Yao, Y.; Liu, D. Comparison of low-field NMR and mercury intrusion porosimetry in characterizing pore size distributions of coals. Fuel 2012, 95, 152–158. [Google Scholar] [CrossRef] [Scilit]
- Li, Y.; Song, D.; Liu, S.; Ji, X.; Hao, H. Evaluation of pore properties in coal through compressibility correction based on mercury intrusion porosimetry: A practical approach. Fuel 2021, 291, 120130. [Google Scholar] [CrossRef] [Scilit]
- Xiong, Q.; Li, K.; Yang, D.; Yu, H.; Pan, Z.; Song, Y. Characterizing coal pore space by gas adsorption, mercury intrusion, FIB–SEM and µ-CT. Environ. Earth Sci. 2020, 79, 209. [Google Scholar] [CrossRef] [Scilit]
- Wang, K.; Guo, L.; Xu, C.; Wang, W.; Yang, T.; Lin, S.; Cai, Y. Multiscale Characteristics of Pore-Fracture Structures in Coal Reservoirs and Their Influence on Coalbed Methane (CBM) Transport: A Review. Geoenergy Sci. Eng. 2024, 242, 213181. [Google Scholar] [CrossRef] [Scilit]
- Lu, F.; Liu, C.; Zhang, X.; Jia, B.; Wang, Y.; Liu, S.; Tang, Y.; Liu, J.; Lin, P. Study on full-scale pores characterization and heterogeneity of coal based on low-temperature nitrogen adsorption and low-field nuclear magnetic resonance experiments. Sci. Rep. 2024, 14, 16910. [Google Scholar] [CrossRef] [Scilit]
- Zhang, B.; Zhu, J.; He, F.; Jiang, Y. Compressibility and fractal dimension analysis in the bituminous coal specimens. AIP Adv. 2018, 8, 075118. [Google Scholar] [CrossRef] [Scilit]
- Okolo, G.N.; Everson, R.C.; Neomagus, H.W.J.P.; Roberts, M.J.; Sakurovs, R. Comparing the Porosity and Surface Areas of Coal as Measured by Gas Adsorption, Mercury Intrusion and SAXS Techniques. Fuel 2015, 141, 293–304. [Google Scholar] [CrossRef] [Scilit]
- Li, Z.; Ren, T.; Li, X.; Qiao, M.; Yang, X.; Tan, L.; Nie, B. Multi-scale pore fractal characteristics of differently ranked coal and its impact on gas adsorption. Int. J. Min. Sci. Technol. 2023, 33, 389–401. [Google Scholar] [CrossRef] [Scilit]
- Zhu, G.; Xie, Z.; Wang, T.; Hu, H.; Wang, D. Microscopic pore structure characteristics of Shanxi Formation coal reservoir in Daning-Jixian Block. Meikuang Anquan 2024, 55, 31–42. [Google Scholar] [CrossRef]
- Wang, T.; Tian, F.; Deng, Z.; Hu, H. The Characteristic Development of Micropores in Deep Coal and Its Relationship with Adsorption Capacity on the Eastern Margin of the Ordos Basin, China. Minerals 2023, 13, 302. [Google Scholar] [CrossRef] [Scilit]
- Fan, W.; Lin, H.; Li, L.; Wang, T.; Liu, L.; Zheng, D.; Wang, J. Microscopic pore-fracture structure characterization of medium-high rank coal reservoirs from eastern margin of Ordos Basin. J. Northeast. Pet. Univ. 2026, 50, 95–108. [Google Scholar] [CrossRef]
- Zhang, C.; Liu, G.; Gao, R.; Ye, L.; Han, M.; Lin, S. Pore structure and gas-bearing properties of deep high-rank coal reservoirs in southeastern Ordos Basin. Pet. Reserv. Eval. Dev. 2026, 16, 974–982. [Google Scholar] [CrossRef]
- Zhang, M.; Fu, X.; Wang, H. Analysis of Physical Properties and Influencing Factors of Middle-Rank Coal Reservoirs in China. J. Nat. Gas Sci. Eng. 2018, 50, 351–363. [Google Scholar] [CrossRef] [Scilit]

Disclaimer/Publisher’s Note: The statements, opinions and data contained in all publications are solely those of the individual author(s) and contributor(s) and not of MDPI and/or the editor(s). MDPI and/or the editor(s) disclaim responsibility for any injury to people or property resulting from any ideas, methods, instructions or products referred to in the content. |
© 2026 by the authors. Licensee MDPI, Basel, Switzerland. This article is an open access article distributed under the terms and conditions of the Creative Commons Attribution (CC BY) license.